


Abstract
The number and orientation of spokes are critical parameters for spray-path planning of cable reels. Aiming at the low efficiency of manual counting, contour fragmentation of slender structures caused by traditional edge detection, and the inability to automatically determine the spoke quantity, this paper proposes an automatic spoke-detection method based on radial density fusion and frequency-domain analysis. First, Hough-gradient-based circle transform is adopted to locate the outer-circle boundary, and a multi-feature fusion algorithm is utilized to accurately extract inner-circle parameters. Second, adaptive threshold segmentation is performed in the HSV color space according to the color statistics of the outer-circle region. Combined with ring mask and morphological closing operation, the complete spoke regions are extracted. Radial density projection is implemented within the annular region, where color density and edge confidence are weighted and fused to construct an angular-density curve. Fourier spectral analysis is carried out on the density curve, and the spoke number is automatically estimated via frequency-domain peak localization and harmonic-factor analysis. An energy function containing a data-fidelity term, a missed-detection penalty term and a structure-guidance term is constructed. The spoke-angle matching problem is transformed into an energy-minimization problem, and the optimal angles are obtained by traversal search in the offset-angle space. Experimental results demonstrate that the proposed method can effectively identify spokes of cable reels with different colors and different spoke quantities. Evaluated on 40 cable-reel images, the recognition success rate reaches 92.5%. Calculated against manually annotated center points, the mean pixel error of detected center coordinates is 14 pixels, and the mean actual deviation is 13.42 mm.
1. Introduction
Cable reels are core industrial equipment for storing and transporting cables in power transmission and communication networks. A reel structure generally consists of an outer circle, an inner circle, and several radial spokes connecting them. In industrial production, reel spokes are commonly painted red, green or blue, and relevant reel information is sprayed at the middle position between two adjacent spokes. Reels of different specifications are equipped with different numbers of spokes. The quantity and spatial orientation of spokes directly determine path planning for subsequent automatic spraying procedures [1,2,3]. Among existing image processing methods, Hough-line detection is vulnerable to background texture interference and generates numerous false-positive lines [4], making accurate spoke detection difficult. Worse still, reel spokes may share similar colors with partial background wood boards [5,6]. Slender-shaped spokes tend to produce broken edges in edge detection [7,8,9], and occlusion by wound-cable areas further aggravates the difficulty of feature extraction. These factors cause existing visual algorithms to deliver unsatisfactory detection success rates and robustness for practical production-line scenarios [10]. Aiming at the above challenges, this paper puts forward an automatic spoke-detection method based on fused-density curves.
2. Related Works
In traditional Hough line detection for reel spoke recognition, Canny edges are first extracted within the annular region formed by the inner and outer circles, and morphological closing is applied to connect broken edges; line segments are then detected, collinear segments are merged through angle clustering, and the spoke count and angles are determined by a uniformity test. However, this pipeline encounters many problems in practical reel images. Slender spokes produce fragmented edges, while wood-grain textures on the reel surface generate numerous false line segments. Under these interferences, Hough line detection suffers from missed detection, duplicate detection, and false-positive spokes, and it often fails to locate the true spoke positions. In addition, reel spokes may share similar colors with partial background wood boards, and occlusion by wound-cable areas further aggravates feature extraction, making single-feature Hough-based methods unstable and unable to reliably determine the number and angular distribution of spokes. Deep-learning-based detection methods can learn discriminative features and achieve strong recognition performance, but they typically rely on large parameter networks and high-performance inference hardware, resulting in substantial model size and memory footprint that hinder real-time deployment on resource-constrained embedded platforms. They also usually require training weights and GPU acceleration, which increases engineering cost and deployment complexity. Therefore, how to achieve robust reel spoke recognition under complex industrial backgrounds while maintaining low computational and memory overhead remains an open problem.
3. Materials and Methods
3.1. Outer-Circle Detection
Outer-circle detection is the first step in the whole spoke-detection pipeline. Its accuracy directly affects the reliability of subsequent inner-circle localization and spoke recognition [11,12,13,14,15]. As a feature-extraction technique, the Hough transform is widely used in image processing. Apart from lines, it can detect circles, ellipses and other complex shapes. Its core idea is to map geometric shapes in an image into a parameter space and detect shapes by voting in the parameter space. Nevertheless, traditional Hough-transform circle detection requires voting in a three-dimensional parameter space (center coordinates and radius), which brings high memory consumption and heavy computational cost and is impractical for real-world applications. This paper adopts Hough-gradient-based circle detection [16,17,18,19].
3.1.1. Hough-Gradient-Based Circle Detection
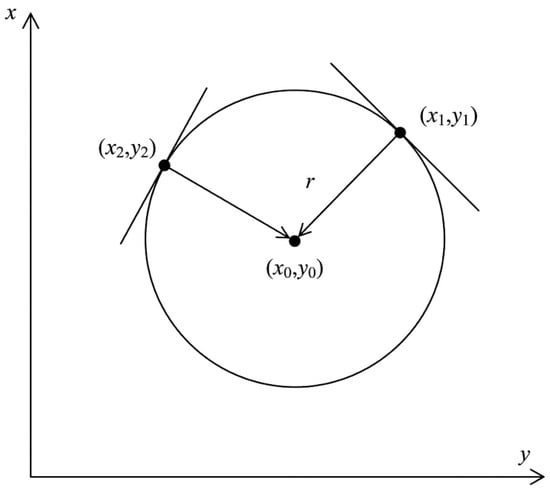
The Hough gradient method leverages the geometric property that gradient directions of circle-edge points point toward the circle center. It reduces the three-dimensional voting of traditional Hough transform to two-dimensional-space voting. For an edge point (xi, yi) In the image with gradient direction θi pointing to the circle center, the center coordinates can be estimated with a given radius:
a = xi + rcos(θi), b = yi + rsin(θi)
As shown in Figure 1, based on this principle, the Hough gradient method votes for pixel positions traversed by gradient lines in a two-dimensional accumulator. Pixels with votes exceeding a threshold are selected as candidate circle centers, and radius histograms are used to determine the radius corresponding to each candidate center.
Figure 1.
Gradient directions of edge points pointing to the circle center.
Preprocess the input image and perform edge detection to obtain an edge map with high quality by adjusting edge-detection thresholds. Compute Sobel gradients in the x and y directions:
where I denotes the gray-scale value of the input image.
Gradient magnitude and gradient direction are computed as:
where G is gradient magnitude and θ is gradient direction.
Create a two-dimensional matrix with the same size as the input image to record voting counts for pixels crossed by gradient lines of edge points. For each edge point (xi, yi), in the edge image, derive its gradient-line equation from its gradient direction:
where ki is the slope of the gradient line.
ki = tan(θi)
y − yi = ki(x − xi)
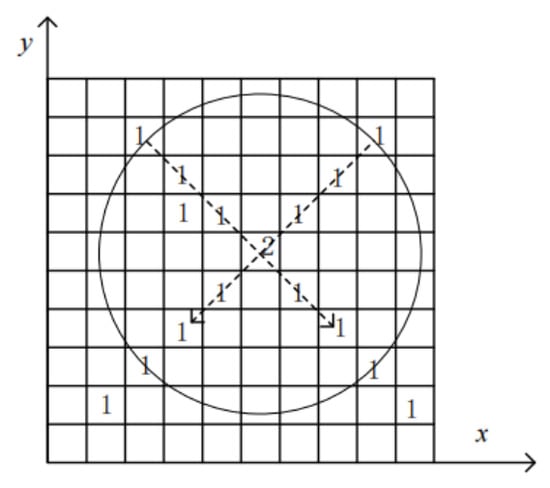
As shown in Figure 2, traverse all potential center positions along each gradient line and cast votes for corresponding pixels in the matrix. Candidate centers are extracted according to a preset voting threshold. For each candidate center, search for its corresponding radius by building a radius histogram that accumulates distances from edge points to the candidate center. Detect peaks in the radius histogram or take the mean of multiple statistical peaks as the radius for the candidate circle.
Figure 2.
Circle center voting accumulator.
3.1.2. Edge Confidence
Edge confidence provides secondary evaluation for the quality of candidate circles. Voting thresholds in the Hough transform only filter candidates by total edge-point quantity on the circumference and cannot judge whether edge points are evenly distributed over the whole circle. Edge confidence samples points uniformly on the circumference and computes the proportion of edge points, which effectively eliminates pseudo-circles caused by local-texture interference. For every detected candidate circle, sample N points uniformly on its circumference and calculate circle-perimeter edge confidence:
where r is circle radius, k is the index of sampling points, cx and cy are the abscissa and ordinate of the candidate circle center.
Edge confidence reflects how well a candidate circle matches image edges. The circle with the highest edge confidence is selected as the final outer circle.
3.2. Spoke Dominant Color Identification
In practical scenarios, reel spokes are usually red, green or blue. Fixed HSV gamut thresholds for segmentation will fail to extract spokes of certain colors. This paper proposes an adaptive main-color-judgment strategy based on color statistics over outer-circle boundaries.
Convert the image from the BGR space to the HSV space [20]. Sample pixels uniformly on the outer-circle boundary, count the proportions of red, blue and green pixels, and automatically determine the maincolor of the reel. Corresponding HSV thresholds are then selected for segmentation.
On the outer circle boundary, pixels are uniformly sampled and their HSV values are extracted. The numbers of pixels falling into the red, blue, and green intervals are counted separately, and the color with the highest count is selected as the final dominant color.The corresponding HSV segmentation thresholds are listed in Table 1.
Table 1.
HSV segmentation thresholds corresponding to dominant colors of the reel.
3.3. Multi-Feature Hough Inner-Circle Detection
Inner-circle edge information is weak. Single-gray-scale Hough transform yields low detection success rates because the small inner-circle size brings insufficient edge votes. Moreover, background inside the inner-circle region caused by shooting angles may corrupt detection results. Therefore, a multi-stage fusion algorithm is designed as follows:
- Candidate-region constraint
The search range of the inner circle center is confined to the neighborhood of the outer circle center, and the radius search interval is set to 25% to 60% of the outer circle radius.
- 2.
- Image main-color enhancement
Perform Hough circle detection within the constrained region. To strengthen inner-circle features, fuse gray scale enhancement and main color enhancement channels. Taking red as an example, the main color enhancement channel is defined as:
where R(x,y), G(x,y), B(x,y) denote the brightness values of the pixel at coordinates (x,y) in the red, green, and blue channels, respectively.
I(x,y) = max(0,R(x,y) − max(G(x,y),B(x,y)))
The fused image Ifused fed into Hough circle detection for the inner circle is formulated as:
Ifused = 0.6Igray + 0.4I
- 3.
- Multi-feature Hough detection
Three scores are calculated for each candidate circle: edge confidence, main-color-circumference score and center-offset score.
Edge confidence is computed in the same way as for outer-circle detection. For the main-color-circumference score, sample M points uniformly on the candidate circle and compute the average main-color-enhancement value over sampling points:
The center-offset score is given by:
where are abscissa and ordinate of the inner-circle center, are abscissa and ordinate of the outer-circle center.
The comprehensive score reads:
Among them, α is set to 0.4, β to 0.3, and γ to 0.3.
Set a screening threshold. The circle whose score exceeds the threshold and reaches the maximum value is selected as the final inner circle.
3.4. Spoke Detection Based on Radial Multidimensional-Density Curves
Spokes are supporting structures connecting the inner and outer circles of a cable reel. Their quantity and angular distribution directly affect obstacle-avoidance planning for spraying paths. This paper proposes a spoke-detection and counting method combining HSV-color-space segmentation, weighted fusion of radial main-color density and edge density, and a uniform-distribution model. The overall workflow is as follows. First, perform threshold segmentation with the reel main color in the HSV space. Combine an annular mask and morphological closing operation to extract complete spoke regions. Second, conduct radial-density projection within the annular region. Compute main-color density and edge-confidence density and fuse them with weights to compress two-dimensional “angle-radius” image information into a one-dimensional angular-density curve [21,22]. Third, apply Fourier-spectrum analysis to the density curve and automatically estimate the number of spokes by means of spectral characteristics of circular signals. Finally, recover accurate uniform-distribution angles for each spoke using an angle-fitting algorithm with offset searching and penalty terms [23].
3.4.1. Construction of Radial-Fused-Density Curves
Build a polar-coordinate system taking the circle center as the pole [24]. Within the annular region, sample at a step of two pixels radially from the inner-circle radius to the outer-circle radius for each angle θ with 1° angular steps. Radial main-color density and edge density are defined as:
where Ns(θ) is the total number of sampling points, Ncolor(θ) is the number of points falling inside the color mask, and Nedge(θ) is the number of points lying on Canny edges.
The fused density is defined as:
ρ(θ) = 0.6ρcolor(θ) + 0.4ρedge(θ)
Combining main-color density and edge density effectively suppresses interference from wood boards whose color is close to that of spokes.
To suppress noise, smooth ρ(θ) with a moving-average filter of window length 5 to obtain the smoothed curve .
3.4.2. Spoke-Number Estimation via Fourier-Spectrum Analysis
The smoothed radial-fused-density curve is essentially a discrete periodic signal defined over a circle. When a reel has K uniformly-distributed spokes, the curve should show K complete periodic fluctuations within 0°–360°. Therefore, estimating the number of spokes can be converted into frequency identification of a periodic signal [25].
Treat as a periodic signal. Subtract its mean value and apply a Hanning window, then compute the discrete Fourier transform:
where denotes the mean of .
Take the magnitude spectrum|Φ(k)| and locate its peaks. The Fourier transform decomposes the complex density waveform into different frequency components, and peak positions give the number of full fluctuations kmax.
All divisors of kmax are taken as candidate spoke counts , constrained within the range 3 to 20, which covers most spoke quantities for industrial cable reels.
The core idea is that the main spectral peak may correspond to either the fundamental frequency or one of its harmonics; the fundamental frequency must be a divisor of the main-peak frequency. Divisor decomposition and amplitude comparison help eliminate harmonic interference and select the physically most plausible quantity from multiple candidates, avoiding misjudgment caused by over-reliance on the main spectral peak.
3.4.3. Spoke-Angle Localization with Uniformity Prior
Peaks of the radial-fused-density curve deliver candidate directions for spokes. Nevertheless, noise, occlusion and discrete sampling bring localization errors if peaks are directly adopted as spoke angles. Besides, shooting angles lead to non-perfect uniform distribution of spokes in images. Accordingly, an angle-localization method using uniformity prior knowledge is proposed.
For each candidate , search for optimal uniform-distribution angles by optimizing the offset angle ϕ∈[0, 360/K). Local searching compensates for estimation errors of ±1 possibly introduced by Fourier-spectrum analysis due to noise, harmonic components or non-ideal periodicity, and improves final reliability.
Based on uniformity prior knowledge, theoretical spoke angles are derived:
where λ is the index for individual spokes.
For each theoretical angle, search for actual density-curve peak angles within a 5° tolerance neighborhood to accommodate detection offsets. Candidate peak angles must satisfy:
and maintain angular intervals no smaller than 15°, from already-matched spoke angles. If a candidate angle violates the density threshold, the corresponding spoke feature is weak; skip matching and count a miss-detection penalty. If the angular-interval constraint is violated, peaks are too close and duplicate detection may occur; continue searching for other potential peaks.
To quantitatively evaluate matching quality, formulate spoke-angle matching as an energy-minimization problem. Let the set of successfully matched angles be:
where M is the actual matched quantity. Define the energy function:
where T is the theoretical angular period, μ is the miss-detection-penalty coefficient, λ is the structure-guidance weight coefficient, and Δθj is denotes actual adjacent-angle intervals after circular sorting of matched angles:
Three terms in the energy function have respective physical meanings:
Data-fidelity term: Measures how well selected angles fit the density curve. Higher density yields smaller values, forcing the algorithm to prefer positions with prominent spoke features.
Miss-detection-penalty term: Imposes penalties when the actual matched number is less than the theoretical number, preventing excessive matching omissions caused by avoiding low-density regions.
Structure-guidance term: Quantifies deviations between actual adjacent-spoke intervals and theoretical intervals.
Embed the energy function into offset-angle traversal. For each fixed offset angle, theoretical-angle sequences are determined by Equation, and each spoke is independently matched via local-neighborhood searching. The matching score can be equivalently written as:
where μ is set to 1.0 and λ is set to 0.5.
Traverse ϕ in 1° steps and compute matching scores for every offset angle to obtain the highest score for each candidate K values and select the K with the highest score as the final spoke count. Finally, fine-tune each matched angle within a 2° neighborhood and pick the angle with maximum density as the final spoke orientation to eliminate errors from angular discretization.
3.4.4. Localization of Spoke Endpoints and Spray-Point Centers
Based on refined angles , outer-circle radius rout and inner-circle radius rin, compute spoke-endpoint coordinates:
Output spoke quantity, angles and endpoint coordinates for subsequent spraying-path planning.
For spray-point-center localization, adopt the middle radius between inner and outer circles and the central angle between two adjacent spokes:
where rin and rout represent inner-circle radius and outer-circle radius respectively.
xcenter = cx + rcenter × cos(θcenter)
ycenter = cy + rcenter × sin(θcenter)
4. Experimental Results
4.1. Analysis of Spoke Number Estimation Results
Experiments were carried out on 40 field-captured images of cable reels, which were taken using a smartphone’s native camera. The images cover various common reel types, including five-spoke, six-spoke, and eight-spoke reels, with a resolution of 3024 × 4032 pixels. The detection success rate reaches 92.5%. Taking the coordinates of manually labeled centers and detected centers as evaluation metrics for spoke-position deviation, the average pixel error is 14 pixels and the average physical deviation is 13.42 mm.
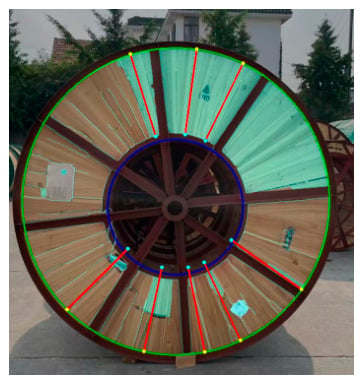
The conventional approach employs pure-edge Hough line detection: Canny edges are extracted within the annular region formed by the inner and outer circles, followed by morphological closing to connect broken edges. Line segments are then detected using Hough line detection, collinear segments are merged through angle clustering, and the spoke count and angles are finally determined via a uniformity test. Figure 3 presents a typical failure case of this conventional method. Slender spokes produce fragmented edges, while wood-grain textures on the reel surface generate numerous false line segments. Under these interferences, Hough line detection suffers from missed detection, duplicate detection, and false-positive spokes.
Figure 3.
Typical Failure Case of Conventional Straight-Line Detection.
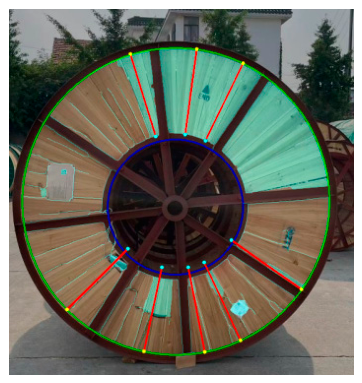
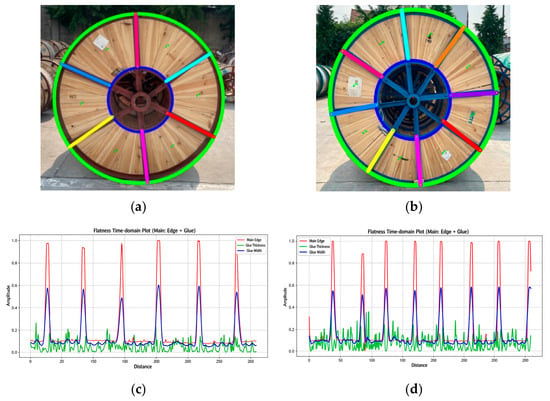
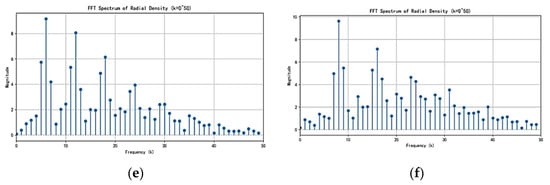
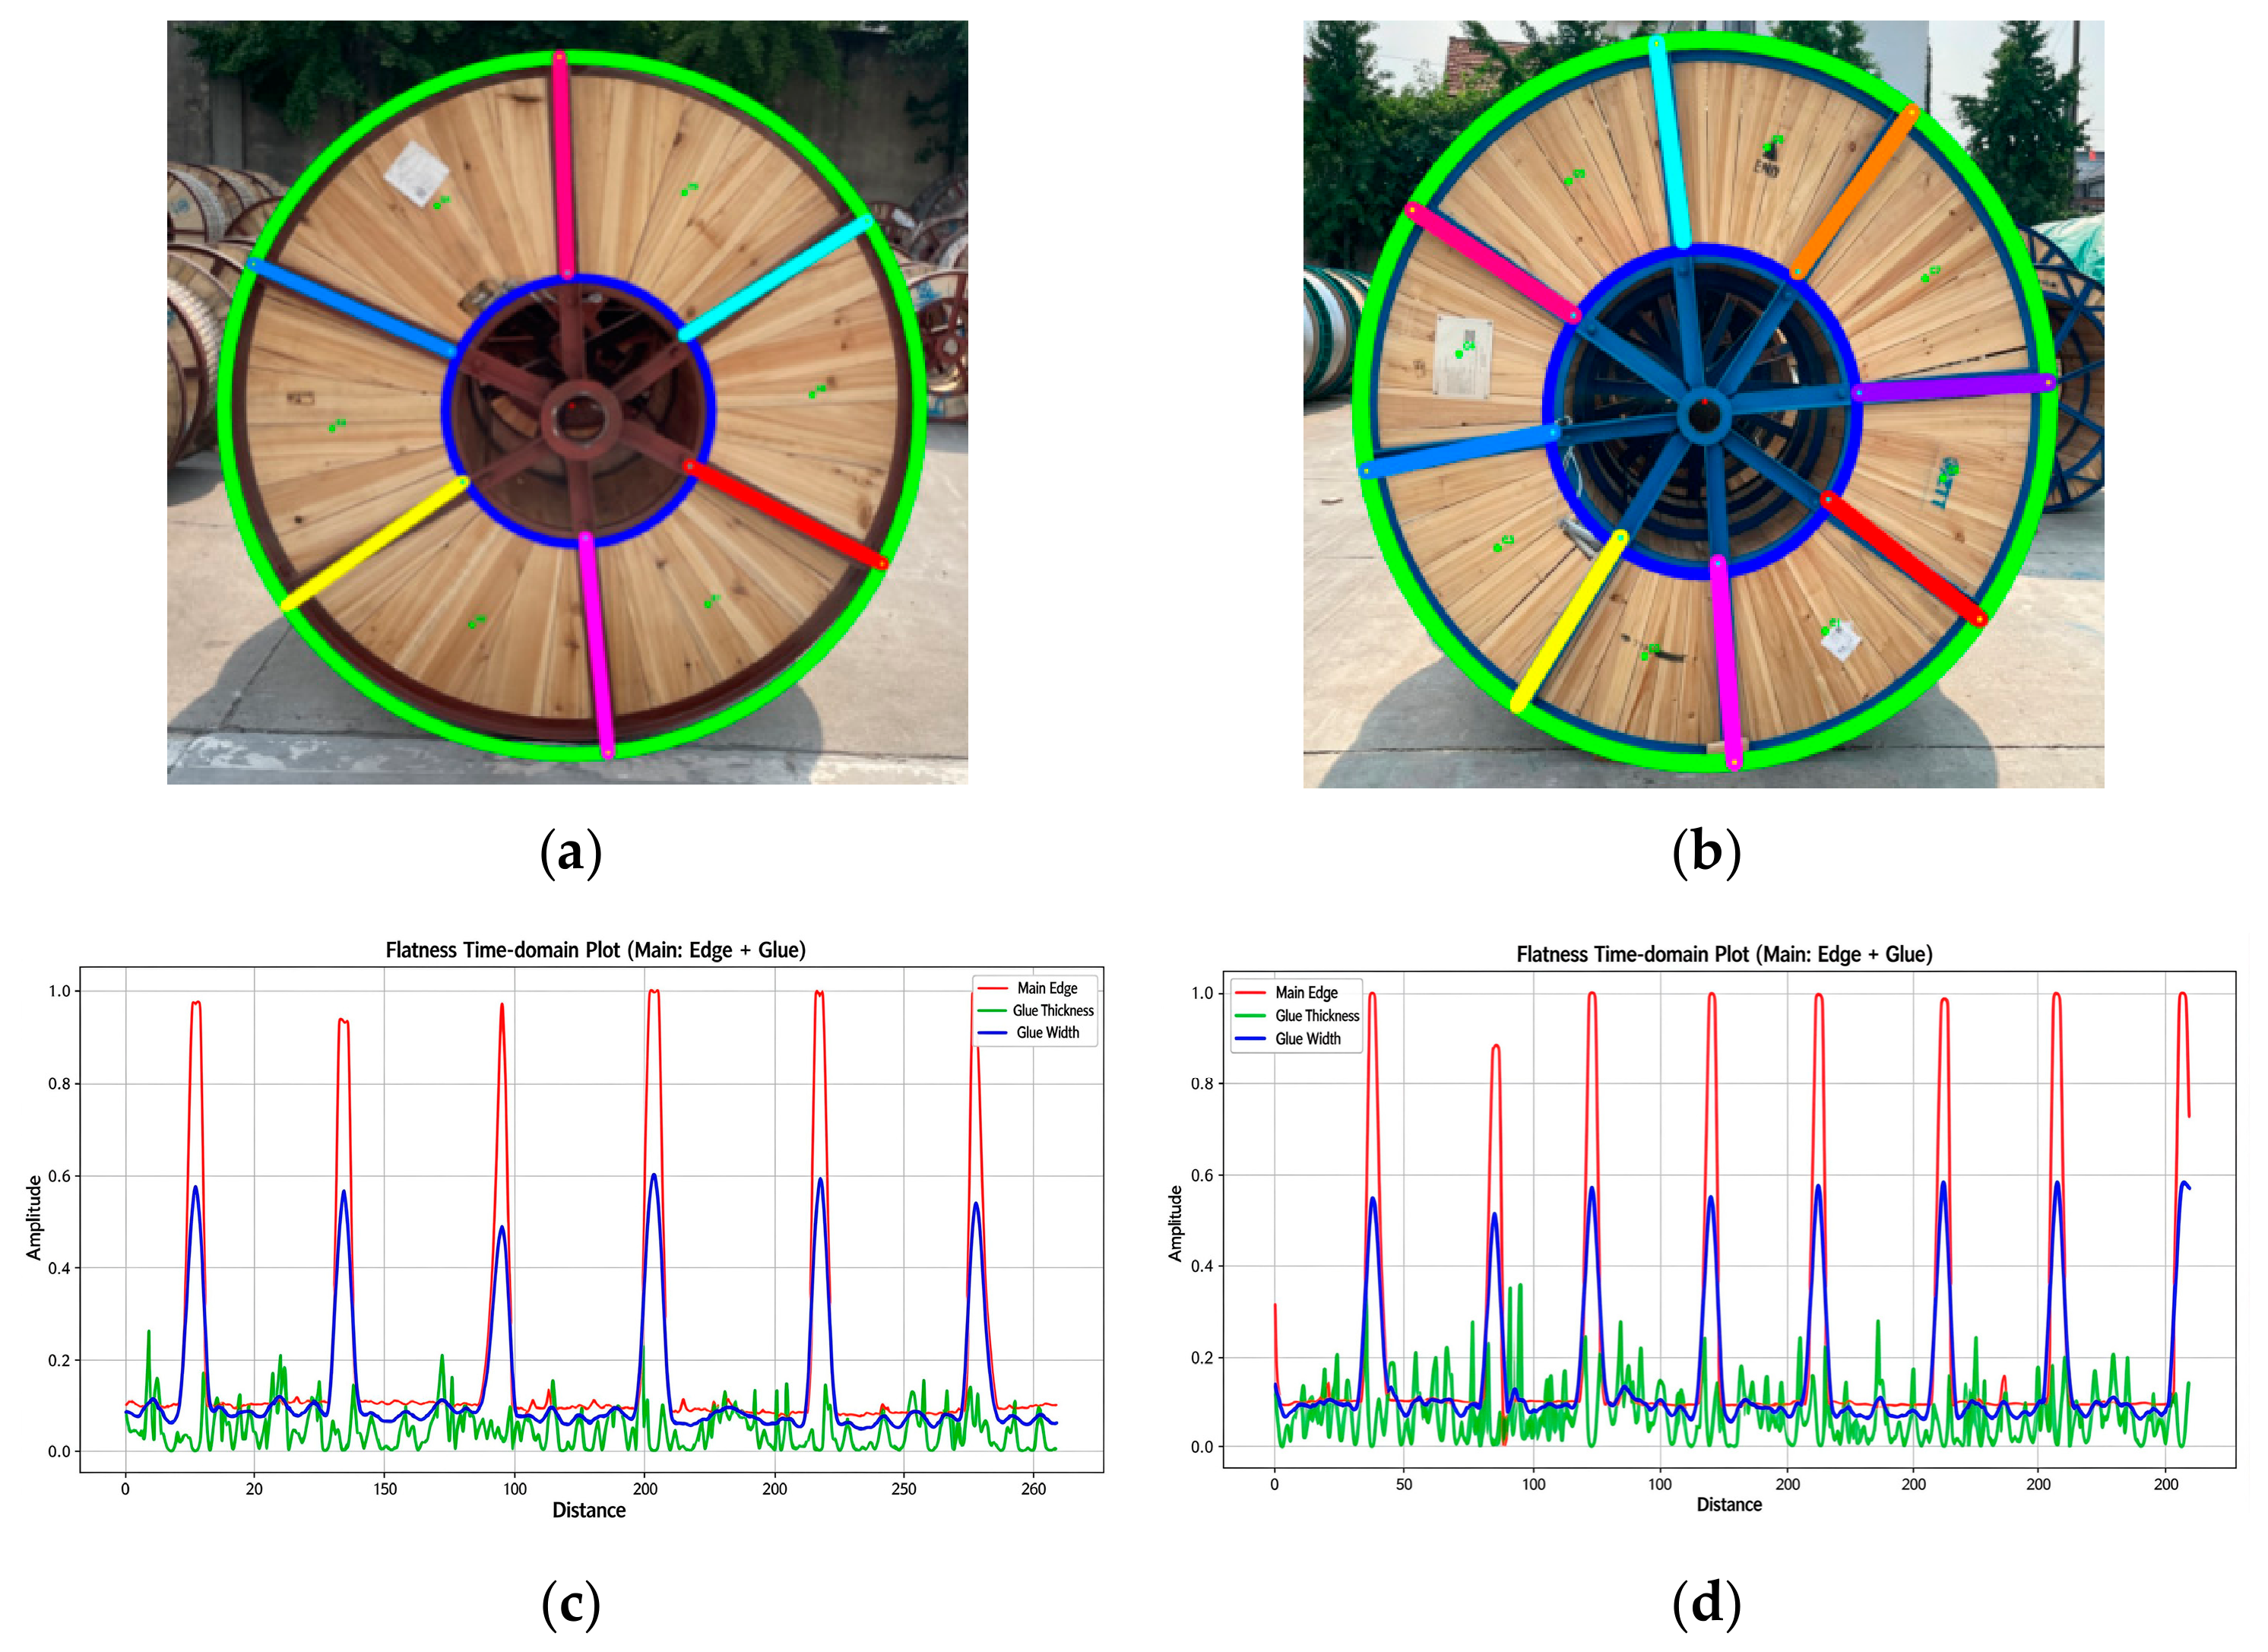
Figure 4 shows partial experimental results. Figure 4a,b display detection results for two types of reels. Yellow circles denote detected outer circles, blue circles denote detected inner circles, and straight lines between them represent detected spoke positions, which are nearly consistent with the real-world spoke positions. Green dots mark the central points between adjacent spokes as references for spraying positions.
Figure 4.
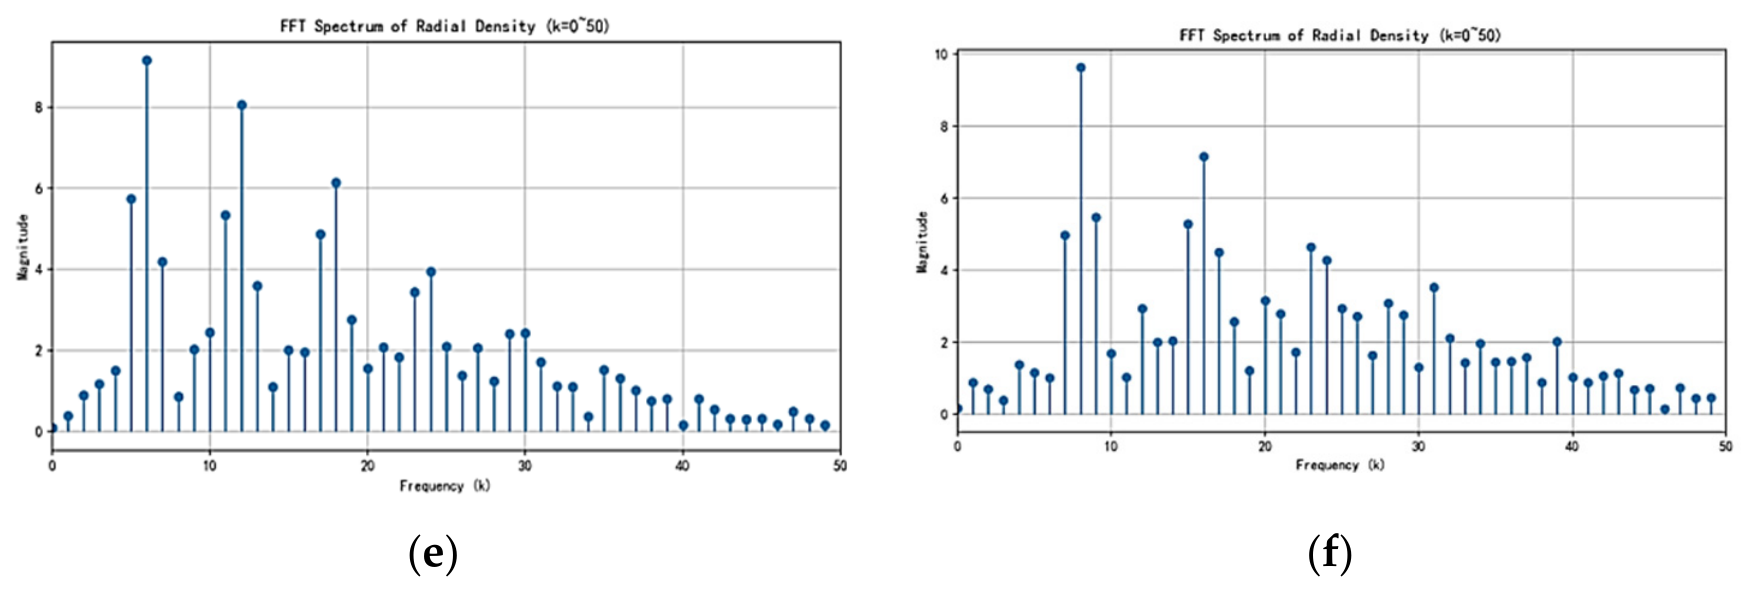
Experimental results. (a) Six-spoke red reel. (b) Eight-spoke blue reel. (c) Six-spoke radial fused density curve. (d) Eight-spoke radial fused density curve. (e) Six-spoke radial fused density spectrum. (f) Eight-spoke radial fused density spectra.
Figure 4c,d plot radial-fused-density curves for two reels. Red curves are main-color-density curves, green curves are edge-density curves, and blue curves are fused-density curves. The peak quantities and peak intervals of the fused-density curves match the real-world spokes and can serve as criteria for spoke-position judgment. Figure 4e,f show spectra obtained from the Fourier transform of the radial-fused-density curves. The horizontal axis k represents frequency, and the peak positions correspond to candidate spoke quantities, which are consistent with the real-world spoke counts.
4.2. Analysis of Spoke-Number Estimation Results
The current algorithm is only applicable to spoke recognition and spray-point localization when reels face the camera squarely. It satisfies positioning requirements for automatic spraying under normal front-view shooting conditions. Large shooting tilt angles induce obvious geometric distortion of spoke structures. Spacing, angles and distribution rules of spokes deviate greatly from front-view situations, so existing polar-coordinate transformation and spoke-constraint checks fail and recognition cannot be completed.
5. Conclusions
This paper proposes an automatic-detection method for cable-reel spokes based on radial fused density. Candidate circles are extracted from images by Hough-gradient-based circle detection. Edge-confidence inspection is performed, and main-color judgment is carried out on the final outer circle. Multi-feature fusion realizes inner- and outer-circle localization. Spoke regions are extracted via HSV-color-space segmentation within the annular region. Radial-fused-density curves are constructed, and Fourier-spectrum analysis automatically estimates the number of spokes. The spoke-angle-matching problem is modeled as an energy-minimization problem containing a data-fidelity term, a miss-detection-penalty term and a structure-guidance term. Error analysis shows small physical deviations of spray points, meeting industrial-production requirements. The proposed method accurately detects spokes of reels with common colors and different spoke quantities and exhibits good adaptability and reliability. For future work, binocular-camera depth measurement will be introduced to determine spray-font size according to reel dimensions. Deep-learning-based detection of wound-cable regions will be integrated to realize preliminary positioning and spatial planning for cable-spraying tasks.
Author Contributions
Conceptualization, P.X.; methodology, P.X.; software, Y.S.; writing—original draft preparation, Y.S.; writing—review and editing, L.Z.; supervision, L.Z. All authors have read and agreed to the published version of the manuscript.
Funding
This research was funded by the Ministry of Education Industry-University-Research Collaborative Education Program, grant number 230800011302616.
Data Availability Statement
The raw data supporting the conclusions of this article will be made available by the authors on request.
Conflicts of Interest
The authors declare no conflict of interest.
References
- Guo, Z.; Wang, M.; Zhang, J.; Jiao, T. Research on On-Line Recognition and Classification Technology of Wheel Hub Based on Machine Vision. J. Test. Meas. Technol. 2019, 33, 233–237. [Google Scholar]
- Liu, Y.; Yuan, W. Design of Autonomous Robot Imaging System for Motorcycle Wheel Spoke Surface. Instrum. Tech. Sens. 2021, 90–93. [Google Scholar]
- Yang, Y. Design of Automobile Hub Detection Based on Machine Vision System. Electr. Switch 2021, 59, 34–36. [Google Scholar]
- Dai, N. Research and Parameter Analysis of Circle Detection Algorithm Based on Hough Transform. China Metrol. 2010, 87–89. [Google Scholar]
- Zhao, G.; Yu, H. Research on Construction Worker Positioning Method Based on HSV Color Space. Sci. Technol. Inf. 2023, 21, 22–25. [Google Scholar]
- Wu, J.; Liu, J.; Shi, J.; Zhang, S. Research on Image Segmentation and Color Recognition Method of Laser Weld. Laser Technol. 2023, 47, 723–728. [Google Scholar]
- Sun, H.; Han, G. Noise Image Edge Detection Based on Improved Canny Algorithm. J. Hubei Univ. Automot. Technol. 2023, 37, 54–63. [Google Scholar]
- Wang, H.; Wang, X.; Zhou, R. Research on UAV Image Edge Detection Algorithm Based on Improved Canny. Intell. Comput. Appl. 2023, 13, 70–75. [Google Scholar] [CrossRef] [Scilit]
- Wang, Z.; Wang, Y.; Zhu, S. Application and Development Trend of Edge Detection Technique Based on Improved Canny Algorithm. Inf. Commun. Technol. Policy 2023, 49, 90–96. [Google Scholar]
- Zhang, X.; Li, S.; Li, J.; Yang, Y. An Improved Intelligent Hough Transform for Detecting the Diameter of Red-hot Circular Workpiece. J. Xi’an Univ. Technol. 2022, 38, 41–47. [Google Scholar]
- Zhou, L.; Li, L.; Fang, H.; Zhang, M. Research on Improvement and Application of Lunar Crater Detection Algorithm Based on Hough Transform. Comput. Appl. Softw. 2023, 40, 266–271. [Google Scholar]
- Zhong, J.; Ye, Z.; Wu, J. Circle Detection Algorithm Integrating Hough Transform and Caliper Clustering. Electron. Compon. Inf. Technol. 2023, 7, 70–75. [Google Scholar]
- Liang, X.; Li, Y.; Zhang, J. Multi-Adaptive Circle Detection Based on Hough Transform. Mach. Electron. 2007, 25, 74–75. [Google Scholar]
- Yan, W.; Qiu, Y. Research on Initial Information Extraction of Aircraft and Missile Separation Based on Regional Hough Transformation. J. Appl. Opt. 2021, 42, 65–70. [Google Scholar] [CrossRef] [Scilit]
- Dang, Y.; Hua, Q.; Chen, Z. Automatic Detection of Human Interpupillary Distance Based on Gray Integral Projection and Hough Circle Transform Algorithm. Comput. Syst. Appl. 2022, 31, 259–264. [Google Scholar]
- Illingworth, J.; Kittler, J. A survey of the Hough transform. Comput. Vis. Graph. Image Process. 1988, 44, 87–116. [Google Scholar] [CrossRef] [Scilit]
- Hassanein, A.S.; Mohammad, S.; Sameer, M.; Ragab, M.E. A survey on Hough transform, theory, techniques and applications. Int. J. Comput. Sci. Issues 2015, 12, 139–156. [Google Scholar]
- Zhao, Z.; Kang, J.; Ren, Y.; Xu, Y.; Sun, Z.; Zhang, Z.; Xue, T.; Wu, B. A high-precision micro-hole circle detection method via lightweight focusable network and accelerated resolution-aware Hough transform. IEEE Trans. Circuits Syst. Video Technol. 2026, 36, 5200–5215. [Google Scholar] [CrossRef] [Scilit]
- Guo, S.-Y.; Zhang, X.-F.; Zhang, F. Adaptive randomized Hough transform for circle detection using moving window. In Proceedings of the 2006 International Conference on Machine Learning and Cybernetics, Dalian, China, 13–16 August 2006. [Google Scholar]
- Sural, S.; Qian, G.; Pramanik, S. Segmentation and histogram generation using the HSV color space for image retrieval. In Proceedings of the IEEE International Conference on Image Processing (ICIP 2002), Rochester, NY, USA, 22–25 September 2002; Volume 2, pp. 589–592. [Google Scholar]
- Xu, X.; Yang, R.; Wang, N. A robust circle detector with regionalized radius aid. Pattern Recognit. 2024, 149, 110256. [Google Scholar] [CrossRef] [Scilit]
- Davies, E.R. Radial histograms as an aid in the inspection of circular objects. IEE Proc. D Control Theory Appl. 1985, 132, 158–163. [Google Scholar] [CrossRef] [Scilit]
- Song, S.; Liu, J.; Shleimovich, M.P.; Shakirzyanov, R.M.; Novikova, S.V. An adaptive radial object recognition algorithm for lightweight drones in different environments. Comput. Opt. 2025, 49, 480–492. [Google Scholar] [CrossRef] [Scilit]
- Oppenheim, A.V.; Schafer, R.W. Discrete-Time Signal Processing, 3rd ed.; Pearson: Upper Saddle River, NJ, USA, 2010. [Google Scholar]
- Ioannou, D.; Huda, W.; Laine, A.F. Circle recognition through a 2D Hough Transform and radius histogramming. Image Vis. Comput. 1999, 17, 15–26. [Google Scholar] [CrossRef] [Scilit]

Disclaimer/Publisher’s Note: The statements, opinions and data contained in all publications are solely those of the individual author(s) and contributor(s) and not of MDPI and/or the editor(s). MDPI and/or the editor(s) disclaim responsibility for any injury to people or property resulting from any ideas, methods, instructions or products referred to in the content. |
© 2026 by the authors. Licensee MDPI, Basel, Switzerland. This article is an open access article distributed under the terms and conditions of the Creative Commons Attribution (CC BY) license.