


Abstract
Multi-Criteria Decision Analysis (MCDA) requires human involvement at every stage of its process. This paper proposes a systematic LLM evaluation protocol for end-to-end MCDA pipelines, using published expert rankings as a benchmark. In addition, it implements a four-stage LLM pipeline as a case study applying the protocol to three leading LLMs across five benchmark problems selected to vary in application domain and in the number of alternatives. The protocol comprises 225 independent pipeline executions (3 models × 5 repetitions × 3 temperatures × 5 problems); each execution applies three MCDA methods (LLM-weighted linear scoring, TOPSIS, PROMETHEE II) to the same LLM-generated score matrix, yielding 675 method-specific outputs in total. Consistent with a smaller pilot study of this protocol, differences between models are small relative to problem identity (Kruskal–Wallis, H = 1.10, p = 0.577, η2 = 0.005; a small but significant effect emerges once problem identity is controlled for, η2 = 0.6%), while problem identity remains the dominant performance factor—and a larger one than previously observed (η2 = 0.761, H = 170.51, p < 0.001, N = 225 executions). Kendall’s τ ranges from −0.34 on a ten-alternative problem to 0.56 on a four-alternative problem; a permutation test against random rankings indicates that two of the five benchmark problems produced agreement below chance level, while two problems produced agreement above chance level; since the test treats executions as independent, these deviations should be read as descriptive rather than inferential. Top-3 Accuracy ranges from 10.1% to 72.1% across problems, relative to chance baselines of 30% to 75%. Reliability varies strongly across problems, and the compensatory/non-compensatory distinction from the pilot does not fully explain this. In this pipeline, the scoring stage receives the names of the alternatives and criteria but not the numerical decision data, so the results reflect the LLM’s prior knowledge; its role as an explanatory factor is proposed as a hypothesis for future testing.
1. Introduction
Evaluating the reliability of AI systems requires protocols with measurable benchmarks. In the field of Multi-Criteria Decision Analysis (MCDA), the development of such protocols is particularly important as MCDA is a well-established structured process with clear stages (definition of criteria, assignment of weights, ranking calculation, interpretation) and has published results by human experts which can serve as a benchmark for comparison [1,2]. However, its implementation today still requires extensive human involvement, which is often time-consuming, costly, and prone to subjectivity [3].
At the same time, the evolution of LLMs into autonomous pipeline-based systems capable of executing complex processes has created new research opportunities but has also left open two questions: whether LLMs can perform an MCDA process end-to-end from free-text input, and how reliably they can do so. Existing studies examine the use of LLMs in individual MCDA steps [4], but several research gaps remain. To the best of our knowledge, no existing study proposes an end-to-end LLM pipeline, and none performs an a posteriori evaluation against published expert rankings.
This paper makes three contributions. First, it proposes an evaluation protocol for end-to-end MCDA pipelines, which defines benchmark-selection criteria based on published expert rankings, four agreement metrics, execution-level nonparametric inference with cluster-bootstrap confidence intervals, and a permutation test against random rankings. Second, it implements a four-stage LLM pipeline, from free-text problem description to ranked alternatives under three MCDA methods, as a case study of the protocol. The individual building blocks of this pipeline are pre-existing: structured JSON-output prompting, schema-validated JSON hand-offs with automatic retry, and the standard weighted-sum, TOPSIS and PROMETHEE II methods. The contribution lies in their integration into a single end-to-end workflow and in the pipeline’s use as an object of systematic evaluation. Third, it provides empirical evidence from 225 independent pipeline executions (675 method-specific outputs, 100% completion rate) across three LLMs and five benchmark problems, which is used to identify the factors affecting reliability. This evidence yields three main findings, concerning model selection, problem identity, and the factors that condition performance.
2. Literature Review
2.1. Method Taxonomy and Known Limitations in MCDA
Multicriteria Decision Analysis (MCDA) methods are designed to evaluate and rank alternatives under multiple, often conflicting, criteria. A recent literature review highlights the widespread and continued use of methods such as AHP, TOPSIS, and PROMETHEE in a wide range of application domains [5]. These domains range from transportation infrastructure design to electric vehicle charging station siting, demonstrating that AHP remains the most popular method despite its known limitations, particularly when a large number of criteria and pairwise comparisons are involved. The hierarchical structure of AHP, which decomposes complex decision problems into multiple levels, has been extensively documented [6], while reviews of its application in fields such as construction [7] confirm its continued prominence in practice. A key limitation of these approaches is their reliance on subjective expert judgment, which limits scalability and can introduce variability into the resulting weights, especially in high-stakes applications such as forest-fire risk assessment [8].
Beyond expert-elicited weighting, decision-support methods also differ in whose competing requirements the resulting weights are meant to represent. Arman et al. [9] address cloud plan selection under the requirements of multiple applications by combining ranking aggregation, TOPSIS, and fuzzy representations of application importance, allowing different stakeholders to express, through linguistic variables, how much each application’s requirements should weigh in the final plan choice. In that framework, the weights are explicitly stakeholder-derived: they encode the relative importance that identified decision makers assign to each application. This differs from the present pipeline’s Stage 2, where criterion weights are generated automatically by the LLM rather than elicited from a named decision maker or stakeholder group. The distinction matters for interpreting disagreement with expert benchmarks: because the pipeline’s weights are not tied to any specific stakeholder perspective, a mismatch with a published expert ranking may reflect a computational error, a legitimately different prioritization scheme, or simply the absence of a defined stakeholder viewpoint for the weights to represent. Accordingly, in the present pipeline, the Stage 2 weights should be read as the LLM’s own estimate of criterion importance, informed by its prior knowledge of the stated problem, rather than as a stand-in for any stakeholder’s, expert’s, or organization’s preferences. Disentangling these sources of disagreement would require either supplying the published expert weights directly to Stage 3, or explicitly conditioning Stage 2 on a stated stakeholder viewpoint so that the resulting weights can be compared with a benchmark on a like-for-like basis.
2.2. AI and LLMs in Decision Support Systems
The rapid adoption of large language models (LLMs) is reshaping how Decision Support Systems (DSS) are designed and operated. A recent study [10] argues that LLMs have greater flexibility than traditional DSS approaches, as they can simultaneously retrieve and synthesize information, generate alternatives, and support their evaluation. The authors organize the open research questions around a classic three-phase decision-making model (intelligence–design–choice) and highlight that the integration of LLMs into this process raises new challenges related to reliability, transparency, and human oversight. A central theoretical distinction in this literature is between automation, in which the LLM replaces human judgment, and augmentation, in which the LLM functions as a decision-support tool.
Several studies have also examined individual stages of AHP and other MCDA procedures. A recent systematic review [11] covering the period 2020–2025 reports substantial methodological heterogeneity in LLM-based weight elicitation, in both prompting strategies and evaluation protocols, and concludes that a standardized methodological framework has yet to emerge.
Systematic comparisons of LLM performance with human experts have become an active area of research, particularly for subjective assessment and alternative-ranking tasks. In a CV-screening study, the authors compared the performance of three LLMs—Claude, GPT, and Gemini—against human recruiters in multiple corporate contexts, using analysis of variance and paired t-tests demonstrating statistically significant differences among the LLMs and between the LLMs and human experts (p < 0.01). In a related application [12], the authors developed a comprehensive framework for the evaluation of educational content generated by LLMs in software engineering, combining AHP and fuzzy AHP to define criterion weights based on the judgments of a panel of eight experts, and applied it to five contemporary LLMs. At a more methodological level, [13] adapted the AHP and its fuzzy extension, Fuzzy AHP (FAHP), specifically to assess the output quality of LLMs within an ‘LLM-as-a-Judge’ framework, showing that structured, hierarchical criterion decomposition via AHP consistently outperforms simple direct scoring in terms of accuracy and judgment stability.
2.3. Design Patterns for LLM Pipeline Architectures
Autonomous LLM pipelines refer to systems that perform a sequence of actions without requiring human involvement at each step. Such a system makes decisions without external guidance, decomposes complex tasks into individual subtasks, invokes external functions and APIs to interact with LLMs, and detects and corrects failures without human intervention.
In the literature, three main architectural models can be distinguished [14]. In the sequential pipeline, each stage is completed before the next one is triggered, which suits tasks with strict data dependencies. In the parallel execution model, multiple stages are executed simultaneously, and their results are then combined, an approach suitable for independent subtasks. In hierarchical orchestration, a central orchestrator dynamically assigns tasks to specialized processing stages, as needed. Due to the dependencies between its stages, MCDA naturally follows the sequential pipeline pattern. The literature also suggests that multi-stage pipeline architectures may be beneficial in complex tasks but does not provide systematic comparisons with single-stage pipelines in the context of structured decision-making methodologies [15].
2.4. Research Gap
The literature shows that, although there is substantial research on both the limitations of traditional MCDA methods and the integration of LLMs into individual stages of AHP, neither research stream systematically examines a complete end-to-end MCDA pipeline, from the initial interpretation of a problem expressed in free text to the final ranking of alternatives using multiple MCDA methods. In particular, the applied studies identified in the literature typically focus on specific decision problems and use LLMs primarily for criterion weighting. The present study addresses this combined gap in two ways: by proposing an evaluation protocol for end-to-end MCDA pipelines, and by applying it to a four-stage pipeline in 225 controlled executions on five published benchmark problems, using three MCDA methods and statistical procedures with the execution as the primary unit of analysis.
3. Proposed Pipeline Framework
3.1. Pipeline Overview
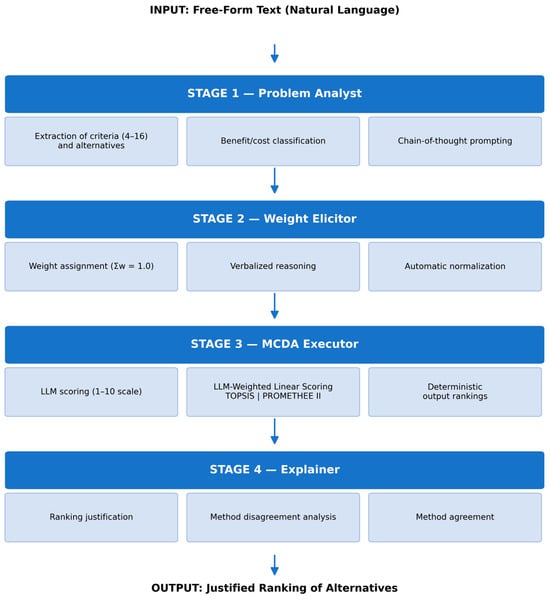
A clear distinction between the protocol and the pipeline is essential. Specifically, the protocol defines how an MCDA system using benchmarks, metrics, and statistical tests is evaluated, whereas the pipeline is a specific implementation evaluated using that protocol. The proposed pipeline consists of four stages and follows a sequential execution flow. Figure 1 illustrates the pipeline workflow and the sequence of stages. Each stage communicates with the next using structured JSON validated against a predefined schema.
Figure 1.
Architecture of the proposed four-stage LLM pipeline for end-to-end MCDA. Each transition includes JSON schema validation with automatic retry (max 3 attempts).
3.2. Overview of the Stages
Stage 1 (Problem Analyst) serves as the system input stage. It accepts the free-text problem description and produces a structured representation of the problem, including a list of alternatives (identifier, name and short description) and a set of evaluation criteria classified as either benefit or cost criteria. The number of criteria is limited to 4–16 to avoid over-analysis (redundant or overlapping criteria) and under-analysis (omission of critical dimensions); if a model returns more than 16 criteria, the list is truncated to the first 16. The prompt instructs the model to list sub-criteria separately rather than collapsing them into parent criteria. The output is generated exclusively in JSON format, without the intermediate reasoning steps of chain-of-thought prompting [16].
Stage 2 (Weight Elicitor) receives the list of criteria and assigns a weight to each criterion such that the weights sum to one. In addition to numerical values, a natural-language justification is generated for each weight using the verbalized reasoning approach [17], which encourages the explicit externalization of reasoning and improves output consistency. Weight stability across repeated executions is assessed using the inter-execution standard deviation and serves as a proxy measure of this stage’s reliability.
Stage 3 (MCDA Executor) serves as the computational core of the system and is divided into two conceptually distinct sub-stages. In the first sub-stage, the LLM assigns a score to each alternative for every criterion using a 1–10 scale (benefit criteria: 10 = best performance; cost criteria: 10 = lowest cost). In the second sub-stage, a deterministic implementation in Python (version 3.13.16) using NumPy (version 2.1.3) applies three MCDA methods to the resulting score matrix, using the weights produced by Stage 2 and the 1–10 scores produced above: TOPSIS, LLM-weighted linear scoring, and PROMETHEE II. LLM-weighted linear scoring is a linear weighted-sum aggregation of the Stage 3 scores using the Stage 2 weights, and is not the classical Analytic Hierarchy Process, since it does not construct a pairwise-comparison matrix and does not compute a consistency ratio. Also, it is important to note that all three MCDA calculations are deterministic and are not delegated to the LLM, ensuring that they remain correct regardless of the LLM used, and that the three methods are computed from the same underlying score matrix within a single pipeline execution rather than via independent LLM calls.
Stage 4 (Explainer) translates numerical results into an interpretable explanation for end users. It produces: (a) a summary of the ranking by method, (b) a justification for the best-ranked alternative based on the evaluation criteria, (c) an analysis of deviations between methods, and (d) a method agreement assessment (high/medium/low) based on the degree of agreement between TOPSIS, LLM-weighted linear scoring and PROMETHEE. Because all three methods are applied to the same LLM-generated score matrix and weights from a single execution, this agreement reflects the consistency of the ranking procedure given that input, not an independent check of whether the input itself is correct; a poorly grounded set of scores could still yield high agreement among the three methods. Producing explainable results is essential for the adoption of DSS by professional users.
Stage 1 reads the full problem text, but passes on only a one-sentence summary, the alternative names, and the criteria names and types. Stages 2–4 receive only this reduced information, so the numerical data in the problem texts never reach the scoring step, and the Stage 3 scores rely on the LLM’s prior knowledge of the named alternatives. The agreement metrics therefore measure agreement between this LLM judgment and published expert rankings, not the analysis of each problem’s numerical data. The system prompts used at each stage of the pipeline are provided in Appendix A.
3.3. Design Rationale and Execution Reliability
Inter-stage communication using structured JSON with schema validation is a key design choice to ensure reliability in a multi-stage pipeline, where the output of each stage serves as the input to the next stage and therefore any error propagation can undermine the entire processing chain. For this reason, each stage of the proposed pipeline includes a retry mechanism, with a maximum of three attempts, which is automatically activated if the output of the LLM fails to conform to the predefined schema. Examples of such failures include criterion weights that do not sum to one, JSON responses that do not conform to the expected structure (e.g., incomplete or extra fields), and alternative scores outside the predefined scale of 1–10. It is important to note that the validation process is performed outside of the LLM because an LLM may incorrectly validate its own erroneous outputs. This ensures that each stage passes only valid, structurally consistent output to the next stage before execution.
This approach addresses a well-documented limitation of LLMs in multi-stage, interdependent processes. An error occurring at an early stage, such as incorrect normalization of weights, does not remain confined to that stage but is propagated to subsequent stages and often amplified there in the pipeline, ultimately degrading the quality of the overall outcome in a way that is difficult to detect afterwards. The validation-and-retry scheme acts precisely as a barrier at the boundaries of each stage, isolating potential errors at the point where they occur, rather than allowing them to propagate silently to the rest of the pipeline. The limit of three attempts was not chosen arbitrarily, but as a balance between two conflicting needs: on the one hand, the tolerance of transient, non-systematic output errors which are often corrected by the second attempt, and on the other hand, the avoidance of unlimited retries, which would significantly increase both the execution time and the computational/financial cost of the experiment, without any guarantee that additional attempts would eventually lead to success. Each failed attempt is logged systematically, enabling subsequent analysis of the most frequent error types and the stages at which they occur. This information is useful both for diagnosing pipeline weaknesses and for guiding future optimization.
In the context of the present experiment, the validation process achieved a 100% completion rate (225 successful executions out of 225), indicating that the combination of schema validation and a limited number of retries is sufficient in practice to ensure structurally valid output at each stage: only two of the 225 executions required a second attempt (both at Stage 2), and none required a third. The average execution time for a complete pipeline execution (including all four stages) was approximately 19.3 s, resulting in a cumulative execution time of approximately 72 min for the 225 complete pipeline executions performed during the experiment.
4. Experimental Setup
4.1. Benchmark Problems and Setup
Published MCDA benchmark problems were selected according to predefined inclusion criteria. Each benchmark problem had to include published expert rankings in a peer-reviewed source, belong to a different application domain, and include evaluation criteria with varying levels of objectivity. The protocol was first tried in a smaller pilot study with four benchmark problems, the same three models, three temperatures and five repetitions (540 method-specific outputs). The five benchmark MCDA problems selected for this study are summarized in Table 1.
Table 1.
Benchmark MCDA Problems.
The experimental factors considered in this study were LLMs, temperatures, repetitions and benchmark problems. All possible combinations of these factors were evaluated, resulting in 225 independent executions, and within each execution, three MCDA methods were applied to the outputs. These outputs from a given execution are not statistically independent (mean pairwise Spearman correlation between the methods’ Kendall’s τ values across executions = 0.86) and are treated as repeated measurements clustered within execution in all inferential analyses. The experimental factors, their levels, and the total number of method-specific outputs are summarized in Table 2.
Table 2.
Benchmark Setup.
4.2. Evaluation Metrics and Statistical Analysis
A total of four metrics were considered for evaluation:
- Kendall’s τ: Rank-correlation coefficient equal to (number of concordant pairs—number of discordant pairs) divided by the total number of pairs. Range: [−1, 1], where 0 is the expected value under random ranking; the width of the interval that random rankings actually occupy depends on N.
- Spearman’s ρ: Monotonic rank correlation. More sensitive to large positional differences.
- Top-1 Accuracy: Percentage of executions in which the alternative ranked first by the pipeline is the alternative ranked first by the experts.
- Top-3 Accuracy: Overlap between the pipeline’s top three alternatives and the experts’ top three, divided by min(3, N), where N is the number of alternatives. Both Top-1 and Top-3 use exact-label matching (after normalizing case, spacing and punctuation); Kendall’s τ and Spearman’s ρ additionally accept containment or fuzzy matches (similarity ≥ 0.85) as a fallback when no exact match exists, since they compare complete rankings in which the exact label is normally present. Ranks are obtained by sorting the method scores in descending order, so ranks are strict and no shared ranks are assigned to tied scores; ties are resolved by the default behavior of the sort, no explicit tie-breaking rule was applied, and the frequency of ties was not logged. For reference, the expected Top-k overlap under a uniformly random ranking with N alternatives is k/N. For the two problems with N = 4 (Aircraft Selection, Military Advanced Training Selection), this expected value is 75% for Top-3, but the metric is also bounded below by 66.7% by construction, since any two 3-element subsets of a 4-element set share at least two elements. The observed values of 72.1% and 66.7% therefore lie within an attainable range of only 66.7–100% and are at or below the chance expectation, so Top-3 accuracy carries almost no information for these two problems.
Because Kendall’s τ does not follow a normal distribution, exclusively nonparametric statistical tests were used: the Kruskal–Wallis test for cross-group comparisons, the Mann–Whitney U test for pairwise comparisons, and the Friedman test for the comparison of MCDA methods. In addition to the p-values, effect sizes are also reported: eta-squared η2 for Kruskal–Wallis, computed as η2 = H/(N − 1) (η2 > 0.14 = large; >0.06 = moderate; >0.01 = small) and Cohen’s d for pairwise comparisons.
Because each pipeline execution is scored by three MCDA methods on the same ranking output generated by the LLM (mean pairwise Spearman correlation of the methods’ Kendall’s τ values across executions = 0.86), the pipeline execution (N = 225), rather than the individual method output (N = 675), is considered the primary experimental unit for the main statistical analyses.
Because Kendall’s τ does not follow a normal distribution, and observations within the same execution are correlated, 95% confidence intervals were estimated using a cluster bootstrap (5000 resamples, with resampling performed at the execution level) instead of the t-distribution. For comparison, the corresponding naïve confidence interval based on the t-distribution is also reported where necessary, which ignores this correlation and is consistently narrower.
To test whether the observed agreement differed from what would be expected in a random ranking, an additional Monte Carlo permutation test was performed for each problem, comparing the observed mean Kendall’s τ to a null distribution centered at zero resulting from repeated random permutations of the alternatives of each problem. The statistical significance level was set to α = 0.05.
4.3. Exploratory Robustness Check
The main tests in Table 3 (Kruskal–Wallis, N = 225) already avoid pseudo-replication, since they aggregate the three model observations into one value per execution. As a complementary exploratory analysis, we repeated the analysis on the 675 method-level observations with linear mixed models (LMM, random intercepts for problem, REML) and cluster bootstrap (5000 iterations, with whole problems resampled).
Table 3.
Statistical Summary of Results.
The LMM showed a nominally significant model effect (χ2 = 13.27, df = 2, p = 0.0013), in contrast to the non-significant result of the main analysis (H = 1.10, p = 0.577). In a stability check based on 2000 resamples of the five clusters, the resulting p-values ranged from <0.001 to 0.99, with only 27.8% of the resamples being significant, a very unstable result reflecting the small number of clusters (k = 5). The LMM findings are therefore treated only as exploratory, rather than as evidence against the main analysis. The ICC (0.765) confirms that most of the variance is attributable to differences between problems. The bootstrap confidence interval for each model (e.g., Claude Sonnet 4.6 [−0.211, 0.298]) shows substantial overlap across models, providing no evidence of a substantial model effect.
The main finding concerns the magnitude of the problem-identity effect: η2 = 0.761 (H = 170.51, p < 0.001), at the appropriate, execution-level unit of analysis (N = 225), compared with the pseudo-replicated estimate of 0.717 obtained when the 675 method-outputs are (incorrectly) treated as independent. The bootstrap CI [0.096, 0.830] remains broad due to the small sample (N = 5 problems), but excludes zero.
The overall conclusion remains unchanged: model selection does not significantly affect performance (H = 1.10, p = 0.577), regardless of the analytical approach used. The nominally significant LMM finding does not negate this conclusion, as it is unstable and is driven largely by GPT-4.1’s stronger performance on a single problem (Electric Car). On the contrary, the dominance of the “problem” factor is further strengthened methodologically, supporting the recommendation to expand the sample of problems in future research.
5. Experimental Results
Table 3 summarizes the statistical tests performed, the corresponding effect sizes and the results of the post-hoc power analysis, providing an overall overview before the detailed analysis of each factor separately in the following sections.
The main finding is the pronounced asymmetry between the effects of the LLM and of the problem: the choice of LLM does not produce any substantial difference in performance, whereas the problem factor explains most of the observed variation. Neither the MCDA method nor the sampling temperature appears to significantly affect the results within this analysis.
5.1. LLM Performance
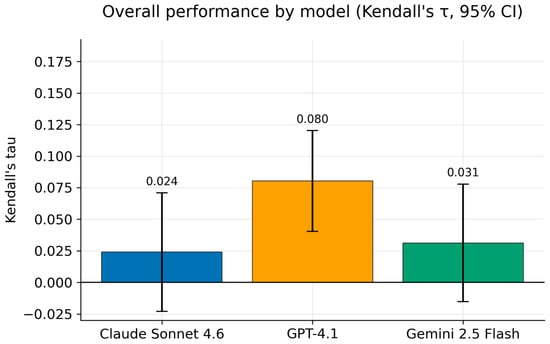
Table 4 reports Kendall’s τ coefficients with 95% confidence intervals for each model, along with Top-1 and Top-3 accuracy and Cohen’s d relative to GPT-4.1. The selected models show similar performance, with mean τ values ranging from 0.024 (Claude Sonnet 4.6) to 0.080 (GPT-4.1) and with the corresponding confidence intervals showing substantial overlap. The Cohen’s d effect size for Claude Sonnet 4.6 relative to GPT-4.1 is 0.169, which is conventionally interpreted as a small effect. The mean Kendall’s τ values of all three models are close to zero in absolute terms, reflecting the inclusion of two problems on which the pipeline performed below chance according to the permutation test (Medical Visualization and Electric Car) and one (Aircraft Selection) on which it did not differ from chance. The overall performance by model, based on Kendall’s τ, is presented in Figure 2.
Table 4.
Performance by Model with 95% CIs and Effect Sizes.
Figure 2.
Overall performance by model (Kendall’s τ with 95% CI).
Mann–Whitney pairwise tests at the execution level are consistent with the overall pattern: Claude vs. GPT-4.1 (p = 0.327), Claude vs. Gemini (p = 0.936), and GPT-4.1 vs. Gemini (p = 0.411), indicating that none of the pairwise comparisons reached statistical significance. This pooled comparison, however, does not account for the much larger differences between problems. When problem identity is controlled for (a stratified permutation test, an execution-level mixed model, and a two-way ANOVA all give p ≈ 0.04), a small model effect becomes detectable, driven mainly by GPT-4.1 scoring somewhat higher than the other two models (η2 = 0.6%, compared with η2 = 76.1% for problem identity). The stratified pairwise differences in mean τ (95% CI) are: GPT-4.1—Gemini +0.049 [0.006, 0.090] and GPT-4.1—Claude +0.056 [0.018, 0.094], both excluding zero, while Claude—Gemini is −0.007 [−0.051, 0.036]. A post hoc power analysis showed that the study had insufficient power to detect a difference of this magnitude, with a power of 0.434 at N = 225, and that approximately 550 executions per model would be required to achieve 80% power. Spearman’s ρ shows the same pattern as Kendall’s τ and is therefore not analyzed further.
5.2. Problem Identity as a Factor
In contrast to model selection, problem identity had a large effect on performance (η2 = 0.761, N = 225, p < 0.001). Table 5 presents Kendall’s τ values by problem and model, along with their 95% confidence intervals.
Table 5.
Performance by Problem and Model, with 95% CIs.
Relative to the chance level, Top-3 accuracy is above chance in Medical Visualization and Four-Wheeler Selection, below chance in Electric Car (10.1% vs. 30.0%), and slightly below chance in Aircraft Selection and Military Advanced Training Selection. For N = 4, a Top-3 overlap of at least 2/3 is guaranteed by construction, so Top-3 accuracy is uninformative for these two problems and Kendall’s τ is the more reliable metric.
Notably, GPT-4.1’s confidence interval for the Electric Car problem touches zero at its upper bound [−0.104, 0.000], unlike Claude and Gemini on the same problem, so its agreement with the benchmark is at most marginally distinguishable from chance.
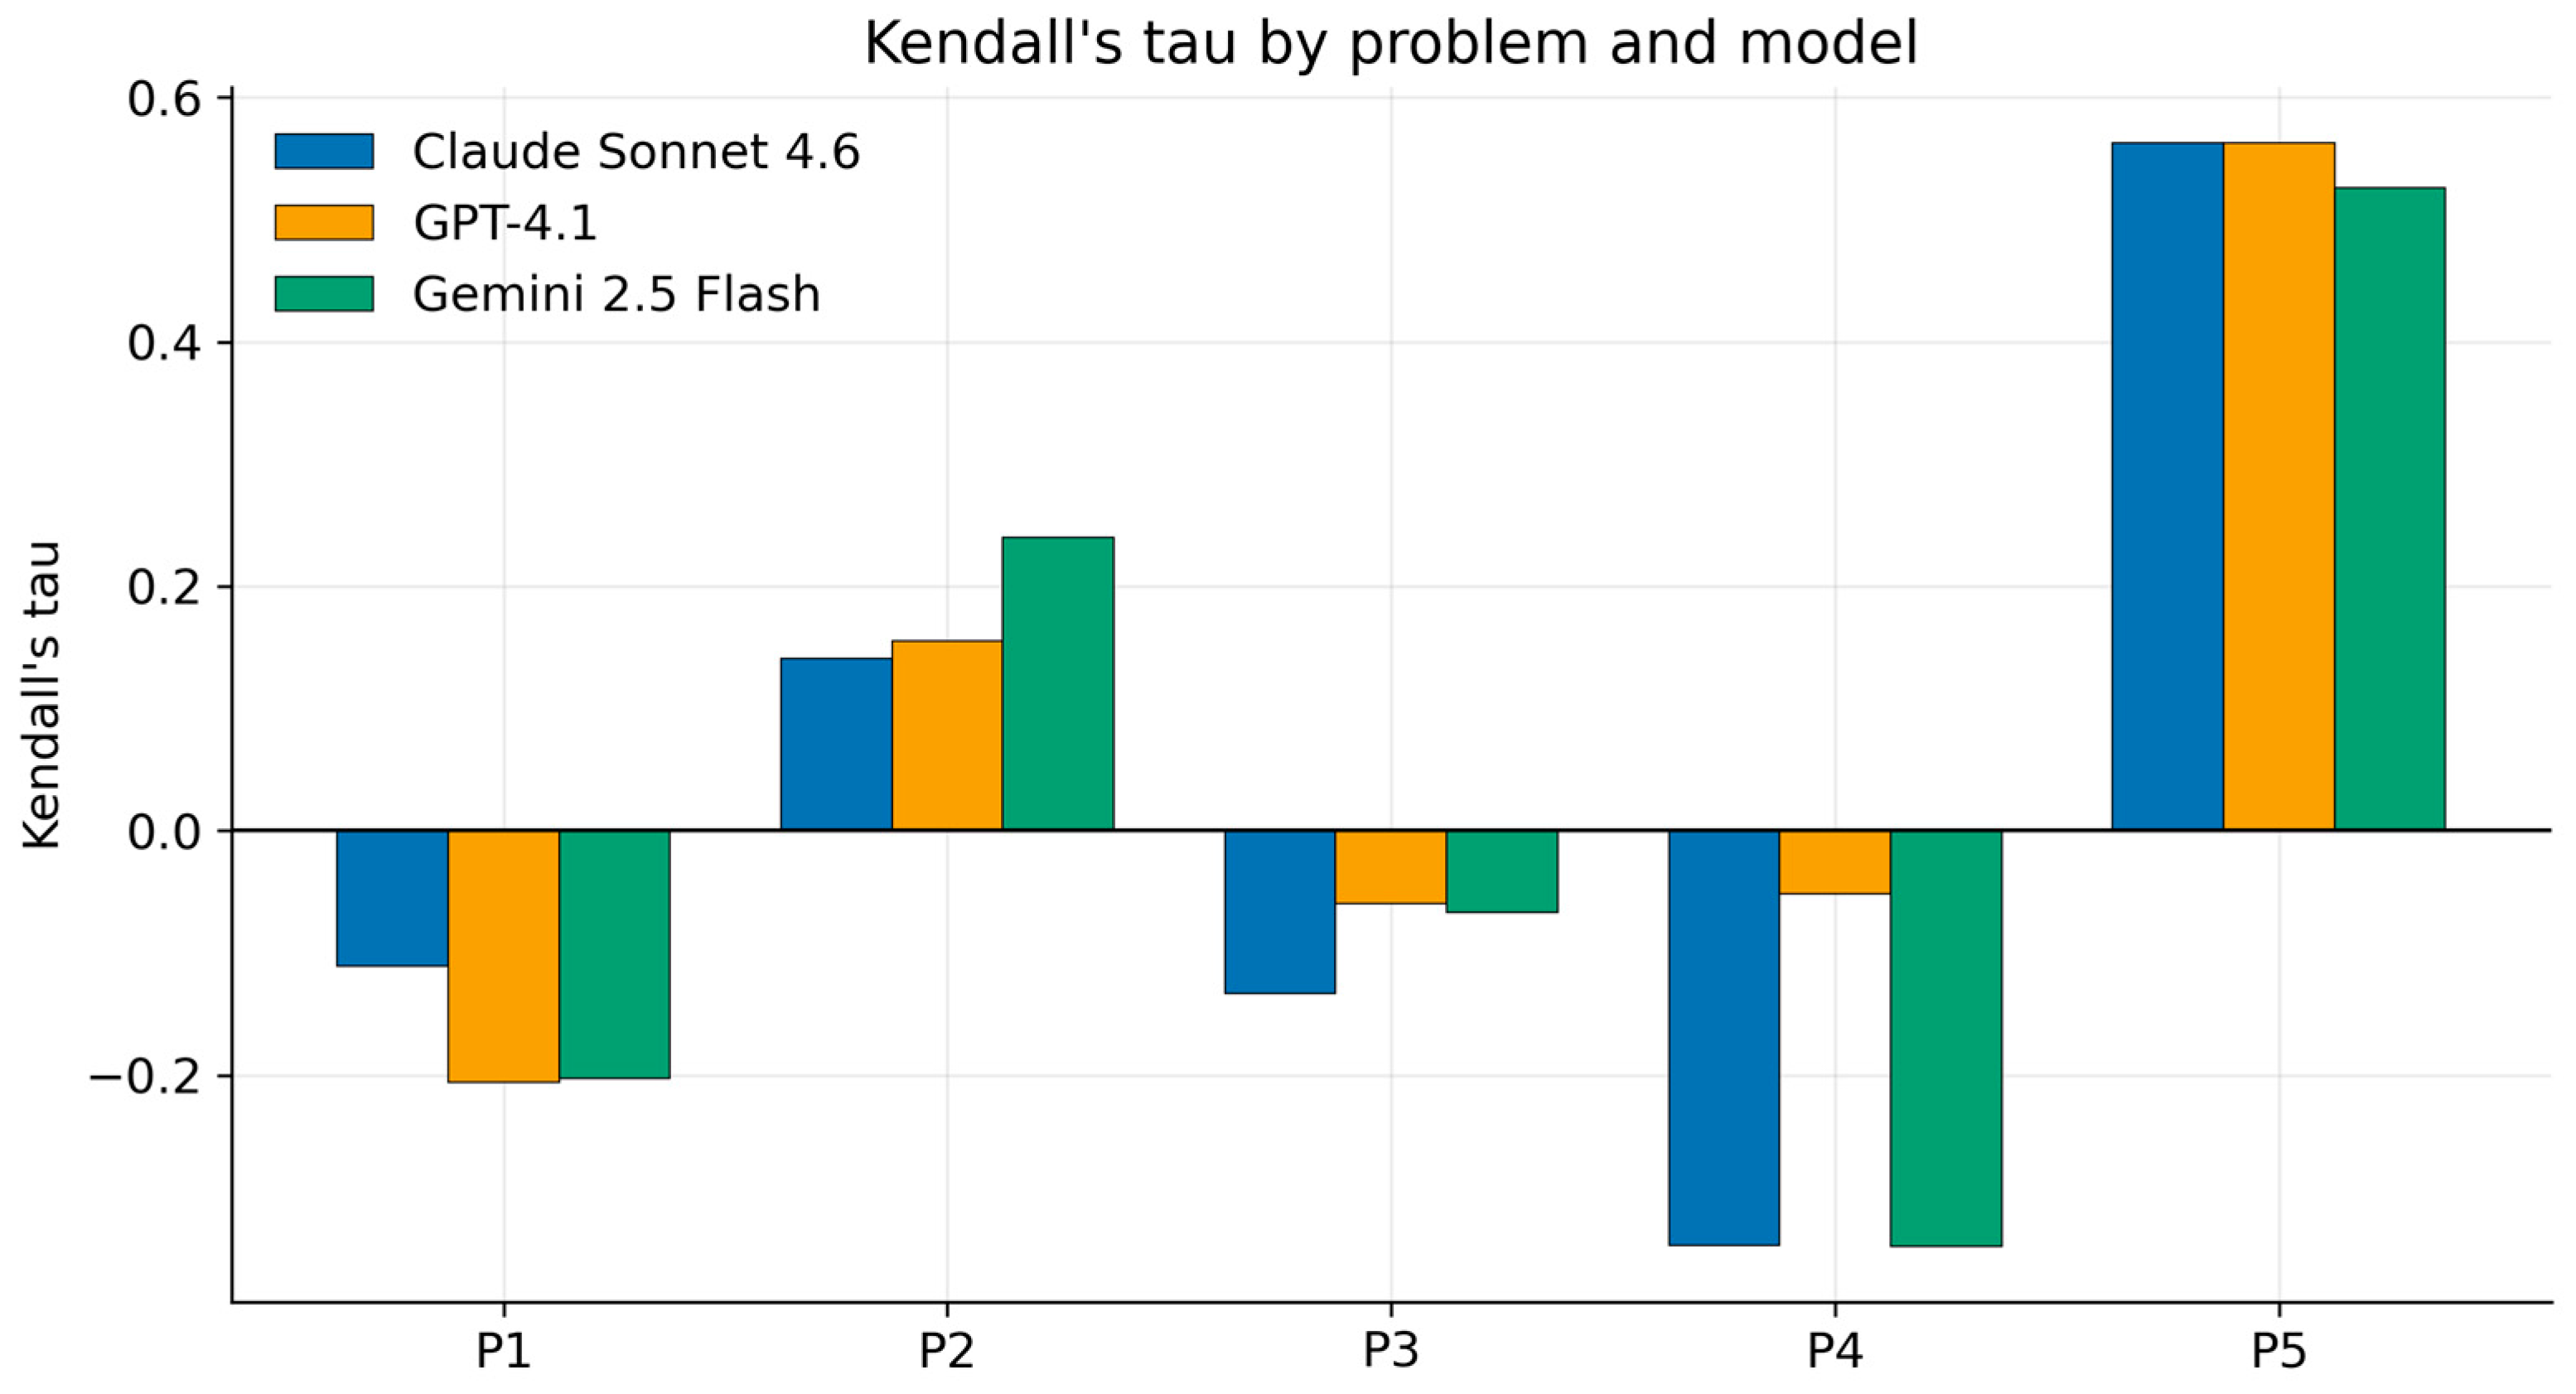
The differences between problems remain substantially larger than the differences between models, consistent with the pilot study, with this gap now becoming more pronounced. In three of the five problems (Medical Visualization, Aircraft Selection, Electric Car), all models showed a negative Kendall’s τ. Because this alone does not establish agreement beyond chance, a Monte Carlo permutation test was performed for each problem separately. Two problems showed agreement below chance according to the permutation test: Electric Car (τ = −0.24, null interval [−0.07, 0.07]) and Medical Visualization (τ = −0.17, null interval [−0.10, 0.10]). Two problems (Four-Wheeler Selection, Military Advanced Training Selection) showed agreement above chance according to the same test, while Aircraft Selection (τ = −0.09, null interval [−0.14, 0.14]) did not differ statistically from chance, despite its negative estimate. Note that the per-model confidence intervals for this problem in Table 5 exclude zero: they describe the consistency of the pipeline across executions, whereas the permutation null describes the spread of random rankings of only four alternatives, which is much wider. For scale, with four alternatives each discordant pair lowers τ by 0.33 (a single swapped pair gives τ = 0.67), so the mean τ of 0.55 in Military Advanced Training Selection corresponds to between one and two discordant pairs out of six. Despite this relatively high τ, Top-3 accuracy for this problem (66.7%) is at the lowest attainable value and below the chance expectation of 75% (N = 4, Section 4.2); with only four alternatives, τ and Top-3 can diverge sharply, since τ is sensitive to the full ordering while Top-3 collapses to a coarse set-overlap measure at this small N. Because τ takes such coarse values with four alternatives, agreement in this problem should be interpreted with caution; whether it reflects the simplicity of the problem or the LLM’s prior knowledge of the four aircraft was not tested.
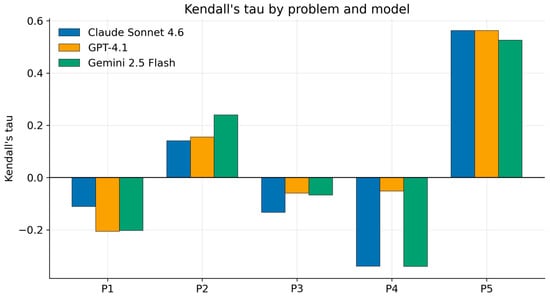
No model consistently outperformed or underperformed the others: GPT-4.1 showed the least negative agreement on the Electric Car problem (τ = −0.052), but on the other problems, it performed similarly to the other two models, and all models showed very similar agreement on the Military Advanced Training Selection problem (τ = 0.53–0.56). This inconsistency in model performance across problems supports the finding of the pilot study in a new sample. Figure 3 presents Kendall’s correlation by problem and model.
Figure 3.
Kendall’s τ by Problem and Model.
5.3. Prior Knowledge as a Candidate Explanatory Factor
The pilot study hypothesis (that compensatory problems are more difficult) does not fully explain the observed pattern. In the present pipeline, the numerical values in the problem texts do not reach the scoring step (Section 3.2), so differences in how the input data were formatted cannot directly account for the differences between problems. A candidate explanation, which was not tested, is that agreement depends on how well the LLM’s prior knowledge of the named alternatives and criteria reflects the ranking published in the source study.
Two descriptive observations are consistent with this possibility:
First, in Medical Visualization and Aircraft Selection, disagreements with the benchmark were concentrated on familiar alternatives (e.g., Tableau/Jupyter instead of the reference Visual.ly; Boeing 737 instead of the reference Airbus A321neo). This is what would be expected if the scores were driven by the familiarity of the names, since the numerical data do not reach the scoring step; this reading was not tested.
Second, in the Electric Car problem, the alternatives are anonymous identifiers (A1–A10), so the scoring step has no information about them other than their labels. Agreement was below chance according to the permutation test in this problem (τ = −0.24), and its interpretation is therefore limited: the scores cannot reflect knowledge of the alternatives themselves.
Prior knowledge is therefore put forward as a hypothesis, in addition to the compensatory/non-compensatory distinction. Because the problems differ from one another in several respects at once (domain, number of alternatives, familiarity of the alternatives), these factors cannot be separated from problem identity in the present design. Testing this hypothesis would require a version of the pipeline that passes the numerical data to the scoring step, applied to the same problems.
5.4. Robustness Across MCDA Methods and Temperature
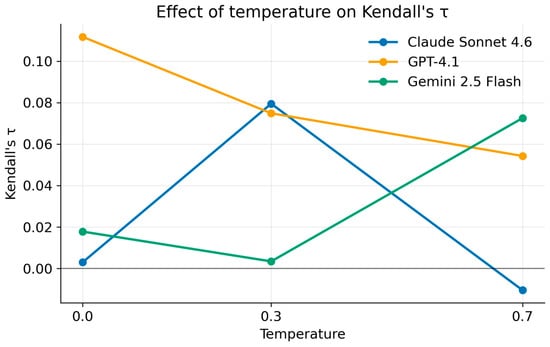
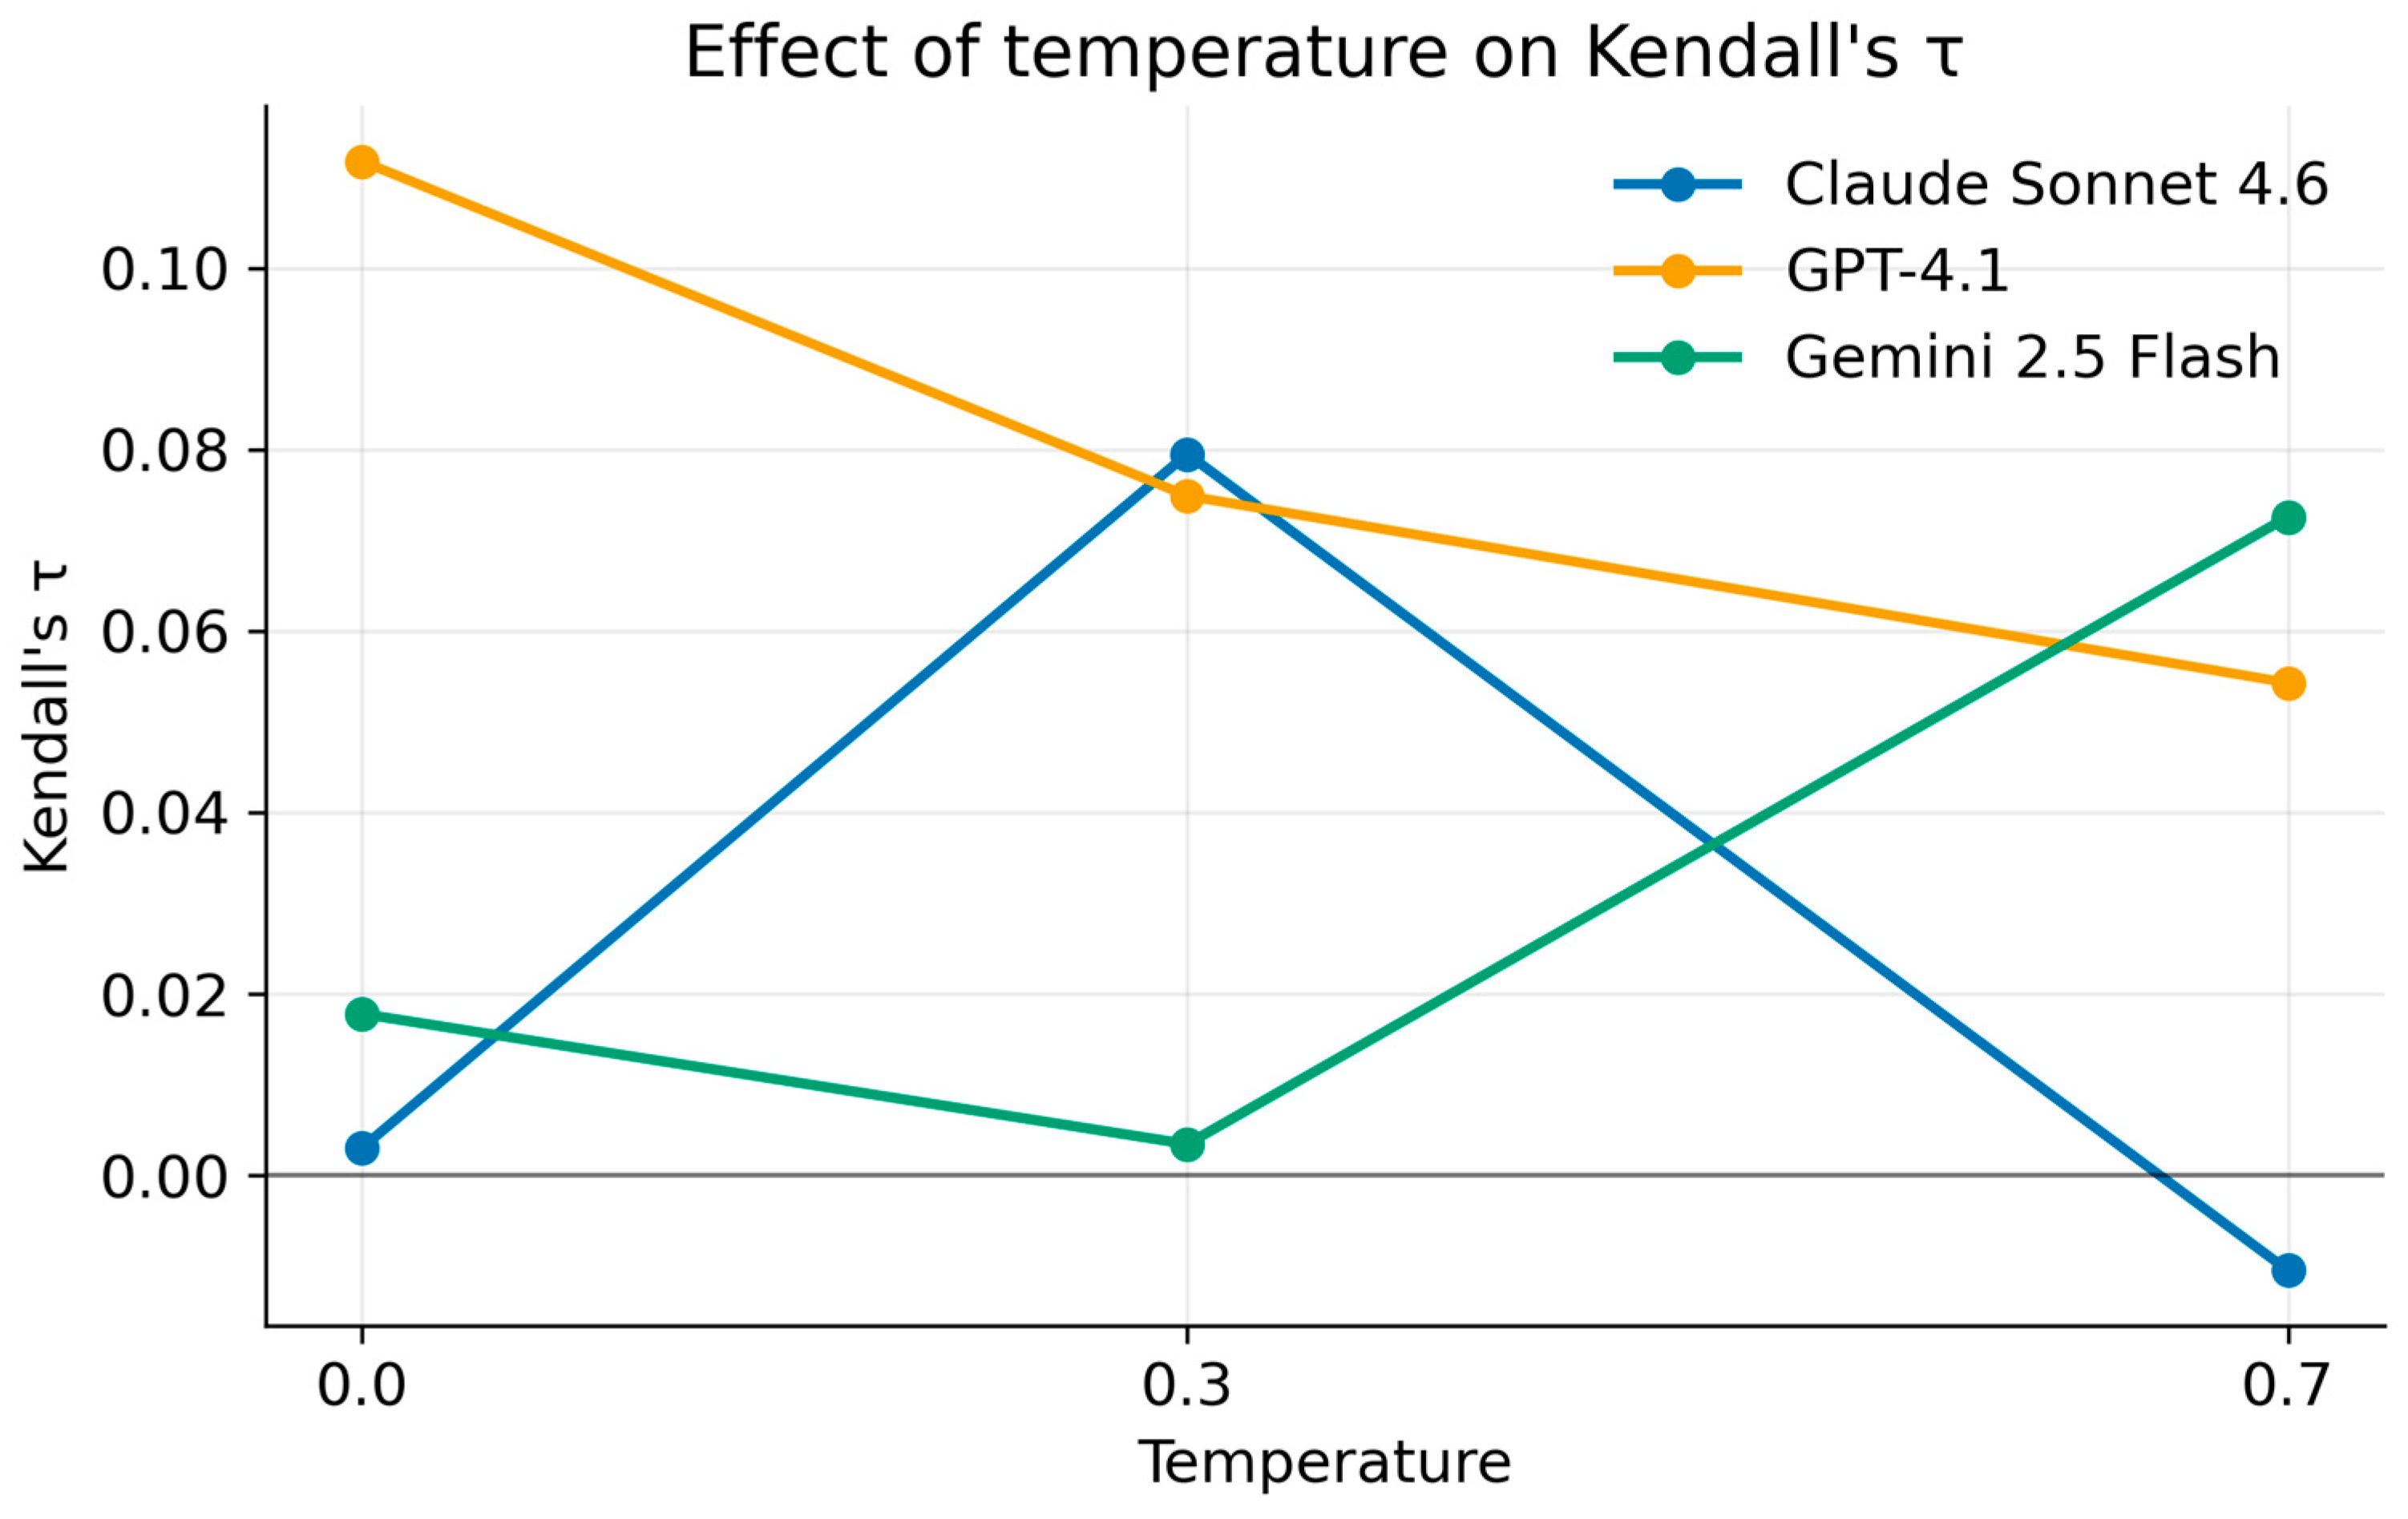
The MCDA method and the sampling temperature again showed no statistically significant effect on performance. Across the TOPSIS, LLM-weighted linear scoring, and PROMETHEE II methods, the Friedman test found no statistically significant differences among the methods (χ2 = 0.085, p = 0.959), providing weaker evidence against the null hypothesis than the pilot study (χ2 = 4.22, p = 0.121). Between-method variability was lowest for Gemini 2.5 Flash (σ = 0.034) and highest for Claude Sonnet 4.6 (σ = 0.111), with GPT-4.1 in an intermediate position (σ = 0.069), reversing the ordering observed in the pilot study. Sampling temperature (0.0, 0.3, and 0.7) also showed no statistically significant effect in the omnibus test (Kruskal–Wallis H = 0.13, p = 0.937), and the largest difference in mean τ between temperatures within a single model was 0.089, compared with 0.139 in the pilot study. Figure 4 illustrates the effect of sampling temperature on Kendall’s τ.
Figure 4.
Effect of sampling temperature on Kendall’s τ.
5.5. Case Study
The Electric Car problem (N = 10 alternatives; 45 pipeline executions × 3 MCDA methods = 135 method-specific outputs) is the most informative individual case in this set of test problems, as it displays the lowest average agreement of all problems for two of the three models (Claude: τ = −0.339 and Gemini: τ = −0.340) and the lowest overall Top-3 accuracy across the five problems (10.1%). In contrast to the Personnel Selection problem in the pilot study, where the disagreement with the benchmark could be attributed to a specific compromise of criteria (cost versus qualification), the Electric Car problem is difficult to interpret, because its alternatives are anonymous identifiers (A1–A10) and the scoring step therefore has no information about them other than their labels. The measured disagreement cannot be read as a judgment about the alternatives themselves. GPT-4.1’s relatively better performance on this problem (τ = −0.052) than the other two models represents the largest inter-model gap observed for any problem in the study and is best interpreted as a descriptive outlier rather than a general model advantage, given the absence of a significant omnibus-level model effect.
5.6. Pipeline Stability by Stage
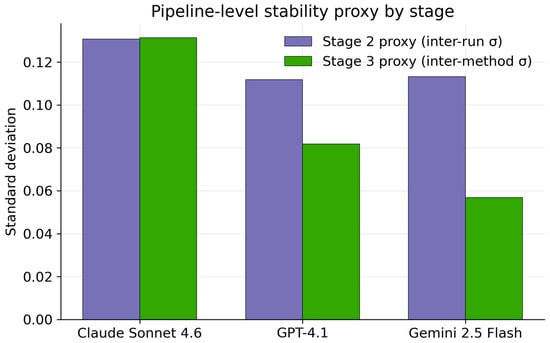
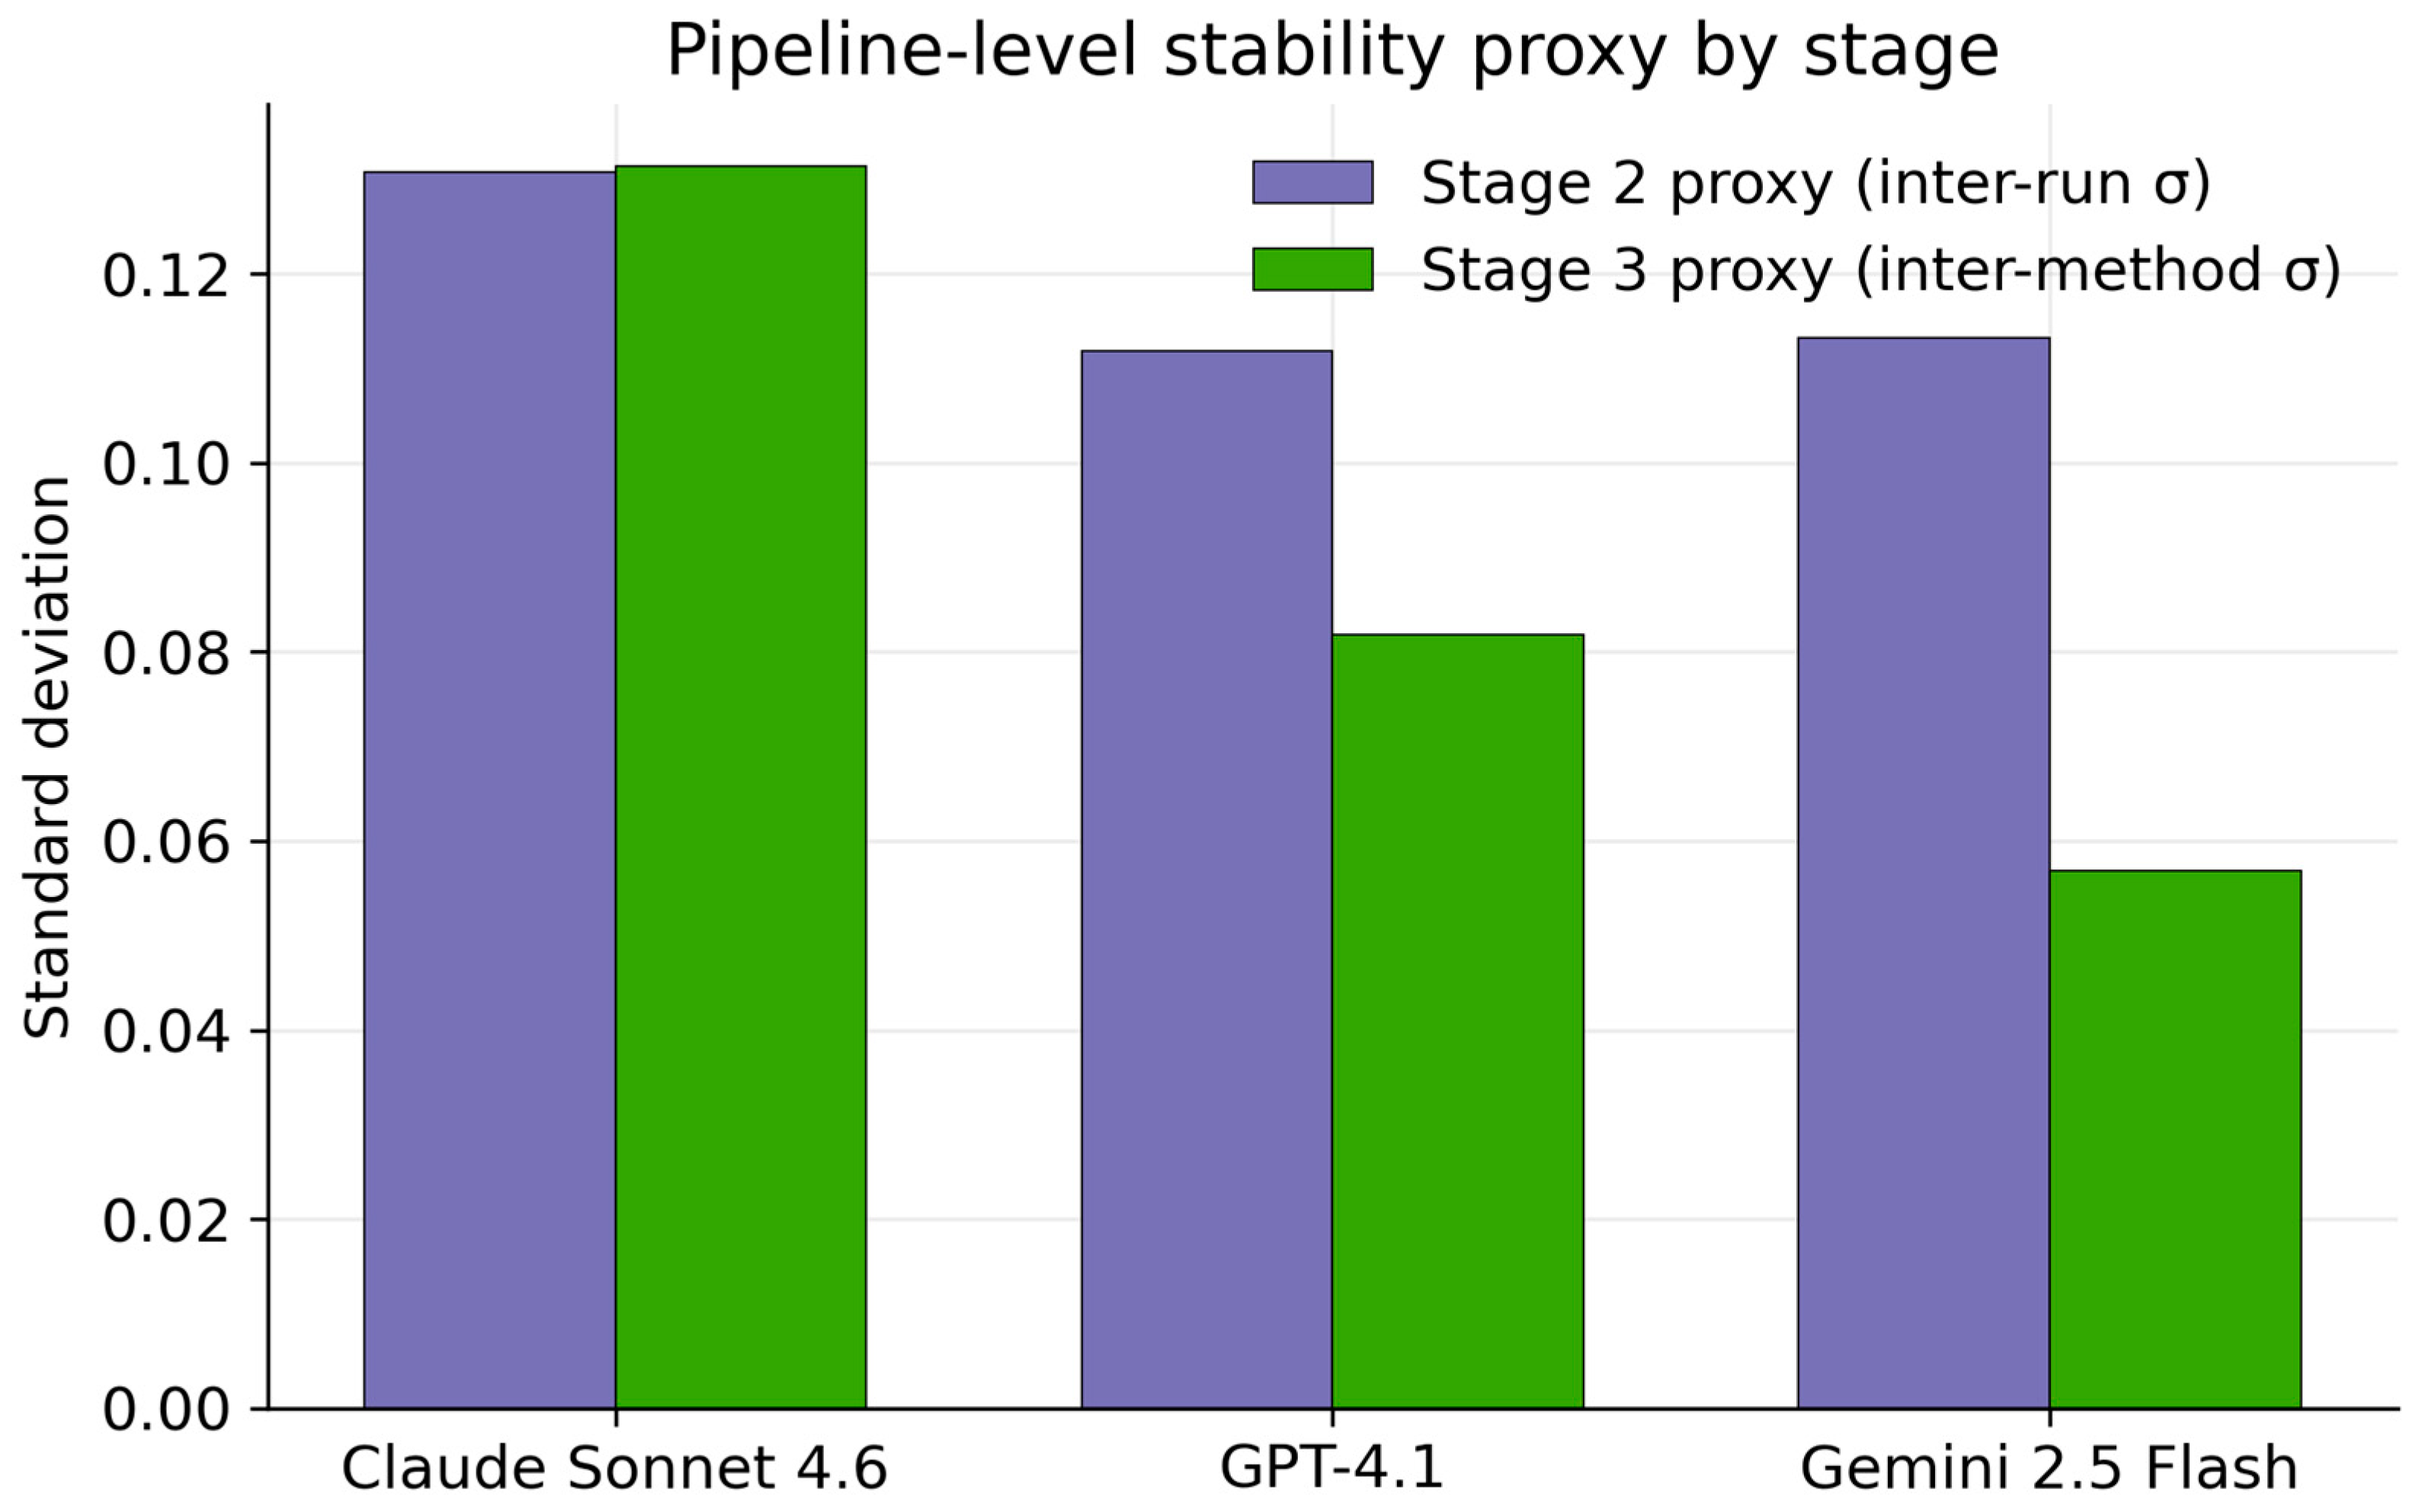
Two proxy indicators were used to assess the stability of the pipeline. The first is the standard deviation of τ across the five repetitions of each model–problem–temperature setting (computed at the execution level and averaged over settings), reflecting the repeatability of the pipeline under identical conditions, and the second is the standard deviation of τ across the three MCDA methods within each setting (computed on the method means and averaged over settings), which specifically reflects the stability of Stage 3, as the three methods TOPSIS, LLM-weighted linear scoring, and PROMETHEE are applied to the same LLM-generated score matrix within each execution.
These two indicators do not reproduce the stability asymmetry observed in the pilot study. There, Claude exhibited low variance between executions but moderate variance between methods, while GPT-4.1 exhibited the reverse pattern. In the present independent sample, the variance between executions is now similar for all three models (Claude σ = 0.105, GPT-4.1 σ = 0.100, Gemini σ = 0.101), while the variance between methods, although still different by model, produces a different ordering from that observed previously: Claude now shows the highest variance between methods (σ = 0.111), GPT-4.1 intermediate (σ = 0.069) and Gemini the lowest (σ = 0.034) in contrast to the pilot study, where GPT-4.1 was the lowest and Gemini the highest.
The failure to reproduce this pattern is itself an informative finding. It suggests that the ‘asymmetry’ of the pilot study, which was not statistically significant even in the pilot study, should not be treated as a fixed characteristic of a given model, and that relative stability rankings across models may depend more on the specific set of problems than on general model behavior. This reinforces, rather than weakens, the central argument of the work that the identity of the problem, rather than the identity of the model, is the main factor that influences the behavior of the pipeline: even properties that seemed model-dependent in a sample (stability rankings) do not generalize to an independent problem sample. Figure 5 provides an overview of pipeline stability at each stage through proxy analysis.
Figure 5.
Proxy Analysis of Pipeline Stability by Stage.
6. Discussion
The central finding is that model selection has a much smaller effect on performance than problem identity (pooled test: H = 1.10, p = 0.577, η2 = 0.005; a small but significant effect emerges once problem is controlled for, η2 = 0.6%), while the identity of the problem accounts for 76.1% of the variance (η2 = 0.761), which is substantially higher than the 39.4% observed in the pilot study, despite the greater complexity of the five problems. The replication of this finding in an independent and more difficult sample reinforces the central claim that pipeline reliability depends substantially more on the specific problem than on model selection. The practical implications, however, are more cautious. In the pilot study, the pipeline disagreed with the benchmark with only one compensatory problem. Here, it produced a negative mean agreement score on three of the five problems, with two showing agreement below chance according to the permutation test; some of these problems are not clearly compensatory. Therefore, the distinction between compensatory and non-compensatory problems is not sufficient on its own; the LLM’s prior knowledge of the named alternatives is proposed as a possible additional factor but remains a hypothesis to be tested in future research, not a confirmed effect. From a practical perspective, the conclusion is more conservative: Top-3 accuracy averaged 55.0% (ranging from 10.1% to 72.1% across problems); two of the five problems (Aircraft Selection, Military Advanced Training Selection), both with only four alternatives, performed at or below their chance-level baseline of 75% despite one of them (Military Advanced Training Selection) showing the highest τ of all problems, illustrating that Top-3 and τ can disagree at small N. The pipeline should not yet be considered universally reliable, because its reliability varies strongly across problems and the problem characteristics driving this variation have not yet been established.
6.1. Comparison with the Existing Literature
The findings are broadly consistent with previous research on the integration of LLMs into individual stages of AHP and other MCDA methods, while also extending it. The present study builds on the methodological heterogeneity recorded by a recent systematic review [11], which did not identify any single framework for assessing the elicitation of criterion weights through LLMs across different types of problems, and extends this observation of problem-dependent variability to three LLMs and two independent reference problem sets, showing a substantially larger effect of problem identity (η2 = 0.394 in the pilot study, 0.761 here) than that of model selection. A pooled, unstratified comparison finds no significant difference between models in either sample, but this test has low power to detect a model effect against the much larger between-problem variance. When problem is controlled for, a small but statistically significant model effect is detectable in the present sample. This is consistent with, and considerably better powered than, the nominally significant but unstable effect noted in the exploratory mixed-model analysis of the pilot study. The predominance of problem identity over model choice does not, by itself, indicate whether disagreement with the benchmark reflects a computational error or the LLM’s own unelicited prioritization, a distinction the protocol cannot separate.
This pattern confirms the finding that structured, hierarchical decomposition of criteria via AHP may produce different outcomes across problems in ways that are not fully explained by model capability alone [12], which is consistent with the present findings. The pilot study’s hypothesis on cost bias does not extend directly to the three worst-performing problems in the present sample, as two of them (Electric Car and Medical Visualization) fall below the level expected by chance according to the permutation test, while the third (Aircraft Selection) is not distinguishable from chance. The hypothesis about LLM’s prior knowledge is proposed as a complementary rather than a competing explanation, and it was also not directly tested.
Overall, applying the same protocol to two independent problem sets reinforces the main methodological argument: an assessment based on a single model and a single problem is not sufficient to assess the reliability of an LLM pipeline in MCDA. Therefore, evaluation protocols that incorporate multiple problems and models are needed to distinguish robust findings, such as the limited effect of model selection and the predominance of problem identity, from findings that were specific to the sample of the pilot study (e.g., the stability asymmetry that was not reproduced).
6.2. Limitations
Expert rankings as benchmarks: Published expert rankings are useful benchmarks but should not be treated as objective ground truth. They reflect the particular weights, preferences and methods of each source study (AHP, TOPSIS, fuzzy variants and goal programming across our five problems), so the metrics measure agreement with a specific published outcome rather than absolute correctness. The benchmarks are also not mutually comparable, since they come from different methods and different expert panels. In a sensitivity test, in the two problems with four alternatives a single transposition changes τ by 0.333, a change comparable in size to many of the observed differences between problems, whereas in Electric Car (ten alternatives) the same transposition changes τ by only 0.044. This suggests that the large negative τ in Electric Car is unlikely to be an artifact of the benchmark ranking.
Explanations were not assessed: Kendall’s τ measures ranking agreement only. The quality of the Stage 4 explanations, including the accuracy of the justifications, was not quantitatively evaluated in this study. In particular, the method agreement assessment reflects agreement between three methods applied to the same LLM-generated scores and weights rather than an independent measure of correctness, and it was not tested against the benchmark; the method agreement labels themselves were not retained in the stored results, so a direct test could not be performed.
As a proxy, we examined, for each of the 225 executions, whether the three MCDA methods (TOPSIS, LLM-weighted scoring, PROMETHEE) agreed on the top-ranked alternative (all three agreeing = “high” proxy agreement, 131/225 executions; two of three = “medium”, 92/225; all three differing = “low”, 2/225). This proxy is not the confidence label produced by Stage 4, since that label is based on comparing the full ranking across the three methods, not only the top position. Results were mixed across problems: in Electric Car, executions with high proxy agreement had a higher mean τ than those with lower agreement (Kruskal–Wallis, H = 8.10, p = 0.017), consistent with agreement tracking performance; in Medical Visualization, the opposite pattern was observed (mean τ of −0.20 for high agreement vs. −0.16 for medium, H = 3.05, p = 0.081, not significant), suggesting that method agreement should not be assumed to indicate correctness in general. A direct test of the actual Stage 4 label is left for future work, particularly on the weakest problems.
Label matching: Alternatives in the Stage 1 output are matched to the expert ranking by normalizing the labels (case, spacing and edge punctuation) and then trying an exact match, containment of one label in the other, and a fuzzy string match (similarity cutoff 0.85); an expert alternative that cannot be matched is placed in last position. In Electric Car, where alternatives are anonymous identifiers, Stage 1 produced 24 distinct labels for at most 10 alternatives (e.g., “A6”, “Alternative A6”, “Electric Car A6”). In the 135 Electric Car outputs, the Top-1 hits coincided exactly with the labels containing the expert’s best alternative (A8). The execution log shows no case among the 225 executions in which an expert alternative could not be matched, and none in which Stage 1 returned more than the maximum of 16 criteria; the code issues a warning in both cases. However, Stage 1 outputs and the complete ranking vectors were not retained, so the completeness of the extracted criteria relative to the source studies (e.g., the 12 criteria of Medical Visualization) and the effect of label variants on τ could not be assessed, and the matching was not audited for false matches, for example when containment or fuzzy matching pairs two different alternatives. An earlier calculation applied this same fuzzy fallback to Top-1 and Top-3 as well, which are computed by matching against a small subset (the top one or three items) rather than the complete ranking; when the reference alternative was absent from that subset, the fallback could match a different, similar-looking item, inflating both metrics for Aircraft Selection and Electric Car. The pipeline was not re-executed, and no new LLM calls were made. Because the full ranking vectors were not retained, the corrected Top-1 and Top-3 values were reconstructed from the archived first-ranked alternative, Kendall’s τ and Spearman’s ρ of each output, and this reconstruction reproduces all 675 archived outputs.
LLM-generated weights and scores: Both the criterion weights (Stage 2) and the alternative scores (Stage 3) are produced by the LLM rather than taken from published expert weights or data. As described in Section 3.2, the numerical values of the benchmark problems do not reach these stages: both are generated from the names of the alternatives and criteria. The metrics therefore assess the agreement of an LLM judgment, based on prior knowledge, with the published rankings; they do not show that the pipeline can analyze numerical decision data, and should not be read as evidence of that ability. In Electric Car, the alternatives are anonymous identifiers, so the scores cannot reflect knowledge of the alternatives. The text of Military Advanced Training Selection also included the published closeness scores of the alternatives; these are not passed to the later stages, but the Stage 1 summaries were not audited for their presence. Because of this, the protocol cannot currently distinguish two different sources of disagreement with a published ranking: errors in extracting or scoring the decision problem, and legitimate differences in priorities between the LLM-generated weights and the (unobserved) weights of the source study. Testing this directly would require providing the published criteria and weights to Stage 3. However, Stage 1 autonomously extracts its own criterion set for each problem, and this set is not guaranteed to match that of the source study, so the published weights could not be substituted without a criterion-by-criterion mapping that would depart from the pipeline’s fully autonomous design. For this reason, the evaluation protocol compares the pipeline against the published final rankings only, which remain comparable regardless of the criteria structure each model selects, rather than against intermediate weights. Supplying the published expert weights to Stage 3, in place of the LLM-generated weights from Stage 2, would isolate this distinction in future work. More broadly, this reflects a general distinction among decision-support approaches in whose preferences the criterion weights represent, discussed in Section 2.1: some approaches elicit weights directly from stakeholders, so that the weights reflect identified decision makers’ priorities, whereas the present pipeline generates weights automatically without eliciting them from any decision maker. As noted there, this limits the extent to which disagreement with the published expert rankings can be attributed to a computational error rather than to a legitimately different, or undefined, prioritization scheme.
Independence of executions: The permutation test compares the mean τ of the 45 executions of each problem with the mean of 45 independent random rankings. The executions of a problem are not independent, since they use the same problem text and only three models, and the pipeline tends to produce similar rankings across executions. The test is therefore likely to be optimistic, and the significant deviations from chance should be treated as descriptive. This also explains why the confidence intervals of Aircraft Selection exclude zero while its mean τ lies within the permutation null interval: the intervals reflect the consistency of the pipeline across executions, whereas the null interval reflects the variability of random rankings of only four alternatives.
Top-k baseline varies with N: The chance-level baseline for Top-3 accuracy is k/N, ranging from 30% (Electric Car, N = 10) to 75% (Aircraft Selection and Military Advanced Training Selection, N = 4). Raw Top-3 percentages are therefore not directly comparable across problems, and a problem’s Top-3 value should be read relative to its own baseline rather than against the other problems.
Generalizability: The five problems, although more varied than the four in the pilot, remain few and do not cover other areas such as energy or policy, so the findings are provisional. Only three models, in specific versions, were tested, and results may change as models are updated. Scaling up the number of problems and executions is constrained by the cost and time of each execution. Finally, because the problems differ from one another in several respects at once (domain, number of alternatives, familiarity of the alternatives), the design cannot separate the effect of any one of these from problem identity; doing so would require experiments that vary one factor while holding the others constant.
7. Conclusions
The present paper developed a reproducible protocol for the evaluation of LLM pipelines in end-to-end MCDA problems, implemented it in a four-stage pipeline and evaluated it on a second, independent set of five problems, following a pilot study involving four problems.
Model selection again had a much smaller effect than problem identity (pooled test: H = 1.10, p = 0.577, η2 = 0.005; η2 = 0.6% once problem is controlled for), confirming the finding of the pilot study. A complementary exploratory analysis did not change this conclusion. Future evaluations should continue to use multiple models and multiple problems.
Problem identity remained the dominant factor and was even substantially stronger than in the pilot study (η2 = 0.761 vs. 0.394), which emphasizes the importance of diversity in the design of test problems. Three of the five problems produced a negative mean τ in all models; two of them (Electric Car and Medical Visualization) fell below chance according to the permutation test, while Aircraft Selection was not distinguishable from chance. This pattern shows that the compensatory/non-compensatory distinction does not fully explain the observed disagreement with the benchmark. The LLM’s prior knowledge of the named alternatives is put forward as a possible additional explanation but remains a hypothesis for future work.
The usefulness of the pipeline as a preselection tool is also more conditional: Top-3 accuracy ranged from 10.1% to 72.1%, so reliability varies across problems and requires case-by-case assessment. An open question is how multi-stage and one-stage pipelines compare.
Future extensions could include application to larger problem sets, and a version of the pipeline that passes the numerical data to the scoring step, which would allow testing the role of the LLM’s prior knowledge.
Overall, the findings from the two independent problem sets, comprising 675 method-level results in the present study and 540 in the pilot study, show that the reliability of an LLM pipeline in MCDA depends less on model selection and more on the problem itself. Which problem characteristics drive this dependence, including a possible role of the LLM’s prior knowledge of the named alternatives, remains to be established. Reliability therefore cannot yet be assumed across arbitrary problems without prior assessment.
Author Contributions
Conceptualization, M.R.O.; methodology, M.R.O.; software, M.R.O.; validation, M.R.O., J.P., L.T. and G.D.; formal analysis, M.R.O.; investigation, M.R.O.; resources, M.R.O.; data curation, M.R.O.; writing—original draft preparation, M.R.O.; writing—review and editing, M.R.O., J.P., L.T. and G.D.; visualization, M.R.O.; supervision, J.P.; project administration, J.P. All authors have read and agreed to the published version of the manuscript.
Funding
This research received no external funding.
Data Availability Statement
The experimental data (225 pipeline executions, 675 method-specific results, including Kendall’s τ, Spearman’s ρ, Top-1 and Top-3 accuracy for each model, MCDA method, temperature, and benchmark problem, together with the results of the pilot study: 180 executions, 540 method-specific results) are openly available in Zenodo at 10.5281/zenodo.22912223.
Conflicts of Interest
The authors declare no conflicts of interest.
Abbreviations
The following abbreviations are used in this manuscript:
| LLM-WS | LLM-Weighted Linear Scoring |
| DSS | Decision Support System(s) |
| LLM | Large Language Model |
| MCDA | Multi-Criteria Decision Analysis |
| PROMETHEE | Preference Ranking Organization Method for Enrichment Evaluations |
| TOPSIS | Technique for Order of Preference by Similarity to Ideal Solution |
Appendix A. System Prompts by Stage
- Stage 1—Problem AnalystSystem: “You are an expert MCDA consultant. Extract the decision problem structure.Extract 4–16 criteria. Each criterion must have type: benefit or cost.Return ONLY valid JSON, no markdown, no explanation.”User: “Extract: {alternatives: [{id, name, description}],criteria: [{id, name, description, type}]}from: [PROBLEM_TEXT]”Stage 2—Weight ElicitorSystem: “Assign weights to criteria. Weights must sum to exactly 1.0.Keep reasoning strings under 10 words each.Return ONLY valid JSON.”User: “Decision: [summary]. Criteria: [list].Return: {weights: {C1: 0.0, …}, reasoning: {C1: short_reason, …}}”Stage 3—MCDA ExecutorSystem: “Score alternatives on criteria 1–10.BENEFIT criterion: 10 = best performance. COST criterion: 10 = lowest cost.Return ONLY valid JSON.”Stage 4—ExplainerSystem: “Explain MCDA results to decision-makers. Be concise.Return: {ranking_summary, top_alternative_justification,method_disagreement_analysis, method_agreement}”
References
- Greco, S.; Ehrgott, M.; Figueira, J.R. (Eds.) Multiple Criteria Decision Analysis: State of the Art Surveys, 2nd ed.; Springer: New York, NY, USA, 2016. [Google Scholar] [CrossRef] [Scilit]
- Mardani, A.; Jusoh, A.; Nor, K.M.D.; Khalifah, Z.; Zakwan, N.; Valipour, A. Multiple criteria decision-making techniques and their applications—A review of the literature from 2000 to 2014. Econ. Res.-Ekon. Istraž. 2015, 28, 516–571. [Google Scholar] [CrossRef] [Scilit]
- Belton, V.; Stewart, T.J. Multiple Criteria Decision Analysis: An Integrated Approach; Springer: New York, NY, USA, 2002. [Google Scholar] [CrossRef] [Scilit]
- Pereira, V.; Basilio, M.P.; Santos, C.H.T. Enhancing decision analysis with a large language model: pyDecision—A comprehensive library of MCDA methods in Python. J. Model. Manag. 2026, 21, 481–521. [Google Scholar] [CrossRef] [Scilit]
- Więckowski, J.; Sałabun, W.; Kizielewicz, B.; Bączkiewicz, A.; Shekhovtsov, A.; Paradowski, B.; Wątróbski, J. Recent advances in multi-criteria decision analysis: A comprehensive review of applications and trends. Int. J. Knowl.-Based Intell. Eng. Syst. 2023, 27, 367–393. [Google Scholar] [CrossRef] [Scilit]
- Saaty, T.L. Analytic hierarchy process. In Encyclopedia of Biostatistics; Armitage, P., Colton, T., Eds.; John Wiley & Sons: New York, NY, USA, 2005. [Google Scholar] [CrossRef] [Scilit]
- Darko, A.; Chan, A.P.C.; Ameyaw, E.E.; Owusu, E.K.; Pärn, E.; Edwards, D.J. Review of application of analytic hierarchy process (AHP) in construction. Int. J. Constr. Manag. 2019, 19, 436–452. [Google Scholar] [CrossRef] [Scilit]
- Sivrikaya, F.; Küçük, Ö. Modeling forest fire risk based on GIS-based analytical hierarchy process and statistical analysis in Mediterranean region. Ecol. Inform. 2022, 68, 101537. [Google Scholar] [CrossRef] [Scilit]
- Arman, A.; Foresti, S.; Livraga, G.; Samarati, P. Cloud plan selection under requirements of multiple applications. Secur. Priv. 2018, 1, e35. [Google Scholar] [CrossRef] [Scilit]
- Handler, A.; Larsen, K.R.; Hackathorn, R. Large language models present new questions for decision support. Int. J. Inf. Manag. 2024, 79, 102811. [Google Scholar] [CrossRef] [Scilit]
- Ouzounis, M.R.; Papathanasiou, J.; Tsaples, G.; Drogalas, G. Large Language Models in MCDA Weight Elicitation: A Systematic Review. In Decision Support Systems XVI; Cabral Seixas Costa, A.P., Radovanović, S., Zhao, G., Jayawickrama, U., Eds.; Springer: New York, NY, USA, 2026; Volume 582, pp. 257–269. [Google Scholar] [CrossRef] [Scilit]
- Jović, J.L.; Domazet, D.S.; Vesić, N.O.; Ranđelović, B.M.; Simjanović, D.J. An integrated AHP–fuzzy AHP evaluation framework for large language models in software engineering education. Mathematics 2026, 14, 1637. [Google Scholar] [CrossRef] [Scilit]
- He, Y.; Smirnov, I.; Fedrushkov, D.; Kovalchuk, S.; Revin, I. Structured multi-criteria evaluation of large language models with fuzzy analytic hierarchy process and DualJudge. arXiv 2026, arXiv:2604.03742. [Google Scholar] [CrossRef] [Scilit]
- Wu, Q.; Bansal, G.; Zhang, J.; Wu, Y.; Li, B.; Zhu, E.; Jiang, L.; Zhang, X.; Zhang, S.; Awadallah, A.; et al. AutoGen: Enabling next-gen LLM applications via multi-agent conversation. In Proceedings of the First Conference on Language Modeling (COLM 2024), Philadelphia, PA, USA, 7–9 October 2024. [Google Scholar]
- Schick, T.; Dwivedi-Yu, J.; Dessi, R.; Raileanu, R.; Lomeli, M.; Hambro, E.; Zettlemoyer, L.; Cancedda, N.; Scialom, T. Toolformer: Language Models Can Teach Themselves to Use Tools; Advances in Neural Information Processing Systems 36; Neural Information Processing Systems: South Lake Tahoe, NV, USA, 2023. [Google Scholar] [CrossRef] [Scilit]
- Wei, J.; Wang, X.; Schuurmans, D.; Bosma, M.; Ichter, B.; Xia, F.; Chi, E.H.; Le, Q.V.; Zhou, D. Chain-of-Thought Prompting Elicits Reasoning in Large Language Models; Advances in Neural Information Processing Systems 35; Neural Information Processing Systems: South Lake Tahoe, NV, USA, 2022; pp. 24824–24837. [Google Scholar] [CrossRef] [Scilit]
- Kojima, T.; Gu, S.S.; Reid, M.; Matsuo, Y.; Iwasawa, Y. Large Language Models Are Zero-Shot Reasoners; Advances in Neural Information Processing Systems 35; Neural Information Processing Systems: South Lake Tahoe, NV, USA, 2022; pp. 22199–22213. [Google Scholar] [CrossRef] [Scilit]
- Albarrak, A.M. Determining a trustworthy application for medical data visualizations through a knowledge-based fuzzy expert system. Diagnostics 2023, 13, 1916. [Google Scholar] [CrossRef] [Scilit] [PubMed]
- Das, S.; Bhattacharjee, A.; Maity, M.; Sahoo, R.; Mondal, J.K. Selection of optimal four wheeler applying AHP & TOPSIS technique. Int. J. Exp. Res. Rev. 2019, 20, 10–27. [Google Scholar] [CrossRef] [Scilit]
- Kiracı, K.; Akan, E. Aircraft selection by applying AHP and TOPSIS in interval type-2 fuzzy sets. J. Air Transp. Manag. 2020, 89, 101924. [Google Scholar] [CrossRef] [Scilit] [PubMed]
- Hamurcu, M.; Eren, T. Multicriteria decision making and goal programming for determination of electric automobile aimed at sustainable green environment: A case study. Environ. Syst. Decis. 2023, 43, 211–231. [Google Scholar] [CrossRef] [Scilit] [PubMed]
- Sánchez-Lozano, J.M.; Naranjo Rodríguez, O. Application of fuzzy reference ideal method (FRIM) to the military advanced training aircraft selection. Appl. Soft Comput. 2020, 88, 106061. [Google Scholar] [CrossRef] [Scilit]

Disclaimer/Publisher’s Note: The statements, opinions and data contained in all publications are solely those of the individual author(s) and contributor(s) and not of MDPI and/or the editor(s). MDPI and/or the editor(s) disclaim responsibility for any injury to people or property resulting from any ideas, methods, instructions or products referred to in the content. |
© 2026 by the authors. Licensee MDPI, Basel, Switzerland. This article is an open access article distributed under the terms and conditions of the Creative Commons Attribution (CC BY) license.