


Abstract
Humanoid redesign with existing actuators requires balancing torque gain against loaded joint speed and holding duration. This study applies quasi-static load and torque–speed models to three generations of a 134 cm humanoid and measures the deployed hip-roll configuration on a separate bench. Stance narrowing and per-axis gearing increase the calculated hip-roll capacity ratio from 0.70 to 2.03, although the final configuration exceeds its target by only 1.4%. The bench uses two actuators and a 24:55 external gear pair to measure maximum speed at four loads and static holding at three loads. The speed measurements calibrate a torque–speed characteristic used to evaluate candidate reduction ratios. At approximately twice the reference moment, the measured speed is 47.8% below the no-load upper bound. At 23.39 N·m, holding trials terminate after 333–394 s at a prespecified reported-temperature criterion of 70 °C; both lighter loads complete 600 s. Unequal currents and temperatures indicate asymmetric actuator operation during holds. These results relate nominal torque margins to loaded speed and holding time, providing experimentally informed design checks without establishing performance during dynamic play.
1. Introduction
When upgrading an existing humanoid, a university team may need to retain its actuators. Changing actuator class can exceed the available budget and require changes throughout the legs. The practical question is how much can be gained by changing the transmission and leg geometry with the hardware already available. Recent quasi-direct-drive platforms offer backdrivability and high control bandwidth [1,2,3], but adopting that actuator class would require a substantially different platform. This study examines a humanoid built around integrated smart servos.
External gearing increases joint torque at the cost of speed. Narrowing the stance can reduce the hip-roll moment, provided enough clearance remains for the swing leg. These changes must be considered together. Even when the calculated torque margin meets its target, the joint must still move the load at the required speed and hold it for the required duration.
This study asks whether the revised configurations meet a hip-roll capacity ratio target of two under the stated model, and how the corresponding actuator group performs when moving and holding a load. These questions require different evidence. The capacity ratio is calculated for the deployed robot configurations, including the changes in mass. Speed and holding duration are measured on a separate bench with the same actuator model and external gear pair. The comparison is limited to the defined reference posture and the tested bench conditions.
The analysis covers three generations of a 134 cm humanoid deployed between 2017 and 2019. A common quasi-static hip-roll load model separates the effects of stance narrowing and external gearing. Sensitivity calculations examine how the capacity margin changes with uncertain inputs. The standard linear torque–speed model is then used to evaluate which reduction ratios can satisfy a specified load and joint rate together. A ratio that passes separate torque and no-load speed checks may still fail to provide the required speed under load. The equations apply established mechanics to the completed redesign; the bench measurements provide new evidence about the tested actuator group.
The bench uses two actuators and a 24:55 external gear pair, matching the deployed hip-roll configuration. Maximum joint speed is measured at four loads, and static holding is tested at three loads against prespecified duration and temperature criteria. The speed measurements calibrate an effective torque–speed characteristic for comparing candidate ratios. The holding tests record the duration reached at each load and the current and temperature of both actuators.
The original robot is retired; so, the bench uses different actuator units and does not reproduce walking. The measurements cover one actuator pair and one external gear ratio. Recalled competition failures provide context for the mechanical revisions, but concern other joints and cannot validate the hip-roll capacity calculation. The sources of the deployment parameters and the limitations of the recalled record are stated in the methods. Section 2 distinguishes this analysis and the new measurements from earlier platform reports. Section 3, Section 4 and Section 5 describe the model and methods, followed by the results and their implications for redesign.
2. Related Work
Open humanoid platforms document practical ways to obtain useful performance from available components. The igus Humanoid Open Platform uses a lightweight printed structure [4], while NimbRo-OP2X combines paired actuators with external gearing at selected leg axes [5]. Wolfgang-OP emphasizes replaceable subassemblies [6], and DARwIn-OP established a widely used small-scale platform [7]. These examples provide relevant design choices, but the suitability of a particular transmission still depends on the load and rate required at its joint.
Motor and transmission selection has an established analytical basis. Rezazadeh and Hurst derive feasible transmission ratios for candidate motors and a specified task [8]. Their approach selects the motor and ratio together using a known load trajectory. Here, the motor is fixed, and no joint-load trajectory was recorded on the deployed robot. The available analysis is therefore limited to a reference posture and an estimated rate requirement. Series-elastic and proprioceptive actuation address additional requirements for compliance and interaction bandwidth [1,9]. An external gear stage on an integrated servo does not provide those capabilities; its torque gain must be evaluated alongside the loss of joint speed.
Locomotion control determines the demand to which an actuator must respond. Arena et al. [10] developed a hierarchical controller combining central pattern generators with adaptive motor maps and evaluated it through dynamic simulations of a hexapod. That work addresses gait generation and adaptation. The present experiments characterize an isolated actuator group under prescribed loads. The approaches are complementary because a controller supplies the joint-demand trajectory, whereas actuator characterization constrains the output available to follow it. The bench experiments do not compare gait-control algorithms.
General engineering design methods organize the progression from requirements to embodiment [11,12,13]. Field-failure reporting adds evidence for subsequent revisions: FRACAS formalizes reporting and corrective action [14], and studies of mobile robots and RoboCup identify failures associated with hardware and deployment conditions [15,16]. Competitions provide exposure to these conditions [17,18]. The historical record used here was reconstructed from recollection rather than collected through a formal reporting system. It is retained as descriptive context with explicit uncertainty.
The platform itself was published previously. Jeong et al. [19] describe its delivered mechatronic configuration and inverse-kinematics solver. The redesign sequence and its rationale were presented at IASDR 2025 [20]. The present contribution is a quantitative analysis of that existing hardware, supported by new bench measurements. It separates geometric and transmission contributions to the hip-roll margin, evaluates sensitivity to assumed inputs, and measures loaded speed and holding duration for the actuator group. The failure counts are also presented with exposure and confidence intervals. The mechanical modifications and the underlying torque–speed relations are not new contributions.
3. Torque and Speed Constraints
3.1. Reference Hip-Roll Load
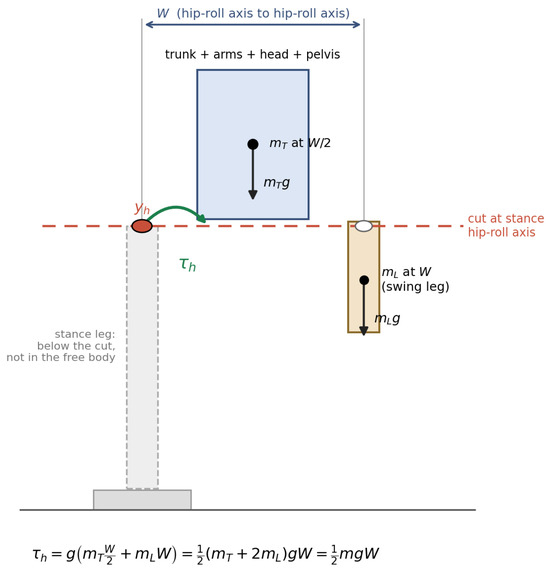
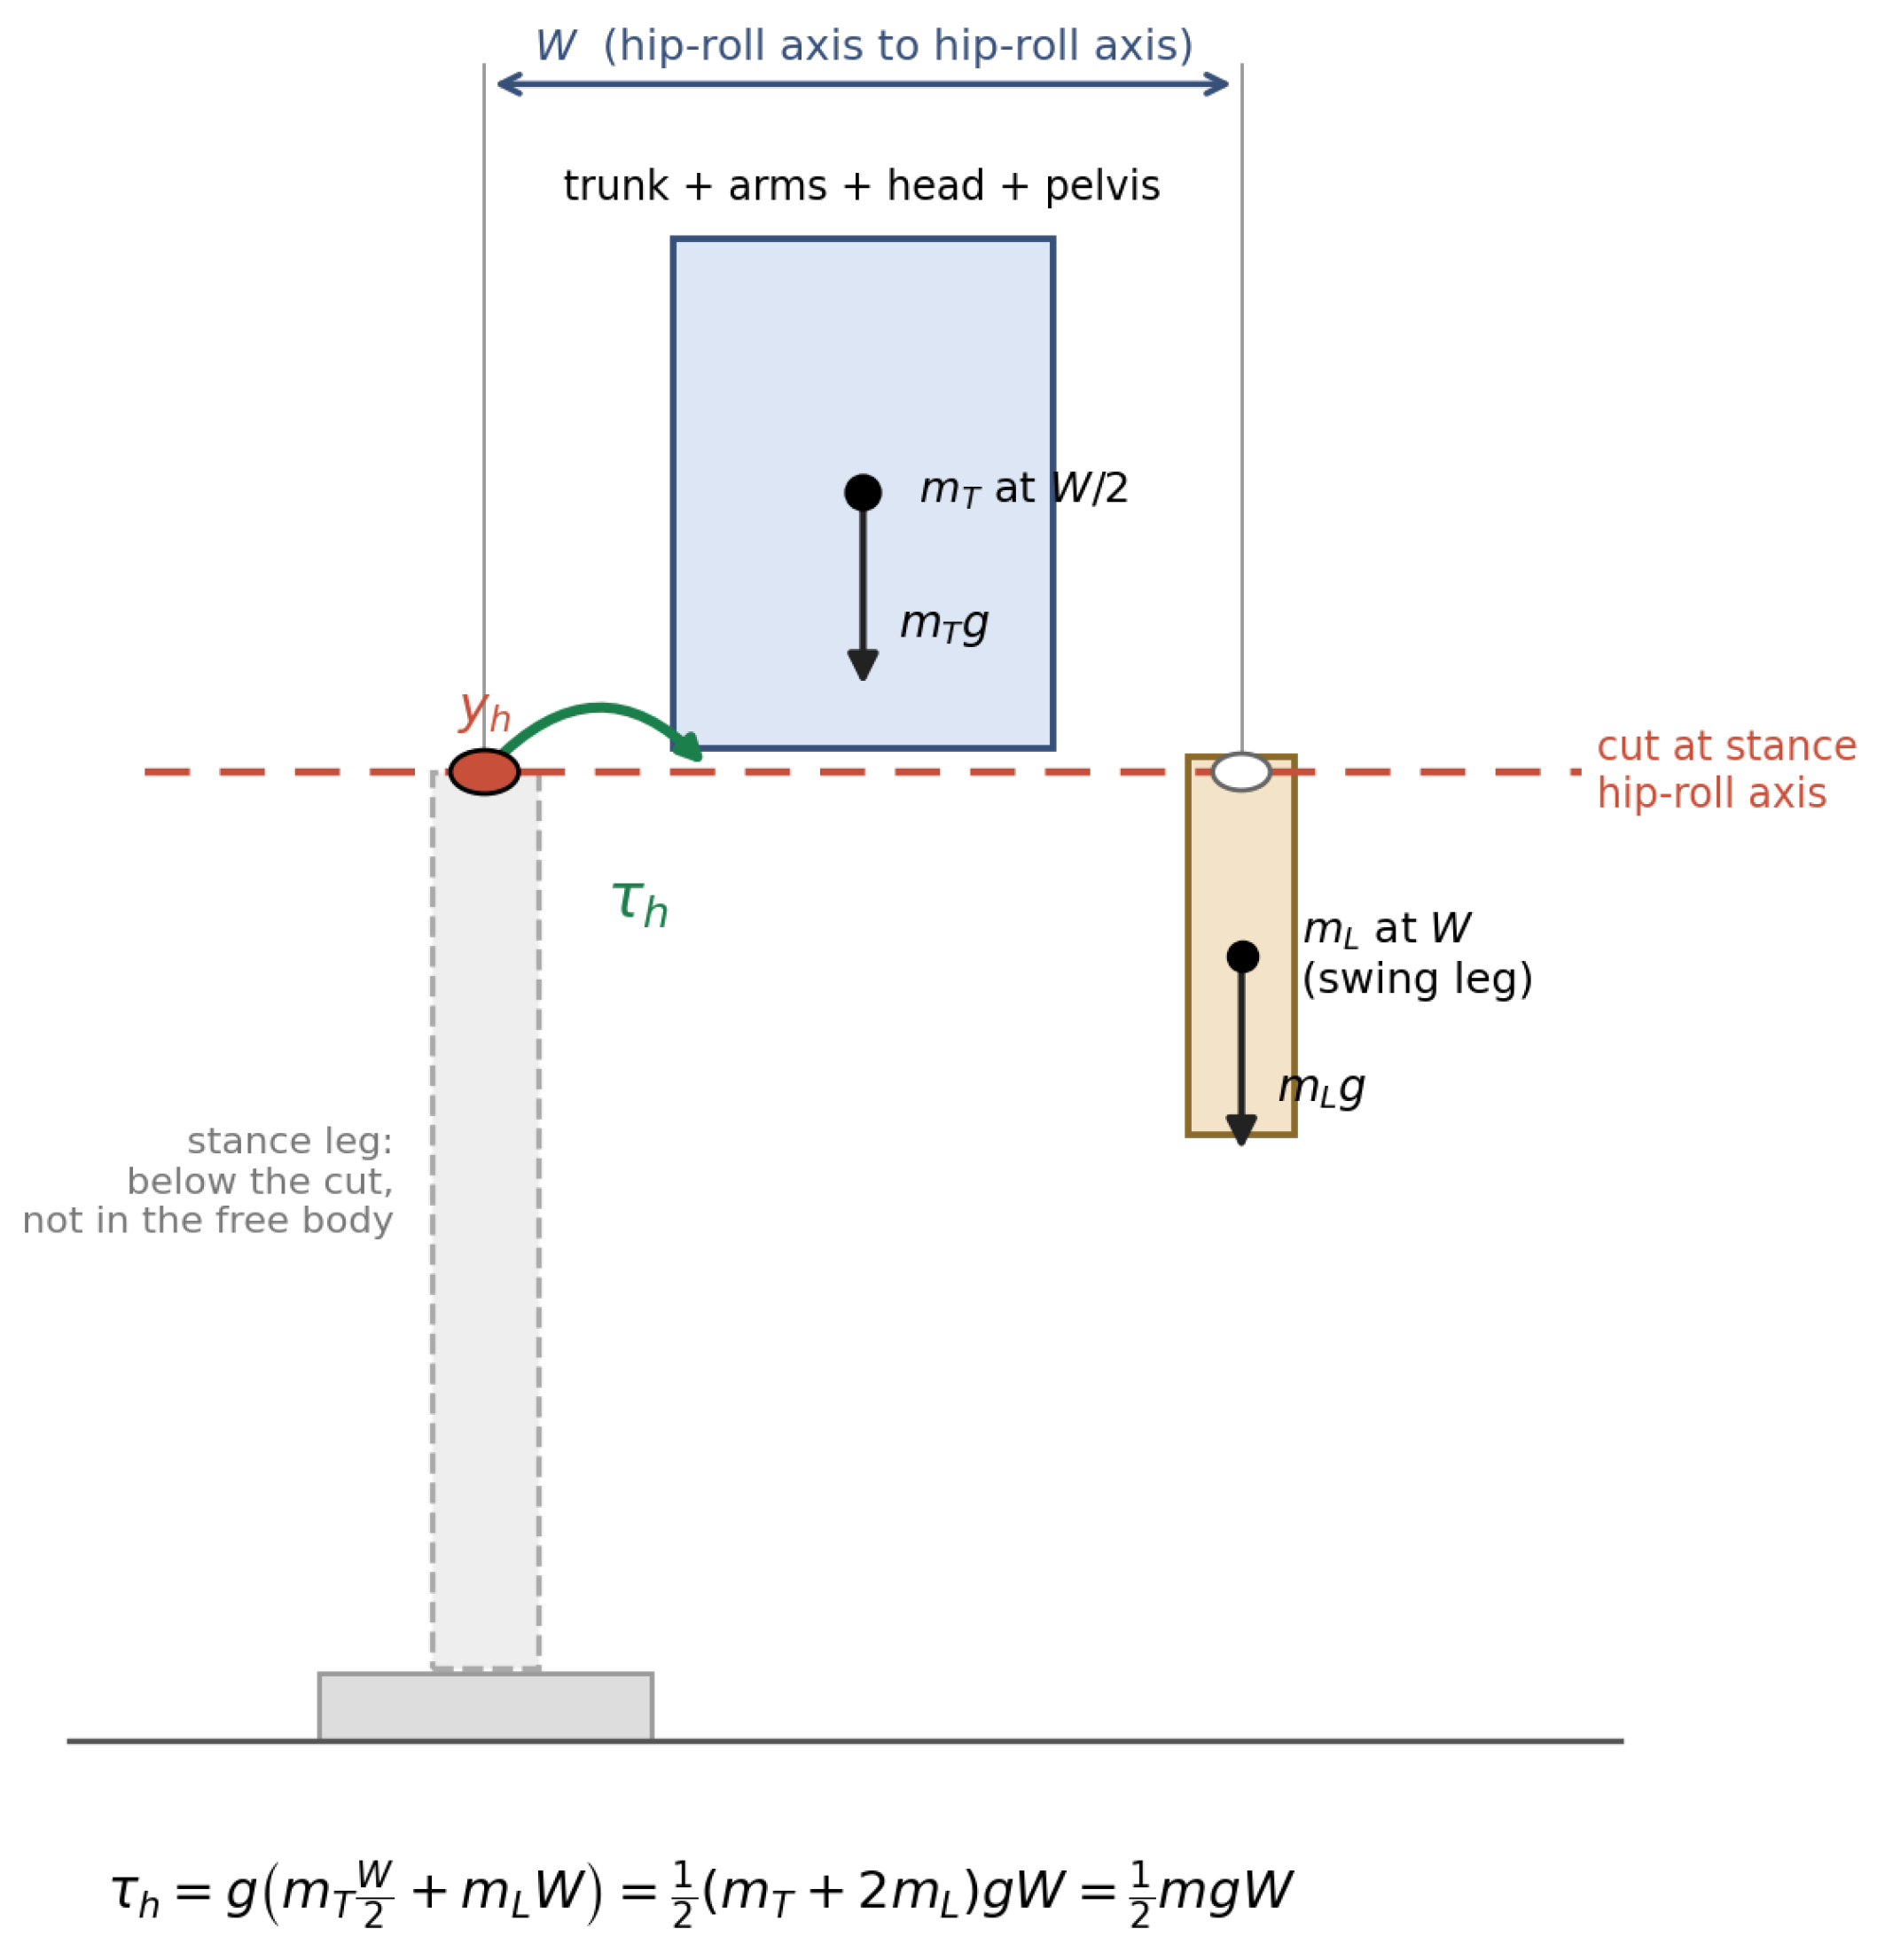
The hip-roll load is evaluated by cutting the robot at the stance hip-roll axis in quasi-static single support (see Figure 1). The free body above the cut includes the trunk assembly and swing leg. The stance leg below the axis does not contribute to this joint moment. If is the fraction of total mass m above the cut and its mass-weighted lateral offset from the axis, the moment is . Writing , where W is the separation between the hip-roll axes, gives:
Figure 1.
Reference free body above the stance hip-roll axis. The trunk assembly acts at and the swing leg at W; the stance leg is below the cut. This geometry gives .
For a symmetric robot without lateral trunk lean, let the trunk assembly (trunk, arms, head, and pelvis) have mass acting at from the stance axis. If each leg has mass , the swing-leg center of mass lies at W, and the stance leg lies wholly below the cut, then the following is observed:
Thus, and give for any trunk-to-leg mass split satisfying this geometry. Excluding the stance leg reduces , while the swing-leg offset increases by the compensating amount.
These conditions define the reference posture, not a maximum over the gait. With the trunk still centered but the swing-leg center of mass at , the following is observed:
An outboard swing leg therefore increases the moment. Arm and trunk motion can also alter it. A gait-wide bound would require a defined posture set and kinematic or CAD evaluation, which were unavailable for the retired platform. Section 6.4 instead varies the load factor.
Equation (1) excludes segment inertia, lateral ground-reaction forces, trunk angular momentum, and impact loads during kicking or support exchange. Lateral trunk lean can also reduce the moment. The calculation therefore concerns an identifiable quasi-static posture, not the worst case during play. Narrowing W reduces this reference load, but swing-foot clearance requires . No clearance study was performed: the deployed 17.9 cm stance is a demonstrated configuration, not a measured minimum.
3.2. Available Output and Separate Conditions
For actuators driving an external spur pair with ratio , the following is observed:
Here, is mesh efficiency, scales the combined actuator output to account for load sharing, is an assumed per-actuator output, and is no-load speed. The torque and speed expressions refer to different operating points. The manufacturer distinguishes stall torque from practical output and directs users to its performance graph [21]. The adopted comes from that graph; it is not a demonstrated continuous rating.
For a target capacity ratio SF and required joint rate , separate torque and no-load speed checks give:
The torque condition sets a lower bound on N, the speed condition an upper bound, and clearance a lower bound on W. Passing both actuator conditions does not establish simultaneous torque and speed capability: the speed in Equation (6) is available only at zero torque. Their outputs cannot be multiplied to calculate available mechanical power.
3.3. Loaded Characteristic and Power Bound
At fixed supply voltage, a linear DC-motor approximation gives , where is stall torque [21]. Requiring the demanded torque and speed to lie within this characteristic yields:
The quadratic admits a real ratio only if:
The right-hand side is the model’s maximum mechanical power, reached at half stall torque and half no-load speed. It contains no N: changing the external ratio cannot compensate for insufficient power. When Equation (8) holds, the roots of Equation (7) delimit the ratios allowed by the loaded characteristic. These must also satisfy Equation (5) when the separate capacity target is imposed.
The linear approximation describes motoring in the stated direction; it does not characterize braking, backdriving, or impacts. Its peak power is not a continuous rating. Service feasibility would additionally require:
where is the task’s demanded joint torque and is the allowable actuator output at the instantaneous speed, voltage V, winding temperature , and duty D. This magnitude form assumes the applicable motoring characteristic; other operating directions require their own characterization. Neither a complete allowable-output map nor task-level joint loads were measured on the retired robot. The bench tests characterize selected load and duration conditions for the actuator group, while the reference calculations remain necessary conditions for the stated posture.
3.4. Frontal-Plane Model and Rate Estimate
A linear inverted pendulum model (LIPM) [22] describes lateral center-of-mass sway with constant height, massless legs, and no trunk angular momentum. It is separate from the quasi-static free-body model. For this estimate, the lateral distance between successive support points is taken to equal the hip-axis separation W. With single-support duration and center-of-mass height , the support-exchange velocity and kinetic energy index are:
For the final generation, m and s give rad/s and m/s at cm. Approximating stance-leg inclination rate by gives:
This estimate assumes correspondence between leg inclination and hip-roll rate. It covers stance sway only, excludes lateral foot placement and recovery, and is not a bound on gait demand. Admissible ratios are therefore also evaluated over other required rates. Section 6.2 compares the generations’ frontal-plane model results.
4. Case Platform
Robinion Sr. is a 134 cm humanoid with 38 degrees of freedom that competed in the RoboCup Humanoid League AdultSize class between 2017 and 2019. Its final mass was 13.2 kg. The platform retained Dynamixel MX-series actuators across three mechanical configurations; the original subsystems are described in [19]. Table 1 places its actuator choice alongside other open humanoids. Robinion Sr. and NimbRo-OP2X are AdultSize; the igus and DARwIn-OP3 platforms are smaller.
Table 1.
Platform comparison. All listed actuators are manufactured by ROBOTIS Co., Ltd., Seoul, Republic of Korea. Mass includes battery. Costs are Robinion Sr.’s bill of materials and published figures for the other robots; so, they are not directly equivalent. PA12 = polyamide 12; N/A = not published.
Each leg has nine MX-106R actuators, paired at the roll and pitch axes and single at hip yaw. The knee has no actuator: a parallelogram linkage couples its motion to the hip-pitch and ankle-pitch joints. The omitted knee actuator and mounting hardware total 528 g per leg, or 1056 g for both legs (8.0% of final platform mass), from manufacturer data and CAD models prepared in Onshape. The analysis below concerns the paired hip-roll group.
Mechanical Revisions
Table 2 summarizes the three configurations and their first competition seasons.
Table 2.
Configurations and first competition seasons. Ratios are external spur pairs; axis assignments follow the build record and CAD.
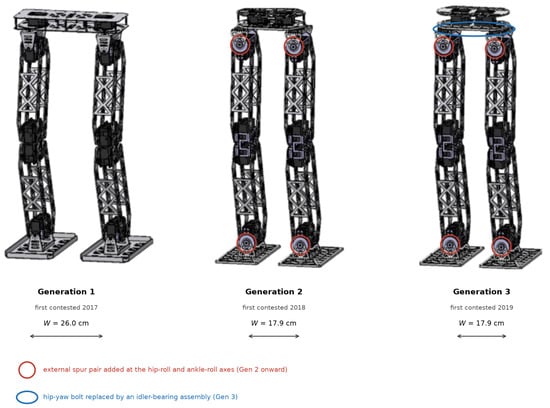
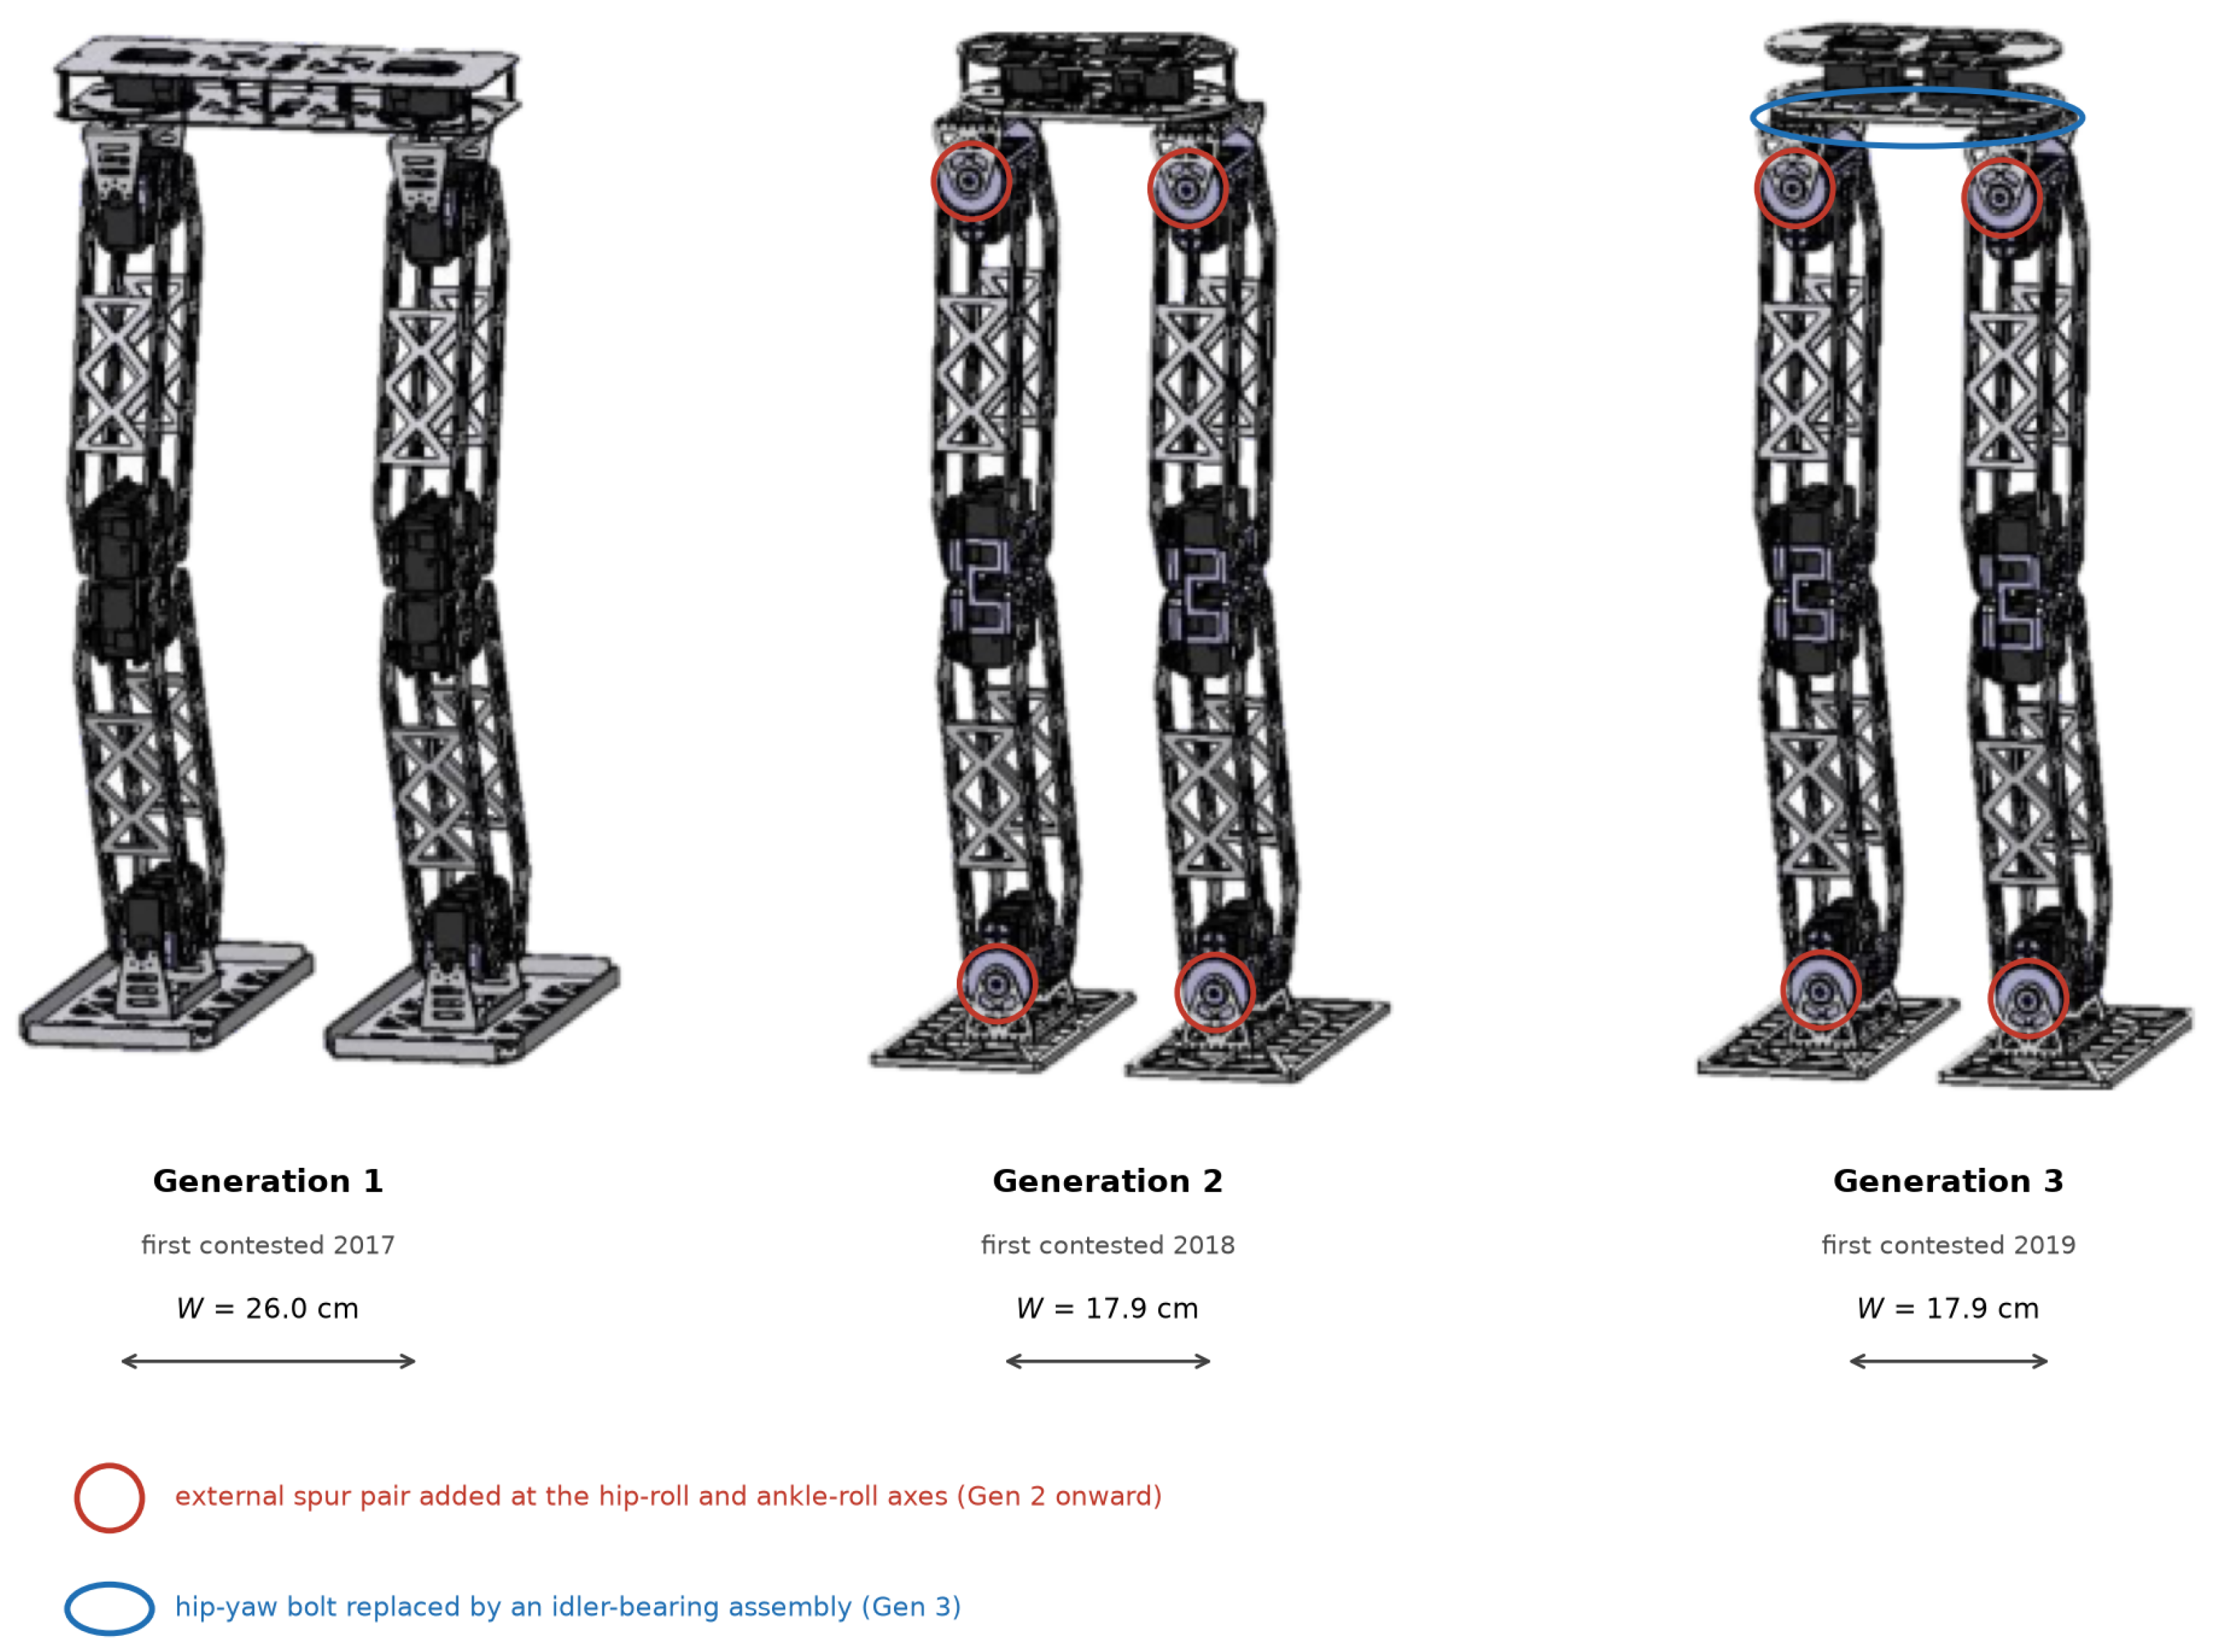
Generation 1 used direct-mounted joints and a 26.0 cm stance, with a total mass of 12.1 kg. Generation 2 added flanged bearings and per-axis external gearing while narrowing the stance to 17.9 cm. Figure 2 locates the changes across the three generations. Gearing and stance narrowing were introduced together; so, the deployed configurations do not isolate their individual effects. Section 6.1 separates those effects analytically.
Figure 2.
Three generations with stance widths and seasons. Circles identify the added roll-axis gearing and hip-yaw idler bearing. CAD views were rendered for this paper; annotations were added here.
Table 3 lists the installed gearing and the nominal outputs calculated from Equation (4). Roll axes received the largest reduction to support the quasi-static lateral moment; pitch axes used a smaller ratio to preserve swing and kicking rate, and hip yaw used the smallest. These ratios were chosen from available tooth counts during development. The torque and no-load speed columns describe different operating points; so, their values are not available simultaneously. The loaded-speed analysis in Section 6.3 and measurements in Section 6.5 examine the speed available under load.
Table 3.
Installed gear allocation and nominal outputs from Equation (4).
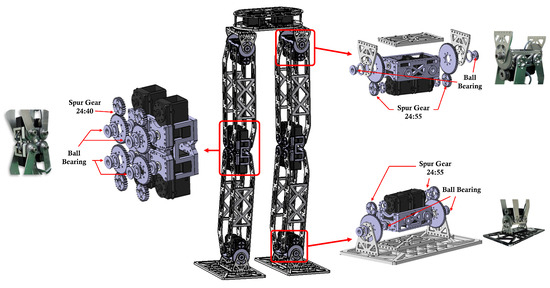
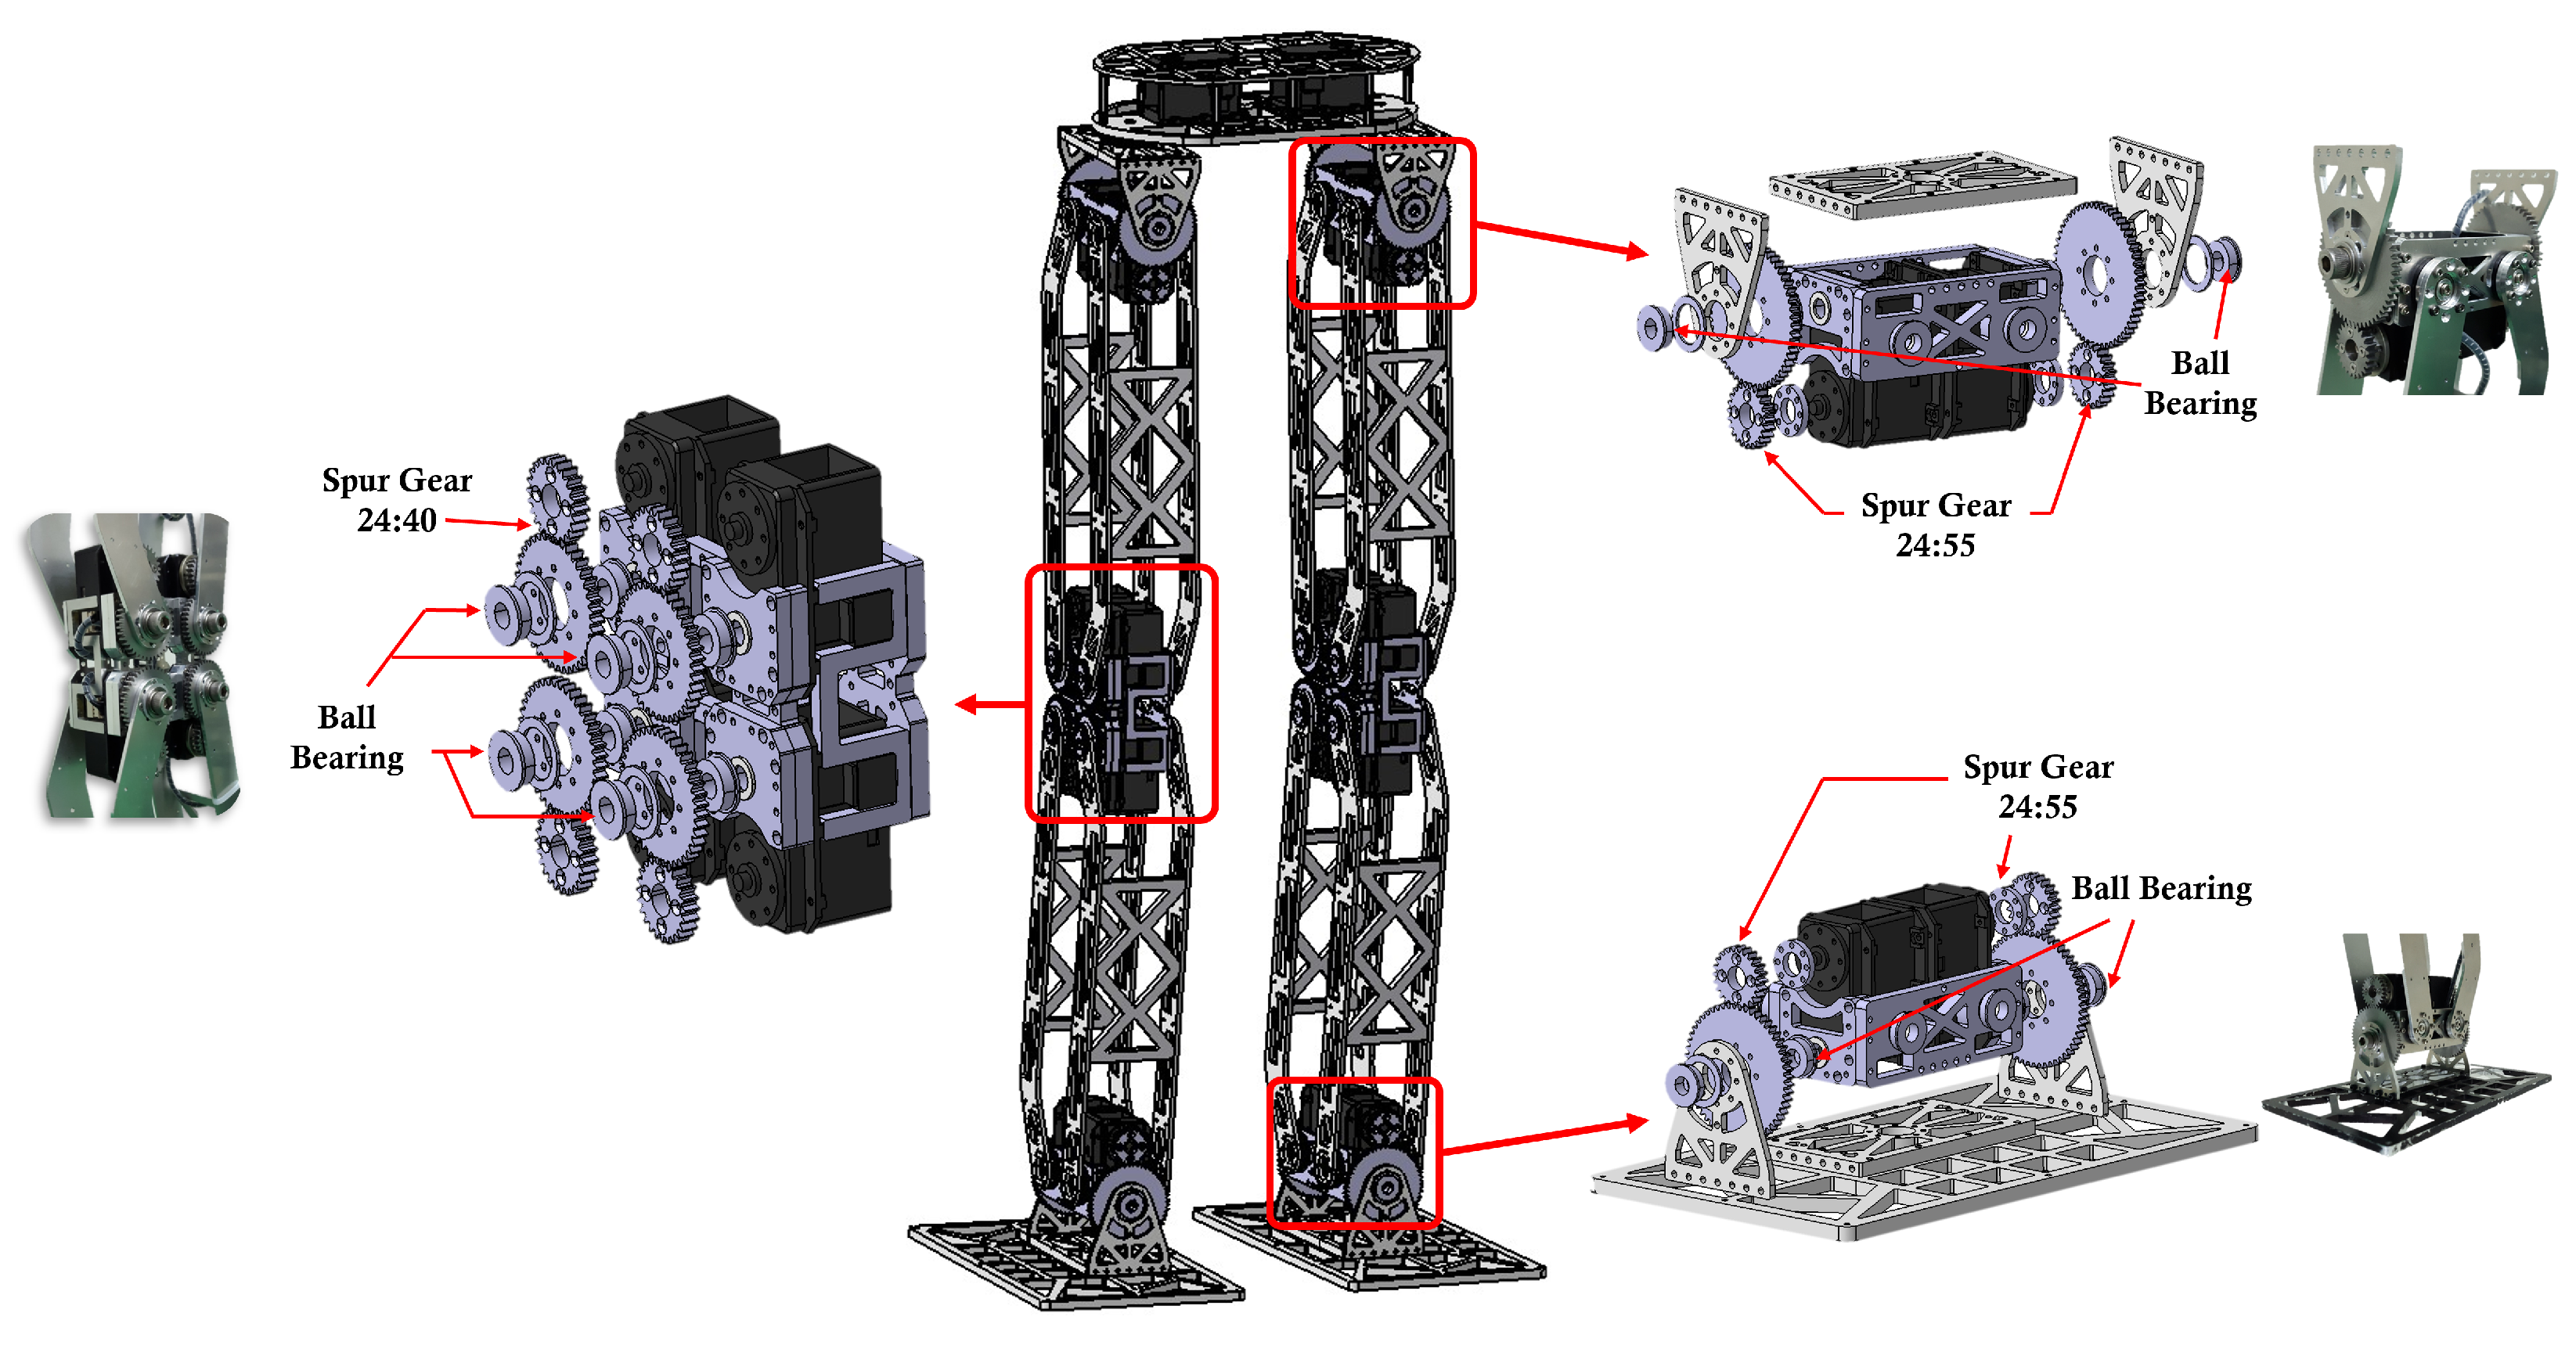
The expanded assemblies in Figure 3 show how the reduction ratios were distributed across the leg. The earlier report [19] incorrectly assigns 24:36 to the knee and 24:40 to hip yaw. The build record, CAD, and that report’s figures show the assignments used here. The knee is unactuated; the pitch reductions in Table 3 belong to the hip and ankle joints. The hip-roll assembly at the upper right is the actuator group used in the capacity calculation: two actuators driving through a 24:55 external gear pair. The separate bench uses different actuator units of the same model with this gear ratio to measure loaded speed and holding duration.
Figure 3.
Second-generation leg with expanded hip-roll (upper right), pitch (left), and ankle-roll (lower right) assemblies. CAD views were rendered for this paper; the author’s photographs are previously unpublished.
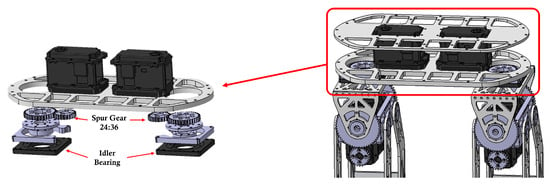
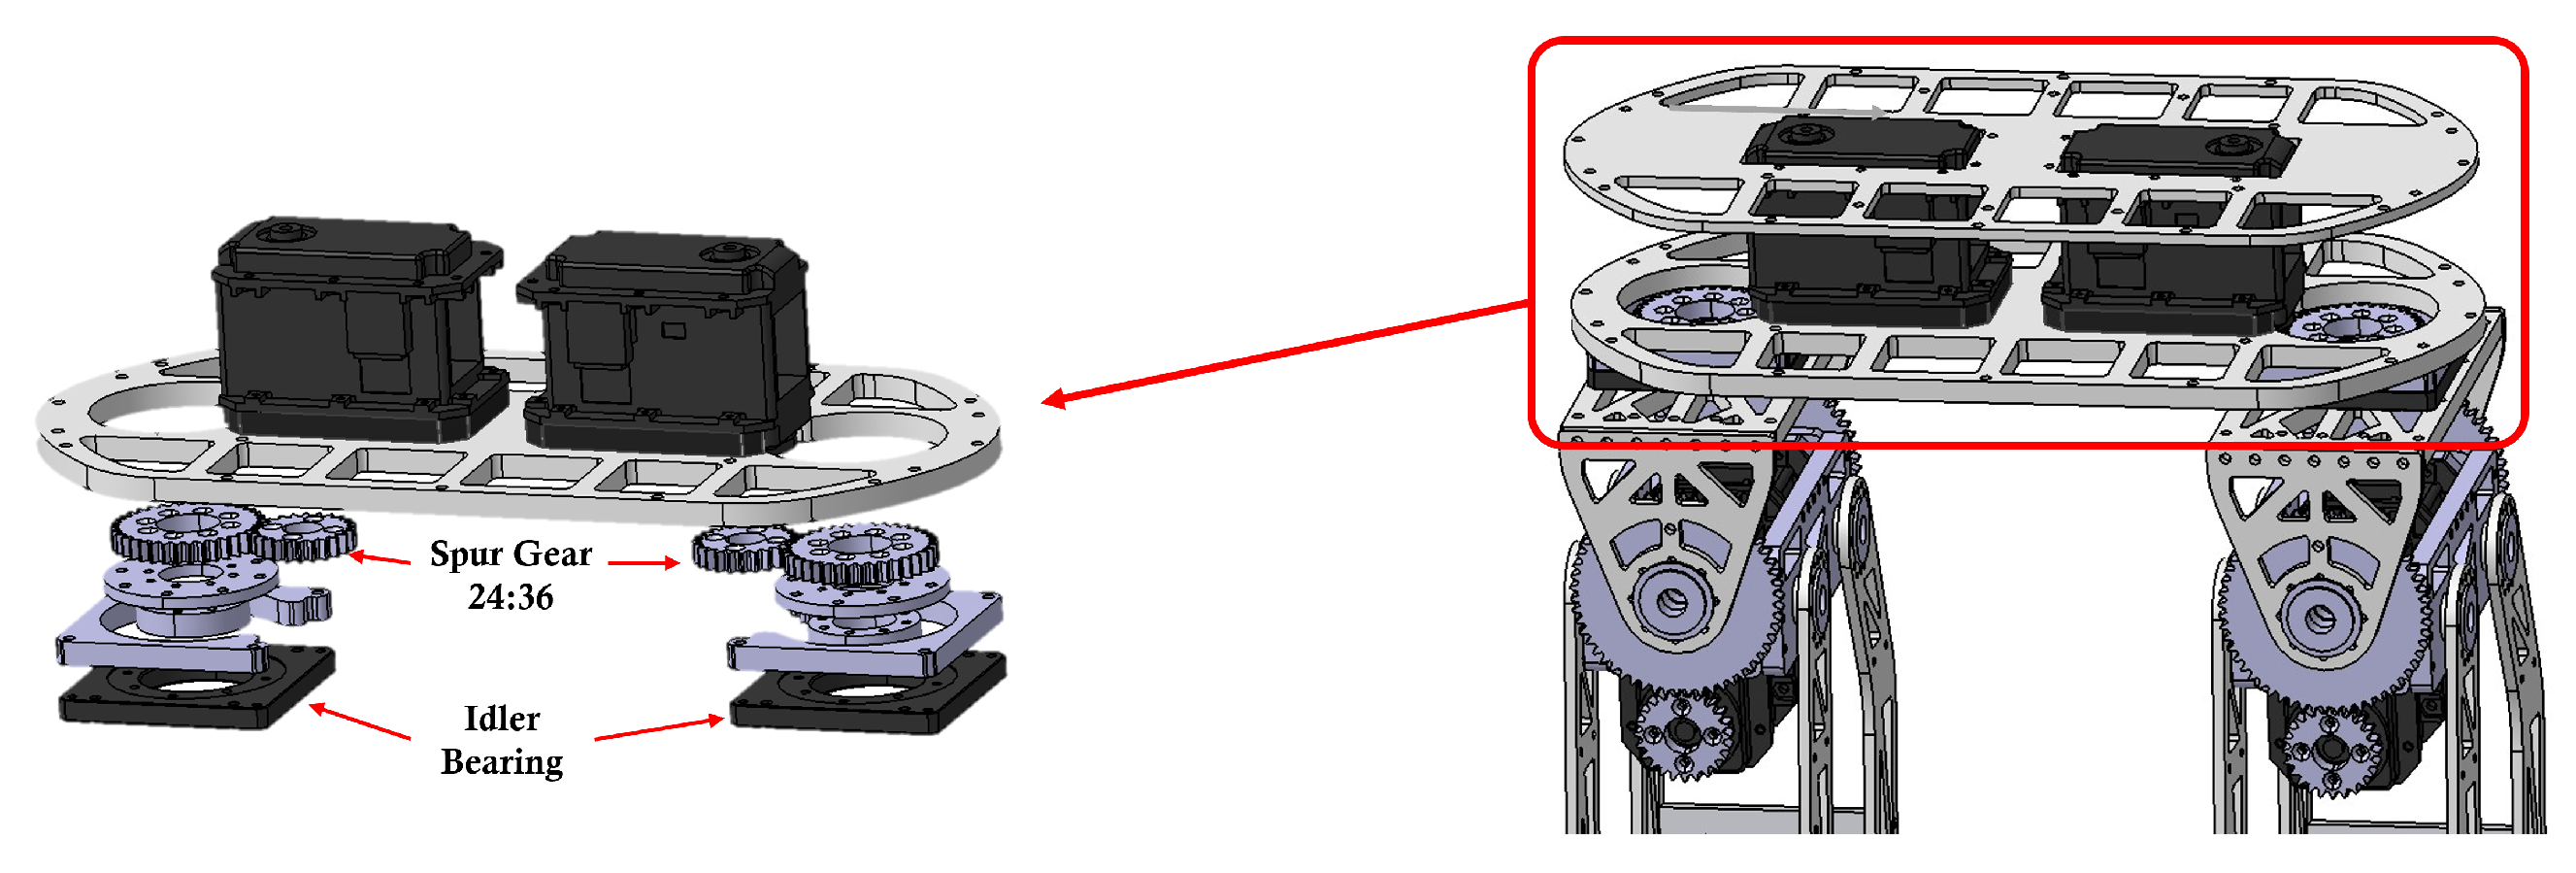
Generation 3 replaced the hip-yaw M8 bolt with an idler-bearing assembly after gear dead space and bolt deflection were observed. Figure 4 shows the assembly. The conference version incorrectly states that Generation 2 first competed in 2019 and sustained a 30-min match. It first competed in 2018; AdultSize matches comprise two ten-minute halves. These values are corrected here. The idler bearing supports axial and radial loads at hip yaw; the 24:36 spur pair is unchanged. This change concerns hip-yaw support and does not increase the modeled hip-roll torque output. The stance and hip-roll ratio were unchanged from Generation 2, while total mass increased from 12.8 to 13.2 kg. Under the nominal actuator assumptions, the greater total mass raises the reference moment and reduces the hip-roll capacity ratio (Section 6.1).
Figure 4.
Third-generation hip-yaw assembly with the 24:36 spur pair and idler bearing; the installed assembly is boxed at right. Rendered for this paper from the platform’s CAD model.
The present equations analyze these choices retrospectively, separating geometric and transmission effects while retaining each generation’s measured mass.
5. Methods
The deployed robot was retired after the 2019 season. Its analysis therefore uses recorded dimensions, inspection measurements, manufacturer specifications, and reconstructed failure counts. The new bench measurements concern a separate actuator assembly with the same actuator model and external gearing. Table 4 identifies the inputs to the platform calculations; fitted bench parameters are reported separately.
Table 4.
Inputs to the platform analysis and their sources. Assumed values are varied in the sensitivity analysis; bench estimates do not replace these nominal inputs.
5.1. Sensitivity
The capacity ratio was recalculated over –1.00, –5.4 N·m, –1.00, and –1.10. These ranges test departures from the nominal assumptions rather than representing measured distributions. Critical values were also calculated by setting the capacity ratio equal to the target. The conditional estimate of from the bench current split is considered separately in Section 6.6.
5.2. Failure Record and Statistics
The author and Jaesik Jeong, a co-author of the preceding conference paper, reconstructed incidents by season and joint from memory. No contemporaneous maintenance log was available, and incidents could not be assigned to individual matches. Match exposure was obtained from the league’s published results [23,24,25]: 5 main and 0 Drop-In matches in 2017, 4 and 5 in 2018, and 6 and 6 in 2019. Technical Challenges and practice sessions were excluded from both counts; no failures in those activities were recalled. An incident denotes loss of an intended joint constraint without withdrawal of the robot from the tournament.
Seasonal counts were divided by match exposure. Exact Garwood Poisson 95% confidence intervals describe sampling uncertainty conditional on the recalled counts; they do not account for recall error. The 2017-to-2019 rate ratio was calculated with log-Wald and exact conditional-binomial intervals. A main-tournament-only analysis examines the changing composition of exposure. Joint-level counts and an exploratory comparison of hip-yaw incidents are reported in Section 6.7.
5.3. Bench Measurement of the Actuator Group
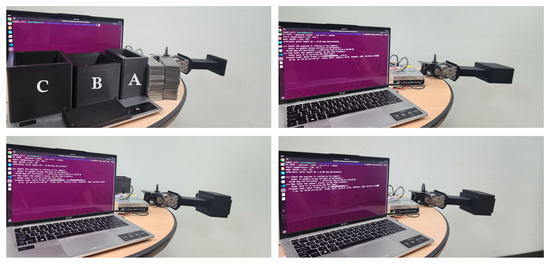
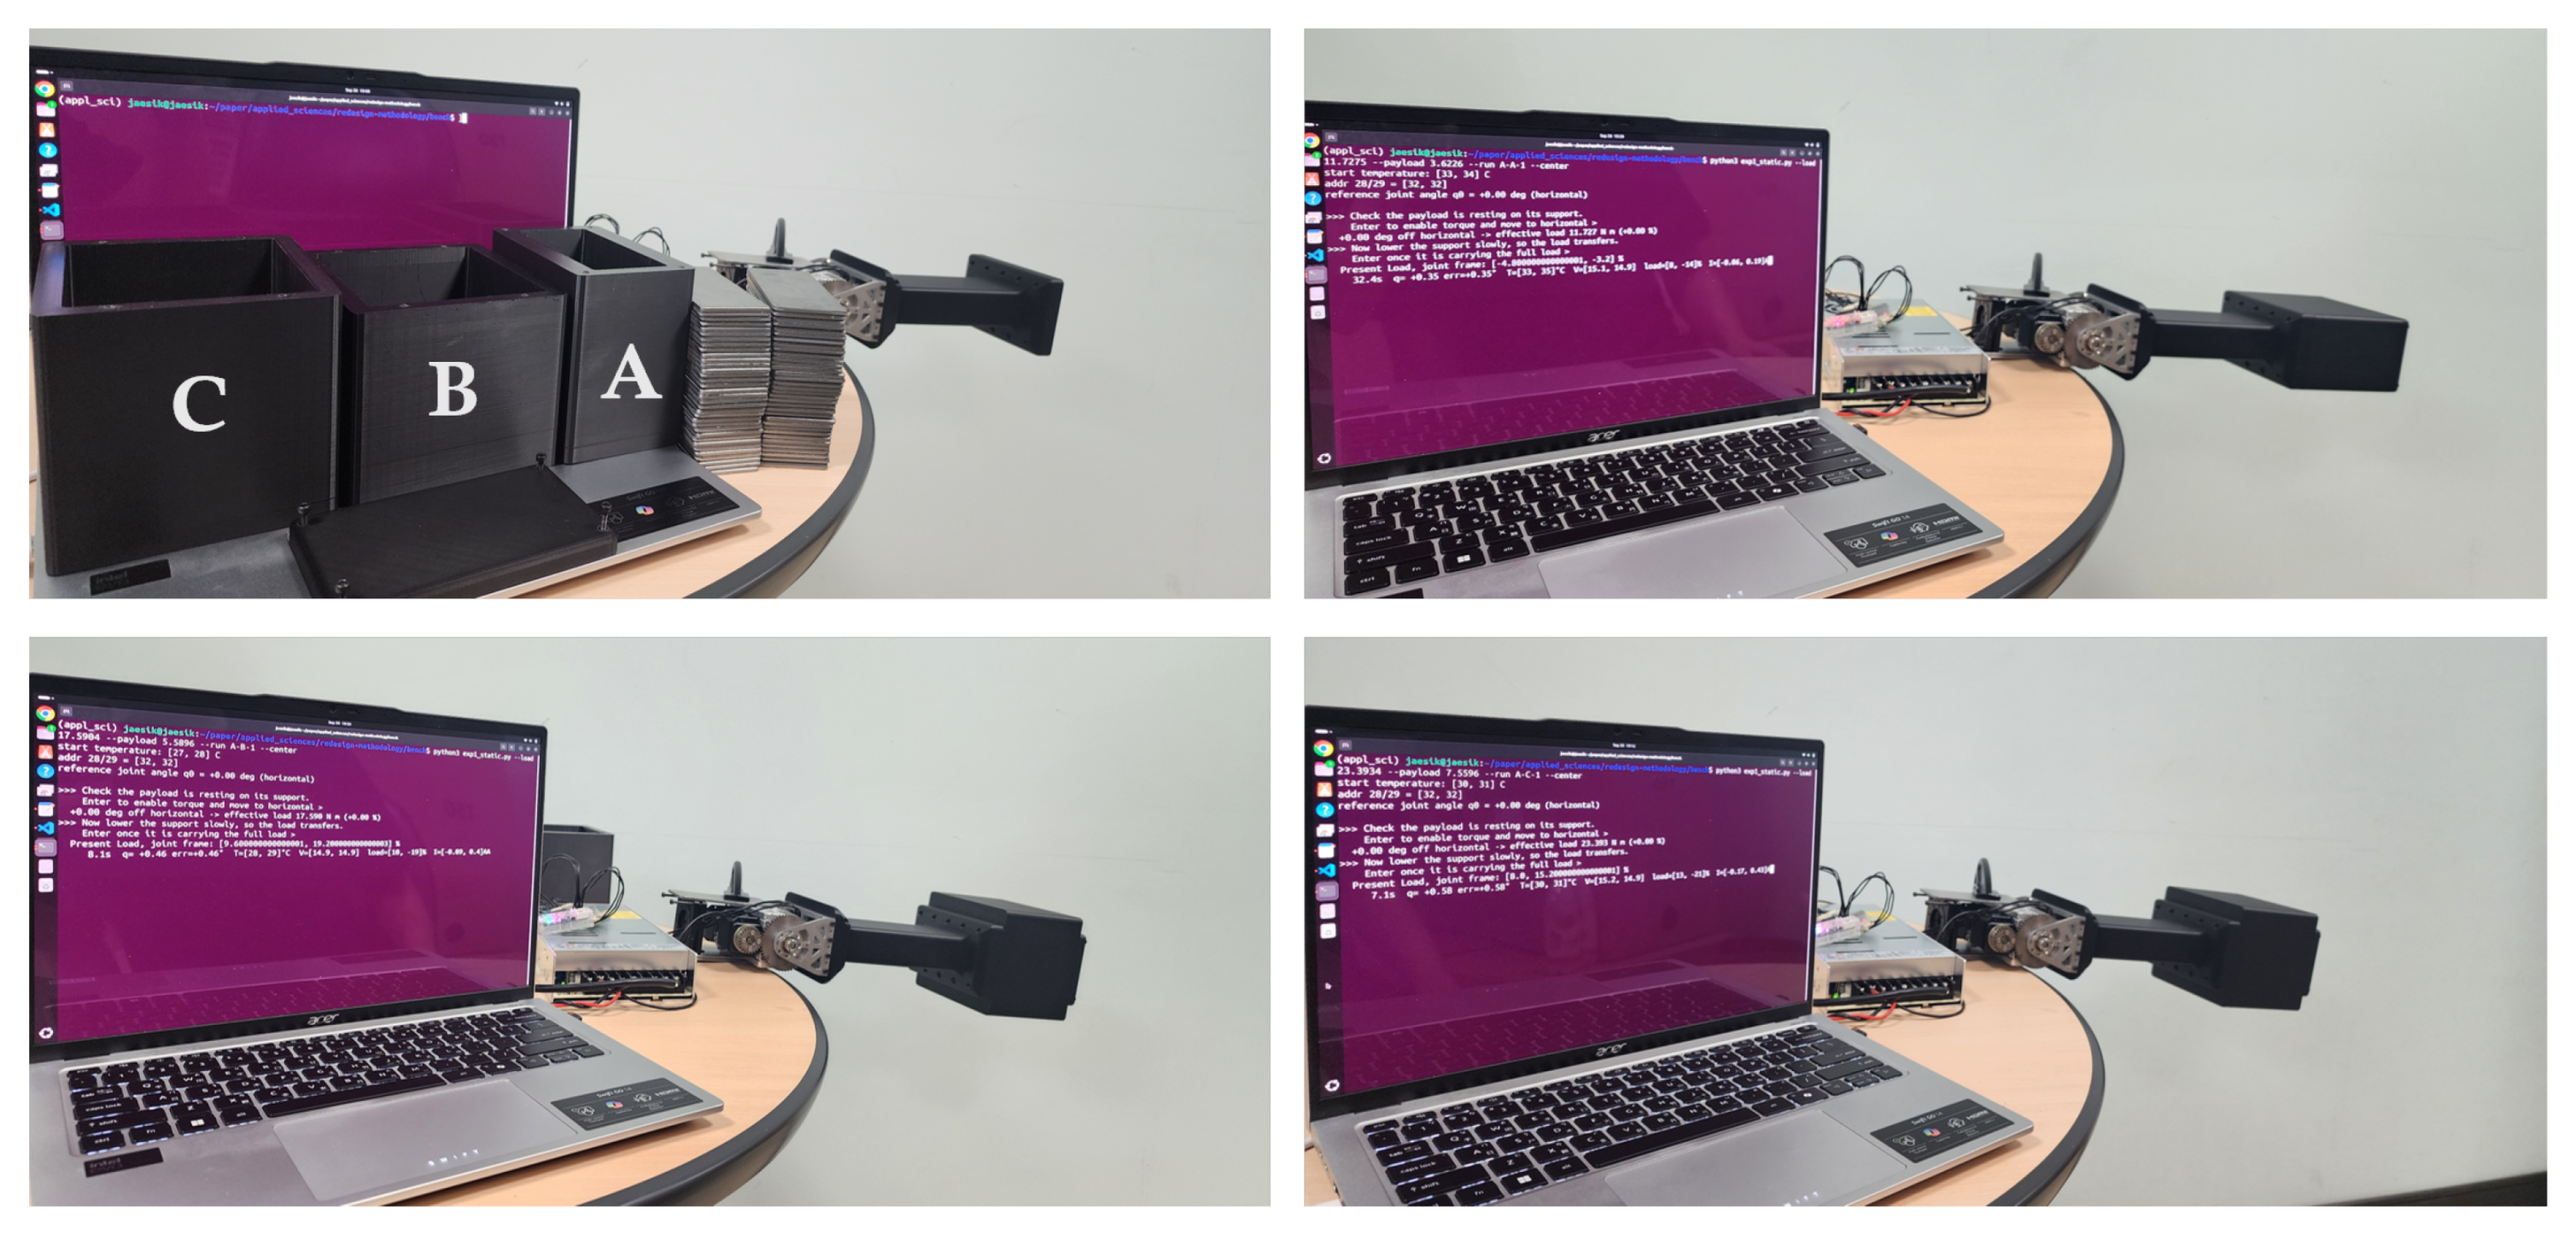
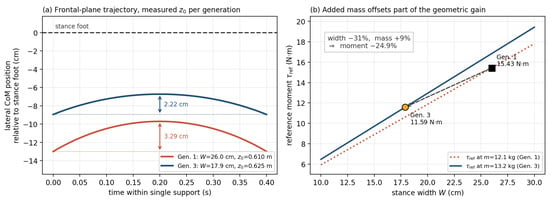
A separate bench measured loaded speed and sustained holding with the actuator model and external gearing used at the deployed hip-roll axis (see Figure 5). Two Dynamixel MX-106 actuators drive a common shaft through . The shaft carries a lever with a 300 mm axis-to-load distance and interchangeable weight boxes. The units are not those of the retired platform. A 600 W switched-mode supply was set to 14.8 V and checked at the actuator terminals, which read 14.7–14.9 V unloaded. Commands use a 1 Mbps bus, with one synchronized write for both actuators and one bulk read per record.
Figure 5.
Hip-roll bench and loads. (Top left): boxes C, B and A, weights and lever; other panels: loaded configurations A (top right), B (bottom left) and C (bottom right). Photographed terminal screens are incidental; the load values are given in Table 5.
Table 5 gives the four loads. Payloads were weighed in bulk; the equivalent mass of each lever–box configuration was measured with the lever detached from the drive. The applied moment is , with m. Detachment matters because the mounted gear train has a single-direction static resisting torque of 0.61 N·m, determined from the difference between mounted and detached balance readings. This is not a measurement of running friction or bidirectional hysteresis.
Table 5.
Load configurations at m. includes the lever and box; is the weighed payload. SF is relative to the 11.59 N·m reference moment.
Control settings and record history: The actuators use position control under Protocol 1.0. Both report model number 320 and firmware revision 41, whose control table names addresses 26–28 D, I and P gains [21]. Table S1 gives the readback after all testing. The manufacturer-default values 0, 0 and 32 identify the PID settings; address 29 is undocumented for this model and returning the same value as address 28 does not establish compliance control. In a preliminary sweep, address 28 set to 8 yielded only 0.231 and 0.003 rad/s in two attempts to track 0.374 rad/s at 11.73 N·m. Values from 16 upward tracked the command with decreasing static droop, consistent with increasing proportional gain rather than compliance slope.
Only the three SF holds explicitly wrote 32 to addresses 28 and 29 and recorded that value in a log column. Earlier runs predate the column and contain no gain record; no script writes addresses 26 or 27. Torque limit 1023 was configured for all reported runs and goal acceleration (address 73) to 254 for maximum-speed runs. Those two settings are documented by the configuration and command line, not by the logs. Before changing addresses 28 and 29, the script reads their existing values and restores them afterward; restored values appear on the console but are not logged.
The 28 September readback is consistent with the state immediately before the last run that changed these registers, on 27 September, provided no reconfiguration occurred afterward. Under that condition, P was already 32 before the final run. Equal gains across all tests are therefore plausible but not established: the restore values, absence of other intervening changes and complete gain history lack contemporaneous records. This qualification remains part of the comparison between loads.
Protocols: Maximum-speed traverses lift the load through the horizontal position, with three repetitions per load. Speed is evaluated over , limiting gravitational-load variation to 1.0%. This angular window does not itself establish zero acceleration; Table S3 reports the logged window conditions. Early downhill trials regenerated into the switched-mode supply, which cannot sink current, and bus voltage reached 24.1 V, above the actuator’s 16.0 V limit. Those trials were discarded and are distinct from the empty-lever sweeps used below.
For sustained holding, each loaded configuration was commanded to horizontal three times. Criteria fixed on 19 September 2026, before valid testing, were 600 s duration, a 1.0° angle tolerance with a 0.5 s dwell before an angle abort, termination when either actuator reported 70 °C, and a start-temperature ceiling of 40 °C. Actual initial temperatures were 25–35 °C. Tests were in still laboratory air; ambient temperature was not recorded.
A constant-rate control followed a trapezoidal profile at the derived 0.374 rad/s rate, with a 2.60 s constant phase and three repetitions per loaded configuration. The middle 60% of that phase was evaluated against a speed tolerance and a first-half-to-second-half uniformity tolerance. Both the separate necessary conditions and the loaded characteristic predict attainment of this rate; so, the control tests the apparatus rather than discriminating between the descriptions.
Measurement: Position, load, current, voltage and internal device temperature were read from both units in one bulk transaction per record. Logging rates were 50 Hz for holds, 500 Hz for constant-rate traverses and approximately 1000 Hz for maximum-speed runs. The latter logged 2000 records in each 2.0 s repetition at a median interval of 1.000 ms; sample counts in Table S3 refer to records carrying both units, not separate actuator readings. Tabulated speeds are least-squares slopes of encoder position against logged timestamps, without assuming a fixed sampling interval.
Temperature is the actuator’s address-43 internal-device value [21]; no external surface sensor was fitted. One encoder count is at the actuator and at the joint. The manufacturer’s speed-register-to-rpm conversion did not match these units. Commanding a series of register values on the empty lever and regressing achieved encoder speed against command gave 0.1258 rpm per count. This factor interprets register commands only and enters none of the reported encoder-derived results.
No-load estimate: Three maximum-speed empty-lever sweeps in each direction were evaluated over the central 60% of each traverse. Their mean gives:
This estimates the drive train, including external mesh and bearing friction, rather than the motor alone. Averaging is intended to cancel the lever’s gravitational contribution, which assists one direction and opposes the other. Table S2 lists all three determinations: the torque-limit-800 result is excluded, the second value of 5.999 rad/s is adopted, and the post-test repeat differs by 0.07%. That agreement establishes the stability of this speed index only; no other measure of actuator health was compared before and after testing.
The directional difference of 4.1–5.6% reveals the asymmetry that averaging addresses but does not bound bias in the mean. A common effect, such as voltage away from nominal, could shift both directions together. The estimate assumes negligible common bias and small residual directional friction; neither is independently verified, and bus voltage was not logged during these sweeps. They carried only the empty lever and do not include the discarded loaded downhill trials.
Uncertainty and scope: Instrument terms, repeatability and motion variation are reported separately. Encoder quantization contributes below 0.03% to fitted speed over the 107–206 ms windows, and timestamp jitter below 0.1%. Between-run SD is 0.12–1.2% of the mean; residual speed variation across a window is 0.30–3.21% (Table S3). The latter describes the motion and is not combined with instrument terms or repeatability.
The equivalent lever mass carries the same absolute uncertainty at every load, whereas payload mass increases. Combining tolerance half-widths of g for equivalent lever mass, g for payload and mm for the 300 mm radius in quadrature gives approximate moment variations of for the empty lever and , and for the loaded conditions. Thus, an approximate figure applies only to the loaded cases. These are neither standard uncertainties nor guaranteed bounds and carry no coverage factor. It is assumed that independent rectangular distributions would convert each half-width a to before combination, scaling the figures by . A formal distribution-based evaluation was not made; repeatability and window variation are larger than the stated instrumental contributions to speed.
The bench reproduces neither ground reaction nor support exchange, trunk motion or task duty. It samples group capability at the tested conditions and does not establish the task-level service condition of Equation (9).
6. Results
6.1. Gearing and Stance Narrowing
Table 6 compares the deployed hip-roll configurations with assumed cases in which each intervention is applied alone. The first-generation capacity ratio is 0.70. Gearing alone raises it to 1.44–1.52, depending on the assumed mass, and stance narrowing alone raises it to 1.02. Together they give 2.09 for Generation 2 and 2.03 for Generation 3. Only the combined changes reach the target of two under the nominal inputs.
Only total platform masses were recorded. The gearing-only case is therefore calculated both without added mass and with the full 0.7 kg increase between Generations 1 and 2; treating stance narrowing as mass-neutral is an assumption. These comparisons isolate modeled contributions rather than experimentally measured effects of individual modifications.
For the first and final generations, the relative increase is:
The common assumptions for , , and cancel. This cancellation requires the same effective output, sharing, and reference geometry in both configurations. Mesh efficiency does not cancel because only the later configuration has the external mesh: the relative gain is 2.44 at and 3.05 at . The mass ratio reduces the combined geometric and gearing benefit by 8.3%.
Solving the torque condition for stance width gives:
For the ungeared first generation, is 18.2 cm at unity capacity and 9.1 cm at a target of two. Narrowing alone could therefore exceed unity at the later 17.9 cm stance, but reaching two would require a stance 49% narrower than any used on the platform. No clearance limit was established; so, this comparison does not prove that such a stance is infeasible.
The installed ratios also differ by axis (Table 3). Using the 24:36 yaw ratio at the roll axes would lower the final hip-roll capacity ratio to 1.33. Applying the 24:55 roll ratio to the pitch axes would lower their no-load speed from 3.46 to 2.51 rad/s; whether that speed would suffice was not evaluated.
6.2. Frontal-Plane Consequences
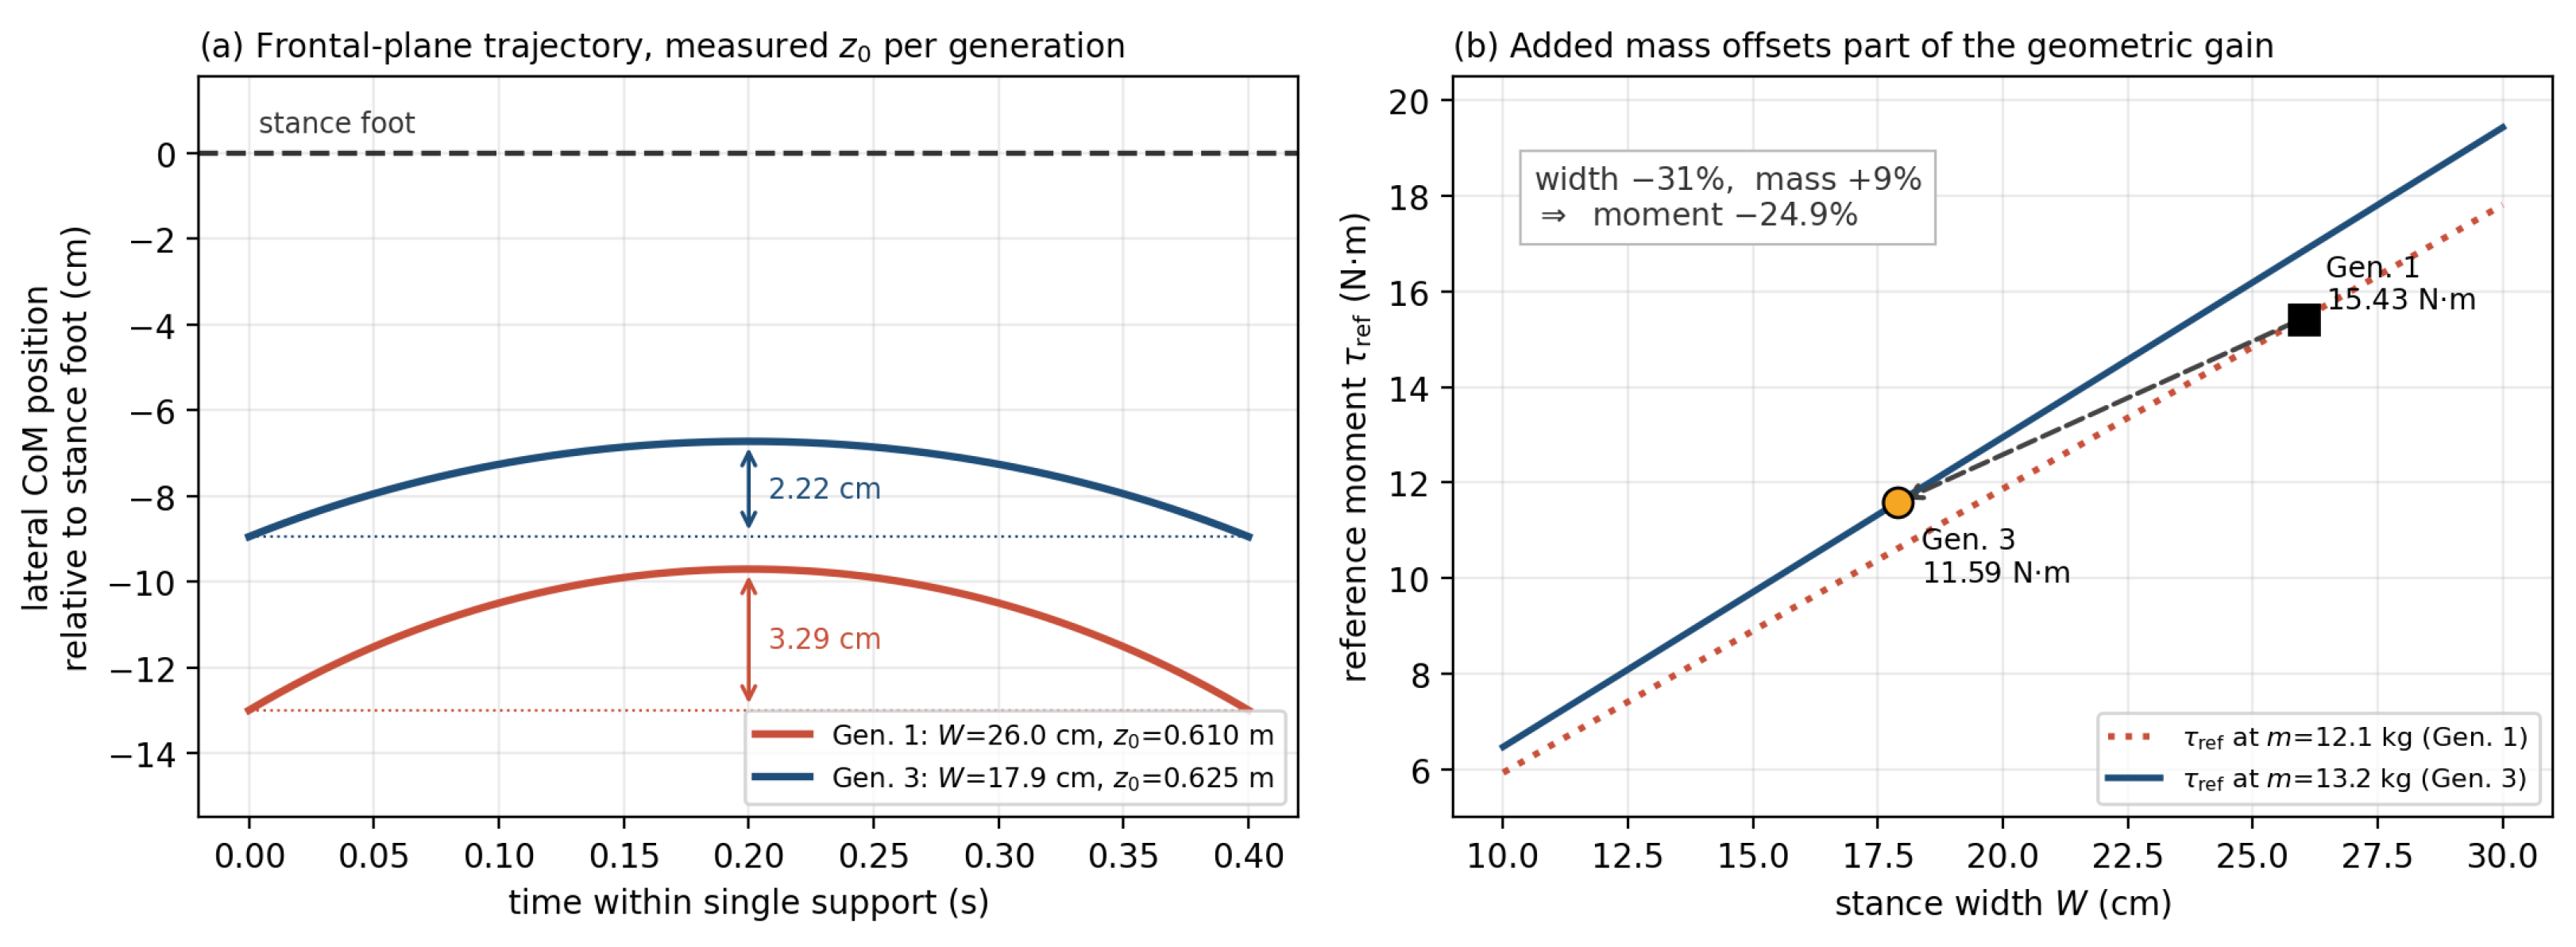
Table 7 and Figure 6 compare the first and final generations using their inspection measurements: kg and m in Generation 1, and kg and m in Generation 3. The 31% stance reduction and 9% mass increase produce a net reference-moment reduction of 24.9%, from 15.43 to 11.59 N·m. The recorded total masses do not identify which parts contributed the increase.
Table 7.
Frontal-plane measures using each generation’s measured mass and center-of-mass height. E is kinetic energy at support exchange, not measured energy consumed per step.
Figure 6.
Frontal-plane model results. (a) Lateral center-of-mass trajectory relative to the stance foot during single support. (b) Reference moment versus stance width at each generation’s measured mass.
At fixed mass and center-of-mass height, moment, sway amplitude, and exchange velocity are linear in W, while E is quadratic. A 31% narrowing would therefore reduce the first three by 31% and the energy index by 53%. Across the actual generations, changes in mass and height give reductions of 24.9%, 32.5%, 32.5%, and 50.4%, respectively. The minimum center-of-mass-to-foot lateral distance decreases from 9.7 to 6.7 cm. These are reduced-order model results: E is kinetic energy at support exchange, not measured collision loss or electrical consumption, and the calculations do not establish improved dynamic stability.
6.3. Torque and Loaded-Speed Constraints
At the final stance, SF , , and , the specification-based linear characteristic gives a maximum group power of 27.4 W against a demand of W. Equation (8) therefore requires:
The loaded-speed limit at the installed also rounds to 1.18 rad/s. It is 3.1 times the stance-sway estimate of Equation (11); the no-load bound of 2.51 rad/s would suggest a larger factor of 6.7. Rate is consequently not the binding condition for this reference calculation. That conclusion does not extend to unmeasured foot-placement or recovery motions.
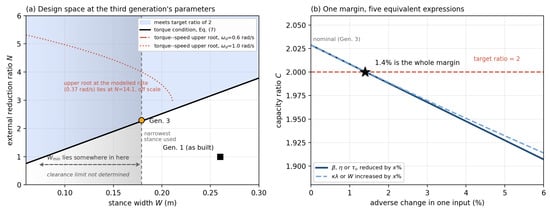
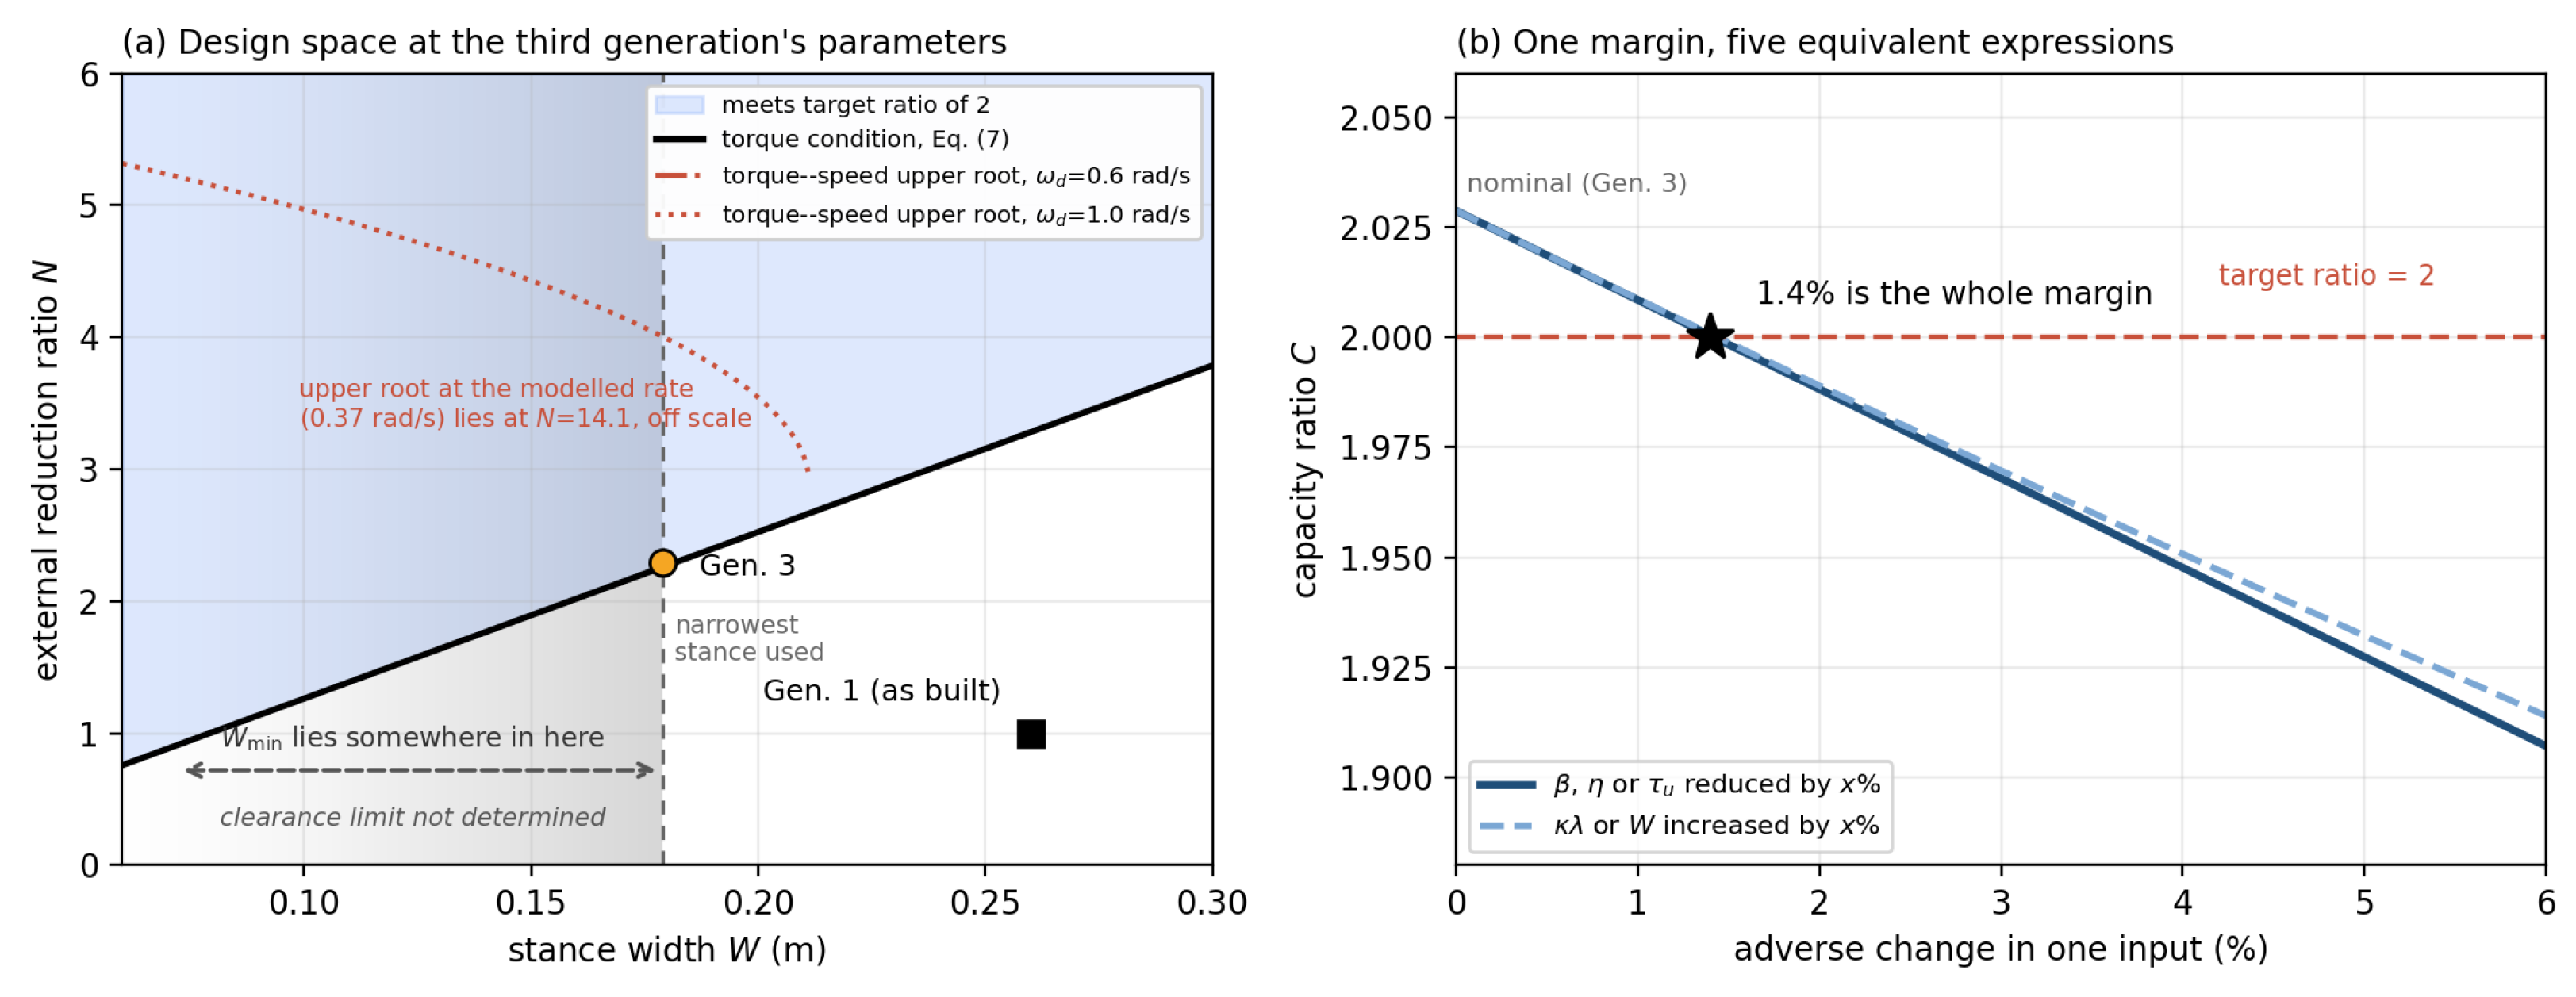
Figure 7 shows the design constraints and sensitivity. At the stance-sway rate, the loaded characteristic allows , while the torque target requires . Their intersection is . The installed ratio 2.292 lies close to the lower edge. The clearance limit remains undetermined; so, the figure does not define a fully verified design region.
Figure 7.
Analytical design constraints. (a) Stance width and reduction ratio; the fading region indicates an undetermined clearance limit, and 17.9 cm is the narrowest deployed stance. (b) Capacity ratio sensitivity to multiplicative input changes.
With hip-roll geometry unchanged, the 0.4 kg mass increase from Generations 2 to 3 reduced the target margin from 4.61% to 1.44%. Under the model, torque capacity is the limiting condition for the final configuration. Later additions to the platform can therefore consume a small margin even when the joint assembly itself is unchanged.
6.4. Sensitivity to Assumed Inputs
The capacity ratio is:
Table 8 summarizes the varied-input cases. The nominal final ratio of 2.029 exceeds the target of two by only 1.4%. At otherwise nominal inputs, the thresholds are , , N·m, , and cm. These describe the same margin, not independent allowances: adverse changes compound, while an improvement in one input can offset another’s shortfall.
Table 8.
Final-generation capacity ratio with the stated inputs varied and other inputs nominal. The current-derived row is a conditional scenario, not a measured capacity.
Table 8 spans capacity ratios of 0.82–2.03. A mesh efficiency of 0.90 gives 1.92, and a 5% reduction in combined output gives 1.93. The relative improvement between configurations can remain substantial, while the absolute target is missed. The load factor is exact only at the defined reference posture; mesh efficiency, usable actuator output, and load sharing require independent evidence.
The factor scales total output, not the difference between actuators. If one supplies its nominal output and the other supplies 95%, then and the modeled ratio is 1.98. Section 6.6 examines unequal current and temperature measurements; its inferred remains conditional rather than a direct capacity measurement.
6.5. Measured Loaded Torque–Speed Characteristic
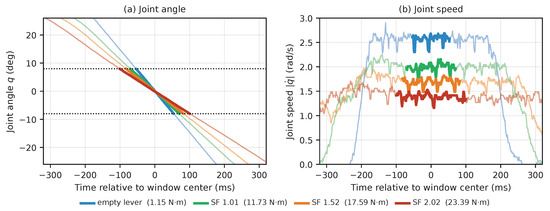
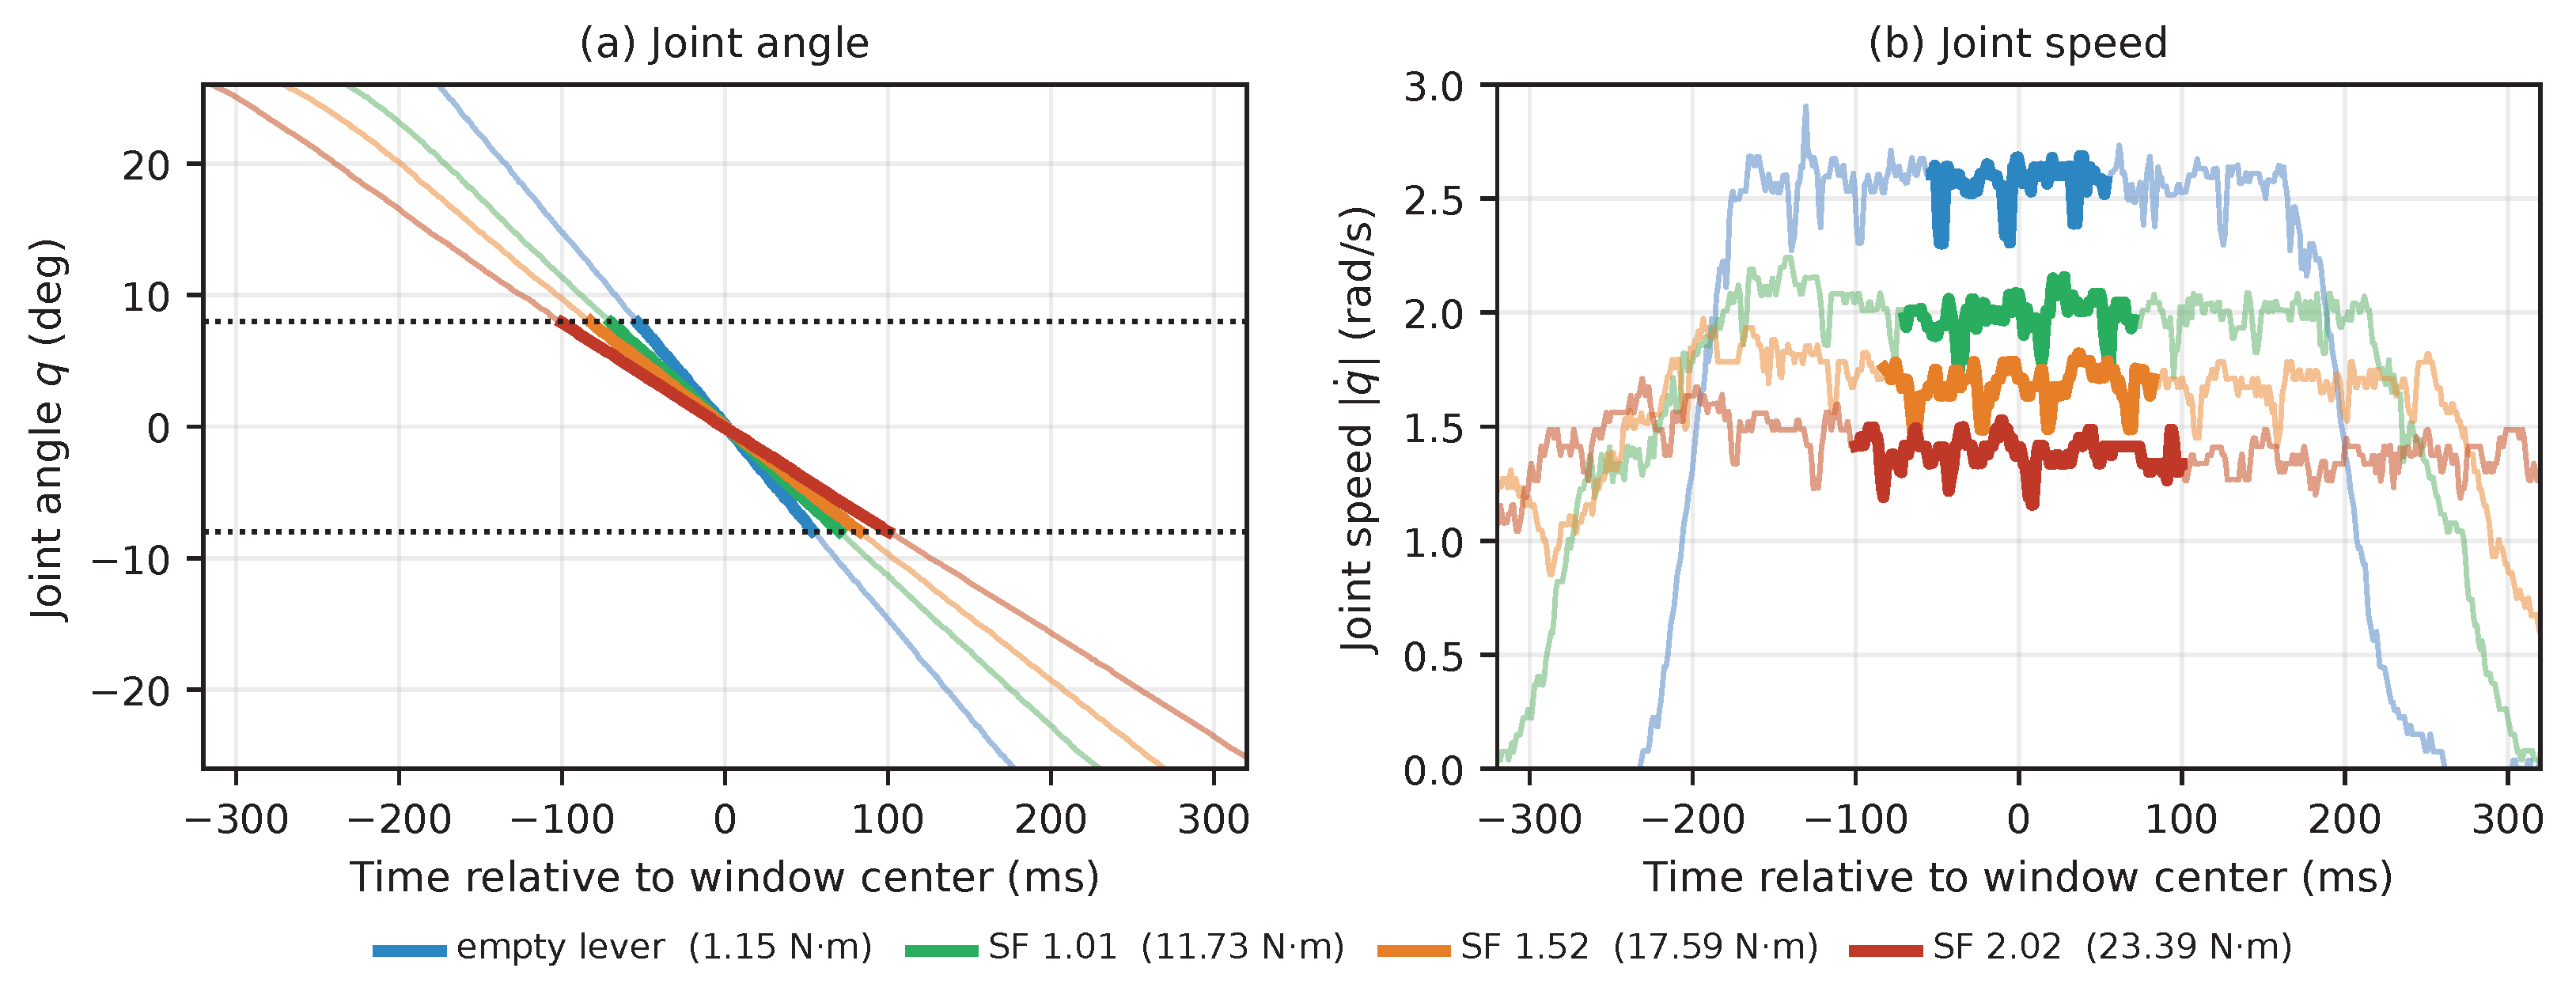
Table S3 and Figure 8 characterize the maximum-speed evaluation windows. They last 107–206 ms, with actuator voltage spanning 13.9–15.2 V. The first-half-to-second-half speed change is 0.30–3.21%, smallest at the heaviest load. These logged segments support near-plateau maxima, but the lighter two conditions are not fully settled steady states.
Figure 8.
First maximum-speed repetition at each load, aligned at the evaluation-window center. (a) Angle; dotted lines mark . (b) Encoder-derived speed, nine-sample moving average. Bold segments in both panels mark the evaluation window, .
Table 9 compares the measured speeds with the loaded characteristic at specification and fitted parameters. Both model columns use:
with , and . The specification column uses rad/s and N·m. The fitted column uses the bidirectional estimate rad/s and fits only to the four measured load conditions. Instrument terms, between-run scatter and residual speed variation have the separate meanings stated in Section 5.3.
Table 9.
Maximum joint speed over , three runs per load. SD is between-run scatter. Difference columns are ; fitted residuals use the same four calibration points. Model parameters are specified in the text.
Measured speed falls from 2.5781 to 1.3653 rad/s as the moment increases from 1.1454 to 23.3934 N·m. The specification-based model underpredicts every measurement, by 5.3–17.4%. Fitting N·m brings residuals within 0.9%, comparable in scale to the 0.12–1.2% between-run SD. The light-load points, which retain the largest window variation, also have the largest fitted residuals.
The fitted agreement is calibration, not independent validation. The measurement identifies only the lumped product N·m; it cannot separate true stall torque, efficiency and load sharing. In particular, the fitted value must not be read as a measured stall torque or proof of equal contributions from the two actuators. Four points establish that a single fitted parameter describes this load dependence, subject to the no-load estimate’s limitations.
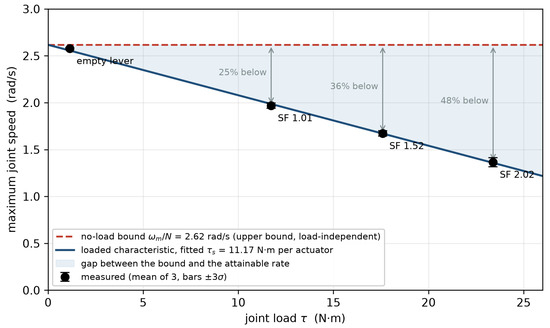
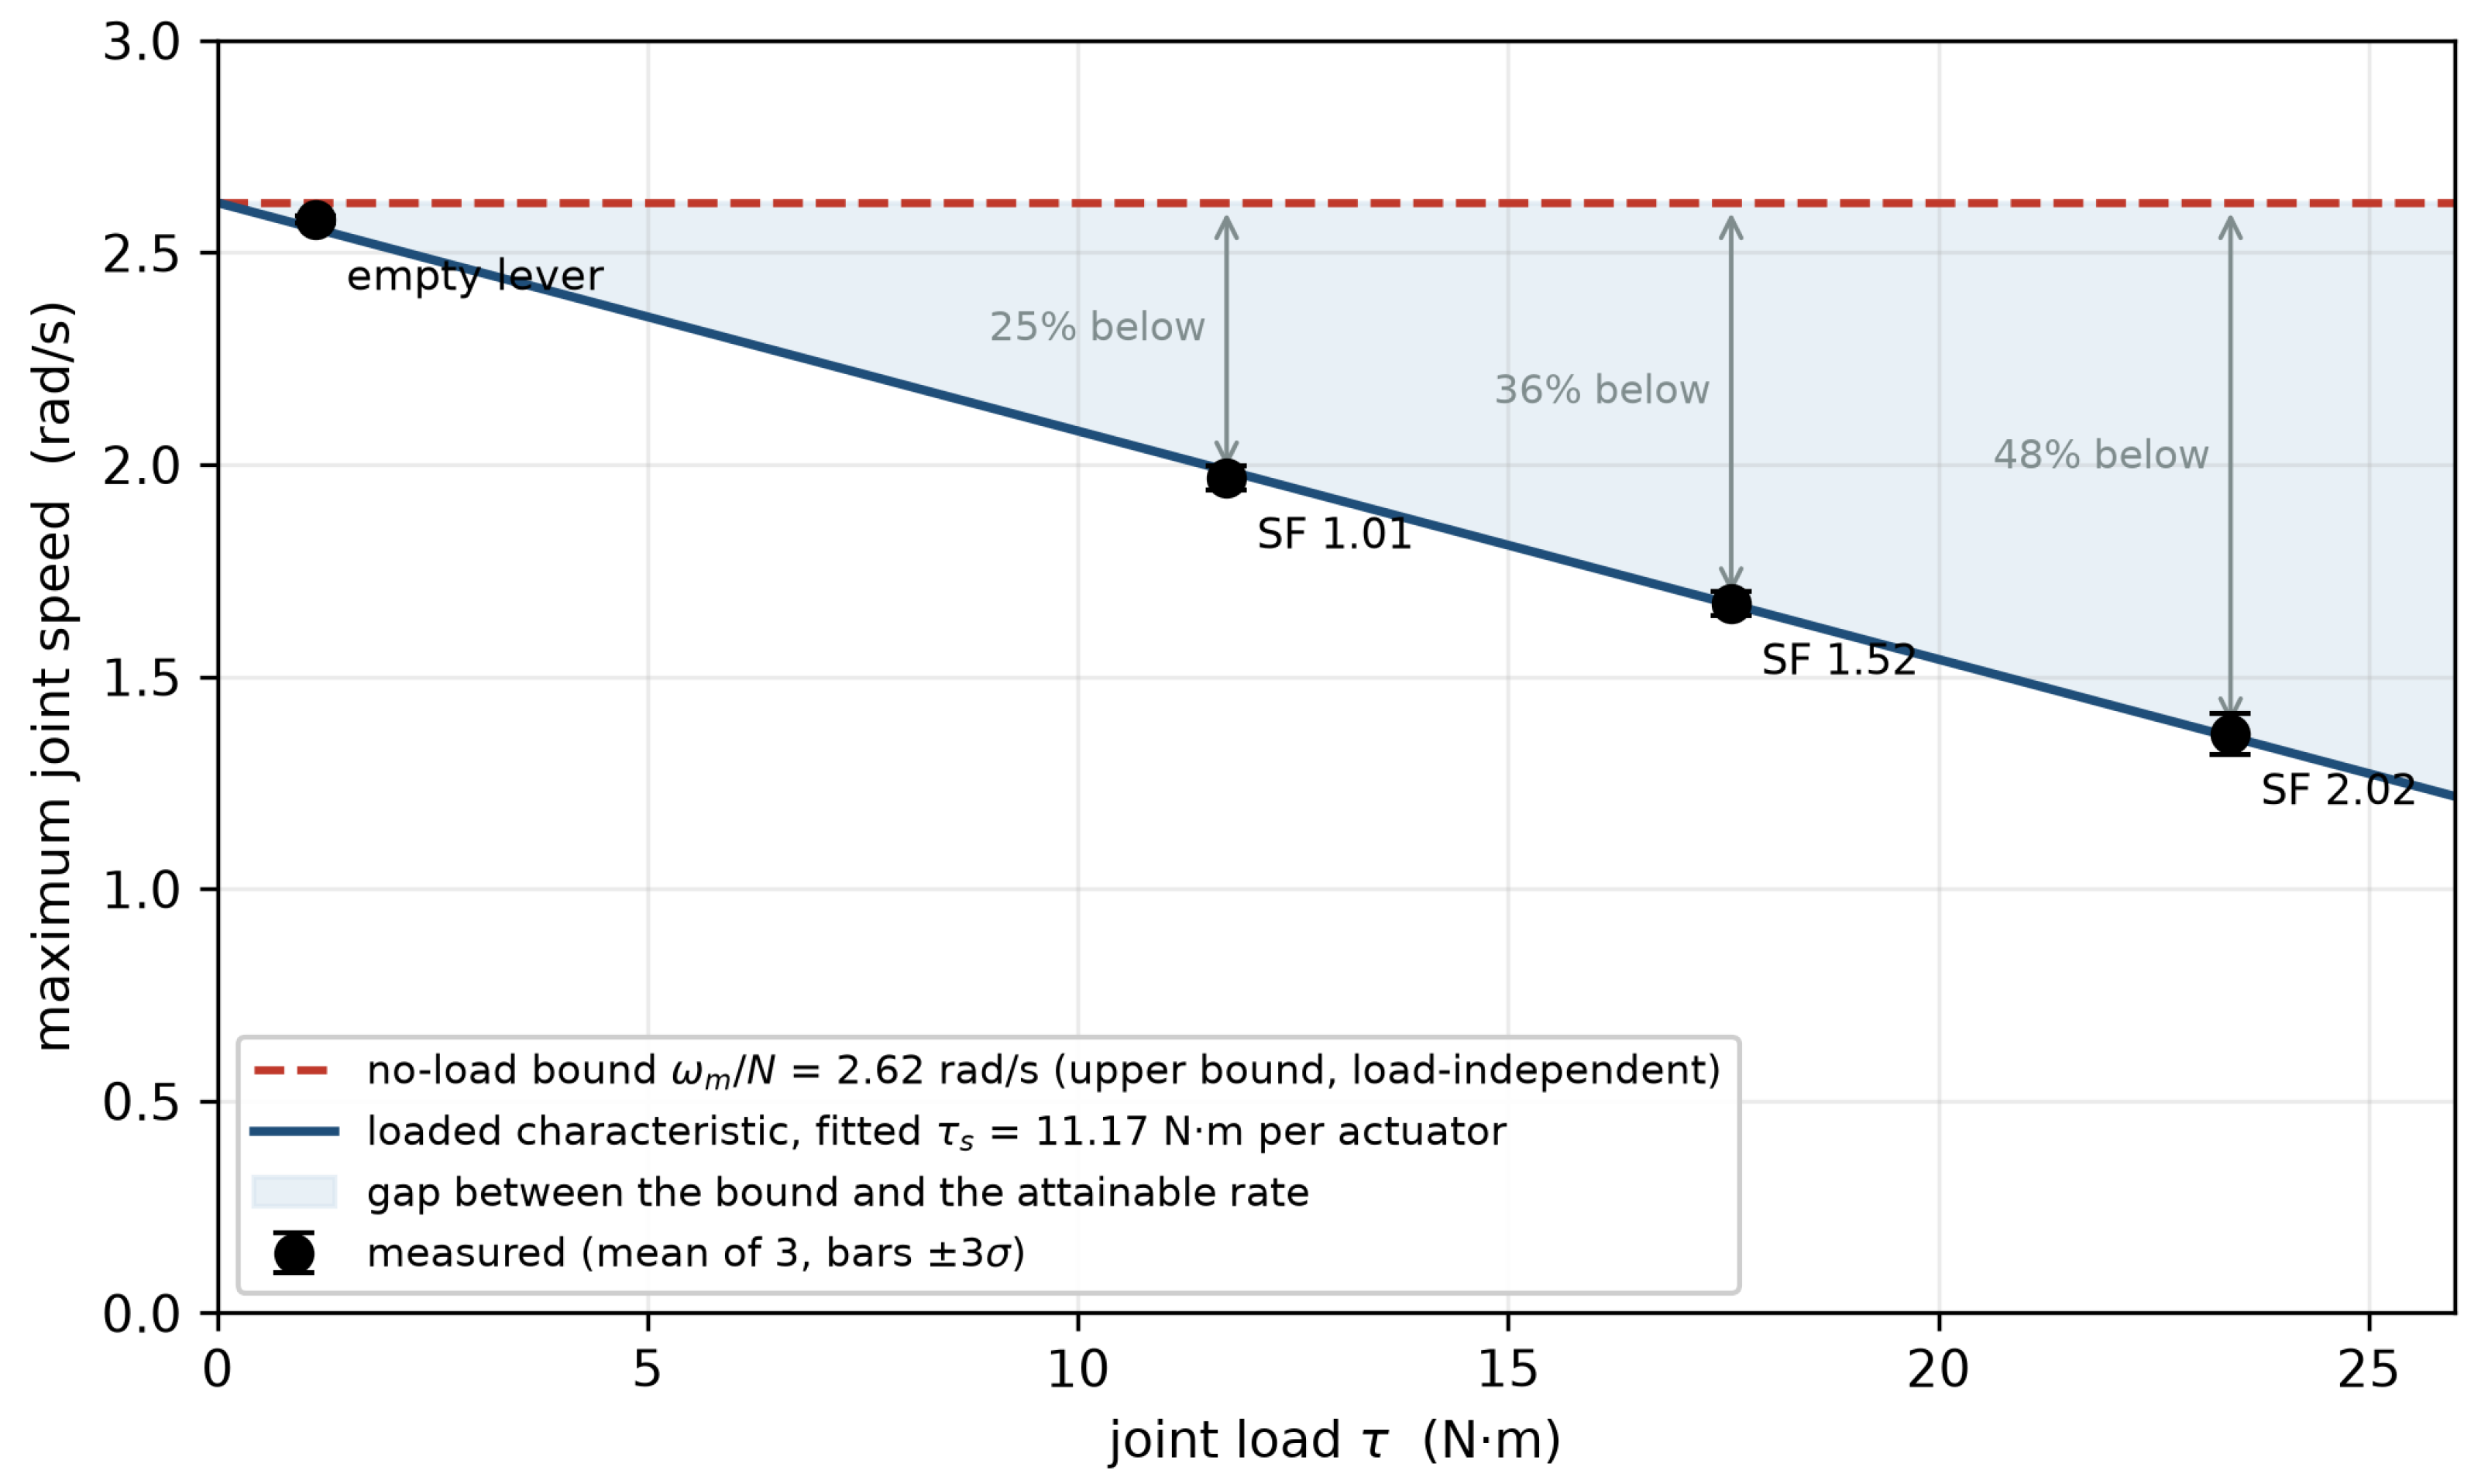
Figure 9 shows the distinction from the no-load upper bound. At the estimated , Equation (6) gives 2.618 rad/s regardless of load. Measurements lie 1.5% below it at the empty lever and 24.8–47.8% below it at the three loaded conditions. At SF , the bound is 1.92 times the measured attainable speed. This does not falsify the upper bound; it shows why passing a no-load rate condition does not establish that rate under load.
Figure 9.
Maximum joint speed versus load. Dashed: no-load upper bound; solid: fitted loaded characteristic; shading: their gap. Arrows show measured shortfalls from the no-load bound; points are means of three runs, with error bars of SD.
With the same fitted parameters, Equation (8) gives 31.8 W and a rate bound of 1.360 rad/s at 23.39 N·m, close to the measured 1.365 rad/s. The deployed ratio, 2.292, is near the power-optimal value 2.205 at that load. This is an internal consistency check using the fitted data, not a separate test of the power bound.
Constant-rate control: Table S4 reports all three loaded configurations. Every repetition attained the derived 0.374 rad/s requirement within 0.7% of target and met the uniformity criterion. Both descriptions predict this outcome; the control places the stance-sway requirement within the measured operating range without distinguishing between the models.
6.6. Sustained Holding and Load Sharing
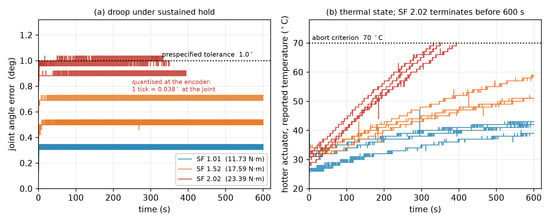
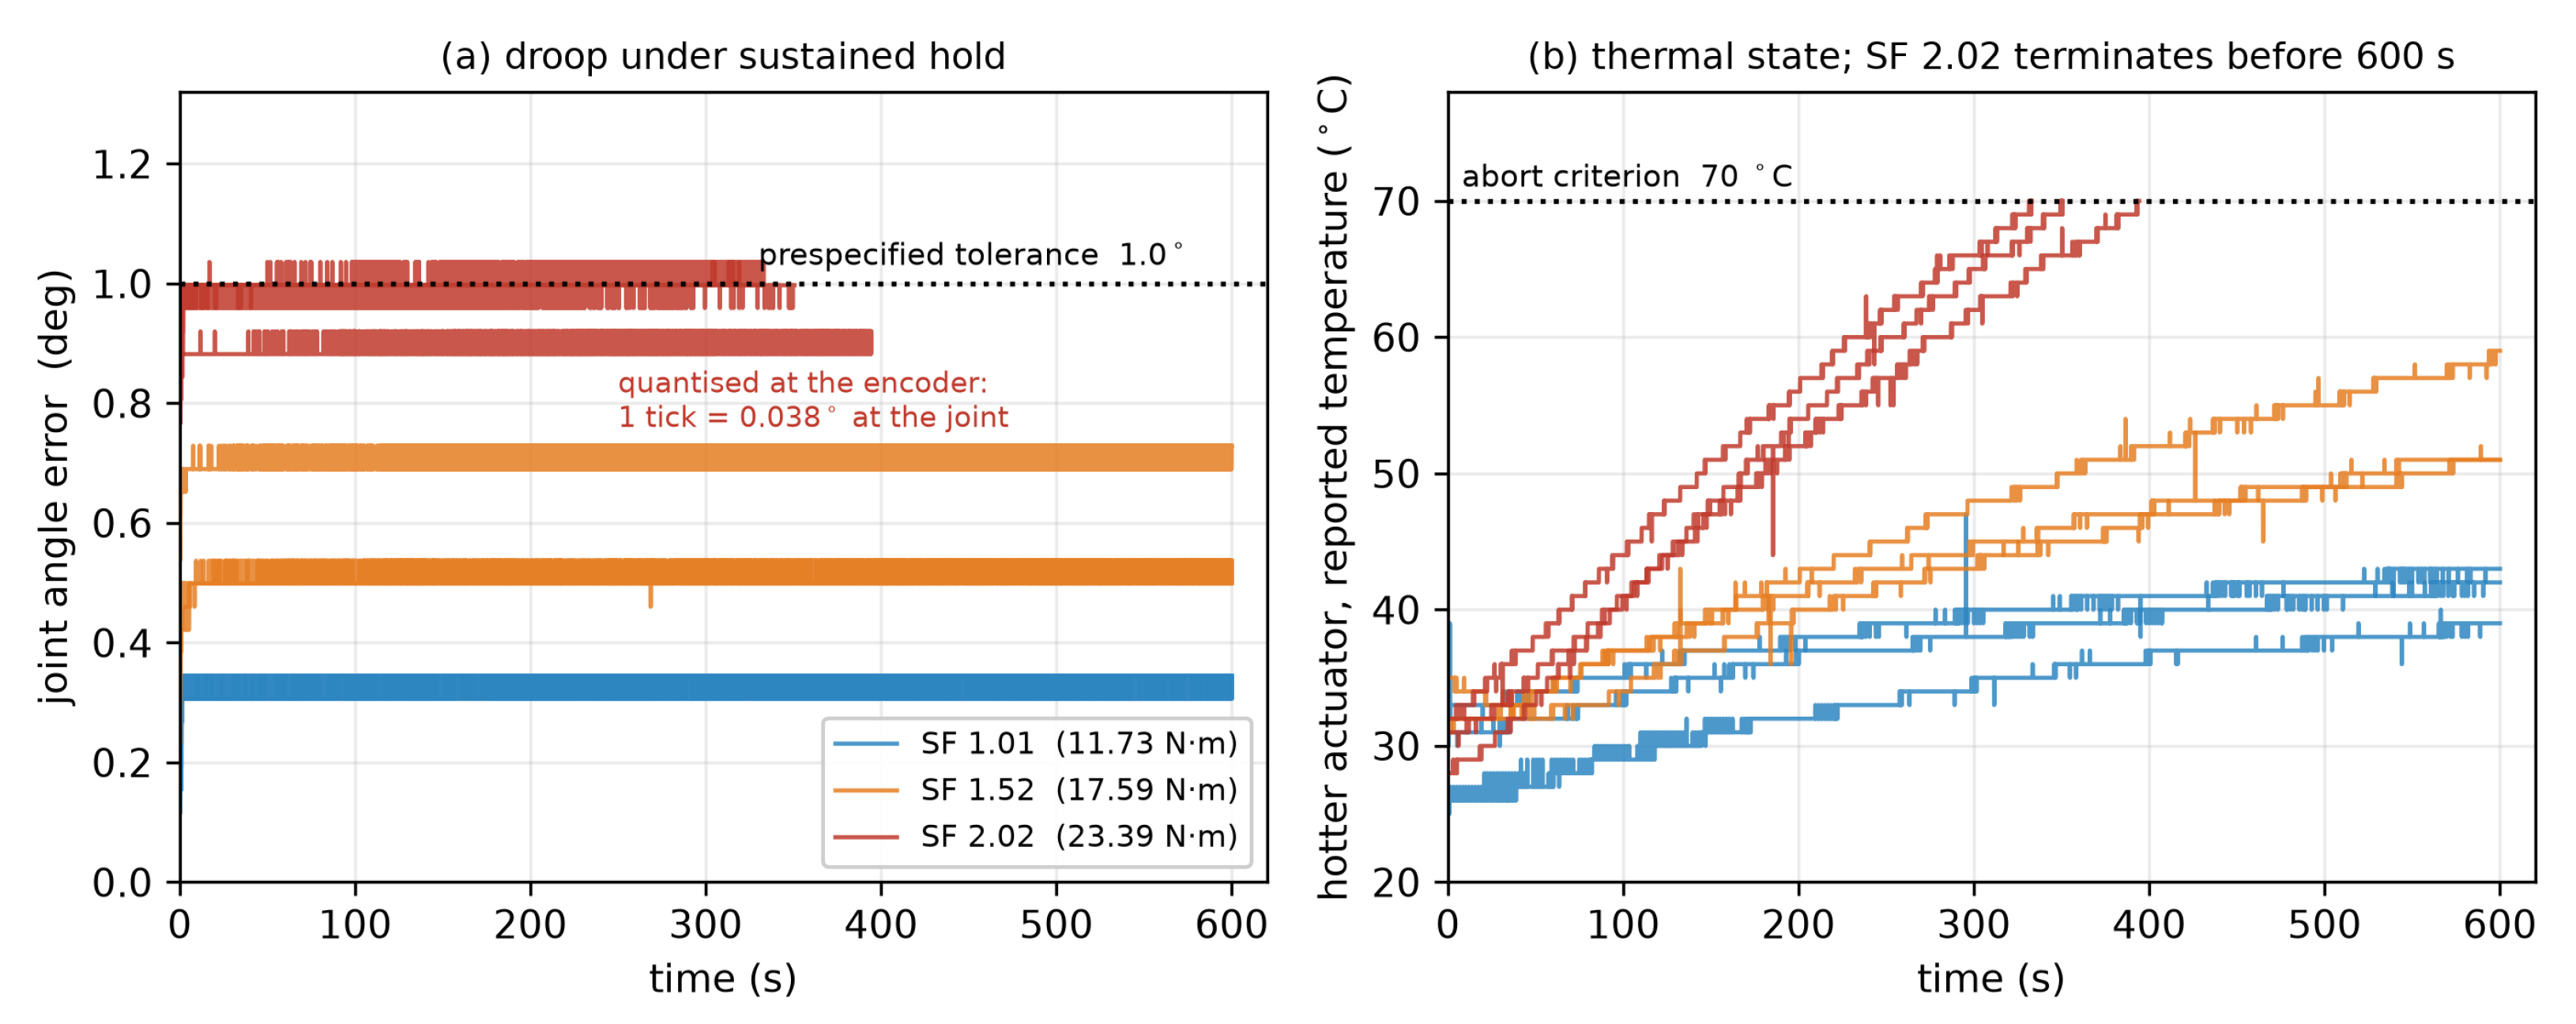
Table 10 and Figure 10 report the three tested moments. All three repetitions at SF and 1.52 completed 600 s. At SF , each run terminated when one actuator reported 70 °C, at 333, 351 and 394 s. No run triggered the angle-abort criterion. The experiment tests these hold durations, not the largest moment the group can sustain or its continuous rating.
Table 10.
Horizontal holds, three runs per load. Droop ranges cover run medians; parentheses give the maximum. End temperature is the hotter unit’s reported internal temperature; is the inter-unit difference at termination.
Figure 10.
Horizontal holds, three runs per load. (a) Joint-angle error; one encoder tick is . (b) Hotter actuator’s reported temperature. Heavy-load runs reach the 70 °C criterion before 600 s.
The heavy-load angle result is limited by resolution. Errors occupied six consecutive encoder values: 0.844, 0.882, 0.920, 0.959, 0.997 and . In the run with greatest droop, 82.9% of samples were at and 15.9% at ; the tolerance lies between these adjacent ticks. The longest continuous excursion above tolerance was 14 samples at 50 Hz, or 0.28 s, below the prespecified 0.5 s dwell. Thus, droop was approximately to within one tick. The logged angle-abort rule was not met, but a strict pass on angle magnitude is not resolved by the instrument.
Static holding also combines actuator output with gear-train friction. The measured 0.61 N·m static resisting torque exceeds the 0.214 N·m by which the heaviest load exceeds the SF target. Holding that load therefore demonstrates assembly behavior, not isolated actuator capacity. Loaded motion provides stronger evidence about delivered output because friction must then be overcome.
Thermal termination was asymmetric: at the heaviest load, the partner of the unit reaching 70 °C was at 51–52 °C. The temperature difference increased with load, as Table 10 shows. Across the SF and 2.02 holds, the hotter actuator carried a median fraction 0.68–0.70 of the pair’s measured current. This establishes unequal current and temperature, not directly unequal torque or a measured load-sharing factor.
Converting current fraction p into a limiting output factor requires equal torque constants, equal individual allowable outputs and persistence of the split at the operating point of interest. Under those unverified assumptions, the following is observed:
which gives 0.71–0.74. Inserting 0.73 reduces the nominal capacity ratio from 2.03 to 1.48 in the conditional sensitivity scenario. Equal sharing is therefore not supported by the hold observations, but neither is established as a measured coefficient. The maximum-speed fit cannot resolve this question because it identifies only the combined product above. Table S5 distinguishes the measured, estimated and fitted quantities.
Neither the lumped speed fit nor the single-direction static resisting-torque measurement identifies the cause of the hold asymmetry. More even sharing in motion is not established; actuator differences, mounting preload and thermal environment remain possible contributors.
The duration comparison is confined to the reported conditions. Initial device temperatures ranged from 25 to 35 °C, ambient temperature was not recorded, and equal historical gains across all loads are not established. No intermediate load was tested, including exactly SF ; so, these observations do not locate a universal thermal boundary. The lighter loads are established only for 600 s. The result is that instantaneous capacity and load-dependent speed do not, by themselves, establish sustained service capability.
6.7. Reconstructed Failure Record
The author and Jaesik Jeong recalled nine incidents across 26 contested matches (see Table 11). Match counts and types are documented in the league’s published results [23,24,25]; the incident record identifies season and joint but cannot recover an exact match or time of onset. A fault may have developed across several matches before discovery or repair. The robot continued to be fielded with each fault and was repaired after the match; so, the counts describe joint degradation rather than failures that stopped participation.
Table 11.
Recalled joint incidents and documented match exposure. Incidence is per match; brackets give exact Poisson 95% confidence intervals, excluding uncertainty from recall. In the lower panel, incident E03 (2017) involved both hip yaw and knee; so, ten joint entries represent nine incidents. Identifiers refer to the released record.
All incidents were recalled as occurring in main-tournament play. Restricting exposure to those matches changes the seasonal incidences to 0.80, 0.75, and 0.33. The 2017-to-2019 rate ratio is 4.80 over all matches, with log-Wald and exact conditional 95% intervals of [0.88, 26.21] and [0.69, 53.06]. For main-tournament play alone, it is 2.40, with intervals of [0.44, 13.10] and [0.34, 26.53]. Every interval includes unity, and the estimated ratio depends substantially on the exposure definition. The lower panel of Table 11 groups the incidents by joint. Five hip-yaw incidents preceded installation of the idler bearing, over 14 matches, and none followed, over 12 matches. An exact conditional comparison gives one-sided probabilities of 0.045 using all matches and 0.078 using main-tournament exposure alone (9 versus 6 matches). The corresponding two-sided probabilities are 0.066 and 0.165. This comparison was selected after noticing the joint-specific pattern and is exploratory; it does not isolate an effect of the bearing change.
No hip-roll incident was recalled, although the first generation’s nominal capacity ratio was below unity. The reference posture may not represent the demand during play, or inadequate torque may have appeared as gait impairment rather than a broken joint. The record cannot distinguish these possibilities and does not validate the hip-roll capacity model. Small counts and recall uncertainty, together with changing match composition and concurrent changes in software, team experience, and rules, prevent attributing changes in reliability to the redesign.
7. Discussion
7.1. Implications for Transmission Design
Stance narrowing and external gearing substantially increased the calculated hip-roll capacity, even after accounting for the added mass. Neither change alone reached the target of two. The final configuration exceeded that target by only 1.4%; so, the size of the improvement should not obscure how little margin remains. A small reduction in actuator output or increase in joint load can bring the ratio below the target. Under the stated model, torque is the limiting condition. The stance-sway rate estimate leaves more room but does not include foot placement or disturbance recovery.
The loaded characteristic also affects the choice of reduction ratio. Table 12 uses cm, SF , and , with the bench estimate rad/s and fitted N·m. The required rates illustrate the comparison; they were not measured during gait. Both columns include Equation (5). The separate calculation also uses Equation (6), while the combined calculation uses the torque–speed quadratic in Section 3.3.
Table 12.
Admissible external reduction ratios from separate torque and no-load rate conditions and from the combined loaded condition, using the inputs specified in the text.
At a required rate of 1.30 rad/s, for example, passes the separate conditions, but the calibrated characteristic gives 1.09 rad/s, 16% below the requirement. Accounting for load therefore excludes a ratio that would pass a no-load speed check. This is a model calculation for an alternative ratio; only the 24:55 pair was tested. For a planned redesign, the loaded characteristic can help select a candidate transmission once the joint load and required rate have been estimated. Operation during a task also depends on the allowable output and joint-demand history in Equation (9).
Holding duration requires a separate check. The heaviest tested moment, 2.02 times the reference, reached the temperature criterion after 333–394 s, while both lighter loads completed 600 s under their reported test conditions. The static capacity ratio alone gives no duration for this comparison. The paired drive also needs attention at the level of each actuator. At termination, one unit was 18–19 °C cooler than the other. Monitoring both units revealed a difference that could be missed by measuring only one. These observations help identify what to measure when retaining an existing actuator group. Applying the calculations to another design requires its own load and rate estimates, followed by tests of the selected assembly under the intended operating conditions.
7.2. Loaded Performance and Holding Duration
The measured speeds lie below the no-load upper bound, as expected, and show how the difference increases with load. The fitted characteristic describes these four points; its small residual is a calibration result, not independent predictive validation. The fit identifies a combined output parameter and cannot separate transmission efficiency from actuator torque or load sharing.
Holding duration adds information absent from a nominal torque margin. The heaviest load reached the prespecified temperature criterion before the intended duration, while the two lighter loads completed the test. These outcomes apply to the tested loads; the exact target load and a maximum sustainable capacity were not established. Static friction contributes to the held moment; so, a successful hold does not isolate actuator output. The unresolved encoder-level droop criterion is reported separately from the temperature termination.
Unequal current and temperature provide direct evidence of asymmetric operation during holds. Converting the current split into additionally assumes equal torque constants and individual allowable outputs, with the split persisting at the operating point of interest. The fitted speed characteristic does not establish equal sharing during motion. For a paired assembly, recording both actuators’ temperatures is therefore relevant to holding duration: one unit reached the criterion, while its partner remained substantially cooler.
7.3. Scope and Limitations
The reference load describes one quasi-static, unleaned posture. It omits dynamic loading and does not establish the worst case during walking. The minimum swing-clearance width was also not measured. The analysis can compare the deployed configurations under stated assumptions, but cannot define their complete admissible operating region.
The separate bench used two different units of the deployed actuator model. It samples allowable output at a few operating points without reproducing gait or the robot’s thermal enclosure. Holding results apply to laboratory ambient, the reported internal temperature criterion of 70 °C, and the 600 s test horizon. Supply voltage varied within the evaluation windows, and its contribution is not separated from the reported scatter. Control-register values were not recorded for every bench run; later readback cannot establish identical settings throughout. These limitations restrict exact reproduction and extrapolation to other conditions.
The failure history concerns structural incidents in other joints, which the hip-roll capacity model does not explain. The exposure analyses in Section 6.7 show how the incidence estimates depend on match composition. Together with recall uncertainty and concurrent deployment changes, this prevents causal attribution to the revisions.
The evidence covers one platform family and one actuator pair. Extending the calculation to another design requires its own parameters; evaluating performance during a task also requires a representative joint-demand history and allowable output over the relevant operating conditions. Neither is available here for dynamic play.
8. Conclusions
Stance narrowing and external gearing increased the calculated hip-roll capacity ratio from 0.70 to 2.03 without changing actuator class. Neither change reached the target of two alone. The final configuration exceeded that target by only 1.4%; so, small changes in the assumed actuator output or joint load could determine whether it was met.
The bench measurements show why this nominal margin needs to be considered alongside loaded performance. At approximately twice the reference moment, maximum joint speed was 47.8% below the no-load upper bound. A torque–speed characteristic fitted to the measured points provides a basis for comparing candidate reduction ratios under load. At 23.39 N·m, all three holding trials ended after 333–394 s when one actuator reported the prespecified limit of 70 °C; both lighter loads completed 600 s. The unequal currents and temperatures show asymmetric operation during holds, although they do not directly establish the torque supplied by each unit.
For a redesign with existing actuators, the torque calculation can narrow the choice of transmission. A candidate still needs to be checked at the required speed under load and for the intended holding duration. Both units should be monitored in a paired drive.
The results concern one actuator pair and one external gear ratio under the reported conditions. They do not establish continuous capacity or performance during walking. No task-specific joint-load history was available for the retired platform, and the reconstructed competition incidents concern other joints. That record remains descriptive context for the redesign.
A useful next step is to apply the calculations to a planned redesign and record the predicted torque margin and loaded speed before construction. These predictions could then be compared with measurements from the completed assembly. Holding duration would need a separate test against a requirement set in advance. This would help assess the usefulness of the calculations for a new design.
Supplementary Materials
The following supporting information can be downloaded at: https://www.mdpi.com/article/10.3390/app162010145/s1, Table S1: Post-test register readback on 28 September 2026, after all reported runs; Table S2: Empty-lever sweeps, three per direction; Table S3: Maximum-speed evaluation windows, ranges over three runs; Table S4: Constant-rate traverses, three runs per load; Table S5: Bench evidence for model inputs.
Funding
This research was supported by the National Science and Technology Council (NSTC), Taiwan, under grant NSTC 114-2222-E-131-007.
Institutional Review Board Statement
Not applicable.
Informed Consent Statement
Not applicable.
Data Availability Statement
The analysis and bench control code, raw bench logs, run records, and failure counts reconstructed from recollection are openly available at https://github.com/yjh-mcut/redesign-methodology, accessed on 18 August 2026. Data provenance, limitations, and run exclusions are documented in the repository.
Conflicts of Interest
The author declares no conflicts of interest.
Abbreviations
| CoM | Center of mass |
| DoF | Degrees of freedom |
| LIPM | Linear inverted pendulum model |
| SF | Capacity ratio target |
References
- Seok, S.; Wang, A.; Chuah, M.Y.; Hyun, D.J.; Lee, J.; Otten, D.M.; Lang, J.H.; Kim, S. Design principles for energy-efficient legged locomotion and implementation on the MIT cheetah robot. IEEE/ASME Trans. Mechatronics 2014, 20, 1117–1129. [Google Scholar] [CrossRef] [Scilit]
- Katz, B.; Di Carlo, J.; Kim, S. Mini cheetah: A platform for pushing the limits of dynamic quadruped control. In Proceedings of the 2019 International Conference on Robotics and Automation (ICRA), Montreal, QC, Canada, 20–24 May 2019; pp. 6295–6301. [Google Scholar]
- Liao, Q.; Zhang, B.; Huang, X.; Huang, X.; Li, Z.; Sreenath, K. Berkeley humanoid: A research platform for learning-based control. In Proceedings of the 2025 IEEE International Conference on Robotics and Automation (ICRA), Atlanta, GA, USA, 19–23 May 2025; pp. 2897–2904. [Google Scholar]
- Allgeuer, P.; Farazi, H.; Ficht, G.; Schreiber, M.; Behnke, S. The igus Humanoid Open Platform: A child-sized 3D printed open-source robot for research. arXiv 2018, arXiv:1809.11110. [Google Scholar]
- Ficht, G.; Farazi, H.; Brandenburger, A.; Rodriguez, D.; Pavlichenko, D.; Allgeuer, P.; Hosseini, M.; Behnke, S. NimbRo-OP2X: Adult-sized open-source 3D printed humanoid robot. In Proceedings of the 2018 IEEE-RAS 18th International Conference on Humanoid Robots (Humanoids), Beijing, China, 6–9 November 2018; pp. 1–9. [Google Scholar]
- Bestmann, M.; Güldenstein, J.; Vahl, F.; Zhang, J. Wolfgang-op: A robust humanoid robot platform for research and competitions. In Proceedings of the 2020 IEEE-RAS 20th International Conference on Humanoid Robots (Humanoids), Munich, Germany, 19–21 July 2021; pp. 90–97. [Google Scholar]
- Ha, I.; Tamura, Y.; Asama, H.; Han, J.; Hong, D.W. Development of open humanoid platform DARwIn-OP. In Proceedings of the SICE Annual Conference 2011, Tokyo, Japan, 13–18 September 2011; pp. 2178–2181. [Google Scholar]
- Rezazadeh, S.; Hurst, J.W. On the Optimal Selection of Motors and Transmissions for Electromechanical and Robotic Systems. In Proceedings of the 2014 IEEE/RSJ International Conference on Intelligent Robots and Systems (IROS), Chicago, IL, USA, 14–18 September 2014; pp. 4605–4611. [Google Scholar] [CrossRef] [Scilit]
- Pratt, G.A.; Williamson, M.M. Series elastic actuators. In Proceedings of the 1995 IEEE/RSJ International Conference on Intelligent Robots and Systems. Human Robot Interaction and Cooperative Robots, Pittsburgh, PA, USA, 5–9 August 1995; Volume 1, pp. 399–406. [Google Scholar]
- Arena, P.; Fortuna, L.; Frasca, M.; Sicurella, G. An adaptive, self-organizing dynamical system for hierarchical control of bio-inspired locomotion. IEEE Trans. Syst. Man. Cybern. Part B (Cybern.) 2004, 34, 1823–1837. [Google Scholar] [CrossRef] [Scilit] [PubMed]
- Pahl, G.; Beitz, W.; Feldhusen, J.; Grote, K.H. Engineering Design: A Systematic Approach, 3rd ed.; Springer: London, UK, 2007. [Google Scholar]
- Ulrich, K.T.; Eppinger, S.D.; Yang, M.C. Product Design and Development; McGraw-Hill Higher Education: Boston, MA, USA, 2008; Volume 4. [Google Scholar]
- Suh, N.P. The Principles of Design; Oxford University Press: New York, NY, USA, 1990. [Google Scholar]
- NASA. Problem Reporting and Corrective Action System. NASA Lessons Learned Information System, Lesson 738. 1999. Available online: https://llis.nasa.gov/lesson/738 (accessed on 18 August 2026).
- Carlson, J.; Murphy, R.R. How UGVs physically fail in the field. IEEE Trans. Robot. 2005, 21, 423–437. [Google Scholar] [CrossRef] [Scilit]
- Steinbauer, G. A Survey about Faults of Robots Used in RoboCup. In RoboCup 2012: Robot Soccer World Cup XVI; Lecture Notes in Computer Science; Springer: Berlin/Heidelberg, Germany, 2013; Volume 7507, pp. 344–355. [Google Scholar]
- Anderson, J.; Baltes, J.; Cheng, C.T. Robotics competitions as benchmarks for AI research. Knowl. Eng. Rev. 2011, 26, 11–17. [Google Scholar] [CrossRef] [Scilit]
- Gerndt, R.; Seifert, D.; Baltes, J.H.; Sadeghnejad, S.; Behnke, S. Humanoid robots in soccer: Robots versus humans in RoboCup 2050. IEEE Robot. Autom. Mag. 2015, 22, 147–154. [Google Scholar] [CrossRef] [Scilit]
- Jeong, J.; Yang, J.; Christmann, G.H.G.; Baltes, J. Lightweight mechatronic system for humanoid robot. Knowl. Eng. Rev. 2023, 38, e5. [Google Scholar] [CrossRef] [Scilit]
- Yang, J.; Jeong, J. Heuristic Design Approaches for Humanoid Robots. In IASDR 2025: Design Next; Chang, C.Y., Chen, C.H., Hsu, Y., Eds.; Design Research Society (DRS): London, UK, 2025. [Google Scholar] [CrossRef] [Scilit]
- ROBOTIS. Dynamixel MX-106 e-Manual: Specifications and Performance Graph. Available online: https://emanual.robotis.com/docs/en/dxl/mx/mx-106/ (accessed on 18 August 2026).
- Kajita, S.; Kanehiro, F.; Kaneko, K.; Yokoi, K.; Hirukawa, H. The 3D linear inverted pendulum mode: A simple modeling for a biped walking pattern generation. In Proceedings of the 2001 IEEE/RSJ International Conference on Intelligent Robots and Systems. Expanding the Societal Role of Robotics in the the Next Millennium (Cat. No. 01CH37180), Maui, HI, USA, 29 October–3 November 2001; Volume 1, pp. 239–246. [Google Scholar]
- RoboCup Humanoid League. RoboCup 2017 Humanoid League: Official Results. 2017. Available online: https://humanoid.robocup.org/hl-2017/results/ (accessed on 18 August 2026).
- RoboCup Humanoid League. RoboCup 2018 Humanoid League: Official Results. 2018. Available online: https://humanoid.robocup.org/hl-2018/results/ (accessed on 18 August 2026).
- RoboCup Humanoid League. RoboCup 2019 Humanoid League: Official Results. 2019. Available online: https://humanoid.robocup.org/hl-2019/results/ (accessed on 18 August 2026).

Disclaimer/Publisher’s Note: The statements, opinions and data contained in all publications are solely those of the individual author(s) and contributor(s) and not of MDPI and/or the editor(s). MDPI and/or the editor(s) disclaim responsibility for any injury to people or property resulting from any ideas, methods, instructions or products referred to in the content. |
© 2026 by the author. Licensee MDPI, Basel, Switzerland. This article is an open access article distributed under the terms and conditions of the Creative Commons Attribution (CC BY) license.