


Abstract
Steelgrade selection can influence both the environmental impact and structural performance of manufactured products. This study evaluates these trade-offs for a footwear shoe shank by combining Life Cycle Assessment (LCA) and Finite Element Analysis (FEA) to compare a conventional heat-treated C60 steel with a DP1000 steel alternative. A cradle-to-gate LCA was performed to quantify carbon dioxide equivalent emissions, while nonlinear FEA predicted the structural response and guided design exploration. Direct substitution of steels indicates that the C60 solution has approximately 7% lower global warming potential per component than the DP1000 solution, with steel production accounting for the majority of total emissions. An additional FEA study involved reducing the thickness of the DP1000 solution whilst ensuring load-bearing capacity equivalent to that of the C60 design. By reducing the DP1000 thickness from 1.30 mm to 1.18 mm, this new model achieved a global warming potential reduction of 1.43% compared to the initial C60 model. Sensitivity analysis indicates that this solution’s environmental benefit can range from 1.15% to 6.79% and is strongly influenced by assumptions regarding steel production and component mass. The results highlight the importance of jointly evaluating environmental and mechanical performance when selecting materials for footwear components.
1. Introduction
The effects of climate change are already clearly being felt [1], highlighting the urgent need for action to address this reality. To this end, it is imperative to reduce carbon dioxide emissions, as this is the compound that contributes most to climate change [2].
As a material widely used in the manufacture of most everyday products, steel presents a significant opportunity for achieving environmental targets. In fact, its production accounts for 7% to 8% of global emissions [3]. This means that action can be taken across various fronts, such as raw material extraction [4], production methods [5,6], the processing of semi-finished products [7], and post-manufacturing treatments [8].
Over the years, different grades of steel have been developed to meet the requirements of specific applications. By varying the alloying elements and incorporating specific processes into production, it is possible to manipulate mechanical properties such as ductility and tensile strength, among others. One example is high-strength steel, whose subclasses continue to evolve, largely driven by demand from the automotive industry [9]. In practical terms, if a given steel has a higher yield strength than other grades, a reduction in mass can be expected for the same application whilst still ensuring the same structural integrity. This is particularly relevant in vehicles, where any mass reduction requires less energy to move the vehicle and, consequently, results in fewer greenhouse gas emissions [10].
Among the stages involved in the production of a steel component, a common approach is to apply a heat treatment at a final stage of manufacturing to ensure certain mechanical properties. This is because the steel may not initially possess these properties, or due to limitations in manufacturing the desired component. However, this process often has a significant energy impact [8], as it is necessary to subject the product to thermal cycles (using industrial furnaces) to control its metallography. Eliminating this process therefore offers potential for reducing the product’s environmental impact, particularly in terms of emissions [11].
Using these steels in sectors beyond the automotive industry may offer advantages. One such example is footwear, where studies have already examined the substitution of materials. Bianchi et al. applied LCA to the toe caps of safety footwear manufactured from different materials, demonstrating the lower environmental impact of this steel component compared to aluminium, polycarbonate, glass fibre prepreg and composite [12]. The toe cap was also addressed by Costa et al., who developed a new model made of ultra-high-strength steel with reduced thickness. This model demonstrated improved performance under impact whilst achieving a 40% reduction in thickness [13].
Shoe shanks are a common component in various types of footwear; their purpose is to provide structural sturdiness, improve wearer comfort, and prevent the shoe from bending between the forefoot and the heel (particularly in high-heeled shoes). Traditionally, this component is made from medium-carbon steel sheet (such as C60 steel), and its manufacture involves cold forming followed by heat treatment. Although a dedicated international standard exists for assessing longitudinal stiffness (ISO 18896 [14]), numerical analysis of this component remains largely unexplored in the scientific literature and existing knowledge relies primarily on experimental testing. Combined LCA-FEA approaches, in turn, have already been applied in other sectors, but have not yet been extended to footwear components. Two examples are the optimisation of structural performance and the reduction in the environmental impact of automotive tooling components [15], and a thermoplastic composite component [16]. Most studies assess environmental performance or mechanical performance separately; fewer studies explicitly examine the trade-off between material grade, component mass, structural response, and environmental impact at the component level. The hypothesis underlying this study is that replacing C60 steel with a high-strength grade (such as DP1000) can result in a product with a lower carbon footprint while maintaining similar in-service performance.
2. Materials and Methods
This study was based on an approach comprising two tools: Life Cycle Assessment and numerical simulation using Finite Element Analysis. The former was used to analyse the carbon footprint of each solution, whilst the latter focused on assessing their structural performance.
This dual approach relied on a real physical component to provide both geometric and material property data. This physical model, made of C60 steel, has a mass of 13.72 g and a density of 7.80 g/ [17]. Assuming a shoe shank with the same total volume (retrieved directly from the CAD model), a mass of 14.03 g was estimated for the DP1000 steel model, with a density of 7.85 g/. This made it possible, at an initial stage, to observe the results of a simple direct substitution of steel and, on that basis, to assess how the environmental and structural performance of the shoe shank changes when its thickness is reduced.
2.1. Life Cycle Assessment
The LCA methodology involves following specific steps in accordance with the ISO 14040 [18] and ISO 14044 [19] standards. Among these, it is essential to define the system boundary, the functional unit and the life cycle inventory. The choice of a life cycle impact assessment method ultimately enables the quantification of each category associated with that method and the evaluation of the environmental performance of each proposed solution.
The LCA performed in this study was carried out using Sphera v10.9.1.17 software, with Ecoinvent 3.12 used to establish the LCI.
2.1.1. Definition of the Objective and Scope
This LCA consists of a comparative analysis between two solutions, the aim of which is to quantify the global warming potential in terms of kgeq./component of a shoe shank made from C60 steel or DP1000 steel.
A key parameter in an LCA is the definition of its functional unit. The functional unit adopted in this study is defined as one shoe shank component providing equivalent structural performance. The initial C60 and DP1000 scenarios, in which the shoe shank geometry and thickness were held constant, provide an exploratory comparison to characterise the structural performance gap between the two steels under identical geometric conditions. As such, they do not satisfy the functional equivalence criterion underlying the defined functional unit and are not intended as a direct life cycle comparison. Functional equivalence, and therefore the valid basis for environmental comparison under ISO 14044, is achieved only in the final scenario, in which the DP1000 shank thickness is reduced to match the structural performance of the C60 reference shoe shank. In terms of system boundaries, this is a “cradle-to-gate” study, encompassing all stages from the extraction of raw materials to the final component ready for assembly into a shoe.
2.1.2. Life Cycle Inventory
The analysis type considered in this study is a cradle-to-gate LCA; as such, all stages involved in the production of the shoe shank are included, up to the point at which it is ready to be incorporated into a shoe. By grouping the production process into sub-phases, the following can be identified: steel production, component forming, and heat treatment of the final product—the latter applying only to the C60 steel solution. Table 1 sets out all the flows/processes that make up the LCI for each of the LCAs. It should be noted that all inputs were based on the mass of each shoe shank made from the two different steel types (these values are given in the second paragraph of Section 2).
Table 1.
Identification of the flows/processes used as LCI to carry out the described LCA.
Despite the designation of the item used to model the heat treatment, it refers specifically to that process (the description of the process on the ecoQuery platform makes this point clear: “It only includes the energy consumption for the heat treatment of the steel after it has been deformed by impact extrusion.”) [20]. This choice was made because it is the only entry available in the database that can be used to model the heat treatment process satisfactorily.
2.1.3. Simplifications, Omissions and Limitations of the Study
Given the cradle-to-gate system boundary adopted for this LCA, both the use and end-of-life phases of the shoe shank were omitted. In practical terms, once the shoe shank is fitted into a shoe, no additional environmental impact occurs regardless of the solution. Although the service life may be longer or shorter for each solution, this could only be estimated by performing fatigue tests. Furthermore, the duration of the use phase will largely depend on the user’s own usage patterns, so accounting for the environmental impact of this phase would require broadening the definition of the functional unit adopted in this study.
At end of life, the impact would be similar if the shoe shanks end up in a landfill. In terms of recycling, there may be slight disparities between the two steel types, owing to their different elemental compositions. It is also worth noting that transportation across the entire production path (i.e., the transportation of raw materials and semi-finished and finished products between factories) was excluded from this study. This aspect was disregarded because the difference in mass between the two solutions is small, and the transport routes are expected to be essentially the same regardless of the solution considered.
Neither of the two phases described above is crucial for the intended comparative analysis (the disparities between solutions lie primarily in the production and manufacture of the shoe shank). However, expanding the study’s system boundary to encompass the full product life cycle, from raw material extraction to disposal, would yield a truly comprehensive total GWP for each of the two solutions.
2.2. Finite Element Analysis
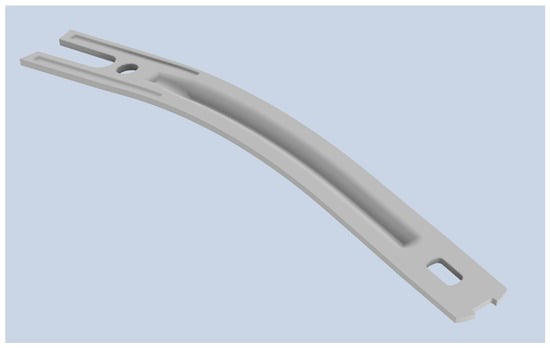
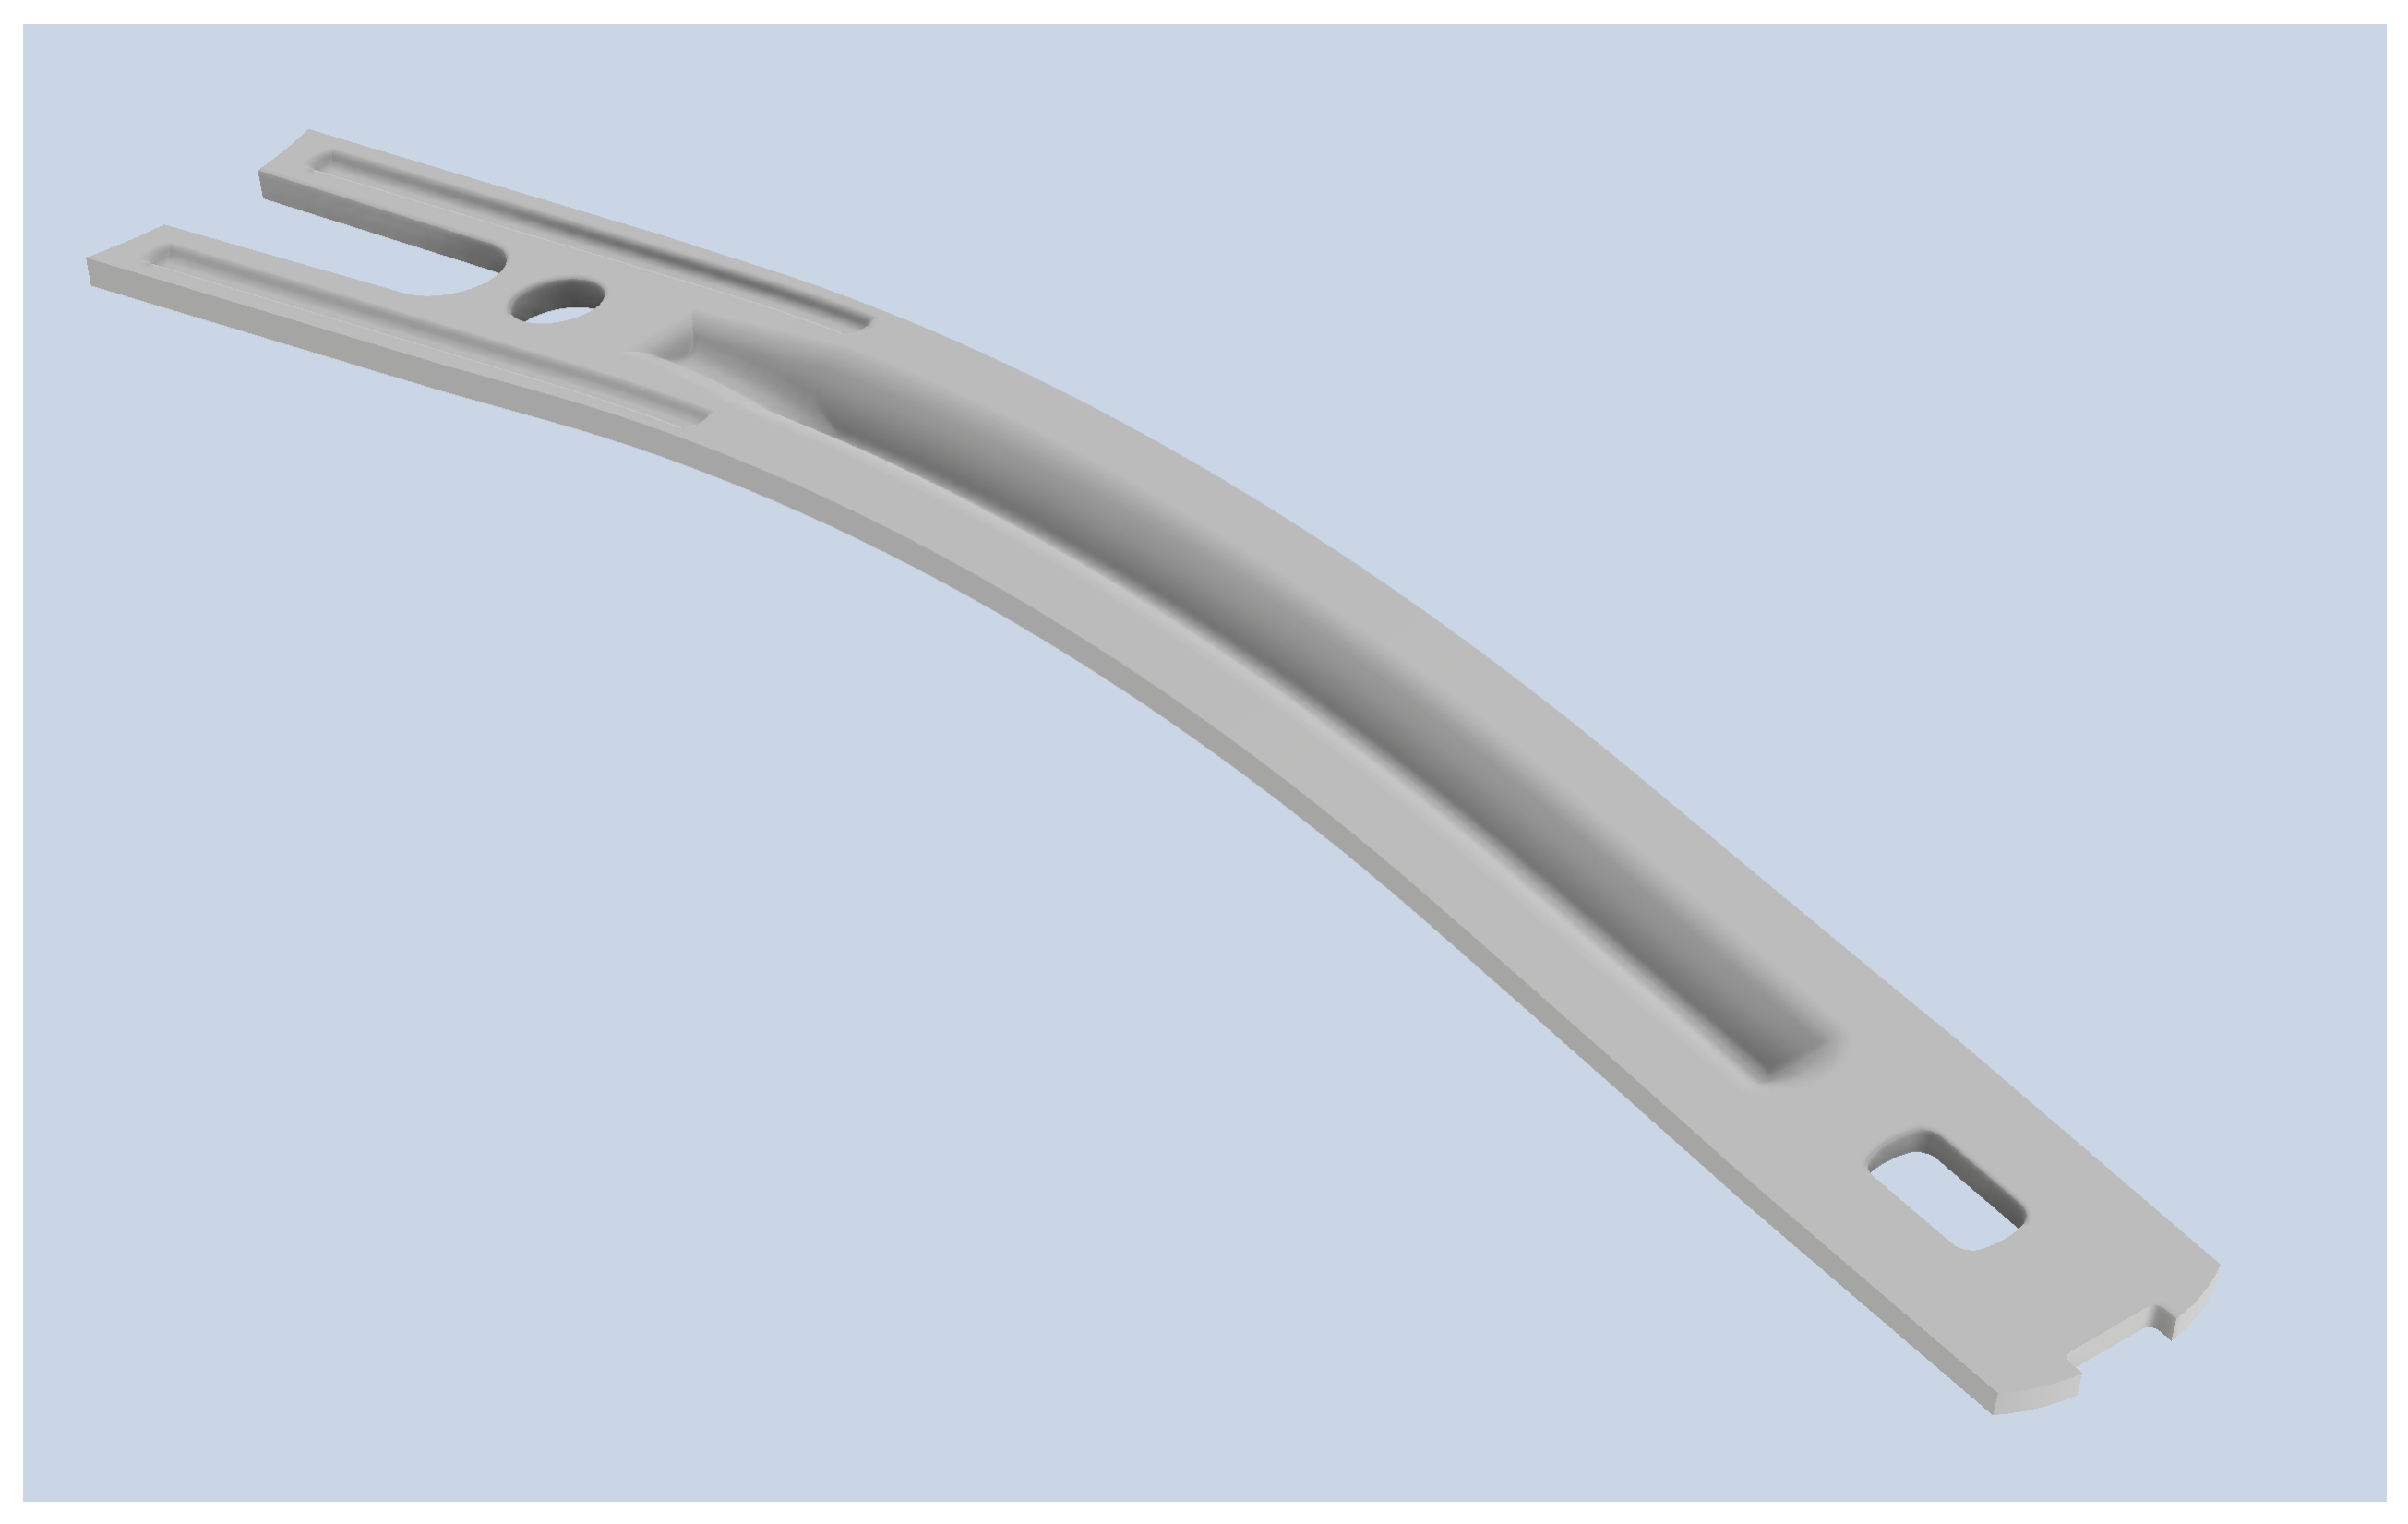
In order to carry out the numerical simulations of the shoe shank, it was first necessary to obtain a CAD model of it. The approach used consisted of manually modelling the shoe shank, using a 3D-scanned model as a visual reference to help capture some challenging features (e.g., the shoe shank curvature). Figure 1 shows the shoe shank modelled manually in Autodesk Inventor Professional 2026.
Figure 1.
The model of the shoe shank obtained through specialised CAD software (Autodesk Inventor Professional 2026).
2.2.1. Test Configuration of the Numerical Simulation
The numerical simulation in question was carried out to assess the flexural performance of the shoe shank when made from C60 or DP1000 steel. To this end, a setup consistent with the SATRA TM58 test method was adopted [21]; this method is used to determine the stiffness of shoe shanks. The test consists of clamping one end of the component in place while applying a load via suspended weights at the free end.
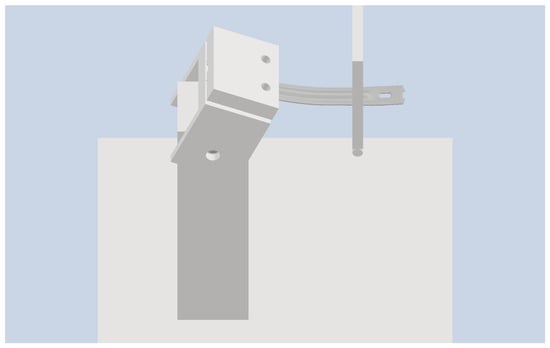
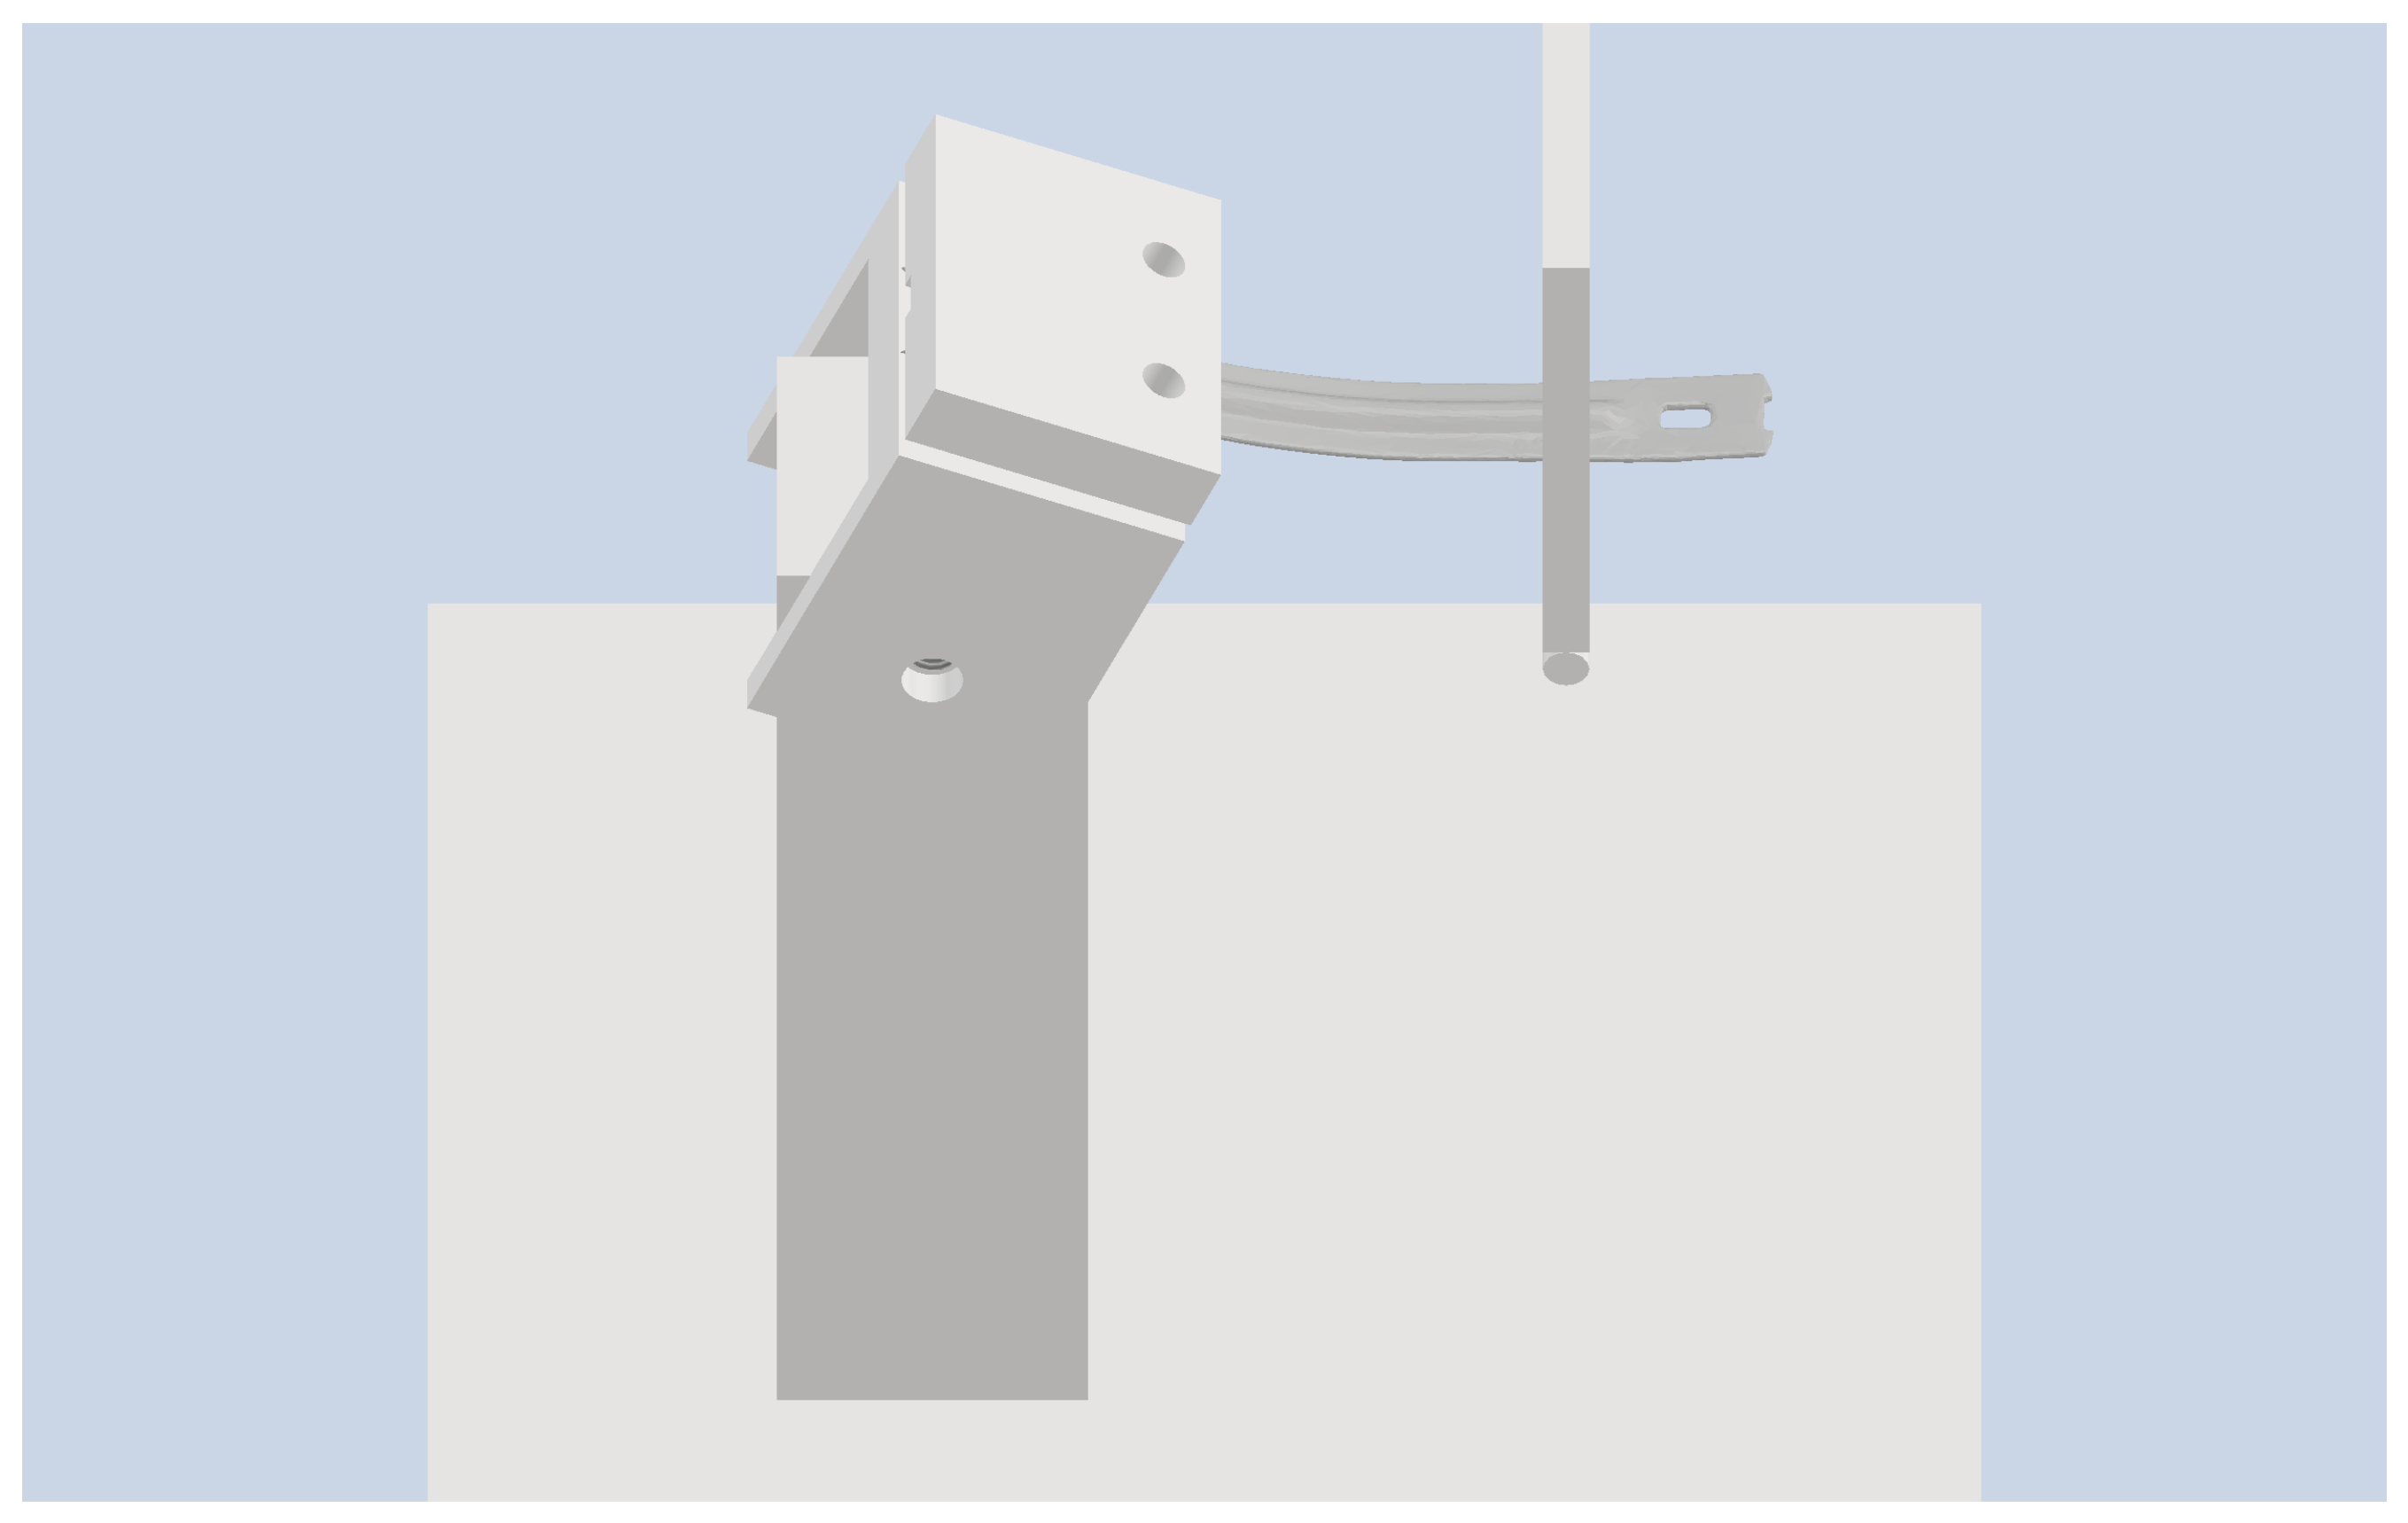
In the numerical simulation of the present work, the load was instead applied by means of a punch on a universal testing machine. While this adaptation deviates from the original suspended-weight configuration, it was applied identically to both the C60 and DP1000 models, so that any influence of the loading method on the absolute force–displacement response is expected to affect both materials comparably, preserving the validity of the relative comparison between them. Future experimental validation is planned to confirm the absolute magnitude of the results. A conceptual design of the testing apparatus is presented in Figure 2. To consistently represent the test configuration described, an additional geometry was modelled to depict the punch to be used in future experimental tests.
Figure 2.
Concept for an experimental test rig inspired by the SATRA TM58 method. In this case, the punch acting on the shoe shank is controlled using a universal testing machine.
2.2.2. Definition of Boundary Conditions
To reduce computational cost, a decision was made to use only half of the geometry in the numerical simulation. This is justified by the symmetric nature of the specimen geometry, loading configuration, and support conditions with respect to the longitudinal mid-plane of the shoe shank. No asymmetric geometric features, loads, or boundary conditions were present that would compromise this simplification’s validity. At the symmetry plane, out-of-plane displacement and in-plane rotations were constrained to zero. This approach reduces computational cost without affecting the accuracy of the simulated response, and was applied identically to both the C60 and DP1000 models, ensuring that the relative comparison between the two solutions remains unaffected by this modelling choice.
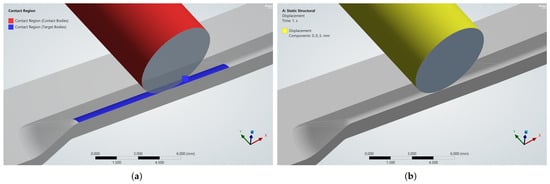
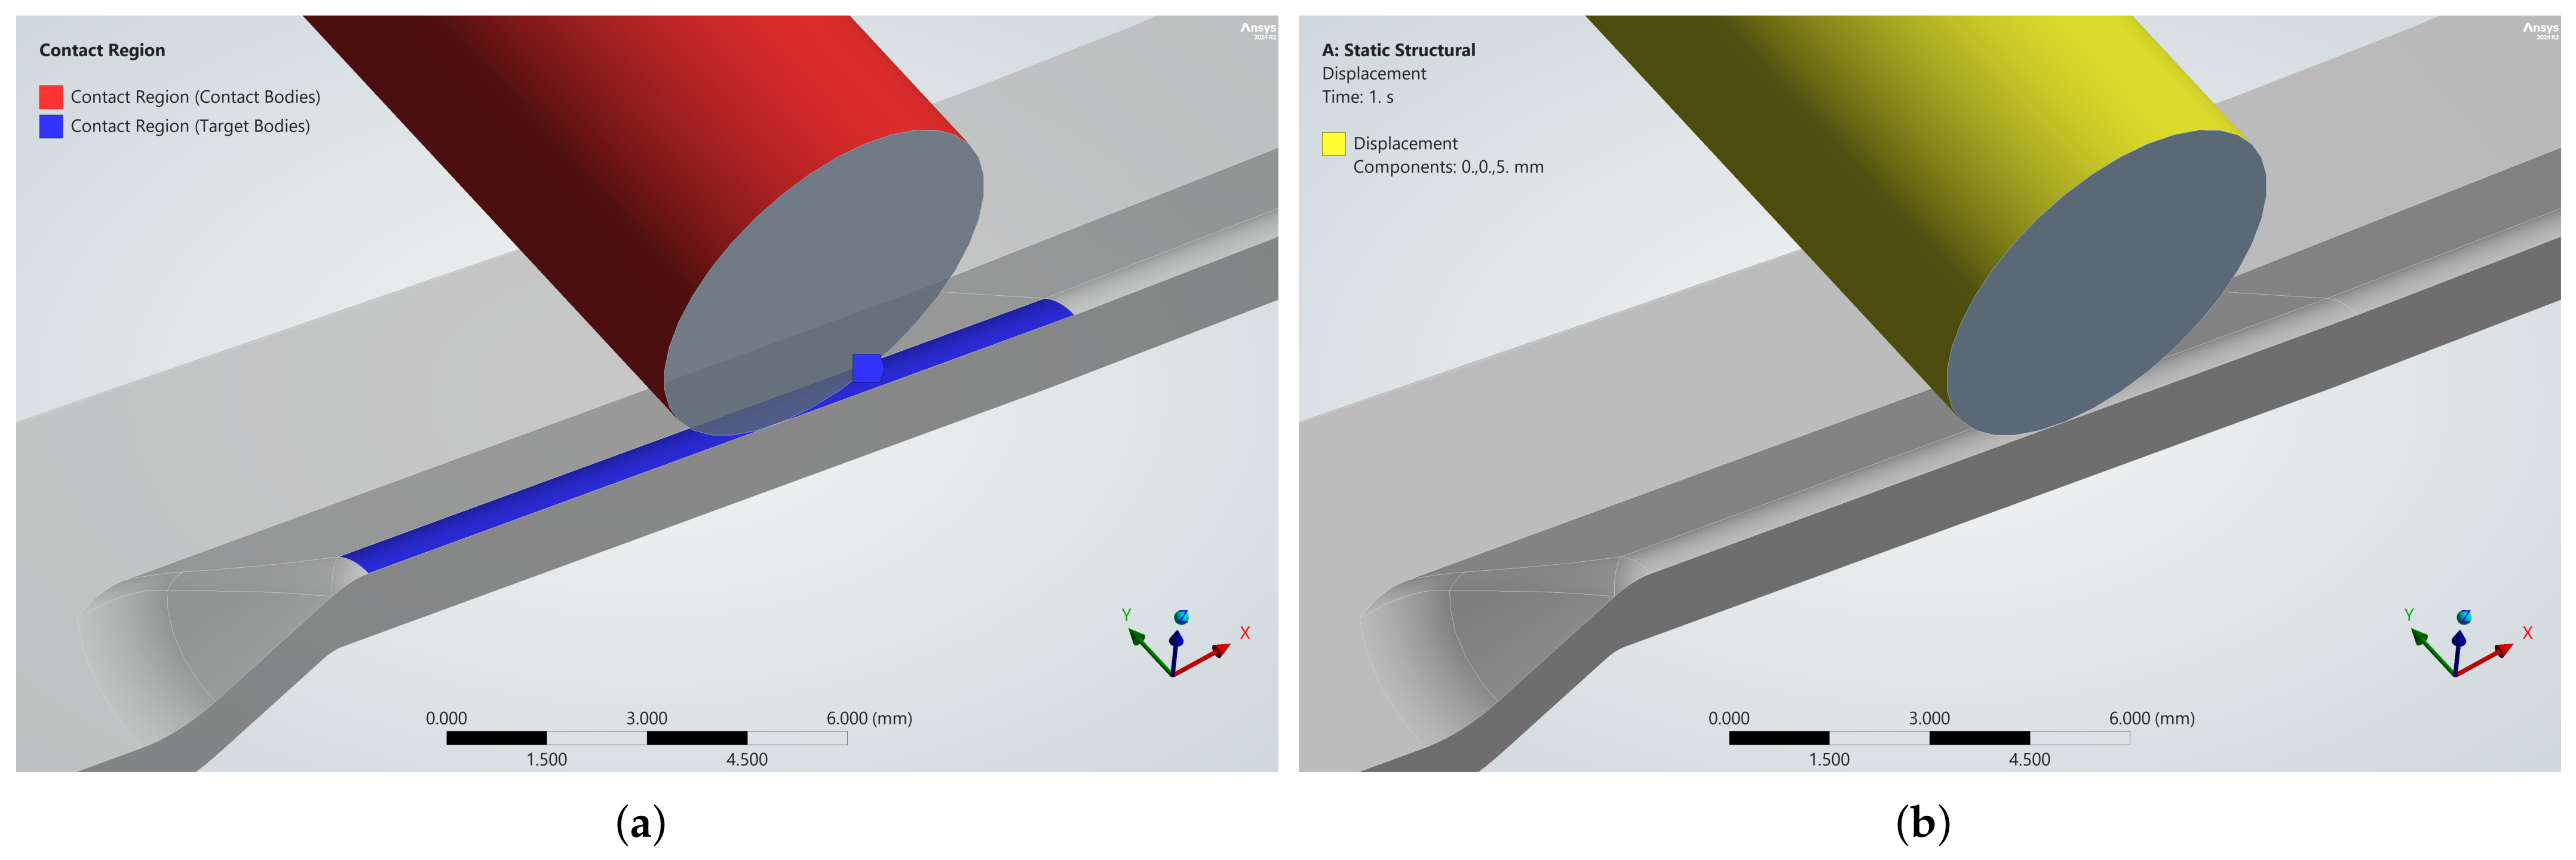
At a predefined distance from the free end, frictional contact was established between the punch and the shoe shank, with a friction coefficient of 0.2, representing a typical value for steel-on-steel sliding contact under dry or lightly lubricated conditions. Given that the actual friction behaviour at the loading interface was not experimentally characterised, this value should be regarded as a reasonable estimate rather than a measured parameter. However, since the same friction coefficient was applied consistently to both the C60 and DP1000 models, its influence on the absolute force–displacement response is expected to affect both models in a similar manner.
A displacement of sufficient magnitude was applied to the punch so that the shoe shank reached the material’s tensile strength. The direction of punch displacement is normal to the face of the shoe shank at the onset of contact. Both boundary conditions are illustrated in Figure 3.
Figure 3.
Boundary conditions applied to the punch: (a) The region of frictional contact between the punch and the shoe shank; (b) identification of the displacement applied to the punch.
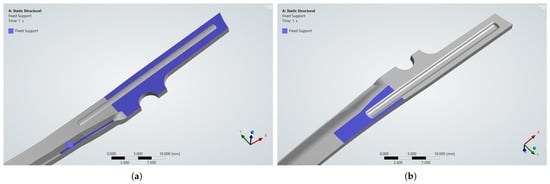
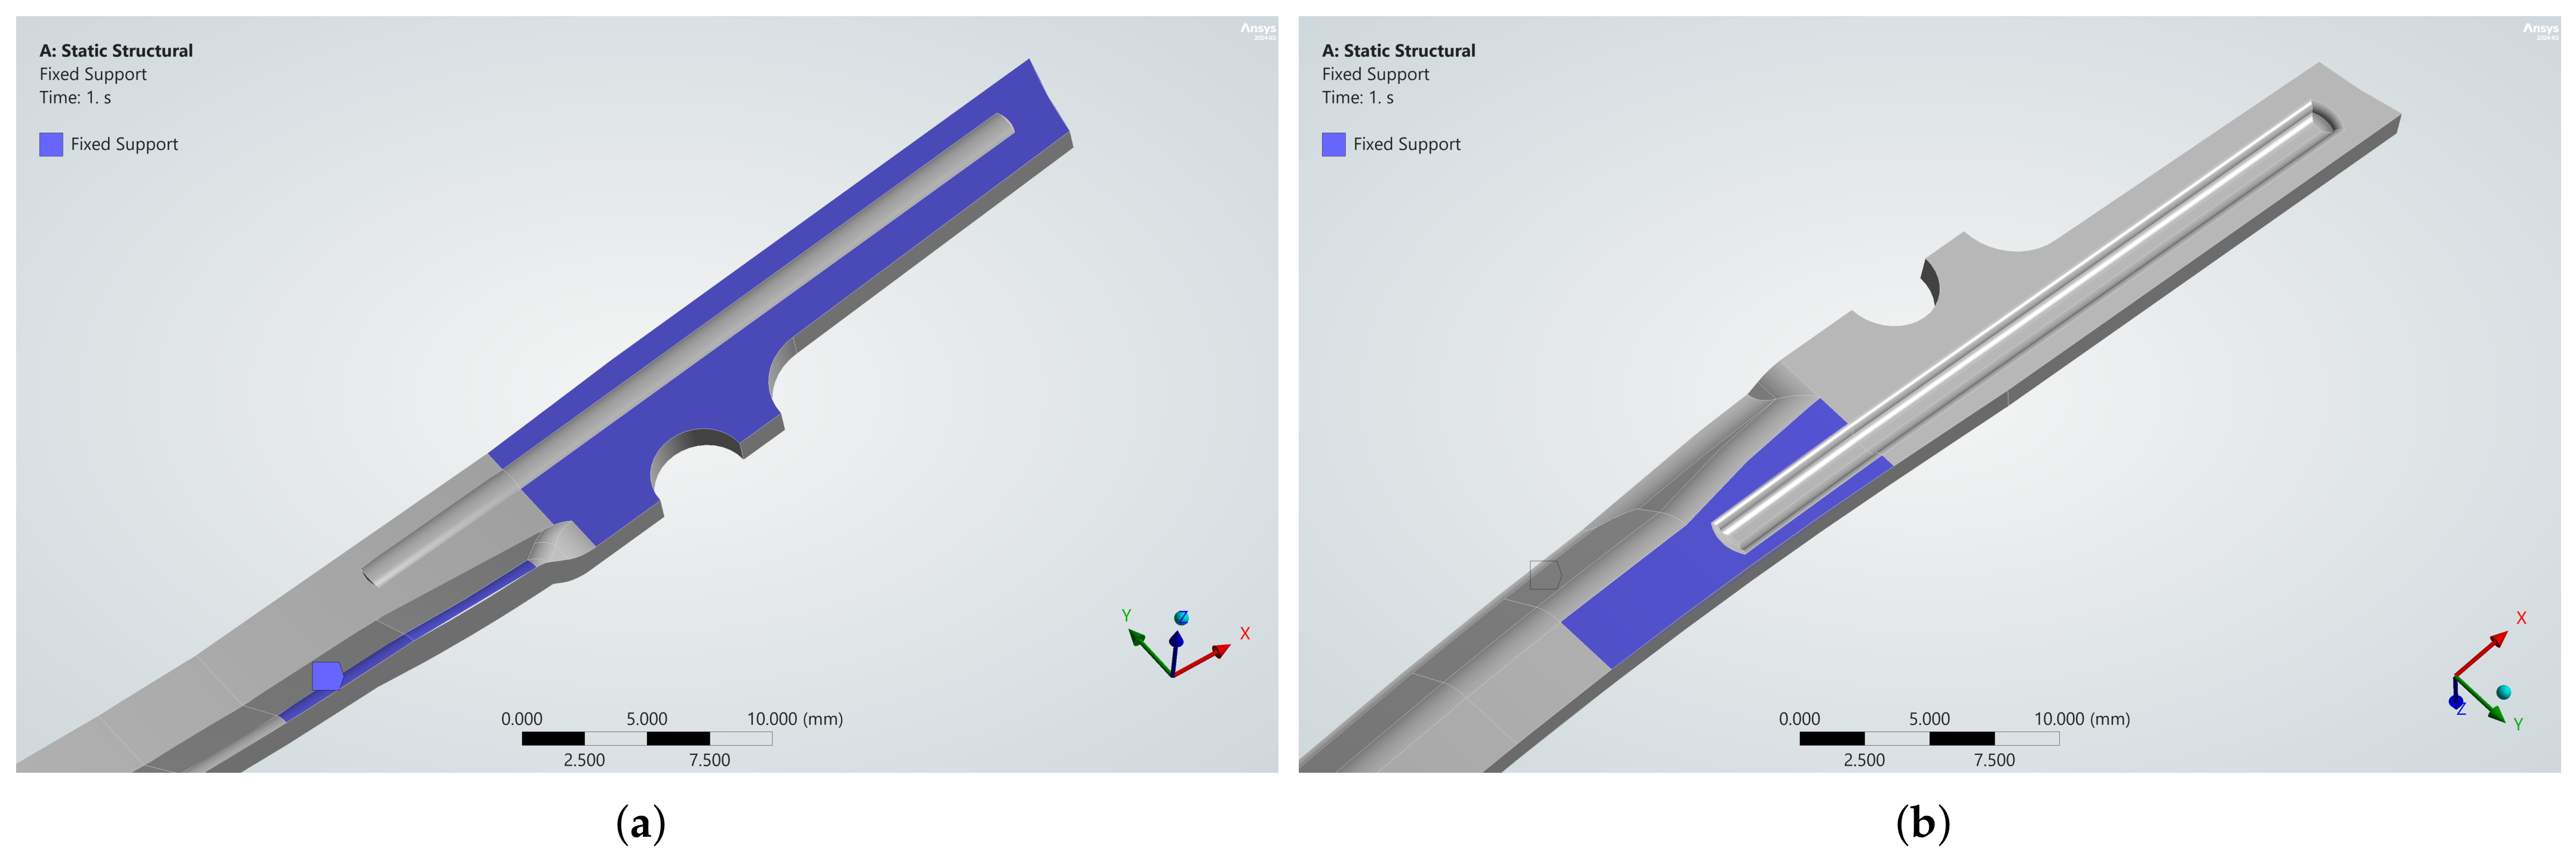
At the other end of the specimen, certain faces of the geometry were selected, and fixed supports were applied to represent the fixed-end condition of the experimental test. The stiffness introduced by this type of support provides a reasonable approximation of the proposed test configuration shown in Figure 2. Since the shoe shank is secured by clamping it between two plates with bolts, its curvature determines which faces are in contact. Assigning the “fixed support” condition to these faces is consistent with the clamping arrangement described, as no significant slippage is expected. The faces selected for the application of this boundary condition are shown in Figure 4.
Figure 4.
Faces selected for the application of the fixed support conditions: (a) Three faces on the front of the shoe shank; (b) one face at its back.
Finally, it is also worth mentioning that because the punch displacement is large and the model exhibits a nonlinear response, it is necessary to control certain solver parameters to ensure convergence. To this end, “Auto Time Stepping” was set to “On”, with 55 “Initial Substeps”, 15 “Minimum Substeps”, and 750 “Maximum Substeps”. Furthermore, “Large Deflection” mode was also set to “On”. The Force Convergence plot obtained during the simulation confirmed that no issues occurred.
2.2.3. Definition of the Numerical Model Mesh
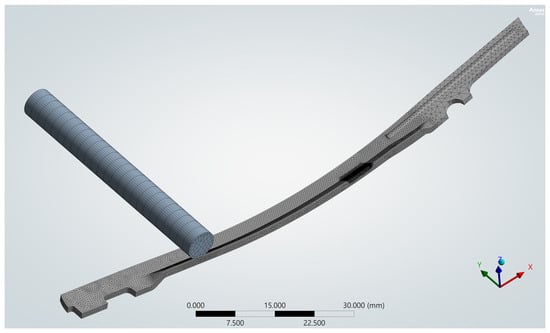
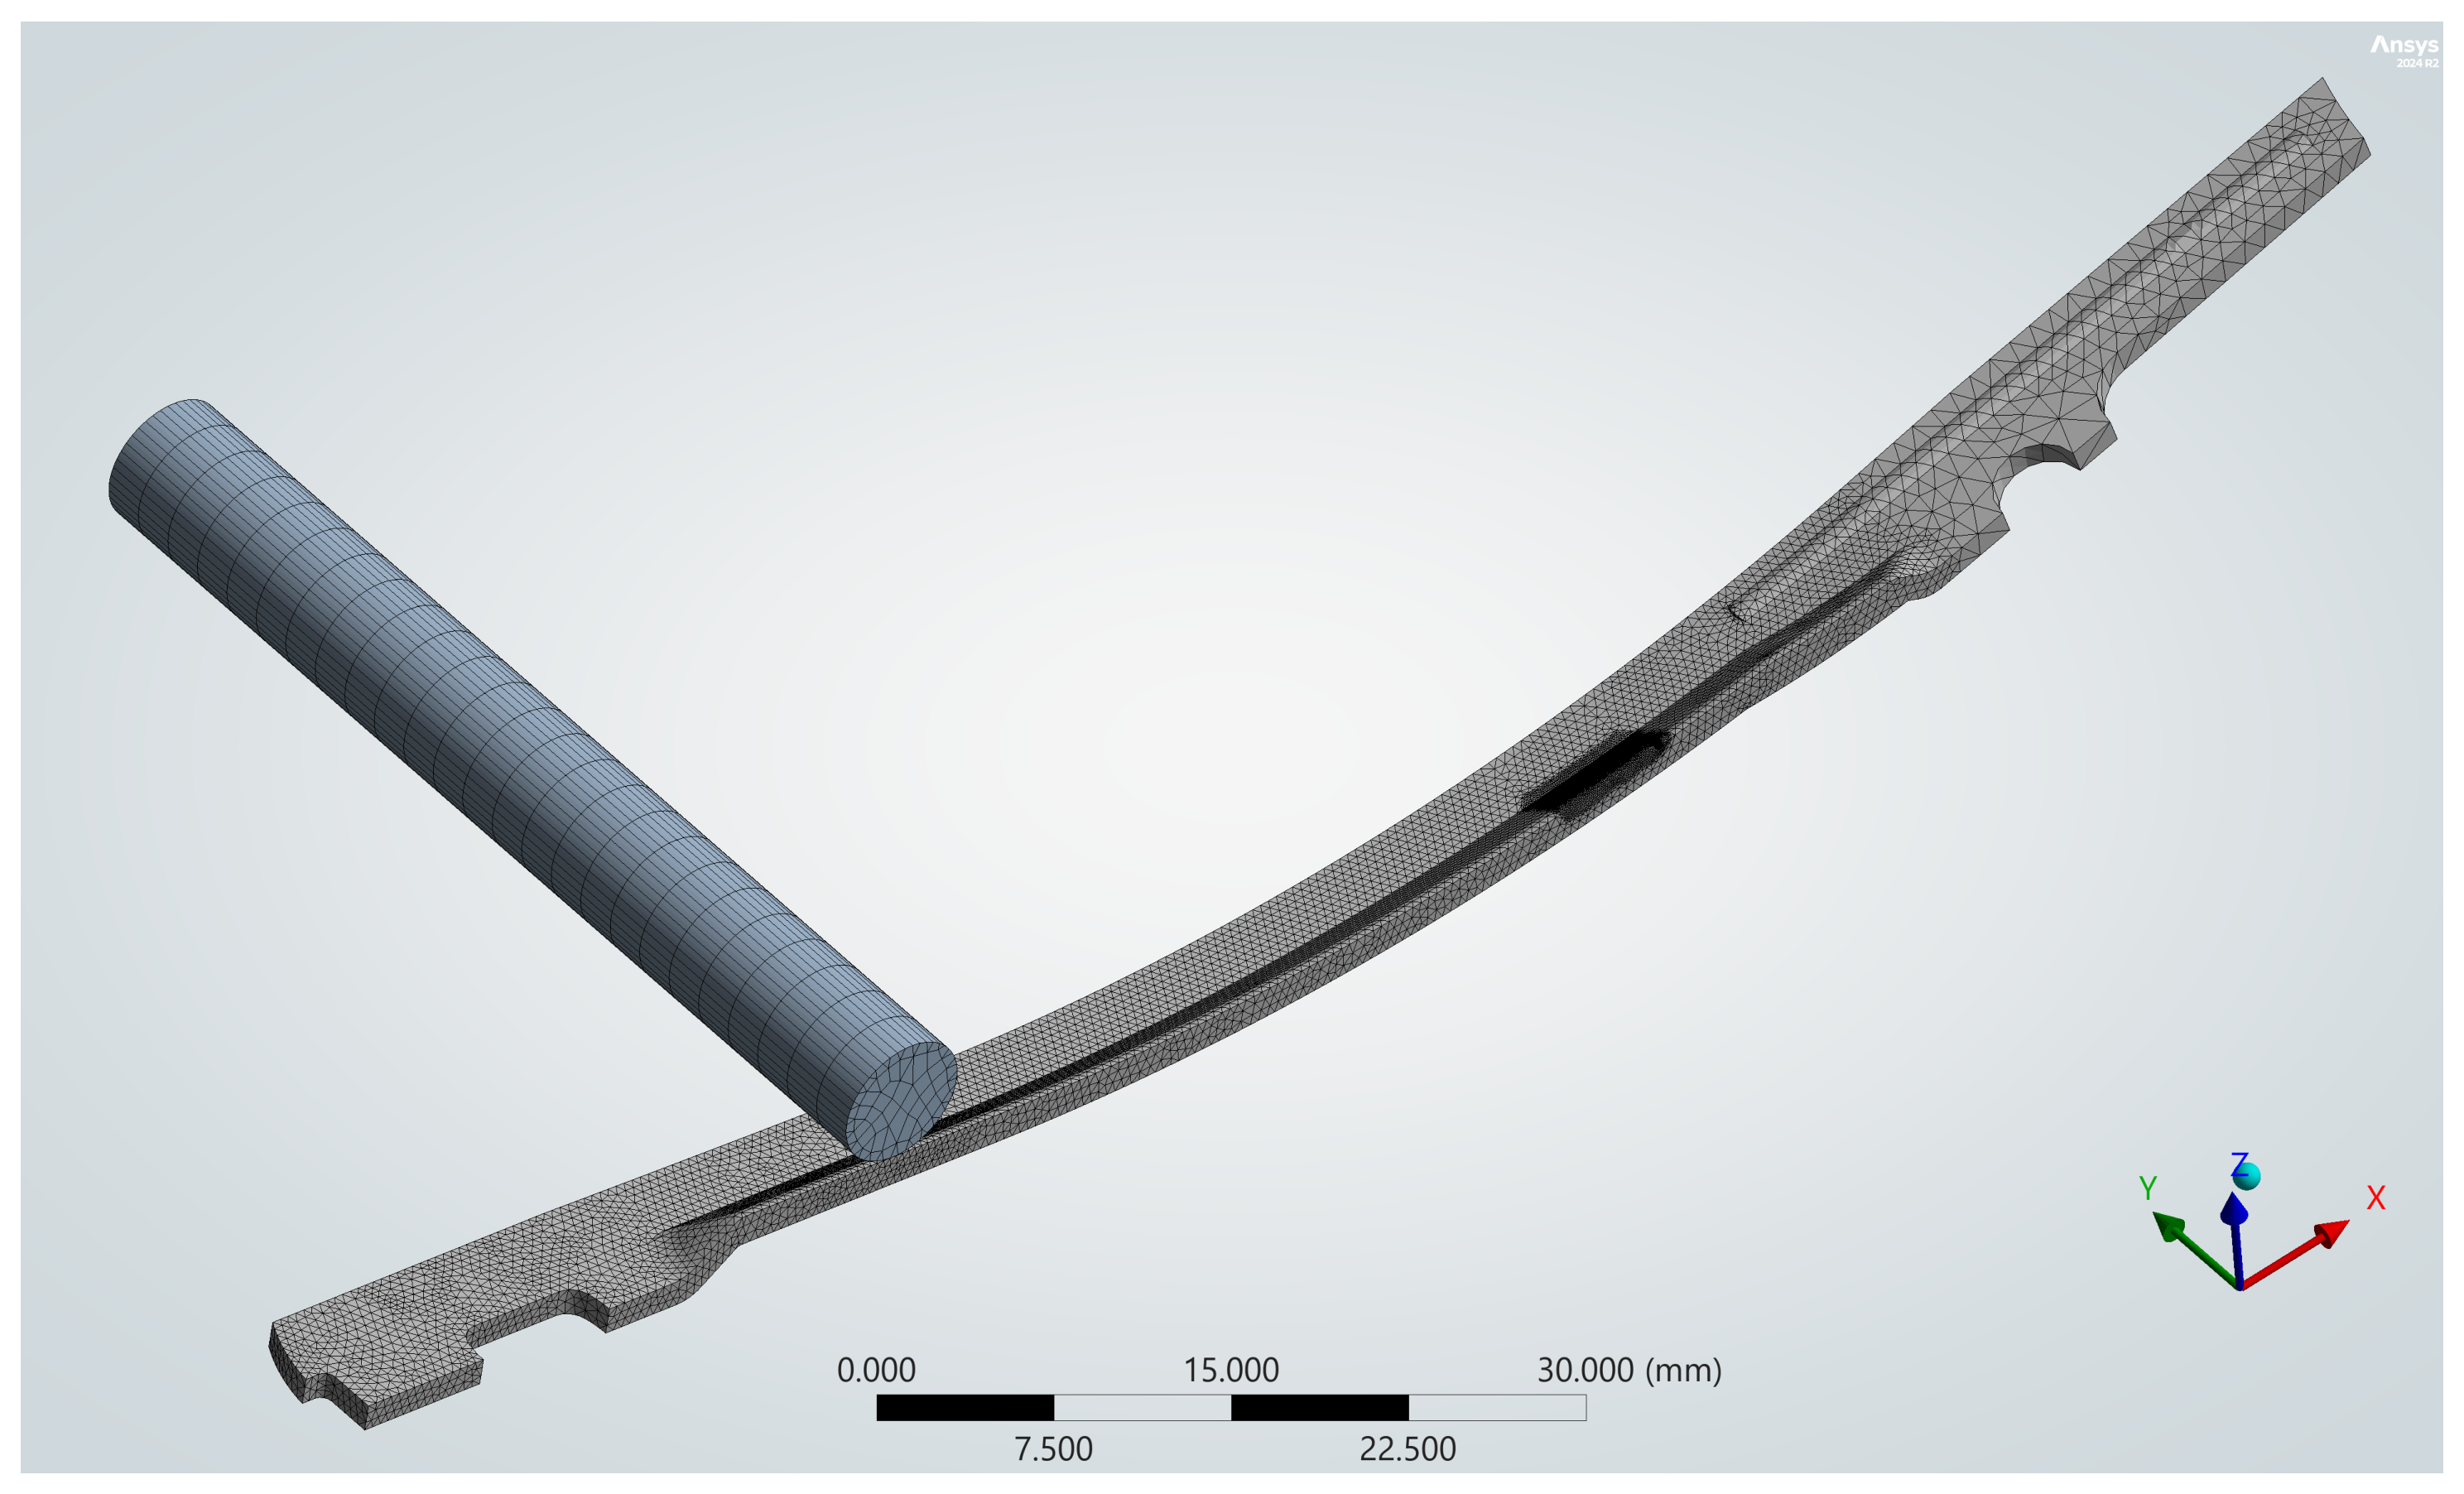
To ensure the suitability of the model mesh used in the numerical simulation, it was necessary to adjust certain parameters. Starting from a default mesh automatically generated by the software, the “Physics Preference” and “Element Order” parameters were set to “Nonlinear Mechanical” and “Quadratic”, respectively. It was then ensured that there were at least three elements across the thinnest part of the shoe shank, along with a balanced mesh at the punch (which is responsible for imparting displacement, but whose deformation is irrelevant to the study). Contact sizing was also applied to the punch/shoe shank contact zone following a solver warning indicating severe element distortion in that area. Figure 5 shows the model discretised according to the mesh described.
Figure 5.
Initial mesh of the system under study. It can be seen that a higher density of elements has been introduced in the areas of interest in order to obtain reliable results.
To ensure that the solution is independent of the mesh discretisation, a convergence study was carried out to determine the point at which further mesh refinement leads to the stabilisation of parameters such as stress and plastic strain.
To this end, a displacement was applied to the punch so that the shoe shank deforms within its plastic domain, i.e., within a range between the yield strength and the tensile strength.
Due to artificially high stress at the edge bounding the fixed boundary condition, the convergence study was carried out by monitoring stress and plastic deformation at a node located 0.5 mm from that edge. This stress concentration arises not only from the discontinuity introduced by the boundary condition, but also from limitations of the constitutive model used to describe the steels. In fact, the stress in the material is not limited to the tensile strength and may increase indefinitely along the line with a slope defined by the tangent modulus. This can be seen in more detail in Section 2.2.4 [22].
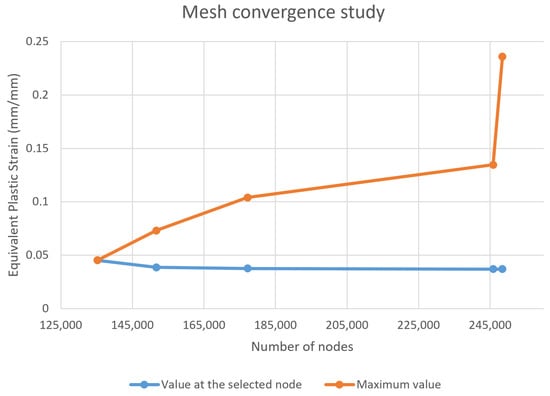
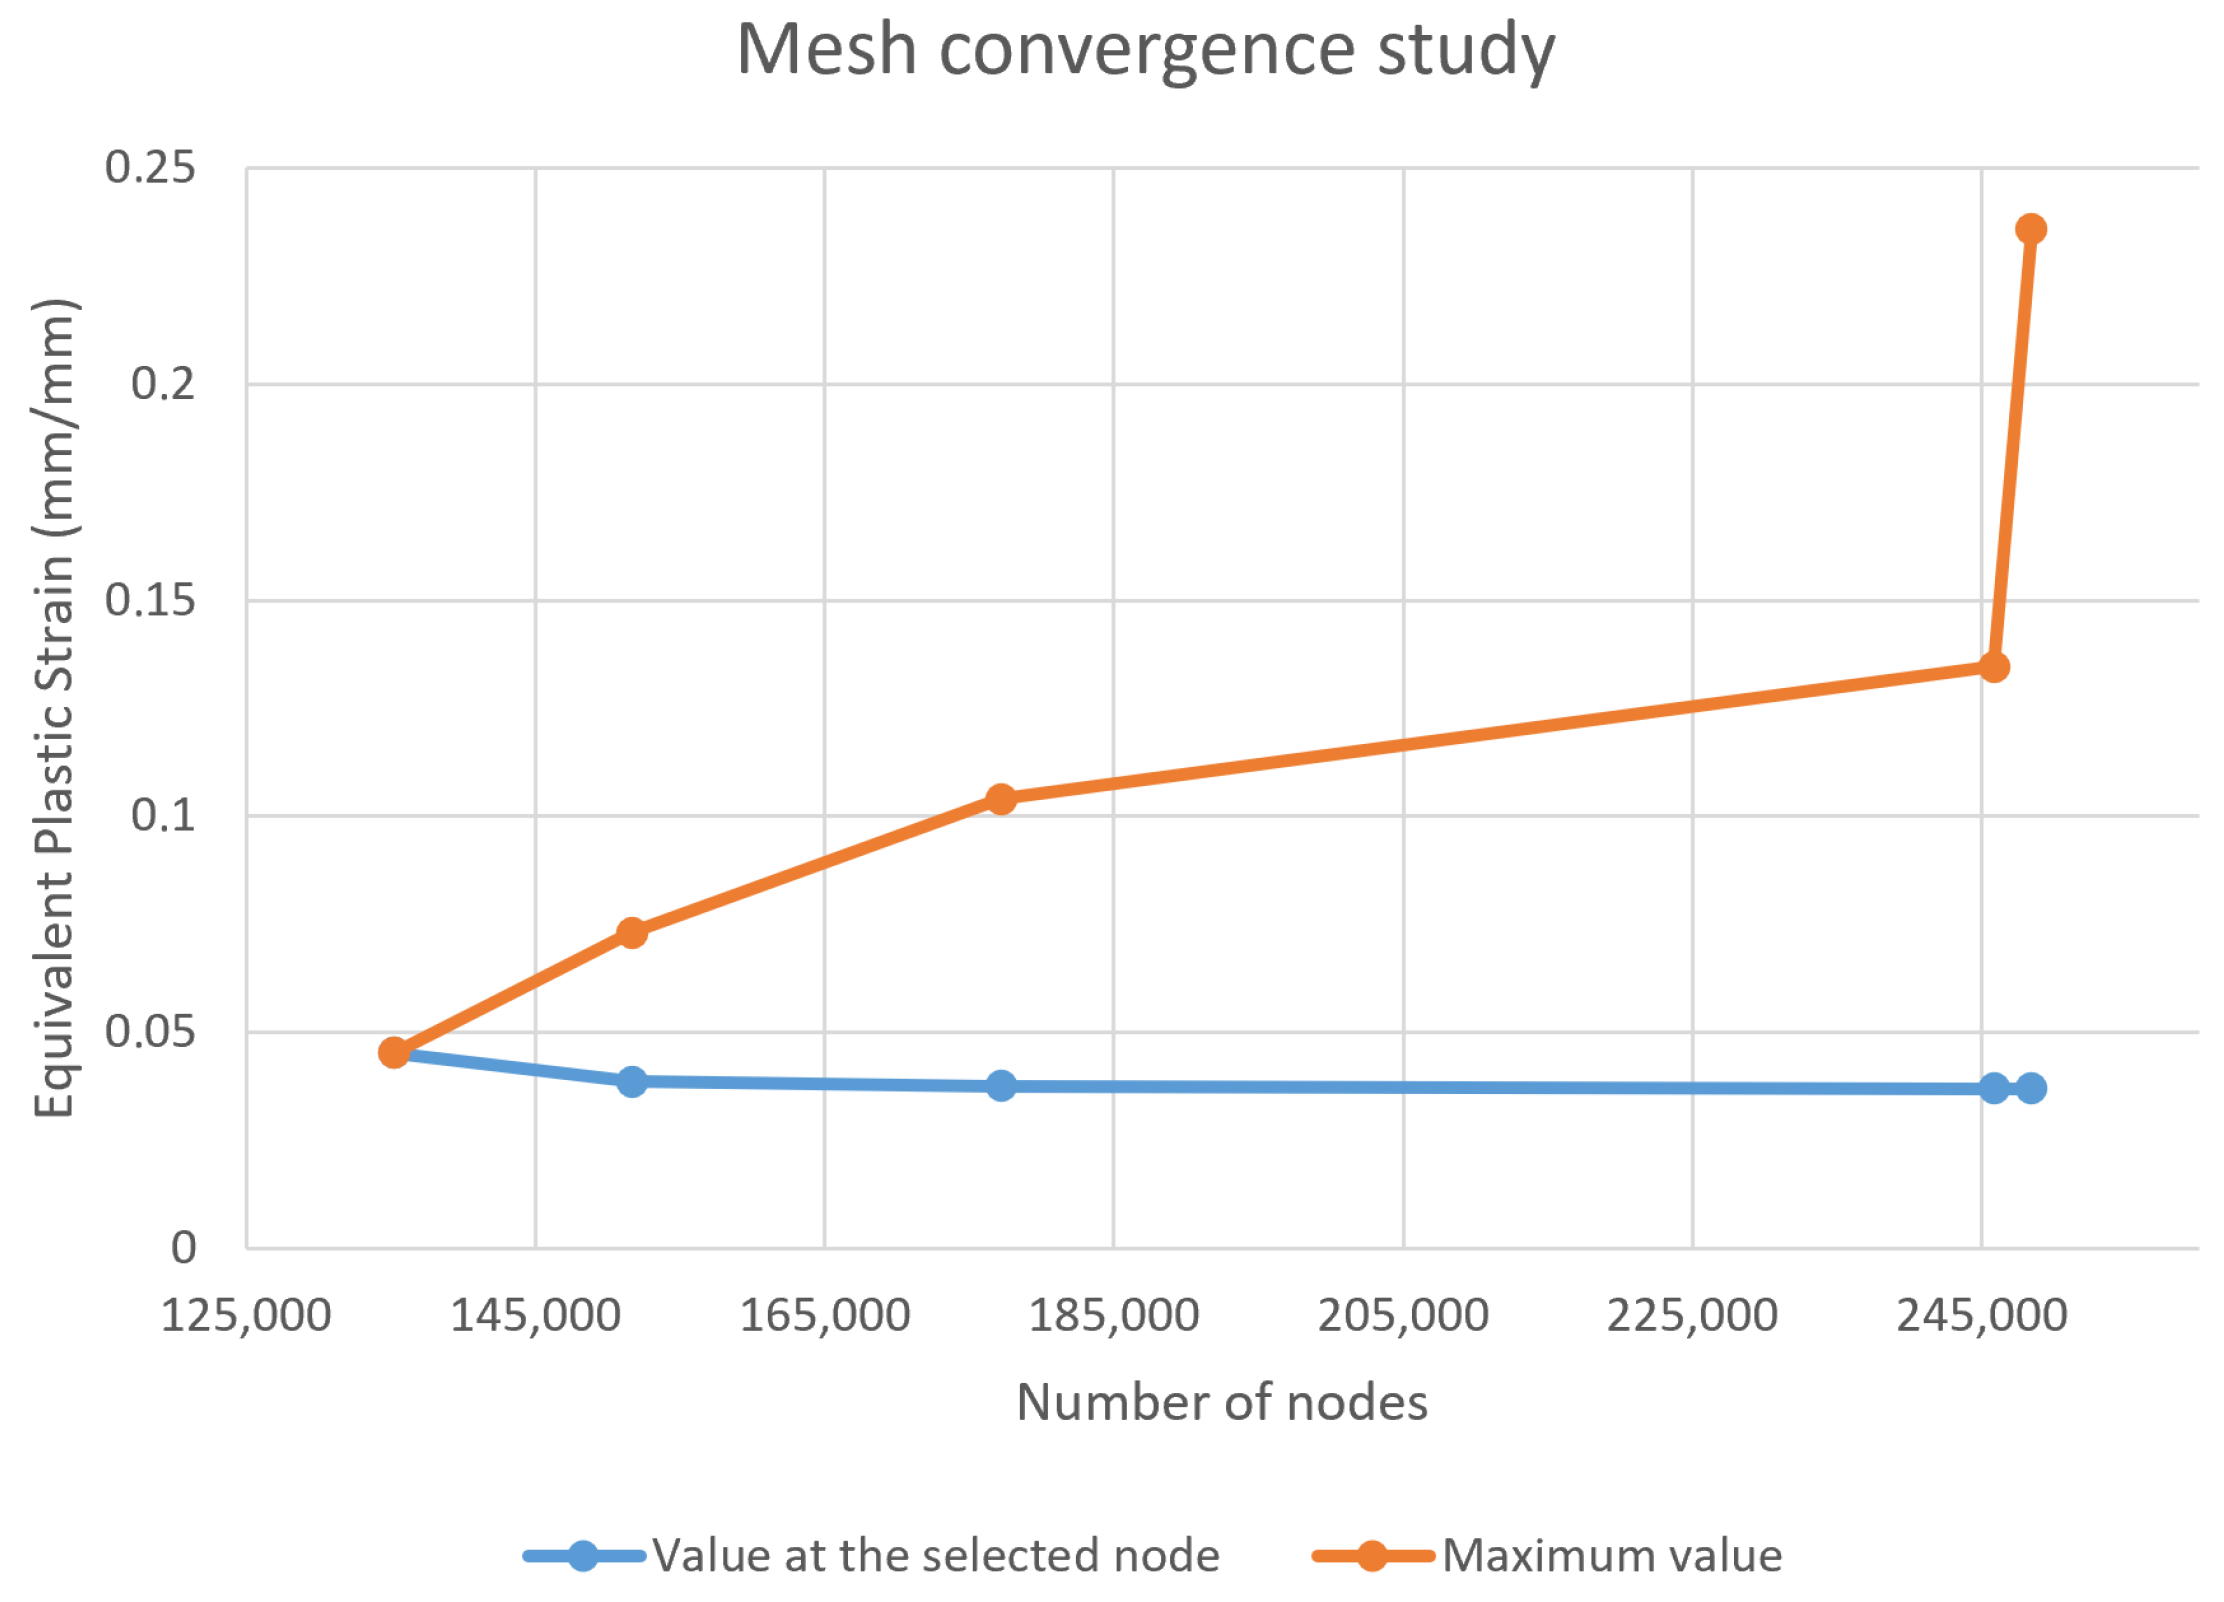
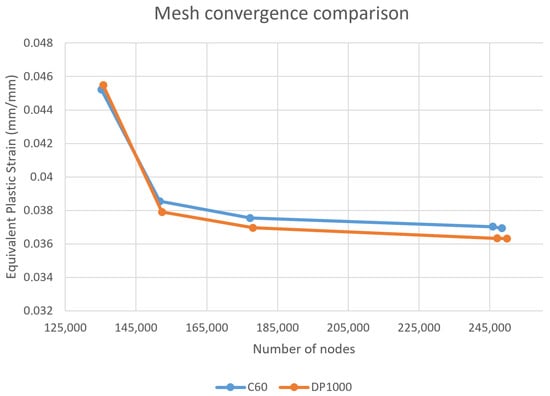
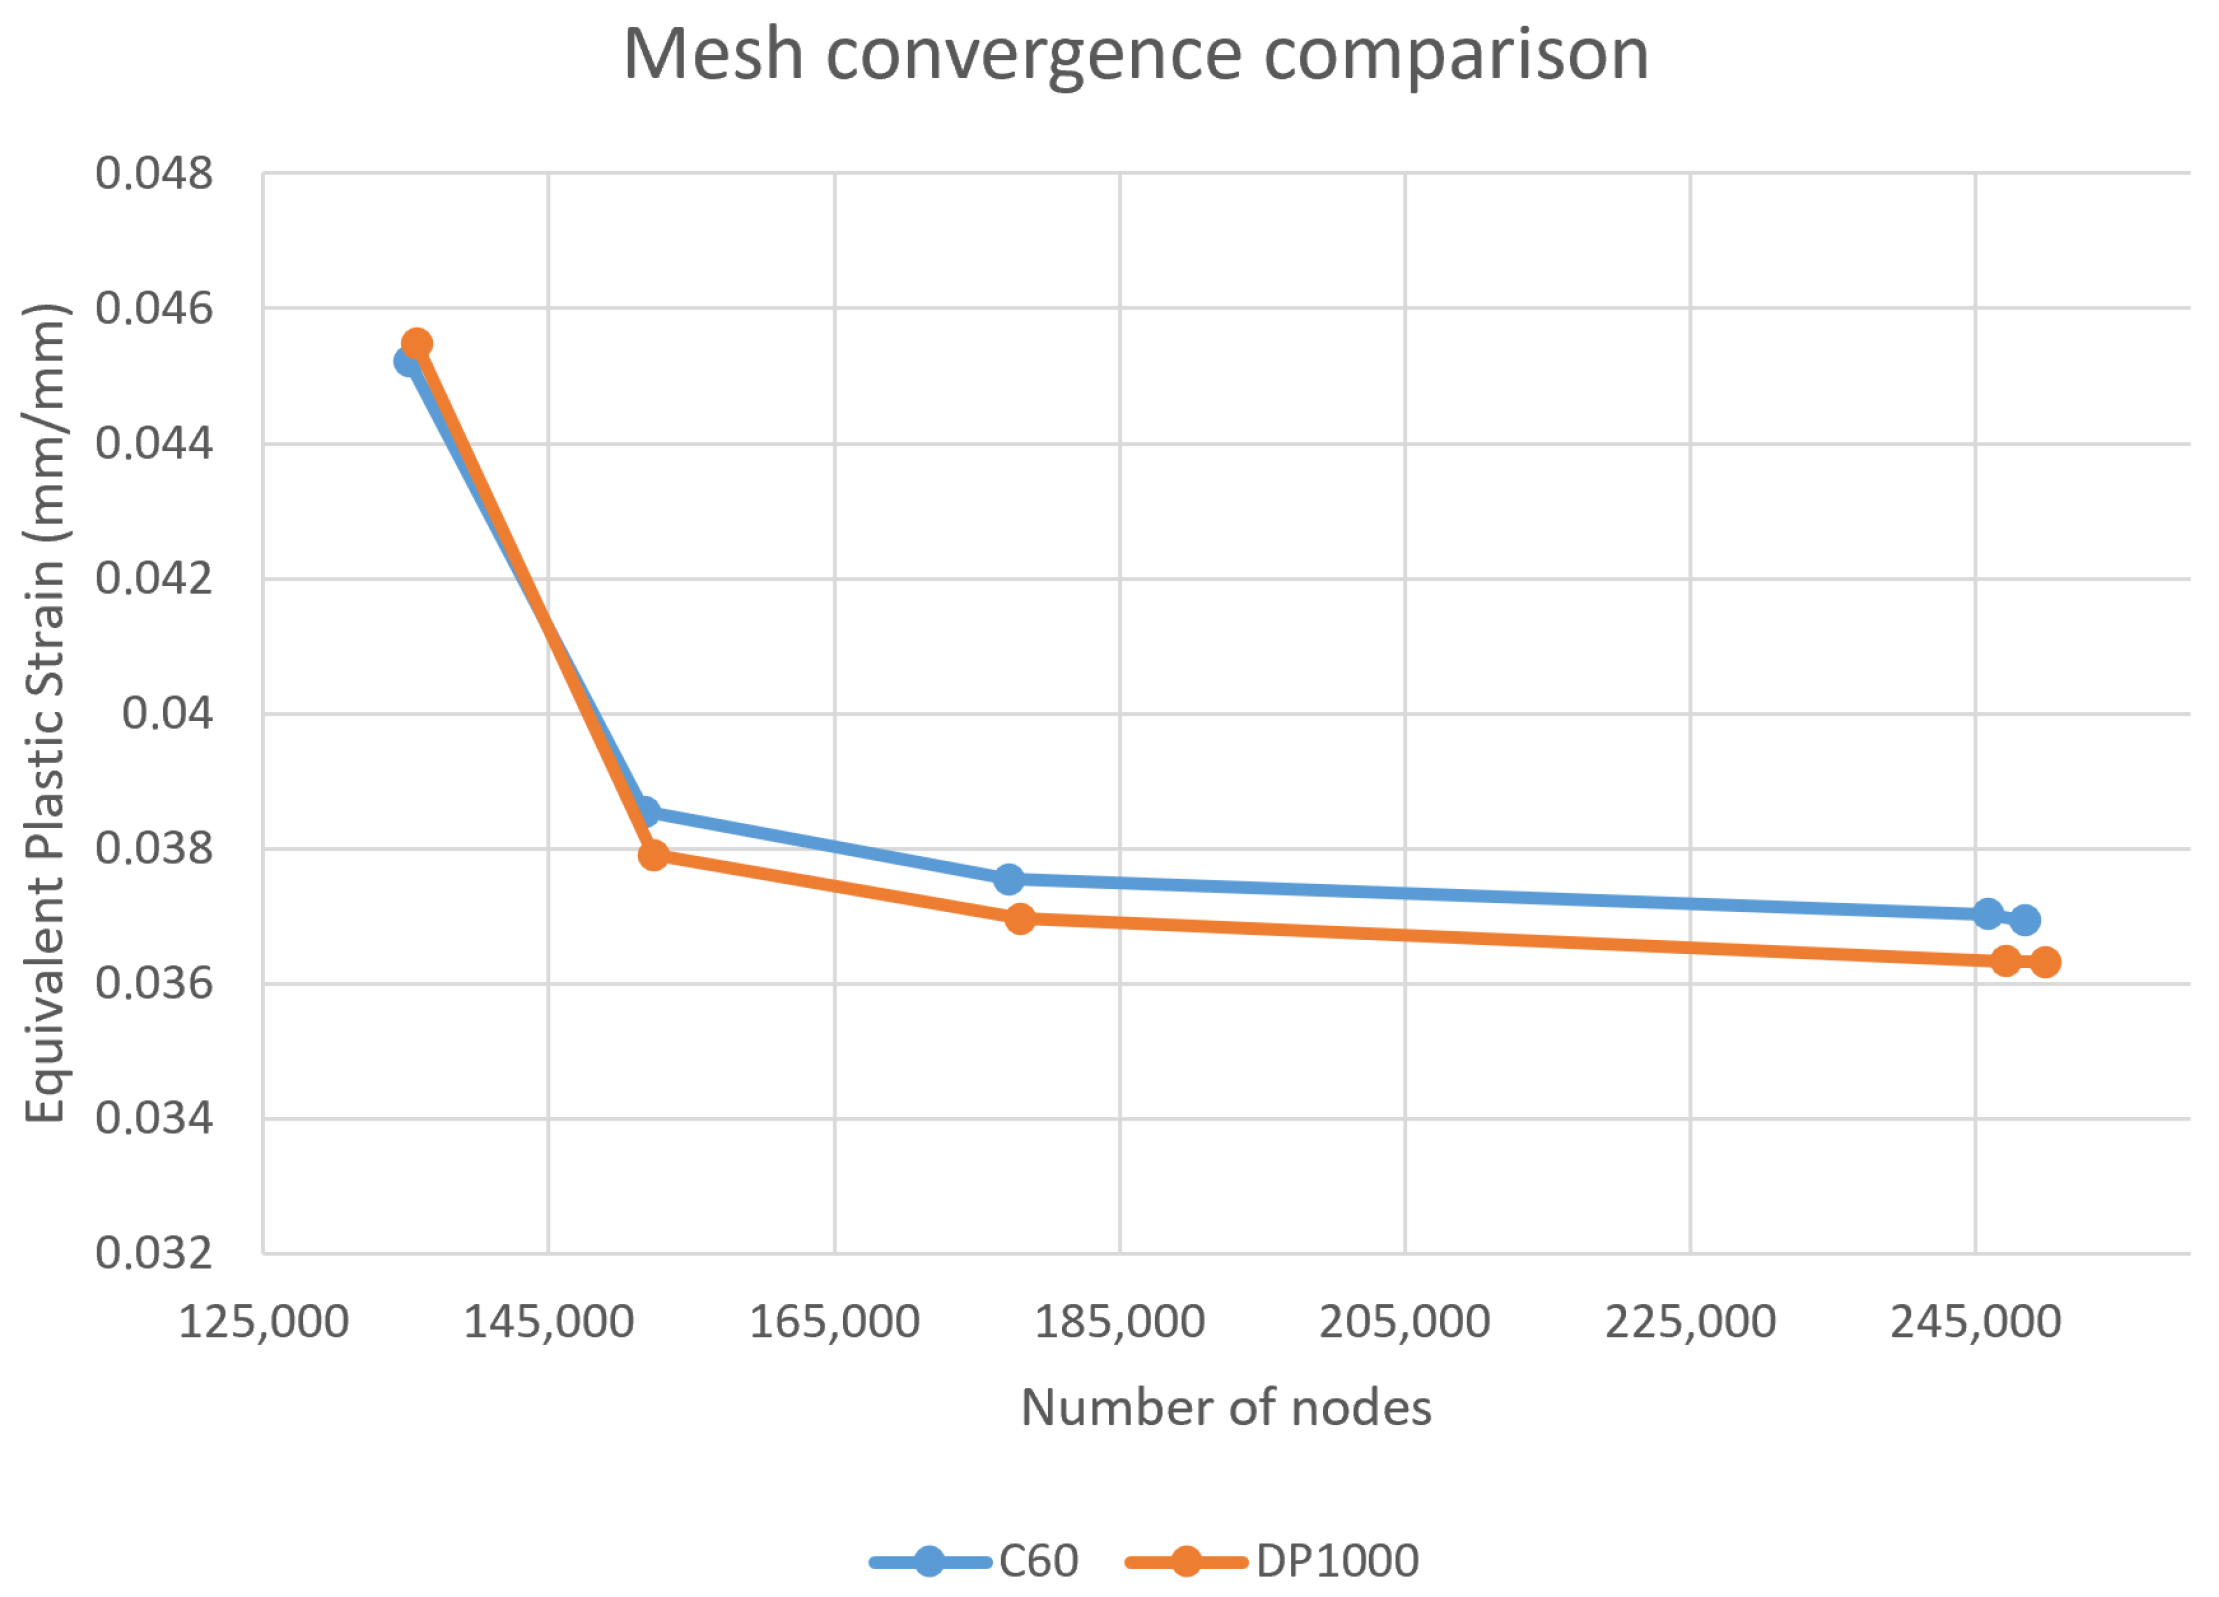
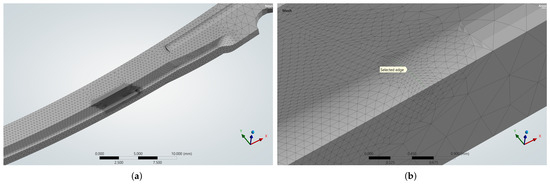
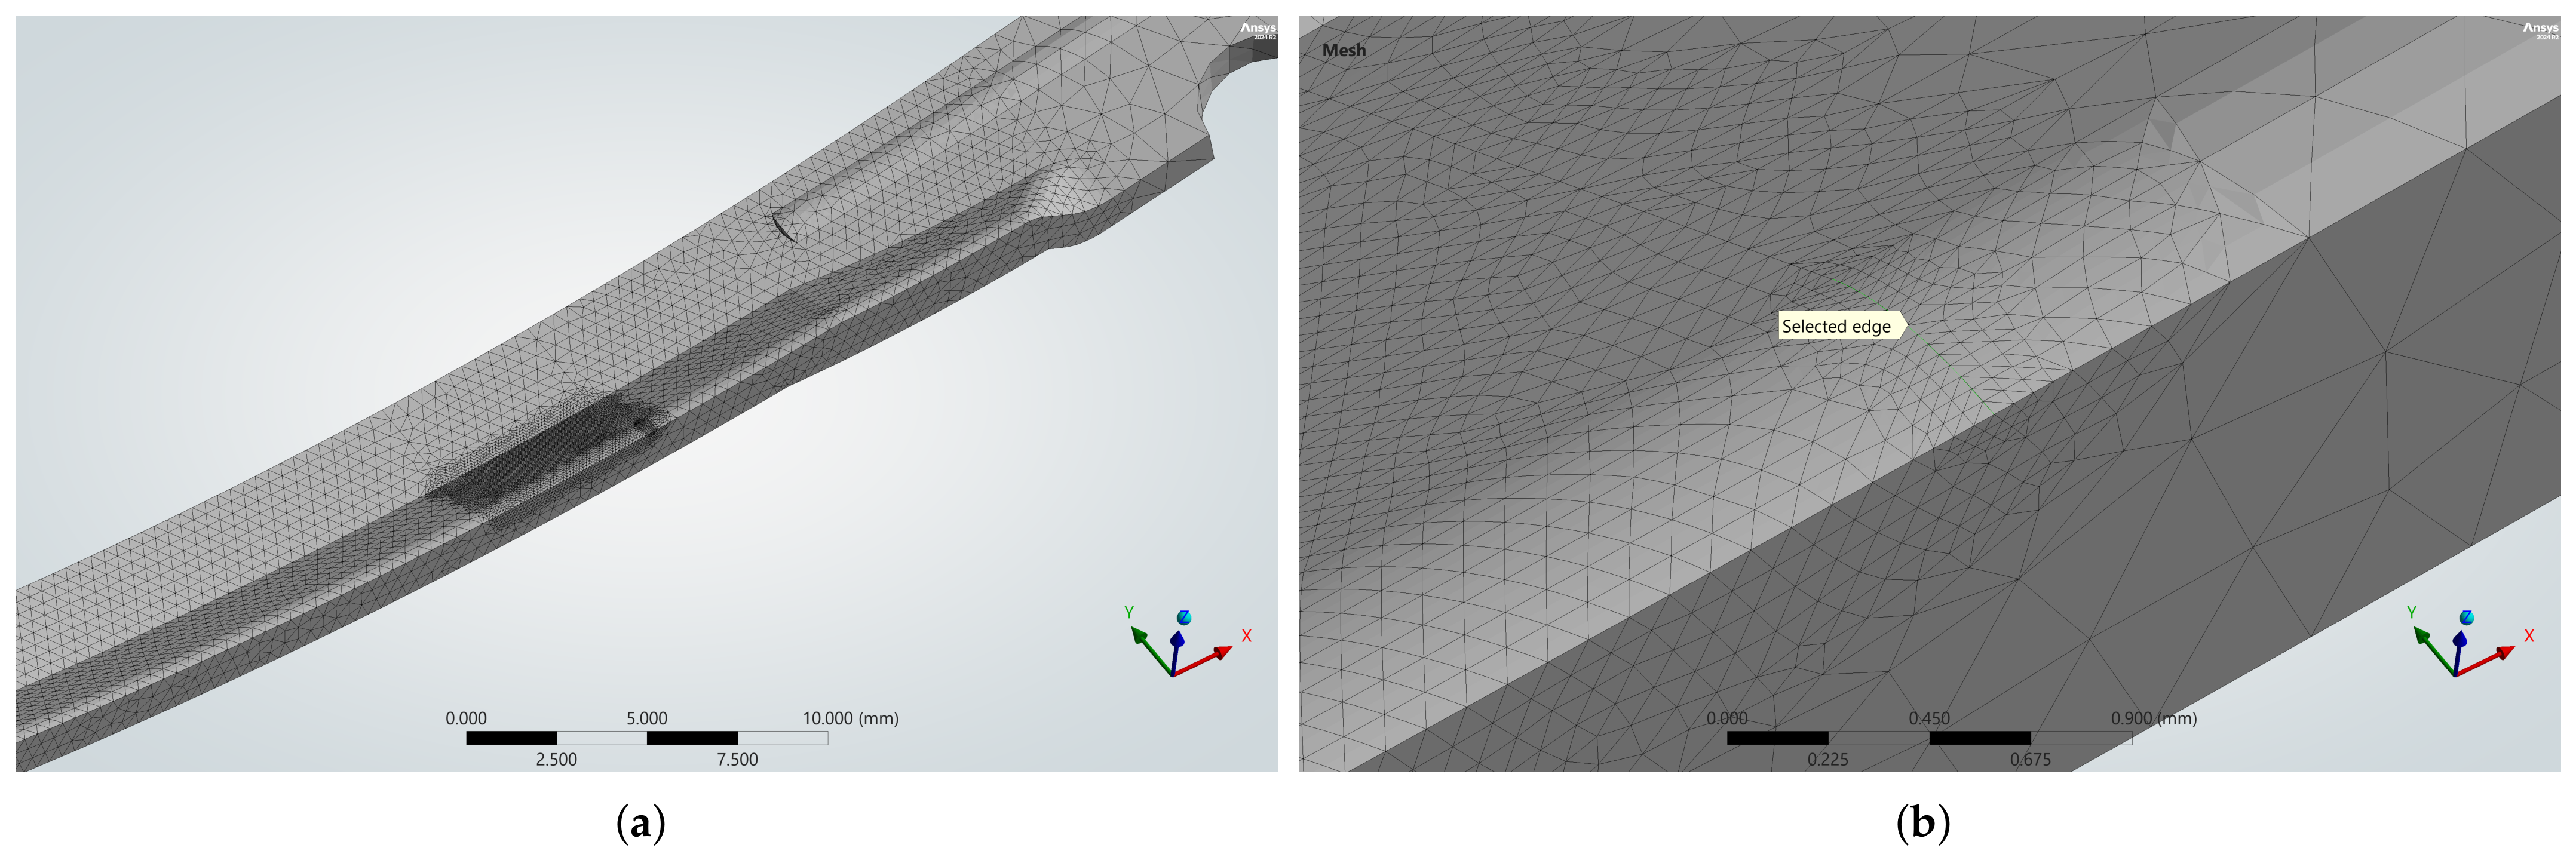
Table 2 shows the results obtained for each refinement step, with the punch displacement held constant at 5 mm. Figure 6 further shows that the Equivalent Plastic Strain (EPS) value tends to converge as the number of elements increases through mesh refinement, while Figure 7 shows a similar trend in the stress developed at the selected node, confirming mesh convergence for both steels. Refinements 1, 2, and 3 were applied to the two faces of interest where maximum stress and strain values were observed, while refinement 4 was applied to the edge at the boundary of the fixed support condition. Details of these refinements are shown in Figure 8.
Table 2.
Results obtained for each of the mesh refinement iterations. This study was carried out on the shoe shank using the material model for C60 steel.
Figure 6.
EPS values obtained as a function of the increase in the number of model nodes in the area of interest. It can be seen that whilst the values at the selected node evolve asymptotically, the maximum values tend to diverge, confirming the singularity at the edge located at the fixed boundary condition.
Figure 7.
Results of the mesh convergence analysis for both steels. The similar curves reveal the validity of the study.
Figure 8.
Areas of interest where refinements were applied: (a) Two faces, in the vicinity of the fixed boundary condition (refinements 1, 2 and 3); (b) an edge coinciding with the aforementioned boundary condition (refinement 4).
Taking into account the type of analysis and the limitations on computing power, a difference of less than 3% between successive refinements was established as an acceptable convergence criterion. This criterion was applied to both the Equivalent Stress and EPS values at the node, with the latter proving harder to satisfy. Table 3 shows the percentage differences between successive refinements in the area of interest of the shoe shank.
Table 3.
Percentage differences in Equiv. Stress and Equiv. Plastic Strain observed between each of the mesh refinements.
The results show that convergence occurs more rapidly for the Equivalent Stress than for the EPS. It should be noted that the very small variation observed in the final refinement is due to the fact, as already mentioned, that it was applied to the edge at the fixed boundary condition rather than to the two faces of interest. The purpose of this refinement was, in fact, to assess the effect of stress concentration in that edge region, as shown by the values reported in Table 2.
The convergence criterion of a difference of less than 3% is met at the second refinement; the mesh selected to run the simulations for both solutions was therefore defined according to these specifications.
2.2.4. Definition of the Material Properties of the Steels
To assess the performance of the shoe shank made from each of the two steel types, a numerical simulation in the elastoplastic domain was carried out. This is because, although both steels share the same elastic modulus, they exhibit substantially different yield strengths and work-hardening behaviour, which only manifest beyond the elastic limit. To ensure that the same conditions and assumptions were maintained across the simulations for each steel solution, it was decided to define not only the linear elastic properties but also the plasticity through the bilinear isotropic hardening model. This was partly necessary due to the need to use literature data to model the C60 steel [17,23].
To define these models, it is essential to determine the tangent modulus, which reflects the behaviour of the steel after yield. Whilst experimental data were used directly for the DP1000 steel [24], the C60 steel definition was based on other literature sources. First, it was necessary to convert its mechanical property values (normally determined from engineering stress–strain data) into true values (accounting for the effective reduction in the cross-sectional area of the test specimen). To this end, Equations (1), (2) and (3) were applied to calculate the true yield stress, engineering yield strain, and true tensile strength, respectively:
where E is Young’s modulus, in GPa, and Z is the reduction in cross-sectional area at fracture, in %.
The tangent modulus is then determined by considering only the plastic deformation, calculated using Equations (4) and (5):
Finally, the tangent modulus can be calculated using Equation (6):
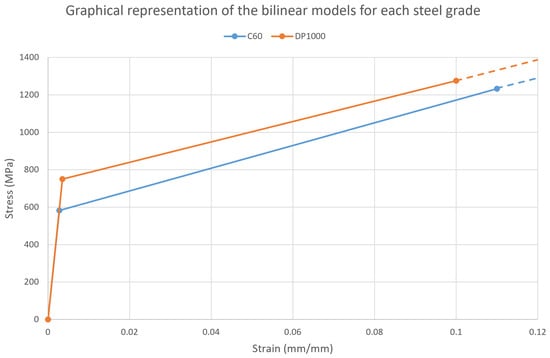
Table 4 summarises the material property values defined as inputs in the software, as well as other additional properties used in their calculation. Figure 9 shows the stress–strain curves for each steel, based on the properties mentioned above.
Table 4.
Summary of the most relevant mechanical properties of the two types of steel for their parameterization in the software.
Figure 9.
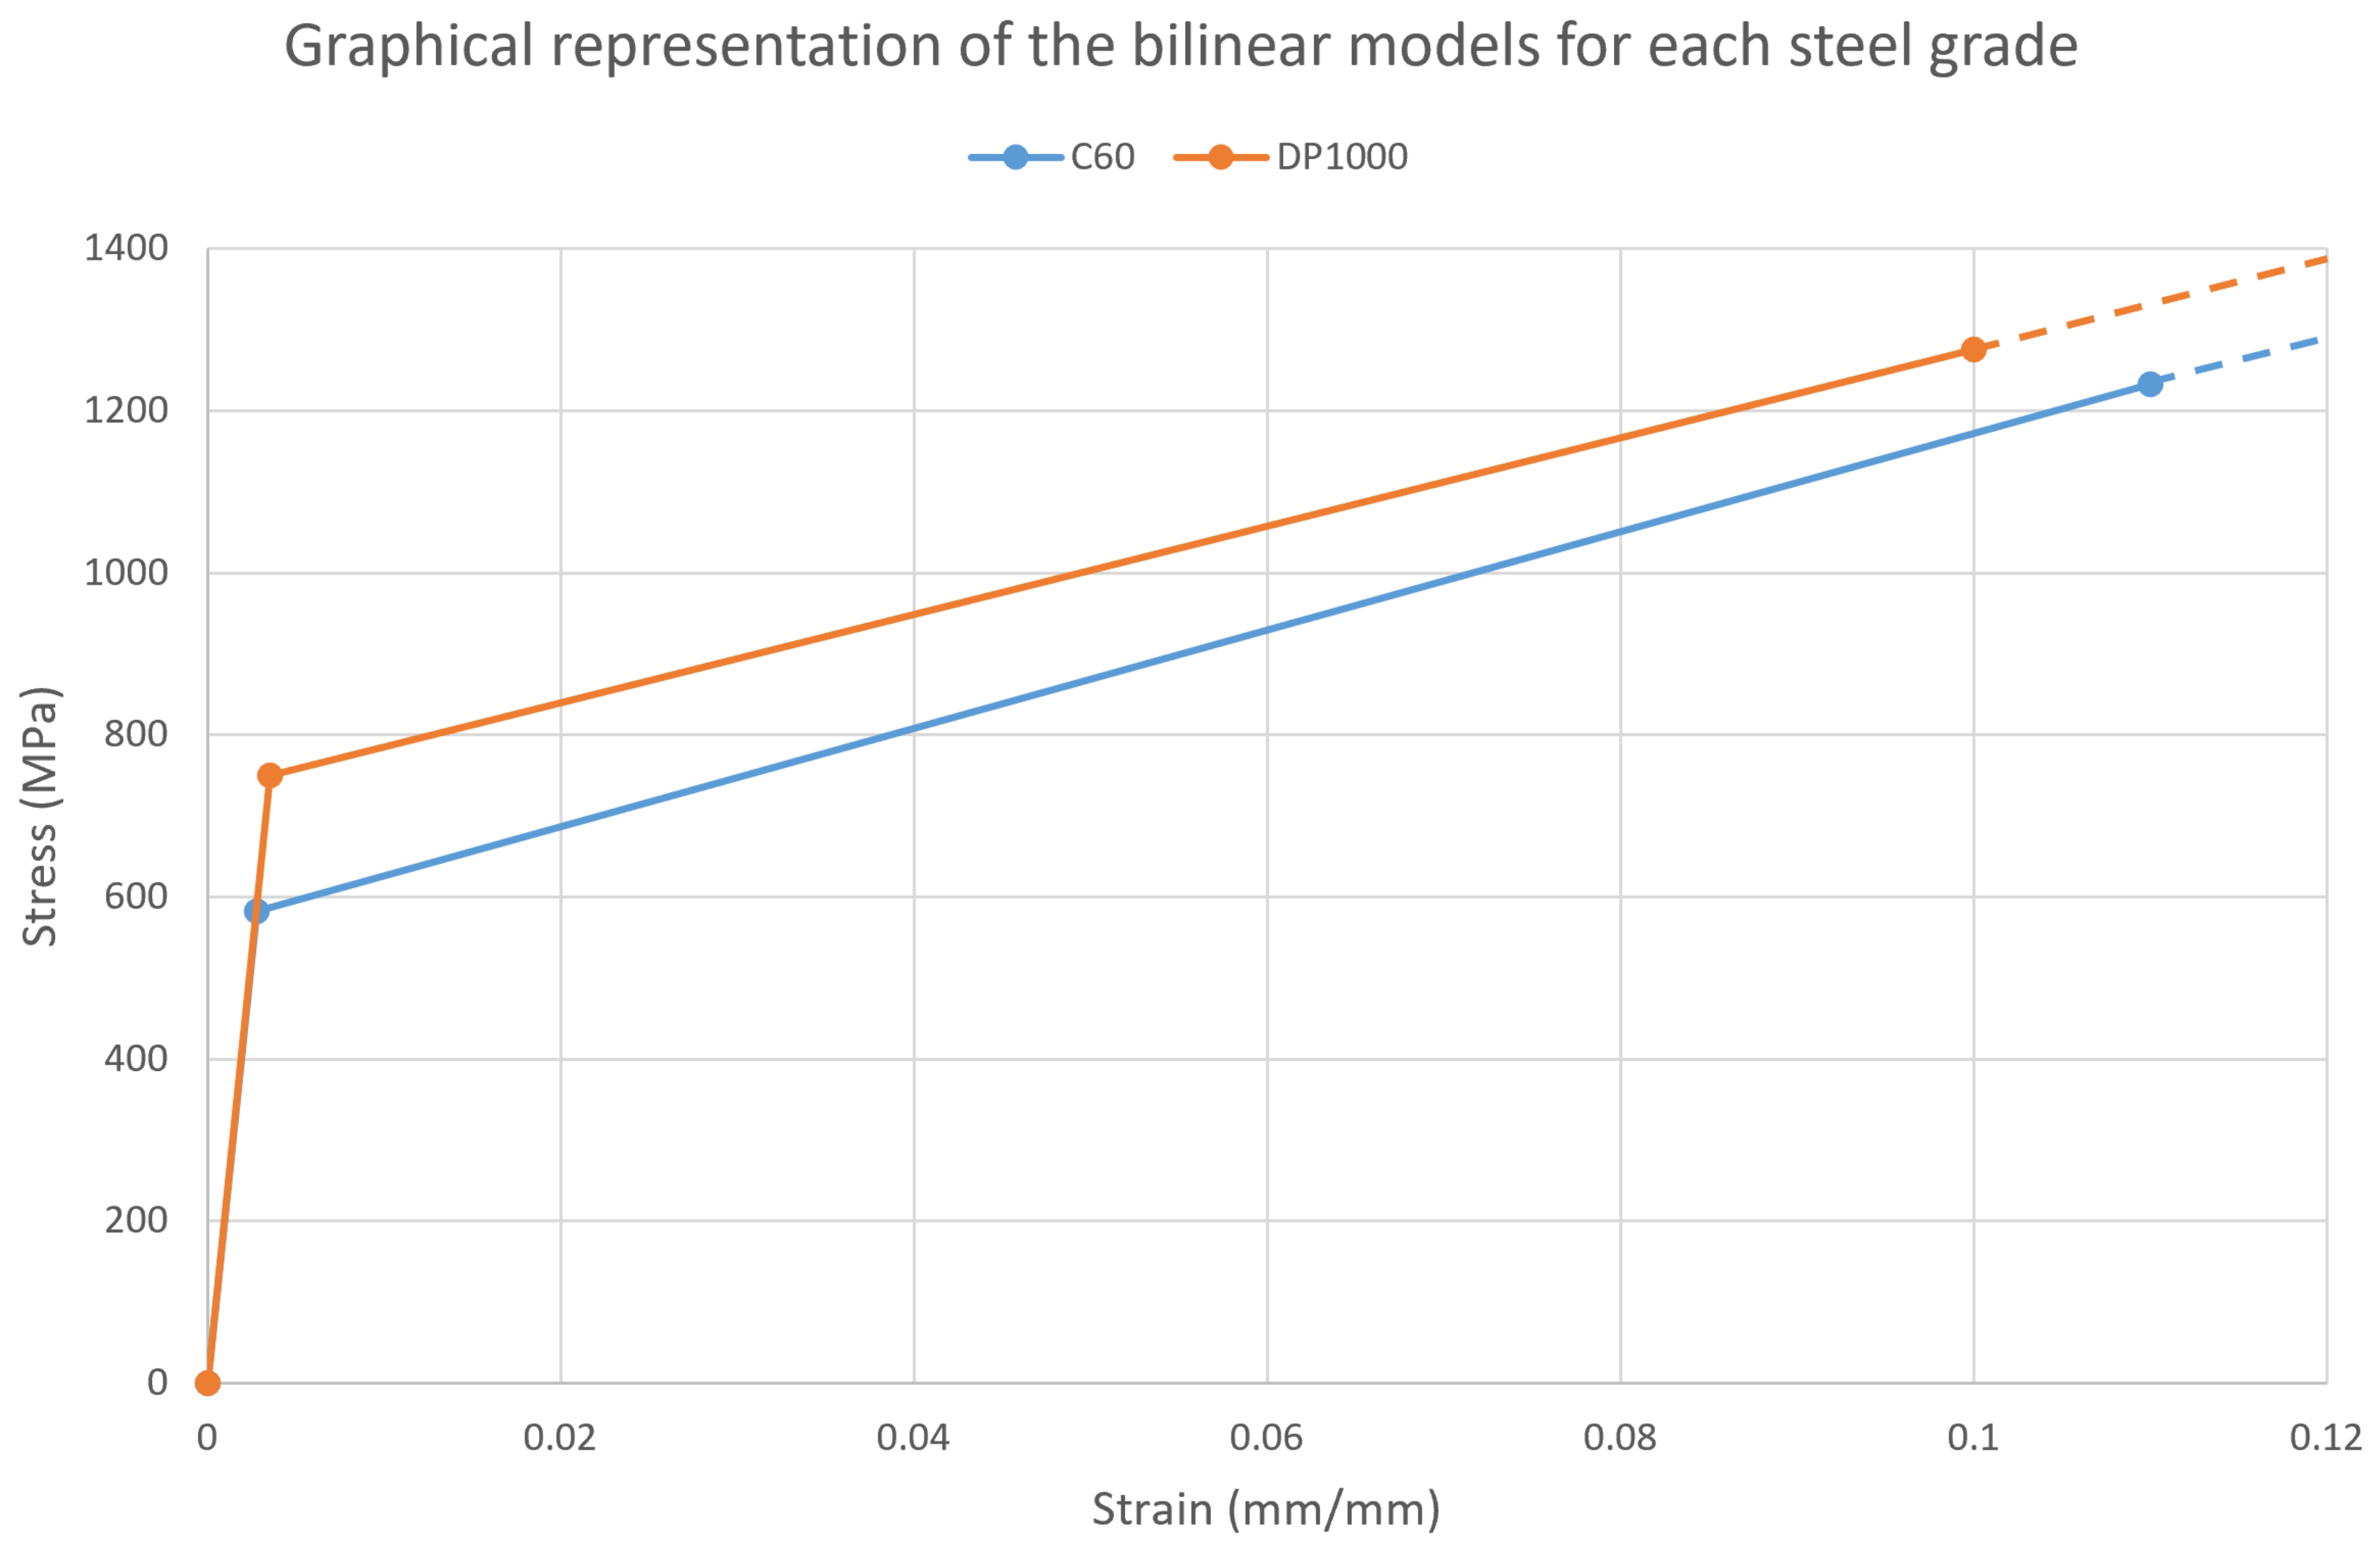
Stress–strain curves for C60 and DP1000 steels defined by a bilinear model. The first line segment represents the elastic region, whilst the second one describes the plastic region.
Figure 9 shows that both steels follow the same line in the elastic domain, since they share the same Young’s modulus, with the elastic limit varying according to each material’s characteristic yield strength. In the plastic domain, the higher tangent modulus of the C60 steel causes its curve to gradually approach that of the DP1000 steel, revealing higher work hardening in the former. It is also worth noting that the software extrapolates the values beyond the tensile strength, i.e., the region indicated by the dashed lines.
An important point to acknowledge is that the performed numerical simulations do not model physical fracture or damage initiation. The reported displacement and reaction force correspond to the point at which the equivalent stress at the selected node reaches the nominal tensile strength used in the material model. Furthermore, it is also worth identifying some limitations of using this constitutive model. Its implementation does not account for kinematic hardening, Bauschinger effects and anisotropy (common mechanisms that help to better describe advanced high-strength steels such as DP1000). In this regard, the “load-bearing capacity” reported in the present study should not be directly interpreted as the actual ultimate performance of the shoe shank.
2.2.5. Study of the Relationship Between Displacement and Tensile Strength
Following the mesh convergence study, the only parameters that differed between the simulations of the two solutions were the displacement imposed on the punch and the material properties assigned to the shoe shank. Focusing on the issue of displacement, a study was carried out to determine the value responsible for causing the shoe shank to reach its tensile strength for each of the two steels.
This study was carried out using the “Direct Optimization” tool in Ansys Workbench. This tool allows objectives to be set (in this specific case, that the maximum equivalent stress at the node of interest equals the tensile strength of the steel) by parameterising the punch displacement input. An acceptable range is then defined for the displacement values, and the software calculates the solutions for each input. The process is iterative and generates new displacement values to satisfy the defined objective.
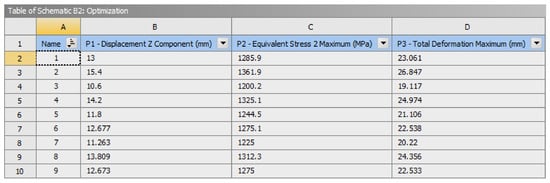
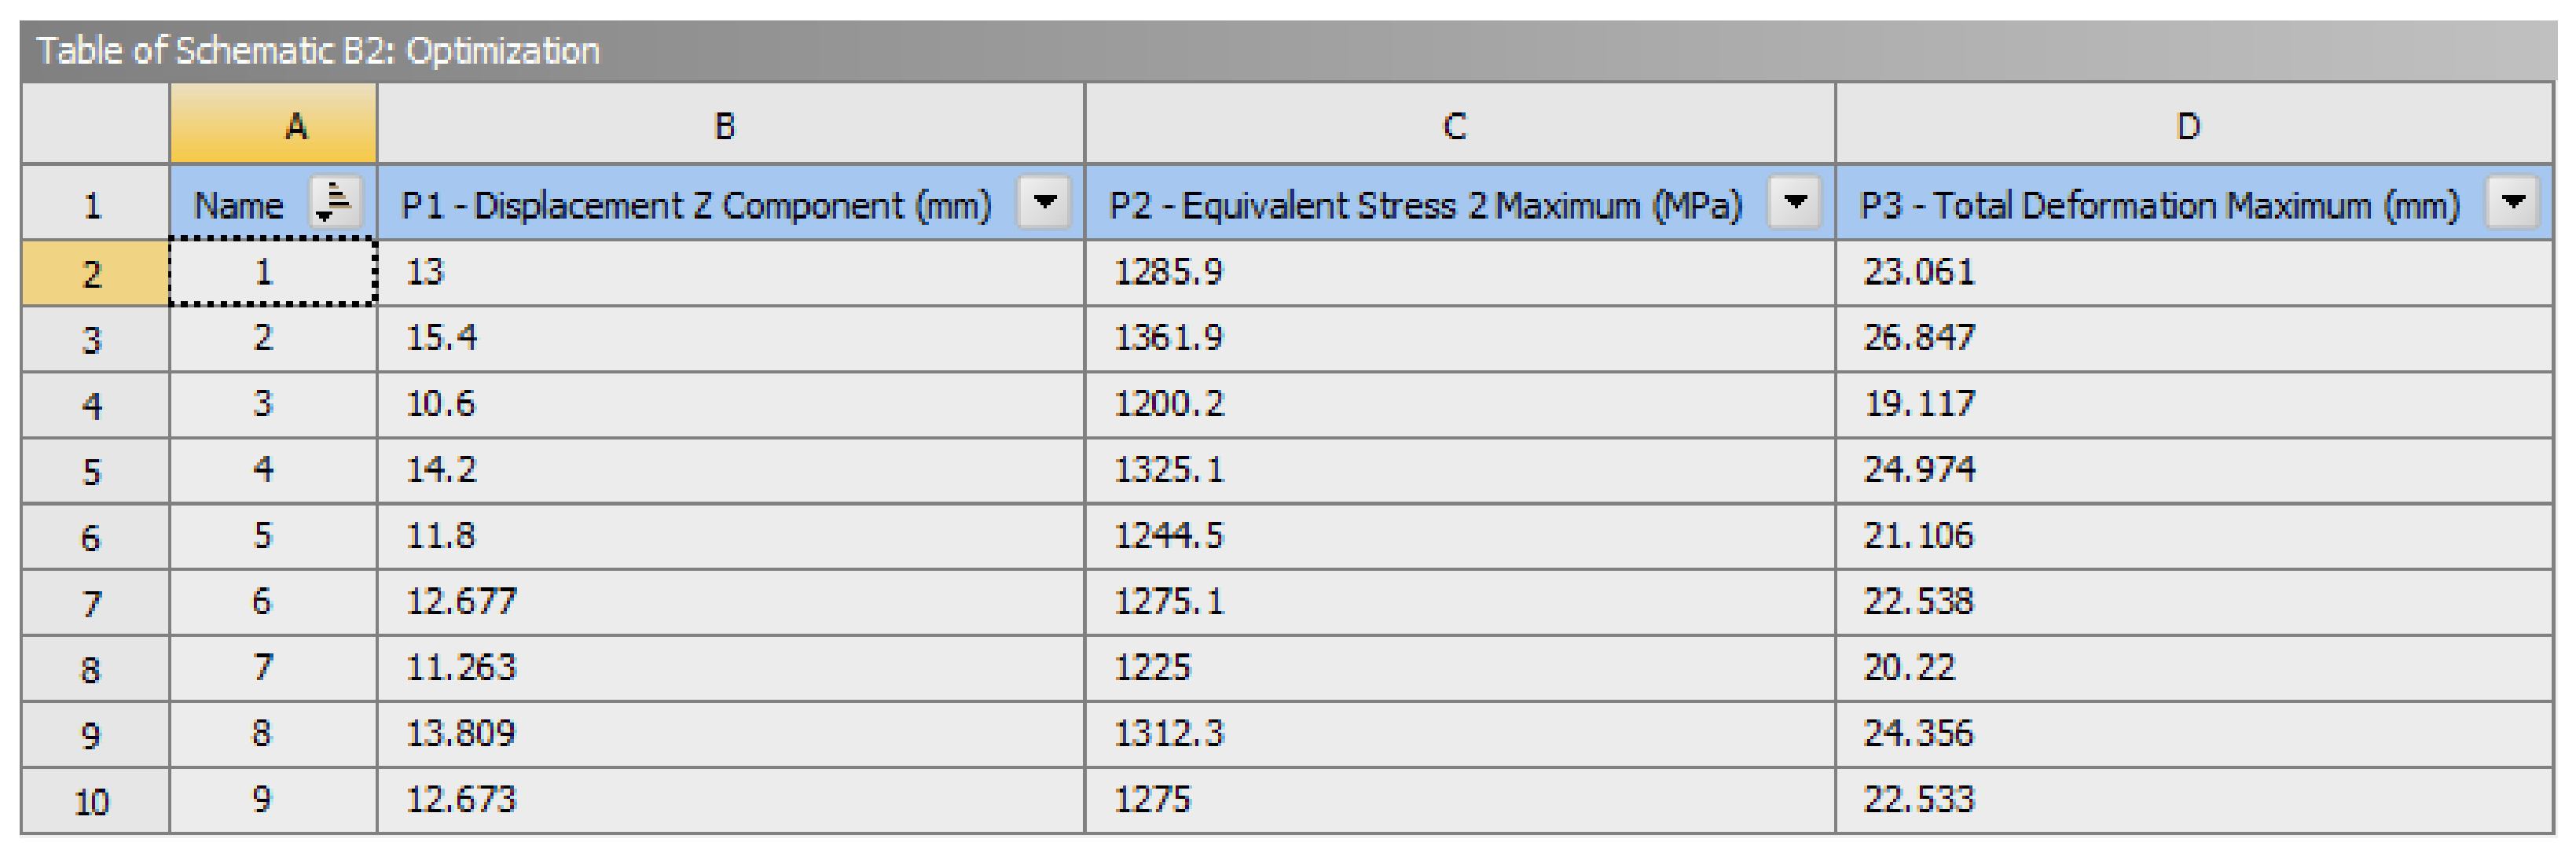
That said, and by way of example, for the DP1000 steel solution, the software found the solution corresponding to the predefined objective on its ninth iteration, as can be seen in Figure 10.
Figure 10.
Results of successive iterations until the “P2” parameter reaches the tensile strength defined as the “optimisation” objective. The “P3” parameter was also activated to monitor the evolution of the maximum total deformation of the shoe shank.
3. Results
3.1. Life Cycle Assessment of the Initial Geometry
By modelling the system described in Section 2.1 using specific LCA software (Sphera v10.9.1.17), it was then possible to obtain results quantifying the environmental impact of each of the solutions. To this end, it was also necessary to select the life cycle impact assessment method, which was the IPCC AR6, specifically the GWP 100 category. This scale was chosen because it is the most widely used for determining global warming potential, precisely accounting for emissions in terms of equivalent .
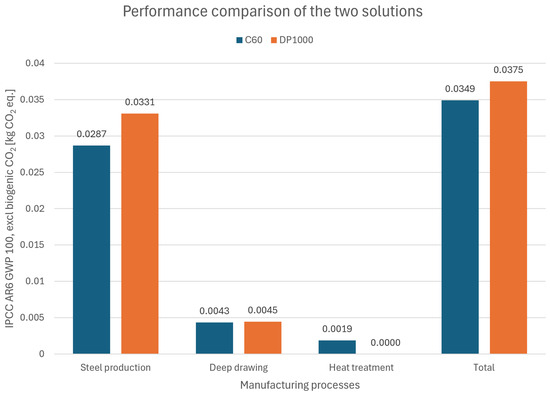
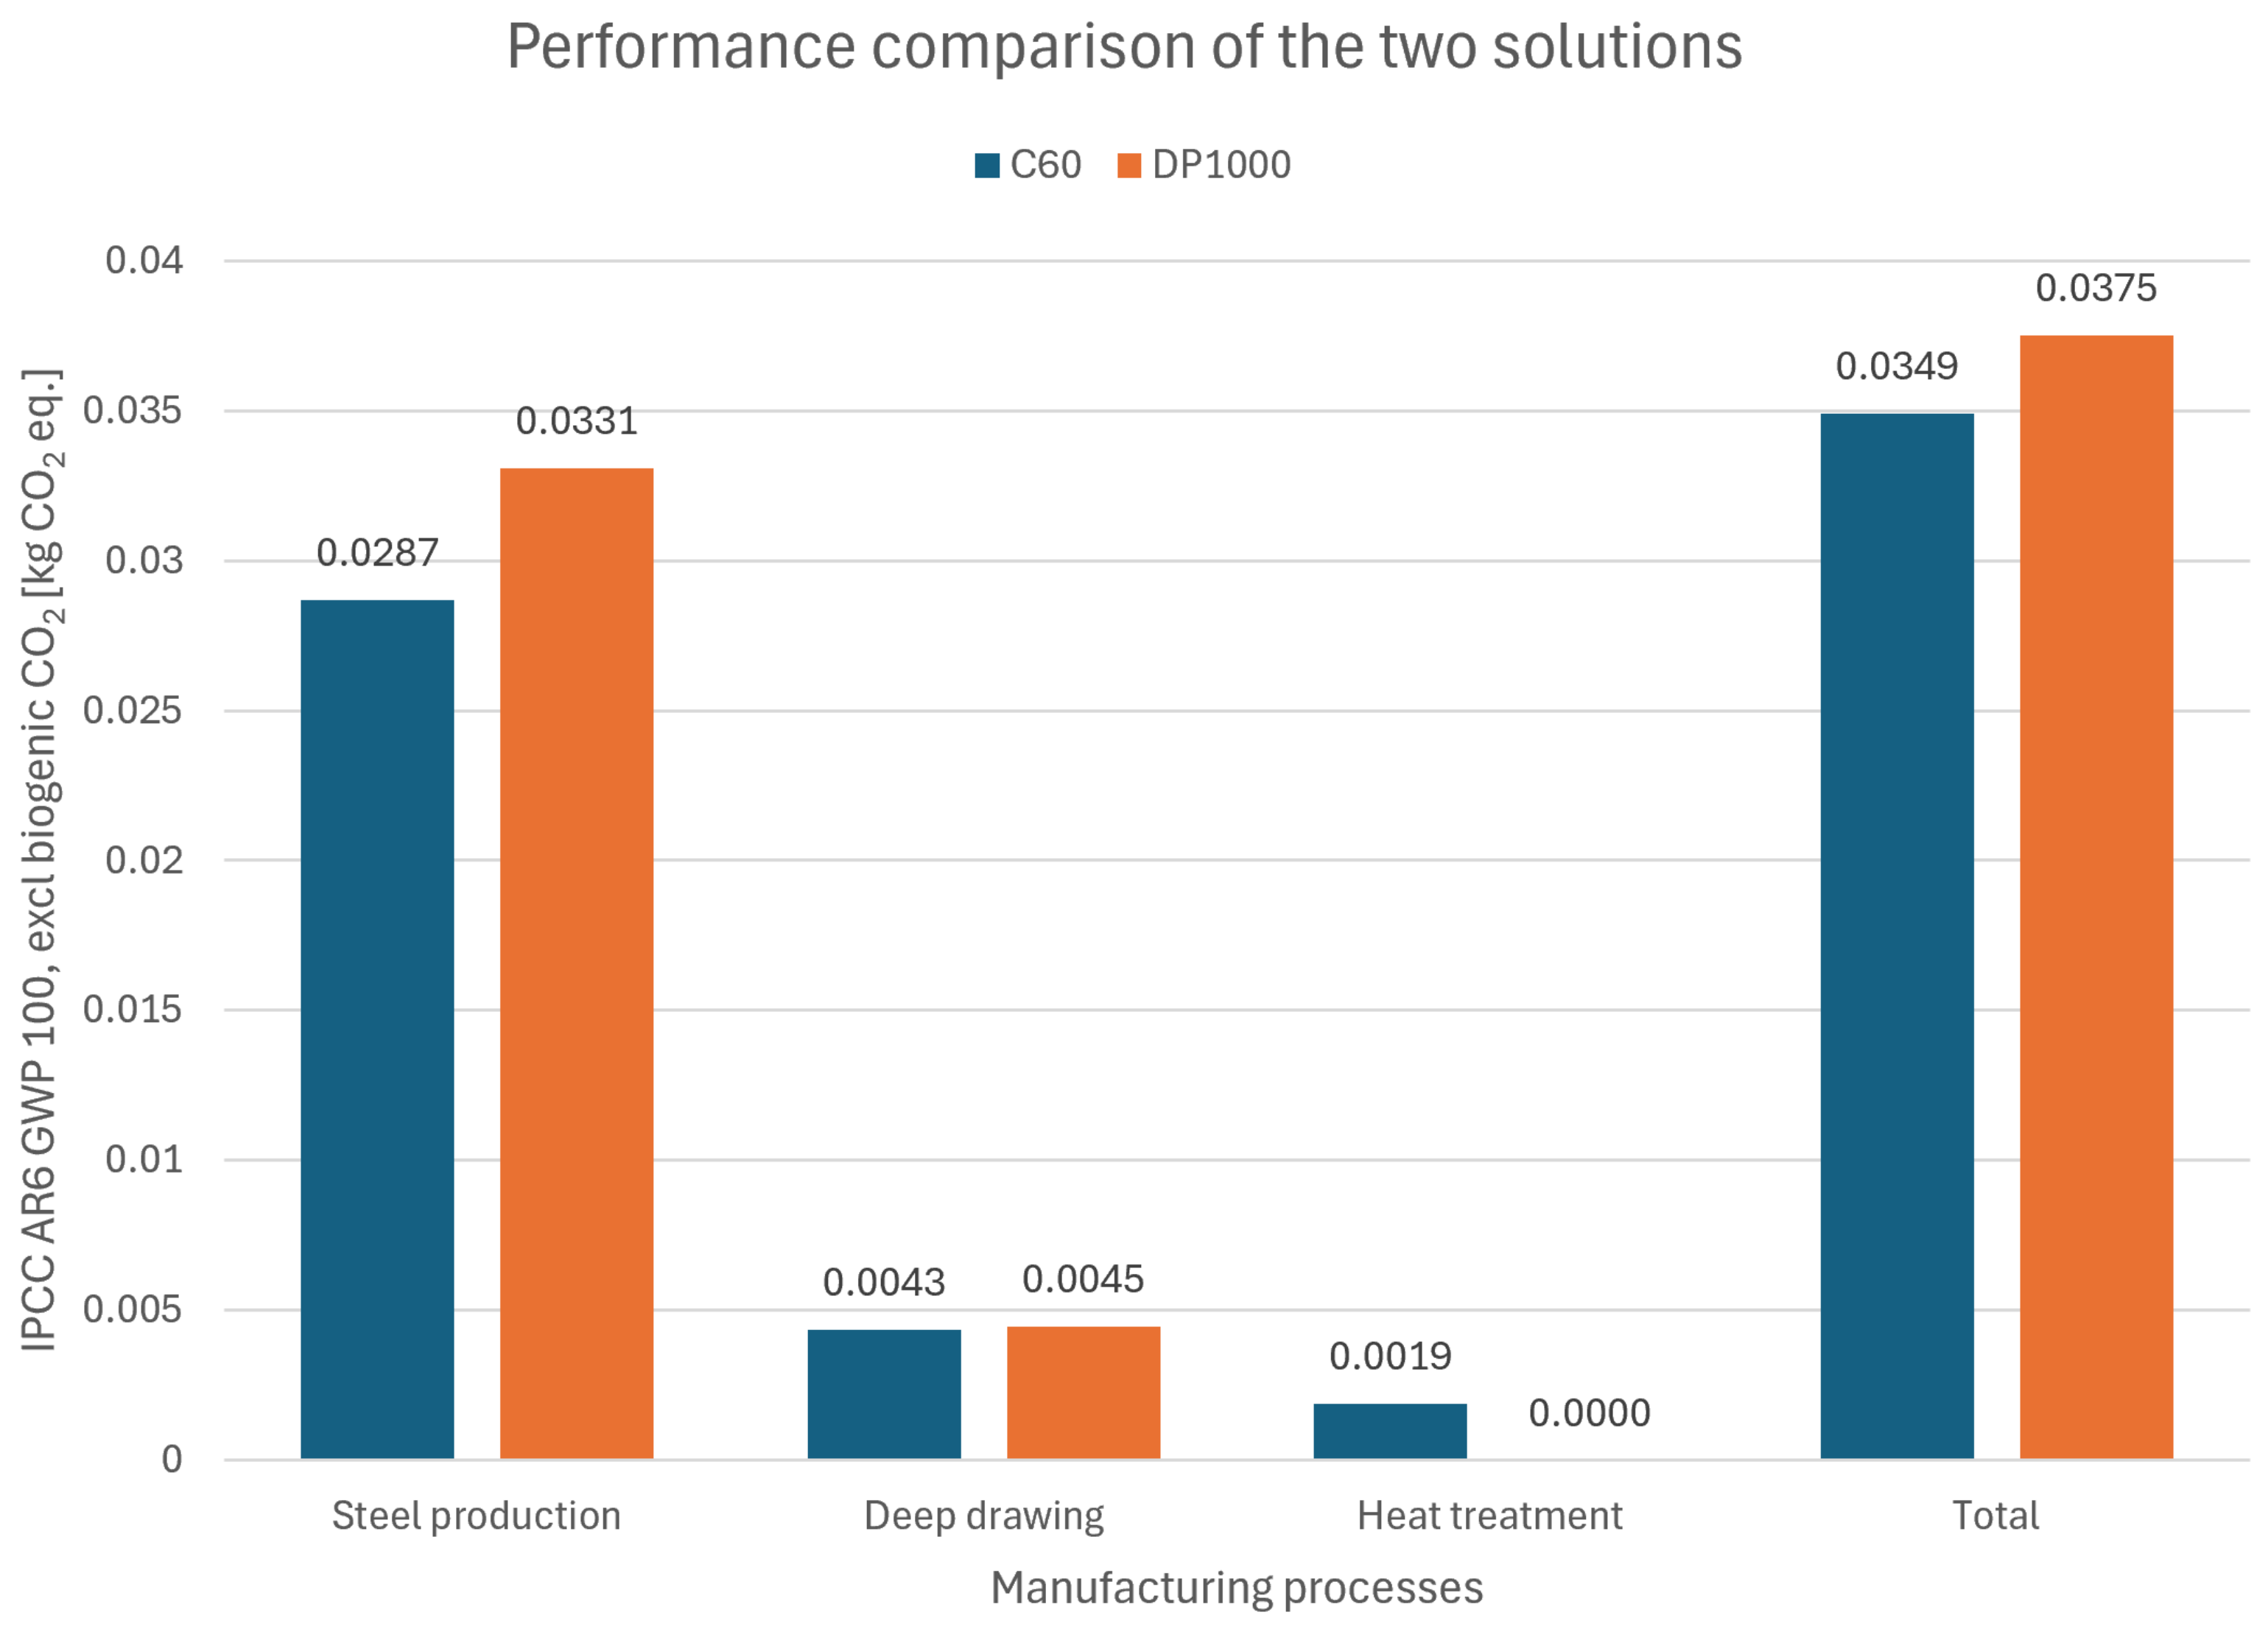
The results of the exploratory comparative LCA preserving the shoe shank geometry are shown in Figure 11, where a graph illustrates the impacts by production phase and the total impact for each of the solutions assessed.
Figure 11.
Results of the exploratory comparative LCA. The impact in kgeq./shoe shank can be seen for each manufacturing process and type of steel.
The results show that the DP1000 steel solution has an impact approximately 7% higher than that of the C60 steel solution. Regarding the impact of each phase, steel production is where the biggest difference between the solutions is observed (around 15%), whilst it also accounts for the largest share of total emissions for each solution (an average of around 85%). This factor ultimately plays a decisive role in the final result of each solution.
The shoe shank’s forming has a very similar impact in both solutions (influenced only by the estimated use of higher-capacity machinery for the DP1000 solution), whilst the heat treatment has a relatively low impact (around 44% of the impact of the forming process).
This initial exploratory assessment confirms the need to make geometric changes to the shoe shank design. Simply replacing the steel grades is therefore not sufficient to ensure the desired trade-off.
3.2. Finite Element Analysis
As mentioned in Section 2.2.5, the displacement of the punch required to reach the steel’s tensile strength at the node of interest was determined. In each of the simulations, the corresponding displacement value was used as input, and the maximum total deformation of the shoe shank and the force reaction at the punch/shoe shank contact were retrieved. The results obtained are summarised in Table 5.
Table 5.
Results obtained for each of the simulations in which the shoe shank is made of C60 or DP1000 steel.
In view of the results obtained, in the case of the C60 steel shoe shank, its slightly lower tensile strength than that of DP1000 allows a higher displacement of the punch, which also results in a higher total deformation until reaching the tensile strength threshold. On the other hand, the DP1000 steel shoe shank reaches its tensile strength with a smaller displacement of the punch and allows a total deformation of around 17% less than the C60 steel. However, the maximum load withstood until hitting the tensile strength threshold also differs by around 20% between the two solutions, with the DP1000 steel shoe shank being the one that withstands higher loads.
To perform a comparative LCA in accordance with the defined functional unit, the geometry of the DP1000 shoe shank was modified to ensure equivalent performance to that of the C60 base model. This process involved running simulations whilst varying only the thickness of the shoe shank, aiming to achieve the same maximum load-bearing capacity. Table 6 shows the various results obtained.
Table 6.
Maximum load-bearing capacity of the shoe shank as a function of its thickness.
This thickness-parametric study showed that reducing the thickness from 1.30 to 1.18 mm ensures that the DP1000 shoe shank has an equivalent load-bearing capacity to the original C60 steel model. Table 7 presents a comparison of the FEA results for each of the solutions.
Table 7.
FEA results comparison between the initial C60 solution and the DP1000 steel shoe shank with thickness reduction.
In this situation, the performance of both solutions is similar in terms of the permitted displacement of the punch and the maximum deformation of the shoe shank (lower by 8.5% and 0.6%, respectively, for the DP1000 solution). The higher apparent stiffness observed for the optimised DP1000 solution (14.18 mm punch displacement, compared to 15.50 mm for C60) can be explained by the difference in yield strength between the two materials (Figure 9). Since DP1000 enters the plastic domain at a substantially higher stress level than C60, it requires proportionally less plastic strain to reach the stress level associated with the load-bearing capacity criterion adopted for structural equivalence, resulting in a smaller accumulated displacement at the punch. This behaviour originates from differences in yield strength and strain-hardening response rather than from elastic stiffness, since the latter is identical between the two materials.
An additional convergence check was performed for the DP1000 shank (1.18 mm thickness) using three mesh densities, with two, three, and four elements through the thickness. For each mesh, the reaction force was evaluated at a fixed punch displacement corresponding to the load-bearing capacity criterion established with the baseline (three-element) mesh used throughout the study. The reaction force decreased by 0.70% between the two- and three-element meshes, and by a further 0.88% between the three- and four-element meshes, confirming that the results in the large-deformation regime exhibit low sensitivity to mesh refinement through the thickness. The results are summarised in Table 8.
Table 8.
Additional convergence analysis assessing the influence of the number of elements across the thickness on the maximum load of the DP1000 final shoe shank solution.
3.3. Comparative Life Cycle Assessment
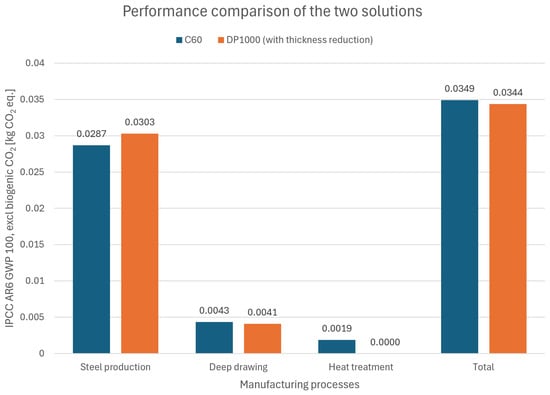
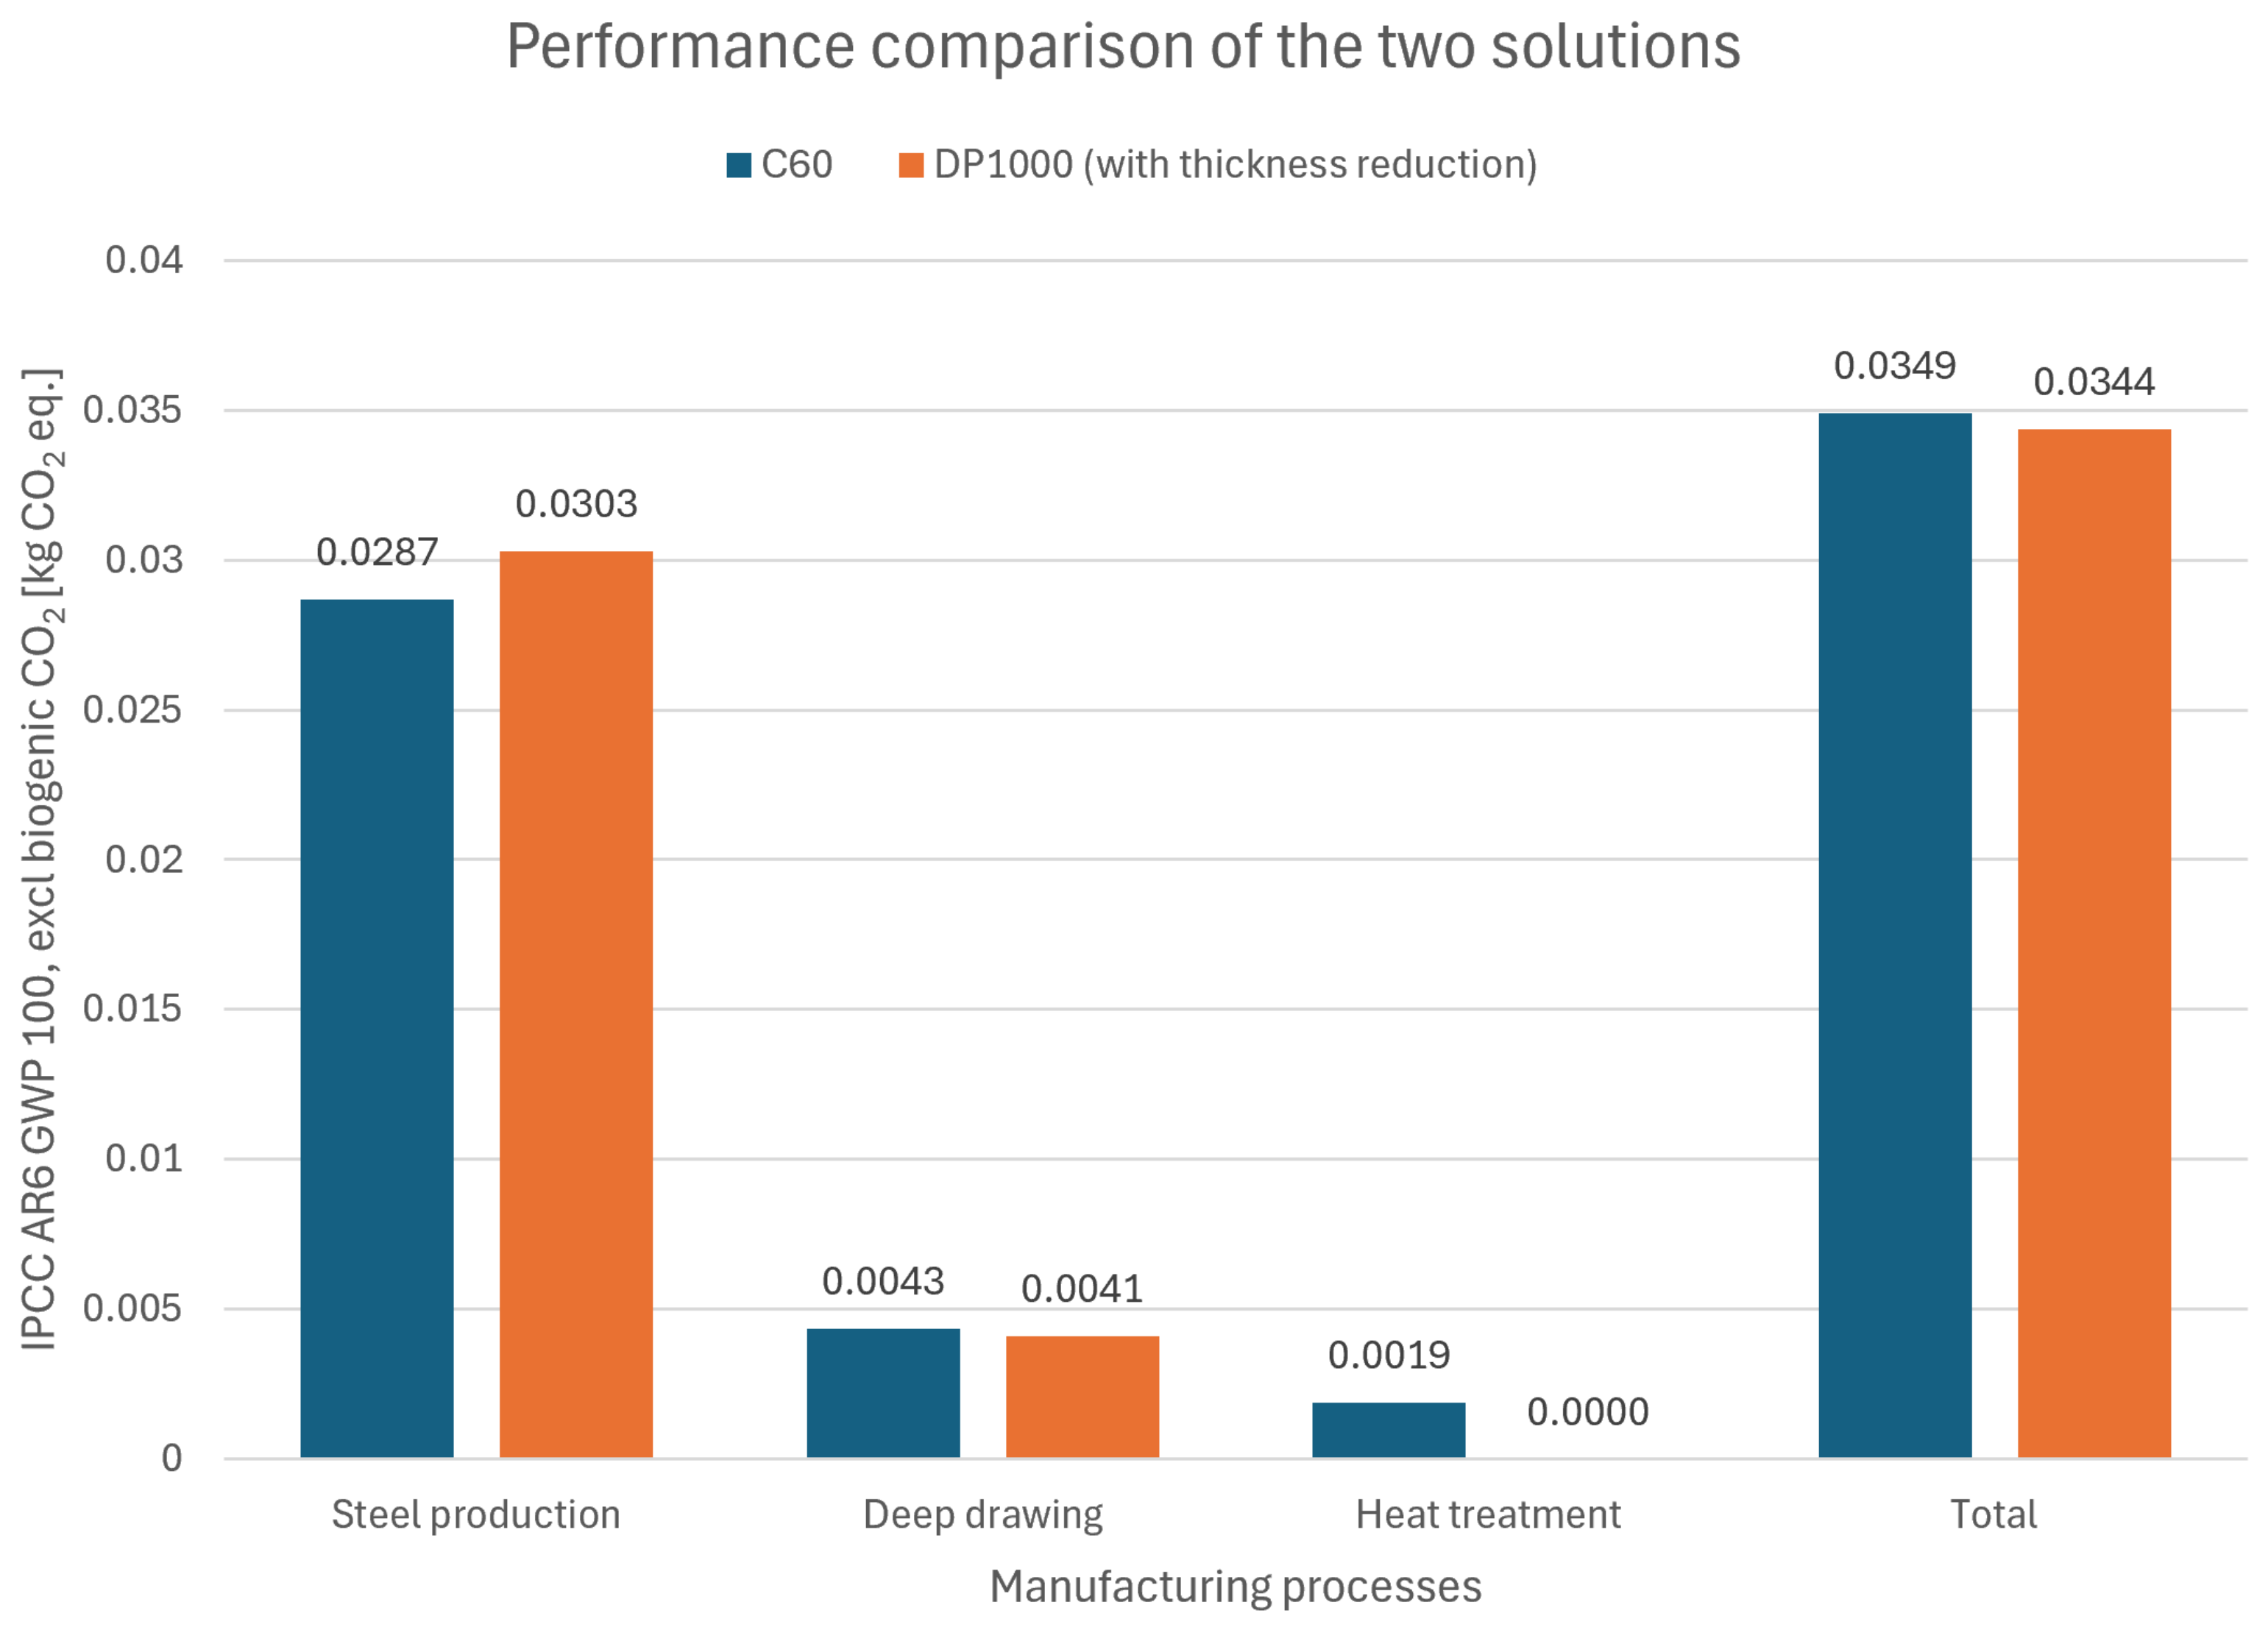
The study of the reduction in thickness of the DP1000 steel solution made it possible to carry out a comparative LCA in accordance with the established functional unit. This thickness reduction from 1.30 to 1.18 mm enabled a mass reduction in the shoe shank from 14.03 to 12.85 g. Figure 12 shows the results of this new analysis.
Figure 12.
Results of the comparative LCA assuming the thickness reduction in the DP1000 steel shoe shank.
In this case, the DP1000 steel solution has a total GWP that is 1.43% lower than the C60 solution. On the other hand, regarding only the steel production phase, the DP1000 impact is still 5.57% higher. However, the total results highlight the positive trade-off of the application of high-strength steel.
Sensitivity Analysis
Having identified the steel production phase as the one that mostly contributes to the overall carbon footprint of both solutions, it is also important to examine it in greater detail. Through an iterative approach, three scenarios of this LCA were analysed, testing different steel inputs. Table 9 summarises the impacts associated solely with steel production, depending on the items used to model it.
Table 9.
Results obtained for three steel production scenarios in which the shoe shank is made of C60 or DP1000 steel.
Comparing the GWP values from the EPDs of steels corresponding to each of the solutions, scenario 3 shows the smallest discrepancy for both steels (approximately 2.22 kgeq./kg of C60 [25,26] and 2.34 kgeq./kg of DP1000 [27,28]). Taking a simplistic view of this issue, this means that the impact of the C60 steel production can be underestimated by around 5.9%, whilst the corresponding figure for the DP1000 is overestimated by around 0.85%.
However, there are caveats to note in this direct comparison of figures. Two parameters are kept constant across all inputs, namely a cradle-to-gate system boundary and equivalent product types (C60 modelled as hot-rolled coil, DP1000 modelled as cold-rolled coil). Regarding the production technology, all inputs represent the Blast Furnace/BOF route, with the exception of the input used in the LCA, which consists of a mix of this technology and the electric arc furnace route. This helps to explain the lower figure, as this technology, by having a lower carbon footprint, ultimately offsets the higher impact of the Blast Furnace/BOF route. On the other hand, all inputs are representative of the European region, with the exception of the EPD from the manufacturer SSAB, which reports data specific to Sweden and Finland. Similarly, this may explain the slight discrepancy observed, as this company prioritises renewable energy sources. This general analysis highlights the inherent uncertainty of using databases to set up the LCI when it is not possible to obtain primary data. That said, in order to establish a credible uncertainty interval for the LCA, it is necessary to carry out sensitivity analyses that assess the variations described.
An initial sensitivity analysis was conducted to assess how variations in mass can influence the results. That relationship can be seen in Table 10.
Table 10.
Results of the sensitivity analysis assessing the influence of mass variation on the final results.
The mass variations of +20% and -10% yield a linear variation for both solutions. This confirms the expected response, given that the inputs used in this LCA were based only on mass. Even in processes like steel forming and heat treatment, the software uses the mass input to internally compute the associated environmental impact. Based on this linear behaviour, additional sensitivity analyses were carried out on the three processes involved in the manufacture of the shoe shank, as presented in Table 11.
Table 11.
Results: We added borders to distinguish different items or categories, please confirm the revision. of the sensitivity analysis assessing the influence of different steel production, forming inputs and heat treatment on the performance of both solutions.
The results of the sensitivity analyses show that the DP1000 steel solution offers a more favourable environmental performance in all the alternative scenarios. When the GWP of steel production is assumed to be equivalent to that reported in the EPDs, the difference between the solutions increases from 1.43% to 6.79%, highlighting a scenario with higher benefit if the steel data were sourced directly from the manufacturers in question.
On the other hand, using a more generalised input relating to forming processes (in the absence of any other specific input for deep drawing) increased the advantage from 1.43% to 3.26%. However, it is important to emphasise the significant discrepancy compared with the baseline process used (around 50% higher impact for both solutions). This means that, when assessing the final carbon footprint of both solutions, the figures undergo significant changes. This aspect once again stresses the importance of choosing representative inputs and the limitations of the lack of primary data (a direct calculation based on machinery data used in the forming factory would help to clarify this discrepancy). The significance of this discrepancy is, however, minimised by the fact that both solutions require similar forming processes, and therefore do not introduce additional uncertainty from the perspective of a purely comparative analysis.
With regard to the heat treatment process for the C60 steel solution, as there were no alternative data entries in the database that were consistent with the process characteristics, an analytical estimate was carried out based on values reported by a manufacturer. These values consist of an energy requirement for Q&T heat treatment of 700 kWh/t and a carbon footprint using gas for heating purposes of approximately 0.19 kgeq./kWh [29]; this implies that the GWP of the C60 steel shoe shanks is 0.0018 kgeq./component. This scenario depicts a reduction of 0.287% in the GWP of the C60 steel solution and reduces the advantage of the DP1000 steel solution to 1.15%.
4. Discussion
Taking into account the initial LCA results of the shoe shanks, the lower GWP quantified for the C60 steel solution highlighted the need to introduce geometry changes for the DP1000 solution to be competitive. In practice, simply replacing the C60 with DP1000 steel is not sufficient to reduce carbon footprint. The steel production stage, accounting for around 85% of the solution’s total impact, was also an important insight to acknowledge. The heat treatment process, on the other hand, made a smaller contribution than initially expected. However, it is essential to bear in mind that both stages can be directly influenced by the production technologies (blast furnace-basic oxygen furnace or electric arc furnace for steel production; continuous or batch treatment for heat treatment) and by the energy sources (fossil or renewable). Access to production data provided directly by producers would therefore be an ideal scenario for ensuring higher accuracy in the LCA results.
Regarding the assessment of the structural performance of the shoe shank for each of the solutions, some differences in their performance arose when maintaining the geometry. In this scenario, the C60 steel shoe shank allowed deformation up to tensile strength to be approximately 17% higher than that of the DP1000 steel shoe shank. Conversely, this model could withstand an applied load up to tensile strength approximately 20% higher than that of the C60 steel shoe shank.
Through performing a reduction thickness study, the DP1000 steel solution with 1.18 mm of thickness revealed an equivalent performance to the C60 base model with 1.30 mm of thickness. In this case, both shoe shanks allowed a much closer total deformation, with a difference of only 0.6%. In terms of their maximum load-bearing capacity, both solutions demonstrated equal performance (113.3 N).
The comparative LCA, which included the DP1000 steel model with reduced thickness, confirmed the aimed trade-off between competing solutions. In this new scenario, this solution now has a total GWP that is 1.43% lower than that of the initial C60 steel base model. Although this difference is relatively small, given the large production volumes expected in the footwear industry, this result could represent a meaningful reduction in environmental impact. Besides that, the sensitivity analysis performed established a possible benefit range of the DP1000 solution from 1.15% to 6.79%, evidencing a positive performance across different scenarios.
The results obtained must also be contextualised, taking into account the limitations of this study, both in the LCA and FEA components. In the first topic, the lack of primary data is a source of uncertainty in a comparative assessment of this kind. As the materials under study are two steels of different grades, the specificity of the data relating to their production is a key factor in the final results. Their alloy composition differs, as do some manufacturing processes within production, while these parameters are very sparse in the actual available databases. Knowing that this phase accounts for almost the entirety of this product’s carbon footprint across its whole life cycle, the results should not be held as a definitive assessment, especially given that the GWP of both solutions is relatively close.
Regarding the FEA, the validation of the results obtained requires experimental testing. It is essential to highlight the uncertainty associated with the real physical behaviour of the shoe shank. It may reveal not only a significant variation in the load-bearing capacity but also in the punch displacement required to reach the material’s tensile strength. This is because the present study evaluates the elastoplastic regime without including fracture or damage models. For that matter, these results need to be considered as a numerical prediction of the expected behaviour of the shoe shank and not its actual ultimate performance. Another source of uncertainty is the fact that different sources were used to parameterise the constitutive models (the literature for C60, experimental data for DP1000). Ideally, experimental data would be used for both. However, as the source for the C60 data is a manufacturer of this steel, the discrepancies are expected to be reduced.
Author Contributions
Conceptualization, M.F. and N.P.; methodology, M.F. and N.P.; validation, M.F. and N.P.; formal analysis, M.F.; investigation, M.F.; resources, A.R.; data curation, M.F.; writing—original draft preparation, M.F.; writing—review and editing, N.P.; visualization, M.F.; supervision, N.P., S.L.C. and A.R.; project administration, N.P.; funding acquisition, N.P. All authors have read and agreed to the published version of the manuscript.
Funding
This research was funded by FCT—Fundação para a Ciência e Tecnologia, I.P., grant number 2024.04213.BDANA, DOI identifier https://doi.org/10.54499/2024.04213.BDANA, and by UID/4077: Mechanical Engineering and Resource Sustainability Center (MEtRICs).
Data Availability Statement
The original contributions presented in this study are included in the article. Further inquiries can be directed to the corresponding author.
Acknowledgments
The main author would like to thank Tiago Mestrinho, IDI intern at the CVR - Centre for Waste Valorisation, for his support in modelling the studied systems in the LCA software Sphera v10.9.1.17. During the preparation of this manuscript/study, the authors used Claude for Windows, version 1.24012.9 (03c61d), for the purposes of generating text, data collection, analysis, and interpretation of data. The authors have reviewed and edited the output and take full responsibility for the content of this publication.
Conflicts of Interest
Author Sérgio L. Costa was employed by the company Bairrimoldes Lda. The remaining authors declare that the research was conducted in the absence of any commercial or financial relationships that could be construed as a potential conflict of interest.
Abbreviations
The following abbreviations are used in this manuscript:
| 3D | Three-Dimensional |
| DP | Dual-Phase |
| EPD | Environmental Product Declaration |
| EPS | Equivalent Plastic Strain |
| FEA | Finite Element Analysis |
| GWP | Global Warming Potential |
| IPCC | Intergovernmental Panel on Climate Change |
| LCA | Life Cycle Assessment |
| LCI | Life Cycle Inventory |
References
- ERA5. June 2026 Was the Warmest June on Record for Western Europe. 2026. Available online: https://climate.copernicus.eu/sites/default/files/2026-07/C3S_Bulletin_PR_202606_warmest_june_for_western_Europe.pdf (accessed on 19 July 2026).
- Intergovernmental Panel On Climate Change (IPCC). Climate Change 2021—The Physical Science Basis: Working Group I Contribution to the Sixth Assessment Report of the Intergovernmental Panel on Climate Change, 1st ed.; Cambridge University Press: Cambridge, UK, 2023. [Google Scholar] [CrossRef] [Scilit]
- World Steel Association. Climate Change and the Production of Iron and Steel—2025; World Steel Association: Brussels, Belgium, 2025. [Google Scholar]
- Milanez, B.; Costa, D.; Wanderley, L.J. Life cycle assessment of iron ore in Brazil: The importance of system boundaries. Extr. Ind. Soc. 2024, 20, 101541. [Google Scholar] [CrossRef] [Scilit]
- Yang, L.; Hu, H.; Yang, S.; Wang, S.; Chen, F.; Guo, Y. Life cycle carbon footprint of electric arc furnace steelmaking processes under different smelting modes in China. Sustain. Mater. Technol. 2023, 35, e00564. [Google Scholar] [CrossRef] [Scilit]
- Lee, J.; Kwak, G.; Jung, Y.; Choi, W. Life cycle greenhouse gas emissions of conventional and alternative steel production methods in countries dependent on energy import: A South Korean case study. Energy Convers. Manag. X 2025, 25, 100865. [Google Scholar] [CrossRef] [Scilit]
- Fang, X.; Sun, W.; Li, W.; Ma, G.; Wang, P.; Zuo, C. Process-based life cycle inventory framework for assessing the carbon footprint of products from complex production paths: Case of dual-phase automotive strip steel. J. Clean. Prod. 2024, 447, 141551. [Google Scholar] [CrossRef] [Scilit]
- Ma, Y.; Wang, L.; Wang, G.; Li, F. Life cycle assessment of metal heat treatment process using furnaces with different energy sources in China from multiple perspectives: Environmental impact, power structure and production cost. Energy 2025, 319, 135117. [Google Scholar] [CrossRef] [Scilit]
- Farmer, W. AHSS Application Guidelines: Defining Steels. 2021. Available online: https://ahssinsights.org/metallurgy/defining-steels/ (accessed on 19 July 2026).
- Shui, B.; Luo, X.; Huang, G. Greenhouse gas emissions benefits of the lightweight vehicle fleet in China: A dynamic fleet perspective. Resour. Conserv. Recycl. 2024, 205, 107544. [Google Scholar] [CrossRef] [Scilit]
- Ferreira, M.; Peixinho, N.; Ribeiro, A.; Costa, S.L.; Vilarinho, C. Comparative Life Cycle Assessment of Safety Toe Caps: Conventional Medium Carbon Steel Versus High-Strength Martensitic Steel. In Innovations in Mechanical Engineering V; Machado, J., Trojanowska, J., Ottaviano, E., Xavior, M., Valášek, P., Basova, Y., Eds.; Series Title: Lecture Notes in Mechanical Engineering; Springer Nature Switzerland: Cham, Germany, 2026; pp. 196–207. [Google Scholar] [CrossRef] [Scilit]
- Bianchi, I.; Forcellese, A.; Simoncini, M.; Vita, A.; Castorani, V.; Cafagna, D.; Buccoliero, G. Comparative life cycle assessment of safety shoes toe caps manufacturing processes. Int. J. Adv. Manuf. Technol. 2022, 120, 7363–7374. [Google Scholar] [CrossRef] [Scilit]
- Costa, S.L.; Mendonça, J.P.; Peixinho, N. Study on the impact behaviour of a new safety toe cap model made of ultra-high-strength steels. Mater. Des. 2016, 91, 143–154. [Google Scholar] [CrossRef] [Scilit]
- ISO 18896:2018; Footwear—Test Methods for Shanks—Longitudinal Stiffness. ISO: Geneva, Switzerland, 2018.
- Carallo, G.A.; Magnasco, L.; Chiocca, S.; Lessio, A.; Mattia, M.; Morbarigazzi, M.; Verdulli, A. A Sustainable Path for Automotive Composite Tooling: Novel Materials, Design, and Technologies Through FEM and LCA. Polymers 2026, 18, 757. [Google Scholar] [CrossRef] [Scilit] [PubMed]
- Stamopoulos, A.G. A combined finite element—Life cycle assessment approach for assessing the sustainability of the thermoforming process of a thermoplastic composite component. In Proceedings of the Material Forming—ESAFORM 2024, Toulouse, France, 24–26 April 2024; pp. 2767–2777. [Google Scholar] [CrossRef] [Scilit]
- Ovako. Material Data Sheet: Steel Grade C60E. 2025. Available online: https://steelnavigator.ovako.com/steel-grades/c60e (accessed on 5 May 2026).
- NP EN ISO 14040:2006; Gestão Ambiental—Avaliação do ciclo de vida—Princípios e Enquadramento. ISO: Geneva, Switzerland, 2008.
- NP EN ISO 14044:2006; Gestão Ambiental—Avaliação do ciclo de vida—Requisitos e Linhas de Orientação. ISO: Geneva, Switzerland, 2010.
- Steiner, R. Impact Extrusion of Steel, Cold, Tempering. 2006. Available online: https://ecoquery.ecoinvent.org/3.12/cutoff/dataset/8205/documentation (accessed on 25 July 2026).
- SATRA. SATRA TM58: Stiffness of Steel Shanks; SATRA: Kettering, UK, 1999. [Google Scholar]
- Ansys Inc. 3.1. Understanding Bilinear Isotropic Hardening; Ansys Inc.: Canonsburg, PA, USA, 2026. [Google Scholar]
- ISO 683-1:2016(E); Heat-Treatable Steels, Alloy Steels and Free-Cutting Steels—Part 1: Non-Alloy Steels for Quenching and Tempering. ISO: Geneva, Switzerland, 2016.
- Pereira, R.; Peixinho, N.; Costa, S.L. Ductile fracture characterization of DP1000 sheet steel: Benchmarking of specimen geometries. Proc. Inst. Mech. Eng. Part L J. Mater. Des. Appl. 2026, 14644207261419093. [Google Scholar] [CrossRef] [Scilit]
- thyssenkrupp Steel Europe. Environmental Product Declaration: Hot Rolled Steel Coil; Environmental Product Declaration EPD-TKS-20240545-CBC1-EN; thyssenkrupp Steel Europe: Duisburg, Germany, 2025. [Google Scholar]
- ArcelorMittal Europe—Flat Products. Environmental Product Declaration: Hot Rolled Coils; Environmental Product Declaration EPD-IES-0014415; ArcelorMittal Europe—Flat Products: Stockholm, Sweden, 2024. [Google Scholar]
- SSAB Europe Oy. Environmental Product Declaration: Cold Rolled Steel Sheets and Slit Coils; Environmental Product Declaration EPD-IES-0023966; SSAB Europe Oy: Stockholm, Sweden, 2025. [Google Scholar]
- ArcelorMittal Europe—Flat Products. Environmental Product Declaration: Cold Rolled Coils; Environmental Product Declaration EPD-IES-0014420; ArcelorMittal Europe—Flat Products: Stockholm, Sweden, 2024. [Google Scholar]
- Ovako. Direct-Quenching Steel: Revolutionizing Forging with Energy Savings & CO2 Reduction; Ovako: Stockholm, Sweden, 2024. [Google Scholar]

Disclaimer/Publisher’s Note: The statements, opinions and data contained in all publications are solely those of the individual author(s) and contributor(s) and not of MDPI and/or the editor(s). MDPI and/or the editor(s) disclaim responsibility for any injury to people or property resulting from any ideas, methods, instructions or products referred to in the content. |
© 2026 by the authors. Licensee MDPI, Basel, Switzerland. This article is an open access article distributed under the terms and conditions of the Creative Commons Attribution (CC BY) license.