


Abstract
Background: Predicting gait waveforms from reduced measurements requires validation on participants and studies excluded from training. Methods: Two separately fitted tasks were evaluated in adult treadmill walking: body mass and sagittal joint angles predicted single-limb ground reaction forces (GRFs) and joint moments (Task 1; 340 observations, 32 participants, three studies), and GRFs predicted sagittal joint angles (Task 2; 361 observations, 39 participants, four studies). All Kim data were excluded from Task 1 because measured participant masses were unavailable; 21 zero-filled running records were excluded from Task 2. Source waveforms and participant identities were reconstructed before analysis. SVR-RBF, random forest and MLP-ANN underwent participant-grouped hyperparameter searches with training-only input and target scaling inside five-fold participant-independent cross-validation. Leave-one-study-out evaluation tested source transfer. Results: The inner-selected procedure produced Task 1 RMSEs of 0.060 and 0.018 BW for vertical and anterior–posterior GRFs, and 0.212, 0.228 and 0.260 N m/kg for ankle, knee and hip moments. Task 2 RMSEs were 7.01°, 9.76° and 9.74° for ankle, knee and hip angles. Mean channel-normalized errors were 0.380 and 0.496; leave-one-study-out values ranged from 0.440 to 0.996 and 0.441 to 1.426, respectively. Conclusions: Performance depended on outcome, tested configuration and evaluation population. These results characterize adult gait prediction; clinical, overground and prospective independent-cohort performance remain untested.
1. Introduction
Lower-limb joint moments and ground reaction forces (GRFs) quantify joint loading and interactions with the ground during walking. Their interpretation supports gait assessment and the study of assistive devices [1,2]. Conventional kinetic analysis combines motion capture, force measurements and inverse dynamics. Indirect estimation from wearable measurements and markerless motion analysis offers alternative measurement pathways, although the resulting estimates require validation for their intended populations and tasks [3,4]. Because this instrumentation is expensive, laboratory-bound, and labor-intensive, there is sustained interest in reconstructing gait kinetics from more accessible measurements [5,6].
Kinematic waveforms, particularly sagittal-plane joint angles, are increasingly available from wearable and markerless systems, motivating efforts to estimate GRFs and joint moments indirectly from movement data [3,7,8]. Inertial kinematics can also be estimated using a combination of deep learning and biomechanical optimization, although evidence from simulated sensor signals must be distinguished from validation with measured signals [9]. If the mapping from joint angles to kinetics can be learned accurately, kinematics-based models could reduce reliance on force plates for selected descriptive or monitoring applications after external validation, lowering the barrier to biomechanical analysis outside specialized laboratories.
Machine learning is an established approach to this estimation problem, with artificial neural networks and other regressors used to predict joint angles, joint moments, and GRFs from kinematic or inertial inputs [10,11,12]. However, model performance depends strongly on dataset size, feature dimensionality, and validation design, and best-practice reviews caution that flexible models can overfit small biomechanical datasets and that grouped validation is required to avoid optimistic error estimates [13,14,15]. The choice of algorithm, not merely its nominal capacity, therefore, remains an open and practically important question.
Prior studies have predicted GRFs and joint moments from joint kinematics [16,17], and sagittal joint angles from forces measured by sensor shoes [18]. Our earlier work predicted lower-body joint moments and electromyography from GRFs during walking and running [19]. The present study considers two complementary, separately trained waveform mappings: angles and body mass to kinetics, and two GRF components to angles. These statistical predictions do not establish a unique biomechanical inverse or make the fitted models mathematically invertible.
Related models differ in what they measure and reconstruct. Ardestani et al. estimated lower-limb joint moments from GRFs and electromyographic signals using a wavelet neural network [20]. Johnson et al. estimated multidimensional GRFs and ground-reaction moments from wearable accelerations [21], whereas Stetter et al. estimated external knee flexion and adduction moments from two inertial sensors during several locomotor tasks [22]. Physics-based approaches have also estimated external forces from inertial motion capture and gait kinematics and kinetics through musculoskeletal optimal control [23,24]. These studies support reduced-measurement estimation while showing why input modality, output definition and validation task must be specified.
Repeated conditions from one participant share anatomy, movement patterns and measurement characteristics. Splitting such observations across training and evaluation can therefore overstate performance for a new participant. Biomechanical machine learning guidance emphasizes appropriate grouping and separation of model development from evaluation [13,25]. Comparisons under different participant-level validation schemes also show that model performance depends on how generalization is tested [26,27]. We consequently make participant-independent evaluation primary and retain a known-participant observation split only as a secondary analysis.
A further challenge is generalization across data sources. Pooling studies broadens the sampled walking conditions, including assistance, footwear and grade, and permits testing transfer to an entirely withheld source. For example, a secondary analysis of the modular-footwear dataset found that outsole geometry altered phase-dependent center-of-mass velocity variability during inclined walking [28]. Such condition-specific adaptations motivate evaluating predictions across a broader range of walking conditions. Pooling nevertheless requires comparable limb-specific signals; it does not remove differences in source processing or participant characteristics.
Walking conditions can change the coordination between joints and the response to assistance. Increasing ankle pushoff reduced hip muscle moments in an experimental walking study [29], and an unpowered ankle exoskeleton reduced the energy cost of walking [30]. Human-in-the-loop studies have separately optimized ankle-exoskeleton and hip-exosuit assistance using measured metabolic responses [31,32]. These findings motivate sampling assisted as well as unassisted walking, but do not establish that a waveform predictor measures metabolic benefit or selects an optimal assistance profile.
The primary question is how accurately complementary waveform mappings predict gait signals for participants excluded from model development across the represented adult walking conditions. Task 1 predicts GRFs and joint moments from body mass and sagittal angles; Task 2 predicts sagittal angles from GRFs alone. Both use the same participant-independent evaluation framework. A secondary objective compares three model families under specified preprocessing and hyperparameter-search budgets. Pooling extends the range of walking conditions and enables withheld-study evaluation beyond a single-source analysis; it does not establish universal transportability. The analyses are exploratory, with no prospective numerical success threshold.
2. Methods
2.1. Source Data and Eligibility
The hip-exoskeleton source contributed ten participants across twelve treadmill-walking conditions [33,34]. The footwear source contributed ten participants across fifteen combinations of footwear inclination and treadmill grade [35]. The Kim biomechanical subset comprised seven participants with exosuit-assisted, unassisted and no-exosuit walking conditions [36]. The Kin source comprised twelve participants across six level/grade treadmill trials [37]. Each observation is a participant-condition or participant-trial representative waveform, rather than an independent person or an individual raw stride. All sources concern adults without known gait pathology; no formal sample-size calculation was performed for this secondary analysis. Please see Table 1.
Table 1.
Eligible data by study and prediction task. Mass summaries use one recorded mass per participant and the sample standard deviation (SD; denominator n − 1). The total participant counts refer to Task 1/Task 2. Kin mass is the reported participant mass, rather than an estimate derived from force measurements. Measured individual masses were unavailable for Kim; these observations were excluded from Task 1, and no masses were imputed for either task.
Task 1 included 340 observations from 32 participants in the hip-exoskeleton, footwear and Kin sources. All Kim records were excluded because measured participant-level body mass was unavailable. Task 2 used only forces as inputs and therefore included the 21 valid Kim walking observations, yielding 361 observations from 39 participants. The 21 Kim running-condition records had both exported GRF channels identically at zero and were excluded rather than treated as measured zero forces. One footwear observation contained a non-finite required waveform and was excluded before splitting. A source-quality screen also excluded hip-exoskeleton participant S05, condition C02: its entire left ankle trace lay between 152° and 174° before the sign transform, an unresolved coordinate artifact incompatible with the intended sagittal ankle angle. The screen excluded an observation if any ankle coordinate exceeded ±90° and affected this record only. No replacement waveform or contralateral substitution was imputed. All exclusions preceded every data split, and both tasks were refitted on their eligible cohorts. In the original analysis, assigned Kim masses were used only as predictors; they were not used to normalize the force or moment measurements (Table 1).
2.2. Source Reconstruction and Harmonization
Source waveforms were harmonized before model fitting. All GRF channels represent one limb, with laboratory vertical force positive upward and anterior–posterior force retaining braking/propulsion sign. Hip-exoskeleton left-leg forces and Kin leg-1 forces, stored in newtons, were divided by the recorded participant mass multiplied by 9.80665 m/s2. Footwear right-leg laboratory Z and Y components replaced the incline-perpendicular and incline-parallel components. Kim left-leg vertical and anterior–posterior components were retained in their exported body-weight convention. The footwear force export was also retained at its native body-weight amplitude, consistent with the BW units reported in the original publication’s Supplementary Table S1. Bilateral-cycle load balance provided a further consistency check. These checks do not constitute an independent recalibration of the original force plates.
For the hip-exoskeleton source, limb-specific force, angle and net inverse-dynamics moment arrays were taken directly from the original time × participant × condition data. No observations were duplicated, knee moments were not multiplied by an additional scale factor, and neither interpolation across observations nor a fixed late-cycle force cutoff was applied. Net joint moments, rather than the hip biological-moment channel after subtracting assistance, define the kinetic targets. Kin forces retain their original signed values and are not rectified or forced to zero after a fixed percentage of the cycle. A limb-specific force can approach zero during that limb’s swing phase, approximately the final 40% of a typical walking cycle; it is not expected to remain near body weight as a bilateral total would. No fixed toe-off time was imposed.
Forces are reported in multiples of body weight (BW), a dimensionless ratio F/(mg), and never as N/kg. Moments are net sagittal moments in N m/kg. Angles are in degrees, with extension-positive hip/knee and plantarflexion-positive ankle display conventions; source-specific transformations are listed in Table 2. The common cycle axis spans 0–100% of the source-defined limb gait cycle. Kim trajectories were linearly resampled from 1001 to 100 points; the other sources supplied 100-point trajectories. For Kin, m is the reported participant mass; the alternative weight estimate derived from walking force recordings was not used as an input. Differences between reported and force-derived weight remain a normalization uncertainty. Source filtering, joint models, offsets and representative-stride averaging remain inherited characteristics and may still contribute to study differences after unit and limb harmonization.
Table 2.
Limb definitions, normalization and sagittal-plane transformations used to harmonize the studies. Force components are laboratory vertical and anterior–posterior GRF. Body-weight normalization is F/(mg), where m is participant mass and g = 9.80665 m/s2. Sign reversals are relative to the source measurements. Final angles use extension-positive hip/knee and plantarflexion-positive ankle conventions.
Participant groups were assigned before waveform concatenation or exclusion of observations. Group assignments were verified against the original participant and condition labels and recorded masses for the hip-exoskeleton study, the documented participant dimension for footwear, and participant identifiers for Kim and Kin. This verification identified and corrected an earlier mismatch between observation ordering and participant assignment in the hip-exoskeleton data. All participant-independent analyses were repeated using the corrected groups. No participant appeared in both training and test partitions within any inner or outer participant-separated evaluation. Identifiers were kept distinct across studies; the available de-identified information could not establish whether any individual participated in more than one study.
2.3. Predictors and Model Optimization
Two separately trained multi-output regression tasks were evaluated. Task 1 uses one scalar body-mass feature and three 100-point sagittal-angle waveforms (301 input features) to predict two GRFs and three moment waveforms (500 outputs). Mass is supplied once, rather than repeated 100 times. In Task 2 (GRF-to-angle), inputs were only the vertical and anterior–posterior GRF waveforms (200 features), and targets were the ankle, knee, and hip sagittal-angle waveforms (300 targets). Body mass and joint moments were not supplied to Task 2. No study indicator or participant identifier is supplied as a predictor.
SVR with a radial basis function kernel (SVR-RBF) [38], native multi-output random forest [39], and a multilayer perceptron (MLP-ANN) [40] were evaluated separately for each task. SVR fits one regressor per output coordinate; random forest and MLP jointly predict the output vector. Input coordinates with training SD ≤ 10−6 in native units were excluded before standardization to prevent amplification of numerical near-zero variation; the mask was learned separately within every training partition and applied identically to all families. Remaining inputs were standardized using training-only means and SDs. Each target channel was standardized using its training-partition mean and SD across observations and cycle points, and predictions were transformed back to native units for reporting. This target scaling is part of every primary model, including random forest, whose multi-output split criterion can otherwise weight high-variance outputs more strongly.
Each model family received a deterministic search of twelve configurations, comprising one reference configuration and eleven configurations sampled without replacement from the grid in Table 3 (seed 42). The full candidate lists and selected settings are retained with the analysis. Three source-stratified, participant-separated inner folds selected hyperparameters using only the outer training data. Every inner fit learned its own preprocessing. The family with the lowest mean inner validation score was refitted on the entire outer training partition and then evaluated once on that outer test partition. The resulting “inner-selected procedure” can choose different families in different outer folds; family-specific tuned results are also reported, without selecting a family on the outer test scores. Searches were repeated independently within every participant, study and sensitivity evaluation. Sampling a defined hyperparameter space provides a practical alternative to exhaustive grid evaluation [41]; the selected settings remain conditional on that space and budget.
Table 3.
Hyperparameter search grids. Twelve configurations per family were evaluated in each three-fold inner search; the grid was not exhaustively enumerated. The reference settings were SVR C = 10, gamma = scale, epsilon = 0.05; forest 100 trees, minimum leaf size 2, all features, unrestricted depth; and MLP (80, 40) units, alpha = 10−4, learning rate 0.001 and 300 epochs. All primary fits used training-only input and channel-target scaling.
The MLP used ReLU activations, the Adam optimizer [42], batches of up to 64 observations, and a fixed epoch budget of 300 or 600 selected by grouped inner validation. Its random-row early-stopping option was disabled to prevent a participant-mixed validation subset. Training continued for the selected budget; reaching that budget is not evidence of numerical convergence. Seed 42 was fixed for partitioning, search sampling and stochastic estimators. The twelve-configuration budget makes the comparison more systematic than a single fixed setting but does not establish a global optimum or equal exploration of all possible architectures.
2.4. Validation and Outcome Measures
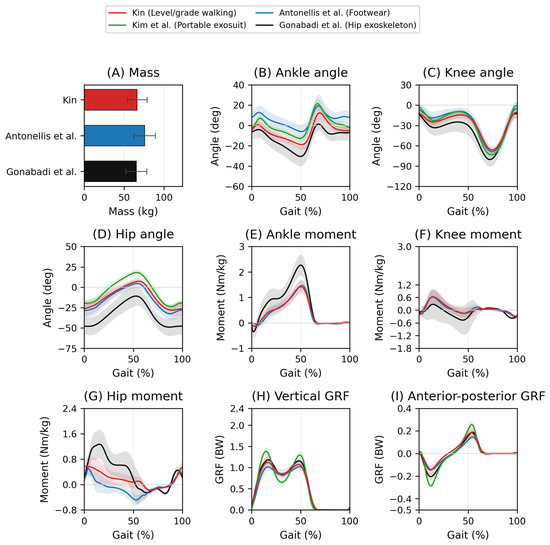
The primary evaluation was five-fold source-stratified participant-independent cross-validation. Every participant contributed predictions only from a model trained without any of that participant’s observations, with model selection nested inside the outer training partition [43,44]. All 32 Task 1 and 39 Task 2 participants therefore contributed held-out predictions. A separate holdout reserved one participant per eligible source, selected by shuffling the source-specific participant lists with seed 42 before inspecting test performance; every condition of that participant was withheld. This provided a secondary check (see Figure 1). A further known-participant sensitivity reserved approximately 20% of each participant’s observations; this explicitly permits participant overlap and is not used to support new-participant generalization.
Figure 1.
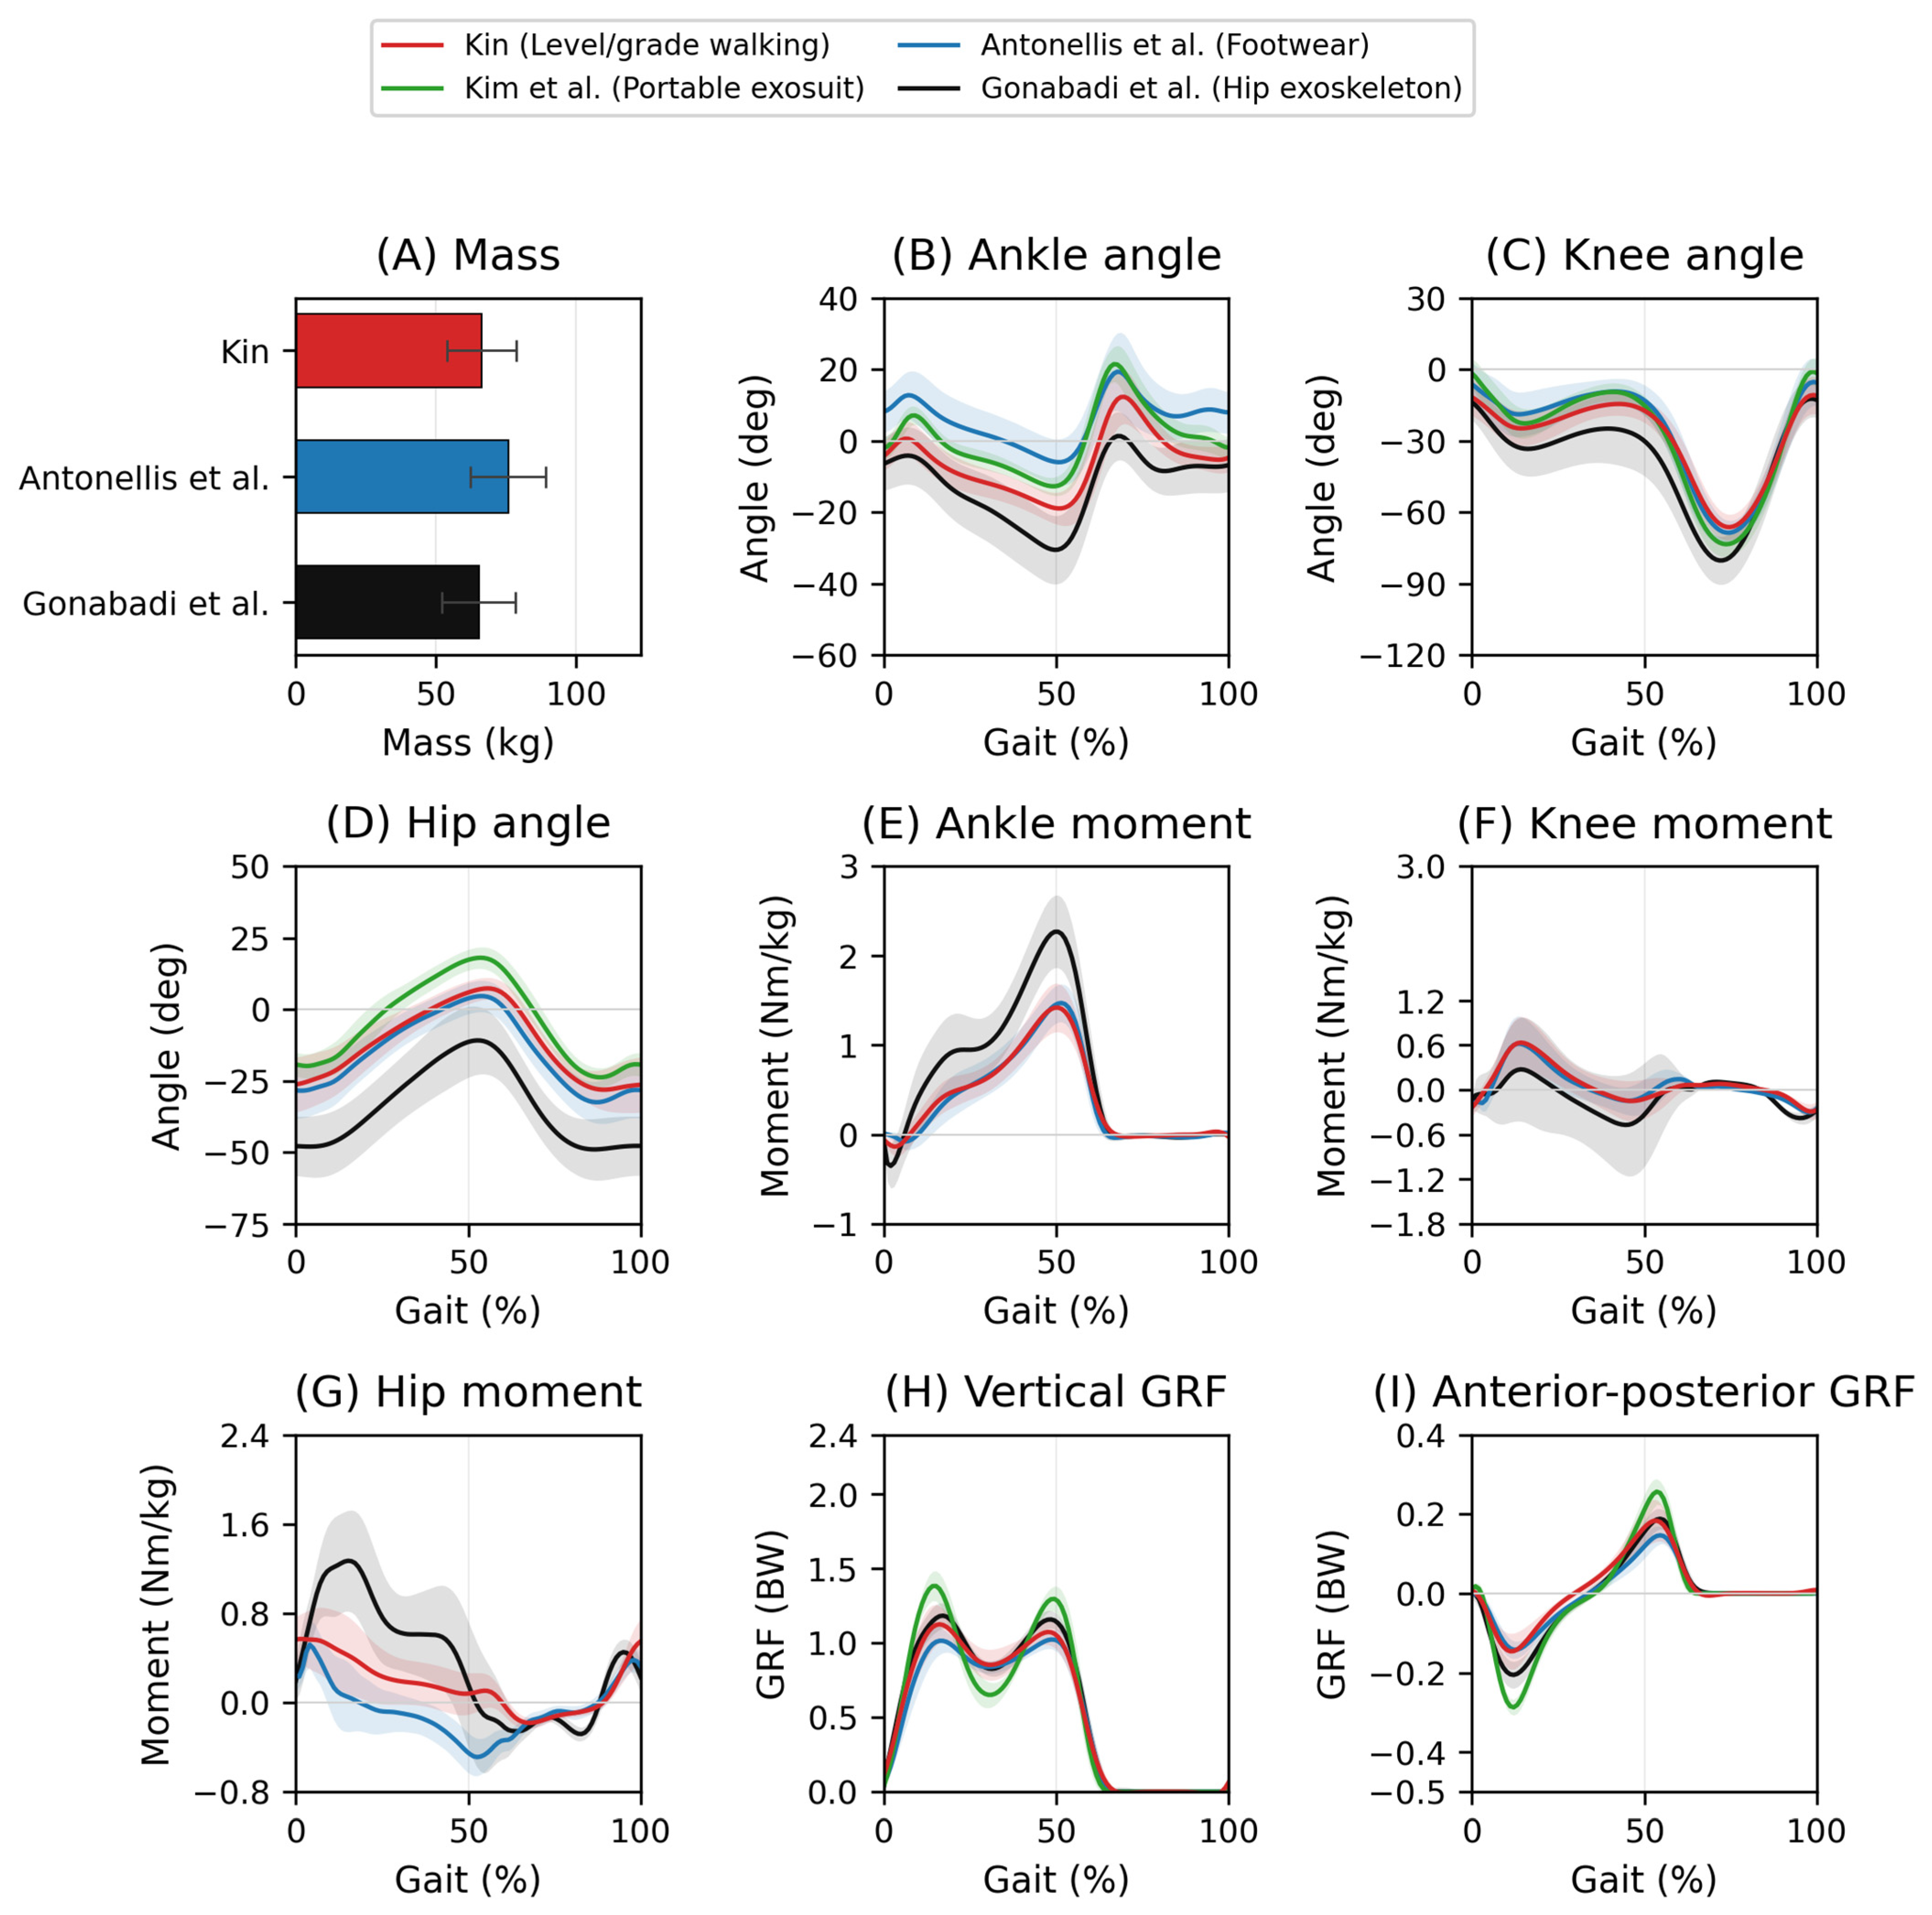
Source-specific mean waveforms with ± one SD across eligible walking observations. (A) Recorded participant mass; (B–D) ankle, knee and hip angles; (E–G) ankle, knee and hip moments; (H) vertical GRF; (I) anterior–posterior GRF. Mass summaries use unique participants. Kim contributes valid walking angles and forces only; no individual mass is imputed and no Kim moment is plotted. Force is dimensionless BW, moments are N m/kg and angles are degrees. These are source distributions, not prediction-performance estimates. Legend colors identify studies: black, hip exoskeleton [33,34]; blue, footwear [35]; green, Kim [36]; red, Kin [37]. A study appears only in panels with eligible measured quantities. The shadow areas of the lines are the SD.
Leave-one-study-out evaluation excluded every participant and observation of one source from preprocessing, hyperparameter selection and fitting (see Figure 1). Task 1 trained on two eligible studies and tested the third, because Kim was excluded from this task; Task 2 trained on three studies and tested the fourth. Inner tuning used only participants from the remaining studies. These are retrospective source-transfer tests, not a new prospective external cohort, and the small number of studies limits inference to other laboratories.
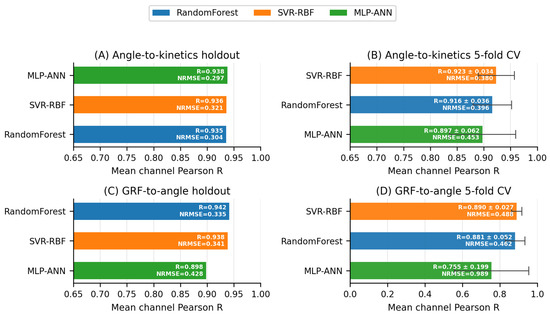
RMSE and MAE were calculated separately for each output channel, first averaging squared or absolute pointwise errors within each participant, then averaging equally across participants; RMSE takes the square root of the resulting mean squared error. Pearson R and R2 describe each channel after pooling its held-out waveform coordinates and are descriptive shape/agreement summaries, not independent pointwise sample sizes. For model selection, each channel’s error was divided by that channel’s training-only SD, participant-balanced normalized RMSE was calculated, and the channel scores were averaged with equal weight. Thus, Task 1 never ranks models using a mixed-unit pooled physical RMSE. Figure 2 displays equal-weight mean channel-specific R for descriptive comparison, not mixed-output pooled R or the selection objective. For combined outer-fold reporting, each prediction retains the SD from its own outer training fold before participant-balanced normalized errors are aggregated.
Figure 2.
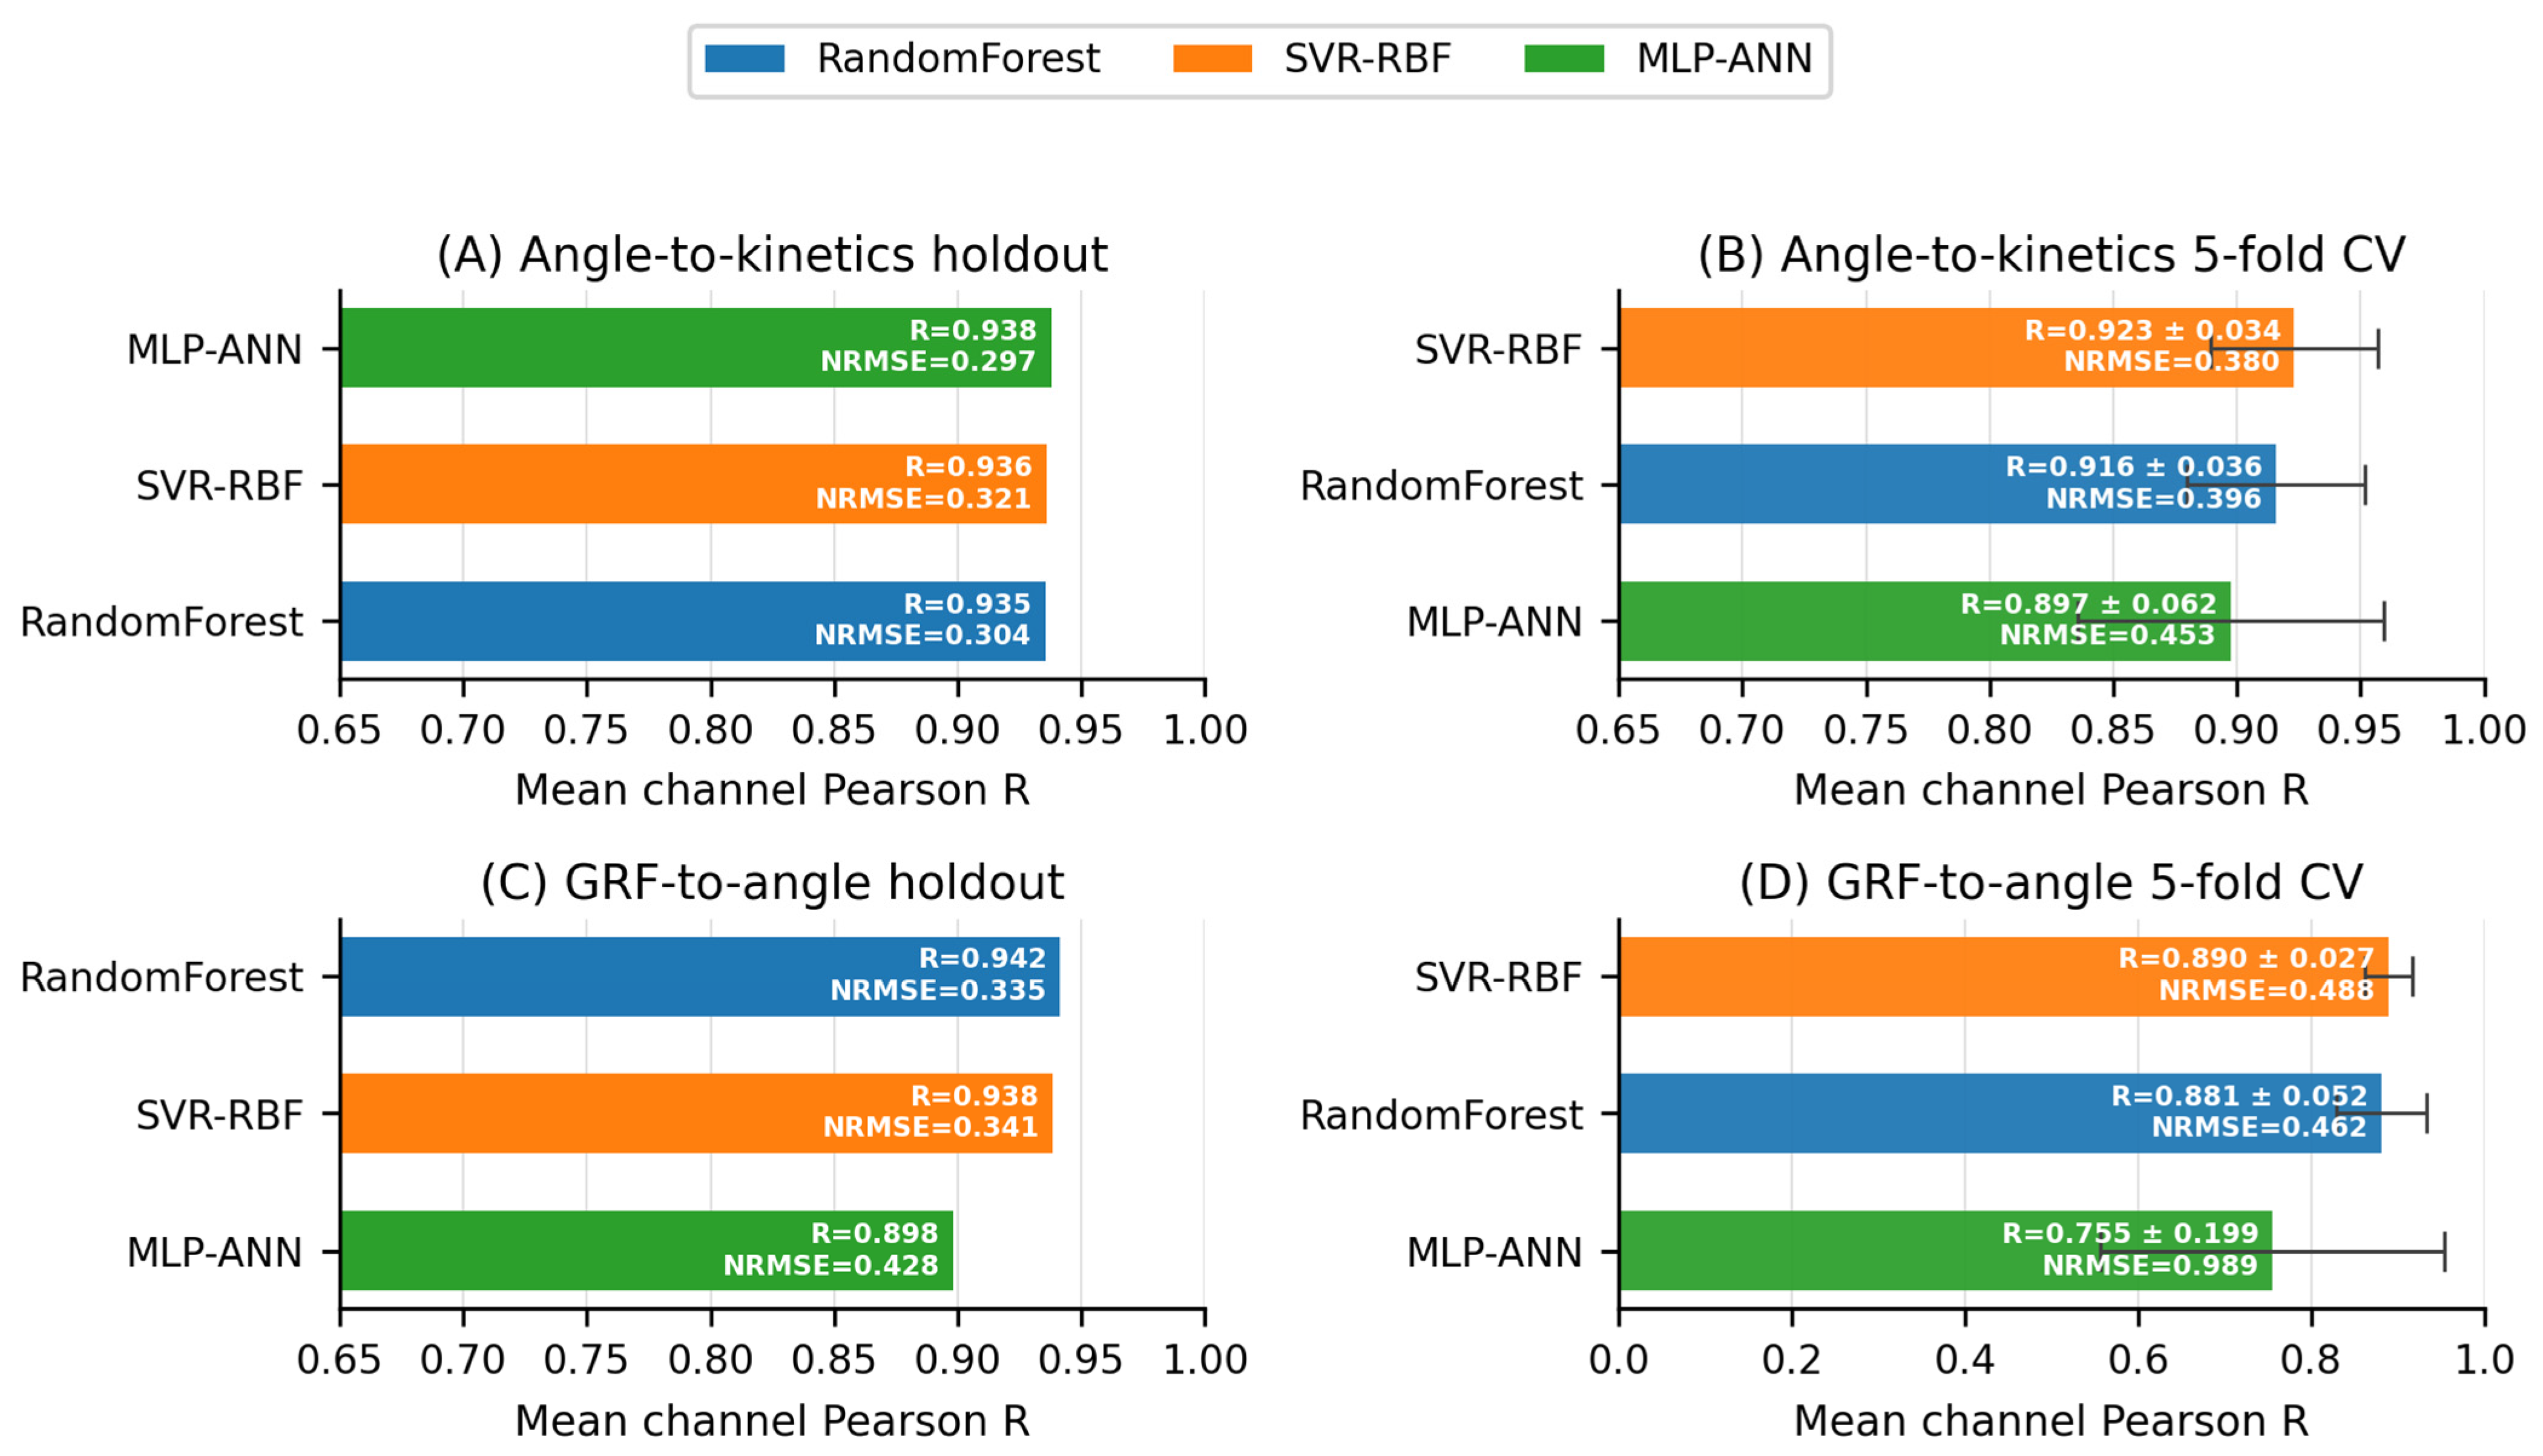
Tuned model comparison in a paired-task layout. (A) Task 1 one-participant-per-source holdout; (B) Task 1 participant-independent five-fold validation; (C) Task 2 one-participant-per-source holdout; (D) Task 2 participant-independent five-fold validation. Bars show the arithmetic mean of channel-specific Pearson R values, with equal channel weights; this is not correlation after pooling mixed-unit outputs. Cross-validation bars average the five fold-level mean channel correlations, and error bars show their SD. Normalized RMSE is annotated separately and remains the criterion for tuning and selection; higher R and lower normalized error indicate better performance. Model colors are consistent across panels. All settings are selected within the relevant training partition; test performance is not used for tuning. Correlation-axis limits are 0.65–1.00 in A–C and 0–1.00 in D, which includes the lower Task 2 MLP correlations. Compare the numerical R labels rather than apparent bar lengths across these scales. Blue, orange and green identify random forest, SVR-RBF and MLP-ANN, respectively.
A training-set mean-waveform baseline predicted each channel’s training-average trajectory for every held-out observation [45]. It used the same outer splits and scoring as the learned models. Ninety-five percent confidence intervals were estimated with 2000 bootstrap resamples of participants, stratified by study and keeping all observations of each resampled participant together. These intervals summarize the saved out-of-fold predictions from 32 or 39 participants, rather than only seven test participants. They are conditional on the fitted models and selected folds; they do not include uncertainty from repeating training, tuning or study sampling. Source-transfer results are reported separately for each withheld study. For pairwise procedure comparisons, the same participant resamples were applied to both procedures and the difference in mean channel NRMSE was recomputed in each resample. These intervals are descriptive and unadjusted for multiple comparisons. Supplementary Table S3 reports all pairwise comparisons. Individual representative-waveform RMSE distributions are summarized in Supplementary Table S2; their observation-level quantiles describe heterogeneity, not independent participant samples.
The Task 1 mass-ablation analysis removed the scalar mass feature and repeated the entire nested five-fold participant-independent procedure on the same 340 observations, with the same outer folds and independent inner tuning. A paired, study-stratified participant bootstrap compared the normalized error of the no-mass and mass-inclusive procedures. Because both source reconstruction and eligibility changed, revised-versus-submitted performance differences cannot be attributed to Kim exclusion alone. Anterior–posterior GRF was assessed with its own physical and normalized errors under target scaling; measurement signal-to-noise ratio was not estimated because an independent noise reference was unavailable.
3. Results
3.1. Reconstructed Data
The corrected data comprised 340 Task 1 and 361 Task 2 observations (Table 1). Mean vertical force across the gait cycle was 0.553, 0.495, 0.549 and 0.529 BW for the hip-exoskeleton, footwear, Kim walking and Kin sources, respectively; the corresponding median peak values were 1.197, 1.088, 1.382 and 1.152 BW. These checks support the single-limb interpretation but do not, by themselves, prove identical acquisition or calibration. The previously reported near-one-BW cycle average of the processed hip export is not retained or used as evidence of a bilateral target. Figure 1 shows the reconstructed distributions, including remaining source differences in joint offsets and waveform amplitudes.
3.2. Primary Participant-Independent Performance
Under nested participant-independent cross-validation, mean channel-normalized RMSE for the separately tuned model families was SVR-RBF 0.380, random forest 0.396, and MLP-ANN 0.453 in Task 1, and random forest 0.462, SVR-RBF 0.488, and MLP-ANN 0.989 in Task 2 (Table 4; Figure 2). Inner validation selected SVR-RBF in five folds for Task 1 and random forest in three folds and SVR-RBF in two folds for Task 2. The inner-selected procedure achieved scores of 0.380 (95% CI 0.281–0.475) and 0.496 (95% CI 0.383–0.594), respectively. The corresponding mean-waveform baseline scores were 0.524 and 0.649. These estimates describe the tested search spaces and budgets; the family ranking is descriptive and is not an independent test of universal algorithm superiority.
Table 4.
Primary participant-independent performance. Mean channel NRMSE is dimensionless and lower values indicate less error. Confidence intervals (CIs) are conditional, study-stratified participant-bootstrap intervals based on all out-of-fold predictions. The inner-selected procedure chooses its family using inner validation only; it is not the minimum outer test score.
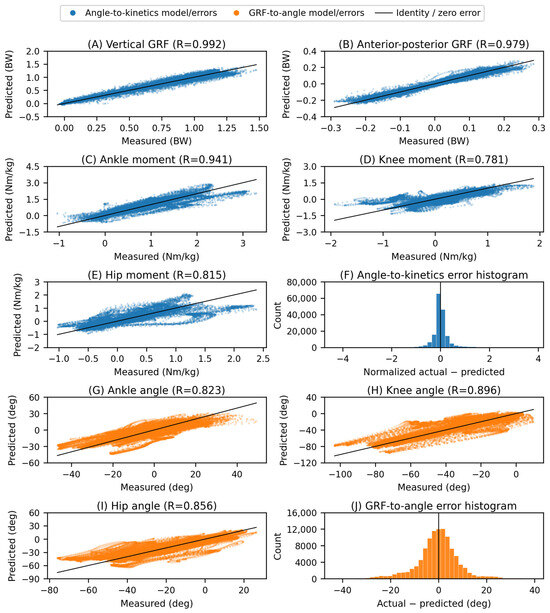
Task 1 channel-specific RMSEs for the inner-selected procedure were 0.060 (0.054–0.066) BW for vertical GRF, 0.018 (0.016–0.020) BW for anterior–posterior GRF, and 0.212 (0.157–0.264), 0.228 (0.165–0.289) and 0.260 (0.184–0.332) N m/kg for ankle, knee and hip moments (parentheses: 95% CI). Task 2 RMSEs were 7.01 (5.73–8.41)°, 9.76 (7.22–11.94)° and 9.74 (7.01–12.24)° for ankle, knee and hip angles. Table 5 provides MAE, correlation, R2 and normalized error for each channel (see Table 4 and Table 5; Figure 3). Correlation alone does not quantify absolute agreement or individual clinical utility (see Figure 3). Supplementary Table S1 reports the corresponding physical and normalized channel errors for every tuned family and the mean-waveform baseline under the same participant-independent splits. Supplementary Table S2 reports median, interquartile and 95th-percentile errors across individual representative waveforms.
Table 5.
Primary channel-specific performance of the inner-selected procedure. RMSE and MAE equally weight participants. Parentheses contain 95% participant-bootstrap intervals for RMSE. R and R2 pool only the coordinates of the stated channel. NRMSE uses each prediction’s outer-training channel SD and is dimensionless.
Figure 3.
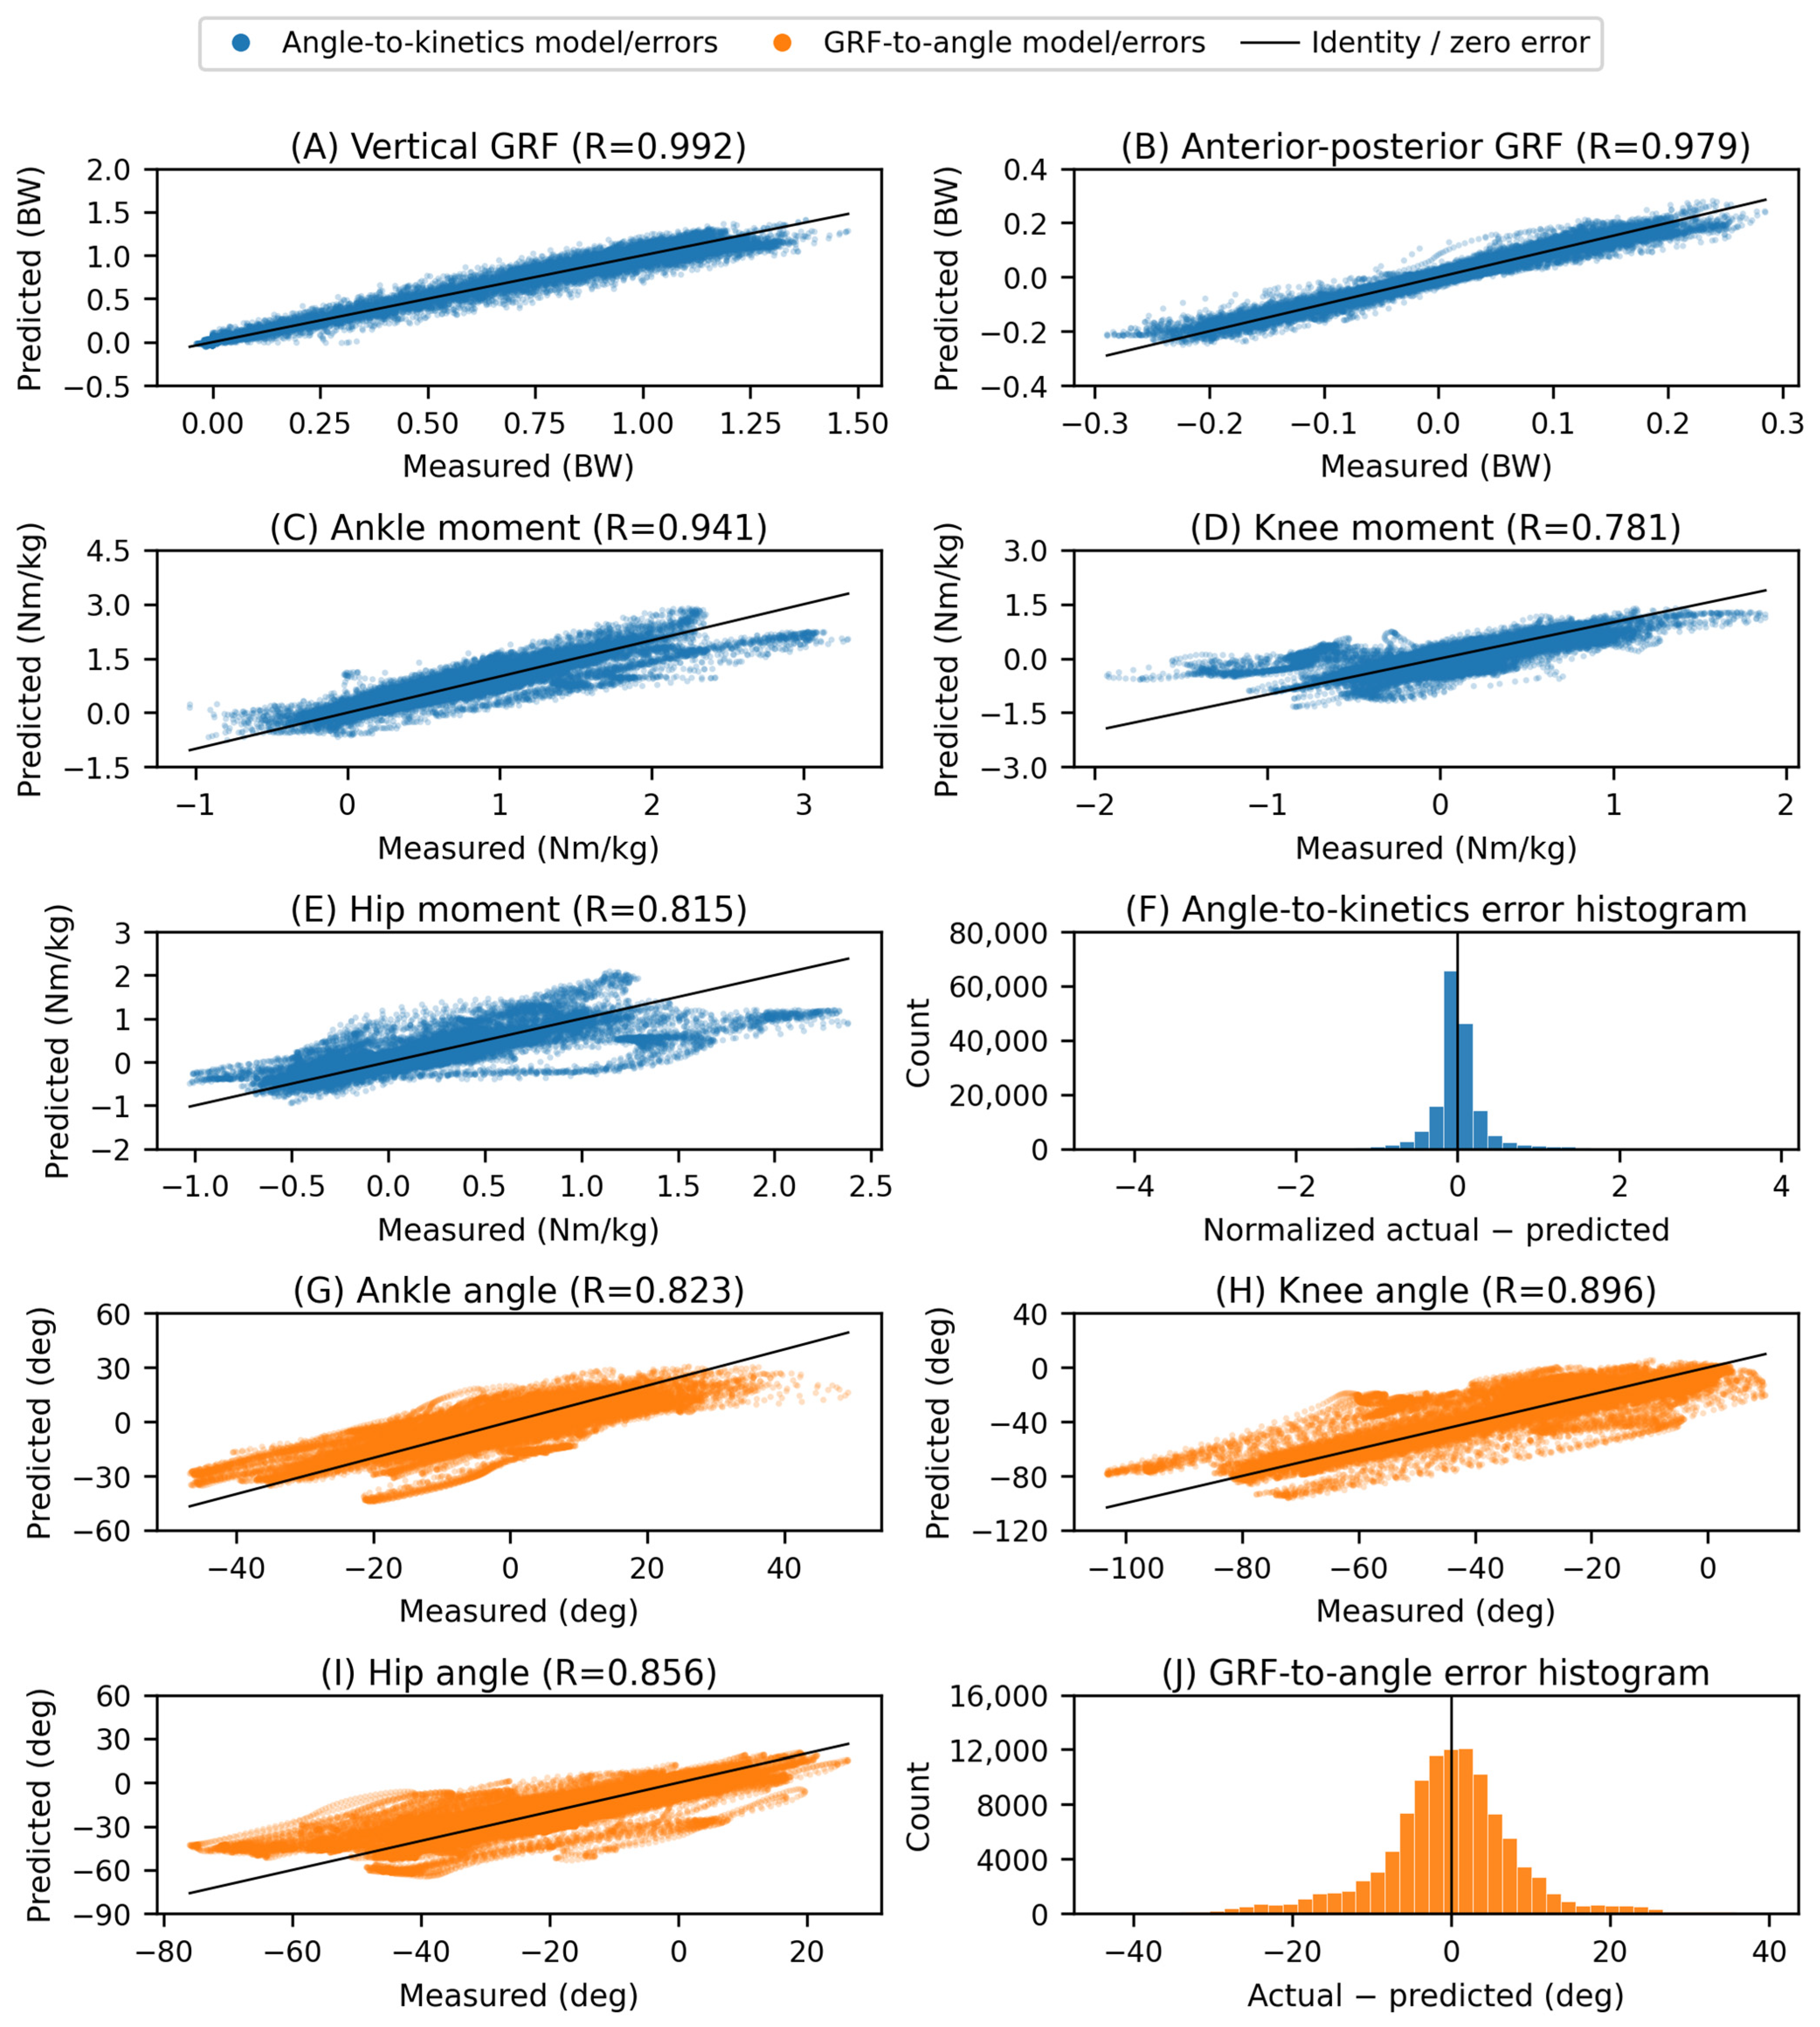
Primary participant-independent regression plots and error histograms from the inner-selected procedure. (A–E) Task 1 vertical GRF, anterior–posterior GRF, ankle moment, knee moment and hip moment; (F) Task 1 normalized-error histogram; (G–I) Task 2 ankle, knee and hip angles; (J) Task 2 error histogram. Blue denotes Task 1 and orange denotes Task 2. Black lines indicate identity or zero error. Each participant contributes only predictions made while excluded from training and tuning. Task 1 histogram errors are divided by the corresponding outer-training channel SD before pooling; Task 2 errors are in degrees. Channel-specific R does not measure absolute agreement. Each point is a gait cycle coordinate within a held-out representative waveform. Coordinates are repeated measurements within observations and participants, not independent samples.
3.3. Transfer to a Withheld Study
Leave-one-study-out mean channel-normalized errors ranged from 0.440 to 0.996 for Task 1 and 0.441–1.426 for Task 2 (Table 6). Channel-level withheld-source results for every tested family are provided in the accompanying analytical tables. The tuned MLP failed to transfer when Kin was withheld in Task 2 (mean channel NRMSE 637.470); inner validation selected random forest for this evaluation, and the unsuccessful MLP result is retained in the analytical tables. Training-source participant validation and withheld-study transfer answer different questions; neither a pooled average nor a favorable result for one source establishes transfer to every laboratory. Task 1 has three source-transfer tests, not four, because no measured Kim mass was available.
Table 6.
Leave-one-study-out transfer. The family shown was selected by participant-grouped inner validation in the remaining studies. The held-out study was excluded from all preprocessing, tuning and fitting. Lower mean channel NRMSE is better.
3.4. Secondary Splits and Mass Ablation
On the corrected Task 1 cohort, removing mass produced a nested participant-independent mean channel-normalized RMSE of 0.377 (95% CI 0.275–0.473), compared with 0.380 (95% CI 0.281–0.475) with mass. The paired no-mass minus mass difference was −0.003 (95% CI −0.025–0.012). The no-mass family scores were SVR-RBF 0.377, random forest 0.409, and MLP-ANN 0.471. This comparison evaluates the complete tuned procedures on identical participants; it does not establish a causal role for mass or rule out source-related information in other predictors.
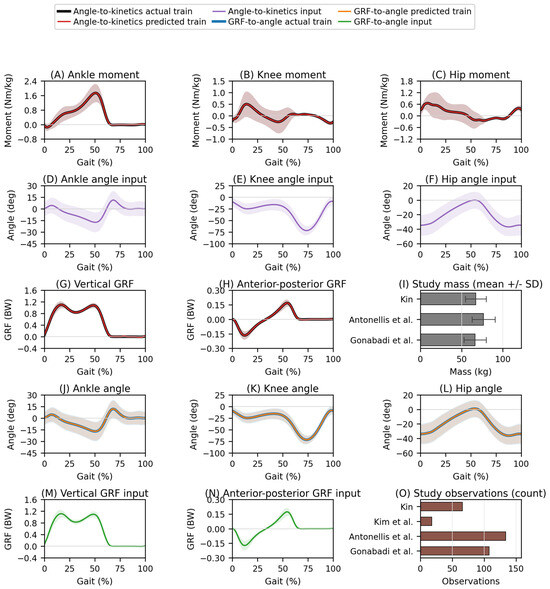
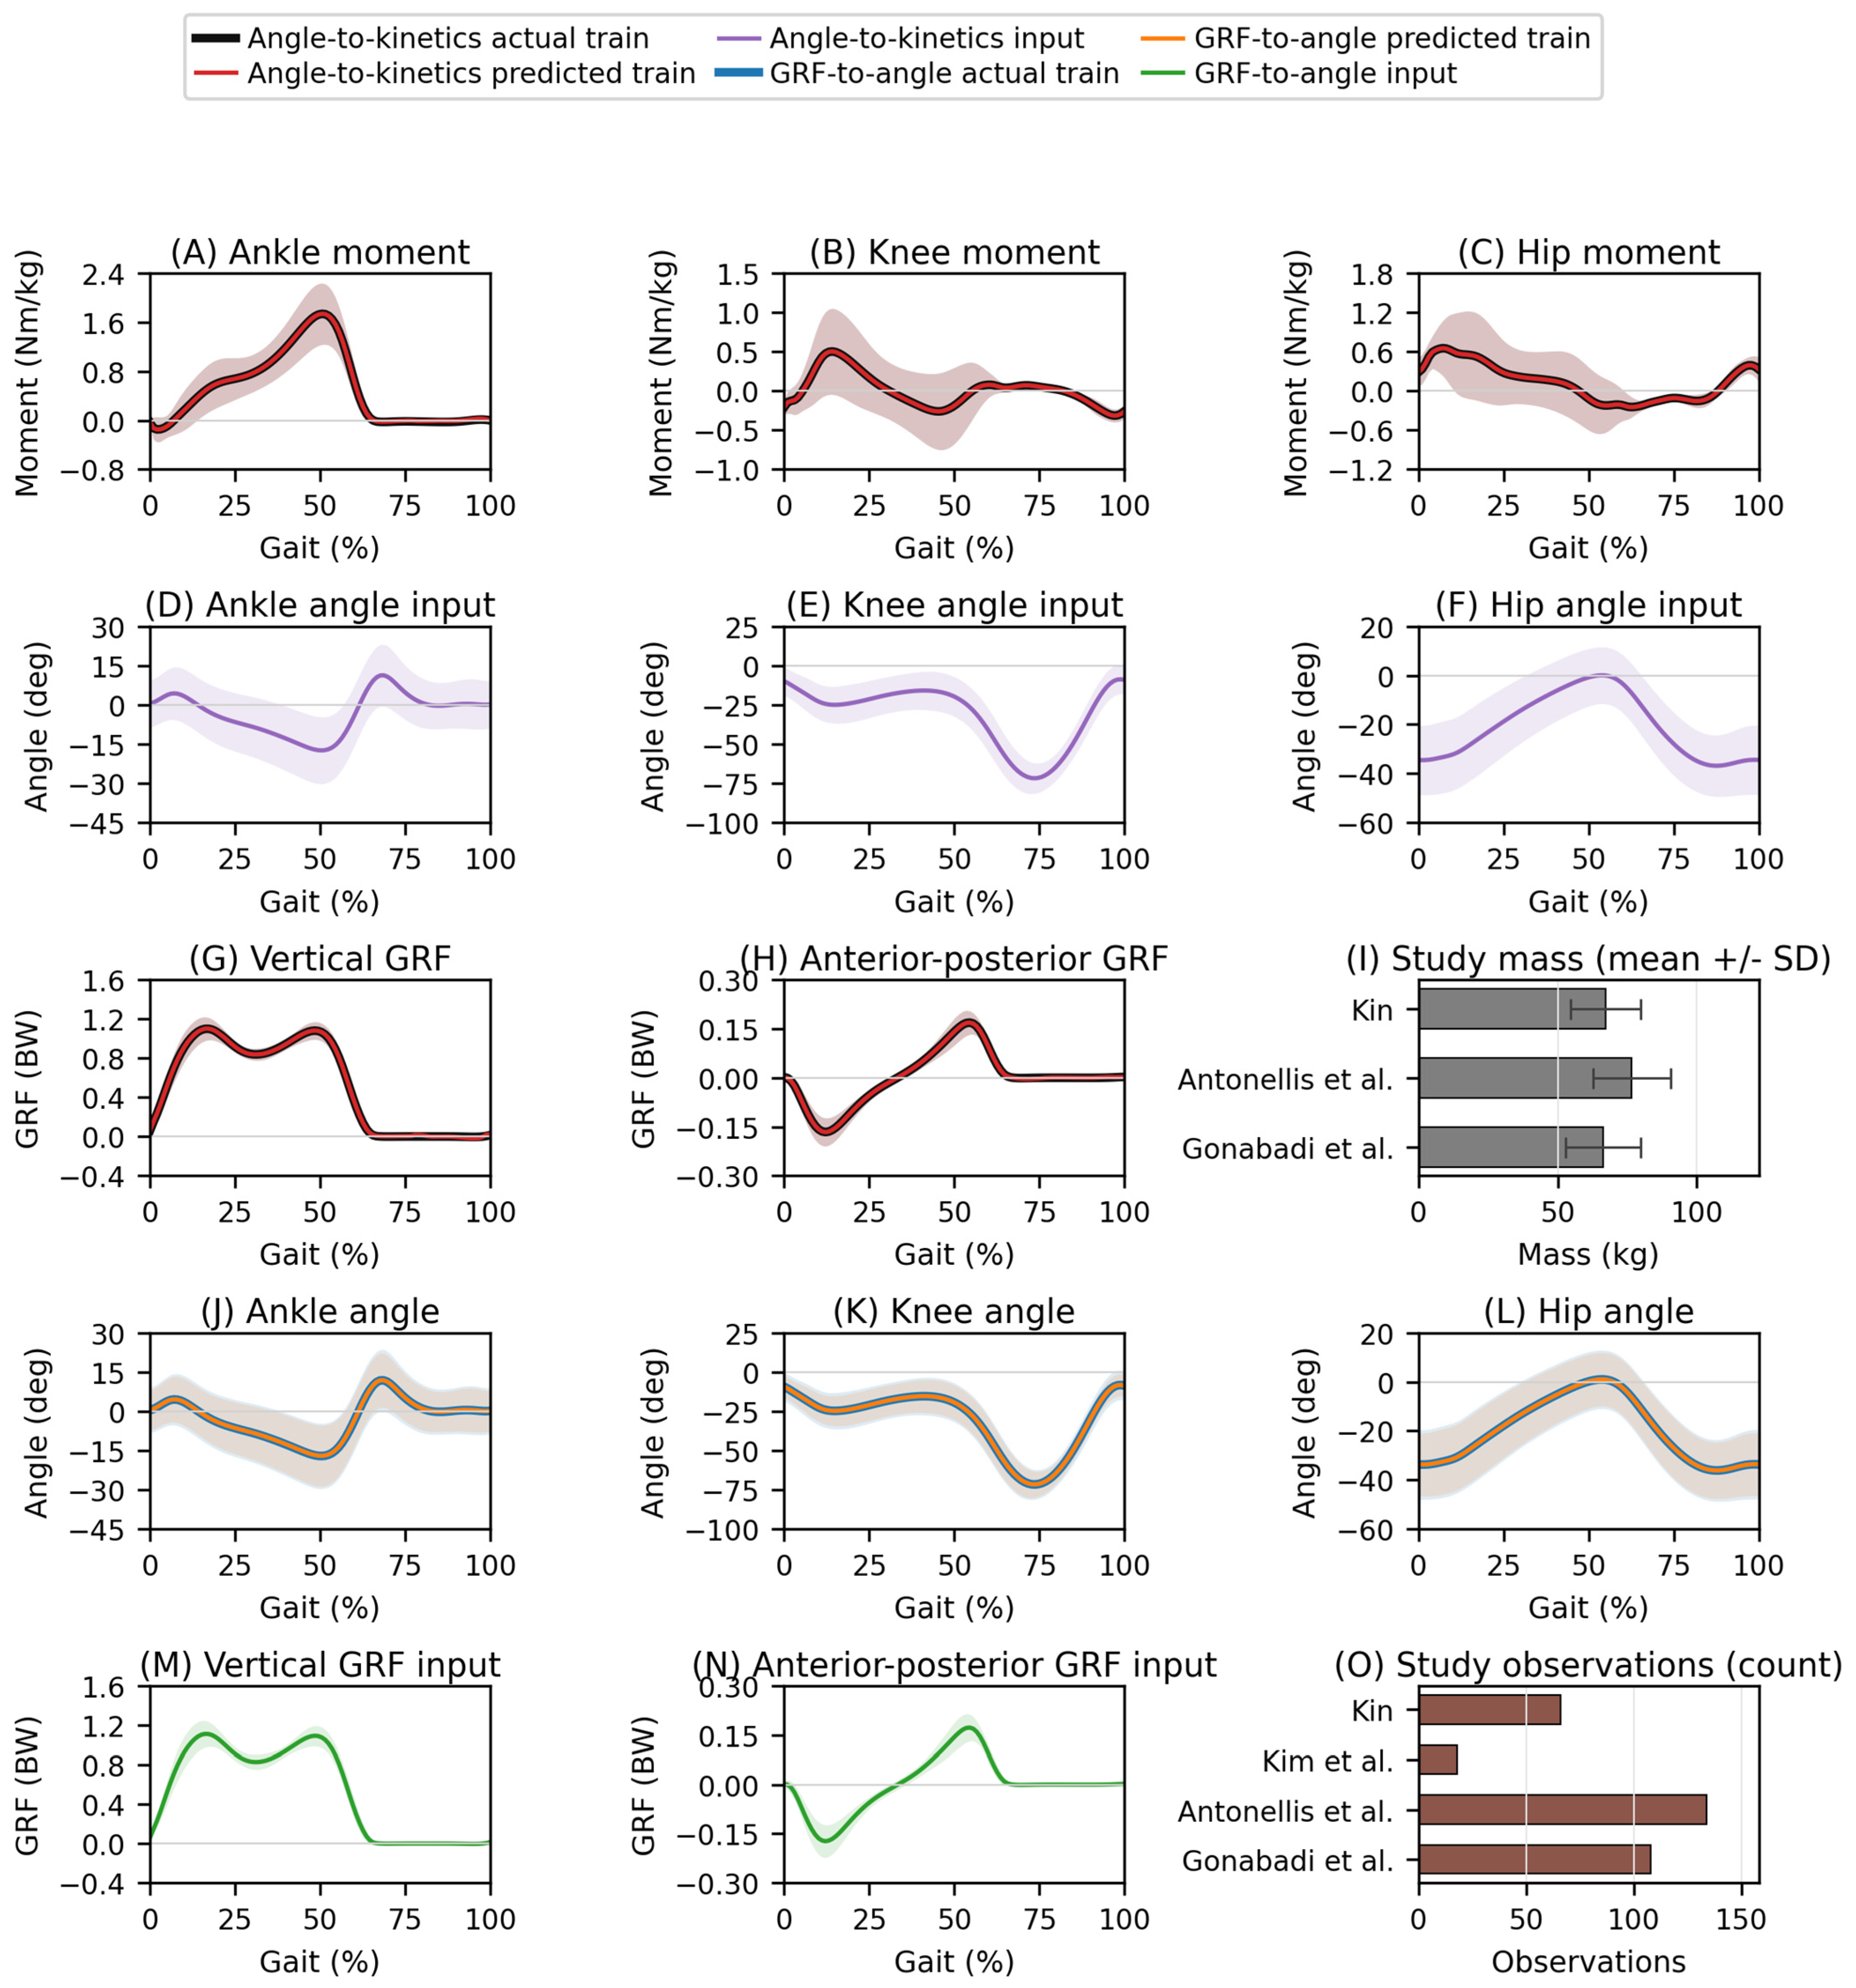
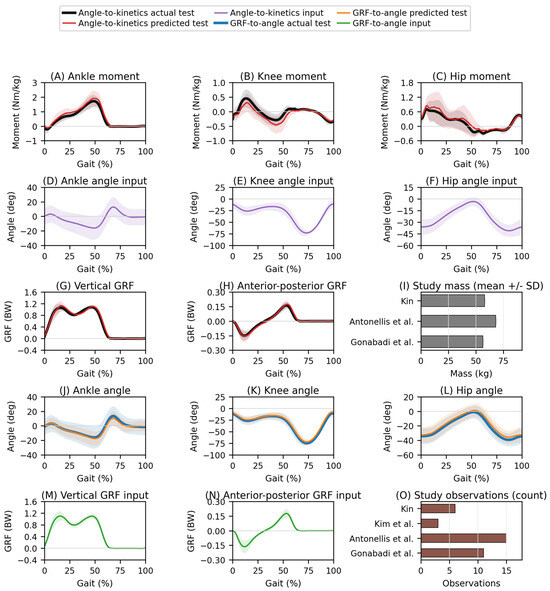
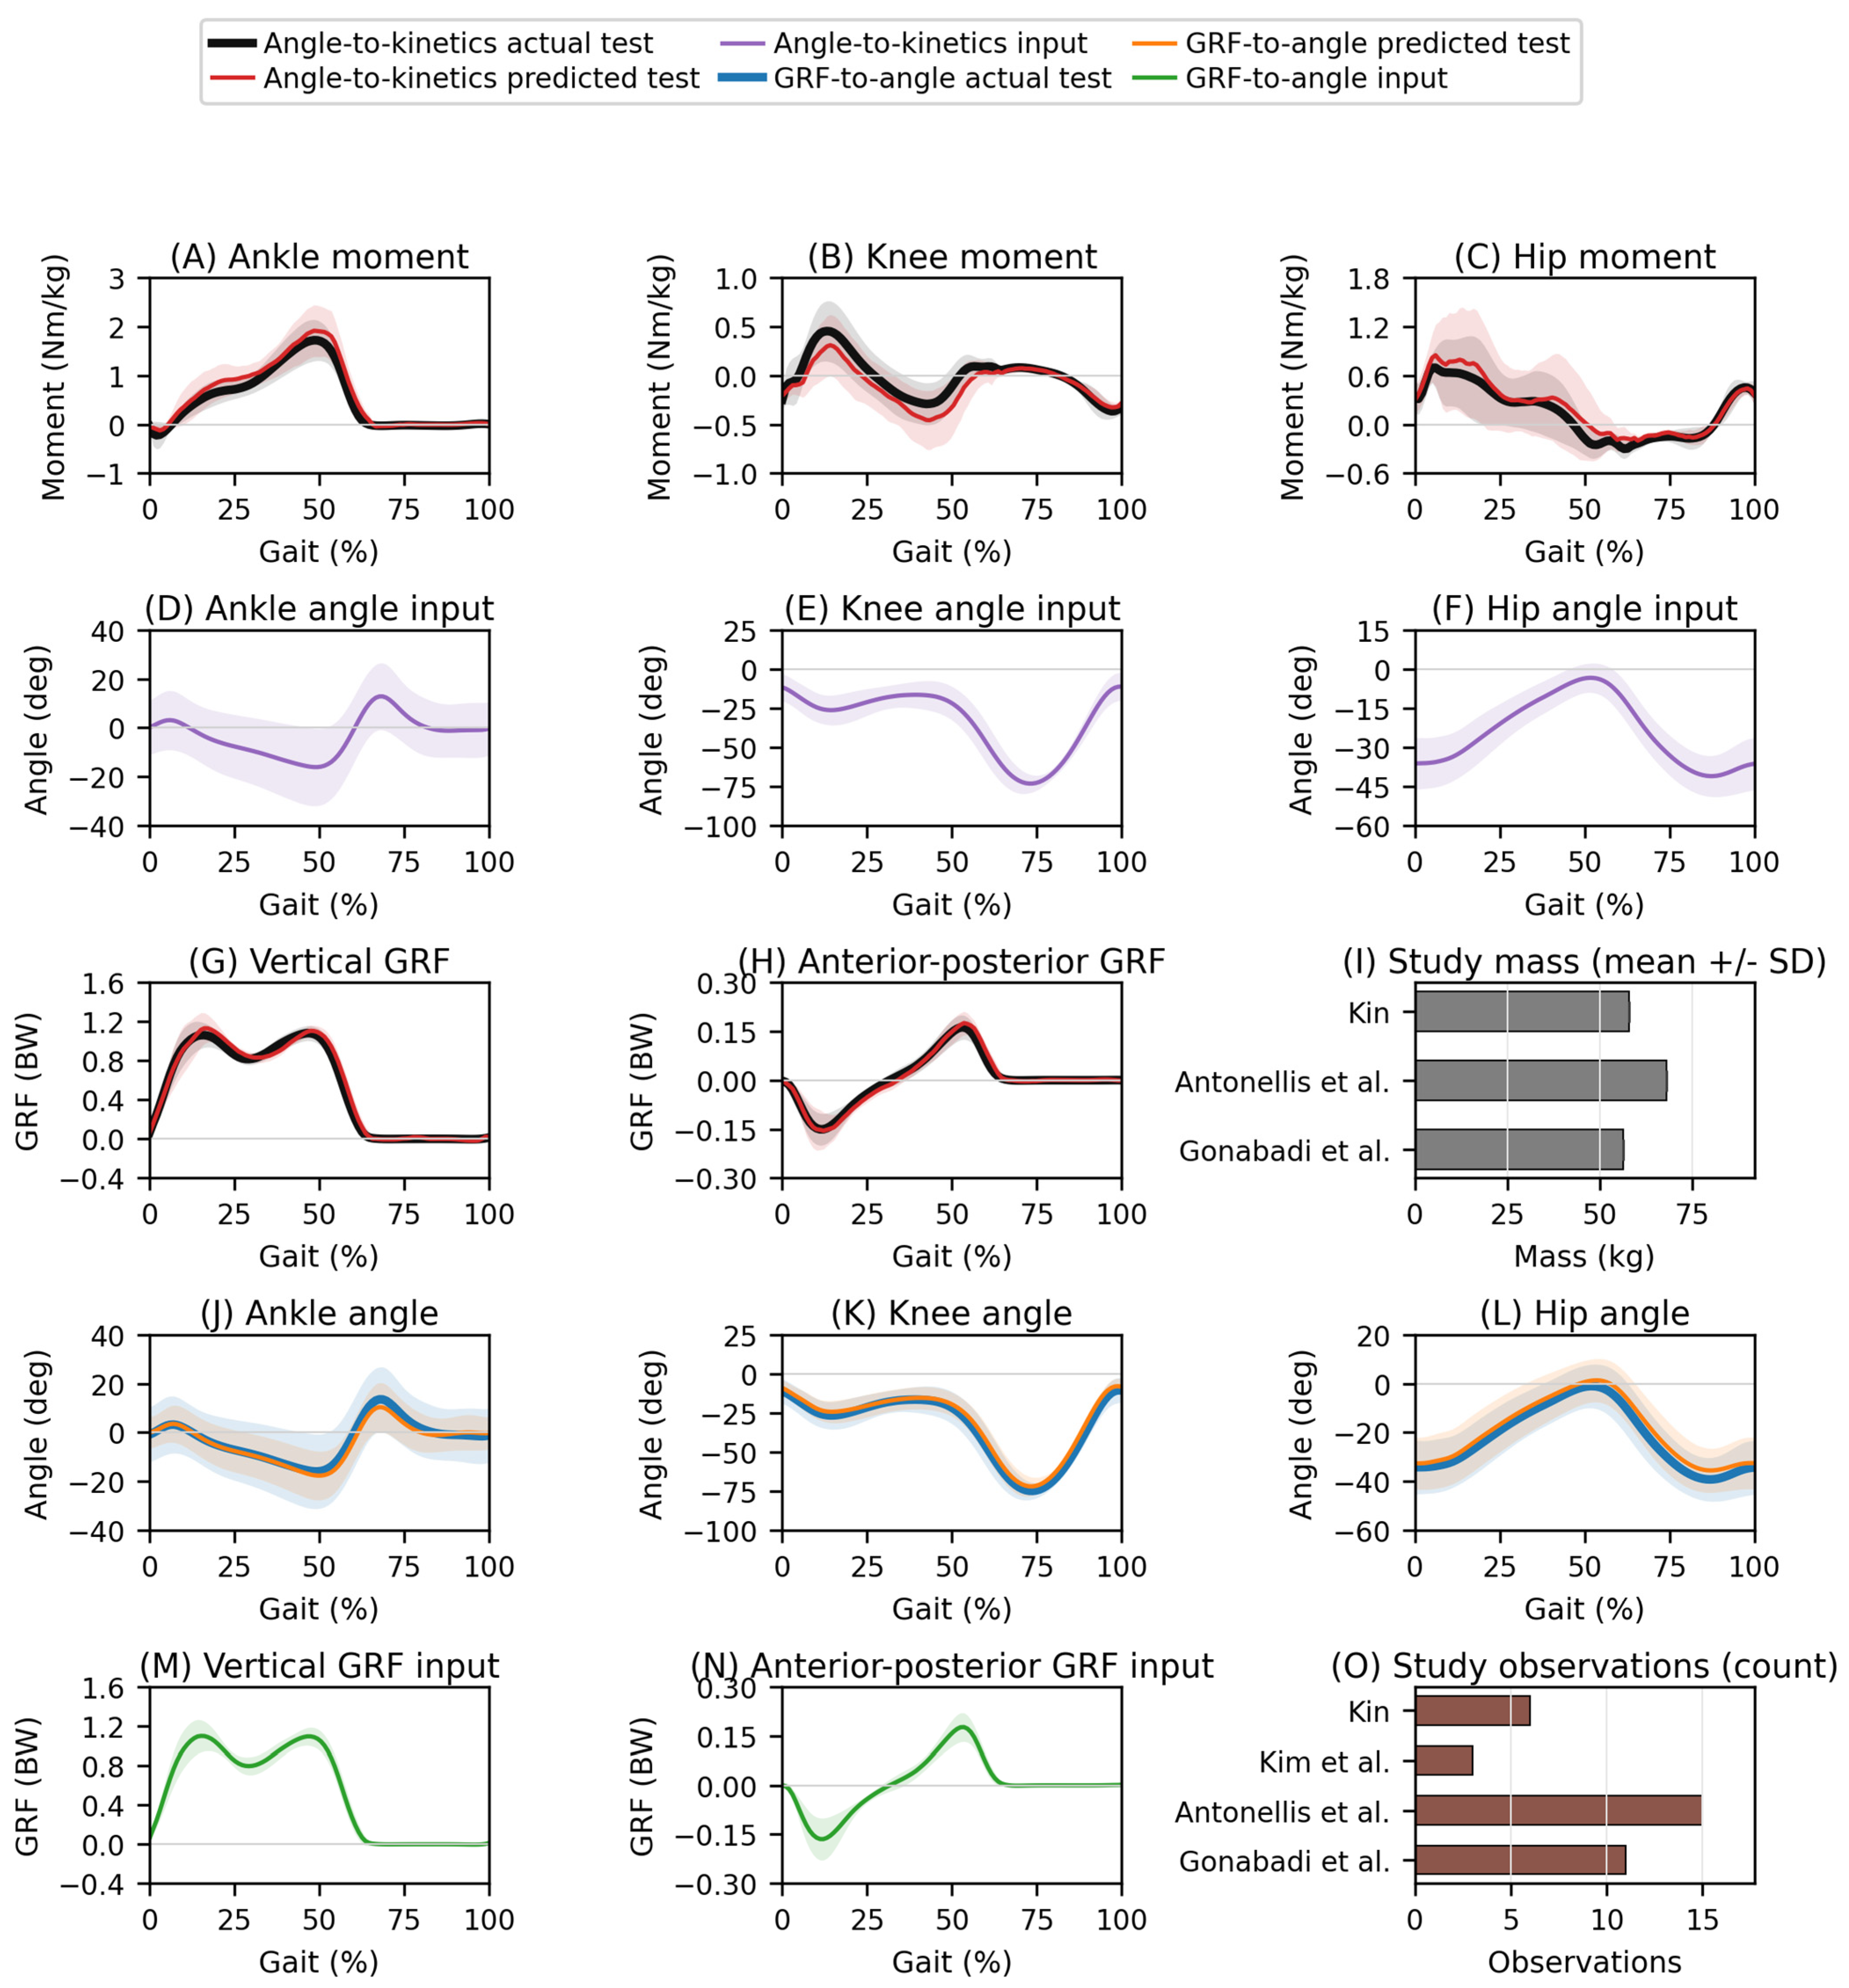
Figure 4 and Figure 5 retain the paired-task layout and show training and test observations, respectively, from the secondary one-participant-per-source holdout. Model families and settings were selected only by inner participant-grouped validation in the training set. The primary participant-independent results use all five outer folds (Table 4 and Table 5; Figure 3). The SD bands summarize between-observation dispersion and are not prediction intervals. Agreement of averaged curves does not imply equally accurate predictions for every participant or condition. Secondary evaluation scores are provided in Supplementary Table S4.
Figure 4.
Training observations from the secondary one-participant-per-source holdout, retaining the paired-task layout. (A–C) Ankle, knee and hip moments; (D–F) Task 1 angle inputs; (G,H) Task 1 vertical and anterior–posterior GRF; (I) recorded mass by study (Gonabadi et al. [33,34]; Antonellis et al. [35]; Kin [37]); (J–L) Task 2 ankle, knee and hip angles; (M,N) Task 2 GRF inputs; (O) Task 2 observation counts (Gonabadi et al. [33,34]; Antonellis et al. [35]; Kim [36]; Kin [37]). Task 1 actual/predicted curves are black/red and its inputs purple; Task 2 actual/predicted curves are blue/orange and its inputs green. Mass bars are gray and count bars brown. Curves show means ± one observation SD; mass bars summarize unique participants with sample SD. Force is BW, moments N m/kg and angles degrees. Training agreement is descriptive and is not an estimate of performance on unseen participants. Waveform colors identify task and measurement/prediction roles, not individual studies; each curve pools the eligible observations for its task and split. Kin contributes to both tasks; Kim contributes only to Task 2. The shadow areas of the lines are the SD.
Figure 5.
Test observations from the secondary one-participant-per-source holdout, using the same panels, colors and units as Figure 4. (A–C) Ankle, knee and hip moments; (D–F) Task 1 angle inputs; (G,H) Task 1 vertical and anterior–posterior GRF; (I) recorded mass by study (Gonabadi et al. [33,34]; Antonellis et al. [35]; Kin [37]); (J–L) Task 2 ankle, knee and hip angles; (M,N) Task 2 GRF inputs; (O) Task 2 observation counts (Gonabadi et al. [33,34]; Antonellis et al. [35]; Kim [36]; Kin [37]). Every condition of the selected participant in each eligible source is withheld from preprocessing, tuning and fitting. Task 1 contains three test participants and 32 observations (Gonabadi et al. [33,34]; Antonellis et al. [35]; Kin [37]); Task 2 contains four test participants and 35 observations (Gonabadi et al. [33,34]; Antonellis et al. [35]; Kim [36]; Kin [37]). Model selection uses only training-participant inner validation. Shading indicates ± one SD across test observations, not a prediction interval. Each mass bar represents one held-out participant, so between-participant SD is not estimable in that source; the zero-length error bar is only a display convention. The primary five-fold participant-independent results are reported separately in Table 4 and Table 5 and Figure 3. Waveform colors identify task and measurement/prediction roles, not individual studies; each curve pools the eligible observations for its task and split. Kin contributes to both tasks; Kim contributes only to Task 2. The shadow areas of the lines are the SD.
4. Discussion
The analysis uses harmonized walking waveforms and verified participant groups. Its principal estimates are the participant-independent channel errors in Table 5, with mean channel-normalized errors of 0.380 for angle-to-kinetics and 0.496 for GRF-to-angle prediction. Evaluating every participant out of sample gives a broader participant-level assessment than a single seven-person holdout, although all participants still belong to a small set of source studies.
Withheld-study errors ranged from 0.440 to 0.996 and 0.441 to 1.426 for the two tasks, demonstrating why source transfer must be reported separately from prediction of new participants within represented studies. The study-specific and channel-specific results identify where the learned associations transfer and where they do not. Differences in joint-model offsets, assistance, footwear, grade, speed and original filtering can persist despite using a common limb and force unit. The present analysis cannot separate biological heterogeneity from source- and pipeline-related heterogeneity in signal definitions, normalization, or processing. The leave-one-study-out experiments provide retrospective transfer evidence for these sources; they do not constitute prospective validation on an independently recruited cohort.
Measurement repeatability and reference-system uncertainty also matter when interpreting transfer across studies. Repeated gait measurements and systematic evaluation of three-dimensional kinematic reliability show that measurement variability depends on the quantity and protocol [46,47]. Skin-mounted markers introduce soft-tissue artifacts that complicate estimation of skeletal motion [48], while inertial measurements add sensor-placement, calibration and processing considerations [49]. These sources of uncertainty can influence both predictors and reference outcomes; the present reconstruction does not quantify their separate contributions to prediction error.
Training-only channel scaling and grouped tuning define the procedures compared here. These results therefore identify the best-performing tested configurations rather than a generally preferred algorithm, and they should not be interpreted as showing that neural networks are intrinsically inferior for these mappings; further model-specific tuning, larger datasets, or task-specific architectures may change the ranking. Paired participant-bootstrap differences (Supplementary Table S3) quantify uncertainty conditional on the fitted models and folds. This interpretation is consistent with evidence that forest performance depends on hyperparameter settings [50] and that selection uncertainty can be comparable to apparent differences between learning algorithms [44].
Anterior–posterior GRFs had an RMSE of 0.018 BW, normalized RMSE of 0.215 and correlation of 0.979, compared with 0.060 BW, 0.129 and 0.992 for vertical GRF. Smaller numerical amplitude can reduce an output’s contribution to an unscaled multi-output loss or make a fixed native-unit SVR epsilon large relative to that signal. The training-only channel scaling used here addresses those scale effects. Smaller amplitude alone does not demonstrate lower measurement signal-to-noise ratio, and this analysis lacks an independent noise estimate. Residual differences may involve unmeasured movement, timing, source processing or model fit; none of these mechanisms was isolated experimentally.
The mass-ablation comparison (Section 3.4) provides no clear improvement from adding mass in this reconstructed three-study cohort. It does not establish that mass is unimportant in other populations or justify imputing individual values from a group summary. Kim walking records remain usable in Task 2 because that mapping requires neither mass nor moments.
The mean-waveform baseline produced normalized errors of 0.524 and 0.649, against 0.380 and 0.496 for the corresponding inner-selected procedures. Reporting this comparator helps separate participant/condition-specific prediction from recovery of a stereotyped time-normalized gait shape [45]. Channel-specific physical errors are necessary because a high correlation can coexist with offsets or amplitude errors [51]. The waveform figures summarize the population dispersion and cannot substitute for participant-level error measures.
Both prediction directions have precedent in kinematic estimation of kinetics and force-based estimation of angles [16,17,18]. The present contribution is their evaluation with the same three model families, harmonized source waveforms, nested participant grouping and withheld-study tests. Because source participants, sensors and evaluation schemes differ from prior studies, numerical performance comparisons are not head-to-head algorithm tests. Treadmill and overground gait can differ [52,53,54], and models trained on laboratory waveforms do not automatically apply to inertial sensors, pressure insoles or markerless angles. Those applications require sensor-specific validation and an assessment of whether prediction errors are acceptable for the intended decision. Practically, the channel-specific errors can help determine which missing laboratory waveforms warrant further reconstruction research. The observed errors, source-transfer variability and individual-waveform tails must be judged against a prespecified application tolerance before using predictions for clinical decisions or device control; such tolerances and decision-level utility were not evaluated here.
These two separately fitted mappings should not be interpreted as proof of a unique biomechanical inverse: multiple kinematic patterns can produce similar external forces, and the models learn statistical regularities within the pooled walking distribution. Unlike inverse dynamics, however, the data-driven model receives neither the complete external wrench, segment accelerations, nor subject-specific inertial properties, so it approximates a statistical association rather than a deterministic mechanical solution [1,23]. Wouda et al. estimated knee kinematics and vertical GRF during running using three inertial sensors, with performance dependent on whether training was subject-specific or across subjects [55]. That work provides a related estimation example, but cannot establish running performance for models fitted only to the walking observations used here.
The two prediction directions address complementary measurement gaps, which we present as proposed application settings rather than validated use cases. Angle-to-kinetics estimation may be useful when optical, markerless, or inertial kinematics are available without force plates, whereas GRF-to-angle estimation may be useful on instrumented treadmills where force signals are available continuously but optical capture is impractical, complementing wearable inertial-sensor approaches to the indirect estimation of gait kinetics [3,5,6]. Translation to pressure insoles or exoskeleton load sensors would require sensor-specific models or calibration, because those devices do not necessarily measure the same single-limb vertical and anterior–posterior GRF components used here, and any downstream use of predicted waveforms should propagate prediction uncertainty and be validated end-to-end.
Related studies have used neural networks to estimate walking metabolic cost from GRF and joint moments [56] and from nonlinear gait metrics [57]. Those studies motivate examining the information carried by biomechanical signals, but address different prediction targets from the present waveform tasks. Studies of phase-dependent stability under hip-exoskeleton assistance [58] and trunk responses to perturbations [59] also illustrate outcomes that cannot be inferred from waveform correlation alone. Neural-network modeling of dual-task performance [60] and EMG-based simulation of personalized walking assistance [61] provide further examples of task-specific modeling. Their results do not constitute validation of the present models for cognition, perturbation recovery or closed-loop assistance; those applications require separate outcomes and independent evaluation.
Open gait datasets offer concrete settings for future evaluation beyond the present sources. Fukuchi et al. released overground and treadmill walking kinematics and kinetics across speeds [62]; Camargo et al. provided lower-limb biomechanics during stairs, ramps, level-ground ambulation and transitions [63]; and Moore et al. shared treadmill gait measurements with mechanical perturbations [64]. None of these resources was added to the current analyses. Their protocols illustrate additional tests of transfer that would require compatible signal definitions, eligible inputs and independent participant groups before model evaluation. Further priorities are phase- and feature-specific error reporting (stance- and swing-phase RMSE and peak magnitude, impulse, and timing errors), incorporation of additional GRF components and center-of-pressure information, and calibrated probabilistic uncertainty.
Several limitations remain. The sample contains only 32 or 39 participants and three or four source studies, with correlated condition-level averages and unequal source sizes. Group identifiers are verified within sources, but the available de-identified metadata cannot establish cross-study participant identity. The analysis was restricted to sagittal-plane joint angles, two GRF components, and sagittal joint moments; mediolateral GRF, frontal- and transverse-plane kinematics and kinetics, foot-segment orientation, and trunk and pelvis motion were not modeled. These unmeasured quantities may contribute to residual error, but their separate contributions were not tested. Force-unit checks and limb selection do not harmonize every source’s joint model, offset, calibration or filtering; the available force exports do not permit independent re-estimation of raw force-plate calibration uncertainty. Kin uses reported participant mass, which differs from its force-derived weight estimate and can contribute normalization error. Eligibility and numerical-stability rules were not preregistered; these analyses are exploratory. The bootstrap conditions on one set of outer folds and fitted models, and the optimization budget is limited [15,44]. No running, overground, pathological-gait or prospective independent-cohort validation was performed. These limitations constrain potential deployment. The secondary one-participant-per-source holdout contains only three or four people and is insufficient for precise stand-alone generalization estimates. Selecting a model on its test performance would bias that estimate; model selection here uses training-participant validation only.
5. Conclusions
Using verified participant groups and reconstructed single-limb waveforms, nested participant-independent evaluation produced Task 1 GRF RMSEs of 0.060 and 0.018 BW and moment RMSEs of 0.212–0.260 N m/kg across the reported ankle, knee and hip outcomes; Task 2 joint-angle RMSEs were 7.01–9.76°. Channel-specific results and withheld-study tests provide the basis for interpretation. Model comparisons apply to the tested, target-scaled hyperparameter searches. Demonstrated performance is confined to adult treadmill-walking data from these sources, including retrospective evaluation on each withheld source. Transfer performance varied across datasets. Reduced-instrumentation gait analysis remains a research direction pending independent prospective, overground and pathological-gait validation.
Supplementary Materials
The following supporting information can be downloaded at: https://www.mdpi.com/article/10.3390/app16199891/s1. Table S1: Participant-independent errors for every procedure and output channel; Table S2: Individual representative-waveform RMSE distributions under participant-independent validation; Table S3: Paired differences in participant-independent mean channel NRMSE (A minus B); Table S4: Secondary evaluations.
Author Contributions
A.M.G. = Arash Mohammadzadeh Gonabadi; J.M.B. = Judith M. Burnfield. Data curation refers to assembly and processing of the pooled joint-angle, joint-moment, and ground reaction force waveforms from the four contributing studies. A.M.G.: Conceptualization, Data curation, Formal analysis, Funding acquisition, Investigation, Methodology, Project administration, Resources, Software, Supervision, Validation, Visualization, Writing—original draft, Writing—review and editing. J.M.B.: Writing—review and editing. All authors have read and agreed to the published version of the manuscript.
Funding
This research was supported by the American Heart Association (grants 25CDA1454074 and 26AIREA1571620; PI/Co-I: A. Mohammadzadeh Gonabadi).
Institutional Review Board Statement
This study reanalyzed existing de-identified datasets publicly shared for reuse; it involved no new recruitment, intervention or data collection, and no new IRB determination was obtained. Original approvals were reported by the source studies: University of Nebraska Medical Center IRB 0101-19-FB (22 April 2019) for the hip-exoskeleton study [33,34]; University of Nebraska Medical Center IRB for the footwear study [35]; Harvard Medical School Committee on Human Studies for the Kim study [36]; and Cleveland State University IRB-FY2017-286 for the Kin study [37].
Informed Consent Statement
The source investigations reported informed consent from their participants [33,34,35,36,37]; the hip-exoskeleton, footwear and Kim reports specify written informed consent [33,34,35,36]. No additional consent was sought for this secondary analysis of the publicly shared de-identified records, which involved no participant contact or new measurements.
Data Availability Statement
The reconstructed feature and target matrices, observation and participant split manifests, complete hyperparameter search histories, held-out predictions and analysis code are available from the corresponding author on reasonable request. The hip-exoskeleton source data were collected in the authors’ laboratory and are available through the original open access publications [33,34,58] (https://doi.org/10.3389/frobt.2025.1669600; https://doi.org/10.3390/biomimetics9040211; https://doi.org/10.3390/app15137530). The portable-exosuit source data are publicly available as supplementary data file S5 of the original publication [36] (https://doi.org/10.1126/science.aav7536). The footwear/outsole-geometry source data are available through the original open access publication [35] (https://doi.org/10.1098/rsos.191527). The Kin laboratory-walking source data are openly available in the Zenodo repository (https://zenodo.org/records/3726551; DOI: https://doi.org/10.5281/zenodo.3726551; CC BY 4.0) accompanying the original open access publication [37] (https://doi.org/10.1371/journal.pone.0222037). Access to each original source remains subject to its original distribution terms. No synthetic participant masses are included in the revised analytical dataset.
Acknowledgments
We thank the investigators and participants of the hip-exoskeleton, footwear, Kim and Kin studies for the datasets shared for secondary research [33,34,35,36,37].
Conflicts of Interest
The authors declare no conflicts of interest.
References
- Winter, D.A. Biomechanics and Motor Control of Human Movement; Wiley: Hoboken, NJ, USA, 2009. [Google Scholar]
- Perry, J.; Burnfield, J.M. Gait Analysis: Normal and Pathological Function, 2nd ed.; Slack Incorporated: Thorofare, NJ, USA, 2010. [Google Scholar]
- Ancillao, A.; Tedesco, S.; Barton, J.; O’Flynn, B. Indirect Measurement of Ground Reaction Forces and Moments by Means of Wearable Inertial Sensors: A Systematic Review. Sensors 2018, 18, 2564. [Google Scholar] [CrossRef] [Scilit]
- Uhlrich, S.D.; Falisse, A.; Kidziński, Ł.; Muccini, J.; Ko, M.; Chaudhari, A.S.; Hicks, J.L.; Delp, S.L. OpenCap: Human Movement Dynamics from Smartphone Videos. PLoS Comput. Biol. 2023, 19, e1011462. [Google Scholar] [CrossRef] [Scilit]
- Gurchiek, R.D.; Cheney, N.; McGinnis, R.S. Estimating Biomechanical Time-Series with Wearable Sensors: A Systematic Review of Machine Learning Techniques. Sensors 2019, 19, 5227. [Google Scholar] [CrossRef] [Scilit]
- Mundt, M. Bridging the Lab-to-Field Gap Using Machine Learning: A Narrative Review. Sports Biomech. 2025, 24, 2779–2798. [Google Scholar] [CrossRef] [Scilit]
- Kanko, R.M.; Laende, E.K.; Davis, E.M.; Selbie, W.S.; Deluzio, K.J. Concurrent Assessment of Gait Kinematics Using Marker-Based and Markerless Motion Capture. J. Biomech. 2021, 127, 110665. [Google Scholar] [CrossRef] [Scilit]
- Horsak, B.; Eichmann, A.; Lauer, K.; Prock, K.; Krondorfer, P.; Siragy, T.; Dumphart, B. Concurrent Validity of Smartphone-Based Markerless Motion Capturing to Quantify Lower-Limb Joint Kinematics in Healthy and Pathological Gait. J. Biomech. 2023, 159, 111801. [Google Scholar] [CrossRef] [Scilit]
- Rapp, E.; Shin, S.; Thomsen, W.; Ferber, R.; Halilaj, E. Estimation of Kinematics from Inertial Measurement Units Using a Combined Deep Learning and Optimization Framework. J. Biomech. 2021, 116, 110229. [Google Scholar] [CrossRef] [Scilit]
- Mundt, M.; Thomsen, W.; Witter, T.; Koeppe, A.; David, S.; Bamer, F.; Potthast, W.; Markert, B. Prediction of Lower Limb Joint Angles and Moments during Gait Using Artificial Neural Networks. Med. Biol. Eng. Comput. 2020, 58, 211–225. [Google Scholar] [CrossRef] [Scilit]
- Dorschky, E.; Nitschke, M.; Martindale, C.F.; van den Bogert, A.J.; Koelewijn, A.D.; Eskofier, B.M. CNN-Based Estimation of Sagittal Plane Walking and Running Biomechanics From Measured and Simulated Inertial Sensor Data. Front. Bioeng. Biotechnol. 2020, 8, 604. [Google Scholar] [CrossRef] [Scilit]
- Lim, H.; Kim, B.; Park, S. Prediction of Lower Limb Kinetics and Kinematics during Walking by a Single IMU on the Lower Back Using Machine Learning. Sensors 2019, 20, 130. [Google Scholar] [CrossRef] [Scilit]
- Halilaj, E.; Rajagopal, A.; Fiterau, M.; Hicks, J.L.; Hastie, T.J.; Delp, S.L. Machine Learning in Human Movement Biomechanics: Best Practices, Common Pitfalls, and New Opportunities. J. Biomech. 2018, 81, 1–11. [Google Scholar] [CrossRef] [Scilit]
- Saeb, S.; Lonini, L.; Jayaraman, A.; Mohr, D.C.; Kording, K.P. The Need to Approximate the Use-Case in Clinical Machine Learning. Gigascience 2017, 6, gix019. [Google Scholar] [CrossRef] [Scilit]
- Vabalas, A.; Gowen, E.; Poliakoff, E.; Casson, A.J. Machine Learning Algorithm Validation with a Limited Sample Size. PLoS ONE 2019, 14, e0224365. [Google Scholar] [CrossRef] [Scilit]
- Mundt, M.; Koeppe, A.; David, S.; Bamer, F.; Potthast, W.; Markert, B. Prediction of Ground Reaction Force and Joint Moments Based on Optical Motion Capture Data during Gait. Med. Eng. Phys. 2020, 86, 29–34. [Google Scholar] [CrossRef] [Scilit]
- Oh, S.E.; Choi, A.; Mun, J.H. Prediction of Ground Reaction Forces during Gait Based on Kinematics and a Neural Network Model. J. Biomech. 2013, 46, 2372–2380. [Google Scholar] [CrossRef] [Scilit]
- Li, G.; Liu, T.; Yi, J.; Wang, H.; Li, J.; Inoue, Y. The Lower Limbs Kinematics Analysis by Wearable Sensor Shoes. IEEE Sens. J. 2016, 16, 2627–2638. [Google Scholar] [CrossRef] [Scilit]
- Mohammadzadeh Gonabadi, A.; Fallahtafti, F.; Pipinos, I.I.; Myers, S.A. Predicting Lower Body Joint Moments and Electromyography Signals Using Ground Reaction Forces during Walking and Running: An Artificial Neural Network Approach. Gait Posture 2025, 117, 323–331. [Google Scholar] [CrossRef] [Scilit]
- Ardestani, M.M.; Zhang, X.; Wang, L.; Lian, Q.; Liu, Y.; He, J.; Li, D.; Jin, Z. Human Lower Extremity Joint Moment Prediction: A Wavelet Neural Network Approach. Expert Syst. Appl. 2014, 41, 4422–4433. [Google Scholar] [CrossRef] [Scilit]
- Johnson, W.R.; Mian, A.; Robinson, M.A.; Verheul, J.; Lloyd, D.G.; Alderson, J.A. Multidimensional Ground Reaction Forces and Moments From Wearable Sensor Accelerations via Deep Learning. IEEE Trans. Biomed. Eng. 2021, 68, 289–297. [Google Scholar] [CrossRef] [Scilit]
- Stetter, B.J.; Krafft, F.C.; Ringhof, S.; Stein, T.; Sell, S. A Machine Learning and Wearable Sensor Based Approach to Estimate External Knee Flexion and Adduction Moments During Various Locomotion Tasks. Front. Bioeng. Biotechnol. 2020, 8, 9. [Google Scholar] [CrossRef] [Scilit]
- Karatsidis, A.; Bellusci, G.; Schepers, H.; De Zee, M.; Andersen, M.; Veltink, P. Estimation of Ground Reaction Forces and Moments During Gait Using Only Inertial Motion Capture. Sensors 2016, 17, 75. [Google Scholar] [CrossRef] [Scilit]
- Dorschky, E.; Nitschke, M.; Seifer, A.-K.; van den Bogert, A.J.; Eskofier, B.M. Estimation of Gait Kinematics and Kinetics from Inertial Sensor Data Using Optimal Control of Musculoskeletal Models. J. Biomech. 2019, 95, 109278. [Google Scholar] [CrossRef] [Scilit]
- Kapoor, S.; Narayanan, A. Leakage and the Reproducibility Crisis in Machine-Learning-Based Science. Patterns 2023, 4, 100804. [Google Scholar] [CrossRef] [Scilit]
- Moghadam, S.M.; Yeung, T.; Choisne, J. A Comparison of Machine Learning Models’ Accuracy in Predicting Lower-Limb Joints’ Kinematics, Kinetics, and Muscle Forces from Wearable Sensors. Sci. Rep. 2023, 13, 5046. [Google Scholar] [CrossRef] [Scilit]
- Altai, Z.; Boukhennoufa, I.; Zhai, X.; Phillips, A.; Moran, J.; Liew, B.X.W. Performance of Multiple Neural Networks in Predicting Lower Limb Joint Moments Using Wearable Sensors. Front. Bioeng. Biotechnol. 2023, 11, 1215770. [Google Scholar] [CrossRef] [Scilit]
- Mohammadzadeh Gonabadi, A.; Najafi, B.; Fallahtafti, F. How Modular Footwear Affects Gait Stability on Inclines: A Phase-Dependent Gait Analysis. Footwear Sci. 2026, 1–14. Available online: https://www.tandfonline.com/doi/full/10.1080/19424280.2026.2736537 (accessed on 1 October 2026). [CrossRef] [Scilit]
- Lewis, C.L.; Ferris, D.P. Walking with Increased Ankle Pushoff Decreases Hip Muscle Moments. J. Biomech. 2008, 41, 2082–2089. [Google Scholar] [CrossRef] [Scilit]
- Collins, S.H.; Wiggin, M.B.; Sawicki, G.S. Reducing the Energy Cost of Human Walking Using an Unpowered Exoskeleton. Nature 2015, 522, 212–215. [Google Scholar] [CrossRef] [Scilit]
- Zhang, J.; Fiers, P.; Witte, K.A.; Jackson, R.W.; Poggensee, K.L.; Atkeson, C.G.; Collins, S.H. Human-in-the-Loop Optimization of Exoskeleton Assistance during Walking. Science 2017, 356, 1280–1284. [Google Scholar] [CrossRef] [Scilit]
- Ding, Y.; Kim, M.; Kuindersma, S.; Walsh, C.J. Human-in-the-Loop Optimization of Hip Assistance with a Soft Exosuit during Walking. Sci. Robot. 2018, 3, 1–9. [Google Scholar] [CrossRef] [Scilit]
- Mohammadzadeh Gonabadi, A.; Pipinos, I.I.; Myers, S.A.; Fallahtafti, F. Optimizing Hip Exoskeleton Assistance Pattern Based on Machine Learning and Simulation Algorithms: A Personalized Approach to Metabolic Cost Reduction. Front. Robot. AI 2025, 12, 1669600. [Google Scholar] [CrossRef] [Scilit]
- Mohammadzadeh Gonabadi, A.; Antonellis, P.; Dzewaltowski, A.C.; Myers, S.A.; Pipinos, I.I.; Malcolm, P. Design and Evaluation of a Bilateral Semi-Rigid Exoskeleton to Assist Hip Motion. Biomimetics 2024, 9, 211. [Google Scholar] [CrossRef] [Scilit]
- Antonellis, P.; Frederick, C.M.; Gonabadi, A.M.; Malcolm, P. Modular Footwear That Partially Offsets Downhill or Uphill Grades Minimizes the Metabolic Cost of Human Walking. R. Soc. Open Sci. 2020, 7, 191527. [Google Scholar] [CrossRef] [Scilit]
- Kim, J.; Lee, G.; Heimgartner, R.; Arumukhom Revi, D.; Karavas, N.; Nathanson, D.; Galiana, I.; Eckert-Erdheim, A.; Murphy, P.; Perry, D.; et al. Reducing the Metabolic Rate of Walking and Running with a Versatile, Portable Exosuit. Science 2019, 365, 668–672. [Google Scholar] [CrossRef] [Scilit]
- Koelewijn, A.D.; Heinrich, D.; van den Bogert, A.J. Metabolic Cost Calculations of Gait Using Musculoskeletal Energy Models, a Comparison Study. PLoS ONE 2019, 14, e0222037. [Google Scholar] [CrossRef] [Scilit]
- Smola, A.J.; Schölkopf, B. A Tutorial on Support Vector Regression. Stat. Comput. 2004, 14, 199–222. [Google Scholar] [CrossRef] [Scilit]
- Breiman, L. Random Forests. Mach. Learn. 2001, 45, 5–32. [Google Scholar] [CrossRef] [Scilit]
- Rumelhart, D.E.; Hinton, G.E.; Williams, R.J. Learning Representations by Back-Propagating Errors. Nature 1986, 323, 533–536. [Google Scholar] [CrossRef] [Scilit]
- Bergstra, J.; Bengio, Y. Random Search for Hyper-Parameter Optimization. J. Mach. Learn. Res. 2012, 13, 281–305. [Google Scholar]
- Kingma, D.P.; Ba, J. Adam: A Method for Stochastic Optimization. arXiv 2017, arXiv:1412.6980. [Google Scholar]
- Varma, S.; Simon, R. Bias in Error Estimation When Using Cross-Validation for Model Selection. BMC Bioinform. 2006, 7, 91. [Google Scholar] [CrossRef] [Scilit]
- Cawley, G.C.; Talbot, N.L.C. On Over-Fitting in Model Selection and Subsequent Selection Bias in Performance Evaluation. J. Mach. Learn. Res. 2010, 11, 2079–2107. [Google Scholar]
- Zaccardi, S.; Brahimetaj, R.; Botti, E.; Beckwée, D.; Swinnen, E.; Jansen, B. Do Deep Learning Models Learn beyond Average Gait? A Comparison of Architectures, Kinematic Representations, and Marker Sparsity for Vertical Ground Reaction Force Prediction. Gait Posture 2026, 130, 110269. [Google Scholar] [CrossRef] [Scilit]
- Kadaba, M.P.; Ramakrishnan, H.K.; Wootten, M.E.; Gainey, J.; Gorton, G.; Cochran, G.V.B. Repeatability of Kinematic, Kinetic, and Electromyographic Data in Normal Adult Gait. J. Orthop. Res. 1989, 7, 849–860. [Google Scholar] [CrossRef] [Scilit]
- McGinley, J.L.; Baker, R.; Wolfe, R.; Morris, M.E. The Reliability of Three-Dimensional Kinematic Gait Measurements: A Systematic Review. Gait Posture 2009, 29, 360–369. [Google Scholar] [CrossRef] [Scilit]
- Leardini, A.; Chiari, L.; Croce, U.D.; Cappozzo, A. Human Movement Analysis Using Stereophotogrammetry. Gait Posture 2005, 21, 212–225. [Google Scholar] [CrossRef] [Scilit]
- Camomilla, V.; Bergamini, E.; Fantozzi, S.; Vannozzi, G. Trends Supporting the In-Field Use of Wearable Inertial Sensors for Sport Performance Evaluation: A Systematic Review. Sensors 2018, 18, 873. [Google Scholar] [CrossRef] [Scilit]
- Probst, P.; Wright, M.N.; Boulesteix, A. Hyperparameters and Tuning Strategies for Random Forest. WIREs Data Min. Knowl. Discov. 2019, 9, e1301. [Google Scholar] [CrossRef] [Scilit]
- Bland, J.M.; Altman, D.G. Statistical Methods for Assessing Agreement between Two Methods of Clinical Measurement. Lancet 1986, 1, 307–310. [Google Scholar] [CrossRef] [Scilit]
- Fallahtafti, F.; Mohammadzadeh Gonabadi, A.; Samson, K.; Yentes, J.M. Margin of Stability May Be Larger and Less Variable during Treadmill Walking Versus Overground. Biomechanics 2021, 1, 118–130. [Google Scholar] [CrossRef] [Scilit]
- Riley, P.O.; Paolini, G.; Della Croce, U.; Paylo, K.W.; Kerrigan, D.C. A Kinematic and Kinetic Comparison of Overground and Treadmill Walking in Healthy Subjects. Gait Posture 2007, 26, 17–24. [Google Scholar] [CrossRef] [Scilit]
- Lee, S.J.; Hidler, J. Biomechanics of Overground vs. Treadmill Walking in Healthy Individuals. J. Appl. Physiol. 2008, 104, 747–755. [Google Scholar] [CrossRef] [Scilit]
- Wouda, F.J.; Giuberti, M.; Bellusci, G.; Maartens, E.; Reenalda, J.; van Beijnum, B.-J.F.; Veltink, P.H. Estimation of Vertical Ground Reaction Forces and Sagittal Knee Kinematics During Running Using Three Inertial Sensors. Front. Physiol. 2018, 9, 218. [Google Scholar] [CrossRef] [Scilit]
- Mohammadzadeh Gonabadi, A.; Fallahtafti, F.; Antonellis, P.; Pipinos, I.I.; Myers, S.A. Ground Reaction Forces and Joint Moments Predict Metabolic Cost in Physical Performance: Harnessing the Power of Artificial Neural Networks. Appl. Sci. 2024, 14, 5210. [Google Scholar] [CrossRef] [Scilit]
- Mohammadzadeh Gonabadi, A.; Fallahtafti, F.; Burnfield, J.M. How Gait Nonlinearities in Individuals Without Known Pathology Describe Metabolic Cost During Walking Using Artificial Neural Network and Multiple Linear Regression. Appl. Sci. 2024, 14, 11026. [Google Scholar] [CrossRef] [Scilit]
- Mohammadzadeh Gonabadi, A.; Fallahtafti, F. Gait Stability Under Hip Exoskeleton Assistance: A Phase-Dependent Analysis Using Gait Tube Methodology. Appl. Sci. 2025, 15, 7530. [Google Scholar] [CrossRef] [Scilit]
- Fallahtafti, F.; Bruijn, S.; Mohammadzadeh Gonabadi, A.; Sangtarashan, M.; Boron, J.B.; Curtze, C.; Siu, K.-C.; Myers, S.A.; Yentes, J. Trunk Velocity Changes in Response to Physical Perturbations Are Potential Indicators of Gait Stability. Sensors 2023, 23, 2833. [Google Scholar] [CrossRef] [Scilit]
- Mohammadzadeh Gonabadi, A.; Fallahtafti, F.; Heselton, J.; Myers, S.A.; Siu, K.-C.; Boron, J.B. Modeling Dual-Task Performance: Identifying Key Predictors Using Artificial Neural Networks. Biomimetics 2025, 10, 351. [Google Scholar] [CrossRef] [Scilit]
- Mohammadzadeh Gonabadi, A.; Hunt, N.H.; Fallahtafti, F. EMG-Based Simulation for Optimization of Human-in-the-Loop Control in Simple Robotic Walking Assistance. J. Sens. Actuator Netw. 2025, 14, 113. [Google Scholar] [CrossRef] [Scilit]
- Fukuchi, C.A.; Fukuchi, R.K.; Duarte, M. A Public Dataset of Overground and Treadmill Walking Kinematics and Kinetics in Healthy Individuals. PeerJ 2018, 6, e4640. [Google Scholar] [CrossRef] [Scilit]
- Camargo, J.; Ramanathan, A.; Flanagan, W.; Young, A. A Comprehensive, Open-Source Dataset of Lower Limb Biomechanics in Multiple Conditions of Stairs, Ramps, and Level-Ground Ambulation and Transitions. J. Biomech. 2021, 119, 110320. [Google Scholar] [CrossRef] [Scilit]
- Moore, J.K.; Hnat, S.K.; van den Bogert, A.J. An Elaborate Data Set on Human Gait and the Effect of Mechanical Perturbations. PeerJ 2015, 3, e918. [Google Scholar] [CrossRef] [Scilit]

Disclaimer/Publisher’s Note: The statements, opinions and data contained in all publications are solely those of the individual author(s) and contributor(s) and not of MDPI and/or the editor(s). MDPI and/or the editor(s) disclaim responsibility for any injury to people or property resulting from any ideas, methods, instructions or products referred to in the content. |
© 2026 by the authors. Licensee MDPI, Basel, Switzerland. This article is an open access article distributed under the terms and conditions of the Creative Commons Attribution (CC BY) license.