


Featured Application
This study can be applied to the seismic pounding analysis and numerical simulation of 45° single-span supported reinforced concrete skew bridges. The findings provide experimental evidence for selecting appropriate pounding models and determining pounding stiffness parameters in finite element analysis, thereby improving the reliability of seismic pounding response prediction and supporting the seismic performance assessment of bridge structures.
Abstract
To investigate the seismic pounding response characteristics of a single-span simply supported reinforced concrete skew slab bridge and evaluate the applicability of different pounding models, shaking table tests were conducted on a 45° skew bridge, and a finite element model was established using SAP2000. The Kelvin and Hertz-damp models were compared under different pounding stiffness values (0.1–0.5k). The experimental results indicate that, without pounding, the acceleration response exhibits a pronounced dynamic amplification effect, while longitudinal and transverse displacements are larger on the acute side than on the obtuse side, accompanied by slight in-plane rotation of the girder. When pounding is considered, the bridge exhibits altered in-plane rotational behavior, which is restrained by the abutment. Meanwhile, the acceleration response is significantly amplified, with peak accelerations reaching 5–22 times the input peak ground acceleration (PGA), whereas the longitudinal displacement decreases and the in-plane rotational response is restrained. The numerical results demonstrate that the Hertz-damp model can reproduce the main response characteristics observed in the experiments. The quantitative error comparison indicates that stiffness values of 0.2–0.3k provide a reasonable balance between acceleration and displacement accuracy. Under the experimental and numerical conditions considered in this study, 0.2k can serve as a reference value within the investigated stiffness range. These findings provide a reference for selecting appropriate pounding models and pounding stiffness parameters in the seismic analysis of skew bridges.
1. Introduction
In recent years, skew bridges have been increasingly adopted in highway networks due to their adaptability to complex terrain conditions and alignment requirements. Compared with conventional orthogonal bridges, skew bridges exhibit more pronounced spatial effects during seismic events because of the inclination angle between the girder axis and the supporting direction. The skewed geometry may induce in-plane rotation, non-uniform displacement distributions, and different responses at bridge corners, increasing the likelihood of girder–abutment pounding and potential unseating risks [1,2,3]. Previous studies have demonstrated that skew angle, structural eccentricity, and pounding effects significantly influence the dynamic characteristics of bridges, while pounding further modifies the spatial response behavior and in-plane rotational characteristics of skew bridges [4,5]. Therefore, appropriately considering the spatial features and pounding boundary conditions is essential for accurately evaluating the seismic responses of skew bridges [6].
Under seismic excitations, the relative movement between the superstructure and abutments may induce repeated pounding, which not only alters the acceleration and displacement responses of bridges but also generates considerable impact forces, thereby affecting the seismic performance of the structure [7,8]. Previous studies have shown that the characteristics of abutment motion, pounding boundary conditions, and ground motion parameters can significantly influence pounding responses [9,10,11]. For skew bridges, further investigations have indicated that pounding effects under strong earthquakes considerably affect girder rotation and end displacement responses, while variations in structural constraints may also modify the influence of pounding on bridge behavior [12,13,14]. Therefore, accurately simulating seismic pounding processes in skew bridges is essential for understanding their spatial response mechanisms and evaluating their seismic performance.
Wu et al. performed shake table tests on scaled skew bridge specimens with seat-type abutments and systematically investigated their seismic response characteristics, including the effects of skew angle, support conditions, and ground motion inputs [15,16]. Other shake table investigations have also examined the seismic response of skew bridges with and without pounding for different skew angles and structural configurations [17]. Yang et al. experimentally investigated the pounding behavior between girder ends and abutments in skew bridges. The results indicated that pounding effects could significantly alter the dynamic responses of the structure [18]. Du et al. further considered multi-point pounding effects and examined the in-plane rotational response of skewed simply supported bridges, highlighting the important influence of pounding on spatial seismic behavior [19]. Numerical studies have also demonstrated the coupling between deck–abutment pounding, transverse displacement, and in-plane rotation in skew bridges [20]. Furthermore, previous studies have shown that different pounding directions and pounding parameters can significantly affect the displacement and rotational responses of skew bridges [21,22]. However, these studies have mainly focused on the response mechanisms and influencing factors of skew-bridge pounding, while systematic experimental validation and comparison of different pounding models under the same bridge configuration and loading conditions remain relatively limited.
To simulate the interaction between bridge components during earthquakes, various contact models have been developed. The early linear spring model was simple in formulation but unable to account for energy dissipation during impact. Subsequently, the Kelvin model, which introduces a damping component to describe energy loss during pounding, has been widely adopted in bridge pounding analyses [23,24,25]. However, the actual pounding process involves nonlinear contact characteristics, and the Kelvin model based on a linear stiffness assumption cannot fully capture the nonlinear relationship between impact force and contact deformation. To overcome this limitation, Muthukumar and DesRoches proposed the Hertz-damp model based on Hertz contact theory, which considers both nonlinear contact stiffness and damping effects and provides a more suitable description of contact behavior during pounding [26].
Previous studies have investigated the influence of different pounding models and associated parameters, demonstrating that key parameters such as contact stiffness can significantly affect the simulated pounding responses of bridges [27,28,29]. Furthermore, for skew bridge pounding analyses, the effects of pounding element arrangement and contact boundary conditions on numerical results have been examined, indicating that appropriate selection of pounding parameters is essential for improving simulation accuracy [30,31,32]. However, existing investigations on the applicability of pounding models have mainly relied on numerical analyses, and systematic comparisons of different models under identical experimental conditions remain relatively limited. In addition, the determination of key parameters such as pounding stiffness still largely depends on empirical values or recommendations from previous studies. Further validation for specific skew bridge configurations is therefore required.
Therefore, this study combines shaking table tests of a 45° single-span simply supported reinforced concrete skew slab bridge with numerical simulations to systematically compare the Kelvin and Hertz-damp models over a pounding stiffness range of 0.1–0.5k under the same structural and loading conditions. First, the dynamic response characteristics of the skew bridge under different seismic input intensities are obtained from the shaking table tests, including the acceleration, displacement, and in-plane motion characteristics under non-pounding and pounding conditions. Subsequently, the Kelvin and Hertz-damp models are employed in the finite element model to simulate girder-end pounding, and their capabilities in reproducing the structural responses are compared. Finally, the influence of pounding stiffness on the numerical responses and simulation accuracy is investigated based on different stiffness values. The results provide experimental references for the selection of pounding models and pounding stiffness parameters in the seismic analysis of 45° single-span simply supported reinforced concrete skew slab bridges.
2. Materials and Methods
To investigate the seismic pounding response characteristics of a single-span simply supported reinforced concrete skew slab bridge and evaluate the applicability of different pounding models, shaking table tests and corresponding numerical simulations were conducted. First, a model bridge was designed and fabricated, and shaking table tests were performed to obtain its seismic pounding responses. Subsequently, a finite element model was established using SAP2000(Version 17.3.0), and different pounding models and pounding stiffness parameters were compared based on the experimental results.
2.1. Shaking Table Test
2.1.1. Experimental Model Design
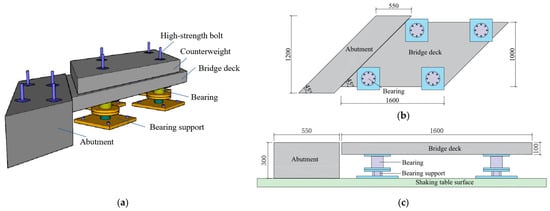
Previous investigations have indicated that the skew angles of existing skew bridges are primarily distributed between 30° and 50°, with bridges having skew angles of 45–50° representing the largest proportion (approximately 30%) [33]. Therefore, a single-span simply supported reinforced concrete skew bridge with a skew angle of 45° was selected as the research object. Considering that the test was mainly intended to investigate the structural pounding-response characteristics and to validate the finite element simulation, the model was designed at a geometric scale of 1:10 without adopting a complete dynamic similitude scheme. The overall layout is shown in Figure 1.
Figure 1.
Configuration of the model bridge: (a) Three-dimensional view; (b) plan view; (c) elevation view (unit: mm).
The span and width of the model bridge were 1600 mm and 1000 mm, respectively. The girder adopted a rectangular cross-section with a slab thickness of 110 mm and was cast using C50 concrete. HRB335 steel bars were used for reinforcement. To highlight the longitudinal pounding effect under seismic excitation and reduce the influence of multiple coupled factors, a rigid abutment was installed on only one side to simulate longitudinal restraint, while transverse pounding effects were not considered. A C50 plain concrete counterweight block with a skew angle of 45° was placed on the top of the girder, and the counterweight block was connected to the skew slab using bolts. The counterweight was used to increase the structural response rather than to satisfy a prescribed mass similitude ratio. Plate rubber bearings were adopted, with a measured horizontal stiffness ranging from 140 to 170 kN/m.
2.1.2. Sensor Layout and Loading Conditions
- (a)
- Sensor Layout:
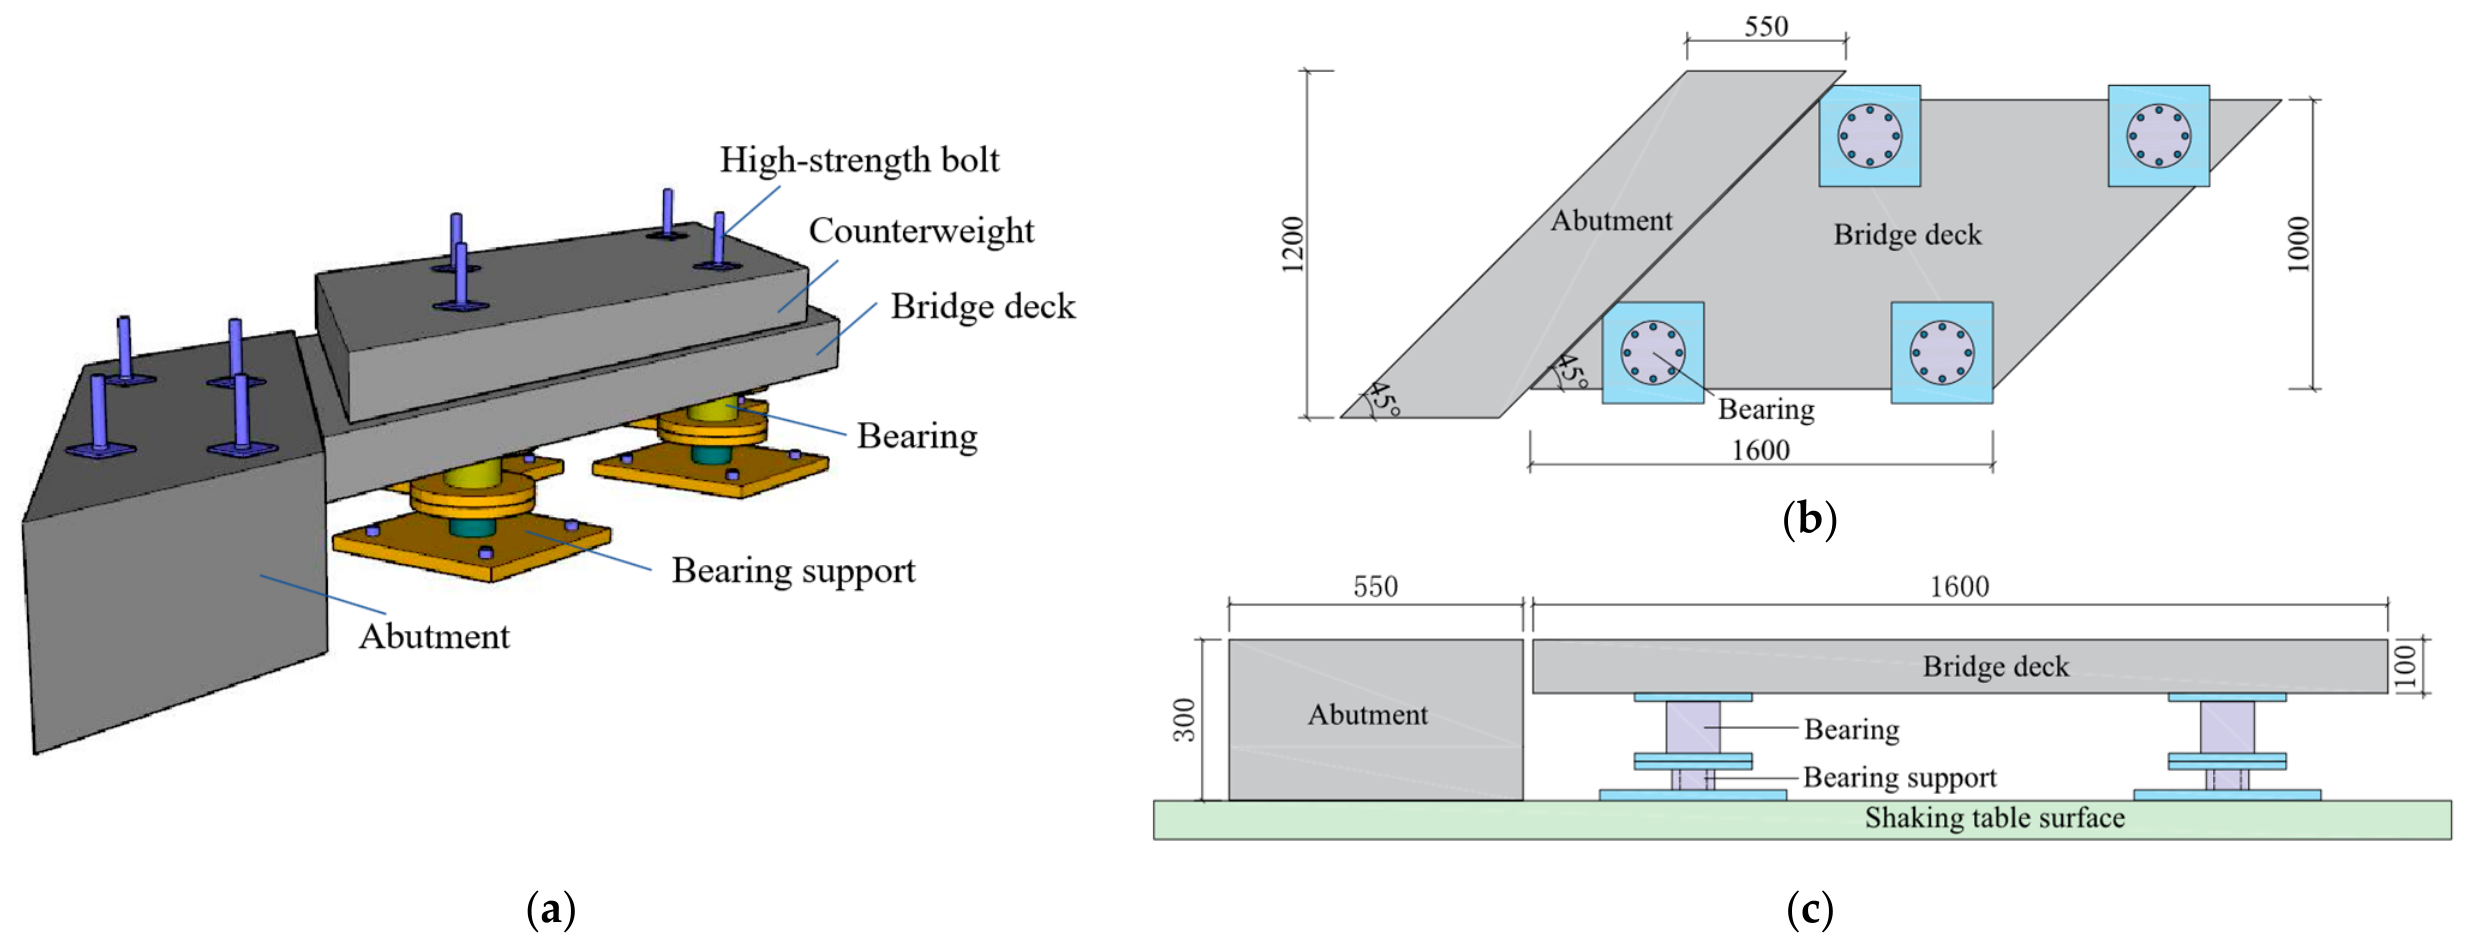
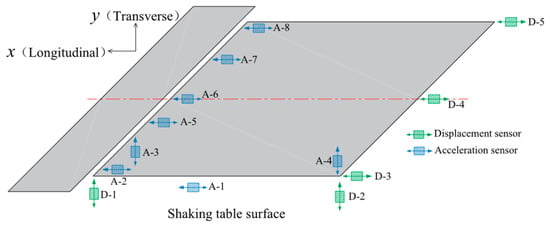
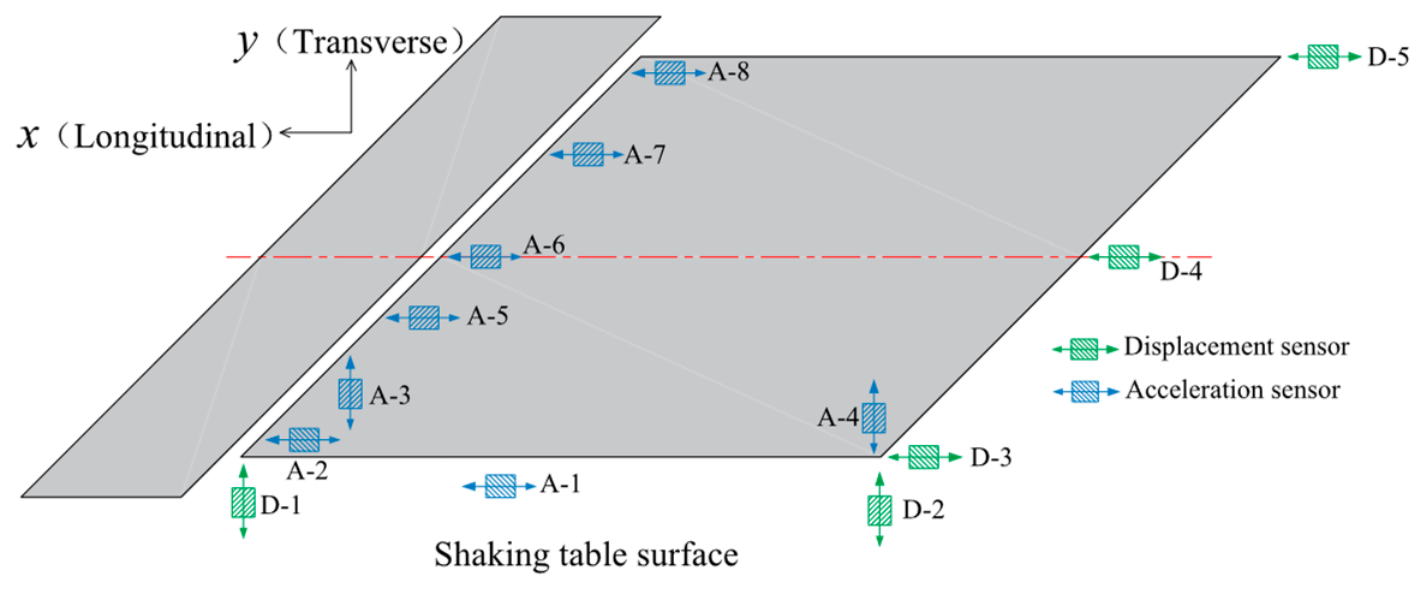
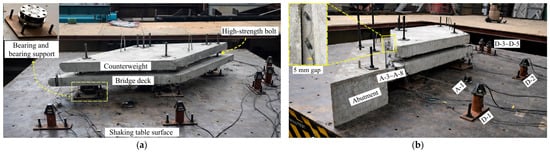
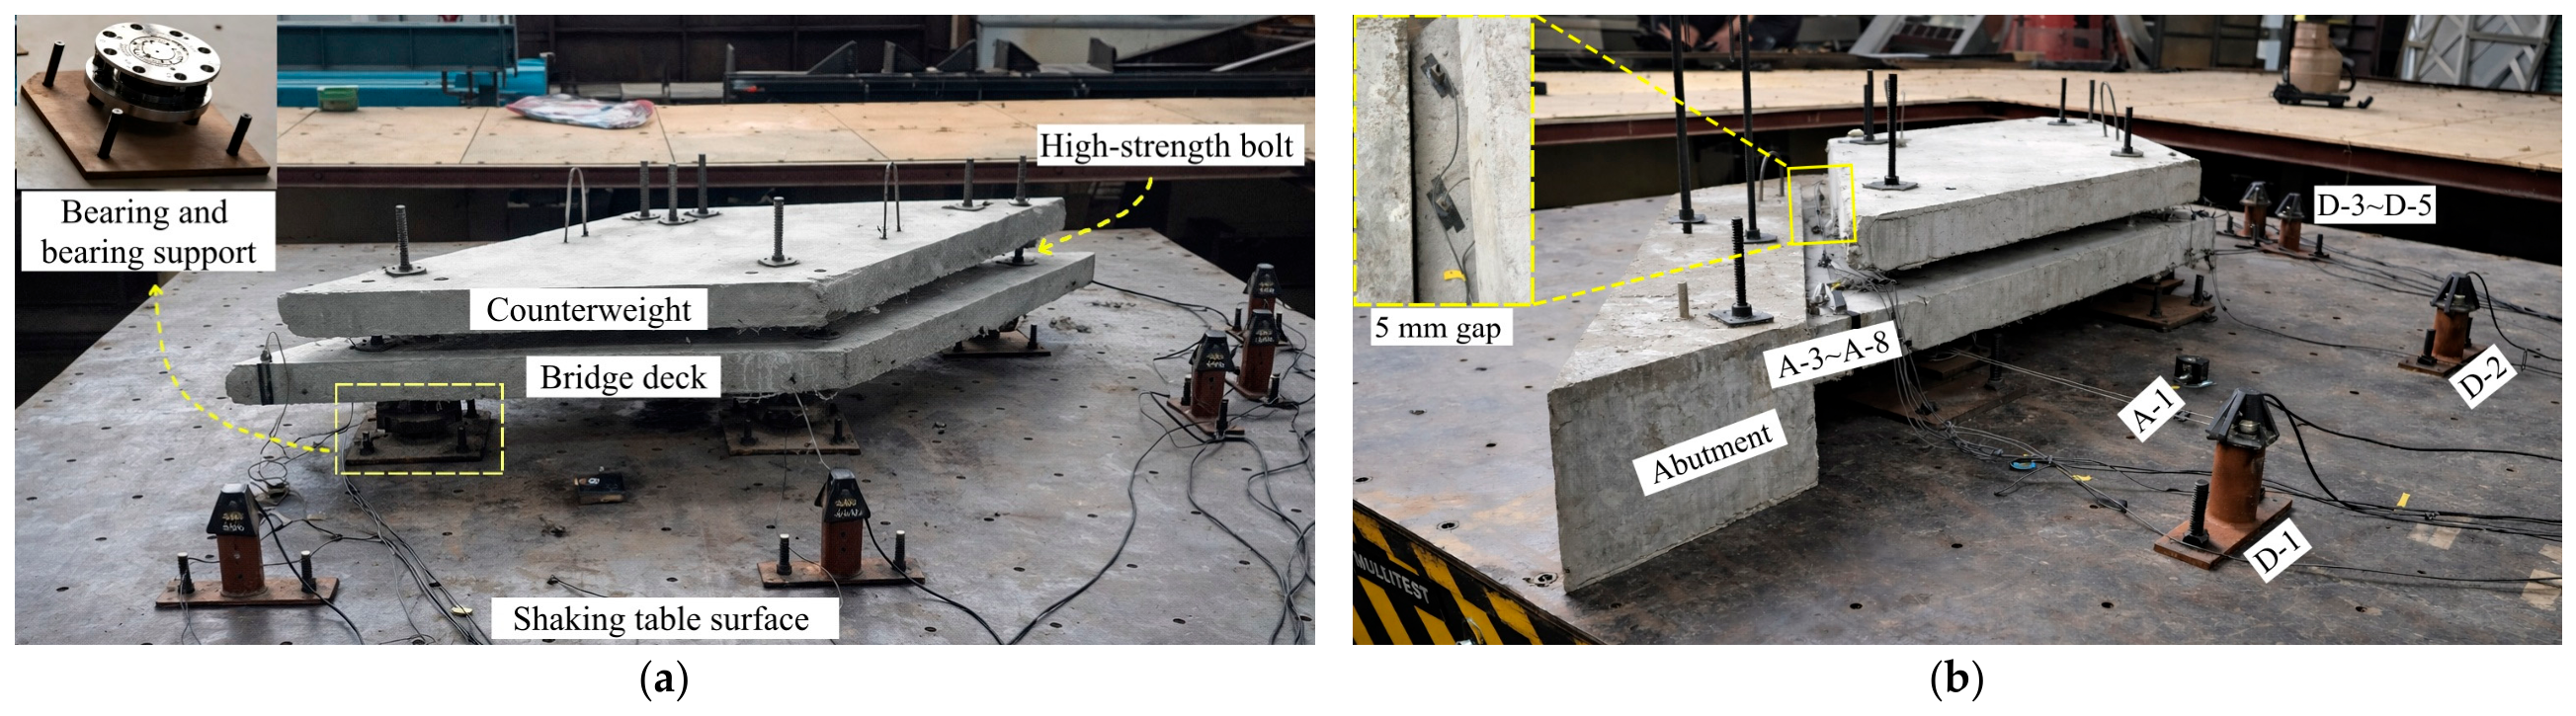
The tests were conducted using the 4 m × 4 m horizontal biaxial shaking table at Fuzhou University. One DH610V accelerometer was installed on the shaking table to record the input motion, and seven DH202-020 piezoresistive accelerometers were installed on the bridge deck. Five BL80-V wire displacement transducers were used to measure the bridge-deck displacement. The sampling frequency was 50 Hz. The test signals were acquired through the shaking-table data-acquisition system and analyzed using the JMTEST dynamic signal testing and analysis software. The planar layout and measurement directions of the sensors is shown in Figure 2, and the overall arrangement of the test model and measurement points is shown in Figure 3.
Figure 2.
Plan layout and measurement directions of the sensors. (Accelerometers A-1, A-2, and A-5–A-8 measure acceleration in the longitudinal (X) direction, while A-3 and A-4 measure acceleration in the transverse (Y) direction.) The red dashed line indicates the longitudinal centerline of the bridge deck.
Figure 3.
Experimental model and sensor locations: (a) without abutment; (b) with abutment.
- (b)
- Loading Conditions:
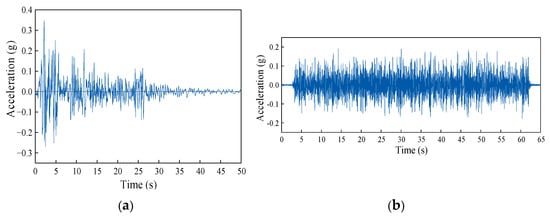
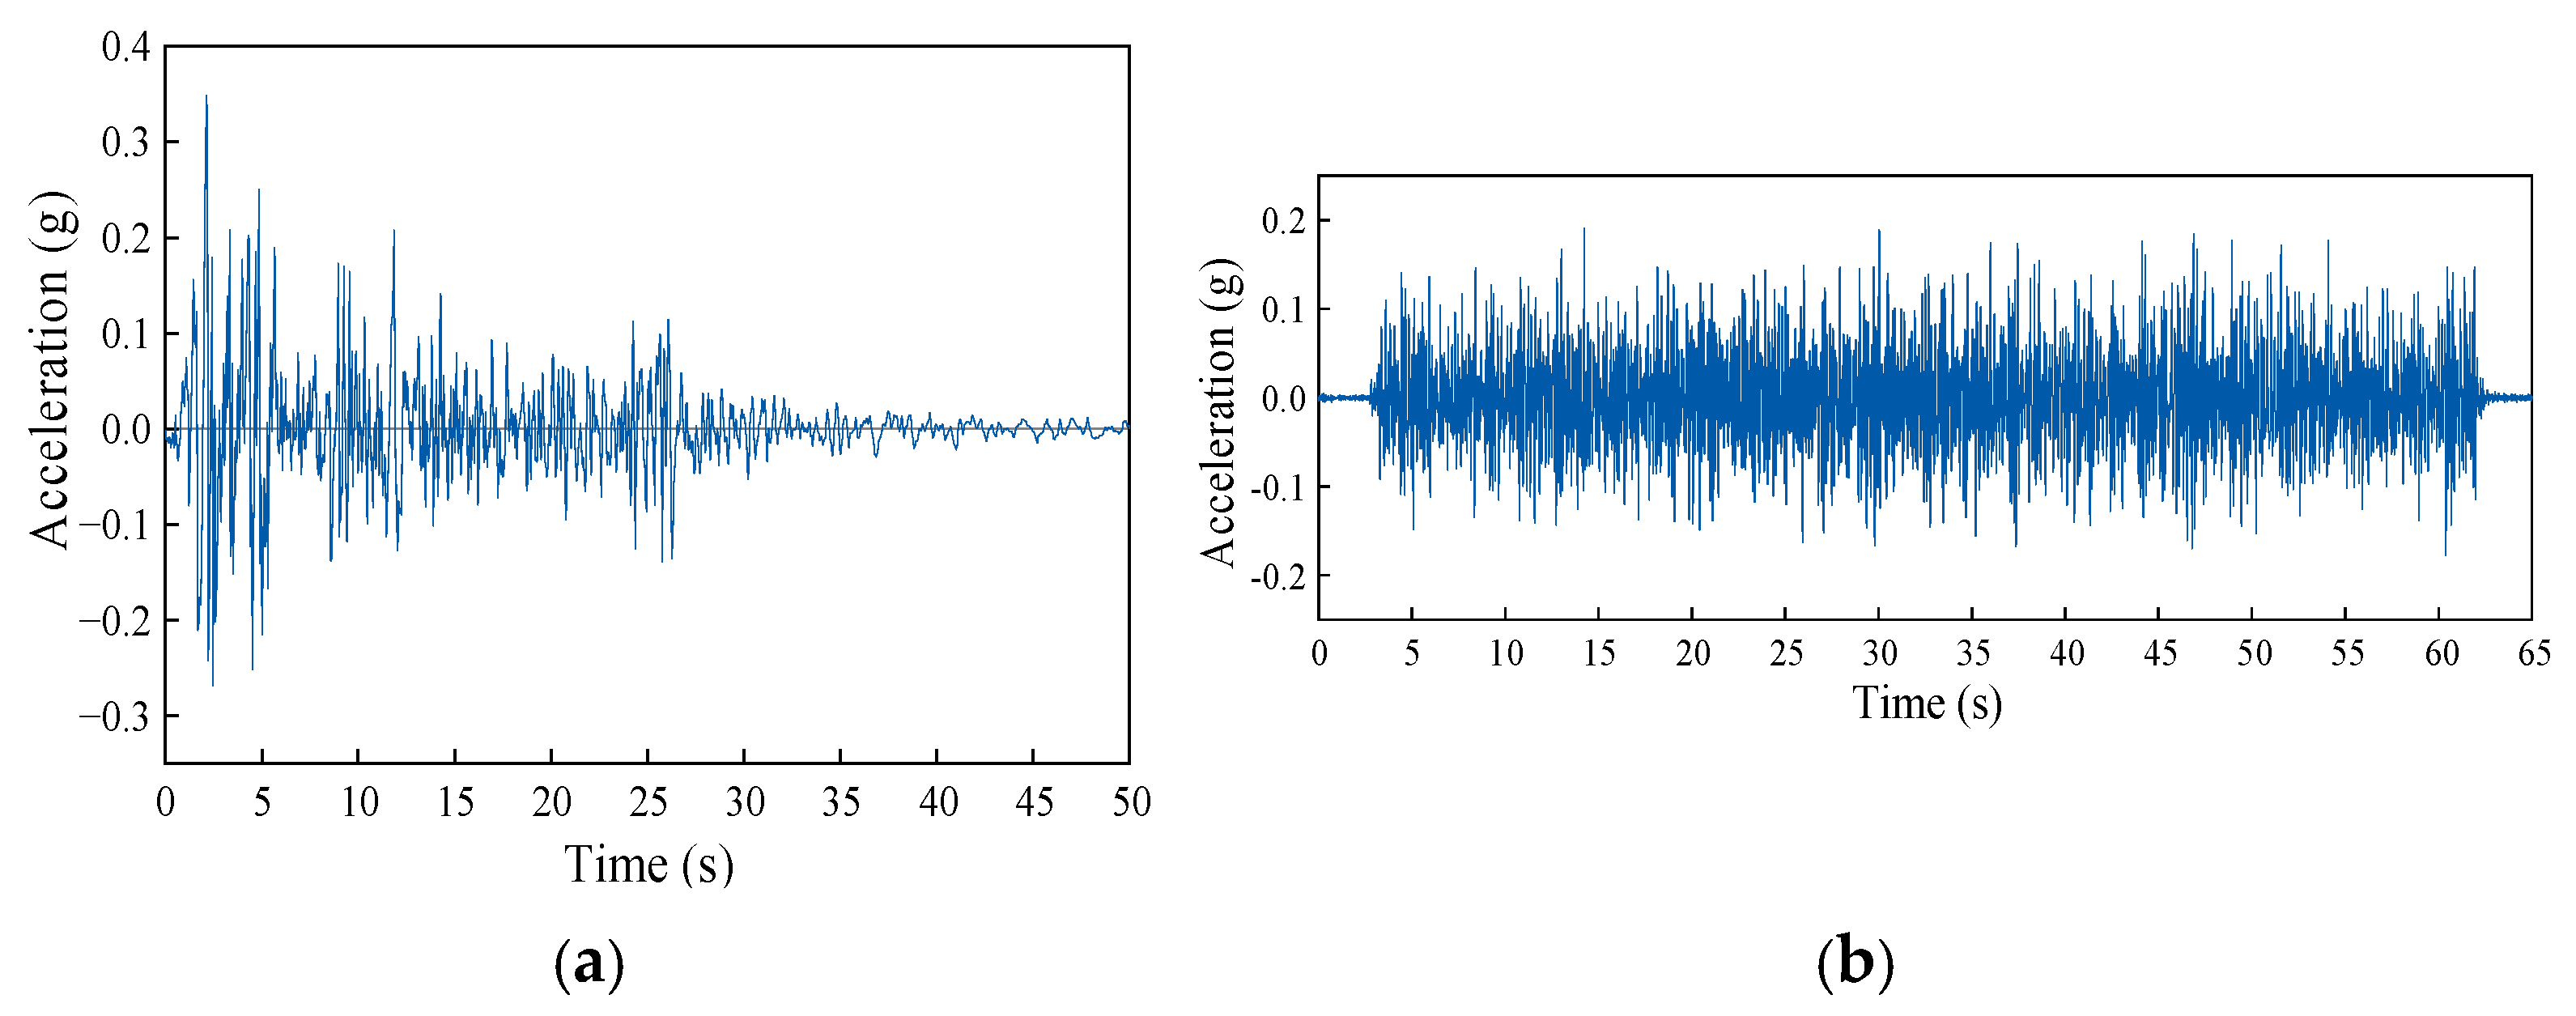
The El Centro earthquake motion was selected as the input ground motion and applied along the longitudinal direction (X direction) of the structure. The original El Centro record had a PGA of 0.34864 g and a duration of approximately 53 s. Only the acceleration amplitude was scaled to the target PGA levels, without time scaling. The corresponding acceleration time history is shown in Figure 4a. The test consisted of two cases: without abutment and with abutment. For the case without an abutment, the initial peak ground acceleration (PGA) was set to 0.1 g and gradually increased by increments of 0.1 g until reaching a maximum value of 0.7 g. For the case with an abutment, a 5 mm gap was maintained between the bridge deck and the abutment. According to the test results without pounding, the peak longitudinal displacement of the bridge deck reached approximately 6.6 mm at a PGA of 0.3 g, exceeding the initial gap. Therefore, 0.3 g was selected as the initial PGA for the pounding test.
Figure 4.
Acceleration time histories of input excitations: (a) El Centro earthquake motion; (b) white noise excitation.
2.2. Numerical Modeling of Pounding Response
To further investigate the applicability of different pounding models, a finite element model of the single-span simply supported skew bridge was established using the SAP2000 software. By comparing the numerical results with the shaking table test results, the simulation accuracy of the Kelvin model and Hertz-damp model under different pounding stiffness values was evaluated. The appropriate pounding model and reasonable parameters for seismic pounding analysis of skew bridges were subsequently determined.
2.2.1. Girder and Bearing Simulation
The superstructure was represented by a grillage model consisting of five longitudinal girders interconnected by transverse members. The transverse members were arranged perpendicular to the longitudinal girders, with their spacing not exceeding the longitudinal-girder spacing. All grillage members were modeled using three-dimensional frame elements. The material was C50 concrete, with an elastic modulus of 3.45 × 10⁴ MPa. To reproduce the actual mass distribution of the experimental model, the weight of the counterweight blocks was converted into equivalent uniformly distributed loads and applied to the beam elements, and the corresponding loads were subsequently converted into mass for dynamic analysis. Since no obvious damage occurred to the bearings during the tests and their hysteretic behavior was approximately linear, elastic link elements were adopted to simulate the bearings. The equivalent horizontal stiffness was set as 150 kN/m based on the measured stiffness range in the shaking table test. The finite element model adopted the same geometric dimensions, material properties, and boundary conditions as those in the shaking table test. Nonlinear time-history analysis was performed. Rayleigh damping was applied with a damping ratio of 5%, and the direct integration method was used for time-domain solution. Bearing sliding was not considered in the numerical model.
2.2.2. Pounding Model Formulation and Parameter Selection
The abutment was represented by the fixed boundary of the pounding element rather than by separate structural elements. One end of the pounding element was fixed, while the other end was connected to the corresponding girder-end node. The pounding element was arranged along the normal direction of the skew section to represent the primary force direction during pounding. In the global coordinate system, the X-axis represents the longitudinal direction and the Y-axis represents the transverse direction. The local 1-axis of the pounding element was oriented toward the normal direction of the skew section.
Based on the experimental results, the equivalent longitudinal stiffness of the girder, denoted as k, was selected as the reference stiffness. A range of 0.1–0.5k was adopted for parameter analysis. To compare the simulation performance of different pounding models, a typical linear viscoelastic model (Kelvin model) and a nonlinear contact model (Hertz-damp model) were selected.
For the Kelvin model, the pounding force during contact is expressed as
where k is the pounding stiffness, δ(t) and are the relative deformation and relative velocity of the colliding bodies, respectively, and c is the damping coefficient. The damping coefficient is calculated as
where m1 and m2 are the effective masses of the colliding bodies, e is the coefficient of restitution, and ξ is the damping ratio associated with e. For concrete-to-concrete pounding, e = 0.65 was adopted.
For the Hertz-damp model, the nonlinear contact behavior was represented in SAP2000 using a multilinear plastic link. The equivalent model parameters were determined from the energy-dissipation and effective-stiffness relations as follows:
where ΔE is the energy dissipated during pounding, keff is the effective stiffness, kh is the pounding stiffness parameter, δm is the maximum penetration, n is the Hertz exponent, δy is the yield displacement, a is the yield coefficient, and K1 and K2 are the initial and post-yield stiffnesses of the equivalent multilinear model, respectively. In the present analysis, n = 3/2, e = 0.65, δm = 2.54 cm, and a = 0.1 were adopted. The resulting parameter values of the two pounding models are summarized in Table 1.
δy = aδm
Table 1.
Parameter values of different pounding models.
3. Results and Discussion
3.1. Dynamic Characteristics of the Structure
Before each earthquake excitation, white noise excitation was applied to identify the variation in the first-order natural frequency of the structure, thereby evaluating changes in structural stiffness and possible damage evolution. The corresponding acceleration time history is shown in Figure 4b. The measured results showed that the first-order natural frequency was 4.3945 Hz under all test conditions, indicating that no significant stiffness degradation occurred during the test and no obvious damage was observed in the main structural components. Therefore, the dynamic characteristics of the structure under different conditions were considered to remain consistent, and the differences in subsequent responses were mainly attributed to the variation in input earthquake intensity and the pounding effect.
3.2. Seismic Response Analysis Without Pounding
3.2.1. Acceleration Response
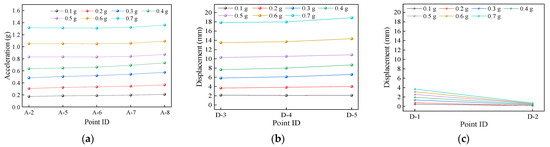
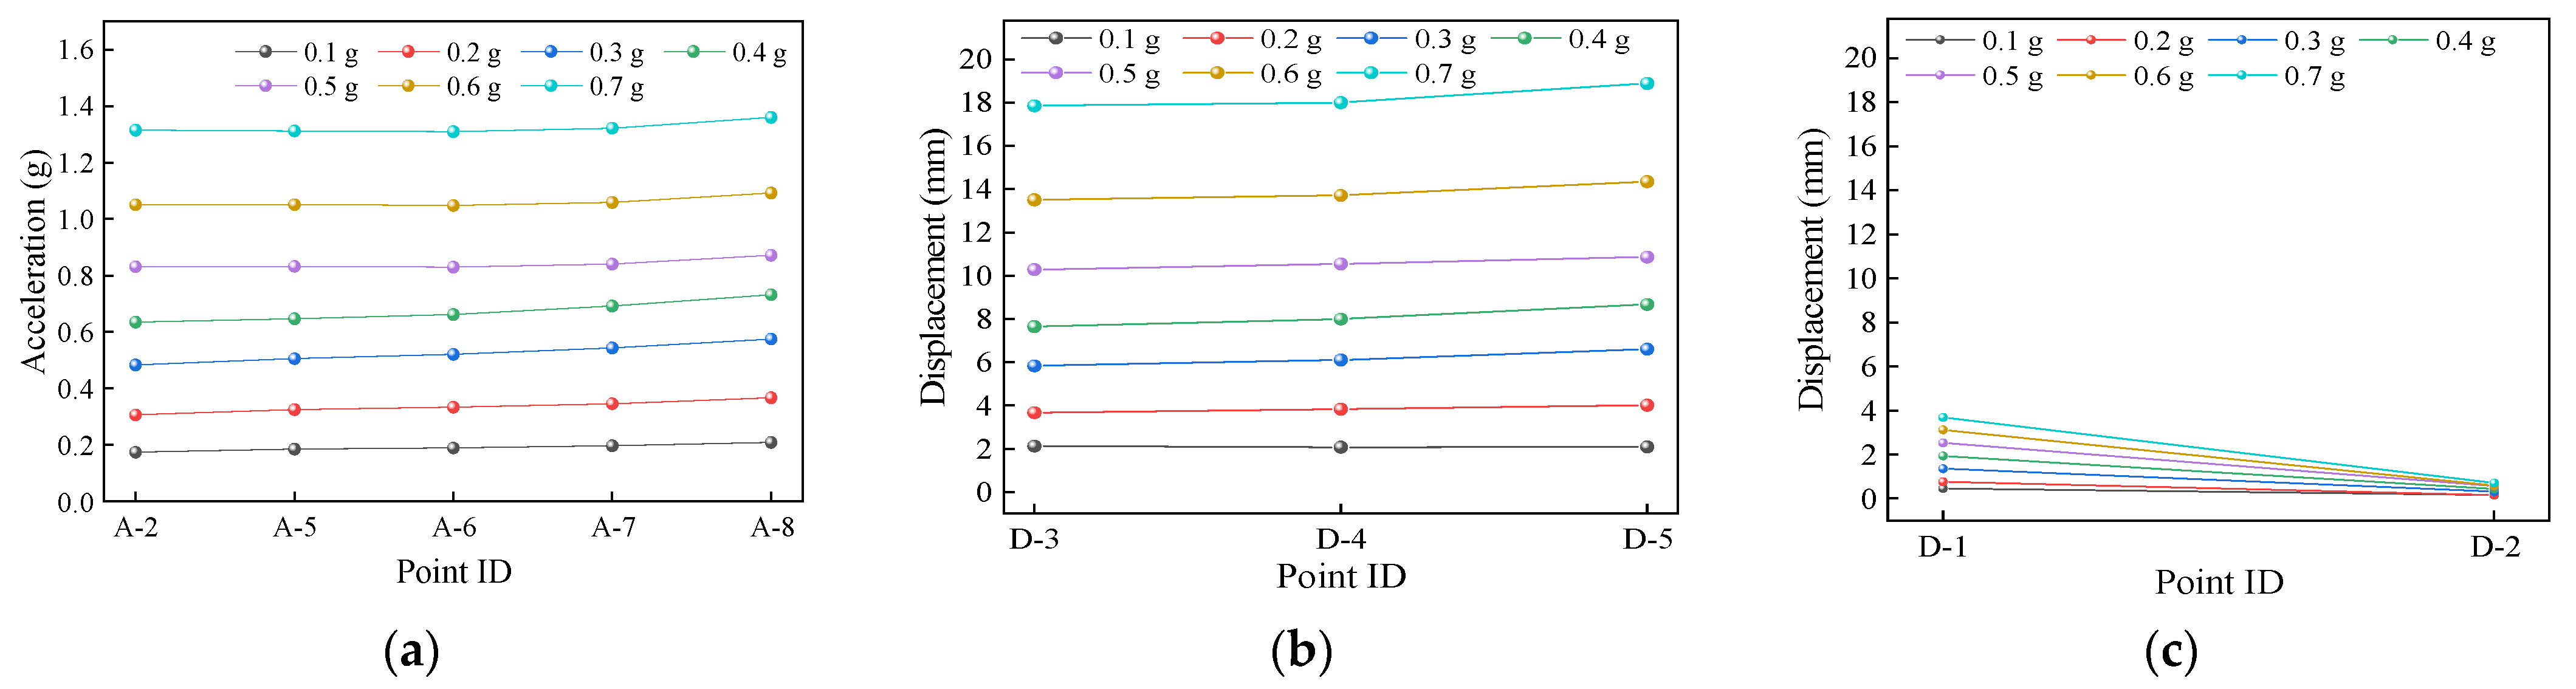
Figure 5a shows the peak longitudinal acceleration under different input PGA levels without pounding. Under all loading conditions, the peak longitudinal acceleration gradually increased along the bridge deck from the measurement point A-2 on the acute side to A-8 on the obtuse side, and the distribution patterns were generally consistent under different PGA levels. With increasing input PGA, the peak acceleration at each measurement point increased accordingly, reaching approximately 1.85 times the peak value of the input ground motion. This indicates that the skew bridge exhibited a pronounced dynamic amplification effect under seismic excitation, while the overall distribution characteristics of the longitudinal acceleration remained unchanged.
Figure 5.
Peak acceleration and displacement responses under different PGA levels without pounding: (a) peak longitudinal acceleration; (b) peak longitudinal displacement; (c) peak transverse displacement.
3.2.2. Displacement Response
The peak displacements at different measurement points under various PGA levels are shown in Figure 5b,c. With increasing PGA, the peak displacement at each measurement point increased, and the displacement difference between the corner measurement points at both ends gradually became more significant, indicating that the spatial non-uniformity of seismic responses of the skew bridge increased with increasing earthquake intensity. The longitudinal and transverse displacements both gradually increased from the obtuse side to the acute side. The differences among measurement points in the longitudinal direction were relatively small, with the maximum-to-minimum peak displacement ratio being approximately 1.08. In contrast, the transverse displacement showed a more significant difference, with the corresponding ratio increasing to approximately 4. This indicates that the transverse response of the skew bridge was more significantly affected by the skew effect.
3.2.3. In-Plane Motion of the Girder
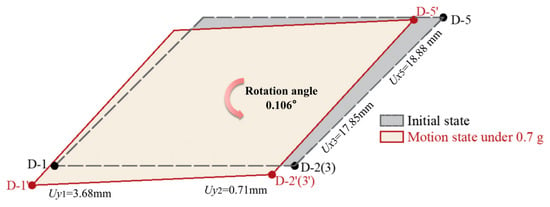
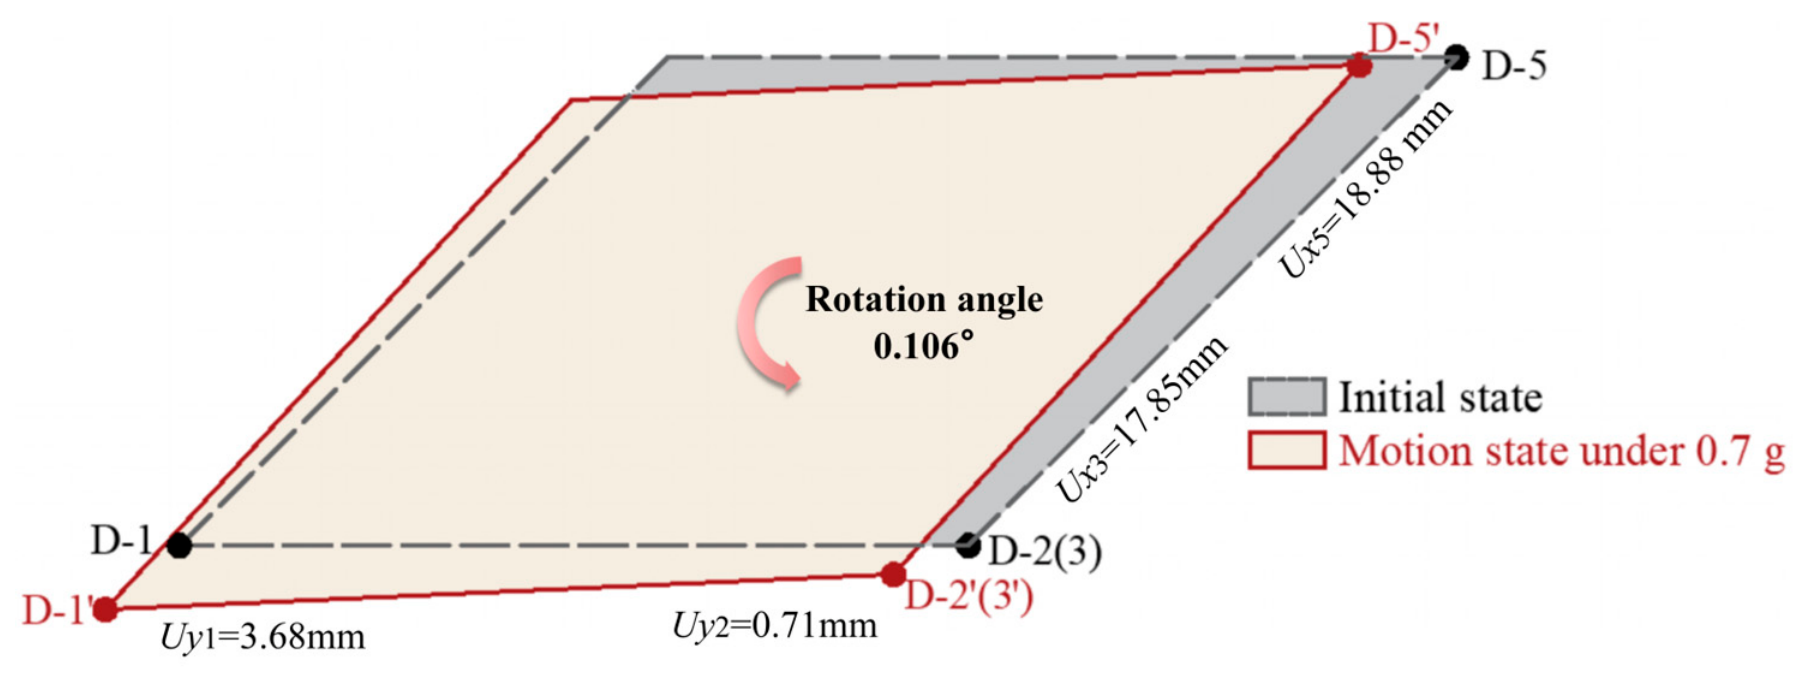
The girder rotation angle was calculated based on the transverse displacement difference between the two sides of the deck, with the span length of 1600 mm adopted as the characteristic length. Under an input PGA of 0.1 g, the girder rotation angle was approximately 0.011° and gradually increased to 0.106° with increasing PGA. The in-plane rigid-body motion of the girder under PGA = 0.7 g is illustrated in Figure 6.
Figure 6.
Schematic representation of the in-plane rigid-body motion of the girder without pounding (PGA = 0.7 g).
Without pounding, the girder exhibited coupled translational and rotational responses, and the rotation amplitude gradually increased with increasing earthquake intensity. This phenomenon was mainly attributed to the geometric asymmetry of the skew structure, which resulted in a non-uniform in-plane force distribution under seismic excitation. Consequently, an unbalanced moment was generated about the structural center of mass, inducing rotational motion. This mechanism also explains the significant spatial difference in transverse displacement mentioned above.
3.3. Seismic Response Analysis with Pounding
To further investigate the influence of abutment pounding on the seismic response of the skew bridge, the fabricated rigid abutment was installed and fixed on the shaking table. The pounding test was conducted starting from a PGA of 0.3 g, as described in Section 2.1.2.
3.3.1. Acceleration Response
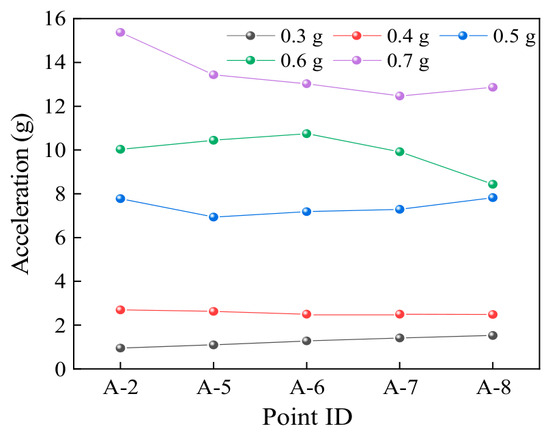
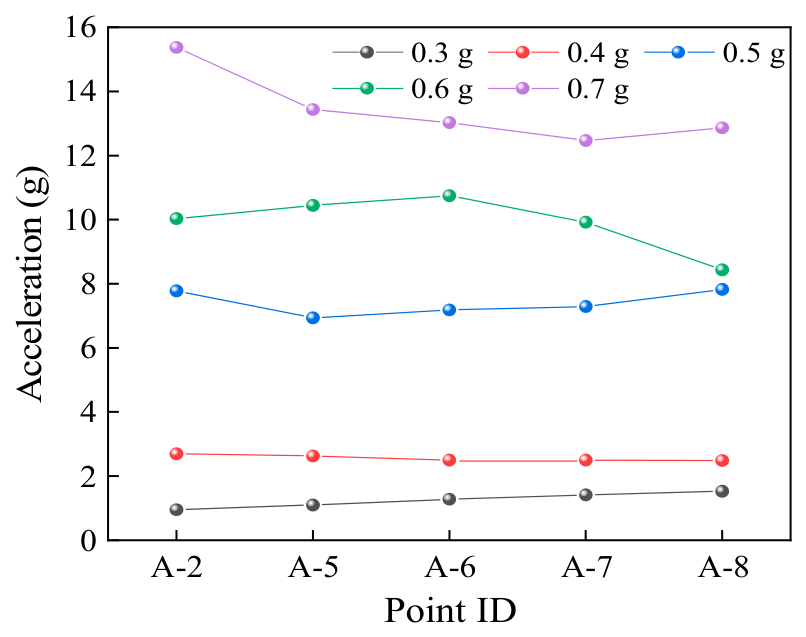
When pounding was considered, the peak longitudinal acceleration exhibited a nonlinear variation with increasing input PGA (Figure 7). At PGA = 0.3 g, the differences in peak acceleration among measurement points were relatively small, and the overall distribution was similar to that in the case without pounding. When the PGA increased to 0.4 g, the peak acceleration at the acute-side measurement point A-2 was slightly higher than that at the obtuse-side measurement point A-8, indicating that pounding began to influence the local dynamic response. At PGA = 0.5 g, the difference between the two sides decreased, and local fluctuations occurred. Under the conditions of PGA = 0.6–0.7 g, the peak acceleration at A-2 increased by approximately 20% compared with that at A-8, and the response difference between the two sides increased again.
Figure 7.
Peak longitudinal acceleration under different PGA levels with pounding.
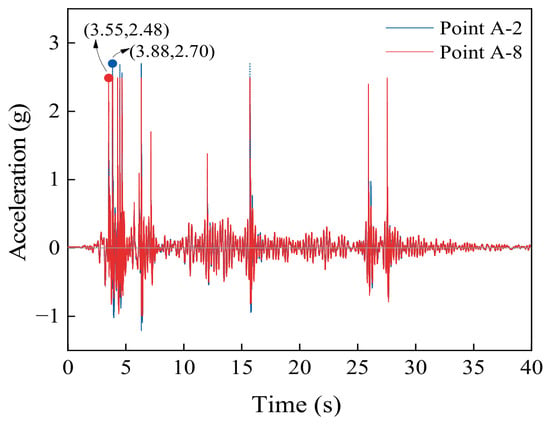
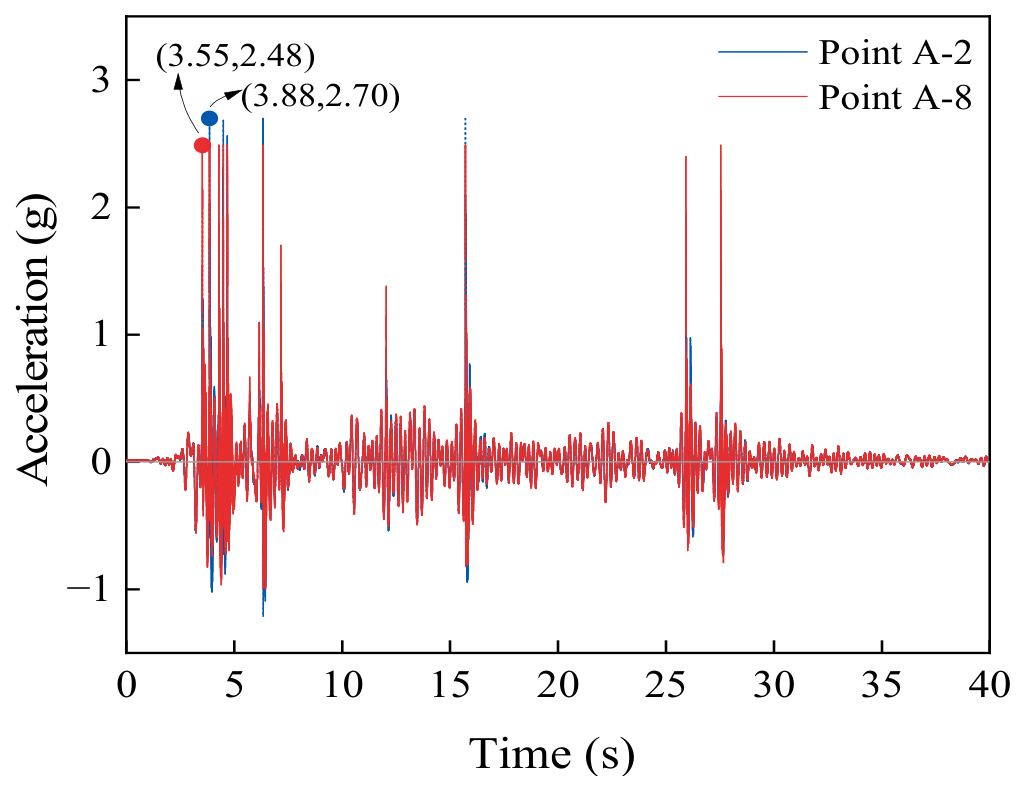
To further investigate the difference in acceleration responses at the two corner points, the acceleration time histories of the acute-side measurement point A-2 and the obtuse-side measurement point A-8 at PGA = 0.4 g were compared, as shown in Figure 8. The obtuse-side measurement point A-8 reached its peak acceleration at 3.548 s and came into contact with the abutment first, which restricted further displacement of the girder on this side. Subsequently, the acute-side measurement point A-2 reached its peak acceleration at 3.875 s and experienced pounding. These results indicate that the skew bridge exhibited an in-plane counterclockwise rotational tendency, with the motion developing from the obtuse side toward the acute side during seismic excitation. This phenomenon was related to the asymmetric constraints on both sides of the skew bridge and the difference in pounding initiation time.
Figure 8.
Acceleration time histories (PGA = 0.4 g).
Table 2 presents the peak accelerations under different input PGA levels with pounding. Within the input PGA range of 0.3–0.7 g, the peak structural accelerations reached 5–22 times the corresponding input PGA values, indicating that pounding significantly amplified the dynamic responses.
Table 2.
Comparison of peak acceleration responses under different input PGA levels with pounding.
To further quantify the influence of pounding on the acceleration response, two representative cases with PGA values of 0.4 g and 0.7 g were selected for comparison with the corresponding cases without pounding.
Table 3 presents a comparison of the peak longitudinal accelerations at different measurement points between the cases with and without pounding. At PGA = 0.4 g, the peak accelerations at all measurement points were approximately 3.83 times those in the case without pounding. When the PGA increased to 0.7 g, the C/NC ratio increased to 10.15. These results quantitatively demonstrate the significant amplification effect of pounding on the acceleration response of skew bridges, especially under strong earthquake excitation.
Table 3.
Comparison of peak longitudinal acceleration responses with and without pounding.
3.3.2. Displacement Response
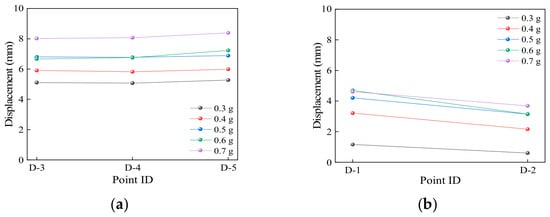
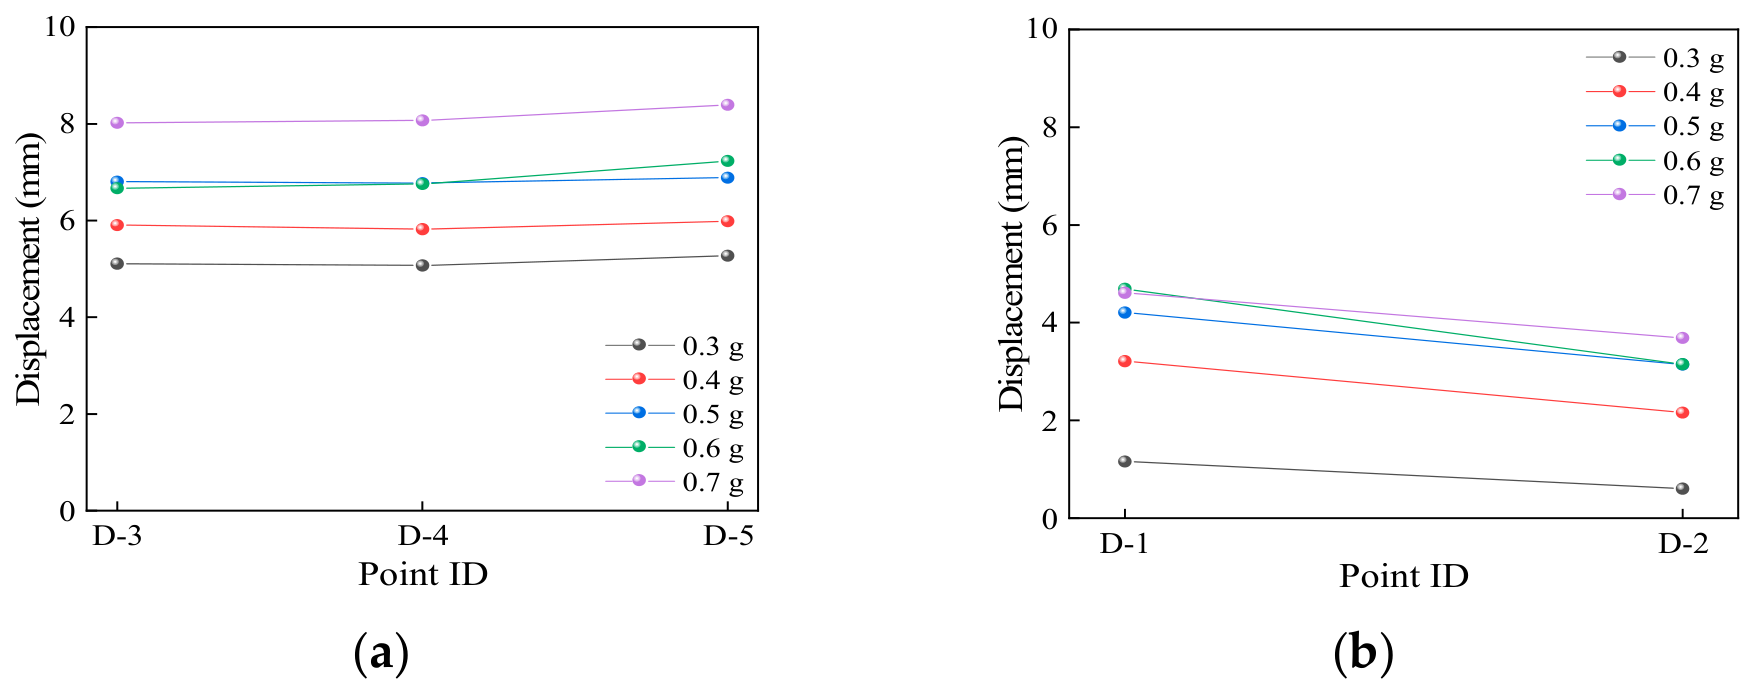
Figure 9 presents the peak displacements at various measurement points of the bridge deck under different PGA levels with pounding. With increasing input PGA, the longitudinal and transverse displacements of the girder generally increased. The longitudinal displacements at different measurement points were relatively close and exhibited an increasing trend from the obtuse side to the acute side, with limited spatial differences. In contrast, the transverse displacement exhibited more significant spatial differences. The peak displacement at the acute-side measurement point D-1 was approximately 1.5–2 times that at the obtuse-side measurement point D-2, and the displacement difference between the two sides decreased with increasing PGA.
Figure 9.
Peak displacement responses under different PGA levels with pounding: (a) longitudinal direction; (b) transverse direction.
Table 4 further compares the peak longitudinal and transverse displacements between the cases with and without pounding under different conditions. Compared with the no-pounding case, the peak longitudinal displacement generally decreased, reducing to 0.44–0.77 times that in the no-pounding case. This indicates that abutment contact effectively restrained the longitudinal movement of the girder, and the restraint effect became more significant with increasing input PGA. In contrast, the peak transverse displacement generally increased, with a maximum increase of up to five times, while the difference between the two side measurement points was reduced.
Table 4.
Comparison of peak displacement responses with and without pounding.
3.3.3. In-Plane Motion of the Girder
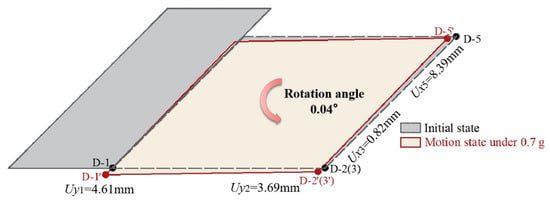
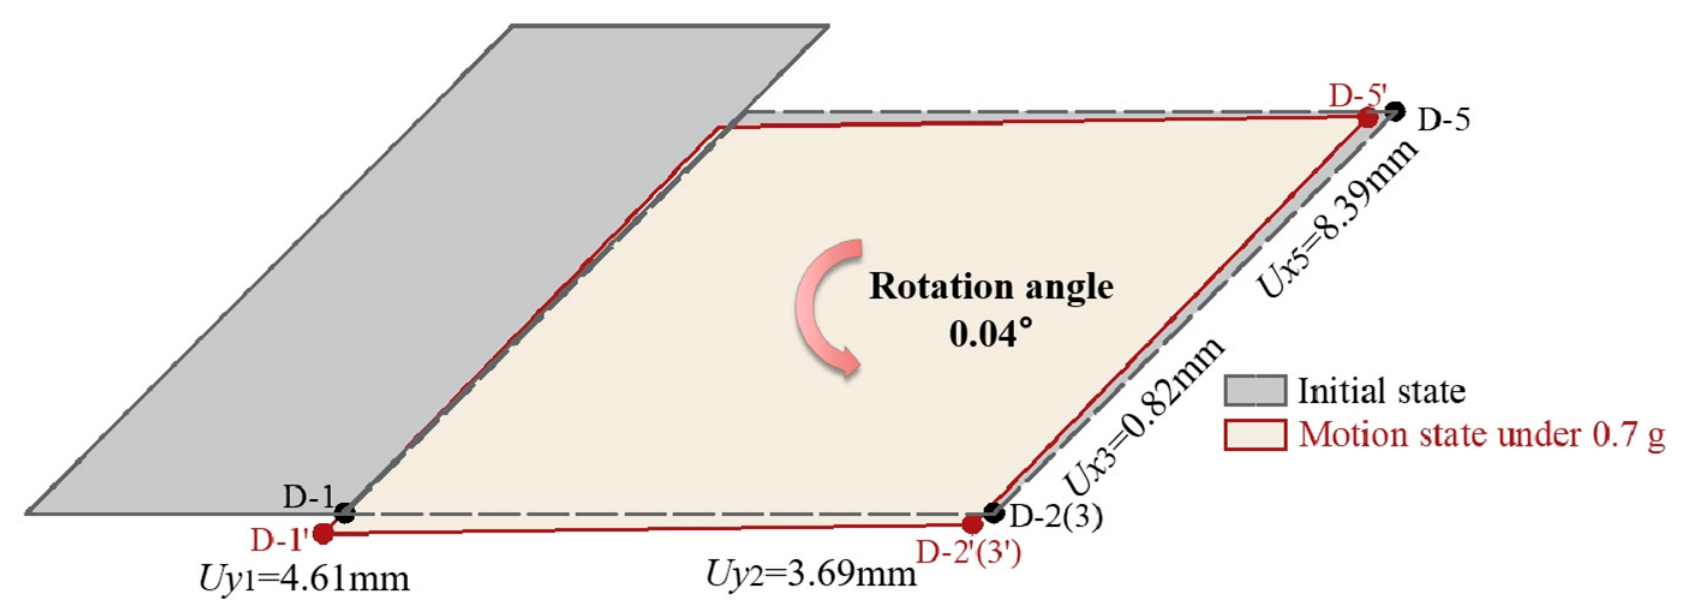
Figure 10 illustrates the in-plane rigid-body motion of the girder at PGA = 0.7 g. The girder exhibited slight counterclockwise rotation. The rotation angle was approximately 0.02° under an input PGA of 0.3 g and increased to approximately 0.04° as the PGA increased to 0.7 g. The overall variation was relatively small and was not strongly dependent on earthquake intensity. Compared with the case without pounding, the girder with abutment pounding still exhibited coupled translational and rotational responses, but with a reduced rotation amplitude. This indicates that pounding can suppress the development of in-plane rotation by modifying the boundary constraints of the structure.
Figure 10.
Schematic representation of the in-plane rigid-body motion of the girder with pounding (PGA = 0.7 g).
Overall, the experimental results indicate that, without pounding, the skew bridge exhibited a pronounced dynamic amplification effect under seismic excitation and developed coupled translational and rotational responses. When pounding occurred, abutment contact significantly amplified the structural acceleration response. Meanwhile, it restrained the development of longitudinal displacement, increased the transverse displacement, and suppressed the in-plane rotation of the girder. These results demonstrate that abutment pounding not only changes the magnitude of structural responses but also alters the in-plane response characteristics of skew bridges.
3.4. Validation of Pounding Models Against Experimental Results
To further evaluate the simulation accuracy and applicability of different pounding models, a finite element analysis was conducted using SAP2000. The first-order natural frequency obtained from the finite element model was 4.3578 Hz, which differed from the experimentally measured value of 4.3945 Hz by a relative error of 0.84%. This indicates that the developed model can effectively reproduce the basic linear dynamic characteristics of the structure and can be used for subsequent analyses of different pounding models and stiffness parameters. The El Centro ground motion was selected as the longitudinal (X-direction) input excitation. Two representative seismic excitation levels with PGA values of 0.4 g and 0.7 g were selected to compare the effects of different pounding models and stiffness values on the structural dynamic responses in the global coordinate system.
3.4.1. Comparison of Acceleration Responses
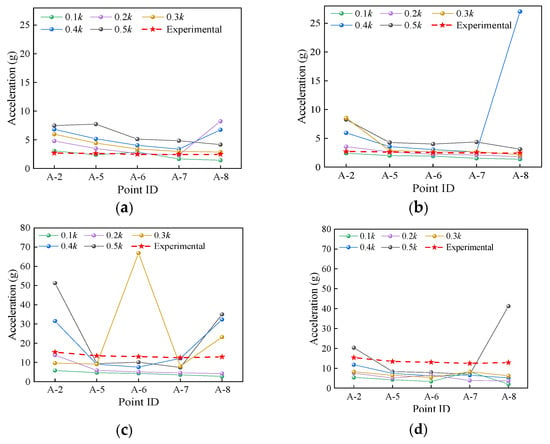
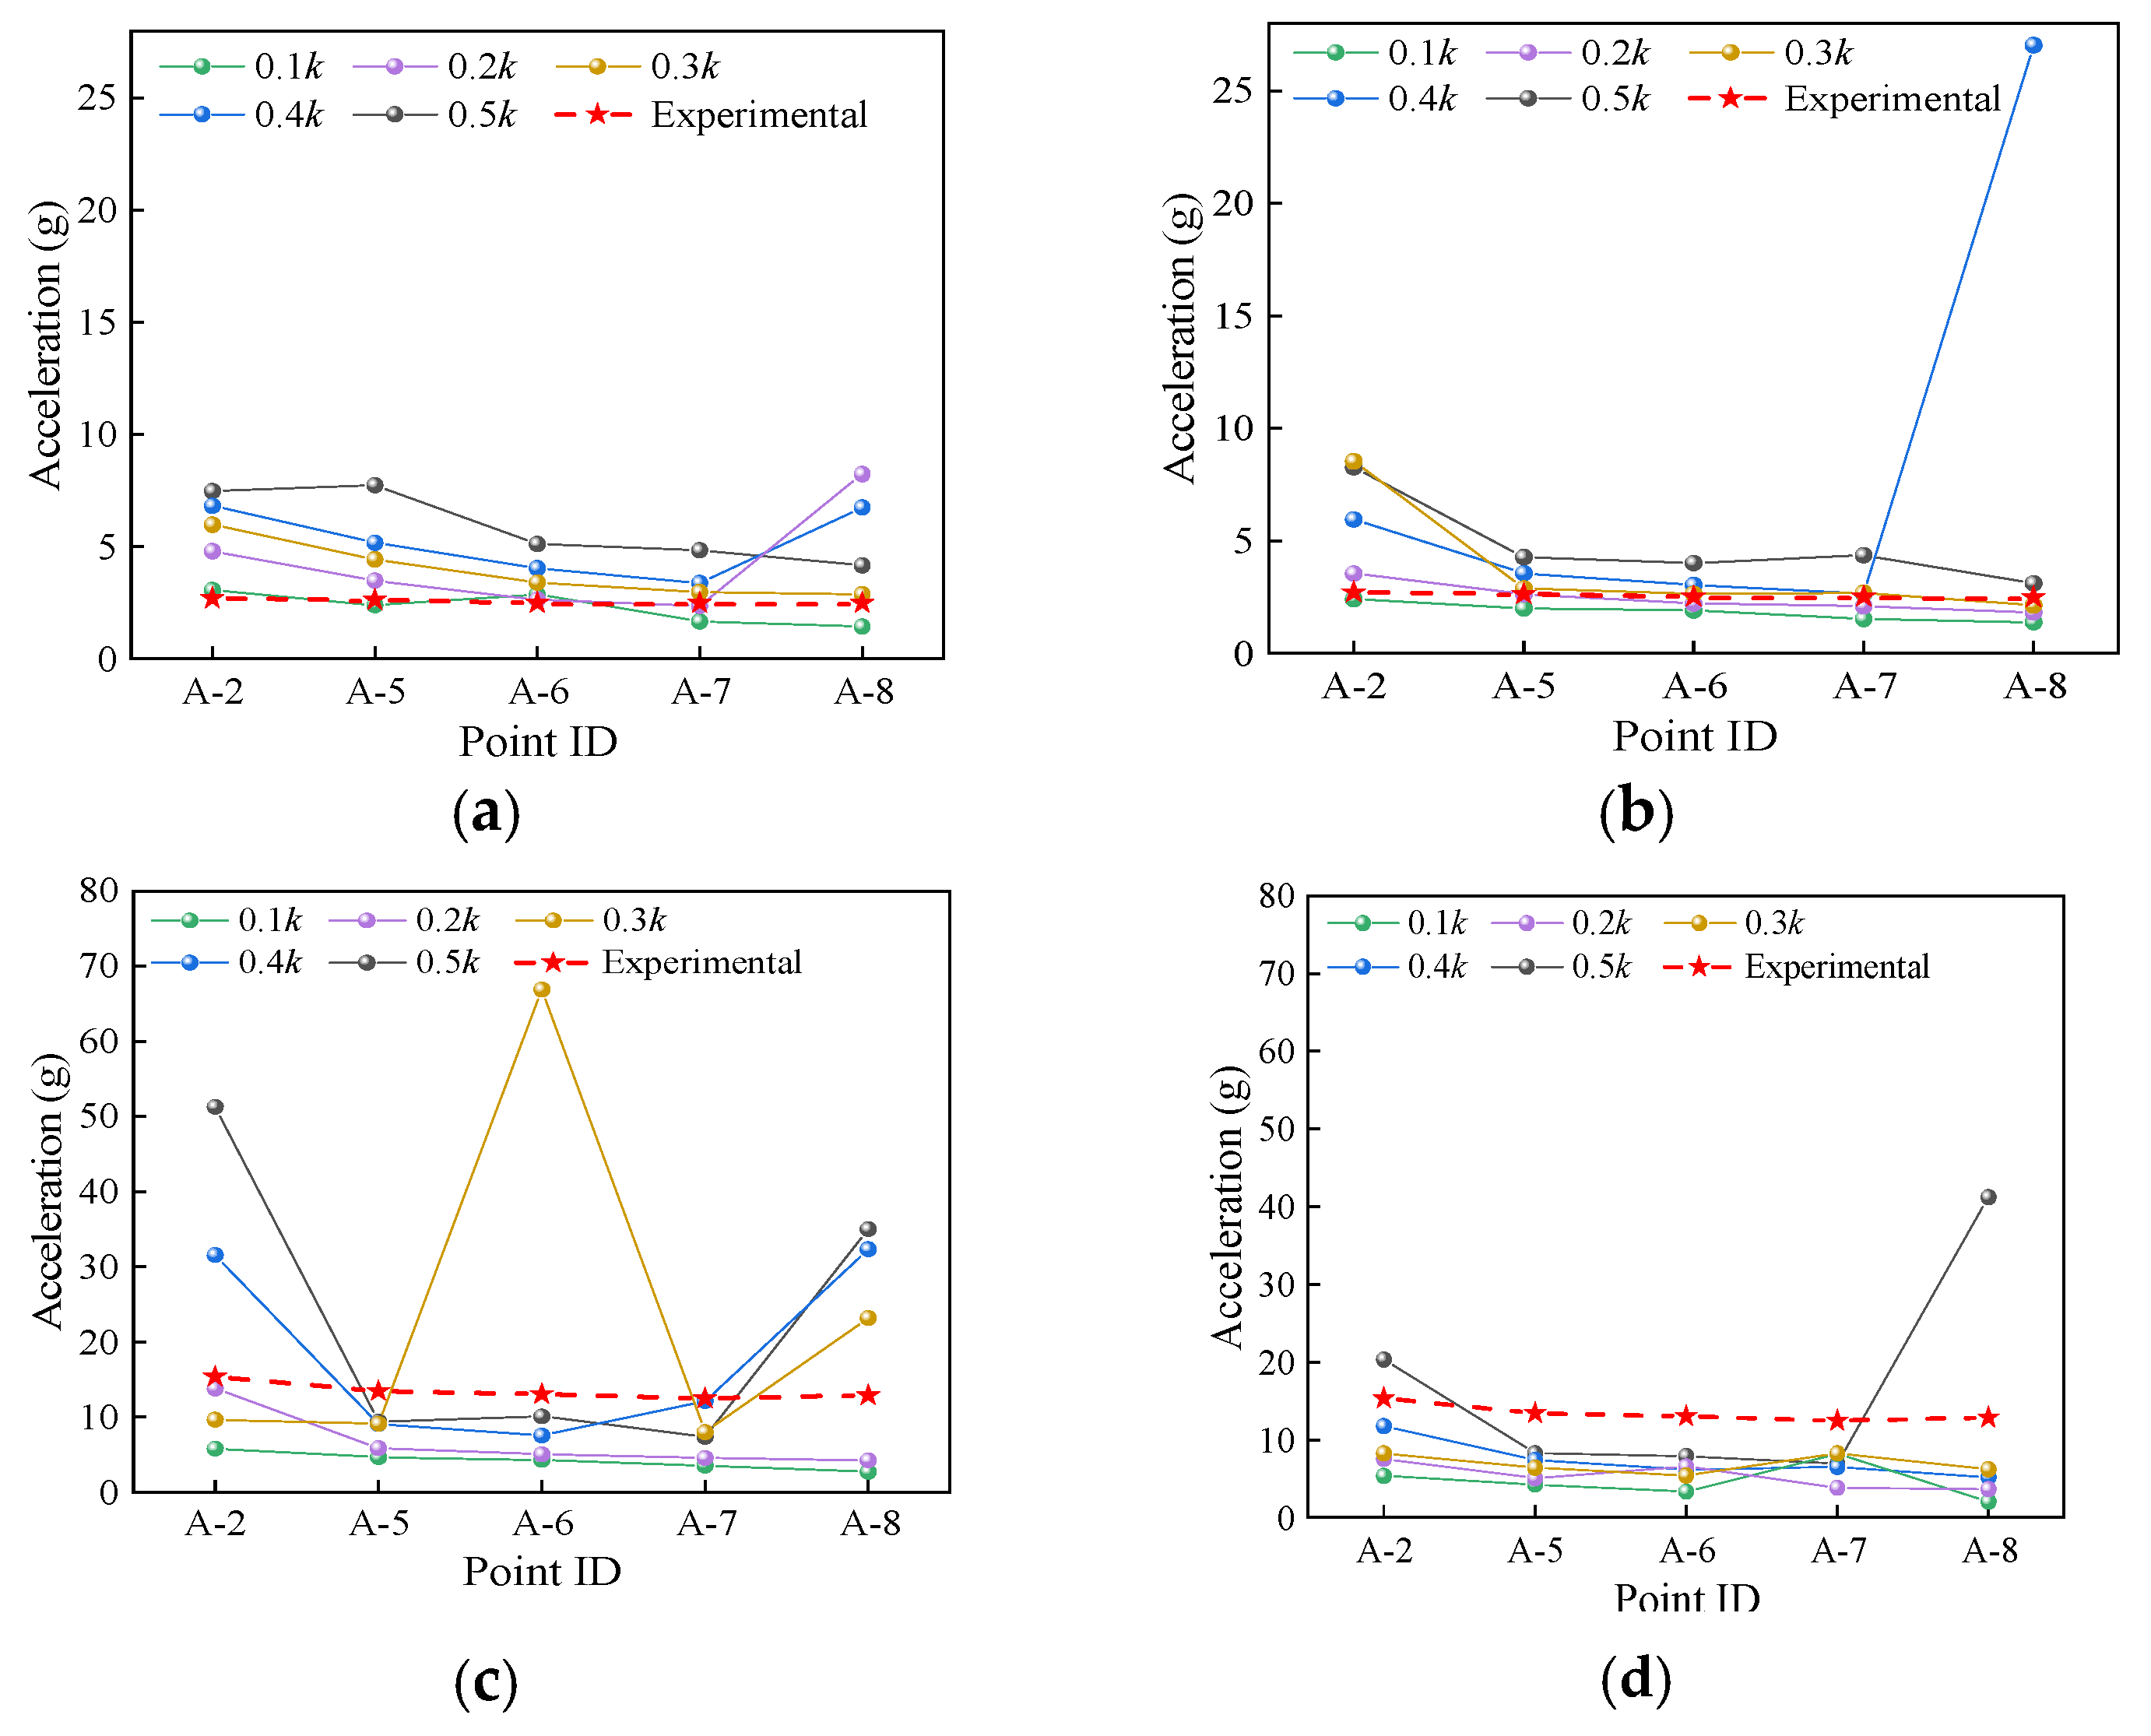
Figure 11 presents a comparison of peak longitudinal accelerations under different conditions. The end measurement points on the acute side (A-2) and obtuse side (A-8) were selected as the primary analysis objects, and the middle measurement points were also considered for comparison to characterize the typical response behavior of skew structures under asymmetric boundary constraints.
Figure 11.
Comparison of peak longitudinal acceleration responses: (a) Kelvin model at PGA = 0.4 g; (b) Hertz-damp model at PGA = 0.4 g; (c) Kelvin model at PGA = 0.7 g; (d) Hertz-damp model at PGA = 0.7 g.
When the PGA was 0.4 g, the numerical results at the middle measurement points showed relatively small dispersion and were generally consistent with the experimental variation trend, while larger differences were observed at the end measurement points. The Kelvin model overestimated the peak acceleration response at the end measurement points under 0.5k stiffness, with the response at A-2 reaching approximately 2.8 times the experimental value. For the Hertz-damp model, the calculated results at 0.2k were generally consistent with the experimental response levels at most measurement points, whereas distinct local amplification occurred at A-2 under 0.3k and at A-8 under 0.4k.
When the PGA increased to 0.7 g, the differences among different models and stiffness values became more pronounced. The Kelvin model still overestimated the end acceleration responses at 0.5k, with the calculated values being approximately 2.7–3.3 times the experimental results. At 0.1k, the Kelvin model generally underestimated the acceleration responses. For the Hertz-damp model, most calculated values within the range of 0.1–0.4k were lower than the experimental values, whereas a pronounced local amplification occurred at A-8 under 0.5k.
3.4.2. Comparison of Displacement Responses
- (a)
- Longitudinal Displacement Response:
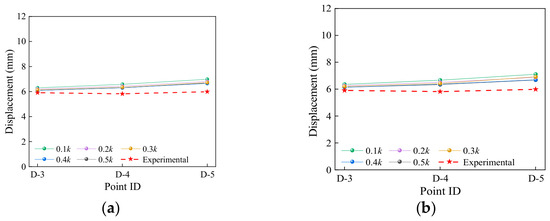
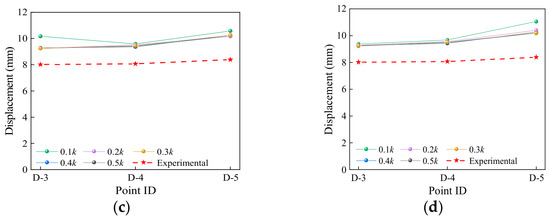
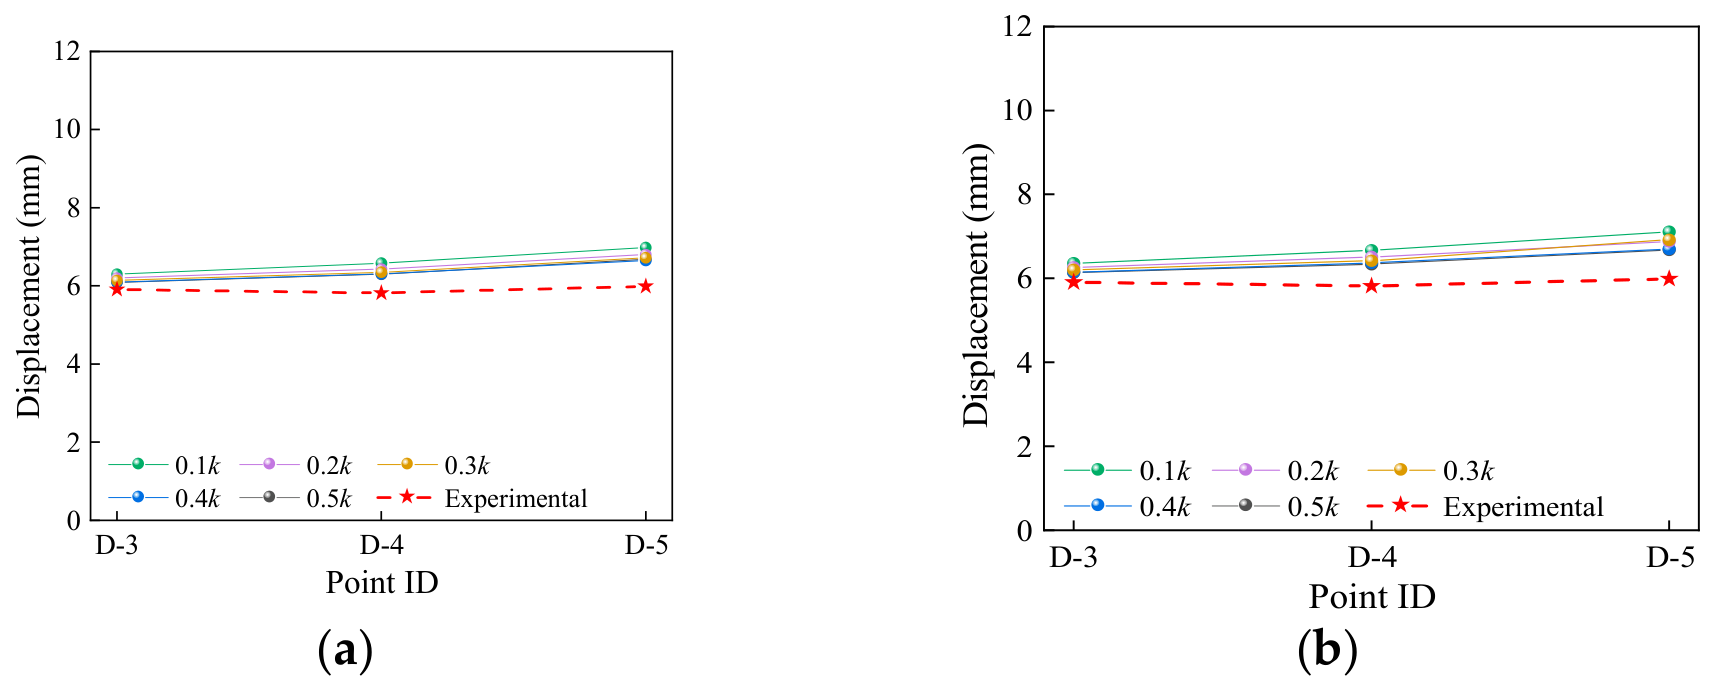
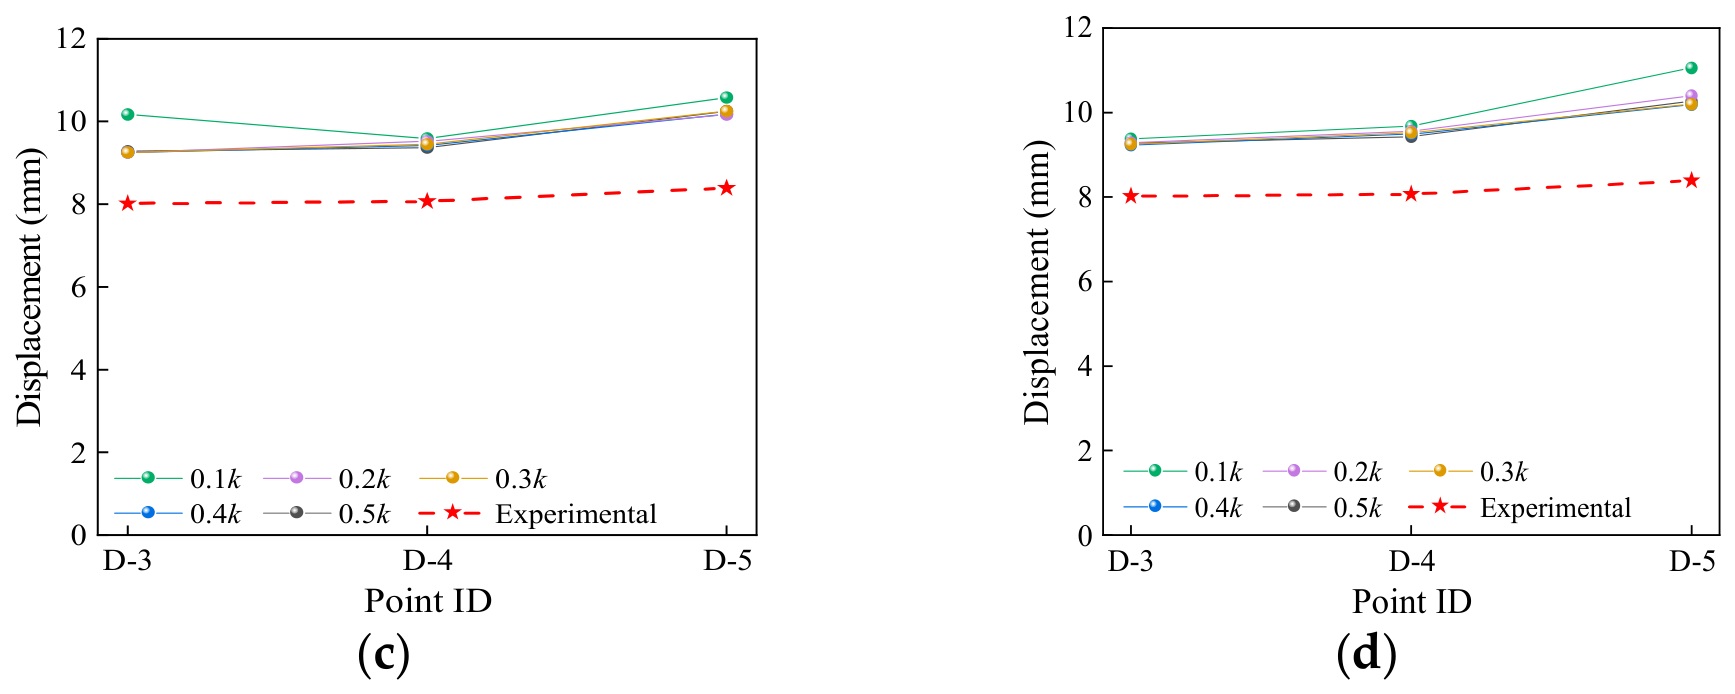
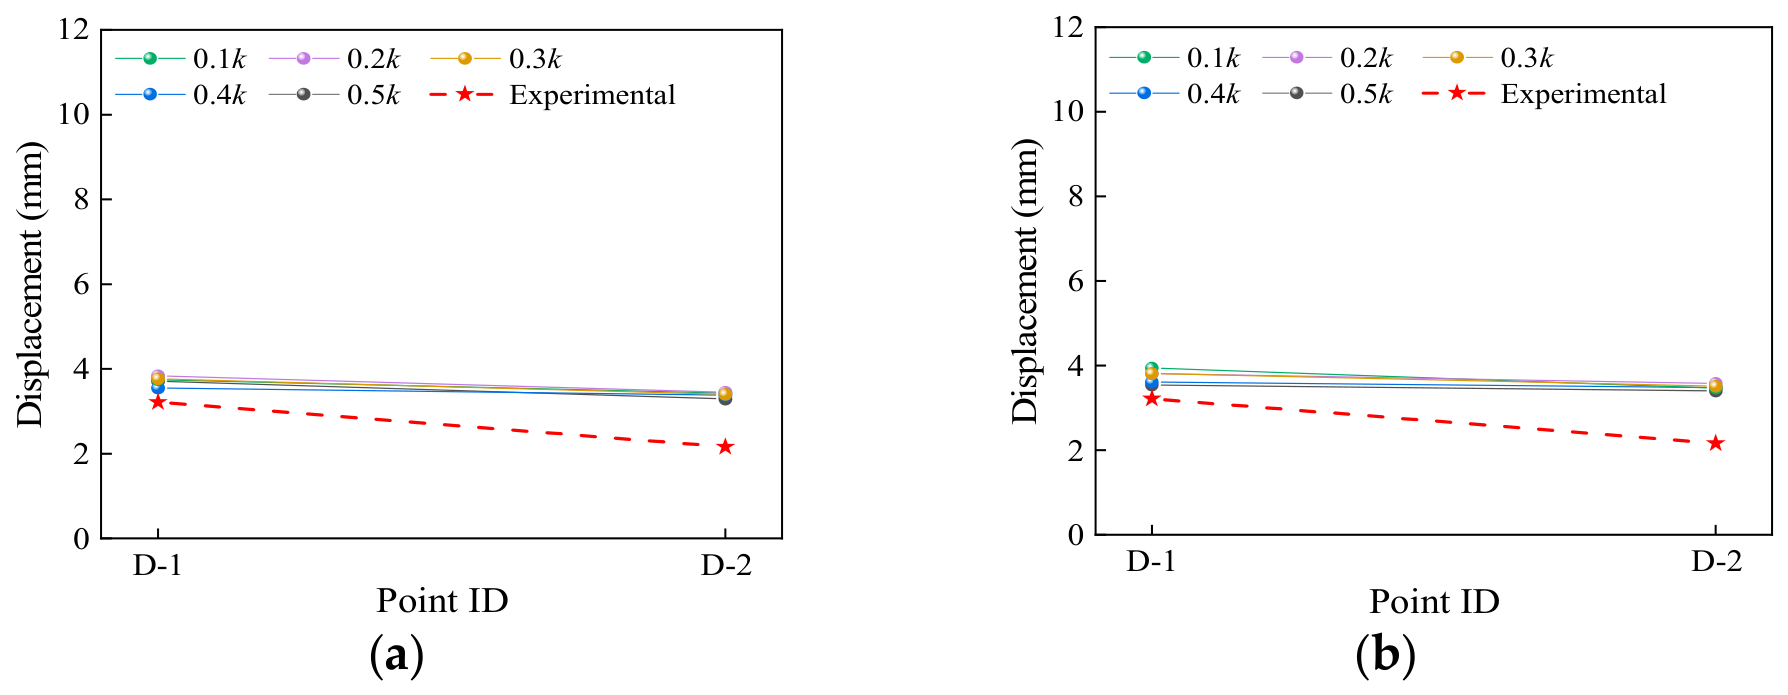
Figure 12 compares the peak longitudinal displacements at different measurement points obtained from different pounding models and stiffness values with the experimental results under PGA values of 0.4 g and 0.7 g.
Figure 12.
Comparison of peak longitudinal displacement responses: (a) Kelvin model at PGA = 0.4 g; (b) Hertz-damp model at PGA = 0.4 g; (c) Kelvin model at PGA = 0.7 g; (d) Hertz-damp model at PGA = 0.7 g.
For PGA = 0.4 g, both pounding models showed good agreement with the experimental results, with the percentage errors across the considered models, stiffness values, and measurement points ranging from approximately 3% to 19%. Along the skew direction of the girder, the errors slightly increased from the obtuse side to the acute side, which was consistent with the in-plane rotational characteristics of the girder observed in the tests, with the errors obtained from the Hertz-damp model being slightly smaller. When the PGA increased to 0.7 g, the longitudinal displacements at all measurement points increased, and the error range increased to approximately 15–32%. However, the overall distribution pattern remained unchanged. Under the low stiffness condition (0.1k), some differences were observed in the error distribution at the corner points, but the overall influence was limited.
- (b)
- Transverse Displacement Response:
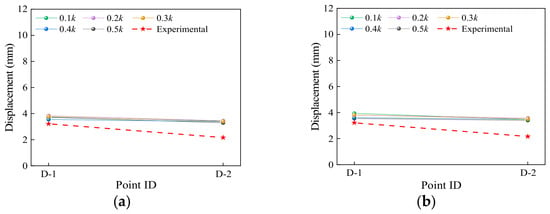
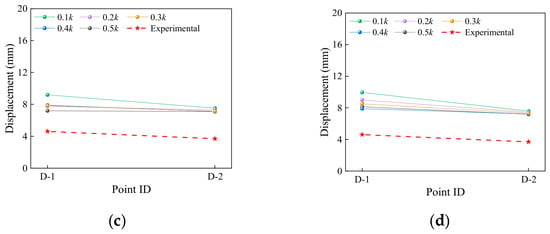
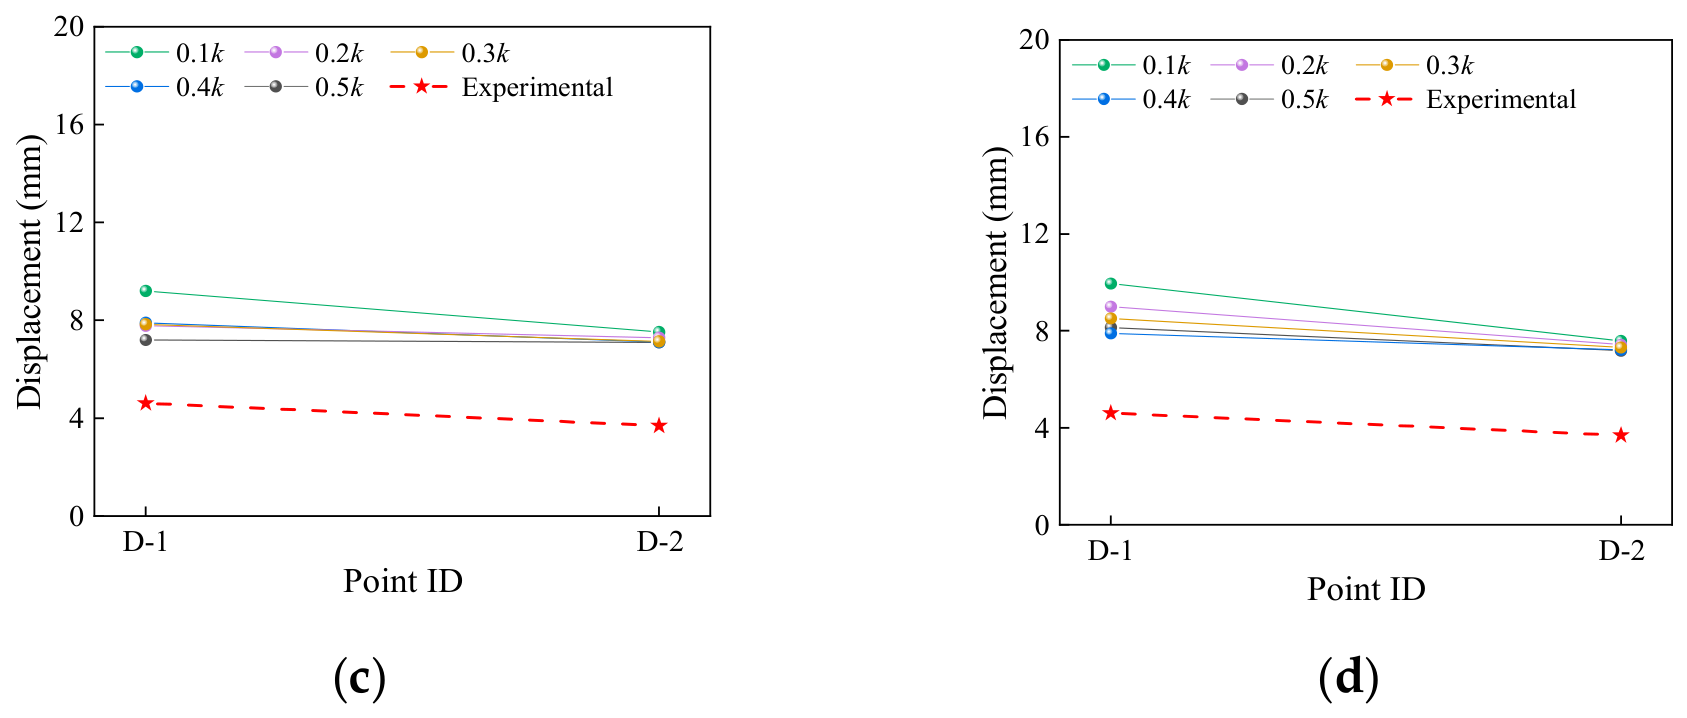
Figure 13 compares the peak transverse displacements obtained from different pounding models with the experimental results. Compared with the longitudinal displacement response, the errors of the transverse displacement response were generally larger. For PGA = 0.4 g, the errors at different measurement points ranged from approximately 10% to 66%; when the PGA increased to 0.7 g, the error range expanded to approximately 56–116%. This indicates that the simulation accuracy of the transverse displacement response was more sensitive to the pounding stiffness values.
Figure 13.
Comparison of peak transverse displacement responses: (a) Kelvin model at PGA = 0.4 g; (b) Hertz-damp model at PGA = 0.4 g; (c) Kelvin model at PGA = 0.7 g; (d) Hertz-damp model at PGA = 0.7 g.
3.4.3. Quantitative Error Comparison and Overall Assessment
To quantitatively compare the numerical and experimental results, the mean absolute percentage error (MAPE) was calculated for each response type under different pounding models, stiffness values, and PGA levels as follows:
where Rn,i and Re,i are the numerical and experimental peak responses at the ith measurement point, respectively, and N is the number of measurement points. The calculated MAPE values are summarized in Table 5.
Table 5.
Mean absolute percentage errors of acceleration and displacement responses under different pounding models and stiffness values.
The MAPE values in Table 5 show clear differences in sensitivity among the response quantities. The longitudinal displacement MAPE ranged from 7.55% to 13.64% at PGA = 0.4 g and from 17.80% to 23.92% at PGA = 0.7 g, indicating relatively small variations with the pounding model and stiffness value. By contrast, the acceleration MAPE varied from 17.46% to 234.50% and from 45.57% to 119.83%, respectively, demonstrating substantially higher sensitivity to the pounding stiffness. The transverse displacement errors were also relatively large, with MAPE values ranging from 33.35% to 42.01% at PGA = 0.4 g and from 74.30% to 110.76% at PGA = 0.7 g.
The quantitative comparison indicates that the stiffness value corresponding to the minimum MAPE was not consistent across different response quantities and PGA levels. For the Hertz-damp model, stiffness values of 0.2k and 0.3k provided a reasonable balance between acceleration and displacement accuracy. Averaged over the two PGA levels, the acceleration MAPE was 39.06% at 0.2k and 49.45% at 0.3k, while 0.3k yielded slightly lower average MAPE values for the longitudinal and transverse displacements (14.27% and 65.87%, respectively) than 0.2k (15.15% and 70.15%, respectively). Although further increases in stiffness reduced the displacement error in several cases, they were accompanied by larger acceleration errors. Therefore, under the experimental and numerical conditions considered in this study, 0.2–0.3k can be regarded as a reasonable stiffness range for the Hertz-damp model. Considering the greater sensitivity of the acceleration response to the pounding stiffness, 0.2k can serve as a reference value within the investigated stiffness range.
4. Conclusions
A 45° single-span simply supported reinforced concrete skew slab bridge was investigated through shaking table tests and numerical analyses to evaluate its seismic pounding responses and the applicability of different pounding models. The main conclusions are summarized as follows:
- (1)
- Without considering pounding, the skew bridge exhibited a pronounced dynamic amplification effect in the longitudinal acceleration response. Both longitudinal and transverse displacements showed a spatial distribution pattern in which the responses on the acute side were larger than those on the obtuse side. The difference was more significant in the transverse direction, and coupled translational and rotational responses with slight in-plane rotation were observed.
- (2)
- When pounding was considered, the acceleration response of the skew bridge was significantly amplified. Within the input PGA range of 0.3 g–0.7 g, the peak structural acceleration was approximately 5–22 times the corresponding input PGA values and increased to approximately 3–12 times those without pounding. The acceleration responses at the corner points gradually changed from relatively small differences to a distribution pattern with larger responses on the acute side than on the obtuse side.
- (3)
- Pounding altered the displacement and in-plane rotational responses of the skew bridge. The abutment impact imposed a significant constraint on the longitudinal displacement, resulting in an overall reduction in longitudinal displacement. Meanwhile, the in-plane rotation of the girder was restrained due to the modification of the boundary constraints.
- (4)
- Both pounding models were able to reproduce the basic response characteristics of the skew bridge under seismic pounding. The quantitative error analysis showed that the stiffness value corresponding to the minimum error varied with the response quantity and PGA level. For the Hertz-damp model, stiffness values of 0.2–0.3k provided a reasonable balance between acceleration and displacement accuracy. Considering the greater sensitivity of the acceleration response to the pounding stiffness, 0.2k can serve as a reference value within the investigated stiffness range under the experimental and numerical conditions considered in this study. These results can provide a reference for selecting pounding stiffness values in the seismic pounding analysis of 45° single-span simply supported reinforced concrete skew slab bridges.
This study focused on the pounding condition with a single-side abutment and employed the El Centro earthquake record as a common input motion to investigate the effects of the pounding model and pounding stiffness under a consistent ground-motion condition. Therefore, the influence of record-to-record variability remains to be further investigated. Future studies will extend the present investigation to multiple earthquake records, multi-side pounding conditions, and different boundary conditions.
Author Contributions
Conceptualization, J.L. and Y.G.; Methodology, J.L. and Y.G.; Software, J.L., Y.S. and W.Z.; Validation, J.L., Y.S., W.Z. and T.C.; Formal Analysis, J.L.; Investigation, J.L., Y.S., W.Z. and T.C.; Resources, Y.S. and W.Z.; Data Curation, J.L.; Visualization, J.L., Y.S., W.Z. and T.C.; Writing—Original Draft, J.L.; Writing—Review & Editing, J.L., Y.S., W.Z., T.C. and Y.G.; Supervision, Y.S., W.Z., T.C. and Y.G.; Project Administration, Y.S. and W.Z.; Funding Acquisition, Y.G. All authors have read and agreed to the published version of the manuscript.
Funding
This research was funded by the National Natural Science Foundation of China, grant number 52278159.
Institutional Review Board Statement
Not applicable.
Informed Consent Statement
Not applicable.
Data Availability Statement
The data supporting the conclusions of this article will be made available by the authors on request.
Conflicts of Interest
Author T.C. was employed by Shanghai Pudong Architectural Design and Research Institute Co., Ltd. The remaining authors declare that the research was conducted in the absence of any commercial or financial relationships that could be construed as a potential conflict of interest.
References
- Chen, J.; Wang, L.; Zhou, Y.; Yaun, X. Near-Fault Seismic Response Analysis of Single-Span Skew Bridges. J. Disaster Prev. Mitig. Eng. 2022, 42, 1314–1323. [Google Scholar] [CrossRef]
- Kaviani, P.; Zareian, F.; Taciroglu, E. Seismic Behavior of Reinforced Concrete Bridges with Skew-Angled Seat-Type Abutments. Eng. Struct. 2012, 45, 137–150. [Google Scholar] [CrossRef] [Scilit]
- Kun, C.; Jiang, L.; Chouw, N. Influence of Pounding and Skew Angle on Seismic Response of Bridges. Eng. Struct. 2017, 148, 890–906. [Google Scholar] [CrossRef] [Scilit]
- Wang, J.; Shen, X.; Li, J. Study of Rotation Mechanism and Skew Degree Influence of Skewed Simply-Supported Beam Bridge under Earthquake Excitation. Bridge Constr. 2014, 44, 32–37. (In Chinese) [Google Scholar]
- Yan, J.; Li, S.; Wang, J. Study of Rotation Mechanism of Decks of Skewed Multi-Span Simply-Supported Girder Bridges under Strong Earthquake. Bridge Constr. 2017, 47, 29–34. (In Chinese) [Google Scholar]
- Zhan, M.; Wang, J.; Yan, J. Study on Simplified Dynamic Calculation Models for Three-Span Skewed Simply Supported Bridges. J. Vib. Shock 2017, 36, 231–237. [Google Scholar] [CrossRef]
- Chen, J.; Han, Q.; Liang, X.; Du, X. Effect of Pounding on Nonlinear Seismic Response of Skewed Highway Bridges. Soil Dyn. Earthq. Eng. 2017, 103, 151–165. [Google Scholar] [CrossRef] [Scilit]
- Huo, Y.; Zhang, J. Effects of Pounding and Skewness on Seismic Responses of Typical Multispan Highway Bridges Using the Fragility Function Method. J. Bridge Eng. 2013, 18, 499–515. [Google Scholar] [CrossRef] [Scilit]
- Wieser, J.; Zaghi, A.E.; Maragakis, E.M.; Buckle, I.G. A Methodology for the Experimental Evaluation of Seismic Pounding at Seat-Type Abutments of Horizontally Curved Bridges. In Structures Congress 2012; American Society of Civil Engineers: Reston, VA, USA, 2012; pp. 613–624. [Google Scholar] [CrossRef] [Scilit]
- Li, B.; Bi, K.; Chouw, N.; Butterworth, J.W.; Hao, H. Effect of Abutment Excitation on Bridge Pounding. Eng. Struct. 2013, 54, 57–68. [Google Scholar] [CrossRef] [Scilit]
- Deng, Y.; Ge, S.; Lei, F. Effects of Pounding and Abutment Behavior on Seismic Response of Multi-Span Bridge Considering Abutment–Soil–Foundation–Structure Interactions. Buildings 2023, 13, 260. [Google Scholar] [CrossRef] [Scilit]
- Shi, Y.; Pei, Y.; Zhang, Z.; Zhao, H.; Zhu, M. Seismic Response and Seismic Isolation Performance Analysis of Skewed Bridges under Strong Earthquakes. World Earthq. Eng. 2023, 39, 105–112. [Google Scholar] [CrossRef]
- Shen, X.; Hu, Y.; Wang, J.; Shi, Y. Study on the Influence of Vertical Ground Motion on Skewed Continuous Girder Bridges. Earthq. Resist. Eng. Retrofit. 2024, 46, 141–150. [Google Scholar] [CrossRef]
- Lao, T.; Gao, G.; Dang, X.; Lain, Q.; Zhang, P.; Yuan, W. Effect of Cable Modular Expansion Joints on Seismic Responses of Skewed Bridges under Near-Fault Earthquakes. J. Railw. Sci. Eng. 2021, 18, 1782–1789. [Google Scholar] [CrossRef]
- Wu, S.; Buckle, I.G.; Itani, A.M.; Istrati, D. Experimental Studies on Seismic Response of Skew Bridges with Seat-Type Abutments. I: Shake Table Experiments. J. Bridge Eng. 2019, 24, 04019091. [Google Scholar] [CrossRef] [Scilit]
- Wu, S.; Buckle, I.G.; Itani, A.M.; Istrati, D. Experimental Studies on Seismic Response of Skew Bridges with Seat-Type Abutments. II: Results. J. Bridge Eng. 2019, 24, 04019092. [Google Scholar] [CrossRef] [Scilit]
- Chern, K.; Yang, Z.; Chouw, N. Seismic Response of Skewed Bridges Including Pounding Effects. Earthq. Struct. 2018, 14, 467–476. [Google Scholar] [CrossRef]
- Yang, Z.; Kun, C.; Chouw, N. Experimental Evaluation of the Seismic Response of Skewed Bridges with Emphasis on Poundings between Girder and Abutments. Shock Vib. 2019, 2019, 4069817. [Google Scholar] [CrossRef] [Scilit]
- Du, H.; Xu, L.; Deng, H.; Lu, X. In-Plane Rotation Response of Skewed Simply Supported Bridges Considering Multi-Point Pounding Effect. Structures 2024, 70, 107813. [Google Scholar] [CrossRef] [Scilit]
- Dimitrakopoulos, E.G. Seismic Response Analysis of Skew Bridges with Pounding Deck–Abutment Joints. Eng. Struct. 2011, 33, 813–826. [Google Scholar] [CrossRef] [Scilit]
- Tao, Y.; Xu, L.; Yao, K.; Li, J. Seismic Response of Continuous Skewed Bridges Considering the Bidirectional Pounding Effect. China Earthq. Eng. J. 2019, 41, 360–369. (In Chinese) [Google Scholar]
- Gu, X.; You, X.; Wu, G. Seismic Performance Analysis of Skewed Bridges Considering Bidirectional Pounding Effects. Highw. Transp. China 2019, 39, 68–73. [Google Scholar] [CrossRef]
- Anagnostopoulos, S.A. Pounding of Buildings in Series during Earthquakes. Earthq. Eng. Struct. Dyn. 1988, 16, 443–456. [Google Scholar] [CrossRef] [Scilit]
- Anagnostopoulos, S.A. Equivalent Viscous Damping for Modeling Earthquake-Induced Pounding. Earthq. Eng. Struct. Dyn. 2004, 33, 897–914. [Google Scholar] [CrossRef] [Scilit]
- Jankowski, R. Non-Linear Viscoelastic Modelling of Earthquake-Induced Structural Pounding. Earthq. Eng. Struct. Dyn. 2005, 34, 595–611. [Google Scholar] [CrossRef] [Scilit]
- Muthukumar, S.; DesRoches, R. A Hertz Contact Model with Non-Linear Damping for Pounding Simulation. Earthq. Eng. Struct. Dyn. 2006, 35, 811–828. [Google Scholar] [CrossRef] [Scilit]
- Ye, K.; Li, L. Impact Analytical Models for Earthquake-Induced Pounding Simulation. Front. Struct. Civ. Eng. 2009, 3, 142–147. [Google Scholar] [CrossRef] [Scilit]
- Ye, K.; Li, L.; Zhu, H. A Note on the Hertz Contact Model with Nonlinear Damping for Pounding Simulation. Earthq. Eng. Struct. Dyn. 2009, 38, 1135–1142. [Google Scholar] [CrossRef] [Scilit]
- Cui, L.L.; Guo, A.X.; Li, H. Investigation of the Parameters of Hertz Impact Model for the Pounding Analysis of Highway Bridge. Procedia Eng. 2011, 14, 2773–2778. [Google Scholar] [CrossRef] [Scilit][Green Version]
- Zhuo, Y.; Li, Z.; Wang, F. Comparison of Different Contact Element Models in Bridge Seismic Pounding Analysis. Eng. Mech. 2014, 31, 11–17. [Google Scholar]
- He, J.; Ye, A. Seismic Response of Continuous Skew Bridges with Pounding Effect. J. Cent. South Univ. Sci. Technol. 2012, 43, 1475–1481. (In Chinese) [Google Scholar]
- Guo, A.; Cui, L.; Li, S.; Li, H. A Phenomenological Contact-Element Model Considering Slight Non-Uniform Contact for Pounding Analysis of Highway Bridges under Seismic Excitations. Earthq. Eng. Struct. Dyn. 2015, 44, 1677–1695. [Google Scholar] [CrossRef] [Scilit]
- Chen, T. Study on the Collision Effect of Simply-Supported Skew Girder Bridge under Earthquake. Master’s Thesis, Fuzhou University, Fuzhou, China, 2017. (In Chinese) [Google Scholar]

Disclaimer/Publisher’s Note: The statements, opinions and data contained in all publications are solely those of the individual author(s) and contributor(s) and not of MDPI and/or the editor(s). MDPI and/or the editor(s) disclaim responsibility for any injury to people or property resulting from any ideas, methods, instructions or products referred to in the content. |
© 2026 by the authors. Licensee MDPI, Basel, Switzerland. This article is an open access article distributed under the terms and conditions of the Creative Commons Attribution (CC BY) license.