


Abstract
Cut blasting in deep excavations occurs in rock masses subject to unequal initial stresses. This study compares two SPH–FEM simulations of the same cut-blasting problem: S35–22, a prescribed biaxial initial-stress state derived from mine-provided field stress records, with horizontal and vertical components of 35 and 22 MPa, respectively, and S0, a zero-preload numerical baseline. The analysis considers equivalent-stress histories and sectional RHT damage over 0–20 ms, the cumulative initial mass of rock SPH particles first observed at D = 1 and its interval-average increase over 0–40 ms, and finite-window cumulative first-crossing mass evaluated through 40 ms. The comparison characterizes the response of the prescribed S35–22 state relative to S0 within the stated observation windows.
1. Introduction
Deep underground excavation places drill-and-blast operations in rock masses carrying substantial and commonly unequal initial stresses. As mining depth increases, this stress environment becomes a governing boundary condition for excavation stability and rock breakage [1]. In a tunnel heading with a single free surface, the cut blast must create the initial relief and compensation space into which rock broken by subsequent holes can move. An ineffective cut therefore restricts the entire round, while stress-altering blast practices show that explosive loading and the pre-existing stress field cannot be considered independently in deep excavations [2]. The present study concerns a roadway in a mine in Gansu Province, China. The mine provided several field stress records with horizontal and vertical components clustered around 35 and 22 MPa, respectively. Their rounded mean values were prescribed as the S35–22 biaxial initial-stress condition. This engineering condition provides a field-informed case for examining a six-empty-hole parallel cut. The central problem is how the prescribed biaxial initial stress state changes the connected sequence of dynamic-stress transmission, material degradation and outward particle transport. Comparison with a stress-free baseline can isolate this influence when geometry, materials, loading procedure and numerical outputs are otherwise unchanged.
Parallel-hole cutting uses uncharged empty holes to provide local free surfaces, stress concentration and compensation volume near charged holes. These functions promote crack interaction and create space for fragmented rock to move, so empty-hole diameter, spacing, charge arrangement and confinement jointly control cut development. Earlier numerical work linked high in situ stress to cut-blasting damage mechanisms and design requirements [3]. Recent studies have examined interactions between empty holes and initial stress [4], the coupled effects of three-dimensional stress and compensation-space coefficient [5], and damage and fracture around a large empty hole under high stress [6]. Three-dimensional SPH–FEM modelling has also resolved damage evolution, ejection and debris migration in empty-hole cuts [7], while simulations combined with field tests have informed cut-hole layouts’ underground stress [8]. These studies show that an empty hole is not merely a geometric void: it modifies the local stress field and the kinematic space available after fracture. They also establish stress, hole geometry and charge configuration as interacting design variables. However, reported outcomes often emphasise one evidence class—damage contours, fracture patterns, projected cavity dimensions or advance—making the relation between stress transmission, fully damaged material and time-dependent rock movement difficult to assess within one controlled comparison. Studies of contour and smooth blasting report that initial stress and borehole layout jointly influence fracture development and surrounding-rock damage [9,10,11].
Initial compression can modify blasting response through concurrent mechanisms. It reduces the tensile part of the transient stress field, limits crack opening and promotes frictional contact or local compression–shear damage, while unequal principal stresses can redirect propagation and alter interactions with empty holes and free surfaces. Empty-hole analyses indicate that stress magnitude and anisotropy affect damage extent and orientation [12]. Three-dimensional SPH–FEM calculations further show that in situ stress interacts with discontinuity persistence and rock bridges to shape fracture networks [13], while confined and unconfined tests confirm that confinement changes fracture patterns, although the response depends on material and loading assumptions [14]. Directional slit-charge experiments provide a clear example: static stress can suppress or promote crack growth according to its orientation relative to the slit [15]. Related simulations indicate that far-field cracks tend to align with the higher initial stress [16], and that increasing in situ stress can enlarge compressive components, reduce tensile components and constrain crushed and cracked zones [17]. These findings do not imply one monotonic rule for every cut. The response depends on stress magnitude, stress ratio, principal-stress direction, free-surface geometry and the performance indicator. This conditionality defines the question addressed here: under one measured non-equibiaxial state, do effective-stress peaks, complete damage and outward rock movement change consistently relative to an otherwise identical stress-free case? At the engineering scale, charge-structure optimisation has been used to control blast-induced damage, while studies of adjacent tunnels and deep roadways show that blast design must account for dynamic response, stability and rock burst risk [18,19,20,21].
Answering this question requires indicators that distinguish loading, degradation and transport. Stress histories describe the arrival, superposition and attenuation of dynamic loading, but not whether affected material becomes fully damaged or leaves the cut region. Continuum blast models commonly map damage or fracture zones [22,23], whereas hybrid finite–discrete approaches can explicitly represent fragmentation, fragment casting and muck-pile formation [24]. Models of cyclic blasting under different in situ stresses likewise connect stress conditions with progressive damage and fragmentation [25]. Each approach resolves a different part of the process. A damage contour identifies a material state defined by a constitutive criterion; it is not a measurement of geometric cavity area. Conversely, particle displacement or boundary crossing describes motion but does not establish that material is fully damaged or permanently removed. These distinctions matter in short simulations, because particles may continue moving after the damage pattern becomes comparatively stable and may later cross back through a reference plane. Stress histories, threshold-defined damage measures and stage-resolved transport measures have rarely been evaluated together in a field-informed paired model. Joint assessment can test whether their trends agree without treating correlation as a one-to-one causal relation. It can also define ejection-related response within the simulated interval without inferring final rock removal from transient movement.
This study examines a six-empty-hole parallel cut for the Gansu roadway using a coupled SPH–FEM model with the RHT constitutive description for rock. Condition S35–22 applies the prescribed horizontal and vertical initial stresses of 35 and 22 MPa, whereas S0 is the zero-preload baseline. The paired design isolates the response associated with the selected initial-stress condition while holding the geometry, material parameters, charge arrangement, boundaries, discretisation and output settings constant.
The study makes three contributions to evaluating cut blasting under field-relevant stress. First, the paired S35–22 and S0 calculations connect a prescribed biaxial initial stress state to a stress-free baseline without changing the hole pattern or numerical treatment. Second, the analysis combines directional effective-stress histories, D = 1 section areas, the cumulative initial mass of rock SPH particles first observed at D = 1 and its interval-average increase, and finite-window cumulative first-crossing mass, separating material degradation from outward particle transport while retaining their temporal correspondence. Third, the stage-resolved results identify a coherent response for the modelled geometry: S35–22 lowers the sampled peak equivalent stress at all eight monitoring points; it generally produces smaller D = 1 areas on the XOZ and YOZ sections, while the XOY response varies by stage; and it reduces the 20 ms cumulative first-crossing mass from 3791.11 to 3604.26 kg, a difference of 4.93%. The 15–20 ms interval still contributes to the cumulative mass, showing that particle transport remains active after the principal damage morphology has formed in the selected sections. These results characterize how one prescribed, directionally unequal stress state is associated with coupled stress, damage and transport indicators for a specific six-empty-hole cut. They provide a field-informed basis for judging cut-performance sensitivity to initial stress within the analysed hole layout and finite observation window.
2. Materials and Methods
2.1. Material Parameters for Numerical Simulation
The simulation models were broadly divided into three components: rock, emulsified explosives and borehole backfill. The rock was defined using the RHT material constitutive model. The rock RHT material card was developed in a previous research project conducted by our team. Static characterization comprised uniaxial compression and Brazilian splitting tests. The uniaxial compression tests provided the uniaxial compressive strength, elastic modulus, and Poisson’s ratio, whereas the Brazilian splitting tests provided the tensile strength. Dynamic characterization was conducted using split Hopkinson pressure bar (SHPB) impact tests, which provided dynamic stress–strain responses and rate-dependent compressive strength. These experimental results, together with constitutive relations and literature recommendations, informed the determination of the RHT parameters.
The emulsion explosive was modelled using the MAT_HIGH_EXPLOSIVE_BURN explosive material model, whilst the JWL-EOS equation of state was employed to accurately describe the volume and pressure of the detonation products. The hole stemming material was modeled as a soil material using the MAT_SOIL_AND_FOAM constitutive model, for which no separate equation of state was required. The JWL equation of state (EOS) is expressed in Equation (1):
where P is the detonation pressure; are material constants of the explosive; V is the initial relative volume; and is the internal energy per unit initial volume.
The specific material parameters are shown in Table 1, Table 2 and Table 3. Dynamic rock strength and Mode-I fracture toughness can be characterised using recommended test methods for rock materials under dynamic loading [26]. The RHT formulation used here follows the high-rate hydrocode modelling lineage described by Riedel et al. [27].
Table 1.
RHT constitutive model parameters for the rock material.
Table 2.
Parameters of the Equation of State for Explosives.
Table 3.
Stemming Material Model Parameters.
2.2. Model Building
The models were based on a tunnel excavation site at a mine in Gansu Province, China. Smoothed particle hydrodynamics was introduced as a meshfree Lagrangian particle method [28,29]. Subsequent work identified tensile instability as a numerical issue and proposed corrective formulations, while SPH-based approaches have also been used to simulate high-rate fragmentation [30,31]. Meshfree, coupled SPH-FE and particle-based approaches have been used to model fragmentation, tunnel response and repeated-blast damage [32,33,34,35,36].
To construct the SPH–FEM coupled model, a finite element model was first established in LS-DYNA and divided into three parts: the near-field rock, explosive, and far-field rock. After the keyword (k) file was generated, it was opened in LS-PrePost. The SPH-Generation module was then used to convert the finite element meshes of the near-field rock and explosive into SPH particles for subsequent calculations. The original finite elements and associated nodes of the explosive and near-field rock were subsequently removed and no longer participated in the calculation.
After the SPH–FEM coupled model was established, the CONTACT_TIED_NODES_TO_SURFACE_OFFSET keyword was added to the generated k file to define the coupling contact between the SPH and FEM domains. The smoothed particle hydrodynamics (SPH) and finite element method (FEM) domains were coupled using the CONTACT_TIED_NODES_TO_SURFACE_OFFSET formulation. The boundary conditions of the model were applied directly to the FEM domain.
This coupling strategy enabled the complex failure and large-deformation processes induced by blast loading to be effectively simulated while maintaining computational efficiency and sufficient accuracy for the small-deformation response of the far-field rock.
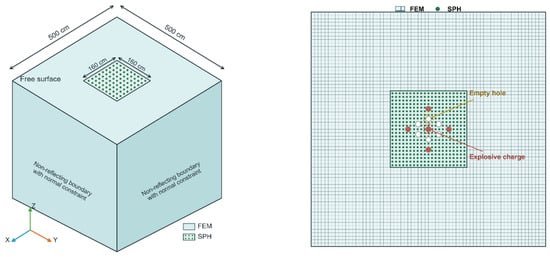
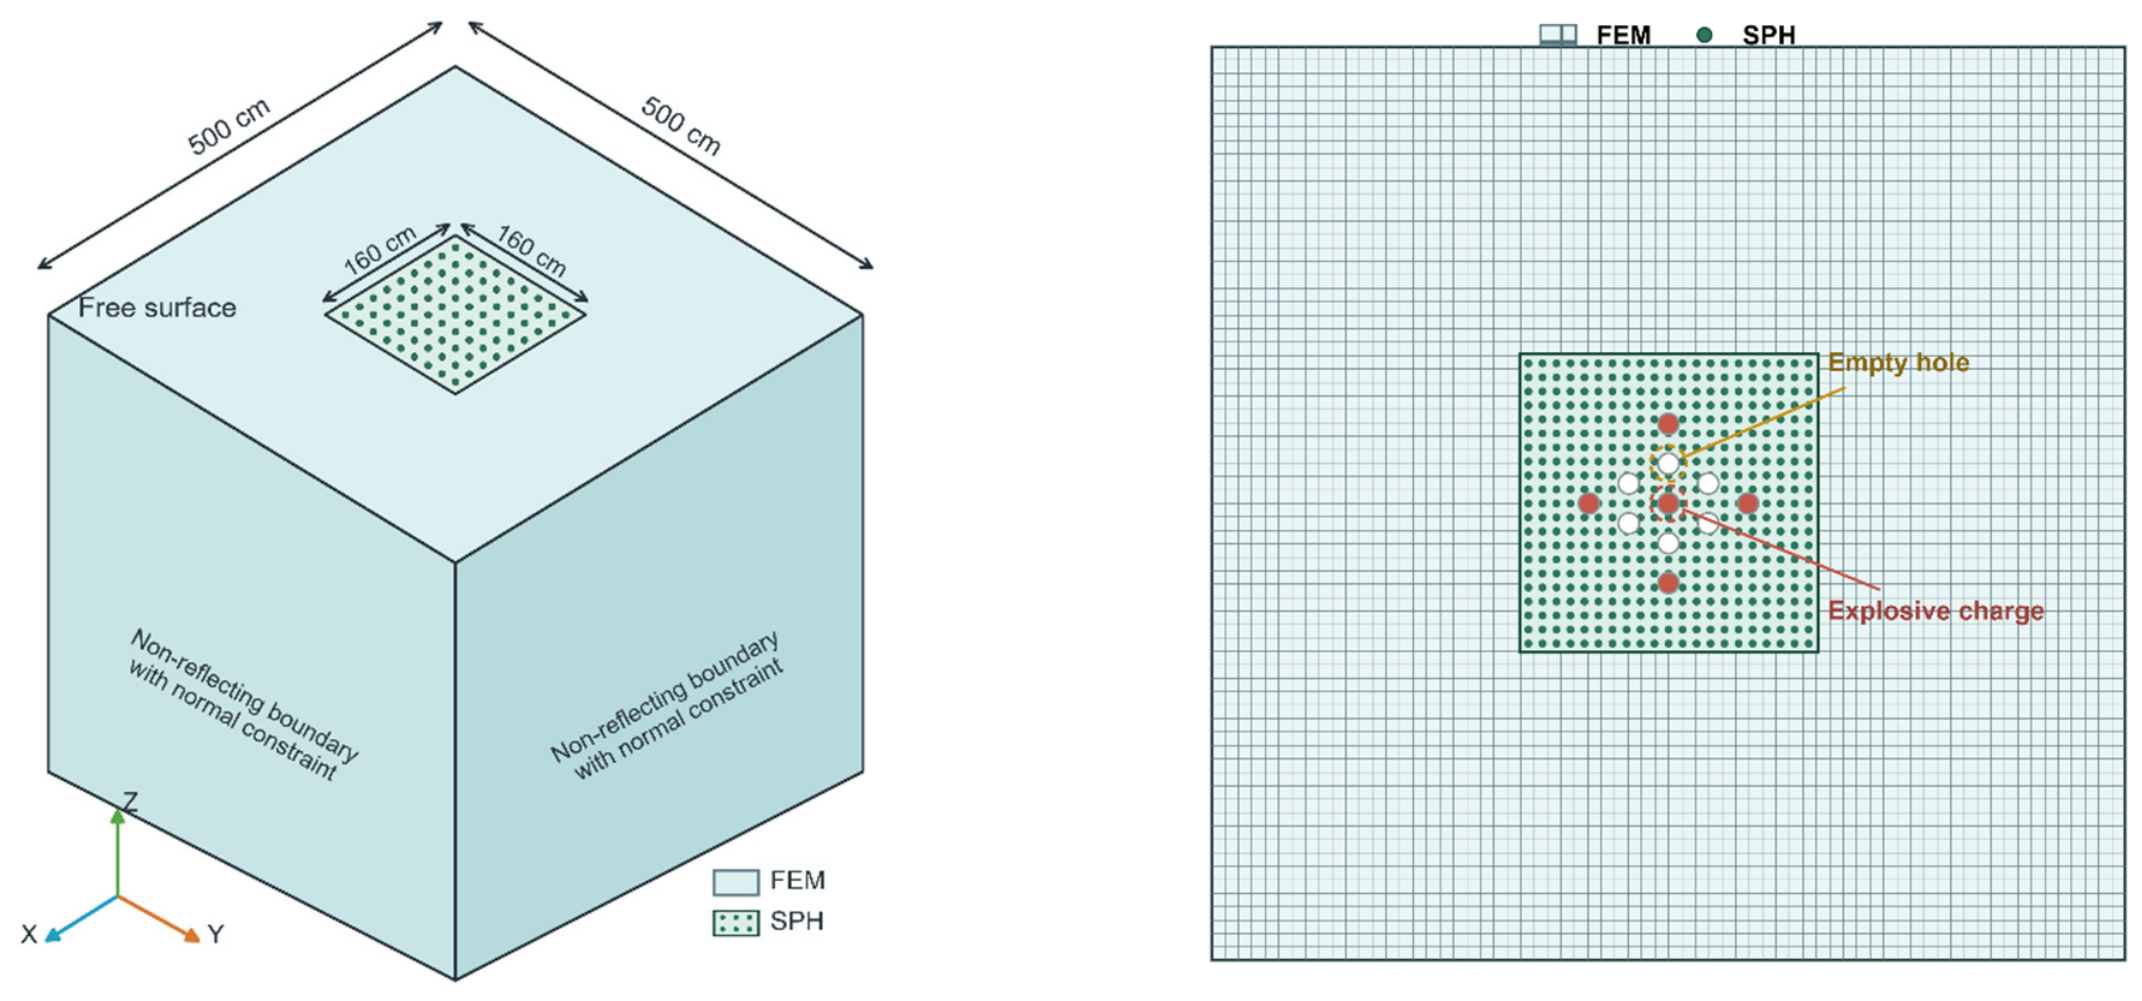
A schematic of the numerical model is shown in Figure 1, with the main geometric parameters provided in the caption. The model consisted of 1,756,701 nodes, 896,320 finite-element solid elements, and 824,400 SPH particles, including 822,400 rock particles. Six empty holes and five charged holes, each 4.2 cm in diameter and 250 cm in length, were arranged at a spacing of 20 cm. Continuous charging was adopted, with a charge length of 225 cm and a stemming length of 25 cm. A nominal SPH particle spacing of 2.5 cm was adopted for the reference model. No model specific spatial resolution sensitivity analysis was performed. Accordingly, the rock SPH particles had an initial spacing of 2.5 cm, and the explosive and stemming particles were arranged at an axial spacing of 2.5 cm, while the surrounding rock was discretized using finite elements with a nominal edge length of 5.0 cm. The SPH formulation used CSLH = 1.2, HMIN = 0.2, HMAX = 2.0, and SPHINI = 0, corresponding to an initial smoothing length of approximately 3.0 cm based on the nominal particle spacing. The S0 model retained the reference uniform discretization, whereas the S35–22 coordinates incorporated the deformation induced by prestressing. No erosion or failure keywords were applied; therefore, all particles remained active throughout the simulation. Previous SPH-based blasting studies have examined particle-resolution effects and the sensitivity of results to SPH parameters [37,38,39].
Figure 1.
FEM-SPH Coupled Numerical Model for Cut Blasting. The model contained six empty holes and five loaded holes, each with a diameter of 4.2 cm, a spacing of 20 cm, and a length of 250 cm. Continuous charging was adopted with a charge coefficient of 0.9, corresponding to a charge length of 225 cm and a stemming length of 25 cm.
The simulations were performed using the shared-memory parallel (SMP) version of LS-DYNA R12. An explicit time-integration scheme was adopted, with a time-step scale factor of 0.67 and without mass scaling. Results were written at intervals of 100 μs.
The blasting simulations were initially evaluated over 0–20 ms and subsequently continued to 40 ms. The additional 20–40 ms interval provided an extended observation stage to assess whether the stress histories and damage measures continued to evolve beyond 20 ms and to examine the dependence of cumulative first-crossing mass on the observation-window duration.
2.3. Initial Stress Condition
Two numerical models were established in this study. Initial in situ stresses were applied in both the horizontal and vertical directions to one model, whereas no initial stress was applied to the other. The two models were compared to evaluate the influence of initial in situ stress on cut blasting in the roadway.
The initial in situ stress parameters adopted in this study were obtained from internal records provided by the mine. Multiple in situ stress measurements had been conducted in an area with a mining-level elevation of approximately 1050 m, a surface elevation of approximately 1780 m, and an overburden depth of about 730 m. Several sets of measurement data were provided. Because the present study primarily focused on the comparison between conditions with and without initial in situ stress, the measured stress data were averaged to reduce variability in the input parameter space and to define a representative stress state for the numerical simulations. The resulting horizontal and vertical initial in situ stresses were 34.98 MPa and 22.02 MPa, respectively. At this stage, the available data indicated a notably high horizontal in situ stress. Therefore, the in situ stress was further estimated using the following stress-estimation equation:
where σV and σH are the vertical and horizontal in situ stresses, respectively, in MPa; γ is the unit weight of the rock mass, in kN·m−3; h is the burial depth of the calculation unit, in m; and μ is Poisson’s ratio. The unit weight of the rock mass is:
where ρ is the rock density, taken as 3.013 g·cm−3 from the RHT material parameters, and is the gravitational acceleration, taken as 9.8~10 m·s−2. The calculated unit weight is γ = 29.5~30.1 ≈ 30 kN·m−3. Therefore:
The vertical in situ stress provided by the mine is therefore considered consistent with the theoretical estimate and can be regarded as reasonable. However, when σV is substituted into the theoretical expression for σH:
where k is the lateral pressure coefficient. The calculated k value is also relatively high and appears unusual. The relevant literature was therefore reviewed. Li and Miao reported that, across metal mines in mainland China, vertical and maximum horizontal in situ stresses generally increase with burial depth. The maximum lateral pressure coefficient, kmax, is mainly distributed within the range of 1.00–2.50, while the ratio between the average horizontal in situ stress and the vertical in situ stress is generally within 1.00–2.00 [40]. In addition, in situ stress measurements conducted in the mining area and its surroundings by the Institute of Geology, Chinese Academy of Sciences, and the Seismogeological Brigade of the State Seismological Bureau indicate that the mine is strongly affected by tectonic stresses. On this basis, the horizontal in situ stress provided by the mine is considered to be consistent with the regional engineering stress environment. The processed stress values were therefore adopted as the initial stress conditions applied to the numerical model.
For ease of implementation in the numerical model, the stress values were further rounded. The initial in situ stresses were therefore set to 35 MPa in the horizontal direction and 22 MPa in the vertical direction. The model with initial in situ stress was designated S35-22, whereas the stress-free reference model was designated S0.
2.4. Application of Initial Stress
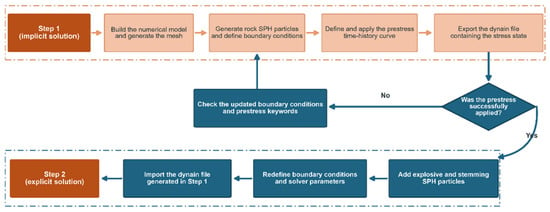
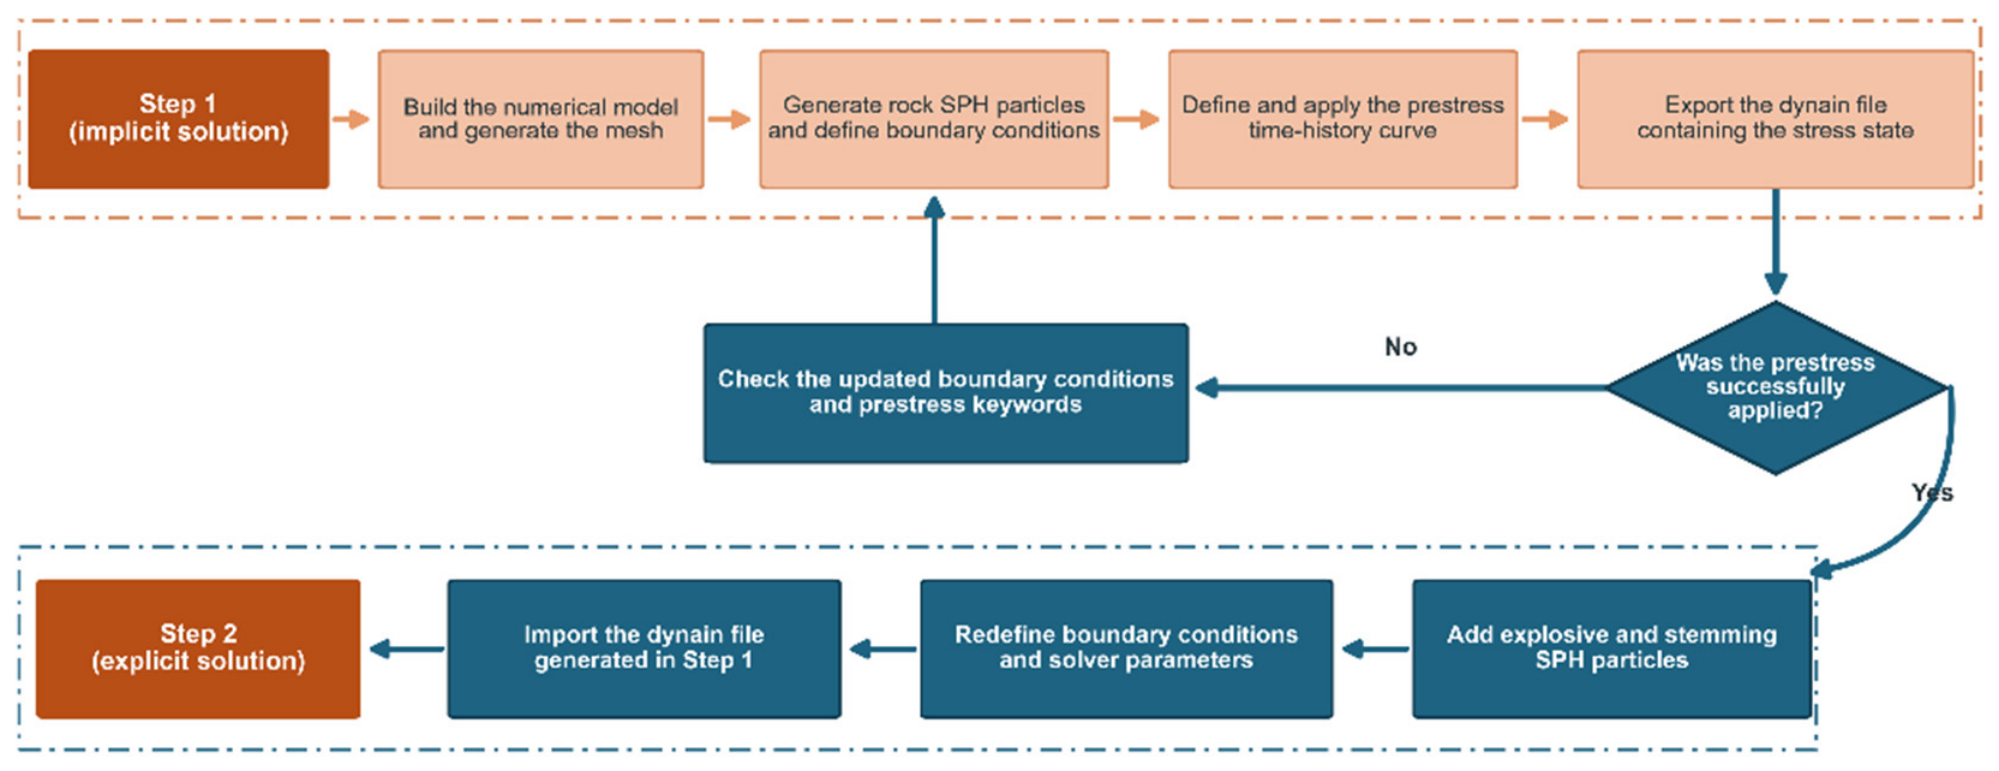
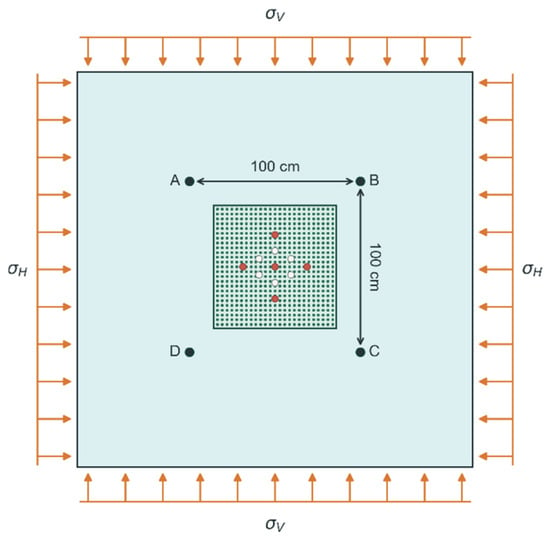
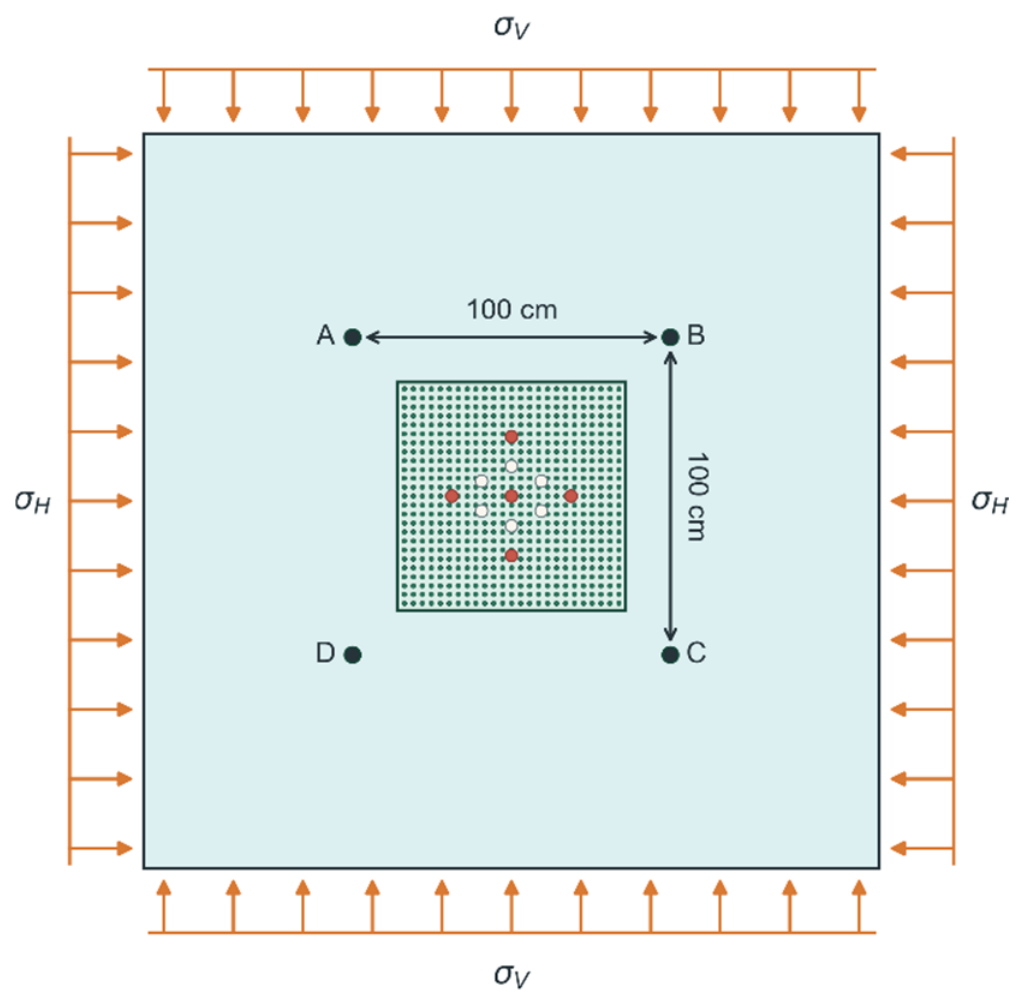
The S35-22 group generated a dynain file via a quasi-static prestressing stage, followed by a blasting stage; the S0 group followed the same two-stage path, but with a prestressing load of zero. The stress application flowchart is shown in Figure 2, and a schematic diagram of the model after stress application is shown in Figure 3.
Figure 2.
FEM-SPH Coupled Blasting Calculation Workflow for Rock Under Preset Stress Conditions.
Figure 3.
Schematic diagram of a numerical model for the application of initial stress.
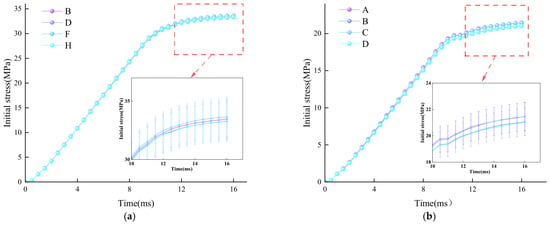
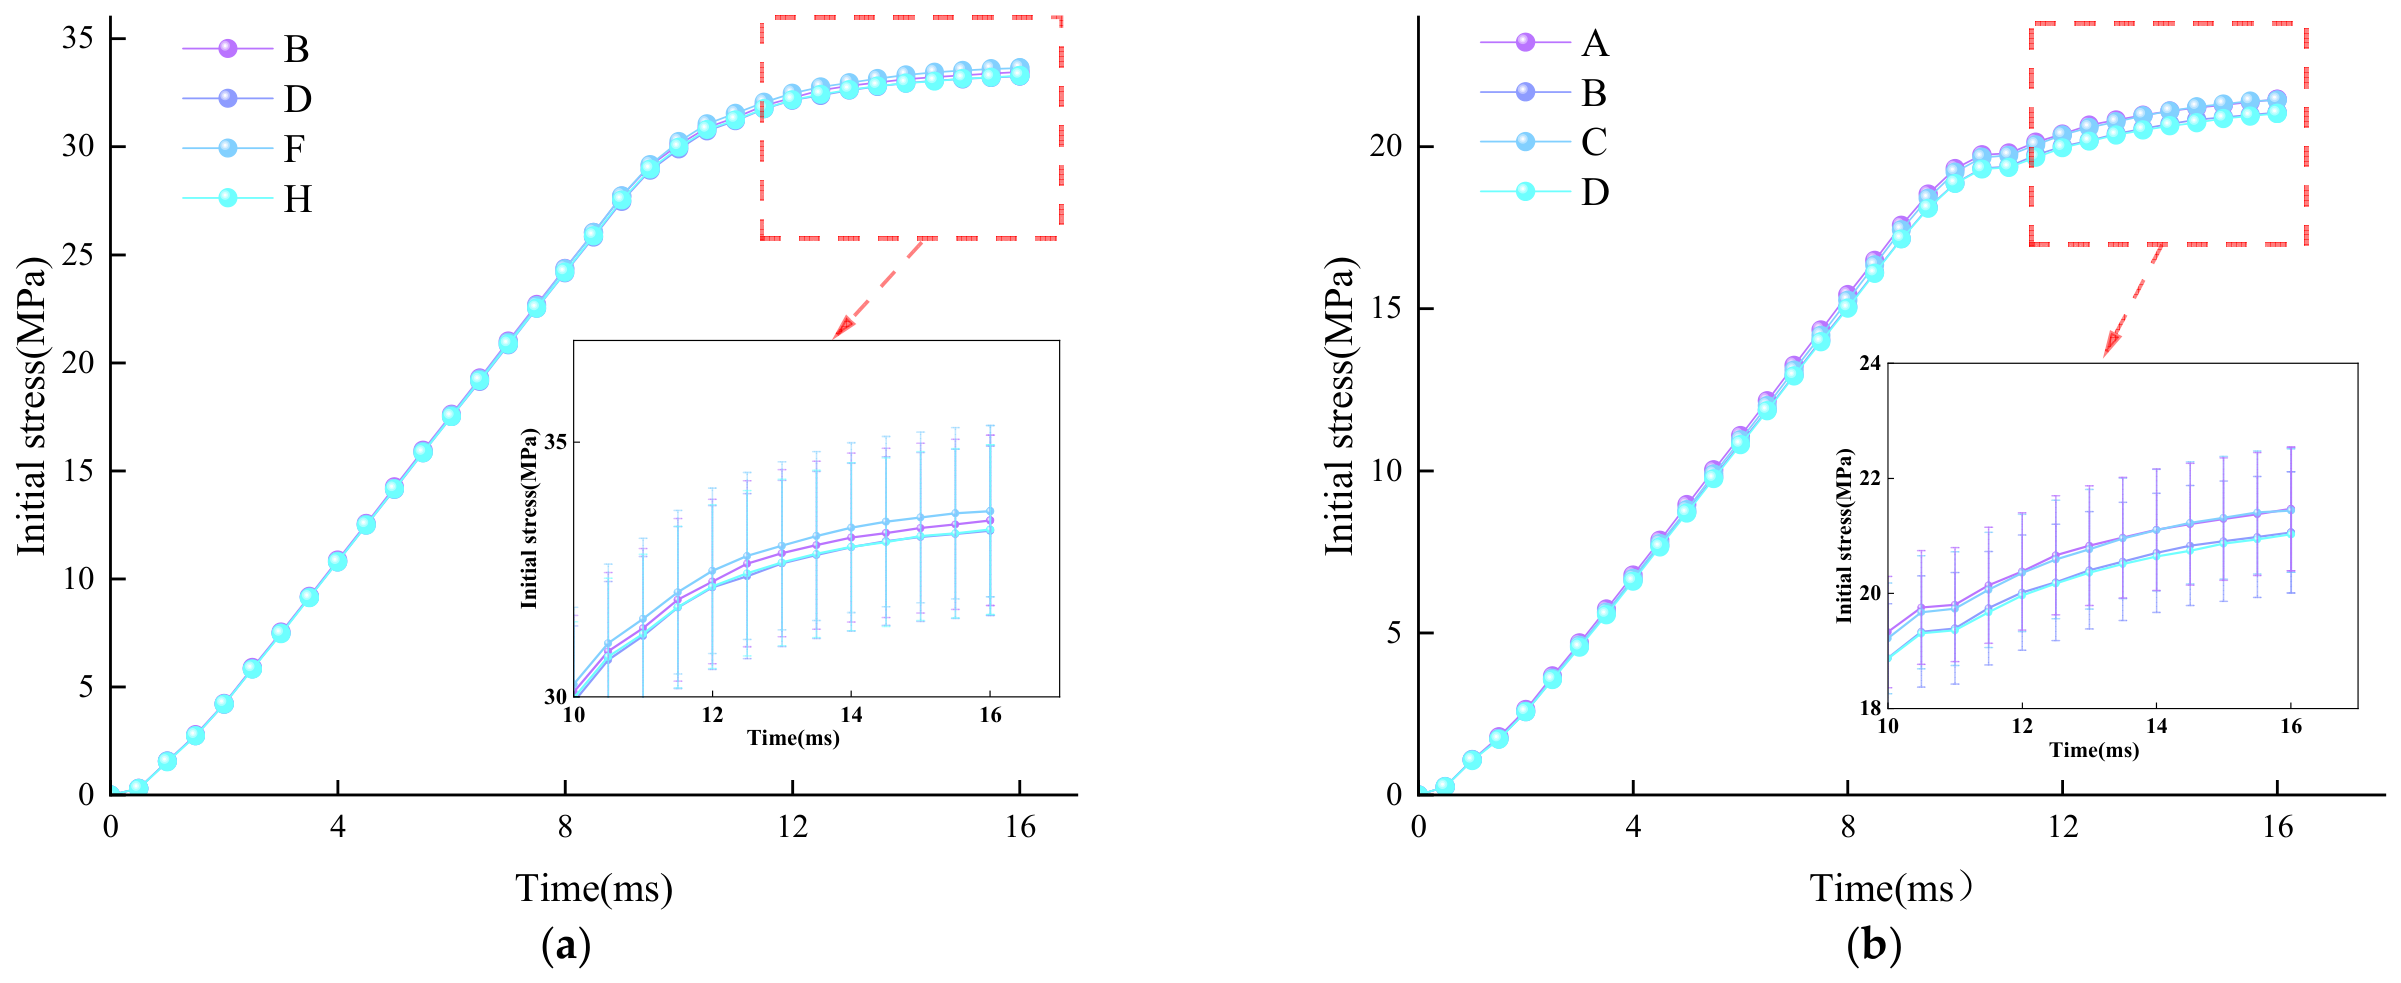
To verify the establishment of the initial stress field before blasting, four SPH monitoring points were positioned at the corners of a square centred on the central charged borehole in the mm cross-section, as shown in Figure 3. The S35-22 model was preloaded, and at 16.003 ms the compressive stresses at the four monitoring points ranged from 33.266 to 33.647 MPa in the -direction and from 21.027 to 21.470 MPa in the -direction. These values were 3.87–4.95% and 2.41–4.42% lower than the nominal applied stresses of 35 and 22 MPa, respectively. The corresponding prestress histories are shown in Figure 4.
Figure 4.
Initial stress loading histories of S35-22 model. (a) Horizontal direction. (b) Vertical direction.
This discrepancy does not indicate that the prescribed boundary loads were not successfully applied, because the pressure imposed on the boundary segments and the local stresses recorded by discrete particles near the borehole group represent physical quantities at different spatial scales. According to the Kirsch solution for a circular opening subjected to biaxial far-field stresses, the presence of an opening redistributes the surrounding stress field and produces local zones of stress concentration and stress relief. Consequently, stresses measured near the borehole group are not expected to coincide exactly with the nominal far-field stresses [41]. In addition, SPH stresses are obtained through kernel interpolation, and consistency errors may arise from kernel-support truncation near physical boundaries, irregular particle distributions and variations in the local smoothing length [42]. In the present model, the monitoring particles were located approximately 2.165 cm from the theoretical corner positions, and local stress gradients may therefore translate this discrete sampling offset into finite differences in the monitored stresses.
Between 15.498 and 16.003 ms, the changes in the - and -direction stresses at the four monitoring points did not exceed 0.24% and 0.43%, respectively, indicating only minor residual stress adjustment during this interval. Accordingly, a tolerance band of ±5% relative to the target stress was predefined in this study as an engineering criterion for evaluating the consistency between representative internal monitoring stresses and the nominal boundary stresses. This tolerance is not intended as a universal theoretical constant and should be further quantified through mesh/particle convergence analysis, monitoring-point sensitivity analysis and boundary-loading sensitivity analysis [43,44].
An audit of the S0 group revealed that the absolute values of the three normal average stresses on the external FEM were all less than 0.1 MPa. Both blasting calculations terminated normally at approximately 20 ms, yielding 202 strictly increasing states spaced at approximately 0.1 ms intervals. The termination points were 20.0005 ms and 15,637 cycles for S0, and 20.0013 ms and 15,882 cycles for S35-22.
2.5. Stress, Damage and Transport Definitions
Effective stress denotes the von Mises equivalent stress, defined as
where is the current Cauchy stress tensor, is its deviatoric component, and is the Kronecker delta. Repeated indices imply summation. The stress histories were exported directly from the Effective Stress output in LS-PrePost without subtracting the initial prestress state.
The RHT damage variable, D, is dimensionless and ranges from 0 to 1. In this study, D = 1 identifies fully damaged material on the selected section. The resulting section area is a local spatial indicator and is not equivalent to global damaged volume, permanently removed rock mass, or final muck yield.
To quantify the fully damaged area on each section, rock SPH particles were selected from fixed particle groups defined in the initial S0 configuration for the XOZ, YOZ and XOY sections. At each output time, the selected particles were mapped to their current positions. Each particle was represented by a square footprint with a side length of 2.5 cm on a raster grid with a cell size of 0.25 cm. Where particle footprints overlapped, the maximum damage value was assigned to the overlapping cells. The area with D = 1 was calculated by multiplying the number of raster cells with a damage value of exactly 1 by the area of one cell. This sectional measure represents fully damaged material in the mapped particle groups and does not directly measure the geometric cavity area.
To quantify cumulative damage across the rock SPH particle population, the cumulative initial mass of particles that had reached D = 1 by checkpoint was calculated as
where denotes the 822,400 rock SPH particles, is the initial mass of particle , and denotes a sampled checkpoint. Each particle was counted once, at the first sampled checkpoint at which its damage variable reached . The calculation includes the rock SPH population only and excludes the surrounding finite-element rock, explosive, and stemming particles.
The interval-average rate of increase in this cumulative mass was calculated between successive checkpoints as
This quantity represents the average increase over a checkpoint interval, in kg/ms; it is not an instantaneous damage rate. The rate was calculated using the actual saved-state times and unrounded cumulative masses.
The finite-window cumulative first-crossing mass, MFC(T), was calculated by summing each rock SPH particle’s initial mass at its first positive-Z crossing of the original free-surface plane (Z = 0) during (0,T]. Crossing was defined as a transition from Z ≤ 0 to Z > 0, with crossing times linearly interpolated between the consecutive saved states bracketing each event. No erosion or failure criterion was specified, so particles remained active after crossing. Each particle was counted only once, even if it subsequently recrossed the plane. Accordingly, MFC(T) quantifies cumulative first-crossing transport within the observation window; it does not denote particle deletion or establish permanent removal from the cut. The reported value at 40 ms therefore represents cumulative first-crossing mass over the 0–40 ms observation window.
3. Results
3.1. The Evolution of Damage During Cut Blasting
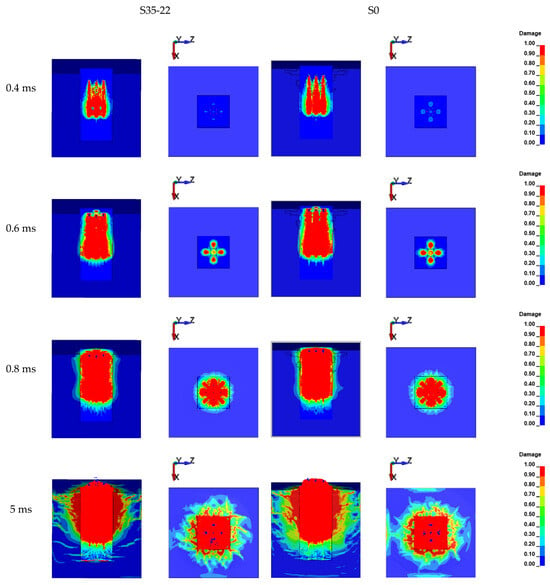
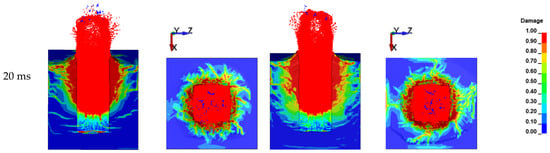
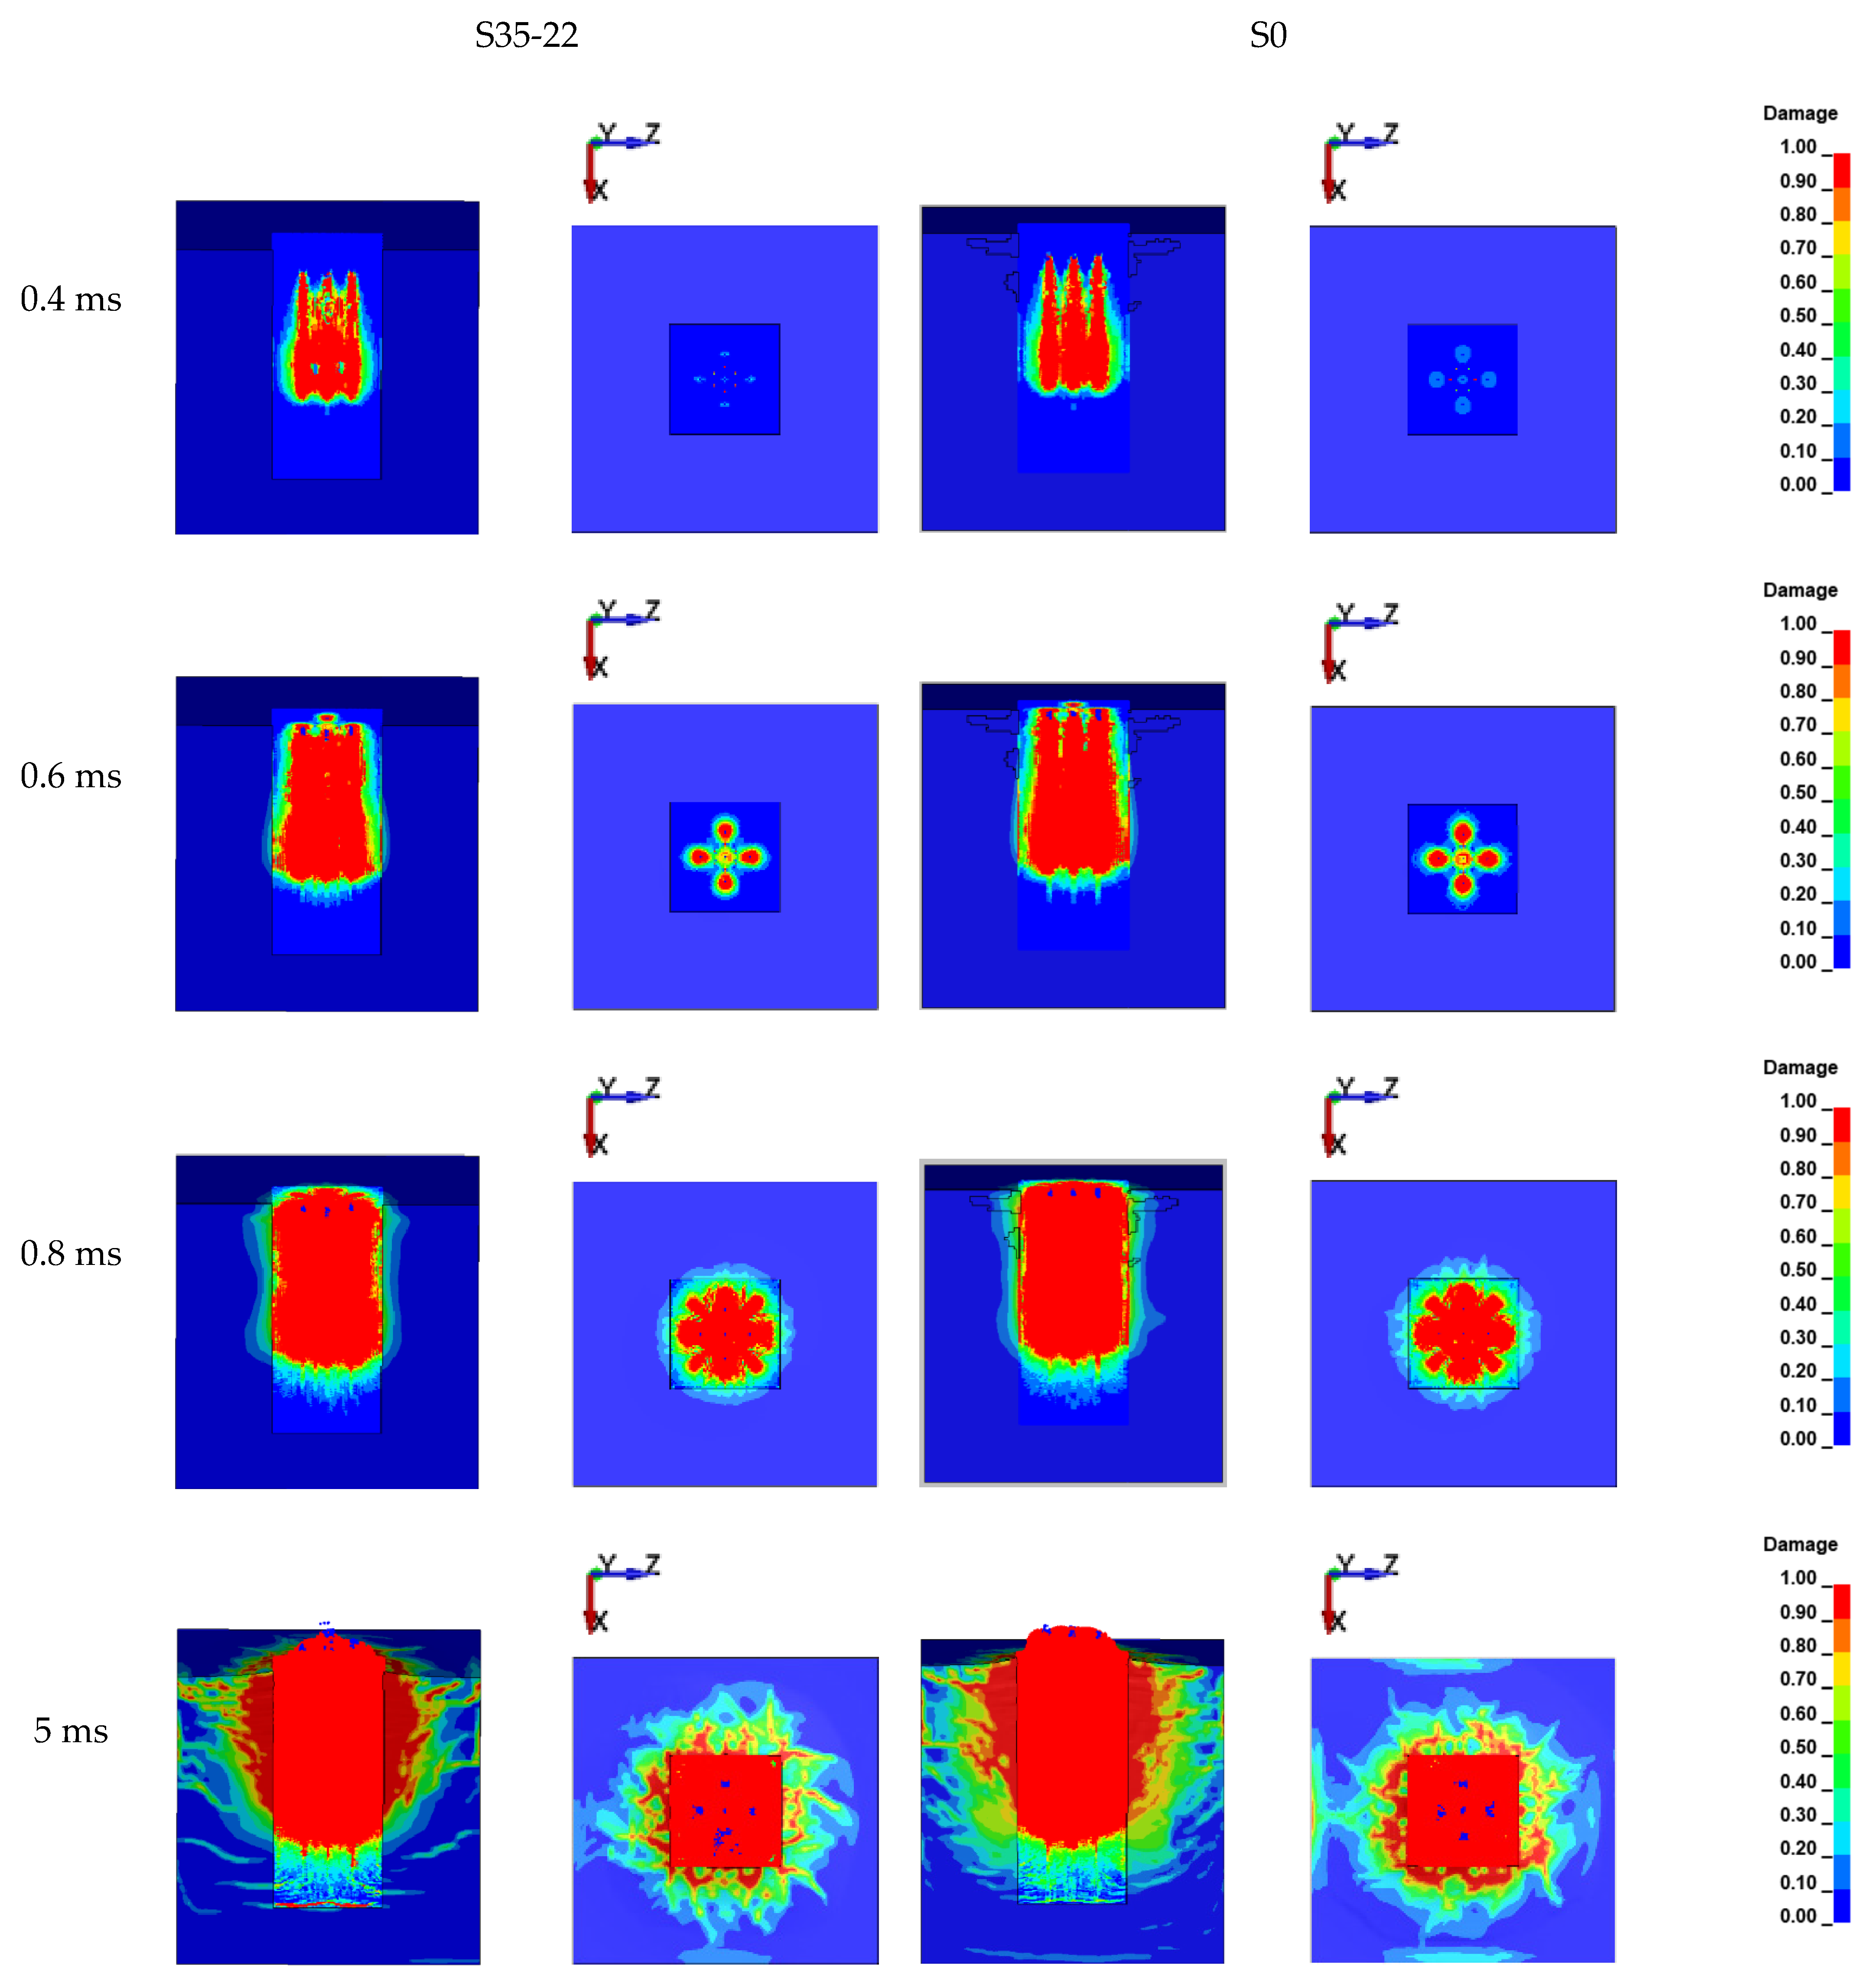
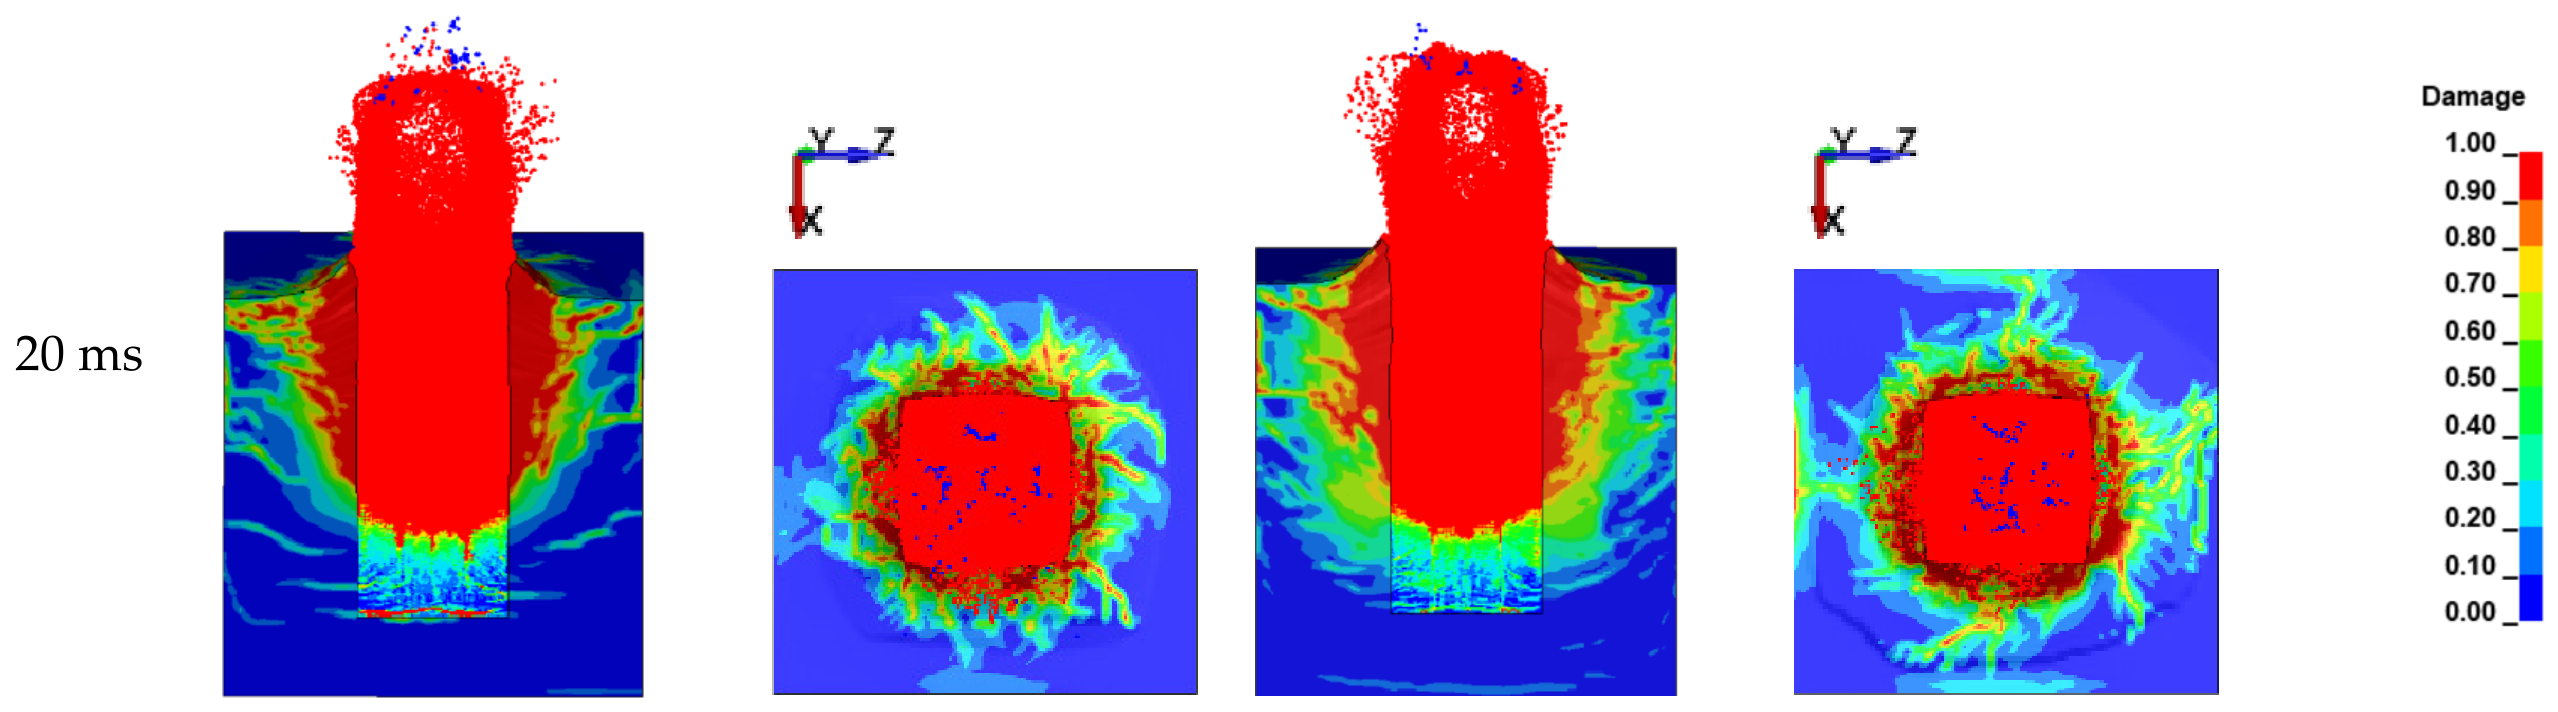
The RHT damage variable characterizes the spatial evolution of material degradation, but it does not directly represent the geometric cavity area or the mass of permanently removed rock. A larger damage variable indicates more severe damage. Figure 5 presents the evolution of cut-blasting damage in the XOZ section of the model, both without and with in situ stress preloading. The XOY horizontal plane at (Z = 150) cm was also extracted to illustrate the corresponding damage evolution around the blast holes. At (t = 0.4) ms, damage was confined to a small region around the blast holes, indicating that the explosive energy had only just been released and that damage had not yet propagated through the rock mass. At (t = 0.6) ms, damage in the XOZ section began to extend along the cut direction, while damage in the XOY section began to develop into a cross-shaped pattern corresponding to the blast-hole arrangement. The zones of high damage progressively expanded towards the empty holes, indicating preferential damage propagation in this direction under stress-wave loading. At (t = 0.8) ms, damage in the XOZ section was further intensified, and a continuous connection had formed between the empty holes and the cut holes. By 5 ms, the principal damage morphology visible in the selected sections had formed and covered the rock mass between multiple blast holes. The cumulative mass of rock SPH particles first observed at , however, continued to increase after this time. Meanwhile, rock particles in the central part of the cut near the free surface began to be ejected. By 20 ms, the damage pattern in the selected sections changed comparatively little in the displayed views; however, the cumulative mass continued to increase through the 40 ms checkpoint.
Figure 5.
Damage evolution process of the S35-22/S0 cut blasting numerical simulation model at 0.4, 0.6, 0.8, 5 and 20 ms. The left-hand column in the figure indicates the time at which damage to the model was observed; the top section shows the grouping; the axes in the figure indicate the direction in which the model interface was sectioned. The color scale on the right represents the damage variable D, which is dimensionless.
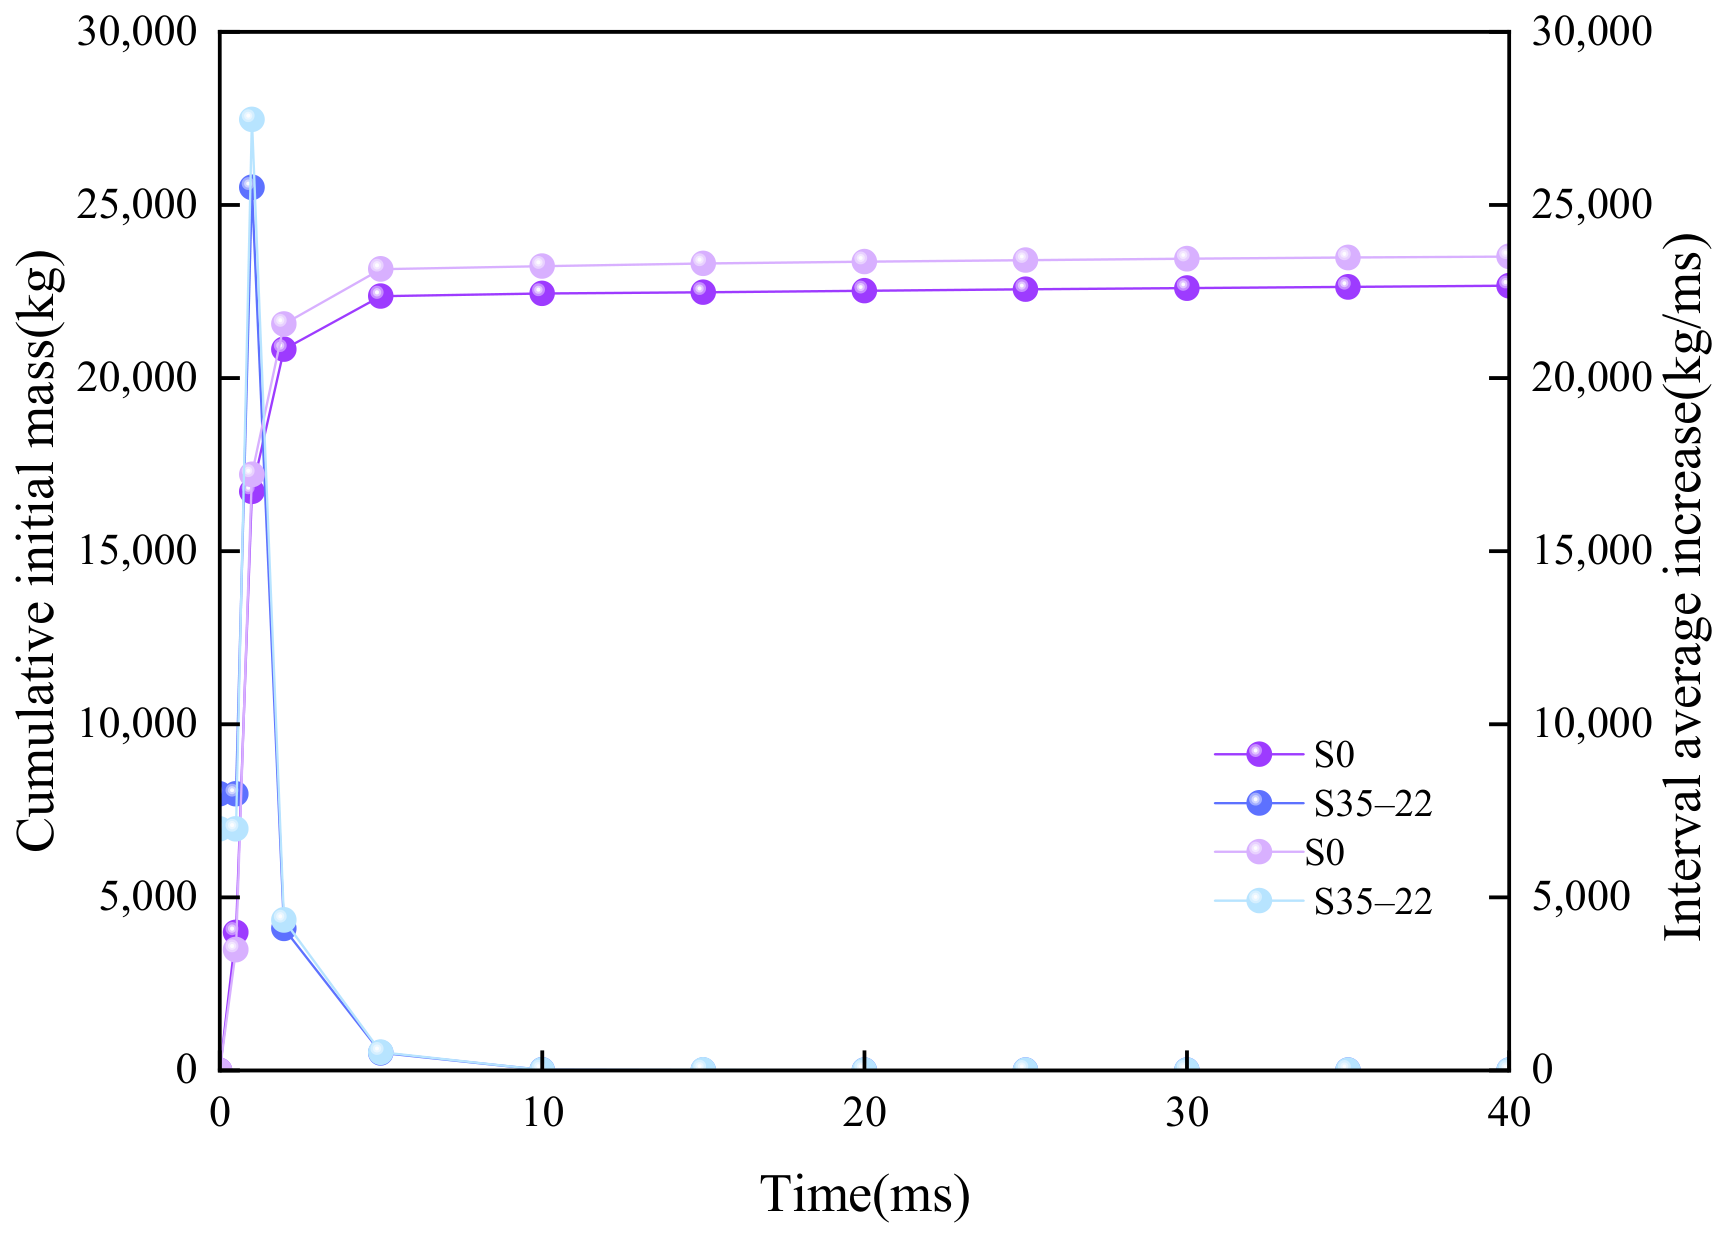
As shown in Table 4, the cumulative mass of rock SPH particles first observed at increased from 22,519.74 kg at 20 ms to 22,667.01 kg at 40 ms under S35–22, and from 23,357.64 kg to 23,517.90 kg under S0. Thus, the cumulative mass was 3.72% higher under S0 at 20 ms and 3.75% higher at 40 ms.
Table 4.
Cumulative mass of rock SPH particles first observed at D = 1.
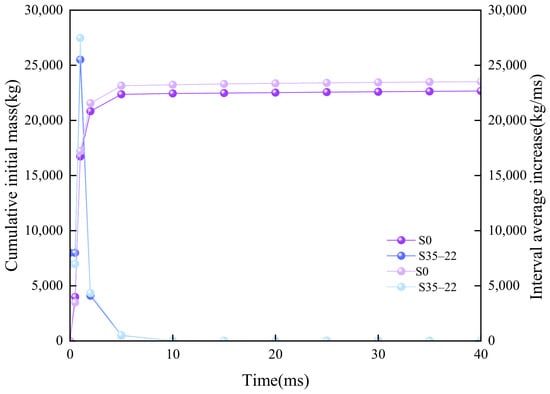
The interval average increase was greatest during the early response. As shown in Figure 6, the highest sampled interval-average rate occurred from 0.5 to 1 ms, reaching 25,510.13 kg/ms under S35–22 and 27,468.72 kg/ms under S0. The rate was much lower from 5 to 10 ms, at 15.47 and 17.01 kg/ms, respectively. Across 10–40 ms, the average rates were 7.38 kg/ms under S35–22 and 9.34 kg/ms under S0. The rates remained positive during this later interval, indicating continued but slower accumulation within the sampled checkpoints.
Figure 6.
Cumulative variation and interval-average increase in the mass of rock SPH particles reaching . The left axis represents the cumulative initial mass of rock SPH particles first observed to reach at each sampled checkpoint, while the right axis represents the interval-average increase in this cumulative mass between successive checkpoints. The curves are plotted at the actual saved-state times, whereas the x-axis tick labels indicate the nominal checkpoint times.
3.2. Spatial and Temporal Variation in Effective Stress
Figure 5 shows different early-stage damage patterns under S0 and S35-22. To quantify the corresponding stress response, effective stress histories were examined at fixed monitoring points. The reported peaks and temporal fluctuations describe the current stress state under each initial stress condition, without subtraction of the initial prestress.
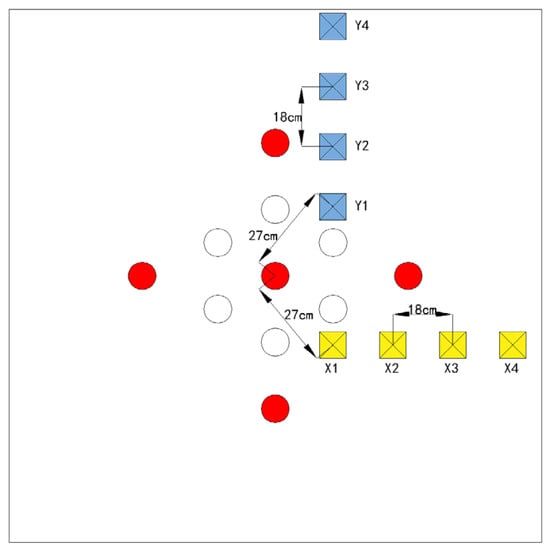
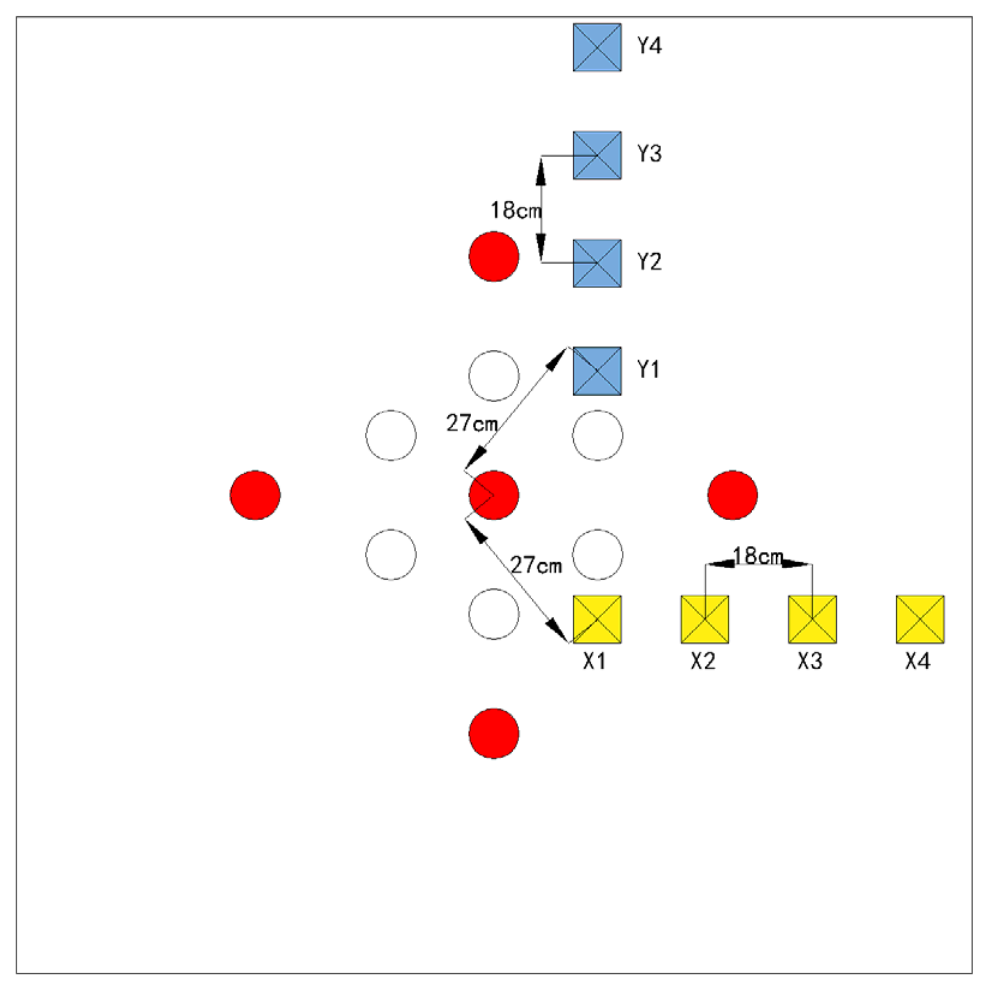
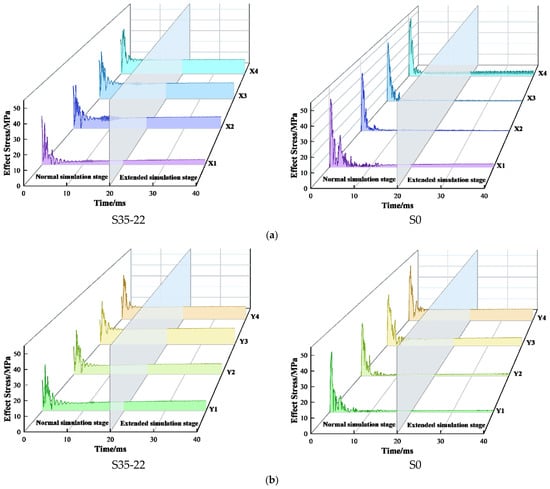
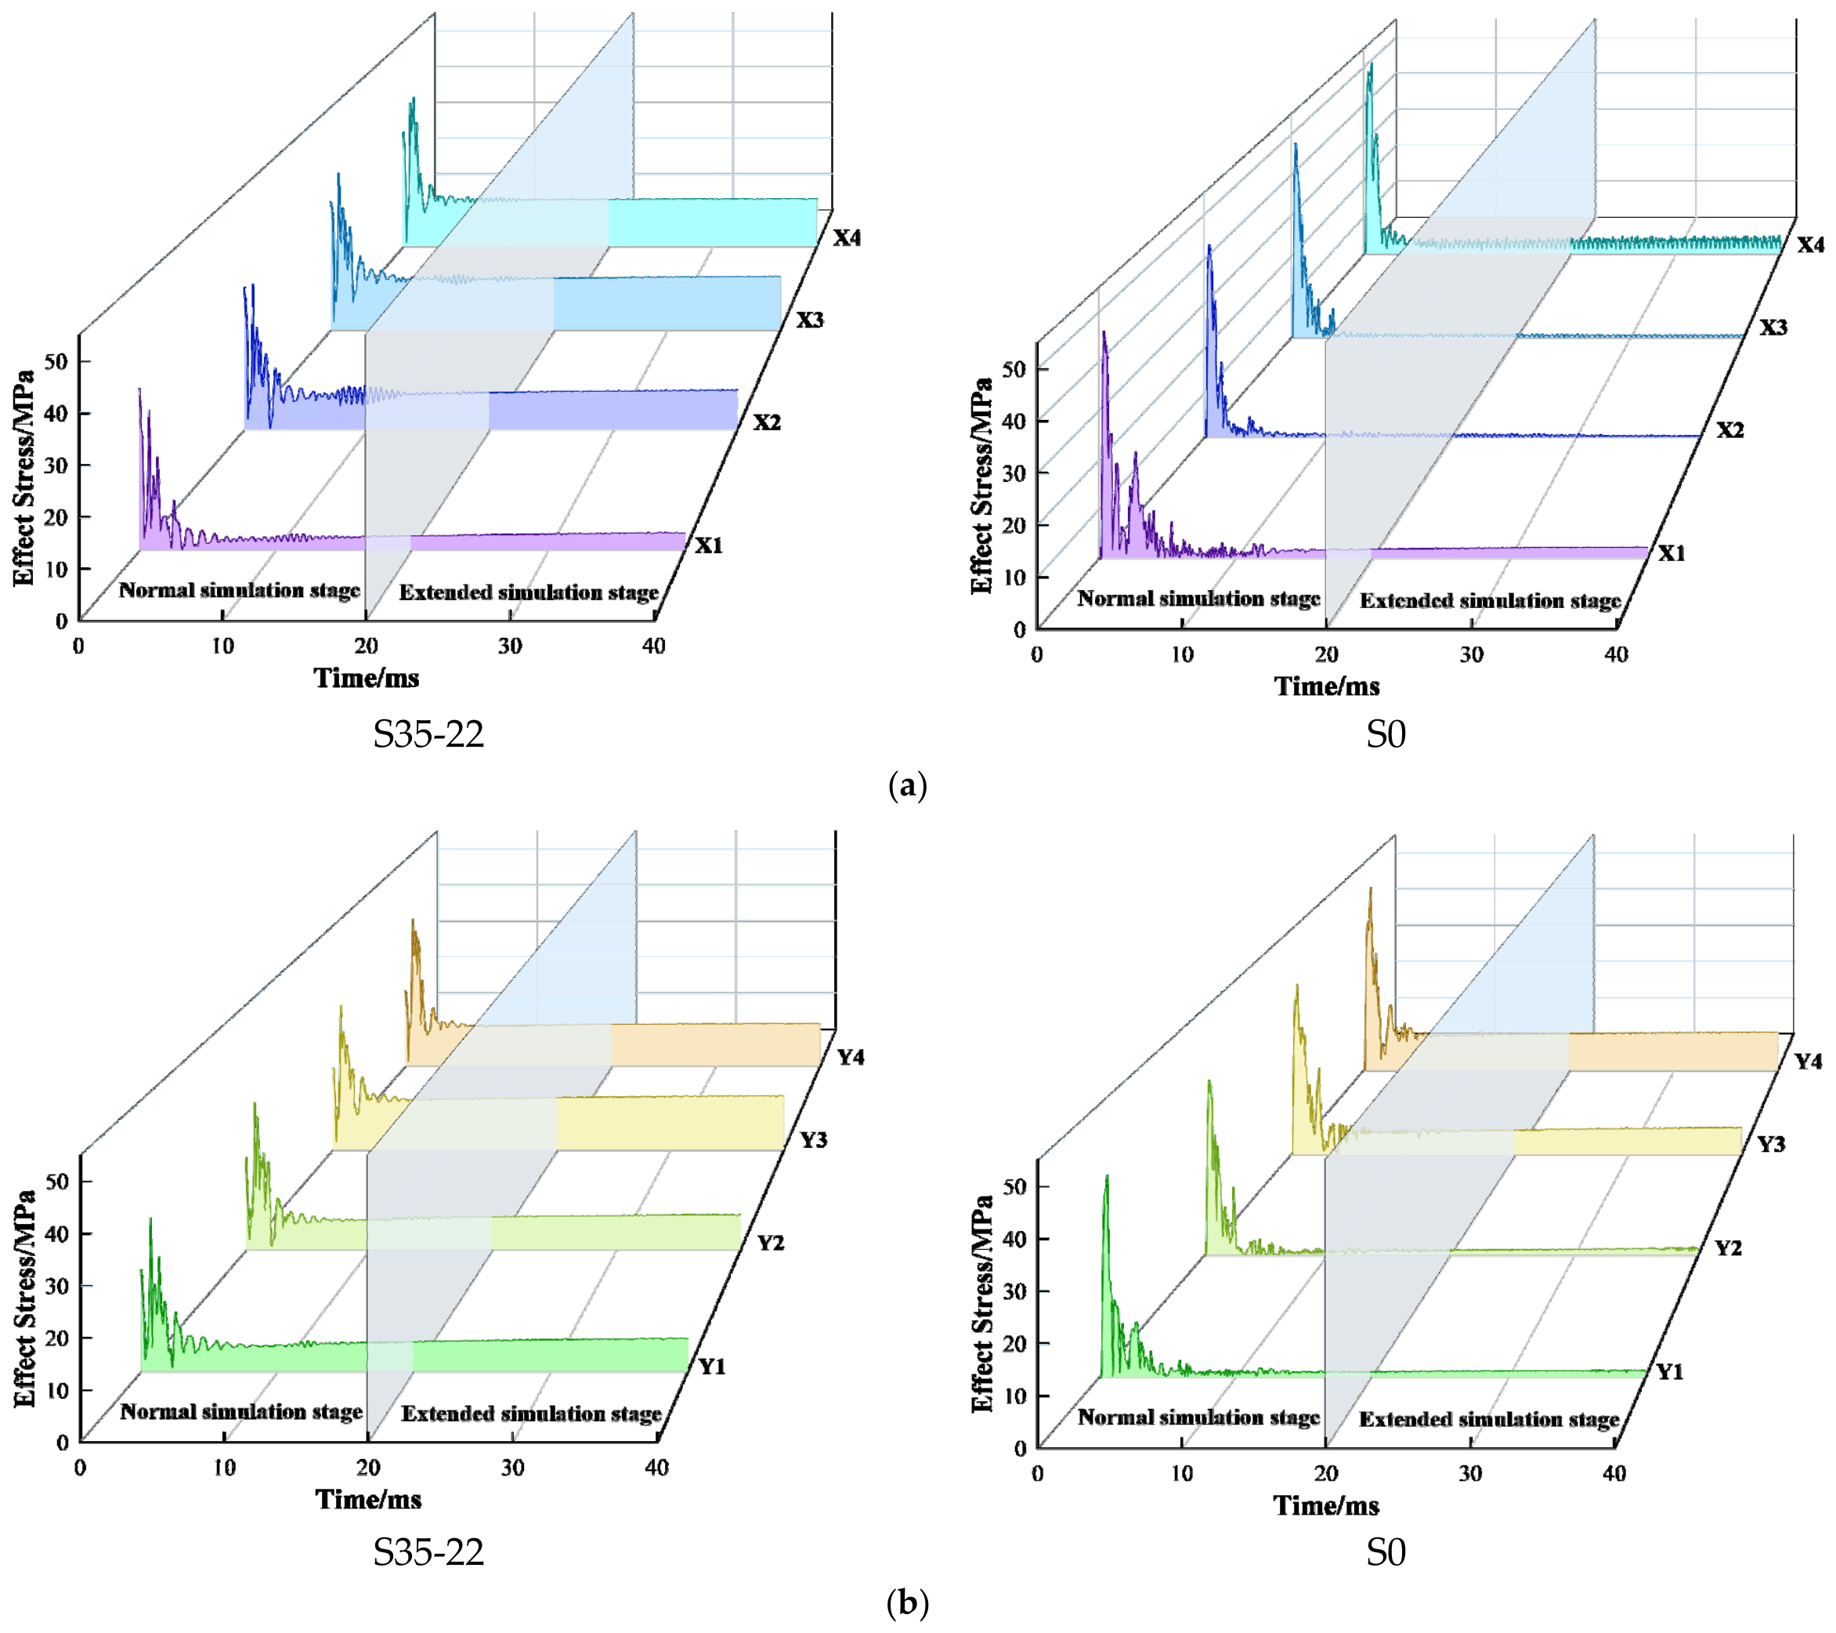
Effective stress histories were examined at eight fixed monitoring points in the horizontal and vertical directions on the XOY section (Figure 7). The histories were saved at intervals of approximately 0.1 ms, and the reported peak values represent the maxima among the saved states. The most pronounced changes in the stress histories occurred during the first 10 ms. Because temporal standard deviation describes variation within a single simulated history and depends on the temporal sampling interval, it was not used as a measure of uncertainty or as a basis for comparing the two conditions. As shown in Figure 8, across all eight monitoring points, the sampled peak equivalent stress was lower under S35–22 than under S0, with reductions of 13.2–27.2% along X and 13.7–29.9% along Y. Under S35–22, the Y-direction peaks decreased from 45.93 MPa at Y1 to 27.57 MPa at Y4, whereas the X-direction peaks varied non-monotonically from 44.91 to 34.96, 37.57 and 39.90 MPa from X1 to X4.
Figure 7.
Schematic diagram showing the layout of measurement points around the trenching area.
Figure 8.
S35-22/S0 Time-history Curves of Effective Stress in the Horizontal and Vertical Directions. (a) Horizontal direction. (b) Vertical direction.
3.3. Finite Window First Crossing Mass Response
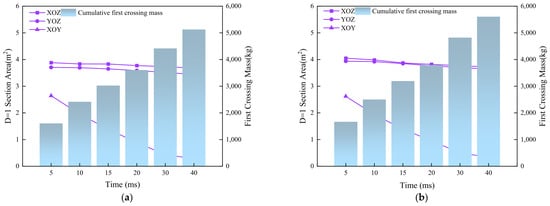
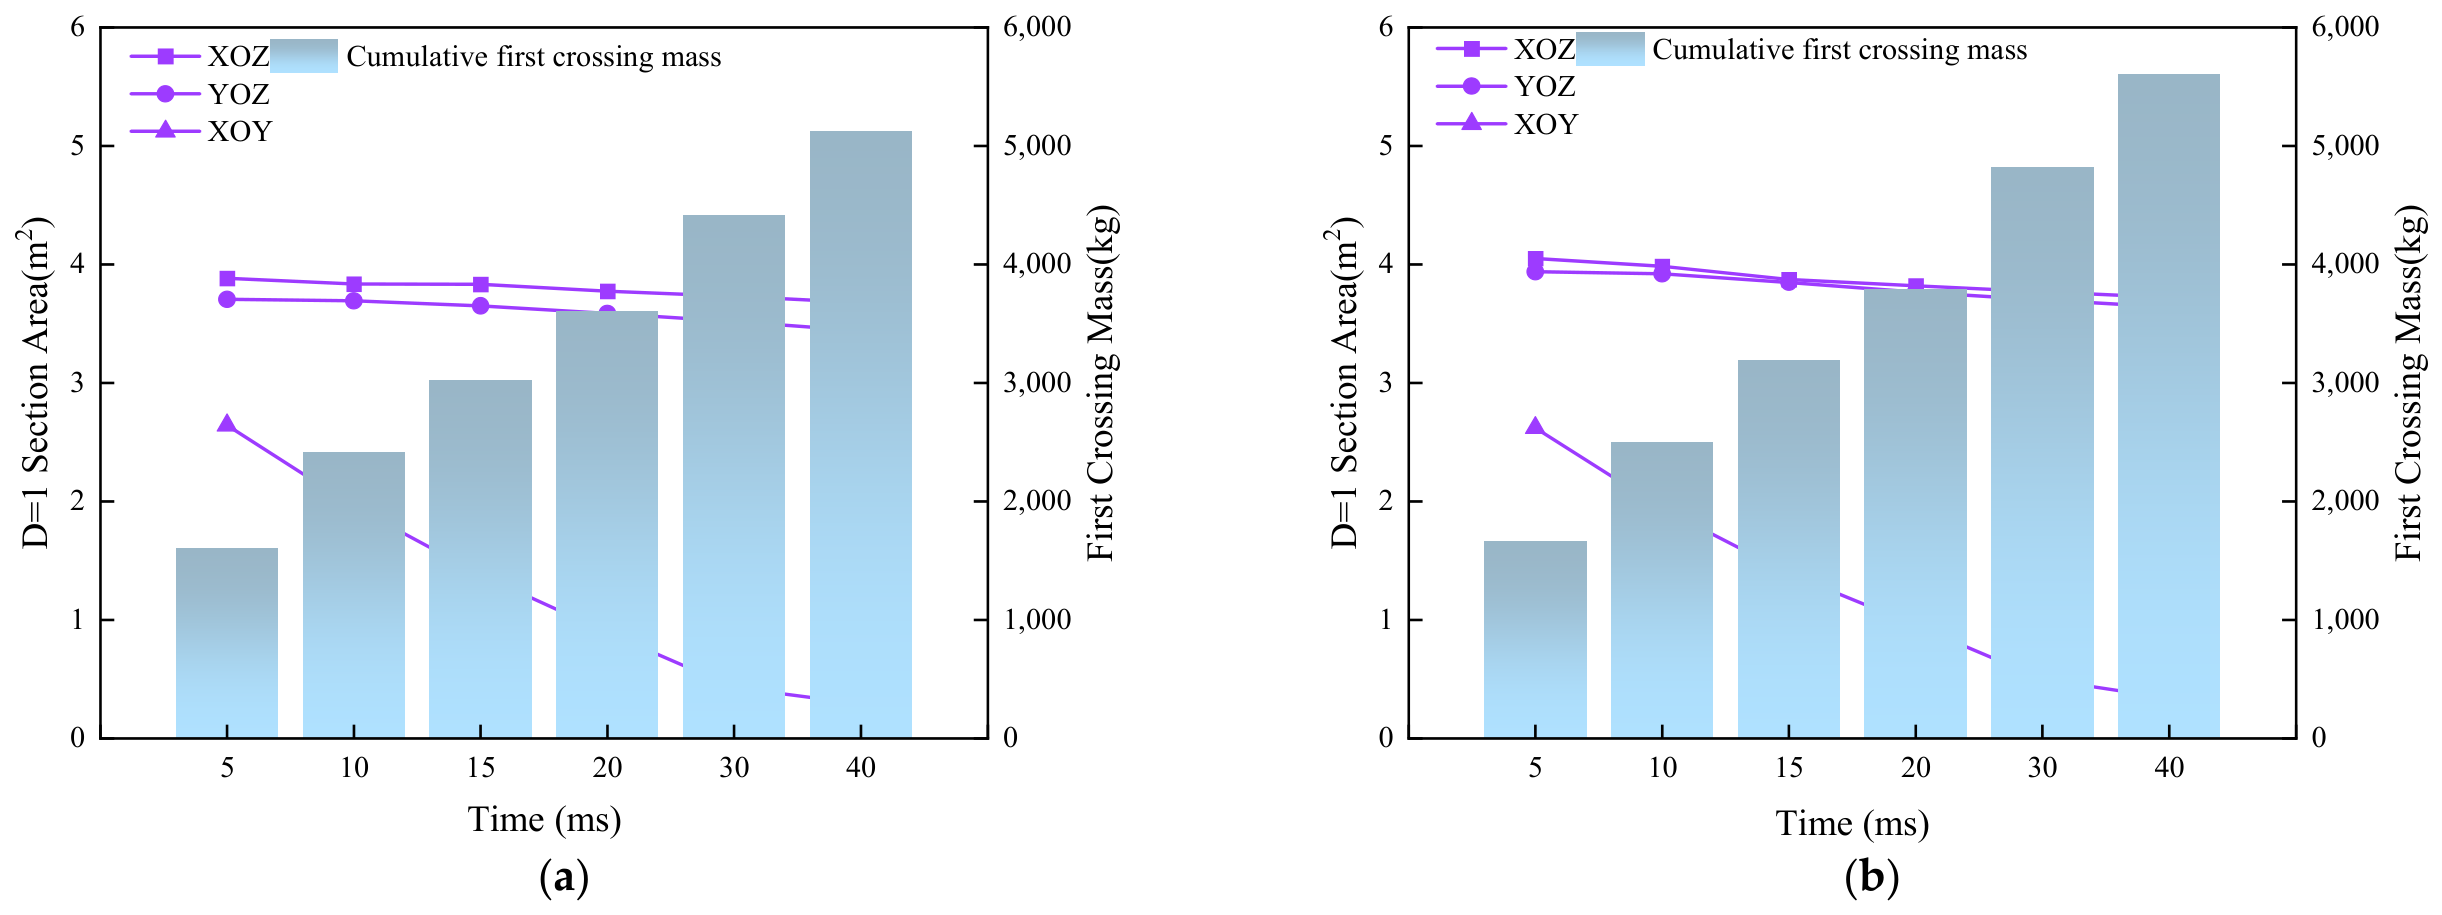
To assess sensitivity to the observation-window endpoint, the cumulative first-crossing mass was compared at 20, 30 and 40 ms (Table 5). For S0 and S35–22, respectively, the values were 3791.11 and 3604.26 kg at 20 ms, 4819.85 and 4412.19 kg at 30 ms, and 5604.16 and 5125.09 kg at 40 ms. The cumulative first-crossing mass remained lower under S35–22 at all three endpoints, with relative reductions of 4.93%, 8.46% and 8.55%. Thus, extending the observation window preserved the ordering of the two conditions, although the magnitude of the difference depended on the endpoint. During 30–40 ms, an additional 784.31 kg crossed under S0 and 712.90 kg under S35–22, indicating that outward first-crossing transport remained active. The 40 ms values therefore represent cumulative transport within the extended observation window rather than terminal transported masses.
Table 5.
Finite window cumulative first crossing mass under the S35–22 and S0 conditions.
The (D = 1) section area in the deformed configuration exhibited a direction-dependent evolution (Table 6 and Figure 9). From 5 to 20 ms, the XOZ area decreased from 3.88 to 3.77 m2 under S35–22 and from 4.05 to 3.82 m2 under S0, while the corresponding YOZ area decreased from 3.70 to 3.59 m2 and from 3.94 to 3.77 m2. Across the four checkpoints, the S35–22 values were 1.03–4.20% lower on the XOZ section and 4.77–6.09% lower on the YOZ section. The XOY areas remained similar through 15 ms, with differences within 1.03%, but reached 0.89 m2 under S35–22 and 0.96 m2 under S0 at 20 ms. Over the complete 5–20 ms interval, the XOY area decreased by 66.29% under S35–22 and by 63.36% under S0. This decline represents the decreasing area occupied by fully damaged material within the fixed XOY view as particles moved outward.
Table 6.
Time-resolved (D = 1) section areas under the S35–22 and S0 conditions.
Figure 9.
Time-resolved evolution of (D = 1) section areas and finite-window cumulative first-crossing mass under (a) S35–22 and (b) S0. Lines denote the (D = 1) areas on the XOZ, YOZ and XOY sections in the deformed configuration (left axis); bars denote the cumulative mass of rock SPH particles that crossed the initial free-surface plane for the first time within (0, T] (right axis).
4. Discussion
The combined evidence from Figure 5, Figure 6, Figure 7, Figure 8 and Figure 9 and Table 3, Table 4, Table 5 and Table 6 shows that the prescribed S35–22 initial-stress state produced a different response from the zero-preload S0 baseline in the paired simulations. The comparison includes reported effective-stress histories, D = 1 section areas on selected planes, and finite-window cumulative first-crossing mass. At 20 ms, the cumulative first-crossing mass was 3791.11 kg under S0 and 3604.26 kg under S35–22, giving a difference of 186.85 kg. The XOZ and YOZ D = 1 section areas were also larger under S0, whereas the XOY response varied with time. These results characterize the combined response of the selected biaxial state within the prescribed model and observation window. They do not isolate the separate effects of stress magnitude, stress ratio, or principal-stress orientation.
The effective-stress histories describe the von Mises equivalent stress calculated from the current stress tensor without subtracting the initial prestress state. Differences between S35–22 and S0 therefore reflect the stress response under the two initial conditions and do not separately quantify attenuation of the blast-induced stress increment. The paired design therefore supports comparison between S35–22 and S0, but does not independently identify the effects of stress magnitude, stress ratio, or principal-stress orientation. Along the Y direction, the peak effective stress decreased progressively from 45.93 MPa at Y1 to 27.57 MPa at Y4, whereas the X-direction peaks varied non-monotonically from 44.91 to 34.96, 37.57, and 39.90 MPa. Distance from the charge therefore cannot explain the spatial response by itself. This interpretation also accommodates different observations in the literature. High initial stress has sometimes been found to guide or accelerate selected microcracks and high-energy acoustic-emission activity [21], while recent tunnel-scale experiments show reduced dynamic response and lower crack-network complexity with increasing confinement [45,46,47]. These trends indicate that confinement may suppress tensile opening while redirecting or concentrating other failure modes; the measured outcome consequently depends on loading path, stress magnitude, geometry, and whether damage, crack activity, or fragmentation is evaluated.
Figure 9 also demonstrates why damage and material removal should be interpreted as related but distinct responses. Under S0, the larger XOZ and YOZ D = 1 section areas occurred together with the higher cumulative first-crossing mass observed in the paired comparison. This correspondence is descriptive rather than one-to-one. The D = 1 criterion identifies material that has reached the fully damaged state of the RHT formulation. The resulting section area is a local spatial indicator and is not a direct measurement of geometric cavity area, detached fragment volume, or mass permanently removed from the cut. This distinction is particularly important for the XOY section. Its D = 1 area decreased by 66.29% under S0 and 63.36% under S35–22 between 5 and 20 ms, although cumulative first-crossing mass continued to increase. The decrease therefore does not represent damage recovery. It mainly reflects the movement of fully damaged SPH material away from the fixed section in the deformed configuration. Laboratory observations likewise distinguish the timing of strain development, fracture formation, and gas ejection during blasting [48]. Research on mechanically cutting pre-damaged rock shows that damage state can modify fragmentation mode and energy demand [11], but it does not establish a direct conversion from damage to blast ejection. In the present simulations, the 15–20 ms interval contributed 605.24 kg under S0 and 589.05 kg under S35–22, corresponding to 15.96% and 16.34% of their respective 20 ms cumulative values. First crossing transport therefore remained active at the end of the observation window.
These findings support including prescribed initial-stress states when comparing damage and particle transport in the present cut-blasting model. Relative to S35–22, the zero-preload S0 case produced larger XOZ and YOZ D = 1 section areas and a higher finite-window cumulative first-crossing mass. The comparison should therefore combine four complementary measures: effective-stress histories, threshold-defined sectional damage areas, cumulative D = 1 particle mass and its interval-average increase, and finite-window first-crossing mass. The cumulative D = 1 mass across the rock SPH domain was also higher under S0 at both the 20 and 40 ms checkpoints. Evaluating any one indicator in isolation could give an incomplete description of cut performance. The directional response also indicates that delay timing, empty-hole arrangement, burden, and available compensation volume should be examined relative to the principal-stress orientation rather than transferred directly from an S0 design. Previous studies have connected stress-dependent damage, compensation-space geometry, and hole layout to cut-blasting performance [3,8,11,48,49,50,51], while SPH modelling has been used to examine directed blast action and charge-layout concepts in deep mining [45]. Nevertheless, the present comparison identifies design sensitivities rather than a unique optimum. The observed mass difference and section area differences should be interpreted as paired model comparisons, not as universal correction factors for other depths, rock types or cut geometries.
Several limits define the range of this interpretation and suggest the next steps. First, the paired comparison contains one combined biaxial stress state and one stress-free state. It cannot independently resolve the effects of stress magnitude, lateral stress ratio, or principal-stress orientation. A factorial simulation programme should vary these components separately while holding the charge and geometry constant. Second, the D = 1 section area depends on the selected damage threshold, section position, numerical resolution, and deformed configuration. Threshold-sensitivity tests, multiple parallel sections, and a three-dimensional fully damaged volume would establish whether the reported sectional trends are robust. Third, cumulative first-crossing mass depends on the observation-window endpoint. Extending the comparison from 20 to 40 ms preserved the lower cumulative first-crossing mass under S35–22, while the relative difference increased from 4.93% to 8.55%. The additional transport during 30–40 ms indicates that neither history had reached a terminal plateau. The comparison therefore supports a consistent ordering of the two conditions over the investigated windows, while the quantitative difference remains time-dependent. First crossing also does not distinguish permanent removal from subsequent recrossing of the reference plane. The 15–20 ms increments show that the cumulative transport response had not reached a terminal value within the reported observation window. Finally, the quantitative results remain conditional on the material parameterization used in the present simulations, the SPH–FEM resolution, the boundary treatment, and the investigated hole pattern. Mesh and particle-resolution checks should be combined with laboratory tests or field observations. High-speed imaging and three-dimensional scanning would be particularly useful for comparing crack development, cavity geometry, fragment motion, and retained material. These extensions would convert the present paired-case evidence into a more general stress-aware framework for evaluating damage, compensation-space formation, and rock removal in deep cut blasting.
5. Conclusions
- (1)
- The paired SPH–FEM simulations show differences in the transient equivalent-stress response between the prescribed S35–22 biaxial initial-stress condition and S0. The main changes in the stress histories occurred during the first 10 ms. The sampled peak equivalent stresses were lower under S35–22 at all eight monitoring points, with reductions of 13.2–27.2% along X and 13.7–29.9% along Y. Under S35–22, the peaks decreased progressively along the Y-direction monitoring sequence, whereas the X-direction sequence showed a non-monotonic variation. These contrasting trends describe a direction-dependent spatial response in the paired S35–22 and S0 simulations.
- (2)
- Under S35–22, the D = 1 section areas on the XOZ and YOZ planes were consistently smaller than those under S0, whereas the XOY difference remained stage-dependent. The cumulative first-crossing mass was lower under S35–22 at the 20, 30 and 40 ms endpoints, with relative reductions of 4.93%, 8.46% and 8.55%, respectively. The ordering remained consistent as the observation window was extended. The lower sectional damage areas and lower outward first-crossing mass under S35–22, together with the higher cumulative D = 1 mass under S0, show that the indicators describe distinct aspects of the paired response; they do not establish a single overall damage ranking. The D = 1 section area quantifies fully damaged material in the deformed configuration and does not directly measure geometric cavity area.
- (3)
- For the present rock, charge configuration, and hole pattern, the S0 calculation produced higher estimates of fully damaged material extent and finite-window outward particle transport. A combined assessment using directional effective-stress histories, threshold-defined damage measures, and particle-transport metrics provides a more faithful basis for comparing candidate designs under the prescribed S35–22 initial-stress condition. During 30–40 ms, cumulative first-crossing mass increased by 784.31 kg under S0 and 712.90 kg under S35–22. The reported transport values therefore describe finite observation windows extending to 40 ms and do not establish terminal transported masses. These conclusions apply to the paired S35–22 and S0 simulations; broader design rules require separate variation in stress magnitude, stress ratio and principal-stress orientation.
Author Contributions
P.Z.: Formal analysis and writing—original draft. Q.H.: Experimental management and safety management. X.L.: Project administration, text review and calibration. M.D.: Numerical simulation. All authors have read and agreed to the published version of the manuscript.
Funding
This work was supported by the National Natural Science Foundation of China (Grant No. 52674160).
Institutional Review Board Statement
Not applicable.
Informed Consent Statement
Not applicable.
Data Availability Statement
The data used to support the findings of this study are included with in the article.
Conflicts of Interest
The authors declare no competing interests.
References
- Wagner, H. Deep Mining: A Rock Engineering Challenge. Rock Mech. Rock Eng. 2019, 52, 1417–1446. [Google Scholar] [CrossRef] [Scilit]
- Saadatmand Hashemi, A.; Katsabanis, P. Tunnel face preconditioning using destress blasting in deep underground excavations. Tunn. Undergr. Space Technol. 2021, 117, 104126. [Google Scholar] [CrossRef] [Scilit]
- Xie, L.; Lu, W.; Zhang, Q.; Jiang, Q.; Chen, M.; Zhao, J. Analysis of damage mechanisms and optimization of cut blasting design under high in-situ stresses. Tunn. Undergr. Space Technol. 2017, 66, 19–33. [Google Scholar] [CrossRef] [Scilit]
- Li, Q.; Li, H.; He, L.; Li, X. Effect of empty-hole on the rock blasting under in-situ stress. Comput. Geotech. 2025, 185, 107290. [Google Scholar] [CrossRef] [Scilit]
- Zhang, Y.; Wu, D.; Hao, Z.; Zhang, F.; Zhao, P. Simulation and experiment study on rock damage evolution mechanism of cut blasting: Coupled effect of three-dimensional in-situ stress and compensation space coefficient. Tunn. Undergr. Space Technol. 2026, 168, 107232. [Google Scholar] [CrossRef] [Scilit]
- Zhou, Z.; Wang, P.; Cheng, R.; Cai, X.; Chen, C. Blast-induced damage and fracture of rock mass in cutting blasting with a large empty hole under high in-situ stress. Tunn. Undergr. Space Technol. 2025, 166, 106942. [Google Scholar] [CrossRef] [Scilit]
- Cao, X.; Liang, R.; Zhou, W.; Lou, X.; Hu, C.; Qi, F.; Chen, X. SPH–FEM Numerical Simulation of Empty-Hole Cut Blasting in Rock Masses. Geotech. Geol. Eng. 2025, 43, 388. [Google Scholar] [CrossRef] [Scilit]
- Zhao, J.; Li, D.; Ranjith, P.G.; Lü, X.; Li, Y.; Su, X. Optimization of cut-hole layout under high in situ stress based on numerical simulation and field tests. Deep Undergr. Sci. Eng. 2026, 5, 367–385. [Google Scholar] [CrossRef] [Scilit]
- Li, X.; Liu, K.; Sha, Y.; Yang, J.; Hong, Z. Experimental and numerical investigation on rock fracturing in tunnel contour blasting under initial stress. Int. J. Impact Eng. 2024, 185, 104844. [Google Scholar] [CrossRef] [Scilit]
- Li, X.; Liu, K.; Zhao, X.; Sha, Y.; Yang, J.; Ma, S.; Hong, Z. Study on rock fracturing in smooth blasting under initial stress. Eng. Fract. Mech. 2024, 296, 109865. [Google Scholar] [CrossRef] [Scilit]
- Tian, X.; Tao, T.; Liu, X.; Jia, J.; Xie, C.; Lou, Q.; Chen, Q.; Zhao, Z. Calculation of hole spacing and surrounding rock damage analysis under the action of in situ stress and joints. Sci. Rep. 2022, 12, 22331. [Google Scholar] [CrossRef] [Scilit] [PubMed]
- Meng, N.; Bai, J.b.; Shen, W.; Chen, Y.; Wang, X.; Wu, W.; Wu, B. Study on the Influences of Empty Hole and In Situ Stress on Blasting-Induced Rock Damage. Geofluids 2021, 2021, 6643042. [Google Scholar] [CrossRef] [Scilit]
- Jayasinghe, L.; Shang, J.; Zhao, Z.; Goh, A. Numerical investigation into the blasting-induced damage characteristics of rocks considering the role of in-situ stresses and discontinuity persistence. Comput. Geotech. 2019, 116, 103207. [Google Scholar] [CrossRef] [Scilit]
- Mitchell, T.R.; Wang, Z.; Araos, M.; Leonardi, C.R.; Gefken, P.R.; Onederra, I.A. Experimental and Numerical Investigation into the Fracture Patterns Induced by Blast-Loading Under Unconfined and Confined Conditions. Rock Mech. Rock Eng. 2023, 56, 2433–2455. [Google Scholar] [CrossRef] [Scilit]
- Yang, R.; Ding, C.; Li, Y.; Yang, L.; Zhao, Y. Crack propagation behavior in slit charge blasting under high static stress conditions. Int. J. Rock Mech. Min. Sci. 2019, 119, 117–123. [Google Scholar] [CrossRef] [Scilit]
- Yi, C.; Johansson, D.; Greberg, J. Effects of in-situ stresses on the fracturing of rock by blasting. Comput. Geotech. 2018, 104, 321–330. [Google Scholar] [CrossRef] [Scilit]
- Li, X.; Zhu, Z.; Wang, M.; Wan, D.; Zhou, L.; Liu, R. Numerical study on the behavior of blasting in deep rock masses. Tunn. Undergr. Space Technol. 2021, 113, 103968. [Google Scholar] [CrossRef] [Scilit]
- Huo, X.; Shi, X.; Qiu, X.; Zhou, J.; Gou, Y.; Yu, Z.; Ke, W. Rock damage control for large-diameter-hole lateral blasting excavation based on charge structure optimization. Tunn. Undergr. Space Technol. 2020, 106, 103569. [Google Scholar] [CrossRef] [Scilit]
- Zhang, Z.; Zhou, C.; Remennikov, A.; Wu, T.; Lu, S.; Xia, Y. Dynamic response and safety control of civil air defense tunnel under excavation blasting of subway tunnel. Tunn. Undergr. Space Technol. 2021, 112, 103879. [Google Scholar] [CrossRef] [Scilit]
- Luo, Y.; Xu, K.; Huang, J.; Li, X.; Liu, T.; Qu, D.; Chen, P. Impact analysis of pressure-relief blasting on roadway stability in a deep mining area under high stress. Tunn. Undergr. Space Technol. 2021, 110, 103781. [Google Scholar] [CrossRef] [Scilit]
- Han, H.; Fukuda, D.; Xie, J.; Fathi Salmi, E.; Sellers, E.; Liu, H.; An, H.; Chan, A. Rock dynamic fracture by destress blasting and application in controlling rockbursts in deep underground. Comput. Geotech. 2023, 155, 105228. [Google Scholar] [CrossRef] [Scilit]
- Ma, G.; An, X. Numerical simulation of blasting-induced rock fractures. Int. J. Rock Mech. Min. Sci. 2008, 45, 966–975. [Google Scholar] [CrossRef] [Scilit]
- Yilmaz, O.; Unlu, T. Three dimensional numerical rock damage analysis under blasting load. Tunn. Undergr. Space Technol. 2013, 38, 266–278. [Google Scholar] [CrossRef] [Scilit]
- An, H.; Liu, H.; Han, H.; Zheng, X.; Wang, X. Hybrid finite-discrete element modelling of dynamic fracture and resultant fragment casting and muck-piling by rock blast. Comput. Geotech. 2017, 81, 322–345. [Google Scholar] [CrossRef] [Scilit]
- Ni, Y.; Wang, Z.; Li, S.; Wang, J.; Feng, C. Numerical study on the dynamic fragmentation of rock under cyclic blasting and different in-situ stresses. Comput. Geotech. 2024, 172, 106404. [Google Scholar] [CrossRef] [Scilit]
- Zhou, Y.; Xia, K.; Li, X.; Li, H.; Ma, G.; Zhao, J.; Zhou, Z.; Dai, F. Suggested methods for determining the dynamic strength parameters and mode-I fracture toughness of rock materials. Int. J. Rock Mech. Min. Sci. 2012, 49, 105–112. [Google Scholar] [CrossRef] [Scilit]
- Riedel, W.; Thoma, K.; Hiermaier, S.; Schmolinske, E. Penetration of reinforced concrete by BETA-B-500: Numerical analysis using a new macroscopic concrete model for hydrocodes. In Proceedings of the 9th International Symposium on Interaction of the Effects of Munitions with Structures, Berlin, Germany, 3–7 May 1999. [Google Scholar]
- Gingold, R.A.; Monaghan, J.J. Smoothed particle hydrodynamics: Theory and application to non-spherical stars. Mon. Not. R. Astron. Soc. 1977, 181, 375–389. [Google Scholar] [CrossRef] [Scilit]
- Lucy, L.B. A numerical approach to the testing of the fission hypothesis. Astron. J. 1977, 82, 1013. [Google Scholar] [CrossRef] [Scilit] [PubMed]
- Chen, J.K.; Beraun, J.E.; Jih, C.J. An improvement for tensile instability in smoothed particle hydrodynamics. Comput. Mech. 1999, 23, 279–287. [Google Scholar] [CrossRef] [Scilit]
- Rabczuk, T.; Eibl, J. Simulation of high velocity concrete fragmentation using SPH/MLSPH. Int. J. Numer. Methods Eng. 2003, 56, 1421–1444. [Google Scholar] [CrossRef] [Scilit]
- Belytschko, T.; Lu, Y.Y.; Gu, L. Element-free Galerkin methods. Int. J. Numer. Methods Eng. 1994, 37, 229–256. [Google Scholar] [CrossRef] [Scilit]
- Koneshwaran, S.; Thambiratnam, D.P.; Gallage, C. Blast Response of Segmented Bored Tunnel using Coupled SPH–FE Method. Structures 2015, 2, 58–71. [Google Scholar] [CrossRef] [Scilit]
- Shahrin, M.I.; Abdullah, R.A.; Jeon, S.; Jeon, B.; Sa’ari, R. Numerical simulation of rock fragmentation by blasting using Discrete Element Method and Particle Blast Method. IOP Conf. Ser. Mater. Sci. Eng. 2019, 527, 012032. [Google Scholar] [CrossRef] [Scilit]
- Liu, K.; Wu, C.; Li, X.; Li, Q.; Fang, J.; Liu, J. A modified HJC model for improved dynamic response of brittle materials under blasting loads. Comput. Geotech. 2020, 123, 103584. [Google Scholar] [CrossRef] [Scilit]
- Wang, H.; Wang, Z.; Wang, J.; Wang, S.; Wang, H.; Yin, Y.; Li, F. Effect of confining pressure on damage accumulation of rock under repeated blast loading. Int. J. Impact Eng. 2021, 156, 103961. [Google Scholar] [CrossRef] [Scilit]
- Li, C.; Yang, R.; Wang, Y.; Kang, Y.; Zhang, Y.; Xie, P. Theoretical and numerical simulation investigation of deep hole dispersed charge cut blasting. Int. J. Coal Sci. Technol. 2023, 10, 15. [Google Scholar] [CrossRef] [Scilit]
- Hu, Y.; Lu, W.; Chen, M.; Yan, P.; Zhang, Y. Numerical simulation of the complete rock blasting response by SPH–DAM–FEM approach. Simul. Model. Pract. Theory 2015, 56, 55–68. [Google Scholar] [CrossRef] [Scilit]
- Gharehdash, S.; Barzegar, M.; Palymskiy, I.B.; Fomin, P.A. Blast induced fracture modelling using smoothed particle hydrodynamics. Int. J. Impact Eng. 2020, 135, 103235. [Google Scholar] [CrossRef] [Scilit]
- Li, P.; Miao, S.J. Analysis and application of in-situ stress in metal mining area of Chinese mainland. Chin. J. Eng. 2017, 39, 323–334. [Google Scholar] [CrossRef]
- Timoshenko, S.P.; Goodier, J.N. Theory of Elasticity, 3rd ed.; McGraw-Hill: New York, NY, USA, 1970. [Google Scholar]
- Sigalotti, L.D.G.; Klapp, J.; Gómez Gesteira, M. The mathematics of smoothed particle hydrodynamics (SPH) consistency. Front Appl. Math. Stat. 2021, 7, 797455. [Google Scholar] [CrossRef] [Scilit]
- American Society of Mechanical Engineers. Guide for Verification and Validation in Computational Solid Mechanics (ASME V&V 10–2006); ASME: New York, NY, USA, 2006. [Google Scholar]
- Stephansson, O.; Zang, A. ISRM suggested methods for rock stress estimation—Part 5: Establishing a model for the in situ stress at a given site. Rock Mech. Rock Eng. 2012, 45, 955–969. [Google Scholar] [CrossRef] [Scilit]
- Zhang, X.; You, S.; Yang, Y.; Li, J.; Yang, Z.; Chen, S.; Li, X. Cut Blasting Optimization Using 3D Laser Scanning and Numerical Simulation. Rock Mech. Rock Eng. 2025, 58, 2549–2568. [Google Scholar] [CrossRef] [Scilit]
- Ding, C.; Guo, X.; Xu, J.; Sui, Z.; You, Y.; Zhao, D. Damage characteristics and fracture patterns of sandstone under the coupled effects of blasting stress and in situ stress. Appl. Sci. 2025, 15, 1819. [Google Scholar] [CrossRef] [Scilit]
- Yan, G.; Yang, Q.; Zhang, F.; Hao, Q.; Wang, X.; Wang, H. Experimental study on the effects of in situ stress on the initiation and propagation of cracks during hard rock blasting. Appl. Sci. 2021, 11, 11169. [Google Scholar] [CrossRef] [Scilit]
- Zhang, H.; Li, T.; Wu, S.; Zhang, X.; Gao, W.; Shi, Q. A study of innovative cut blasting for rock roadway excavation based on numerical simulation and field tests. Tunn. Undergr. Space Technol. 2022, 119, 104233. [Google Scholar] [CrossRef] [Scilit]
- Gao, J.; Xie, S.; Zhang, X.; Wang, H.; Gao, W.; Zhou, H. Study on the 2D Optimization Simulation of Complex Five-Hole Cutting Blasting under Different Lateral Pressure Coefficients. Complexity 2020, 2020, 4639518. [Google Scholar] [CrossRef] [Scilit]
- Chi, L.Y.; Xu, X.; Zhang, Z.-X.; Yang, J. Strain field development, fracturing, and gas ejection in decoupled charge blasting using granite cylinders. Rock Mech. Rock Eng. 2024, 57, 10133–10151. [Google Scholar] [CrossRef] [Scilit]
- Liu, S.-F.; Lu, S.-F.; Wan, Z.-J.; Cheng, J.-Y. Investigation of the influence mechanism of rock damage on rock fragmentation and cutting performance by the discrete element method. R. Soc. Open Sci. 2019, 6, 190116. [Google Scholar] [CrossRef] [Scilit] [PubMed]

Disclaimer/Publisher’s Note: The statements, opinions and data contained in all publications are solely those of the individual author(s) and contributor(s) and not of MDPI and/or the editor(s). MDPI and/or the editor(s) disclaim responsibility for any injury to people or property resulting from any ideas, methods, instructions or products referred to in the content. |
© 2026 by the authors. Licensee MDPI, Basel, Switzerland. This article is an open access article distributed under the terms and conditions of the Creative Commons Attribution (CC BY) license.