


Abstract
Fluorescence spectroscopy (FS) has gained increasing attention as a rapid, sensitive, and non-destructive analytical technique for food safety evaluation and environmental monitoring. However, its practical applications are often constrained by complex sample matrices, spectral overlap, high-dimensional data structures, and nonlinear relationships between fluorescence features and target analytes. Recent advances in machine learning (ML) provide powerful strategies for extracting informative patterns from complex spectral datasets. When appropriately trained and validated, ML may also improve the efficiency and predictive performance of fluorescence-based analysis. In this review, we systematically summarize the recent progress in ML-assisted FS, with particular emphasis on the integration of chemometric methods, classical ML, and deep learning (DL) approaches for spectral preprocessing, feature extraction, classification, quantitative prediction, and data interpretation. Representative applications in food contaminant detection, authenticity assessment, quality evaluation, and environmental pollutant monitoring are discussed. Furthermore, we critically analyze the challenges associated with dataset limitations, model interpretability, overfitting, and real-world deployment. Finally, emerging directions, including explainable artificial intelligence, transfer learning, multimodal data fusion, and portable intelligent sensing platforms, are highlighted to promote the development of reliable and scalable ML-enhanced fluorescence analytical technologies.
1. Introduction
Food safety and environmental monitoring represent two fundamental pillars for safeguarding public health, preserving ecological balance, and promoting sustainable development [1,2,3,4,5]. Rapid globalization and industrialization have significantly increased the complexity of food production and supply chains. This creates multiple pathways for contaminants to enter the food chain from farm to table, including pesticides [6,7,8,9], heavy metals [8,10,11,12,13], and illegal additives [14,15,16], as well as biological hazards such as bacteria [17,18,19,20] and viruses [21,22,23,24]. Meanwhile, intensive human activities have accelerated environmental degradation, resulting in the accumulation of hazardous pollutants in aquatic systems [25,26,27], soils [28,29,30], and atmospheric environments [31,32,33]. These contaminants can not only disrupt ecological systems but may also enter and accumulate within food chains, thereby posing long-term risks to human health [34]. Therefore, the development of rapid, reliable and sensitive analytical strategies for contaminant detection in food and environmental matrices has become increasingly essential for ensuring food safety and supporting effective environmental management [35,36].
Conventional analytical methods, including liquid chromatography-based separation techniques [37,38,39], tandem mass spectrometry approaches [40,41,42,43], and immunoassays [44,45,46,47,48], generally provide excellent accuracy and selectivity for contaminant detection. However, their widespread application is often constrained by complicated sample preparation, lengthy analysis times, high equipment costs, and the need for skilled personnel. As a result, they are less suitable for rapid on-site screening and large-scale monitoring [49,50].
To overcome these limitations, various rapid and non-destructive spectroscopic techniques, including Raman spectroscopy [51,52,53], ultraviolet-visible (UV-Vis) spectroscopy [54], visible and near-infrared (NIR) spectroscopy [55,56,57,58,59], and Fourier transform infrared (FTIR) spectroscopy [60,61,62], have been increasingly explored for food quality and safety evaluation. These techniques provide complementary analytical information and exhibit different advantages and limitations depending on the properties of the target analytes and sample matrices. Raman spectroscopy provides characteristic molecular vibrational information and is particularly useful for structural and chemical characterization, but its intrinsically weak scattering signals and potential interference from fluorescence backgrounds may limit its sensitivity in complex samples [51,63,64]. UV-Vis spectroscopy is relatively simple and rapid, but substantial spectral overlap and matrix effects may reduce its selectivity when multiple components coexist [65,66]. Visible and NIR spectroscopy enables rapid, non-destructive, and potentially large-scale screening, although its spectral information is often indirect and strongly influenced by scattering and matrix composition [67,68]. FTIR spectroscopy provides abundant information on molecular bonds and functional groups. However, strong infrared (IR) absorption by water can complicate the analysis of aqueous or high-moisture samples [69,70,71]. Therefore, no single spectroscopic technique is universally suitable for detecting all types of contaminants, and the selection of an analytical technique should consider the chemical and optical properties of the target contaminant, the complexity of the sample matrix, and the specific analytical objective.
Among these approaches, FS, including fluorescent probe-based sensing [72,73,74], fluorescence imaging [75,76,77], and fluorescence hyperspectral imaging [78,79,80], has attracted considerable attention owing to its high sensitivity, rapid response, non-invasive nature, simple operation, and minimal sample preparation requirements. FS can provide intrinsic fluorescence fingerprints of fluorescent compounds and can also enable indirect detection of non-fluorescent analytes through fluorescent probes or derivatization strategies [81,82]. However, fluorescence-based detection is not universally applicable because the target analyte may lack sufficient intrinsic fluorescence, while fluorescence signals can also be affected by quenching, matrix interference, background fluorescence, scattering, and spectral overlap [83,84,85]. In particular, the fluorescence response of a target compound may vary with the physicochemical properties of the sample matrix, including solvent conditions, pH, temperature, and the presence of other interfering components [85,86,87].
Consequently, FS is particularly attractive when the target contaminant exhibits suitable fluorescence characteristics or can generate a measurable fluorescent response, especially when rapid and sensitive detection is required [88,89]. For complex samples, combining fluorescence with complementary spectroscopic techniques may further improve the reliability and comprehensiveness of contaminant detection by exploiting information from different spectral modalities [90,91]. These characteristics demonstrate the potential of FS for rapid screening, quality assessment, and real-time monitoring of food and environmental systems, while also highlighting the need for appropriate data-processing and analytical strategies to address its inherent limitations.
However, the complex spectral characteristics and matrix-dependent interference associated with fluorescence data present challenges for reliable interpretation and quantitative analysis. The rapid advancement of ML technologies has provided new opportunities for the comprehensive analysis and interpretation of fluorescence data [92]. ML algorithms can automatically extract informative features and identify hidden patterns from large-scale, high-dimensional, and nonlinear spectral datasets. This enables effective noise reduction, separation of overlapping signals, and modeling of complex relationships between spectral characteristics and target properties, such as pollutant identity and concentration [93,94]. Various ML paradigms, including supervised learning (SL), unsupervised learning (UL), semi-supervised learning (SSL), and reinforcement learning (RL) [95], have been integrated into fluorescence-based analytical workflows. These approaches can improve the accuracy, stability, and generalizability of fluorescence analysis while reducing dependence on expert-driven interpretation and facilitating automated data processing, intelligent identification, and decision-making [95,96,97]. Moreover, ML-based approaches provide a potential framework for integrating complementary information from multiple spectroscopic modalities, offering opportunities for more robust analysis of complex samples [90,91,97,98].
This review provides a comprehensive overview of the applications of ML-assisted FS in food safety assessment and environmental monitoring. Section 2 introduces the fundamental categories of ML and discusses their potential roles in spectral data analysis. Section 3 describes the characteristics of fluorescence spectral data and highlights the major challenges associated with spectral interpretation. Section 4 systematically summarizes the applications of ML in critical analytical procedures, including data augmentation, spectral preprocessing, feature extraction, model construction, and performance evaluation. Section 5 presents representative applications of ML-assisted FS for food contaminant detection, food authenticity assessment, and the identification, tracing, and quantification of environmental pollutants. Finally, Section 6 discusses current limitations and provides perspectives on future research directions and emerging trends in this field.
2. Types of ML
In recent years, rapid advancements in algorithms, computational resources, and data availability have transformed ML into a fundamental technology driving innovation across diverse scientific and engineering fields [99]. Within the ML framework, learning paradigms provide the foundation for categorizing different approaches and are generally classified into four major types: SL, UL, SSL, and RL [88]. DL, in contrast, refers to a family of multilayer neural-network architectures that can be developed under different learning paradigms, including supervised, self-supervised, and RL. The studies discussed in this section are representative rather than exhaustive. They are selected to illustrate the methodological characteristics, practical roles, and typical advantages and limitations of different ML paradigms in FS. The selection considers their relevance to FS, methodological representativeness, diversity of analytical tasks, and the availability of quantitative performance information. This section systematically introduces these four learning paradigms, followed by a brief overview of recent developments in DL, a subfield of ML.
2.1. Supervised Learning
SL is one of the most widely used ML paradigms, in which models are trained using labeled datasets to establish relationships between input features and corresponding output labels [100]. Each sample in an SL framework consists of a set of input variables and their associated target values, enabling the model to learn underlying patterns and develop predictive functions between them [101]. Common SL algorithms include artificial neural networks, random forest (RF) [102], logistic regression, support vector machines (SVM) [103], k-nearest neighbors (KNN) [65], naive Bayes, and decision trees. These algorithms have been used in a range of analytical tasks, including classification, regression, and pattern recognition. Their suitability for food safety assessment and environmental monitoring depends on the characteristics of the fluorescence data, the availability of reference labels, and the analytical objective [104,105].
As shown in Figure 1, Slavova et al. employed a mobile FS system to acquire spectral data from two greenhouse tomato varieties. The obtained spectra were processed through a standard analytical workflow involving feature selection, model development, and ten-fold cross-validation, followed by integration with various ML algorithms for non-destructive variety identification. The results demonstrated excellent discrimination performance under the reported experimental conditions, with an average classification accuracy of 100%, a Kappa coefficient of 1.0, and no classification errors in the evaluated dataset. However, these results should be interpreted in relation to the sample diversity, acquisition conditions, and validation design used in the study [106].
Figure 1.
Flowchart for the classification of greenhouse tomato samples based on FS data and ML algorithms. Reproduced from Figure 2 of Slavova et al. [106] under the Creative Commons Attribution 4.0 International (CC BY 4.0) license.
Furthermore, Sun et al. achieved the classification of four tea varieties using fluorescence hyperspectral imaging combined with an ABC-SVM algorithm. The acquired spectral data covered a wavelength range of 400.6797 to 1001.612 nm and were preprocessed using multiplicative scatter correction (MSC) to reduce spectral variations. Subsequently, the competitive adaptive reweighted sampling algorithm was applied to identify 58 characteristic wavelengths, which were used to construct the ABC-SVM classification model. The proposed model achieved 100% accuracy in both the calibration and prediction datasets. Compared with conventional classification approaches, including SVM, KNN, and Naive Bayes, the ABC-SVM model demonstrated superior classification performance, indicating its potential for rapid and accurate identification of tea varieties [107]. However, the applicability of these methods to real-world agricultural scenarios remains unclear. Both studies were conducted under controlled conditions and did not provide interpretable links between spectral features and varietal traits. To address these limitations, the present study adopts the workflow shown in Figure 1 with the enhanced preprocessing and multi-scenario validation, aiming to extend FS-based ML classification toward practical deployment.
2.2. Unsupervised Learning
UL represents another major category of ML, characterized by its ability to analyze datasets without requiring predefined labels. By automatically discovering intrinsic structures, patterns, and relationships within data, UL enables various analytical tasks, particularly clustering and dimensionality reduction [108]. Clustering aims to partition data samples into groups, where samples within the same cluster exhibit greater similarity to each other than to those assigned to different clusters [109]. Common clustering algorithms include K-means clustering [110,111], hierarchical clustering [112,113], and density-based spatial clustering of applications with noise [114,115]. Dimensionality reduction refers to the transformation of high-dimensional data into a lower-dimensional representation while preserving the essential information contained in the original dataset [116]. Widely used dimensionality reduction techniques include principal component analysis (PCA) [117,118], t-distributed stochastic neighbor embedding [119], and autoencoders [120,121].
For example, Savić et al. integrated the unsupervised K-means algorithm with FS analysis to address the challenge of separating overlapping components in complex fluorescence spectra [84]. In their approach, fixed-size window factor analysis was initially employed to extract preliminary spectral factors, followed by K-means clustering to automatically classify the derived factor scores and identify highly similar spectral components without requiring predefined class labels. Subsequently, factor analysis was independently performed within each cluster to extract representative factors, enabling more accurate resolution of the original overlapping spectral components. This study demonstrated the potential of UL for fluorescence-based protein structure analysis and highlighted its applicability in spectral component separation.
2.3. Semi-Supervised Learning
Positioned between SL and UL, SSL utilizes a combination of a limited amount of labeled data and a large quantity of unlabeled data to improve model learning performance [122,123]. This learning paradigm is particularly valuable in practical applications where acquiring sufficient labeled samples is time-consuming, expensive, or requires specialized expertise [124], such as medical diagnosis [125], natural language processing [126], and image recognition [127]. SSL methods are generally based on fundamental assumptions, including smoothness, sparsity, and manifold principles [123], and commonly employed strategies include graph-based label propagation/spreading [128], semi-supervised SVM [129], self-training [130], co-training [131], and neural network-based SSL approaches [132].
For example, Gong et al. proposed a multi-view fluorescence analysis strategy based on semi-supervised collaborative learning. In this approach, three-dimensional fluorescence features were extracted from two complementary perspectives, namely oil thickness and blending ratio, and collaborative training was performed by incorporating unlabeled samples to achieve feature complementation and model optimization. Within the semi-supervised framework, individual classifiers were established for each view, while unlabeled samples were assigned pseudo-labels to enable cross-view information exchange and iterative optimization. Experimental results demonstrated that, even with a limited number of labeled samples, the multi-view collaborative model achieved nearly 100% recognition accuracy, outperforming both single-view models and fully supervised methods. This study highlighted the potential of SSL to reduce annotation requirements, improve feature interpretability, and strengthen model generalizability, providing an efficient strategy for spectral analysis and monitoring in complex environments [133].
The effectiveness of SSL for reducing annotation requirements in food-safety-oriented spectral analysis was further demonstrated by Zhang et al. [134]. They evaluated self-training and graph-based label spreading using two representative spectroscopic datasets, including FTIR-based plasma dosage classification and excitation–emission matrix (EEM) fluorescence-based foodborne pathogen detection. For pathogen detection, EEM spectra were collected over excitation and emission ranges of 250–400 and 260–450 nm, respectively, to discriminate phage-infected E. coli, E. coli, phage, and Listeria samples. SSL exploited unlabeled spectra through pseudo-labeling and subsequently trained the classifiers using both labeled and pseudo-labeled samples. As shown in Figure 2, self-training improved classification accuracy by approximately 10% when only a small number of labeled samples were available, whereas label spreading showed degraded performance for the pathogen detection dataset, likely because its poorly clustered spectral distribution resulted in unreliable pseudo-labels. These findings demonstrate that SSL can effectively reduce dependence on labeled spectral samples; however, its performance strongly depends on the reliability of pseudo-labels and the intrinsic distribution of spectral data.
Figure 2.
Classification accuracy as a function of the number of labeled samples for the pathogen detection dataset using SSL. (A) Self-training with maximum confidence and minimum entropy strategies; (B) label spreading with KNN and RBF kernels. Adapted from Figure 5 of Zhang et al. [134] under the CC BY 4.0 license.
Collectively, these studies demonstrate that SSL provides an effective strategy for exploiting abundant unlabeled spectral data while reducing the cost of sample annotation. By integrating pseudo-labeling, collaborative learning, and structural information within spectral datasets, SSL has considerable potential to improve data efficiency and model generalizability in food safety and environmental monitoring, particularly under label-scarce conditions.
2.4. Reinforcement Learning
RL enables agents to develop optimal decision-making strategies through continuous interactions with their surrounding environments [135]. Unlike supervised and UL, RL does not rely on predefined labeled datasets; instead, it adopts a trial-and-error learning mechanism, in which agents select actions according to the current environmental state and subsequently receive reward signals from the environment. By maximizing cumulative rewards over time, agents iteratively optimize their behavioral policies and improve decision-making performance [136]. Representative RL algorithms include Q-learning [137], state–action–reward–state–action methods [138], deep Q-networks [139], and policy gradient approaches, such as proximal policy optimization and trust region policy optimization [140].
RL has been applied to a variety of optimization and decision-making problems, particularly those involving sequential decision processes and long-term optimization objectives [135,141,142,143]. As shown in Figure 3, its ability to iteratively explore a variable or decision space based on feedback makes it potentially useful for high-dimensional spectroscopic analysis. In particular, RL can be employed as an optimization strategy to identify informative spectral variables or optimize experimental parameters [144].
Figure 3.
The basic framework of RL. Reproduced from Figure 3 of Yang et al. [145] under the CC BY 4.0 license.
Direct applications of RL to molecular FS remain relatively limited. Nevertheless, related spectroscopic studies have explored RL-based strategies for spectral-variable selection and optimization. For example, a quantitative spectroscopy prediction framework combined efficient Q-learning with sparse partial least squares to select informative variables from energy-dispersive X-ray fluorescence spectra for the prediction of potentially toxic elements in soil. Although this study does not involve molecular FS, it illustrates how RL may be used to optimize high-dimensional spectral-variable spaces. In fluorescence analysis, similar strategies may be relevant to adaptive spectral acquisition, experimental-parameter optimization, and sequential analytical decision-making, but their practical value requires direct validation in FS applications [146].
To facilitate a systematic comparison of the four major ML paradigms discussed above, Table 1 summarizes their basic characteristics, strengths, limitations, and most appropriate application scenarios. The comparison also highlights their potential relevance to FS and food safety and environmental monitoring. By presenting the differences in data requirements, learning mechanisms, and application conditions, this table provides a concise overview of the applicability of each learning paradigm to fluorescence spectral analysis.
As summarized in Table 1, the four ML paradigms differ in their data requirements, learning mechanisms, and application conditions. SL is particularly suitable for quantitative prediction and classification when sufficient labeled data are available, whereas UL is more appropriate for exploratory analysis and pattern discovery. SSL provides a useful alternative when only a limited number of labeled samples can be obtained, while RL is mainly relevant to adaptive optimization and sequential decision-making [143,147]. These differences should be considered when selecting an appropriate learning strategy for fluorescence spectral analysis.
Table 1.
Comparison of four major machine-learning paradigms and their potential relevance to FS.
2.5. Deep Learning
DL is a subfield of ML that uses multilayer neural networks to learn hierarchical representations from data [174,175,176,177,178]. In FS, DL has been explored for feature extraction, classification, quantitative prediction, and the analysis of fluorescence images and multidimensional spectral data [179]. The following subsections briefly discuss several emerging DL architectures and their potential relevance to fluorescence analysis.
- Transformers
A Transformer is a DL model based on self-attention. This is a type of neural network architecture in which each position in a sequence can interact directly with all other positions, thereby capturing long-range dependencies [180,181,182]. Researchers have used this model to detect weeds in maize fields, significantly improving the efficiency of weed control [183]. In the field of FS, researchers have constructed a differential Transformer-based DL network, MFliNet, which is suitable for complex macroscopic fluorescence lifetime imaging and offers new insights for advanced biomedical imaging under diverse challenging conditions [184].
- Graph neural networks (GNN)
Wireless sensor networks are widely used in environmental monitoring [185], and the combination of DL and GNN enables the network to provide optimal coverage [186,187,188]. Qiu et al. employed GNNs for computational screening of candidate molecules, and only a small set of high-potential molecules were subjected to fluorescence spectroscopic measurements, which effectively reduced experimental throughput [189]. In addition, the hybrid GNN developed by Nguyen et al. can accurately predict the absorption and emission wavelengths of organic chromophores including typical fluorophores such as coumarin and BODIPY, offering a computational tool for the pre-evaluation of optical properties of prospective fluorescent molecules [190].
- Self-supervised learning
Self-supervised learning is particularly well-suited to scenarios where there are few labelled samples and a large number of unlabelled spectra. This approach offers a cost-effective strategy for accelerating the discovery and optimization of novel therapeutic drugs [191]. Xia et al. utilized the physics-informed self-supervised learning framework PhySMI to achieve multicolor imaging and suppress detection noise on conventional fluorescence microscopes without paired ground-truth labels or intensive spectral acquisition [192]. Furthermore, Li et al. proposed the spatial-redundancy denoising Transformer, which can realize fluorescence-image denoising in a self-supervised fashion, and it restores high-frequency details without generating over-smoothed structures or distorted fluorescence traces [193]. Self-supervised learning circumvents the heavy burden of manual annotation and shows great application potential for fluorescence spectral analysis and fluorescence image processing. Nevertheless, challenges remain regarding model generalization, and further exploration is required to expand its practical deployment in complex fluorescence measurement tasks.
- Multimodal deep learning
Multimodal medical diagnosis is an emerging field in medicine [194]. Multimodal deep learning integrates data from multiple sources, such as electronic health records and radiological images, to generate comprehensive clinical insights [195]. For fluorescence spectral detection, Wang et al. put forward a generalized multi-view machine-learning strategy. By employing both excitation and emission spectra, it addresses the spectral-unmixing problem arising from substantial spectral overlap of fluorophores [196]. Santos et al. constructed a multimodal spectroscopic liquid-biopsy framework integrating EEM fluorescence, Fourier-transform infrared and Raman spectra. Through low-level data fusion and XGBoost classification on serum samples, this approach yielded well-balanced diagnostic results, with ROC-AUC values reaching 0.997 for breast cancer and 0.994 for colorectal cancer [197]. Taken together, multimodal learning can make full use of complementary information from diverse spectral sources and greatly improve analytical and diagnostic performance for fluorescence-related applications.
Although these four models face challenges in terms of data, computation, interpretability and generalisation, they can effectively assist with FS analysis.
3. Limitations of FS
In practical applications of FS, spectral data are inherently complex. Matrix effects, spectral interference, and signal overlap further complicate analysis. Together, these factors can limit analytical performance and hinder the full exploitation of FS [198,199,200,201]. This section discusses the intrinsic characteristics of fluorescence spectral data and systematically examines the challenges associated with its application in fields such as food safety assessment and environmental monitoring.
3.1. Complexity in Fluorescence Spectral Data
FS is an optical analytical technique based on the emission of fluorescent molecules, providing valuable insights into molecular structures and characteristic spectral fingerprints of intrinsic components within samples [96]. Under controlled analytical conditions, fluorescence intensity shows a proportional relationship with both excitation light intensity and analyte concentration, as described in Equation (1) [83],
If = 2.303ϕI0εlc.
Here, If represents the fluorescence intensity emitted by fluorescent components within the detectable range of the photodetector (i.e., the active detection area). ϕ denotes the fluorescence quantum yield, I0 represents the excitation light intensity, ε is the molar extinction coefficient of the fluorescent species, l corresponds to the effective optical path length, and c indicates the concentration of the fluorescent material.
In practical sample analysis, fluorescence signals are determined by both intrinsic and external factors. Intrinsic factors include molecular structures and inherent physicochemical properties. External conditions include solvent polarity, pH, temperature, water content, and the presence of surfactants [157,202]. The combined effects of these factors contribute to complex and dynamic variations in fluorescence spectral characteristics, including changes in spectral profiles, intensity distributions, and peak positions [203]. Moreover, fluorescence spectral datasets are typically characterized by high-dimensionality, as each sample may contain intensity information across hundreds or even thousands of wavelength channels, resulting in a large feature space [204]. In addition, raw fluorescence spectra often contain undesirable variations caused by instrumental noise, scattering effects, and baseline drift, which can complicate spectral interpretation and hinder reliable feature extraction [205,206]. Therefore, these intrinsic and extrinsic factors collectively pose significant challenges for fluorescence data processing, preprocessing, and subsequent analytical modeling.
To address these variations, appropriate preprocessing and spectral analysis procedures are often required before chemometric or ML modeling. However, no single preprocessing strategy is universally optimal for all fluorescence datasets. The appropriate choice depends on the fluorescence modality, the dominant source of spectral variation, and the analytical objectives. Commonly used preprocessing and spectral analysis methods differ in their intended purposes, recommended application scenarios, advantages, and limitations. Table 2 summarizes these differences and provides a practical basis for selecting appropriate data-processing strategies.
Table 2.
Comparison of commonly used preprocessing and spectral analysis methods for FS.
The effectiveness of preprocessing is strongly task-dependent. For relatively noisy one-dimensional fluorescence spectra, Savitzky–Golay (SG) smoothing can improve the signal-to-noise ratio while preserving the overall spectral profile, but excessive smoothing may attenuate weak or narrow spectral features that are relevant to analyte discrimination [209]. Derivative transformations can improve baseline correction and help resolve overlapping spectral features, but they may simultaneously amplify high-frequency noise and therefore are often combined with appropriate smoothing [210]. Standard normal variate (SNV) and MSC are useful when intensity or scattering-related variations dominate the spectral differences among samples; however, these transformations may suppress intensity information that is analytically meaningful. For EEM data, background subtraction, inner-filter effect correction [211], and removal of Rayleigh and Raman scattering are particularly important because these non-fluorescence contributions can interfere with subsequent decomposition or ML modelling [85,171]. PCA can reduce spectral redundancy and facilitate exploratory analysis, whereas parallel factor analysis (PARAFAC) can decompose multidimensional fluorescence data into underlying components. Nevertheless, the results of PCA and PARAFAC depend on the variance structure, selected component number, and underlying model assumptions [84,212]. Therefore, preprocessing and spectral analysis should not be treated as routine, model-independent operations [158,163]; instead, they should be selected and evaluated according to the characteristics of the FS data and the analytical objective.
3.2. Complexity in Practical Applications
FS is a rapid and highly sensitive analytical technique that has demonstrated considerable potential for applications in food safety assessment and environmental monitoring [213,214]. However, its application to complex real-world samples is often affected by matrix interference, background fluorescence, light scattering, and spectral overlap [212]. Food matrices may contain intrinsic fluorophores, such as tryptophan, nicotinamide adenine dinucleotide, and riboflavin, as well as processing-related fluorescent products formed during the Maillard reaction and lipid oxidation. The combined fluorescence emissions of these components generate complex background signals, which can interfere with the accurate detection and quantification of target analytes [86,215,216,217]. Similarly, in environmental monitoring, pollutants (e.g., polyaluminum chloride and mineral oils) commonly coexist with complex matrices, including soils, water bodies, and humic substances, which exhibit strong background fluorescence and scattering effects [218,219]. Furthermore, many environmental pollutants consist of multiple fluorescent components with highly overlapping emission characteristics, making direct signal discrimination and reliable identification challenging [220].
These challenges highlight the need for analytical strategies with enhanced selectivity and sensitivity, while also emphasizing the importance of advanced data-processing approaches. In this context, ML provides powerful tools for the comprehensive interpretation of fluorescence spectral data. Through the development of multilayer neural networks and ensemble learning models, ML algorithms can automatically extract informative features from high-dimensional and highly overlapped fluorescence spectra, effectively suppress background interference, and achieve accurate identification and quantification of complex multicomponent systems [208]. The adaptive learning capability and nonlinear modeling capacity of ML offer new opportunities to overcome the limitations of conventional chemometric approaches in complex analytical environments [212].
4. ML-Assisted FS
The application of ML in FS analysis generally follows a sequential workflow consisting of five interconnected stages: data partitioning and augmentation, spectral preprocessing, feature extraction and dimensionality reduction, model construction for classification and regression, and model evaluation. This section provides an overview of these key analytical procedures, as well as explainable artificial intelligence, highlighting the role and mechanisms of each stage in improving the accuracy, interpretability, and generalizability of fluorescence spectral analysis.
4.1. Division and Enhancement of Data Sets
FS datasets often exhibit several inherent challenges, including limited sample availability, high-dimensionality, and susceptibility to complex background interference and physicochemical variations [221]. When simple random splitting strategies are adopted, model performance evaluation may become biased and fail to provide a reliable estimation of generalizability. By integrating algorithmic principles with domain-specific knowledge, ML provides various data partitioning strategies that enable more representative separation of training and testing datasets, thereby improving the reliability of model evaluation [222].
For example, Sabanci et al. integrated FS data with multiple ML algorithms to investigate the impact of dataset partitioning strategies on model performance using feature-selected spectral variables. Various partitioning schemes, including ten-fold cross-validation and stratified sampling, were employed to maintain the original distribution of sample characteristics between training and testing subsets while minimizing potential randomness and bias. The Ranker + OneR method identified the top 10 discriminative spectral features. Based on these features, multiple ML algorithms were systematically evaluated using accuracy, true positive rate, false positive rate (FPR), F-measure, and Cohen’s Kappa coefficient. These metrics characterized model stability and generalizability (Figure 4). Under this optimized evaluation framework, several models achieved near-perfect or 100% classification accuracy, accompanied by extremely low FPR values and Kappa coefficients close to 1. These findings highlight the critical role of appropriate dataset partitioning strategies in obtaining reliable performance evaluations and improving the robustness of FS-based ML analytical models [223].
Figure 4.
Classification performance of ML models for distinguishing onion cultivars based on selected FS features. Reproduced from Table 1 of Sabanci et al. [223] under the CC BY 4.0 license.
To improve model generalizability, robustness, and resistance to interference, researchers often employ algorithm-based data augmentation strategies to generate realistic and diverse synthetic samples from limited datasets, thereby increasing the size and variability of fluorescence spectral datasets [224]. For instance, to address class imbalance issues in clinical fluorescence spectral data, Svecova et al. applied the synthetic minority oversampling technique to expand the training dataset, as illustrated in Figure 5. By generating synthetic samples for the underrepresented healthy class, the dataset distribution was effectively balanced. Following data augmentation, the specificity of the SVM model increased from 0.47 to 0.89, while other models also demonstrated improved generalizability and robustness. These findings indicate that ML-based data augmentation can help alleviate class imbalance and improve the predictive performance and robustness of fluorescence spectral classification models [225,226].
Figure 5.
The workflow for 3D fluorescence analysis combined with ML-based prediction of serum metabolic profiles in endometrial cancer (EC) patients. Serum samples collected from EC patients and healthy controls were diluted and characterized using three-dimensional FS. Characteristic fluorescence markers were extracted and evaluated for their potential clinical relevance. Subsequently, various ML algorithms, including PCA-based k-means clustering, partial least squares (PLS) discriminant analysis, RF, SVM, linear regression (LR), and stochastic gradient descent, were employed for model development, validation, and prediction. Model performance was assessed using multiple evaluation metrics, including sensitivity, specificity, positive predictive value, negative predictive value, accuracy, and area under the curve. Reproduced from Figure 1 of Švecová et al. [226] under the CC BY 4.0 license.
4.2. Preprocessing Methods
In spectral analysis, data preprocessing is a critical step performed before subsequent modeling and interpretation. It involves a series of operations, such as normalization, baseline correction, and noise reduction, to improve spectral quality and enhance the accuracy and reliability of downstream analyses [158]. Effective preprocessing strategies can improve the signal-to-noise ratio and spectral consistency of acquired data while reducing baseline and intensity variations, thereby providing more reliable inputs for subsequent spectral modelling [167,227]. Commonly used preprocessing techniques include SNV correction [228,229], MSC [230], first- and second-order derivatives [231,232], SG smoothing filtering [233], kernel-based methods, and artificial neural networks, among others [234,235].
For example, Markovski et al. demonstrated the importance of spectral preprocessing in laser-induced fluorescence analysis of complex oil samples. The authors first removed irrelevant spectral regions outside 410–900 nm to minimize interference from the excitation source and subsequently normalized the fluorescence spectra using the chlorophyll-related maximum around 675 nm. As shown in Figure 6, normalization effectively reduced variations in fluorescence intensity among different samples and improved spectral comparability, providing standardized inputs for subsequent neural network-based classification and quantitative analysis. This study highlights the critical role of spectral preprocessing in enhancing data consistency and facilitating reliable ML-assisted fluorescence analysis [236].
Figure 6.
Effect of fluorescence spectral normalization on spectral preprocessing: (a) original laser-induced fluorescence spectra; (b) normalized fluorescence spectra relative to the chlorophyll-related red maximum. Reproduced from Figure 2 of Markovski et al. [236] under the CC BY 4.0 license.
Yang and co-workers applied several spectral preprocessing techniques, including SG smoothing, SNV correction, and normalization, to improve spectral quality by reducing noise interference, correcting baseline variations, and standardizing spectral responses. These preprocessing procedures facilitated more effective feature extraction and enhanced the predictive performance of subsequent ML models. The results demonstrated that ML models developed using SG-preprocessed spectra, including RF and PLS, exhibited excellent prediction capability for evaluating frying frequency in different vegetable oils, with the highest coefficient of determination R2 reaching 0.99. Beyond improving model robustness and generalizable ability, effective preprocessing strategies provide a reliable foundation for rapid and non-destructive quality assessment of edible oils [237].
4.3. Feature Extraction and Dimensionality Reduction
Raw spectral datasets typically contain thousands of variables and exhibit high-dimensional characteristics, making them unsuitable for direct application in many analytical and ML tasks [159,238]. Feature extraction is therefore commonly employed to identify representative and informative variables from the original spectral data. By preserving essential spectral information while reducing data dimensionality, feature extraction can improve computational efficiency and mitigate the risk of model overfitting [239]. Widely used feature extraction approaches include PCA [240], wavelet transform (WT) [241], independent component analysis [242], convolutional neural networks (CNN) [91], and PARAFAC [166].
Zhou et al. developed a fluorescence hyperspectral imaging-based analytical strategy integrated with a DL model, combining WT and a stacked denoising autoencoder (SDAE), for predicting lead accumulation in oilseed rape leaves. After spectral preprocessing using SNV correction, the optimal model was obtained using support vector regression (SVR). This was based on a two-level decomposition with the sym7 wavelet basis function, followed by deep feature extraction using SDAE. The proposed model achieved excellent predictive performance, with a coefficient of determination for the prediction set () of 0.9388, a root mean square error (RMSE) of 0.0199 mg/kg, and a relative percent difference (RPD) of 3.275. These results demonstrated the feasibility of the WT-SDAE-assisted FHSI approach for accurate and sensitive detection of trace heavy metal accumulation in crops [241].
DL-based feature extraction has recently emerged as an effective strategy for automatically extracting hierarchical and nonlinear representations from complex spectral datasets. For example, Lu et al. developed a hyperspectral imaging-based analytical framework combined with multi-task DL for rapid assessment of heavy metal accumulation in Sedum alfredii. The acquired VNIR hyperspectral data were processed using deep neural architectures, including an ecotype identification network and a heavy metal stress and accumulation prediction network (HMNet), which enabled simultaneous sample classification, stress discrimination, and quantitative prediction of Cd, Zn, and Pb accumulation. The workflow integrated spectral preprocessing, feature learning, and multi-output prediction, as illustrated in Figure 7. Compared with conventional PLS- and SVM-based models, the DL framework effectively captured complex spectral features and improved prediction robustness. In particular, HMNet achieved superior regression performance, with prediction-set R2 values above 0.84 and improved RPD values compared with traditional models, demonstrating the potential of deep feature extraction for sensitive monitoring of trace heavy metal accumulation in plants [243].
Figure 7.
Workflow of hyperspectral data preprocessing, deep feature extraction, and multi-task learning for heavy metal accumulation prediction. Reproduced from Figure 2 of Lu et al. [243] under the CC-BY-NC license.
4.4. Classification and Regression
The integration of FS with ML techniques has been widely applied in food safety assessment and environmental monitoring, where spectral data analysis is generally categorized into two fundamental tasks: classification and regression [89]. Classification aims to qualitatively determine the category or class of a target sample by assigning it to one of several predefined groups based on its spectral characteristics [244].
Regression tasks focus on quantitatively predicting the properties of target samples by establishing statistical relationships between dependent (response) variables and one or more independent (feature) variables, thereby enabling the prediction of continuous numerical values [245]. A wide variety of ML algorithms have been extensively applied for the modeling and interpretation of fluorescence spectral data, supporting both classification and regression analyses [96]. For instance, SL algorithms, including DT, RF, KNN, and SVM [246], have been widely employed for spectral signal classification and quantitative concentration prediction [160,247]. Meanwhile, UL approaches, such as cluster analysis, can be used to reveal intrinsic data structures and identify sample groupings within spectral datasets, providing complementary information for subsequent supervised modelling [225].
In practical applications, Ropelewska et al. combined FS data with several conventional ML algorithms, including PART, logistic regression, Naïve Bayes, RF, IBk, and filtered classifier, to discriminate leek seeds from the Starozagorski Kamush variety and two breeding lines. As shown in Figure 8, the binary classification results demonstrated that the models achieved 100% accuracy in distinguishing Starozagorski Kamush from breeding line 4 and breeding line 39, whereas the classification accuracy between breeding line 4 and breeding line 39 was 80%. These results indicate that substantial spectral differences exist among different varieties, while seeds from different breeding lines within the same species exhibit relatively similar fluorescence characteristics. This study highlights the potential of ML-assisted FS as a rapid and non-destructive approach for leek seed variety identification [248].
Figure 8.
Difference in emission wavelength among Starozagorski kamush breeding line 4 and breeding line 39. Reproduced from Figure 2 of Ropelewska et al. [248] under the CC BY 4.0 license.
Chen et al. developed a modeling strategy for the identification of overlapping oil fluorescence spectra by integrating ML algorithms, including KNN, DT, and RF, with linear discriminant analysis (LDA). The results demonstrated that combining LDA with a 2D CNN achieved a classification accuracy of 100% for discriminating overlapping fluorescence spectra. In addition, PLS regression, SVR, DT regression, and RF regression models were employed for quantitative prediction of lubricant concentrations. Among these approaches, the DT regression model exhibited the best performance, achieving an R2 value of 1 and an RMSE of 0, indicating accurate concentration prediction without observable errors. This study demonstrates that ML-assisted FS provides a reliable and highly accurate strategy for both the discrimination of overlapping oil types and quantitative concentration analysis [249].
Furthermore, Wu et al. developed a 3D FS-based ML framework for simultaneous qualitative identification and quantitative determination of vegetable oil adulteration. Nine types of adulterated vegetable oils were analyzed using multiple ML algorithms, including KNN, RF, SVM, PLS, and CNN. The results demonstrated that FS combined with ML models could effectively distinguish different adulteration types, with classification accuracies exceeding 90% under appropriate adulteration thresholds. Among the tested models, SVM exhibited excellent discrimination ability for adulterated oils, achieving classification accuracies ranging from 82% to 100% depending on adulteration type and concentration. For quantitative regression, different ML algorithms were further applied to predict adulterant concentrations. The optimal models achieved high predictive performance, with coefficients of determination () ranging from 0.89 to 0.99 and low RMSEP values (0.01–0.05), demonstrating the feasibility of ML-assisted FS for accurate quantitative analysis of complex food matrices. As illustrated in Figure 9, the developed workflow integrates fluorescence spectral acquisition, ML-based qualitative classification, and quantitative prediction, providing a rapid and non-destructive strategy for vegetable oil authenticity assessment [250].
Figure 9.
Schematic of sample preparation, 3D fluorescence data measurement and data analysis. Reproduced from Figure 1 of Wu et al. [250] under the Attribution-NonCommercial-NoDerivatives 4.0 International license.
4.5. Model Evaluation
Selecting appropriate evaluation metrics remains a critical challenge, as the chosen metrics must align with the objectives and characteristics of the developed models [251]. For classification tasks, commonly used evaluation metrics include accuracy, precision, and recall, which together provide a comprehensive assessment of model discrimination and recognition performance [165]. For regression tasks involving the prediction of continuous variables, metrics such as mean squared error (MSE), RMSE, mean absolute error (MAE), and the coefficient of determination R2 are widely adopted to quantify prediction errors and evaluate model performance [251,252]. The corresponding calculation formulas for these evaluation metrics are presented as follows:
Here, m represents the number of samples, XP denotes the predicted value, and XE represents the actual value. In classification tasks, TP, TN, FP, and FN correspond to true positive, true negative, false positive, and false negative cases, respectively. However, a single evaluation metric is often insufficient to fully characterize model performance, particularly when analyzing complex, nonlinear, and noisy real-world datasets. Therefore, the integration of multiple complementary evaluation metrics is recommended to provide a more comprehensive and reliable assessment of model performance [161].
4.6. Explainable Artificial Intelligence
The increasing use of complex ML and DL models in FS analysis can improve predictive performance but may reduce the interpretability of model decisions. XAI methods can therefore be employed to clarify the relationships between spectral features and model predictions, thereby improving model transparency and facilitating the interpretation of spectroscopic information. In a study, researchers used Shapley Additive Explanations (SHAP) feature importance to assess the acidity of edible oils [149]. This approach offers valuable explainability. Another framework is the local interpretable model-agnostic explanations (LIME). LIME technology provides healthcare professionals with specific information to enable them to diagnose conditions efficiently and conveniently [253]. For example, LIME can help determine whether a patient with Alzheimer’s disease is in the early or late stages of the condition [253].
The attention mechanism draws inspiration from human biological systems, it serves as an interpretable cue that can be cross-validated using SHAP, LIME or domain knowledge [149]. Feature importance analysis is also a useful approach. By studying the fluorescence spectral characteristics of hotpot oil and comparing its characteristic peaks, this approach provides a basis for the rapid detection of reused hotpot oil [254]. We can use interpretable spectral feature extraction. In previous research, scientists used a CNN + PCA approach to enhance the interpretability of classification [168], and employed PARAFAC to extract features explaining oil classification [255]. This technology provides an effective approach for the identification of food safety.
In summary, explainable artificial intelligence serves as a bridge between the predictive capabilities of ML and an understanding of the mechanisms underlying FS. This interpretability is crucial for developing fluorescence analysis models that are reliable, generalizable and readily acceptable to regulatory authorities.
5. Applications in Food Safety and Environmental Monitoring
As a highly sensitive and rapid analytical approach, ML-assisted FS provides intelligent solutions for critical applications, including food contaminant detection, adulteration identification, quality assessment, and the tracing and quantification of environmental pollutants. This section presents a detailed discussion of the applications and methodological strategies involved in integrating ML with FS across food safety and environmental monitoring fields. Representative case studies are highlighted to demonstrate the practical potential of these approaches, while Table 3 summarizes the major applications of ML-integrated FS technologies in these two domains.
Table 3.
Applications of ML combined with FS in food safety and environmental monitoring.
5.1. Applications in Food Safety
In this context, food safety regulation, as a fundamental safeguard for public health, plays a critical role in protecting human well-being and maintaining social stability [66]. ML-assisted FS has emerged as a practical analytical tool in this field due to its non-destructive nature, high sensitivity, and rapid response capability. Consequently, it has been increasingly applied in key areas of food safety assessment, including hazardous substance detection, food authenticity and adulteration identification, and comprehensive quality evaluation [87,162,259].
For food contaminant detection, ML-assisted FS enables rapid and accurate screening of various hazardous substances, including heavy metals, pesticide residues, and microbial contaminants [260,261,262]. For example, Bertani et al. combined FS with an SVM algorithm for the non-destructive detection of aflatoxin B contamination in almond slurry. In their study, samples were excited using a 375 nm UV-LED source, and an SVM-based classification model was developed with feature selection and data standardization procedures. Furthermore, a majority voting strategy was introduced to integrate measurements from multiple sampling locations, thereby improving model robustness. A total of 5000 fluorescence spectra were collected under two different instrumental configurations, with aflatoxin B concentrations ranging from 2.7 to 320.2 ng/g. The results demonstrated that, at a detection threshold of 6.4 ng/g, the proposed model achieved a classification accuracy of 94% with a false-negative rate of 5%. Although these results indicate good performance, the 5000 spectra were collected under only two instrumental configurations, and the use of majority voting across multiple sampling locations may limit the direct comparability with measurements obtained under different acquisition conditions. Moreover, the reported performance was evaluated within the investigated sample and concentration ranges, and its robustness across independent sample batches, instruments, or laboratories remains to be established. Therefore, the FS-SVM approach shows clear promise for rapid and non-destructive contaminant screening, but broader external validation is required before its field applicability can be fully assessed [263].
Beyond the detection of specific hazardous substances, ML-assisted FS has also demonstrated considerable potential for food authenticity assessment and the identification of adulteration [250,264]. By integrating pattern recognition and anomaly detection algorithms, these systems can effectively discriminate adulterated samples from authentic products, thereby supporting food authenticity verification and origin traceability [265].
For example, Yan et al. proposed a novel anomaly detection strategy based on a one-class convolutional SDAE integrated with EEM FS. This approach was applied for rapid authenticity assessment of Zhenjiang aromatic vinegar and tea oil. By incorporating data augmentation and multimodal fusion strategies, including boxplot-based analysis of reconstruction errors and Local Outlier Factor-based processing of latent feature representations, the proposed method successfully identified all abnormal samples. Across different test scenarios, the model achieved a specificity of 100% and classification accuracies exceeding 93%. Although these results indicate strong discrimination capability, the near-perfect specificity was obtained under the reported test conditions, and its robustness to previously unseen adulteration types or independent sample batches remains unclear [34]. Recent studies have demonstrated that the integration of FS, PARAFAC, and ML provides a rapid, reliable, and non-destructive strategy for beverage identification, with promising applications in food quality control and authenticity evaluation [200]. However, the generalizability of such models may depend on the diversity of products and adulteration patterns represented in the training data.
Furthermore, ML-assisted FS can also support comprehensive evaluation of food quality and safety by enabling intelligent assessment of freshness, processing conditions, and potential safety risks through spectral analysis and predictive modelling [266]. For example, Zou et al. applied five preprocessing algorithms to reduce noise in the original fluorescence spectral data, effectively minimizing baseline drift and spectral tilt effects. Feature band selection revealed that the optimal spectral ranges for the binary and six-class classification models were 469–962 nm and 534–809 nm, respectively. PCA visualization further illustrated the distribution patterns of the six sample groups, confirming the feasibility of spectral-based classification. Based on the selected feature bands, the optimal binary classification model (MF-RF-RF) and six-class classification model (MF-XGBoost-LightGBM) both achieved 100% accuracy [254]. While this near-perfect accuracy demonstrates the strong discriminative capability of the proposed workflow, it should be interpreted cautiously because performance obtained from a specific sample set may not fully reflect model robustness for new samples or different measurement conditions. In addition, experimental studies have shown that polarization perturbation two-dimensional correlation FS enables reliable discrimination of different edible oils, further highlighting the potential of advanced fluorescence-based approaches for food authentication and quality control [267]. Further validation using independent samples would help determine whether these promising results can be maintained in practical applications.
5.2. Applications in Environmental Monitoring
Environmental monitoring is an essential component of pollution assessment and control, where rapid, accurate, and reliable analytical approaches are required for the detection and quantification of contaminants [30]. However, conventional monitoring methods often suffer from limitations such as complex operation procedures, time-consuming analysis, and high equipment costs, which restrict their applicability for large-scale and real-time monitoring [268]. In recent years, the integration of FS with ML algorithms has provided new opportunities for rapid and intelligent monitoring of pollutants in water, soil, and atmospheric environments [172,173,269]. By extracting multidimensional spectral features and uncovering complex patterns within fluorescence datasets, ML-assisted FS approaches can improve the accuracy, efficiency, and automation of pollution source identification and contaminant quantification, demonstrating significant potential for practical environmental monitoring applications [171].
In the field of air pollution source apportionment, ML-assisted FS enables the identification and quantification of particle emission sources by exploiting characteristic fluorescence spectral signatures. For example, Rutherford et al. combined EEM FS with ML approaches to identify vegetative burning sources in atmospheric particulate matter with high accuracy. In their study, 103 archived filter samples were analyzed, and principal component regression and CNN models were developed for source prediction. The results demonstrated that vegetative burning sources achieved the highest prediction performance, with a test set R2 value of 0.85, whereas mobile emission sources showed moderate predictive capability, with a test set R2 value of 0.51. These findings highlight the potential of ML-assisted fluorescence analysis for extracting source-specific spectral signatures and performing source apportionment of combustion-derived atmospheric particles [269].
Beyond atmospheric particulate source apportionment, ML-assisted spectral analysis also shows considerable practical value for pollution tracing and rapid quantitative assessment of heavy metal contamination in solid environmental matrices, such as soils. For example, Xia and co-workers evaluated the predictive performance of models for eight heavy metals using a portable X-ray fluorescence (pXRF) system combined with LR and multivariate adaptive regression splines. The results demonstrated that MARS significantly outperformed LR for predicting copper (Cu) and chromium (Cr) concentrations, achieving R2 values of 0.88 and 0.78, and RPD values of 2.89 and 2.11, respectively.
For datasets with low background concentrations, multivariate MARS models improved prediction performance based on pXRF spectral measurements, increasing R2 from 0.032 to 0.39 and RPD from approximately 0.35 to 0.37. For datasets with higher concentration levels, univariate MARS models were applied for Cu and Cr prediction, providing a simpler modeling strategy with reduced computational requirements. Overall, this study demonstrated that ML-based multivariate regression approaches can substantially enhance the quantitative interpretation of pXRF spectra for heavy metal assessment and provide robust, practical solutions for large-scale environmental monitoring across diverse sampling regions [270].
Beyond atmospheric particulate tracing, ML-assisted FS also provides a rapid and non-contact strategy for water pollution monitoring and assessment [271]. For example, Zhang and co-workers proposed a method for predicting biochemical oxygen demand (BOD5) by integrating 3D FS, PARAFAC, and ML algorithms, as illustrated in Figure 10. In this approach, PARAFAC was first employed to decompose the complex fluorescence signals, after which the maximum fluorescence intensities of three extracted components were selected as representative features. Subsequently, an RF model was developed to establish the relationship between these fluorescence features and BOD5 values. The results demonstrated that the RF model achieved reliable predictive performance, with a high coefficient of determination (R2 = 0.878) and a low MSE (MSE = 0.28). This study highlights the feasibility of rapid BOD5 prediction using non-contact fluorescence measurements, reducing the dependence on complicated conventional dissolved oxygen-based procedures. Therefore, this ML-assisted FS strategy provides an efficient solution for high-throughput water quality assessment and large-scale environmental monitoring [272].
Figure 10.
Predicted versus observed scatter plots of the RF regression model: (a) inputs: t, C1, C2, and C3; (b) inputs: t, C1, and C2. Reproduced from Figure 6 of Zhang et al. [272] under the Creative Commons CC BY license.
5.3. Critical Analysis of Model Performance and Generalizability
As illustrated by the studies discussed above, the size and composition of FS datasets vary substantially, which can influence the reported performance of ML models. Importantly, the number of acquired spectra should not be equated with the number of independent samples [273], because repeated measurements from the same physical sample may increase the apparent dataset size without providing an equivalent increase in sample diversity. This issue is particularly relevant to complex ML and DL models, for which a limited number of independent samples may increase the risk of overfitting. Therefore, future studies should report both the number of acquired spectra and the number of independent samples to provide a more meaningful assessment of dataset adequacy.
The reported performance metrics should also be interpreted in the context of the validation strategies employed. As shown in the applications discussed above, high classification accuracy or predictive performance does not necessarily indicate robust generalizability. In particular, near-perfect accuracy obtained from limited datasets or internal validation may not fully reflect model performance on independent samples [274]. Therefore, comparisons among ML models should consider not only accuracy, R2, or other performance metrics, but also dataset size, data partitioning strategy, and validation procedure. External validation using independent sample batches can provide stronger evidence of model reliability than performance evaluated solely within the original dataset [275].
More importantly, the practical value of ML-assisted FS lies in its generalizability beyond the conditions under which the model is developed. Fluorescence signals can be affected by sample composition, measurement conditions, instrument configuration, and experimental environment [276]. Accordingly, a model achieving excellent performance on a specific dataset may suffer performance degradation when applied to samples from different batches, instruments or laboratories.
Model selection should therefore be matched to the characteristics of FS data. Conventional models such as SVM and RF are often suitable for relatively small datasets, whereas CNN- and Transformer-based models generally benefit from larger and more diverse datasets [96]. Cross-batch, cross-instrument, and cross-laboratory validation should therefore be considered when assessing model generalizability and transferability [277].
These considerations further indicate that model selection should not depend merely on the highest reported predictive performance. Table 4 summarizes the key characteristics of six representative ML/DL model categories for FS analysis.
Table 4.
Comparison of representative ML/DL models for FS analysis. Data requirements and interpretability are qualitative assessments based on the cited literature.
6. Challenges and Future Perspectives
The preceding sections demonstrate the potential of ML-assisted FS for food safety and environmental monitoring, while also highlighting that the reported performance of these methods depends strongly on spectral characteristics, data quality, model selection, and validation strategies. Despite the rapid development of ML and FS technologies, several challenges remain before these approaches can be reliably transferred from laboratory studies to practical applications. These challenges involve not only spectral complexity and limited data availability, but also model generalizability, interpretability, standardization, and cross-instrument and cross-laboratory validation. To provide an overall perspective on these issues and the corresponding development pathways, Figure 11 presents a conceptual roadmap for the development of ML-enhanced FS toward reliable real-world applications.
Figure 11.
Conceptual roadmap for ML-enhanced FS. The framework summarizes the major FS modalities and applications, key challenges associated with spectral data and model development, corresponding ML approaches and emerging solutions, and future opportunities for standardized, interpretable, multimodal, and deployable analytical systems.
Figure 11 summarizes four interconnected aspects of ML-enhanced FS: the diversity of FS modalities and analytical tasks, the major challenges associated with spectral data and model development, the corresponding ML strategies and emerging solutions, and future opportunities for standardized, interpretable, and deployable analytical systems. Major FS modalities, including steady-state, time-resolved, synchronous, and fluorescence imaging techniques, provide complementary information for food safety assessment and environmental monitoring [163,171,269]. However, their practical implementation remains constrained by spectral complexity, matrix interference, limited independent samples, instrument variability, overfitting, and limited model interpretability and generalizability [96,204,277]. Accordingly, ML methods should be selected according to the characteristics of the spectral data and the analytical task, rather than solely on the basis of model complexity or reported predictive accuracy [96,280]. Classical chemometric and SL approaches can be effective for routine classification and quantitative prediction, whereas DL may provide advantages for complex and high-dimensional spectral and imaging data when sufficient and diverse training data are available [279,280]. Emerging strategies, including semi-/self-supervised learning, transfer learning, explainable AI, and adaptive learning, provide promising directions for addressing data scarcity, model interpretability, and cross-domain generalizability in spectroscopic analysis [146,168,204,281]. Future progress will depend on standardized spectral databases and evaluation protocols, robust and interpretable models, multimodal data fusion, and portable intelligent sensing platforms [90,281,282,283,284], ultimately facilitating the transition of ML-assisted FS from laboratory studies toward reliable, real-time, and on-site applications.
6.1. Practical and Technical Challenges
Although the integration of ML with FS has demonstrated significant advantages in food safety and environmental monitoring, several challenges remain that limit its widespread practical implementation. First, high-performance fluorescence detection instruments and related components are often associated with high acquisition and maintenance costs. Moreover, many important chemical contaminants lack intrinsic fluorescence activity, making their direct detection difficult and frequently requiring complex sample pretreatment procedures [155,156]. In addition, complex sample matrices, particularly in food systems, can generate strong endogenous fluorescence backgrounds, which complicate the extraction of weak target signals and reduce analytical reliability [153,154]. Furthermore, the acquisition of large-scale, high-quality spectral datasets is often time-consuming and resource-intensive, while the training and deployment of advanced ML models require substantial computational resources and specialized hardware. These limitations collectively hinder the standardization, reproducibility, scalability, and widespread application of ML-assisted FS technologies [151,152,163,285].
6.2. Emerging Strategies for Improving FS Analysis
To address these challenges, several emerging strategies have been explored to improve the practicality, predictive capability, and adaptability of ML-assisted FS.
- Portable Fluorescence Sensors: Yin et al. developed a ratiometric fluorescence-based sensing strategy and incorporated it into a compact, low-cost portable detection device. By integrating chemometric analysis with fluorescence signal processing, the system enabled sensitive phosphate detection while allowing visual recognition through fluorescence color changes. This approach provides a promising solution for rapid and on-site environmental monitoring applications [150].
- Multitask Learning: Jiang et al. developed a rapid and non-destructive quality assessment method for rapeseed oil by integrating ultraviolet FS with a multitask CNN. The proposed model incorporated multi-head attention mechanisms and residual connections. After optimization using SNV-SG preprocessing, it achieved excellent predictive performance, with an average correlation coefficient of 0.964. Furthermore, SHAP was introduced to improve model interpretability and reveal the contribution of spectral features to predictions [149].
- Transfer Learning: Using phenol detection in industrial wastewater as a case study, Chen et al. proposed a transfer learning framework specifically designed for small fluorescence spectral datasets. This strategy improved predictive accuracy under limited data conditions and demonstrated reliable performance when validated with real-world environmental samples, highlighting its potential for addressing data scarcity in practical FS applications [148].
- Model Fusion: Tang et al. proposed a hybrid neural network architecture combining U-Net and long short-term memory (LSTM) networks. By embedding LSTM modules into the U-Net framework, the model effectively captured both temporal dependencies and morphological characteristics of distorted pulse signals. In this architecture, U-Net was responsible for extracting and integrating time-dependent and structural features, while LSTM modeled sequential variations in pulse intensity, thereby improving signal reconstruction performance [98].
- Development of Advanced DL Models: Fan et al. proposed a multi-task freshness monitoring framework that integrates three-dimensional FS with DL for simultaneous multi-parameter prediction and three-stage freshness classification. The model achieved a maximum classification accuracy of 93.84%. Moreover, transfer learning was employed to evaluate cross-species adaptability, providing valuable insights into the development of advanced DL models capable of multi-task learning, cross-domain generalizability, and small-sample adaptation [164].
6.3. Standardization, Benchmarking, and Reproducibility
Despite the rapid development of ML-assisted FS, differences in instrumental configurations, measurement conditions, and preprocessing procedures remain major barriers to reproducible and transferable analysis [276,277]. To improve data comparability across studies, key experimental parameters, including excitation wavelength, emission range, spectral resolution, integration time, instrument configuration, calibration procedures, and preprocessing methods, should be reported in a standardized manner.
Instrument-to-instrument and laboratory-to-laboratory variability can further introduce distribution shifts and reduce model transferability [276,277]. Future studies should therefore emphasize cross-batch, cross-instrument, and cross-laboratory validation, together with calibration transfer, domain adaptation, and transfer learning strategies. Establishing benchmark datasets collected under diverse instrumental and laboratory conditions would also enable more reliable comparison of model robustness and generalizability.
Reproducibility can be further promoted through FAIR data-sharing practices [284]. Where possible, researchers should provide raw spectral data, relevant metadata, preprocessing procedures, model parameters, trained models, and source code. Such practices would facilitate independent verification, systematic benchmarking, and model reuse, thereby supporting the development of more reliable and transferable ML-assisted FS methods.
With continuous advances in ML algorithms and the development of miniaturized and portable detection devices [286,287], ML-assisted FS is expected to move toward real-time, on-site, and intelligent monitoring platforms [288]. Future research should focus on multi-source data integration, model interpretability, cross-domain transferability, standardization, and reproducible evaluation under diverse application conditions.
Here, multimodal data fusion refers to the joint use of FS and complementary spectroscopic or non-spectroscopic information within a unified analytical framework. Complementary spectral techniques, such as Raman, NIR, and IR spectroscopy, can provide molecular, compositional, or functional-group information that may not be fully captured by fluorescence measurements [44]. The contribution of additional spectral data is therefore problem-dependent. For example, Raman spectroscopy may be beneficial when structural information is insufficient, whereas NIR or IR spectroscopy may provide complementary information for complex food matrices or chemical composition. Such additional information may improve target identification, prediction accuracy, and model robustness, particularly when fluorescence signals are weak, highly overlapped, or affected by matrix interference [44,46]. However, additional data do not necessarily lead to better performance, especially when the information is redundant. Future studies should therefore quantify the contribution of each data source through controlled comparisons between single-modality and multimodal models using independent validation datasets.
These developments may provide a foundation for establishing reliable and scalable FS analytical systems for food safety and environmental monitoring [289].
7. Conclusions
In conclusion, this review has systematically examined recent advances in ML-assisted FS for food safety assessment and environmental monitoring, with emphasis on methodological development and practical applications. Major ML approaches, including SL, UL, SSL, RL, and DL, were reviewed in terms of their learning mechanisms, data requirements, and potential roles in fluorescence spectral analysis. The major stages of the ML-assisted FS workflow, including data partitioning, spectral preprocessing, feature extraction, classification and regression, model evaluation, and explainable artificial intelligence (XAI), were also summarized.
The reviewed studies demonstrate that the integration of ML with FS can enhance the analysis of complex fluorescence data and expand the capabilities of conventional FS. In food safety, ML-assisted FS has shown considerable potential for contaminant detection and quantification, food authenticity assessment, and quality evaluation. In environmental monitoring, it has been applied to the identification, quantification, and tracing of pollutants in complex matrices. SL remains widely applicable to classification and quantitative prediction, while unsupervised and SSL provide useful approaches for exploratory analysis and scenarios with limited labeled data. DL further offers opportunities for automated feature learning from complex spectral and spectral imaging data. Overall, these developments highlight the potential of ML-assisted FS as an effective analytical approach for extracting useful information from complex fluorescence measurements.
Despite these advances, several factors still need attention before ML-assisted FS can be more widely applied in practical settings. Dataset quality and representativeness, appropriate data partitioning, independent validation, and differences in instruments and analytical conditions can affect model reliability and transferability. Future studies should therefore emphasize robust validation, transparent reporting, and model selection suited to the available data and specific analytical objectives. These considerations are important for improving the reliability and practical applicability of ML-assisted FS.
Future development will benefit from continued advances in explainable AI, transfer learning, semi-/self-supervised learning, multimodal data fusion, and portable fluorescence sensing. The integration of complementary spectral or non-spectral information should be guided by the specific analytical problem and the additional information provided by each data source, rather than simply by increasing the number of data modalities. Future studies should further quantify the contribution of each additional data source through controlled single-modality and multimodal comparisons with independent validation. Meanwhile, standardized datasets, reproducible evaluation procedures, and effective data-sharing practices can improve comparability and facilitate model transfer across different applications. Overall, ML-assisted FS shows strong potential as a rapid, non-destructive, and intelligent analytical approach for food safety and environmental monitoring.
Author Contributions
H.Y., J.M. and J.C. contributed to data curation, investigation, methodology, software development, and preparation of the original draft. J.C. made substantial contributions during the revision of the manuscript. Z.W. contributed to conceptualization, funding acquisition, supervision, and review and editing of the manuscript, and provided overall guidance throughout the project. All authors have read and agreed to the published version of the manuscript.
Funding
This research was supported by the National Natural Science Foundation of China (Grant No. 12174155).
Institutional Review Board Statement
Not applicable.
Informed Consent Statement
Not applicable.
Data Availability Statement
The data presented in this study are available on request from the corresponding authors.
Conflicts of Interest
The authors declare no conflicts of interest.
Abbreviations
The following abbreviations are used in this manuscript:
| FS | Fluorescence spectroscopy |
| ML | Machine learning |
| EEM | Excitation–emission matrix |
| PCA | Principal component analysis |
| PARAFAC | Parallel factor analysis |
| PLS | Partial least squares |
| SVM | Support vector machine |
| RF | Random forest |
| KNN | K-nearest neighbor |
| CNN | Convolutional neural network |
| GNN | Graph neural network |
| LSTM | Long short-term memory |
| SDAE | Stacked denoising autoencoder |
| WT | Wavelet transform |
| SG | Savitzky–Golay |
| SNV | Standard normal variate |
| MSC | Multiplicative scatter correction |
| RMSE | Root mean square error |
References
- Wang, Y.; Zhang, Z.; Jia, W.; Ou, M.; Dong, X.; Dai, S. A Review of Environmental Sensing Technologies for Targeted Spraying in Orchards. Horticulturae 2025, 11, 551. [Google Scholar] [CrossRef] [Scilit]
- Song, S.-H.; Gao, Z.-F.; Guo, X.; Chen, G.-H. Aptamer-Based Detection Methodology Studies in Food Safety. Food Anal. Methods 2019, 12, 966–990. [Google Scholar] [CrossRef] [Scilit]
- Xu, Y.; Hassan, M.M.; Sharma, A.S.; Li, H.; Chen, Q. Recent advancement in nano-optical strategies for detection of pathogenic bacteria and their metabolites in food safety. Crit. Rev. Food Sci. Nutr. 2023, 63, 486–504. [Google Scholar] [CrossRef] [Scilit] [PubMed]
- Zhang, C.; Li, C.; Aliakbarlu, J.; Cui, H.; Lin, L. Typical application of electrostatic layer-by-layer self-assembly technology in food safety assurance. Trends Food Sci. Technol. 2022, 129, 88–97. [Google Scholar] [CrossRef] [Scilit]
- Wang, J.; Ahmad, W.; Mehedi Hassan, M.; Zareef, M.; Viswadevarayalu, A.; Arslan, M.; Li, H.; Chen, Q. Landing microextraction sediment phase onto surface enhanced Raman scattering to enhance sensitivity and selectivity for chromium speciation in food and environmental samples. Food Chem. 2020, 323, 126812. [Google Scholar] [CrossRef] [Scilit] [PubMed]
- Gao, Q.; Wang, Y.; Li, Y.; Yang, W.; Jiang, W.; Liang, Y.; Zhang, Z. Residue behaviors of six pesticides during apple juice production and storage. Food Res. Int. 2024, 177, 113894. [Google Scholar] [CrossRef] [Scilit] [PubMed]
- Liang, Y.; Duan, J.; Gao, Q.; Zhang, Z. Degradation of pesticides in wheat flour during noodle production and storage. Food Addit. Contam. Part A 2022, 39, 1239–1247. [Google Scholar] [CrossRef] [Scilit] [PubMed]
- Zhou, J.-W.; Zou, X.-M.; Song, S.-H.; Chen, G.-H. Quantum Dots Applied to Methodology on Detection of Pesticide and Veterinary Drug Residues. J. Agric. Food Chem. 2018, 66, 1307–1319. [Google Scholar] [CrossRef] [Scilit] [PubMed]
- Duan, J.; Gao, Q.; Shi, L.; Li, Y.; Zhang, Z.; Liang, Y. Residue changes of five pesticides during the production and storage of rice flour. Food Addit. Contam. Part A 2022, 39, 542–550. [Google Scholar] [CrossRef] [Scilit] [PubMed]
- Guo, Z.; Chen, P.; Yosri, N.; Chen, Q.; Elseedi, H.R.; Zou, X.; Yang, H. Detection of Heavy Metals in Food and Agricultural Products by Surface-enhanced Raman Spectroscopy. Food Rev. Int. 2023, 39, 1440–1461. [Google Scholar] [CrossRef] [Scilit]
- Wang, C.; Wu, B.; Jiang, K.; Wei, M.; Wang, S. Effects of different concentrations and types of Cu and Pb on soil N-fixing bacterial communities in the wheat rhizosphere. Appl. Soil Ecol. 2019, 144, 51–59. [Google Scholar] [CrossRef] [Scilit]
- Zhou, X.; Sun, J.; Tian, Y.; Lu, B.; Hang, Y.; Chen, Q. Hyperspectral technique combined with deep learning algorithm for detection of compound heavy metals in lettuce. Food Chem. 2020, 321, 126503. [Google Scholar] [CrossRef] [Scilit] [PubMed]
- Zhang, W.; Liu, C.; Liu, F.; Zou, X.; Xu, Y.; Xu, X. A smart-phone-based electrochemical platform with programmable solid-state-microwave flow digestion for determination of heavy metals in liquid food. Food Chem. 2020, 303, 125378. [Google Scholar] [CrossRef] [Scilit] [PubMed]
- Oplatowska-Stachowiak, M.; Elliott, C.T. Food colors: Existing and emerging food safety concerns. Crit. Rev. Food Sci. Nutr. 2017, 57, 524–548. [Google Scholar] [CrossRef] [Scilit] [PubMed]
- Fu, Y.; Zhao, C.; Lu, X.; Xu, G. Nontargeted screening of chemical contaminants and illegal additives in food based on liquid chromatography–high resolution mass spectrometry. TrAC Trends Anal. Chem. 2017, 96, 89–98. [Google Scholar] [CrossRef] [Scilit]
- Li, L.; Zhang, M.; Chen, W. Gold nanoparticle-based colorimetric and electrochemical sensors for the detection of illegal food additives. J. Food Drug Anal. 2020, 28, 642–654. [Google Scholar] [CrossRef] [Scilit] [PubMed]
- Li, R.; Lou, M.; He, W.; Quan, S. Sensing Cellular Damages Induced by Food Safety Hazards Using Bacterial Stress-Responsive Biosensors. Biosensors 2025, 15, 695. [Google Scholar] [CrossRef] [Scilit] [PubMed]
- Shi, C.; Chen, Y.; Li, C.; Al-Asmari, F.; Cui, H.; Lin, L. Potential Application of Lactiplantibacillus plantarum in Food Bio-preservation—A Comprehensive Review with a Focus on the Antibacterial and Anti-Virulence Effects on Foodborne Pathogens. Food Rev. Int. 2024, 40, 2993–3019. [Google Scholar] [CrossRef] [Scilit]
- Cui, H.; Li, W.; Li, C.; Lin, L. Synergistic effect between Helichrysum italicum essential oil and cold nitrogen plasma against Staphylococcus aureus biofilms on different food-contact surfaces. Int. J. Food Sci. Technol. 2016, 51, 2493–2501. [Google Scholar] [CrossRef] [Scilit]
- Zhang, Q.; Ashraf, J.; Xu, B. Natural solutions for food safety: Antibacterial activity of xanthohumol against food spoilage microorganisms and foodborne pathogens and its application prospect in food. Food Biosci. 2025, 63, 105767. [Google Scholar] [CrossRef] [Scilit]
- Lu, R.; Liu, Z.; Shao, Y.; Su, J.; Li, X.; Sun, F.; Zhang, Y.; Li, S.; Zhang, Y.; Cui, J.; et al. Nitric Oxide Enhances Rice Resistance to Rice Black-Streaked Dwarf Virus Infection. Rice 2020, 13, 24. [Google Scholar] [CrossRef] [Scilit] [PubMed]
- Xie, Y.; Du, X.; Li, D.; Wang, X.; Xu, C.; Zhang, C.; Sun, A.; Schmidt, S.; Liu, X. Seasonal occurrence and abundance of norovirus in pre- and postharvest lettuce samples in Nanjing, China. LWT 2021, 152, 112226. [Google Scholar] [CrossRef] [Scilit]
- Xu, C.; Lu, C.; Piao, J.; Wang, Y.; Zhou, T.; Zhou, Y.; Li, S. Rice virus release from the planthopper salivary gland is independent of plant tissue recognition by the stylet. Pest Manag. Sci. 2020, 76, 3208–3216. [Google Scholar] [CrossRef] [Scilit] [PubMed]
- Wang, Y.; Song, L.; Zhao, L.; Yu, W.; Zhao, T. Development of a Gene-Based High Resolution Melting (HRM) Marker for Selecting the Gene ty-5 Conferring Resistance to Tomato Yellow Leaf Curl Virus. Horticulturae 2022, 8, 112. [Google Scholar] [CrossRef] [Scilit]
- Sambandam, M.; Mishra, P.; Ikenoue, T.; Nakajima, R.; Itoh, M.; Dhineka, K.; Kaviarasan, T.; Marigoudar, S.R. Microplastic contamination in the western Arctic water column: A transition from pristine to polluted. Chemosphere 2025, 385, 144577. [Google Scholar] [CrossRef] [Scilit] [PubMed]
- Thompson, R.B.; Incrocci, L.; van Ruijven, J.; Massa, D. Reducing contamination of water bodies from European vegetable production systems. Agric. Water Manag. 2020, 240, 106258. [Google Scholar] [CrossRef] [Scilit]
- Xiao, L.; Liu, J.; Ge, J. Dynamic game in agriculture and industry cross-sectoral water pollution governance in developing countries. Agric. Water Manag. 2021, 243, 106417. [Google Scholar] [CrossRef] [Scilit]
- Cheng, P.; Chen, J.; Xu, R.; Tian, Q.; Luo, X.; Dai, Z.; Li, Z.; Lu, Y.; Li, L.; Cheng, K.; et al. Biochar and iron minerals facilitate the reduction of pollution and sequestration of carbon in chloramphenicol-contaminated soil under dry conditions. Appl. Soil Ecol. 2025, 215, 106458. [Google Scholar] [CrossRef] [Scilit]
- El-Sharkawy, M.; Li, J.; Kamal, N.; Mahmoud, E.; Omara, A.E.-D.; Du, D. Assessing and Predicting Soil Quality in Heavy Metal-Contaminated Soils: Statistical and ANN-Based Techniques. J. Soil Sci. Plant Nutr. 2023, 23, 6510–6526. [Google Scholar] [CrossRef] [Scilit]
- Khan, I.; Tariq, M.; Alabbosh, K.F.; Rehman, A.; Jalal, A.; Khan, A.A.; Farooq, M.; Li, G.; Iqbal, B.; Ahmad, N.; et al. Soil microplastics: Impacts on greenhouse gasses emissions, carbon cycling, microbial diversity, and soil characteristics. Appl. Soil Ecol. 2024, 197, 105343. [Google Scholar] [CrossRef] [Scilit]
- Brunekreef, B.; Holgate, S.T. Air pollution and health. Lancet 2002, 360, 1233–1242. [Google Scholar] [CrossRef] [Scilit] [PubMed]
- Koenig, J.Q. Air pollution and asthma. J. Allergy Clin. Immunol. 1999, 104, 717–722. [Google Scholar] [CrossRef] [Scilit] [PubMed]
- Munshed, M.; Van Griensven Thé, J.; Fraser, R.; Matthews, B.; Elkamel, A. Country-Wide Ecological Health Assessment Methodology for Air Toxics: Bridging Gaps in Ecosystem Impact Understanding and Policy Foundations. Toxics 2024, 12, 42. [Google Scholar] [CrossRef] [Scilit] [PubMed]
- Zhang, X.; Yang, N.; Ma, J.; Chen, J.; Gong, J.; Xie, Z.; Zhang, S.; Liao, Q.; Chen, Y. Room-temperature synthesis of sulfonated covalent organic framework for efficient enrichment of trace brominated phenols in aquatic products. J. Chromatogr. A 2025, 1757, 466102. [Google Scholar] [CrossRef] [Scilit] [PubMed]
- Zacharioudaki, D.-E.; Fitilis, I.; Kotti, M. Review of Fluorescence Spectroscopy in Environmental Quality Applications. Molecules 2022, 27, 4801. [Google Scholar] [CrossRef] [Scilit] [PubMed]
- Wang, L.; Huang, X.; Wang, C.; Tian, X.; Chang, X.; Ren, Y.; Yu, S. Applications of surface functionalized Fe3O4 NPs-based detection methods in food safety. Food Chem. 2021, 342, 128343. [Google Scholar] [CrossRef] [Scilit] [PubMed]
- Lu, Y.; Chen, B.; Yu, M.; Han, J.; Wang, Y.; Tan, Z.; Yan, Y. Simultaneous separation/enrichment and detection of trace ciprofloxacin and lomefloxacin in food samples using thermosensitive smart polymers aqueous two-phase flotation system combined with HPLC. Food Chem. 2016, 210, 1–8. [Google Scholar] [CrossRef] [Scilit] [PubMed]
- Zhang, B.; Liu, W.; Liu, Z.; Fu, X.; Du, D. High-performance liquid chromatography for the sensitive zearalenone determination by the automated immunomagnetic beads purifier for one-step sample pre-treatment. Eur. Food Res. Technol. 2022, 248, 109–117. [Google Scholar] [CrossRef] [Scilit]
- Boateng, I.D.; Soetanto, D.A.; Li, F.; Yang, X.-M.; Li, Y.-Y. Separation and purification of polyprenols from Ginkgo biloba L. leaves by bulk ionic liquid membrane and optimizing parameters. Ind. Crops Prod. 2021, 170, 113828. [Google Scholar] [CrossRef] [Scilit]
- Ma, S.; Wang, M.; You, T.; Wang, K. Using Magnetic Multiwalled Carbon Nanotubes as Modified QuEChERS Adsorbent for Simultaneous Determination of Multiple Mycotoxins in Grains by UPLC-MS/MS. J. Agric. Food Chem. 2019, 67, 8035–8044. [Google Scholar] [CrossRef] [Scilit] [PubMed]
- Xiao, Z.; Hou, X.; Zhang, T.; Yuan, Y.; Xiao, J.; Song, W.; Yue, T. Starch-digesting product analysis based on the hydrophilic interaction liquid chromatography coupled mass spectrometry method to evaluate the inhibition of flavonoids on pancreatic α-amylase. Food Chem. 2022, 372, 131175. [Google Scholar] [CrossRef] [Scilit] [PubMed]
- Sun, J.; Mu, Y.; Liu, T.; Jing, H.; Obadi, M.; Yang, Y.; Dong, S.; Xu, B. Evaluation of glycation reaction of ovalbumin with dextran: Glycation sites identification by capillary liquid chromatography coupled with tandem mass spectrometry. Food Chem. 2021, 341, 128066. [Google Scholar] [CrossRef] [Scilit] [PubMed]
- Bassey, A.P.; Zhang, Y.; Zhu, Y.; Cui, X.; Zhang, X.; Corradini, M.G.; Singh, M.; Liu, X.; Zhang, H. Tandem mass tag-based quantitative proteomics elucidates the inactivation mechanisms of high-power pulsed microwave treatment on Pseudomonas aeruginosa PAO1. Innov. Food Sci. Emerg. Technol. 2024, 91, 103532. [Google Scholar] [CrossRef] [Scilit]
- Turner, N.W.; Subrahmanyam, S.; Piletsky, S.A. Analytical methods for determination of mycotoxins: A review. Anal. Chim. Acta 2009, 632, 168–180. [Google Scholar] [CrossRef] [Scilit] [PubMed]
- Liu, S.; Jiang, S.; Yao, Z.; Liu, M. Aflatoxin detection technologies: Recent advances and future prospects. Environ. Sci. Pollut. Res. 2023, 30, 79627–79653. [Google Scholar] [CrossRef] [Scilit] [PubMed]
- Kumar, A.; Pathak, H.; Bhadauria, S.; Sudan, J. Aflatoxin contamination in food crops: Causes, detection, and management: A review. Food Prod. Process. Nutr. 2021, 3, 17. [Google Scholar] [CrossRef] [Scilit]
- Zeng, K.; Wei, W.; Jiang, L.; Zhu, F.; Du, D. Use of Carbon Nanotubes as a Solid Support To Establish Quantitative (Centrifugation) and Qualitative (Filtration) Immunoassays to Detect Gentamicin Contamination in Commercial Milk. J. Agric. Food Chem. 2016, 64, 7874–7881. [Google Scholar] [CrossRef] [Scilit] [PubMed]
- Zhang, C.; Han, Y.; Lin, L.; Deng, N.; Chen, B.; Liu, Y. Development of Quantum Dots-Labeled Antibody Fluorescence Immunoassays for the Detection of Morphine. J. Agric. Food Chem. 2017, 65, 1290–1295. [Google Scholar] [CrossRef] [Scilit] [PubMed]
- Marimuthu, M.; Xu, K.; Song, W.; Chen, Q.; Wen, H. Safeguarding food safety: Nanomaterials-based fluorescent sensors for pesticide tracing. Food Chem. 2025, 463, 141288. [Google Scholar] [CrossRef] [Scilit] [PubMed]
- Adade, S.Y.-S.S.; Lin, H.; Johnson, N.A.N.; Nunekpeku, X.; Ekumah, J.-N.; Kwadzokpui, B.A.; Teye, E.; Ahmad, W.; Chen, Q. Spectroscopic techniques for edible oil evaluation—Technology overview and recent applications from lab to industry. Food Control 2025, 176, 111352. [Google Scholar] [CrossRef] [Scilit]
- Wang, J.; Chen, Q.; Belwal, T.; Lin, X.; Luo, Z. Insights into chemometric algorithms for quality attributes and hazards detection in foodstuffs using Raman/surface enhanced Raman spectroscopy. Compr. Rev. Food Sci. Food Saf. 2021, 20, 2476–2507. [Google Scholar] [CrossRef] [Scilit] [PubMed]
- Guo, Z.; Wang, M.; Wu, J.; Tao, F.; Chen, Q.; Wang, Q.; Ouyang, Q.; Shi, J.; Zou, X. Quantitative assessment of zearalenone in maize using multivariate algorithms coupled to Raman spectroscopy. Food Chem. 2019, 286, 282–288. [Google Scholar] [CrossRef] [Scilit] [PubMed]
- Shi, T.; Yuan, L.; Mu, J.; Gao, R. The effect of Arginine, Lysine and Histidine in the myosin secondary structure by circular dichroism and Raman spectroscopy. CyTA-J. Food 2019, 17, 656–660. [Google Scholar] [CrossRef] [Scilit]
- Farag, M.A.; Sheashea, M.; Zhao, C.; Maamoun, A.A. UV Fingerprinting Approaches for Quality Control Analyses of Food and Functional Food Coupled to Chemometrics: A Comprehensive Analysis of Novel Trends and Applications. Foods 2022, 11, 2867. [Google Scholar] [CrossRef] [Scilit] [PubMed]
- Dong, C.; Zhu, H.; Wang, J.; Yuan, H.; Zhao, J.; Chen, Q. Prediction of black tea fermentation quality indices using NIRS and nonlinear tools. Food Sci. Biotechnol. 2017, 26, 853–860. [Google Scholar] [CrossRef] [Scilit] [PubMed]
- Yahui, L.; Xiaobo, Z.; Tingting, S.; Jiyong, S.; Jiewen, Z.; Holmes, M. Determination of Geographical Origin and Anthocyanin Content of Black Goji Berry (Lycium ruthenicum Murr.) Using Near-Infrared Spectroscopy and Chemometrics. Food Anal. Methods 2017, 10, 1034–1044. [Google Scholar] [CrossRef] [Scilit]
- Zheng, P.; Solomon Adade, S.Y.-S.; Rong, Y.; Zhao, S.; Han, Z.; Gong, Y.; Chen, X.; Yu, J.; Huang, C.; Lin, H. Online System for Monitoring the Degree of Fermentation of Oolong Tea Using Integrated Visible–Near-Infrared Spectroscopy and Image-Processing Technologies. Foods 2024, 13, 1708. [Google Scholar] [CrossRef] [Scilit] [PubMed]
- Lin, H.; Jiang, H.; Lin, J.; Chen, Q.; Ali, S.; Teng, S.W.; Zuo, M. Rice Freshness Identification Based on Visible Near-Infrared Spectroscopy and Colorimetric Sensor Array. Food Anal. Methods 2021, 14, 1305–1314. [Google Scholar] [CrossRef] [Scilit]
- Tingting, S.; Xiaobo, Z.; Jiyong, S.; Zhihua, L.; Xiaowei, H.; Yiwei, X.; Wu, C. Determination Geographical Origin and Flavonoids Content of Goji Berry Using Near-Infrared Spectroscopy and Chemometrics. Food Anal. Methods 2016, 9, 68–79. [Google Scholar] [CrossRef] [Scilit]
- Boukria, O.; Boudalia, S.; Bhat, Z.F.; Hassoun, A.; Aït-Kaddour, A. Evaluation of the adulteration of camel milk by non-camel milk using multispectral image, fluorescence and infrared spectroscopy. Spectrochim. Acta Part A Mol. Biomol. Spectrosc. 2023, 300, 122932. [Google Scholar] [CrossRef] [Scilit] [PubMed]
- Deng, J.; Jiang, H.; Chen, Q. Enhancing Fourier Transform Near-infrared Spectroscopy with Explainable Ensemble Learning Methods for Detecting Mineral Oil Contamination in Corn Oil. J. Food Compos. Anal. 2025, 143, 107594. [Google Scholar] [CrossRef] [Scilit]
- Tahir, H.E.; Xiaobo, Z.; Zhihua, L.; Jiyong, S.; Zhai, X.; Wang, S.; Mariod, A.A. Rapid prediction of phenolic compounds and antioxidant activity of Sudanese honey using Raman and Fourier transform infrared (FT-IR) spectroscopy. Food Chem. 2017, 226, 202–211. [Google Scholar] [CrossRef] [Scilit] [PubMed]
- Hu, X.; Shi, J.; Zhang, F.; Zou, X.; Holmes, M.; Zhang, W.; Huang, X.; Cui, X.; Xue, J. Determination of Retrogradation Degree in Starch by Mid-infrared and Raman Spectroscopy during Storage. Food Anal. Methods 2017, 10, 3694–3705. [Google Scholar] [CrossRef] [Scilit]
- Jayan, H.; Yin, L.; Zhou, R.; Zou, X.; Guo, Z. Future horizons of Raman spectroscopy in food science: Emerging techniques and innovations for enhanced analysis. Food Chem. 2025, 493, 145777. [Google Scholar] [CrossRef] [Scilit] [PubMed]
- Qi, Y.; Hu, D.; Jiang, Y.; Wu, Z.; Zheng, M.; Chen, E.X.; Liang, Y.; Sadi, M.A.; Zhang, K.; Chen, Y.P. Recent Progresses in Machine Learning Assisted Raman Spectroscopy. Adv. Opt. Mater. 2023, 11, 2203104. [Google Scholar] [CrossRef] [Scilit]
- Jiang, L.; Hassan, M.M.; Ali, S.; Li, H.; Sheng, R.; Chen, Q. Evolving trends in SERS-based techniques for food quality and safety: A review. Trends Food Sci. Technol. 2021, 112, 225–240. [Google Scholar] [CrossRef] [Scilit]
- Arslan, M.; Xiaobo, Z.; Tahir, H.E.; Xuetao, H.; Rakha, A.; Basheer, S.; Hao, Z. Near-infrared spectroscopy coupled chemometric algorithms for prediction of antioxidant activity of black goji berries (Lycium ruthenicum Murr.). J. Food Meas. Charact. 2018, 12, 2366–2376. [Google Scholar] [CrossRef] [Scilit]
- Arslan, M.; Xiaobo, Z.; Tahir, H.E.; Xuetao, H.; Rakha, A.; Zareef, M.; Seweh, E.; Basheer, S. NIR Spectroscopy Coupled Chemometric Algorithms for Rapid Antioxidants Activity Assessment of Chinese Dates (Zizyphus Jujuba Mill.). Int. J. Food Eng. 2019, 15, 20180148. [Google Scholar] [CrossRef] [Scilit]
- Liu, T.; He, J.; Yao, W.; Jiang, H.; Chen, Q. Determination of aflatoxin B1 value in corn based on Fourier transform near-infrared spectroscopy: Comparison of optimization effect of characteristic wavelengths. LWT 2022, 164, 113657. [Google Scholar] [CrossRef] [Scilit]
- Deng, J.; Jiang, H.; Chen, Q. Qualitative and quantitative analysis of mineral oil pollution in peanut oil by Fourier transform near-infrared spectroscopy. Food Chem. 2025, 469, 142590. [Google Scholar] [CrossRef] [Scilit] [PubMed]
- Luo, W.; Deng, J.; Li, C.; Jiang, H. Quantitative Analysis of Peanut Skin Adulterants by Fourier Transform Near-Infrared Spectroscopy Combined with Chemometrics. Foods 2025, 14, 466. [Google Scholar] [CrossRef] [Scilit] [PubMed]
- Gu, H.; Huang, X.; Chen, Q.; Sun, Y. Rapid Assessment of Total Polar Material in Used Frying Oils Using Manganese Tetraphenylporphyrin Fluorescent Sensor with Enhanced Sensitivity. Food Anal. Methods 2020, 13, 2080–2086. [Google Scholar] [CrossRef] [Scilit]
- Huang, X.; Sun, W.; Li, Z.; Shi, J.; Zhang, N.; Zhang, Y.; Zhai, X.; Hu, X.; Zou, X. Hydrogen sulfide gas sensing toward on-site monitoring of chilled meat spoilage based on ratio-type fluorescent probe. Food Chem. 2022, 396, 133654. [Google Scholar] [CrossRef] [Scilit] [PubMed]
- Long, L.; Cao, S.; Jin, B.; Yuan, X.; Han, Y.; Wang, K. Construction of a Novel Fluorescent Probe for On-site Measuring Hydrogen Sulfide Levels in Food Samples. Food Anal. Methods 2019, 12, 852–858. [Google Scholar] [CrossRef] [Scilit]
- Koch, M.; Ntziachristos, V. Advancing Surgical Vision with Fluorescence Imaging. Annu. Rev. Med. 2016, 67, 153–164. [Google Scholar] [CrossRef] [Scilit] [PubMed]
- Bertani, F.R.; Mencattini, A.; Gambacorta, L.; De Ninno, A.; Businaro, L.; Solfrizzo, M.; Gerardino, A.; Martinelli, E. Aflatoxins detection in almonds via fluorescence imaging and deep neural network approach. J. Food Compos. Anal. 2024, 125, 105850. [Google Scholar] [CrossRef] [Scilit]
- Yang, R.; Mu, W.-Y.; Chen, Q.-Y. Urazole-Au Nanocluster as a Novel Fluorescence Probe for Curcumin Determination and Mitochondria Imaging. Food Anal. Methods 2019, 12, 1805–1812. [Google Scholar] [CrossRef] [Scilit]
- Li, Y.; Sun, J.; Wu, X.; Chen, Q.; Lu, B.; Dai, C. Detection of viability of soybean seed based on fluorescence hyperspectra and CARS-SVM-AdaBoost model. J. Food Process. Preserv. 2019, 43, e14238. [Google Scholar] [CrossRef] [Scilit]
- Li, Y.; Sun, J.; Wu, X.; Lu, B.; Wu, M.; Dai, C. Grade Identification of Tieguanyin Tea Using Fluorescence Hyperspectra and Different Statistical Algorithms. J. Food Sci. 2019, 84, 2234–2241. [Google Scholar] [CrossRef] [Scilit] [PubMed]
- Cheng, J.; Sun, J.; Yao, K.; Xu, M.; Zhou, X. Nondestructive detection and visualization of protein oxidation degree of frozen-thawed pork using fluorescence hyperspectral imaging. Meat Sci. 2022, 194, 108975. [Google Scholar] [CrossRef] [Scilit] [PubMed]
- Ullah, R.; Khan, S.; Ali, H.; Bilal, M. Potentiality of using front face fluorescence spectroscopy for quantitative analysis of cow milk adulteration in buffalo milk. Spectrochim. Acta Part A Mol. Biomol. Spectrosc. 2020, 225, 117518. [Google Scholar] [CrossRef] [Scilit] [PubMed]
- Liu, H.; Zhang, Z.; Jing, Y.; Cai, G.; Li, J.; Zhang, L.; Zhao, L.; Li, J. Rapid and non-destructive detection of benzo[a]pyrene in edible oils using excitation-emission matrix fluorescence spectroscopy combined with parallel factor analysis. Food Chem. 2026, 504, 147904. [Google Scholar] [CrossRef] [Scilit] [PubMed]
- Fu, Y.; Liu, T.; Zhang, Z.; Li, H.; Li, W.; Huang, M. The crosstalk fluorescence spectroscopy analysis principle and an accurate fluorescence quantitative method for multi-composition fluorescence substances. Spectrochim. Acta Part A Mol. Biomol. Spectrosc. 2022, 280, 121472. [Google Scholar] [CrossRef] [Scilit] [PubMed]
- Savić, A.; Kardos, R.; Nyitrai, M.; Radotić, K. Decomposition of Complex Fluorescence Spectra Containing Components with Close Emission Maxima Positions and Similar Quantum Yields. Application to Fluorescence Spectra of Proteins. J. Fluoresc. 2013, 23, 605–610. [Google Scholar] [CrossRef] [Scilit] [PubMed]
- Hu, Y.; Zhao, D.; Qin, Y.; Wang, X. An enhancement approach of fluorescence signatures in excitation emission matrixes for water contaminant analysis. Water Res. 2020, 169, 115271. [Google Scholar] [CrossRef] [Scilit] [PubMed]
- Radotić, K.; Stanković, M.; Bartolić, D.; Natić, M. Intrinsic Fluorescence Markers for Food Characteristics, Shelf Life, and Safety Estimation: Advanced Analytical Approach. Foods 2023, 12, 3023. [Google Scholar] [CrossRef] [Scilit] [PubMed]
- Venturini, F.; Fluri, S.; Mejari, M.; Baumgartner, M.; Piga, D.; Michelucci, U. Shedding light on the ageing of extra virgin olive oil: Probing the impact of temperature with fluorescence spectroscopy and machine learning techniques. LWT 2024, 191, 115679. [Google Scholar] [CrossRef] [Scilit]
- Kakani, V.; Nguyen, V.H.; Kumar, B.P.; Kim, H.; Pasupuleti, V.R. A critical review on computer vision and artificial intelligence in food industry. J. Agric. Food Res. 2020, 2, 100033. [Google Scholar] [CrossRef] [Scilit]
- Wang, C.; Yan, Z.; Shen, F.; Hu, Q.; Huang, X. Enhanced detection of aflatoxin B1 in single peanut kernels using laser-induced fluorescence and a weighted algorithm. Food Control 2025, 174, 111255. [Google Scholar] [CrossRef] [Scilit]
- Li, Z.; Deng, W.; Zhao, J.; Kong, Y. Spectroscopy-multimodal data fusion empowers smart food quality analysis: Challenges and prospects. Food Chem. X 2026, 36, 103939. [Google Scholar] [CrossRef] [Scilit] [PubMed]
- Shi, L.; Sun, J.; Cong, S.; Zhang, B.; Zhou, X.; Wu, X. Nondestructive detection of trace cadmium in lettuce leaves using deep fusion of fluorescence hyperspectral imaging and near-infrared spectroscopy. J. Food Compos. Anal. 2025, 147, 108038. [Google Scholar] [CrossRef] [Scilit]
- He, J.-R.; Wei, J.-W.; Chen, S.-Y.; Li, N.; Zhong, X.-D.; Li, Y.-Q. Machine Learning-Assisted Synchronous Fluorescence Sensing Approach for Rapid and Simultaneous Quantification of Thiabendazole and Fuberidazole in Red Wine. Sensors 2022, 22, 9979. [Google Scholar] [CrossRef] [Scilit] [PubMed]
- Baek, W.-K.; Jung, H.-S. Performance Comparison of Oil Spill and Ship Classification from X-Band Dual- and Single-Polarized SAR Image Using Support Vector Machine, Random Forest, and Deep Neural Network. Remote Sens. 2021, 13, 3203. [Google Scholar] [CrossRef] [Scilit]
- Sun, J.; Nirere, A.; Dusabe, K.D.; Yuhao, Z.; Adrien, G. Rapid and nondestructive watermelon (Citrullus lanatus) seed viability detection based on visible near-infrared hyperspectral imaging technology and machine learning algorithms. J. Food Sci. 2024, 89, 4403–4418. [Google Scholar] [CrossRef] [Scilit] [PubMed]
- Wang, Y.; Wang, Y.; Wang, A.; Humayun, M.; Bououdina, M. Machine learning advances in food detection technologies. J. Food Compos. Anal. 2025, 148, 108596. [Google Scholar] [CrossRef] [Scilit]
- Yuan, Y.; Ji, Z.; Fan, Y.; Xu, Q.; Shi, C.; Lyu, J.; Ertbjerg, P. Deep learning-assisted fluorescence spectroscopy for food quality and safety analysis. Trends Food Sci. Technol. 2025, 156, 104821. [Google Scholar] [CrossRef] [Scilit]
- Zhong, J.; Zhu, W.; Shen, S.; Zhou, N.; Xi, M.; Du, K.; Wang, D.; Tang, B.Z. Machine Learning for Organic Fluorescent Materials. Aggregate 2025, 6, e70089. [Google Scholar] [CrossRef] [Scilit]
- Tang, L.; Zhou, S.; Shi, K.-B.; Shen, H.-T.; You, L. Application of a neural network model with multimodal fusion for fluorescence spectroscopy. Nucl. Sci. Tech. 2024, 35, 178. [Google Scholar] [CrossRef] [Scilit]
- von Lilienfeld, O.A. Introducing Machine Learning: Science and Technology. Mach. Learn. Sci. Technol. 2020, 1, 010201. [Google Scholar] [CrossRef] [Scilit]
- Zhou, Z.-H. A brief introduction to weakly supervised learning. Natl. Sci. Rev. 2018, 5, 44–53. [Google Scholar] [CrossRef] [Scilit]
- Bertolini, M.; Mezzogori, D.; Neroni, M.; Zammori, F. Machine Learning for industrial applications: A comprehensive literature review. Expert Syst. Appl. 2021, 175, 114820. [Google Scholar] [CrossRef] [Scilit]
- Rajković, D.; Marjanović Jeromela, A.; Pezo, L.; Lončar, B.; Grahovac, N.; Kondić Špika, A. Artificial neural network and random forest regression models for modelling fatty acid and tocopherol content in oil of winter rapeseed. J. Food Compos. Anal. 2023, 115, 105020. [Google Scholar] [CrossRef] [Scilit]
- Lu, C.-H.; Li, B.-Q.; Jing, Q.; Pei, D.; Huang, X.-Y. A classification and identification model of extra virgin olive oil adulterated with other edible oils based on pigment compositions and support vector machine. Food Chem. 2023, 420, 136161. [Google Scholar] [CrossRef] [Scilit] [PubMed]
- Elbeltagi, A.; Srivastava, A.; Deng, J.; Li, Z.; Raza, A.; Khadke, L.; Yu, Z.; El-Rawy, M. Forecasting vapor pressure deficit for agricultural water management using machine learning in semi-arid environments. Agric. Water Manag. 2023, 283, 108302. [Google Scholar] [CrossRef] [Scilit]
- Wang, H.; Gu, J.; Wang, M. A review on the application of computer vision and machine learning in the tea industry. Front. Sustain. Food Syst. 2023, 7, 1172543. [Google Scholar] [CrossRef] [Scilit]
- Slavova, V.; Ropelewska, E.; Sabanci, K. The application of fluorescence spectroscopy and machine learning as non-destructive approach to distinguish two different varieties of greenhouse tomatoes. Eur. Food Res. Technol. 2023, 249, 3239–3245. [Google Scholar] [CrossRef] [Scilit]
- Ahmad, H.; Sun, J.; Nirere, A.; Shaheen, N.; Zhou, X.; Yao, K. Classification of tea varieties based on fluorescence hyperspectral image technology and ABC-SVM algorithm. J. Food Process. Preserv. 2021, 45, e15241. [Google Scholar] [CrossRef] [Scilit]
- Barlow, H.B. Unsupervised Learning. Neural Comput. 1989, 1, 295–311. [Google Scholar] [CrossRef] [Scilit]
- Gan, G.; Valdez, E.A. Data Clustering with Actuarial Applications. N. Am. Actuar. J. 2020, 24, 168–186. [Google Scholar] [CrossRef] [Scilit]
- Zhang, Q.; Chen, Q.; Xu, L.; Xu, X.; Liang, Z. Wheat Lodging Direction Detection for Combine Harvesters Based on Improved K-Means and Bag of Visual Words. Agronomy 2023, 13, 2227. [Google Scholar] [CrossRef] [Scilit]
- Al-Mahasneh, M.; Al-U’datt, M.; Rababah, T.; Al-Widyan, M.; Abu Kaeed, A.; Al-Mahasneh, A.J.; Abu-Khalaf, N. Classification and Prediction of Bee Honey Indirect Adulteration Using Physiochemical Properties Coupled with K-Means Clustering and Simulated Annealing-Artificial Neural Networks (SA-ANNs). J. Food Qual. 2021, 2021, 6634598. [Google Scholar] [CrossRef] [Scilit]
- Bock, F. Hierarchy cost of hierarchical clusterings. J. Comb. Optim. 2022, 44, 617–634. [Google Scholar] [CrossRef] [Scilit]
- Świechowski, M.; Godlewski, K.; Sawicki, B.; Mańdziuk, J. Monte Carlo Tree Search: A review of recent modifications and applications. Artif. Intell. Rev. 2023, 56, 2497–2562. [Google Scholar] [CrossRef] [Scilit]
- Fang, H.; Hu, J.; Chen, X.; Zhang, Q.; Bai, J. DBSCAN-MFI Based Improved Clustering for Field-Road Classification in Mechanical Residual Film Recovery. Agriculture 2025, 15, 1651. [Google Scholar] [CrossRef] [Scilit]
- Birant, D.; Kut, A. ST-DBSCAN: An algorithm for clustering spatial–temporal data. Data Knowl. Eng. 2007, 60, 208–221. [Google Scholar] [CrossRef] [Scilit]
- Licciardi, G.; Chanussot, J. Spectral transformation based on nonlinear principal component analysis for dimensionality reduction of hyperspectral images. Eur. J. Remote Sens. 2018, 51, 375–390. [Google Scholar] [CrossRef] [Scilit]
- Yao, K.; Sun, J.; Tang, N.; Xu, M.; Cao, Y.; Fu, L.; Zhou, X.; Wu, X. Nondestructive detection for Panax notoginseng powder grades based on hyperspectral imaging technology combined with CARS-PCA and MPA-LSSVM. J. Food Process Eng. 2021, 44, e13718. [Google Scholar] [CrossRef] [Scilit]
- Zhao, Y.; Zeng, Y.; Li, X.; Yuan, K.; Li, Y.; Tian, L.; Sun, J.; Bai, W. Modeling and application of sensory evaluation of blueberry wine based on principal component analysis. Curr. Res. Food Sci. 2023, 6, 100403. [Google Scholar] [CrossRef] [Scilit] [PubMed]
- Kang, B.; García García, D.; Lijffijt, J.; Santos-Rodríguez, R.; De Bie, T. Conditional t-SNE: More informative t-SNE embeddings. Mach. Learn. 2021, 110, 2905–2940. [Google Scholar] [CrossRef] [Scilit] [PubMed]
- Deng, J.; Chen, Z.; Jiang, H.; Chen, Q. High-precision detection of dibutyl hydroxytoluene in edible oil via convolutional autoencoder compressed Fourier-transform near-infrared spectroscopy. Food Control 2025, 167, 110808. [Google Scholar] [CrossRef] [Scilit]
- Fu, L.; Sun, J.; Wang, S.; Xu, M.; Yao, K.; Cao, Y.; Tang, N. Identification of maize seed varieties based on stacked sparse autoencoder and near-infrared hyperspectral imaging technology. J. Food Process Eng. 2022, 45, e14120. [Google Scholar] [CrossRef] [Scilit]
- Zhu, X. Semi-Supervised Learning Literature Survey. Comput Sci. 2008, 1530, 60. [Google Scholar]
- Chapelle, O.; Chi, M.; Zien, A. A continuation method for semi-supervised SVMs. In Proceedings of the 23rd International Conference on Machine Learning, Pittsburgh, PA, USA, 25–29 June 2006; pp. 185–192. [Google Scholar]
- Bhusal, G.; Merkurjev, E.; Wei, G.-W. Persistent Laplacian-enhanced algorithm for scarcely labeled data classification. Mach. Learn. 2024, 113, 7267–7292. [Google Scholar] [CrossRef] [Scilit] [PubMed]
- Wang, L.; Qian, Q.; Zhang, Q.; Wang, J.; Cheng, W.; Yan, W. Classification Model on Big Data in Medical Diagnosis Based on Semi-Supervised Learning. Comput. J. 2022, 65, 177–191. [Google Scholar] [CrossRef] [Scilit]
- Hagberg, E.; Hagerman, D.; Johansson, R.; Hosseini, N.; Liu, J.; Björnsson, E.; Alvén, J.; Hjelmgren, O. Semi-supervised learning with natural language processing for right ventricle classification in echocardiography—A scalable approach. Comput. Biol. Med. 2022, 143, 105282. [Google Scholar] [CrossRef] [Scilit] [PubMed]
- Ji, Q.; Jiang, Y.; Wu, Z.; Liu, Q.; Qu, L. An Image Recognition Method for Urine Sediment Based on Semi-supervised Learning. IRBM 2023, 44, 100739. [Google Scholar] [CrossRef] [Scilit]
- Yang, G.; Zheng, W.; Che, C.; Wang, W. Graph-based label propagation algorithm for community detection. Int. J. Mach. Learn. Cybern. 2020, 11, 1319–1329. [Google Scholar] [CrossRef] [Scilit]
- Collobert, R.; Sinz, F.; Weston, J.; Bottou, L. Large Scale Transductive SVMs. J. Mach. Learn. Res. 2006, 7, 1687–1712. [Google Scholar]
- Triguero, I.; García, S.; Herrera, F. Self-labeled techniques for semi-supervised learning: Taxonomy, software and empirical study. Knowl. Inf. Syst. 2015, 42, 245–284. [Google Scholar] [CrossRef] [Scilit]
- Caldas, W.L.; Gomes, J.P.P.; Mesquita, D.P.P. Fast Co-MLM: An Efficient Semi-supervised Co-training Method Based on the Minimal Learning Machine. New Gener. Comput. 2018, 36, 41–58. [Google Scholar] [CrossRef] [Scilit]
- van Engelen, J.E.; Hoos, H.H. A survey on semi-supervised learning. Mach. Learn. 2020, 109, 373–440. [Google Scholar] [CrossRef] [Scilit]
- Gong, B.; Zhang, H.; Wang, X.; Lian, K.; Li, X.; Chen, B.; Wang, H.; Niu, X. Ultraviolet-induced fluorescence of oil spill recognition using a semi-supervised algorithm based on thickness and mixing proportion–emission matrices. Anal. Methods 2023, 15, 1649–1660. [Google Scholar] [CrossRef] [Scilit] [PubMed]
- Zhang, H.; Wisuthiphaet, N.; Cui, H.; Nitin, N.; Liu, X.; Zhao, Q. Spectroscopy Approaches for Food Safety Applications: Improving Data Efficiency Using Active Learning and Semi-supervised Learning. Front. Artif. Intell. 2022, 5, 863261. [Google Scholar] [CrossRef] [Scilit] [PubMed]
- Chen, Y.; Yu, Z.; Han, Z.; Sun, W.; He, L. A Decision-Making System for Cotton Irrigation Based on Reinforcement Learning Strategy. Agronomy 2024, 14, 11. [Google Scholar] [CrossRef] [Scilit]
- Shakya, A.K.; Pillai, G.; Chakrabarty, S. Reinforcement learning algorithms: A brief survey. Expert Syst. Appl. 2023, 231, 120495. [Google Scholar] [CrossRef] [Scilit]
- Dornheim, J.; Link, N.; Gumbsch, P. Model-free Adaptive Optimal Control of Episodic Fixed-horizon Manufacturing Processes Using Reinforcement Learning. Int. J. Control Autom. Syst. 2020, 18, 1593–1604. [Google Scholar] [CrossRef] [Scilit]
- Kara, A.; Dogan, I. Reinforcement learning approaches for specifying ordering policies of perishable inventory systems. Expert Syst. Appl. 2018, 91, 150–158. [Google Scholar] [CrossRef] [Scilit]
- Mnih, V.; Kavukcuoglu, K.; Silver, D.; Rusu, A.A.; Veness, J.; Bellemare, M.G.; Graves, A.; Riedmiller, M.; Fidjeland, A.K.; Ostrovski, G.; et al. Human-level control through deep reinforcement learning. Nature 2015, 518, 529–533. [Google Scholar] [CrossRef] [Scilit] [PubMed]
- Kuhnle, A.; Jakubik, J.; Lanza, G. Reinforcement learning for opportunistic maintenance optimization. Prod. Eng. 2019, 13, 33–41. [Google Scholar] [CrossRef] [Scilit]
- Gow, S.; Niranjan, M.; Kanza, S.; Frey, J.G. A review of reinforcement learning in chemistry. Digit. Discov. 2022, 1, 551–567. [Google Scholar] [CrossRef] [Scilit]
- Chen, Y.; Lin, M.; Yu, Z.; Sun, W.; Fu, W.; He, L. Enhancing cotton irrigation with distributional actor–critic reinforcement learning. Agric. Water Manag. 2025, 307, 109194. [Google Scholar] [CrossRef] [Scilit]
- Xie, F.; Guo, Z.; Li, T.; Feng, Q.; Zhao, C. Dynamic Task Planning for Multi-Arm Harvesting Robots Under Multiple Constraints Using Deep Reinforcement Learning. Horticulturae 2025, 11, 88. [Google Scholar] [CrossRef] [Scilit]
- Zhang, P.; He, Y.; Rong, J.; Tian, Y.; Zhang, Y.; Yang, S.; Zhang, X. Reinforcement learning assisted sparse population coevolutionary algorithm for multi-component spectral feature selection. Swarm Evol. Comput. 2026, 101, 102292. [Google Scholar] [CrossRef] [Scilit]
- Yang, Q.; Fan, W.; Ma, N.; Lin, S.; Chang, J.; Zou, Z.; Sun, L.; Zhang, H. Bilevel scheduling in downstream oil supply chain: Integrating reinforcement learning with mathematical programming. Comput. Chem. Eng. 2026, 204, 109381. [Google Scholar] [CrossRef] [Scilit]
- Lyu, S.; Li, F.; Yang, W.; Zhang, Q.; Su, J.; Zhao, R.; Lu, X. Quantitative analysis of potentially toxic elements in soil by XRF based on efficient reinforcement learning and sparse partial least squares. J. Anal. At. Spectrom. 2024, 39, 942–953. [Google Scholar] [CrossRef] [Scilit]
- Xi, Z.; Pan, T.; Fang, L.; Chen, S. Semi-supervised broad learning system for near-infrared spectroscopy. J. Food Eng. 2026, 409, 112900. [Google Scholar] [CrossRef] [Scilit]
- Chen, Y.; Zhang, J.; Wang, J.; Wang, C.; Zhu, Q. Analysis of small three-dimensional fluorescence spectroscopy dataset using migration learning an example of phenol concentration prediction in wastewater. Sci. Total Environ. 2024, 954, 176301. [Google Scholar] [CrossRef] [Scilit] [PubMed]
- Jiang, X.; Liu, Q.; Cao, X.; Wang, F.; Li, L.; Yan, L.; Fan, S. Fluorescence spectroscopy combined with a multi-task deep learning model for rapeseed oil quality analysis. J. Food Compos. Anal. 2025, 146, 107889. [Google Scholar] [CrossRef] [Scilit]
- Yin, S.; Li, Z. A handheld fluorescent platform integrated with a Sm(iii)-CdTe quantum dot-based ratiometric nanoprobe for point-of-use determination of phosphate. Nanoscale 2024, 16, 21147–21154. [Google Scholar] [CrossRef] [Scilit] [PubMed]
- Lu, X.; Liao, Y.; Liu, C.; Lio, P.; Hui, P. Heterogeneous Model Fusion Federated Learning Mechanism Based on Model Mapping. IEEE Internet Things J. 2022, 9, 6058–6068. [Google Scholar] [CrossRef] [Scilit]
- Li, J.-Y.; Tang, J.-Z.; Zhao, X.-Z.; Fan, B.; Jiang, W.-Y.; Song, S.-Y.; Li, J.-B.; Chen, K.-D.; Zhao, Z.-G. A large-scale, high-quality dataset for lithology identification: Construction and applications. Pet. Sci. 2025, 22, 3207–3228. [Google Scholar] [CrossRef] [Scilit]
- Xu, J.; Zhang, S.; Luo, S.-h.; Xiong, C.-r.; Zhu, M.; Chang, J.; Zou, B.; Ren, B.; Tian, Z.-q.; Liu, G.-k. Rapid Sample Pretreatment Facilitating SERS Detection of Trace Weak Organic Acids/Bases in Complex Matrices. Anal. Chem. 2024, 96, 9399–9407. [Google Scholar] [CrossRef] [Scilit] [PubMed]
- Zhang, L.; Lv, Q.; Zheng, Y.; Gao, S.; Huang, W.; Liu, P.; Kong, D.; Wang, Y.; Yu, Y.; Jiang, Y.; et al. Rapid and sensitive detection of botulinum toxin type A in complex sample matrices by AlphaLISA. Front. Public Health 2022, 10, 987517. [Google Scholar] [CrossRef] [Scilit] [PubMed]
- Gao, Y.; Xu, J.; Li, B.; Jin, Y. PCR-free and label-free fluorescent detection of telomerase activity at single-cell level based on triple amplification. Biosens. Bioelectron. 2016, 81, 415–422. [Google Scholar] [CrossRef] [Scilit] [PubMed]
- Alam, M.W.; Wahid, K.A.; Goel, R.K.; Lukong, K.E. Development of a low-cost and portable smart fluorometer for detecting breast cancer cells. Biomed. Opt. Express 2019, 10, 399–410. [Google Scholar] [CrossRef] [Scilit] [PubMed]
- Matteoli, S.; Diani, M.; Corsini, G. ARTEMIdE—An Automated Underwater Material Recognition Method for Fluorescence LIDAR Invariant to Environmental Conditions. IEEE Trans. Geosci. Remote Sens. 2020, 58, 1763–1776. [Google Scholar] [CrossRef] [Scilit]
- Khalighi, S.; Ma, L.; Ren, S.; Varveri, A. Evaluating the impact of data pre-processing methods on classification of ATR-FTIR spectra of bituminous binders. Fuel 2024, 376, 132701. [Google Scholar] [CrossRef] [Scilit]
- Al Riza, D.F.; Widodo, S.; Purwanto, Y.A.; Kondo, N. Combined fluorescence-transmittance imaging system for geographical authentication of patchouli oil. Spectrochim. Acta Part A Mol. Biomol. Spectrosc. 2019, 218, 155–160. [Google Scholar] [CrossRef] [Scilit] [PubMed]
- Medina-Ortiz, D.; Contreras, S.; Quiroz, C.; Olivera-Nappa, Á. Development of Supervised Learning Predictive Models for Highly Non-linear Biological, Biomedical, and General Datasets. Front. Mol. Biosci. 2020, 7, 13. [Google Scholar] [CrossRef] [Scilit] [PubMed]
- Deo, B.S.; Nayak, S.; Pal, M.; Panigrahi, P.K.; Pradhan, A. Empirical mode decomposition and Hessian LLE in Fluorescence spectral signal analysis for Cervical cancer detection. Biomed. Signal Process. Control 2025, 100, 106917. [Google Scholar] [CrossRef] [Scilit]
- De Pauw, E.; Tack, P.; Lindner, M.; Ashauer, A.; Garrevoet, J.; Vekemans, B.; Falkenberg, G.; Brenker, F.E.; Vincze, L. Highly Sensitive Nondestructive Rare Earth Element Detection by Means of Wavelength-Dispersive X-ray Fluorescence Spectroscopy Enabled by an Energy Dispersive pn-Charge-Coupled-Device Detector. Anal. Chem. 2019, 92, 1106–1113. [Google Scholar] [CrossRef] [Scilit] [PubMed]
- Gu, H.; Hu, L.; Dong, Y.; Chen, Q.; Wei, Z.; Lv, R.; zhou, Q. Evolving trends in fluorescence spectroscopy techniques for food quality and safety: A review. J. Food Compos. Anal. 2024, 131, 106212. [Google Scholar] [CrossRef] [Scilit]
- Fan, Y.; Ji, Z.; Sun, C.; Xu, D.; Yang, X.; Shi, C.; Fan, H. Integrating EEM fluorescence spectroscopy with machine and deep learning models for multi-output prediction of fish freshness. Appl. Food Res. 2025, 5, 101374. [Google Scholar] [CrossRef] [Scilit]
- Chen, H.; Wang, N.; Du, X.; Mei, K.; Zhou, Y.; Cai, G. Classification Prediction of Breast Cancer Based on Machine Learning. Comput. Intell. Neurosci. 2023, 2023, 6530719. [Google Scholar] [CrossRef] [Scilit] [PubMed]
- Browarczyk, J.; Kurowski, A.; Kostek, B. Analyzing the Effectiveness of the Brain–Computer Interface for Task Discerning Based on Machine Learning. Sensors 2020, 20, 2403. [Google Scholar] [CrossRef] [Scilit] [PubMed]
- Liu, Z.; Li, X.; Sun, X.; Yu, Z.; Gao, Y.; Zhang, Y.; Zhou, Y.; Su, Q.; Xia, Y.; Wang, Y.; et al. Progress in Spectral Information Processing Technology for Brillouin Microscopy. Photonics 2026, 13, 36. [Google Scholar] [CrossRef] [Scilit]
- Brdar, S.; Panić, M.; Matavulj, P.; Stanković, M.; Bartolić, D.; Šikoparija, B. Explainable AI for unveiling deep learning pollen classification model based on fusion of scattered light patterns and fluorescence spectroscopy. Sci. Rep. 2023, 13, 3205. [Google Scholar] [CrossRef] [Scilit] [PubMed]
- Ropelewska, E.; Slavova, V.; Sabanci, K.; Aslan, M.F.; Masheva, V.; Petkova, M. Differentiation of Yeast-Inoculated and Uninoculated Tomatoes Using Fluorescence Spectroscopy Combined with Machine Learning. Agriculture 2022, 12, 1887. [Google Scholar] [CrossRef] [Scilit]
- Lim, S.Y.; Yoon, H.M.; Kook, M.-C.; Jang, J.I.; So, P.T.C.; Kang, J.W.; Kim, H.M. Stomach tissue classification using autofluorescence spectroscopy and machine learning. Surg. Endosc. 2023, 37, 5825–5835. [Google Scholar] [CrossRef] [Scilit] [PubMed]
- Cai, W.; Ye, C.; Ao, F.; Xu, Z.; Chu, W. Emerging applications of fluorescence excitation-emission matrix with machine learning for water quality monitoring: A systematic review. Water Res. 2025, 277, 123281. [Google Scholar] [CrossRef] [Scilit] [PubMed]
- Jiang, N.; Jing, M.; Si, B.; He, Z.; Han, H.; Chen, M. Study on the Detection Method of Soil-Motor Oil Contamination Combined with Genetic Algorithm Spectral Wavelength Selection. J. Appl. Spectrosc. 2024, 91, 936–944. [Google Scholar] [CrossRef] [Scilit]
- Lanjun, S.; Zhijian, L.; Xiongfei, M.; Yanchao, Z.; Shuhan, H.; Le, L.; Lin, W. Rapid identification of marine microplastics by laser-induced fluorescence technique based on PCA combined with SVM and KNN algorithm. Environ. Res. 2025, 269, 120947. [Google Scholar] [CrossRef] [Scilit] [PubMed]
- Chen, C.; Zhu, W.; Steibel, J.; Siegford, J.; Han, J.; Norton, T. Classification of drinking and drinker-playing in pigs by a video-based deep learning method. Biosyst. Eng. 2020, 196, 1–14. [Google Scholar] [CrossRef] [Scilit]
- Deng, J.; Ni, L.; Bai, X.; Jiang, H.; Xu, L. Simultaneous analysis of mildew degree and aflatoxin B1 of wheat by a multi-task deep learning strategy based on microwave detection technology. LWT 2023, 184, 115047. [Google Scholar] [CrossRef] [Scilit]
- Wang, J.; Gao, Z.; Zhang, Y.; Zhou, J.; Wu, J.; Li, P. Real-Time Detection and Location of Potted Flowers Based on a ZED Camera and a YOLO V4-Tiny Deep Learning Algorithm. Horticulturae 2022, 8, 21. [Google Scholar] [CrossRef] [Scilit]
- Xu, M.; Sun, J.; Cheng, J.; Yao, K.; Wu, X.; Zhou, X. Non-destructive prediction of total soluble solids and titratable acidity in Kyoho grape using hyperspectral imaging and deep learning algorithm. Int. J. Food Sci. Technol. 2023, 58, 9–21. [Google Scholar] [CrossRef] [Scilit]
- Liu, J.; Abbas, I.; Noor, R.S. Development of Deep Learning-Based Variable Rate Agrochemical Spraying System for Targeted Weeds Control in Strawberry Crop. Agronomy 2021, 11, 1480. [Google Scholar] [CrossRef] [Scilit]
- gu, H.; Lv, R.; Huang, X.; Chen, Q.; Dong, Y. Rapid quantitative assessment of lipid oxidation in a rapeseed oil-in-water (o/w) emulsion by three-dimensional fluorescence spectroscopy. J. Food Compos. Anal. 2022, 114, 104762. [Google Scholar] [CrossRef] [Scilit]
- Han, J.; Li, Y.; Liang, J.; Chen, L.; Yu, X.; Chen, L.; Phyllis, O.; Wahia, H.; Yang, H.; Zhou, C. Based on the umami-transformer machine learning model: Screening of umami peptides from ultrasound-assisted enzymatic hydrolysis of shiitake mushrooms and study on their flavor mechanism. Food Res. Int. 2026, 228, 118379. [Google Scholar] [CrossRef] [Scilit] [PubMed]
- Ji, W.; Zhai, K.; Xu, B.; Wu, J. Green Apple Detection Method Based on Multidimensional Feature Extraction Network Model and Transformer Module. J. Food Prot. 2025, 88, 100397. [Google Scholar] [CrossRef] [Scilit] [PubMed]
- Zhu, W.; Sun, J.; Wang, S.; Shen, J.; Yang, K.; Zhou, X. Identifying Field Crop Diseases Using Transformer-Embedded Convolutional Neural Network. Agriculture 2022, 12, 1083. [Google Scholar] [CrossRef] [Scilit]
- Garibaldi-Márquez, F.; Martínez-Barba, D.A.; Montañez-Franco, L.E.; Flores, G.; Valentín-Coronado, L.M. Enhancing site-specific weed detection using deep learning transformer architectures. Crop Prot. 2025, 190, 107075. [Google Scholar] [CrossRef] [Scilit]
- Erbas, I.; Pandey, V.; Ibtehaj Nizam, N.; Yuan, N.; Verma, A.; Barosso, M.; Intes, X. Enhancing Fluorescence Lifetime Parameter Estimation Accuracy with Differential Transformer Based Deep Learning Model Incorporating Pixelwise Instrument Response Function. arXiv 2024, arXiv:2411.16896. [Google Scholar] [CrossRef] [Scilit]
- Shi, B.; Sreeram, V.; Zhao, D.; Duan, S.; Jiang, J. A wireless sensor network-based monitoring system for freshwater fishpond aquaculture. Biosyst. Eng. 2018, 172, 57–66. [Google Scholar] [CrossRef] [Scilit]
- Pushpa, G.; Babu, R.A.; Subashree, S.; Senthilkumar, S. Optimizing coverage in wireless sensor networks using deep reinforcement learning with graph neural networks. Sci. Rep. 2025, 15, 16681. [Google Scholar] [CrossRef] [Scilit] [PubMed]
- Lin, H.; Pan, T.; Li, Y.; Chen, S.; Li, G. Development of analytical method associating near-infrared spectroscopy with one-dimensional convolution neural network: A case study. J. Food Meas. Charact. 2021, 15, 2963–2973. [Google Scholar] [CrossRef] [Scilit]
- Huang, Y.; Pan, Y.; Liu, C.; Zhou, L.; Tang, L.; Wei, H.; Fan, K.; Wang, A.; Tang, Y. Rapid and Non-Destructive Geographical Origin Identification of Chuanxiong Slices Using Near-Infrared Spectroscopy and Convolutional Neural Networks. Agriculture 2024, 14, 1281. [Google Scholar] [CrossRef] [Scilit]
- Qiu, J.; Wu, Y.; Zhang, H.; Li, M.; Pu, X.; Guo, Y. A Contrastive-Learning-Based Pre-Training Framework for Optical Property Prediction of Low-Data Rhodamines with Interpretable Multitask Graph Neural Networks. Molecules 2026, 31, 1149. [Google Scholar] [CrossRef] [Scilit] [PubMed]
- Nguyen, D.P.; Le, Q.M.; Tran, H.T.P.; Le, P.T.; Nguyen, T.V.T. Enhanced Prediction of Absorption and Emission Wavelengths of Organic Compounds through Hybrid Graph Neural Network Architectures. ACS Omega 2025, 10, 50643–50651. [Google Scholar] [CrossRef] [Scilit] [PubMed]
- Chen, Y.; Wang, Z.; Wang, J.; Chu, Y.; Zhang, Q.; Li, Z.A.; Zeng, X. Self-supervised learning in drug discovery. Sci. China Inf. Sci. 2025, 68, 170103. [Google Scholar] [CrossRef] [Scilit]
- Xia, J.; Yan, J.; Tang, M.; Zhao, B.; Chen, K. Physics-informed self-supervised learning enables spectra-free multiplexed imaging on standard fluorescence microscopes. bioRxiv 2026, 2026.04. 27.721244. [Google Scholar] [CrossRef] [Scilit]
- Li, X.; Hu, X.; Chen, X.; Fan, J.; Zhao, Z.; Wu, J.; Wang, H.; Dai, Q. Spatial redundancy transformer for self-supervised fluorescence image denoising. Nat. Comput. Sci. 2023, 3, 1067–1080. [Google Scholar] [CrossRef] [Scilit] [PubMed]
- Al-Zoghby, A.M.; Ismail Ebada, A.; Saleh, A.S.; Abdelhay, M.; Awad, W.A. A Comprehensive Review of Multimodal Deep Learning for Enhanced Medical Diagnostics. Comput. Mater. Contin. 2025, 84, 4155–4193. [Google Scholar] [CrossRef] [Scilit]
- Miger, K.; Overgaard Olesen, A.S.; Grand, J.; Fabricius-Bjerre, A.; Sajadieh, A.; Høst, N.; Køber, N.; Abild, A.; Pedersen, L.; Lawaetz Schultz, H.H.; et al. Computed Tomography or Chest X-Ray to Assess Pulmonary Congestion in Dyspnoeic Patients with Acute Heart Failure. ESC Heart Fail. 2024, 11, 1163–1173. [Google Scholar] [CrossRef] [Scilit] [PubMed]
- Wang, R.; Feng, Y.; Valm, A.M. A framework of multi-view machine learning for biological spectral unmixing of fluorophores with overlapping excitation and emission spectra. Brief. Bioinform. 2025, 26, bbaf005. [Google Scholar] [CrossRef] [Scilit] [PubMed]
- García Navarro, A.L.; Cachón Ortiz, J.; González Colsa, J.; García Díaz, S.; Viadero Valderrama, C. Machine Learning-Driven Multimodal Spectroscopic Liquid Biopsy for Early Multicancer Detection. arXiv 2026, arXiv:2605.13218. [Google Scholar] [CrossRef] [Scilit]
- Shaikh, S.; O’Donnell, C. Applications of fluorescence spectroscopy in dairy processing: A review. Curr. Opin. Food Sci. 2017, 17, 16–24. [Google Scholar] [CrossRef] [Scilit]
- Gu, H.; Huang, X.; Sun, Y.; Chen, Q.; Wei, Z.; Lv, R. Intelligent evaluation of total polar compounds (TPC) content of frying oil based on fluorescence spectroscopy and low-field NMR. Food Chem. 2021, 342, 128242. [Google Scholar] [CrossRef] [Scilit] [PubMed]
- Gu, H.; Liu, K.; Huang, X.; Chen, Q.; Sun, Y.; Tan, C.P. Feasibility study for the analysis of coconut water using fluorescence spectroscopy coupled with PARAFAC and SVM methods. Br. Food J. 2020, 122, 3203–3212. [Google Scholar] [CrossRef] [Scilit]
- Chen, H.; Geng, D.; Chen, T.; Lu, D.; Chen, B. Second-derivative laser-induced fluorescence spectroscopy combined with chemometrics for authentication of the adulteration of camellia oil. CyTA-J. Food 2018, 16, 747–754. [Google Scholar] [CrossRef] [Scilit]
- Liu, H.; Zhang, K.; Zou, H.; Mu, Q.; Wang, X.; Song, Y.; Lin, L.; Wang, C.-K.; Fan, J. A theoretical perspective of the relationship between the structures and luminescence properties of red thermally activated delayed fluorescence molecules. Phys. Chem. Chem. Phys. 2022, 24, 17140–17154. [Google Scholar] [CrossRef] [Scilit] [PubMed]
- Wu, T.; Průša, J.; Kessler, J.; Drači, M.; Valenta, J.; Bouř, P. Detection of Sugars via Chirality Induced in Europium(III) Compounds. Anal. Chem. 2016, 88, 8878–8885. [Google Scholar] [CrossRef] [Scilit] [PubMed]
- Michelucci, U.; Venturini, F. Deep learning domain adaptation to understand physico-chemical processes from fluorescence spectroscopy small datasets and application to the oxidation of olive oil. Sci. Rep. 2024, 14, 22291. [Google Scholar] [CrossRef] [Scilit] [PubMed]
- Wang, H.; Jiang, W.; Liu, K.; Li, C.; Tian, D.; Zhou, Z. A software system for dispersive atomic fluorescence spectrometry based on UV digital micromirror device. Rev. Sci. Instrum. 2021, 92, 114103. [Google Scholar] [CrossRef] [Scilit] [PubMed]
- Lewis, D.M.; Chatwin, P.C. The treatment of atmospheric dispersion data in the presence of noise and baseline drift. Bound.-Layer Meteorol. 1995, 72, 53–85. [Google Scholar] [CrossRef] [Scilit]
- Zhou, N.; Liang, X.; Deng, W.; Yao, J.; Li, D.; Ha, L. Reinforcement Learning Based Adaptive Output Feedback Control of Uncertain Nonlinear Systems. Int. J. Robust Nonlinear Control 2026, 36, 1205–1216. [Google Scholar] [CrossRef] [Scilit]
- Goyal, R.; Singha, P.; Singh, S.K. Spectroscopic food adulteration detection using machine learning: Current challenges and future prospects. Trends Food Sci. Technol. 2024, 146, 104377. [Google Scholar] [CrossRef] [Scilit]
- Qi, S.; Zhang, Y.; Wang, C.; Xiang, T.; Cao, X.; Xiang, Y. Representing Noisy Image Without Denoising. IEEE Trans. Pattern Anal. Mach. Intell. 2024, 46, 6713–6730. [Google Scholar] [CrossRef] [Scilit] [PubMed]
- Andersen, J.H.; Brumboiu, I.E.; Hodecker, M.; Li, X.; Norman, P.; Rinkevicius, Z. VeloxChem: Large-Scale DFT Calculations of Geometric Derivatives up to Second Order for Simulation of IR Spectra. J. Phys. Chem. A 2026, 130, 569–580. [Google Scholar] [CrossRef] [Scilit] [PubMed]
- Yang, X.; Pei, J.; He, X.; Wang, Y.; Wang, L.; Shen, F.; Li, P.; Fang, Y. A novel method for determination of peroxide value and acid value of extra-virgin olive oil based on fluorescence internal filtering effect correction. Food Chem. 2024, 441, 138342. [Google Scholar] [CrossRef] [Scilit] [PubMed]
- Balcerowska-Czerniak, G. Chemical information obtained from multicomponent spectra by means of Score-based Quantitative Principal Component Analysis. Chemom. Intell. Lab. Syst. 2021, 219, 104438. [Google Scholar] [CrossRef] [Scilit]
- Govindaraju, R.; Kim, J. MXene-based fluorescent aptasensors: Advances and prospects in diagnostics and environmental monitoring. Analyst 2026, 151, 973–990. [Google Scholar] [CrossRef] [Scilit] [PubMed]
- Shen, F.; Feng, X.; Li, Y.; Lin, X.; Cai, F. Compact three-dimensional fluorescence spectroscopy and its application in food safety. LWT 2024, 202, 116324. [Google Scholar] [CrossRef] [Scilit]
- Bagheri, P.; Hoang, K.; Fung, A.A.; Hussain, S.; Shi, L. Visualizing Cancer Cell Metabolic Dynamics Regulated With Aromatic Amino Acids Using DO-SRS and 2PEF Microscopy. Front. Mol. Biosci. 2021, 8, 779702. [Google Scholar] [CrossRef] [Scilit] [PubMed]
- Poojary, M.M.; Lund, M.N. Chemical Stability of Proteins in Foods: Oxidation and the Maillard Reaction. Annu. Rev. Food Sci. Technol. 2022, 13, 35–58. [Google Scholar] [CrossRef] [Scilit] [PubMed]
- Hao, W.; Ji, F.; Wang, J.; Wang, Y.; Zhang, Y.; Bao, Y. Metabolic engineering of Bacillus sp. for diacetyl production. Process Biochem. 2017, 58, 69–77. [Google Scholar] [CrossRef] [Scilit]
- Malmquist, L.M.V.; Boll, E.S.; Nielsen, N.J.; Christensen, J.H. Separation, detection and identification of phase I and phase II metabolites and their corresponding polycyclic aromatic compounds. Anal. Methods 2017, 9, 3323–3328. [Google Scholar] [CrossRef] [Scilit]
- Vanhoudt, N.; Wannijn, J.; Nauts, R.; Van Gompel, A.; Mijnendonckx, K.; Impens, N. Influence of earthworms on the mobility and bioavailability of metals, metalloids and radionuclides in historically contaminated soil. Appl. Soil Ecol. 2024, 203, 105665. [Google Scholar] [CrossRef] [Scilit]
- Kumke, M.U.; Löhmannsröben, H.G.; Roch, T. Fluorescence spectroscopy of polynuclear aromatic compounds in environmental monitoring. J. Fluoresc. 1995, 5, 139–152. [Google Scholar] [CrossRef] [Scilit] [PubMed]
- Ning, H.; Ma, M.; Shi, Z.; Ding, L. A classification method for fluorescence emission spectra of anionic surfactants with few-shot learning. J. Mol. Model. 2025, 31, 218. [Google Scholar] [CrossRef] [Scilit] [PubMed]
- Jeon, C.; Lee, C.; Jang, S.; Kim, S. Data Assimilation for a Simple Hydrological Partitioning Model Using Machine Learning. Water 2025, 17, 3204. [Google Scholar] [CrossRef] [Scilit]
- Sabanci, K.; Aslan, M.F.; Slavova, V.; Genova, S. The Use of Fluorescence Spectroscopic Data and Machine-Learning Algorithms to Discriminate Red Onion Cultivar and Breeding Line. Agriculture 2022, 12, 1652. [Google Scholar] [CrossRef] [Scilit]
- Zhao, W.; Ai, X.; Zhao, H. Quantitative analysis of energy-dispersive X-ray fluorescence spectroscopy based on machine learning and a generative data enhancement technique. Appl. Opt. 2023, 62, 9476–9485. [Google Scholar] [CrossRef] [Scilit] [PubMed]
- Qiu, Z.; Chen, X.; Xie, D.; Ren, Y.; Wang, Y.; Yang, Z.; Guo, M.; Song, Y.; Guo, J.; Feng, Y.; et al. Identification and detection of frozen-thawed muscle foods based on spectroscopy and machine learning: A review. Trends Food Sci. Technol. 2025, 155, 104797. [Google Scholar] [CrossRef] [Scilit]
- Švecová, M.; Blahová, L.; Kostolný, J.; Birková, A.; Urdzík, P.; Mareková, M.; Dubayová, K. Enhancing endometrial cancer detection: Blood serum intrinsic fluorescence data processing and machine learning application. Talanta 2025, 283, 127083. [Google Scholar] [CrossRef] [Scilit] [PubMed]
- Yang, X.-S.; Feng, Y.; Wahab, A.; Geng, H. Non-Hermitian second-order topological phases and bipolar skin effect in photonic kagome crystals. Phys. Rev. A 2026, 113, 023506. [Google Scholar] [CrossRef] [Scilit]
- Jiang, H.; Zhang, M.; Sun, Y.; Bhandari, B.; Wang, X. Improving thawed quality of hot-pot vegetable balls by a freeze–thaw stability control by adding hydrocolloids. J. Food Process Eng. 2020, 43, e13518. [Google Scholar] [CrossRef] [Scilit]
- Sun, J.; Zhou, X.; Mao, H.; Wu, X.; Zhang, X.; Gao, H. Identification of pesticide residue level in lettuce based on hyperspectra and chlorophyll fluorescence spectra. Int. J. Agric. Biol. Eng. 2016, 9, 231–239. [Google Scholar] [CrossRef]
- Mohammadi-Moghaddam, T.; Razavi, S.M.A.; Taghizadeh, M.; Pradhan, B.; Sazgarnia, A.; Shaker-Ardekani, A. Hyperspectral imaging as an effective tool for prediction the moisture content and textural characteristics of roasted pistachio kernels. J. Food Meas. Charact. 2018, 12, 1493–1502. [Google Scholar] [CrossRef] [Scilit]
- Hu, Y.; Sun, J.; Zhan, C.; Huang, P.; Kang, Z. Identification and quantification of adulterated Tieguanyin based on the fluorescence hyperspectral image technique. J. Food Compos. Anal. 2023, 120, 105343. [Google Scholar] [CrossRef] [Scilit]
- Rong, Y.; Zareef, M.; Liu, L.; Din, Z.U.; Chen, Q.; Ouyang, Q. Application of portable Vis-NIR spectroscopy for rapid detection of myoglobin in frozen pork. Meat Sci. 2023, 201, 109170. [Google Scholar] [CrossRef] [Scilit] [PubMed]
- Kim, S.-Y.; Ha, J.-H. Rapid determination of the geographical origin of kimchi by Fourier transform near-infrared spectroscopy coupled with chemometric techniques. Sci. Rep. 2024, 14, 24581. [Google Scholar] [CrossRef] [Scilit] [PubMed]
- Polis, M.; Szydło, K.; Zakusylo, R.; Hawelek, L.; Stolarczyk, A.; Jarosz, T. Study of the Combustion Mechanism of Zn/KMnO4 Pyrotechnic Composition. Molecules 2023, 28, 5741. [Google Scholar] [CrossRef] [Scilit] [PubMed]
- Xi, Q.; Chen, Q.; Ahmad, W.; Pan, J.; Zhao, S.; Xia, Y.; Ouyang, Q.; Chen, Q. Quantitative analysis and visualization of chemical compositions during shrimp flesh deterioration using hyperspectral imaging: A comparative study of machine learning and deep learning models. Food Chem. 2025, 481, 143997. [Google Scholar] [CrossRef] [Scilit] [PubMed]
- Markovski, A.; Zaharieva, L.; Deneva, V.; Taskova, E.; Genova, T.; Gegov, A.; Andreeva, C.; Antonov, L. Machine Learning with Insufficient Data for Classification of Mixtures of Sunflower and Olive Oil Samples Using Laser-Induced Fluorescence Spectroscopy. Physchem 2026, 6, 35. [Google Scholar] [CrossRef] [Scilit]
- Yang, H.; Wang, Y.; Fan, B.; Chen, Q.; Wu, M.; Wang, F.; Li, L. Simultaneous determination of vegetable oil frying frequency and peroxide value based on the three-dimensional fluorescence spectroscopy and machine learning. Food Chem. 2025, 471, 142729. [Google Scholar] [CrossRef] [Scilit] [PubMed]
- Zareef, M.; Arslan, M.; Hassan, M.M.; Ahmad, W.; Ali, S.; Li, H.; Ouyang, Q.; Wu, X.; Hashim, M.M.; Chen, Q. Recent advances in assessing qualitative and quantitative aspects of cereals using nondestructive techniques: A review. Trends Food Sci. Technol. 2021, 116, 815–828. [Google Scholar] [CrossRef] [Scilit]
- Ouyang, Q.; Rong, Y.; Wu, J.; Wang, Z.; Lin, H.; Chen, Q. Application of colorimetric sensor array combined with visible near-infrared spectroscopy for the matcha classification. Food Chem. 2023, 420, 136078. [Google Scholar] [CrossRef] [Scilit] [PubMed]
- Paniel, N.; Noguer, T. Detection of Salmonella in Food Matrices, from Conventional Methods to Recent Aptamer-Sensing Technologies. Foods 2019, 8, 371. [Google Scholar] [CrossRef] [Scilit] [PubMed]
- Zhou, X.; Zhao, C.; Sun, J.; Cao, Y.; Yao, K.; Xu, M. A deep learning method for predicting lead content in oilseed rape leaves using fluorescence hyperspectral imaging. Food Chem. 2023, 409, 135251. [Google Scholar] [CrossRef] [Scilit] [PubMed]
- Guo, Z.; Huang, W.; Peng, Y.; Chen, Q.; Ouyang, Q.; Zhao, J. Color compensation and comparison of shortwave near infrared and long wave near infrared spectroscopy for determination of soluble solids content of ‘Fuji’ apple. Postharvest Biol. Technol. 2016, 115, 81–90. [Google Scholar] [CrossRef] [Scilit]
- Lu, Y.; Nie, L.; Guo, X.; Pan, T.; Chen, R.; Liu, X.; Li, X.; Li, T.; Liu, F. Rapid assessment of heavy metal accumulation capability of Sedum alfredii using hyperspectral imaging and deep learning. Ecotoxicol. Environ. Saf. 2024, 282, 116704. [Google Scholar] [CrossRef] [Scilit] [PubMed]
- Fracassetti, D.; Di Canito, A.; Bodon, R.; Messina, N.; Vigentini, I.; Foschino, R.; Tirelli, A. Light-struck taste in white wine: Reaction mechanisms, preventive strategies and future perspectives to preserve wine quality. Trends Food Sci. Technol. 2021, 112, 547–558. [Google Scholar] [CrossRef] [Scilit]
- Ma, P.; Zhang, Z.; Jia, X.; Peng, X.; Zhang, Z.; Tarwa, K.; Wei, C.-I.; Liu, F.; Wang, Q. Neural network in food analytics. Crit. Rev. Food Sci. Nutr. 2022, 64, 1–19. [Google Scholar] [CrossRef] [Scilit] [PubMed]
- Yang, B.; Bao, W.; Chen, B.; Song, D. Single_cell_GRN: Gene regulatory network identification based on supervised learning method and Single-cell RNA-seq data. BioData Min. 2022, 15, 13. [Google Scholar] [CrossRef] [Scilit] [PubMed]
- Sun, J.; Cong, S.; Mao, H.; Wu, X.; Yang, N. Quantitative detection of mixed pesticide residue of lettuce leaves based on hyperspectral technique. J. Food Process Eng. 2018, 41, e12654. [Google Scholar] [CrossRef] [Scilit]
- Ropelewska, E.; Sabanci, K.; Slavova, V.; Genova, S. The classification of leek seeds based on fluorescence spectroscopic data using machine learning. Eur. Food Res. Technol. 2023, 249, 3217–3226. [Google Scholar] [CrossRef] [Scilit]
- Chen, X.; Hu, Y.; Li, X.; Kong, D.; Guo, M. Fast dentification of overlapping fluorescence spectra of oil species based on LDA and two-dimensional convolutional neural network. Spectrochim. Acta Part A Mol. Biomol. Spectrosc. 2025, 324, 124979. [Google Scholar] [CrossRef] [Scilit] [PubMed]
- Wu, M.; Li, M.; Fan, B.; Sun, Y.; Tong, L.; Wang, F.; Li, L. A rapid and low-cost method for detection of nine kinds of vegetable oil adulteration based on 3-D fluorescence spectroscopy. LWT 2023, 188, 115419. [Google Scholar] [CrossRef] [Scilit]
- Khoshvaght, H.; Permala, R.R.; Razmjou, A.; Khiadani, M. A critical review on selecting performance evaluation metrics for supervised machine learning models in wastewater quality prediction. J. Environ. Chem. Eng. 2025, 13, 119675. [Google Scholar] [CrossRef] [Scilit]
- Li, T.; Zhang, J.; Liu, F.; Dong, S.; Zhou, S.; Jia, Q.; Zhang, Y. Extraction and precise source tracing of mixed wastewater three-dimensional fluorescence spectra based on machine learning techniques. Desalin. Water Treat. 2025, 324, 101455. [Google Scholar] [CrossRef] [Scilit]
- Vimbi, V.; Shaffi, N.; Mahmud, M. Interpreting artificial intelligence models: A systematic review on the application of LIME and SHAP in Alzheimer’s disease detection. Brain Inform. 2024, 11, 10. [Google Scholar] [CrossRef] [Scilit] [PubMed]
- Zou, Z.; Wu, Q.; Wang, J.; Xu, l.; Zhou, M.; Lu, Z.; He, Y.; Wang, Y.; Liu, B.; Zhao, Y. Research on non-destructive testing of hotpot oil quality by fluorescence hyperspectral technology combined with machine learning. Spectrochim. Acta Part A Mol. Biomol. Spectrosc. 2023, 284, 121785. [Google Scholar] [CrossRef] [Scilit] [PubMed]
- Hu, Y.; Wei, C.; Wang, X.; Wang, W.; Jiao, Y. Using three-dimensional fluorescence spectroscopy and machine learning for rapid detection of adulteration in camellia oil. Spectrochim. Acta Part A Mol. Biomol. Spectrosc. 2025, 329, 125524. [Google Scholar] [CrossRef] [Scilit] [PubMed]
- Ji, Y.; Xue, L.; Luan, G.; Li, C. One-pot synthesized multifunctional Zn-MOF/HOF heterostructure sensor array assisted by machine learning for efficient capture, target discrimination and optosmart sensing of doxycycline analogs. J. Hazard. Mater. 2025, 494, 138512. [Google Scholar] [CrossRef] [Scilit] [PubMed]
- Nie, W.; Qian, J.; Zhang, S.; Li, G.; Zhang, J.; Li, W. Rapid origin traceability and quality evaluation of Artemisia argyi Folium empowered by excitation-emission fluorescence spectroscopy and machine learning. Microchem. J. 2025, 212, 113384. [Google Scholar] [CrossRef] [Scilit]
- Batista, T.B.; Mastrangelo, C.B.; de Medeiros, A.D.; Petronilio, A.C.P.; Fonseca de Oliveira, G.R.; dos Santos, I.L.; Crusciol, C.A.C.; Amaral da Silva, E.A. A Reliable Method to Recognize Soybean Seed Maturation Stages Based on Autofluorescence-Spectral Imaging Combined With Machine Learning Algorithms. Front. Plant Sci. 2022, 13, 914287. [Google Scholar] [CrossRef] [Scilit] [PubMed]
- Wu, D.; Sun, X.; Liu, Y.; Liu, C.; Wu, J. The fluorescence spectrum combined with a broad learning system to characterize the content of difenoconazole in cabbage. Anal. Methods 2025, 17, 4764–4770. [Google Scholar] [CrossRef] [Scilit] [PubMed]
- Jiang, S.; Sun, J.; Xin, Z.; Mao, H.; Wu, X.; Li, Q. Visualizing distribution of pesticide residues in mulberry leaves using NIR hyperspectral imaging. J. Food Process Eng. 2017, 40, e12510. [Google Scholar] [CrossRef] [Scilit]
- Aydin, E. Investigation of some bioactive compounds, in vitro bioaccessibility, and sensory acceptability of couscous produced by pre-gelatinized rice flour. J. Sci. Food Agric. 2023, 103, 2207–2214. [Google Scholar] [CrossRef] [Scilit] [PubMed]
- Venturini, F.; Michelucci, U.; Magnus, I.; Smeesters, L. Multi-mycotoxin detection using fluorescence spectroscopy and machine learning. Food Control 2026, 181, 111728. [Google Scholar] [CrossRef] [Scilit]
- Bertani, F.R.; Businaro, L.; Gambacorta, L.; Mencattini, A.; Brenda, D.; Di Giuseppe, D.; De Ninno, A.; Solfrizzo, M.; Martinelli, E.; Gerardino, A. Optical detection of aflatoxins B in grained almonds using fluorescence spectroscopy and machine learning algorithms. Food Control 2020, 112, 107073. [Google Scholar] [CrossRef] [Scilit]
- Wu, X.; Zhao, Z.; Tian, R.; Niu, Y.; Gao, S.; Liu, H. Total synchronous fluorescence spectroscopy coupled with deep learning to rapidly identify the authenticity of sesame oil. Spectrochim. Acta Part A Mol. Biomol. Spectrosc. 2021, 244, 118841. [Google Scholar] [CrossRef] [Scilit] [PubMed]
- Hu, L.; Zhang, Y.; Ju, Y.; Meng, X.; Yin, C. Rapid identification of rice geographical origin and adulteration by excitation-emission matrix fluorescence spectroscopy combined with chemometrics based on fluorescence probe. Food Control 2023, 146, 109547. [Google Scholar] [CrossRef] [Scilit]
- Wu, C.; Chang, H.; Chen, X.; Yang, S.; Dai, Y.; Tan, P.; Chen, Y.; Shen, C.; Lu, Z.; Sun, M.; et al. Deep Learning-Assisted Rapid Assessment of Food Freshness Using an Anti-interfering Triple-Emission Ratiometric Fluorescent Sensor. ACS Sustain. Chem. Eng. 2024, 12, 2465–2475. [Google Scholar] [CrossRef] [Scilit]
- Geng, D.; Chen, B.; Chen, M. Polarization perturbation 2D correlation fluorescence spectroscopy of edible oils: A pilot study. J. Food Meas. Charact. 2019, 13, 1566–1573. [Google Scholar] [CrossRef] [Scilit]
- Zhang, C.; Xiao, L.; Wang, J.J.; Song, Q.; Miao, S. Advancing microplastics detection and prediction: Integrating traditional methods with machine learning for environmental and food safety application. Trends Food Sci. Technol. 2025, 159, 104964. [Google Scholar] [CrossRef] [Scilit]
- Rutherford, J.W.; Larson, T.V.; Gould, T.; Seto, E.; Novosselov, I.V.; Posner, J.D. Source apportionment of environmental combustion sources using excitation emission matrix fluorescence spectroscopy and machine learning. Atmos. Environ. 2021, 259, 118501. [Google Scholar] [CrossRef] [Scilit] [PubMed]
- Xia, F.; Fan, T.; Chen, Y.; Ding, D.; Wei, J.; Jiang, D.; Deng, S. Prediction of Heavy Metal Concentrations in Contaminated Sites from Portable X-ray Fluorescence Spectrometer Data Using Machine Learning. Processes 2022, 10, 536. [Google Scholar] [CrossRef] [Scilit]
- Merck, N.; Otto, J.; Schaeper, M.; Damaschke, N. A non-contact in situ approach for detecting fluorescent microplastic particles in flowing water using fluorescence spectroscopy. Environ. Sci. Adv. 2026, 5, 206–220. [Google Scholar] [CrossRef] [Scilit]
- Zhang, X.; Zhang, Y.; Yang, X.; Wang, Z.; Liu, X. Biochemical Oxygen Demand Prediction Based on Three-Dimensional Fluorescence Spectroscopy and Machine Learning. Sensors 2025, 25, 711. [Google Scholar] [CrossRef] [Scilit] [PubMed]
- Beleites, C.; Neugebauer, U.; Bocklitz, T.; Krafft, C.; Popp, J. Sample size planning for classification models. Anal. Chim. Acta 2013, 760, 25–33. [Google Scholar] [CrossRef] [Scilit] [PubMed]
- Ho, S.Y.; Phua, K.; Wong, L.; Bin Goh, W.W. Extensions of the External Validation for Checking Learned Model Interpretability and Generalizability. Patterns 2020, 1, 100129. [Google Scholar] [CrossRef] [Scilit] [PubMed]
- Holman, A.P.; Kurouski, D. Cross-study validation and guidance for resampling approaches for partial least squares discriminant analysis in spectral machine learning. Anal. Chim. Acta 2026, 1414, 345655. [Google Scholar] [CrossRef] [Scilit] [PubMed]
- Feudale, R.N.; Woody, N.A.; Tan, H.; Myles, A.J.; Brown, S.D.; Ferré, J. Transfer of multivariate calibration models: A review. Chemom. Intell. Lab. Syst. 2002, 64, 181–192. [Google Scholar] [CrossRef] [Scilit]
- Nemeth, F.B.; Leopold-Kerschbaumer, N.; Debreceni, D.; Fleischmann, F.; Borbely, K.; Mazurencu-Marinescu-Pele, D.; Bocklitz, T.; Žigman, M.; Kepesidis, K.V. Bridging Spectral Gaps: Cross-Device Model Generalization in Blood-Based Infrared Spectroscopy. Anal. Chem. 2025, 97, 10264–10272. [Google Scholar] [CrossRef] [Scilit] [PubMed]
- Devos, O.; Ruckebusch, C.; Durand, A.; Duponchel, L.; Huvenne, J.-P. Support vector machines (SVM) in near infrared (NIR) spectroscopy: Focus on parameters optimization and model interpretation. Chemom. Intell. Lab. Syst. 2009, 96, 27–33. [Google Scholar] [CrossRef] [Scilit]
- Zhao, Z.; Wu, X.; Liu, H. Vision transformer for quality identification of sesame oil with stereoscopic fluorescence spectrum image. LWT 2022, 158, 113173. [Google Scholar] [CrossRef] [Scilit]
- Gariso, R.; Coutinho, J.P.L.; Rato, T.J.; Reis, M.S. A comparative analysis of deep learning and chemometric approaches for spectral data modeling. Anal. Chim. Acta 2025, 1347, 343766. [Google Scholar] [CrossRef] [Scilit] [PubMed]
- Guo, W.; Zhu, H.; Wang, X.; Han, Z. Self-supervised learning for aflatoxin B1 detection using masked spectra. Food Chem. 2026, 508, 148342. [Google Scholar] [CrossRef] [Scilit] [PubMed]
- Zareef, M.; Arslan, M.; Ahmad, W.; Hassan, M.M.; Shoaib, M.; Ouyang, Q.; Li, H.; Hashim, M.M.; Javaria, S.; Chen, Q. Applications of benchtop and portable spectroscopy techniques for food quality monitoring. Spectrochim. Acta Part A Mol. Biomol. Spectrosc. 2026, 344, 126713. [Google Scholar] [CrossRef] [Scilit] [PubMed]
- Morais, C.L.M.; Paraskevaidi, M.; Cui, L.; Fullwood, N.J.; Isabelle, M.; Lima, K.M.G.; Martin-Hirsch, P.L.; Sreedhar, H.; Trevisan, J.; Walsh, M.J.; et al. Standardization of complex biologically derived spectrochemical datasets. Nat. Protoc. 2019, 14, 1546–1577. [Google Scholar] [CrossRef] [Scilit] [PubMed]
- Wilkinson, M.D.; Dumontier, M.; Aalbersberg, I.J.; Appleton, G.; Axton, M.; Baak, A.; Blomberg, N.; Boiten, J.-W.; da Silva Santos, L.B.; Bourne, P.E.; et al. The FAIR Guiding Principles for scientific data management and stewardship. Sci. Data 2016, 3, 160018. [Google Scholar] [CrossRef] [Scilit] [PubMed]
- Jiang, Y.; Wang, D.; Wang, Z.; Dai, H.; Wang, C.; Wang, Y. Recent Advances in Spectroscopy and Imaging Techniques for Nondestructive Detection of Meat Quality and Safety. Food Sci. Nutr. 2025, 13, e71303. [Google Scholar] [CrossRef] [Scilit] [PubMed]
- Lu, S.; Peng, K.; Feng, P.; Lin, C.; Geng, Q.; Zhang, J. Compton Camera X-Ray Fluorescence Imaging Design and Image Reconstruction Algorithm Optimization. J. Imaging 2025, 11, 300. [Google Scholar] [CrossRef] [Scilit] [PubMed]
- Cui, S.; Wang, K.; Yang, Y.; Lv, X.; Li, X. An integrated and paper-based microfluidic system employing LAMP-CRISPR and equipped with a portable device for simultaneous detection of pathogens. Anal. Bioanal. Chem. 2025, 417, 785–797. [Google Scholar] [CrossRef] [Scilit] [PubMed]
- Sharma, R.; Jesubalan, N.G.; Rathore, A.S. Application of ensemble learning to augment fluorescence-based PAT and enable real-time monitoring of protein refolding. Biochem. Eng. J. 2024, 204, 109252. [Google Scholar] [CrossRef] [Scilit]
- Li, G.; Park, S.; Kim, H.; Hilal, M.; Cai, Z. Artificial intelligence-enabled MOS gas sensors: Towards Selective and intelligent detection in complex environments. Sens. Actuators A Phys. 2026, 400, 117502. [Google Scholar] [CrossRef] [Scilit]
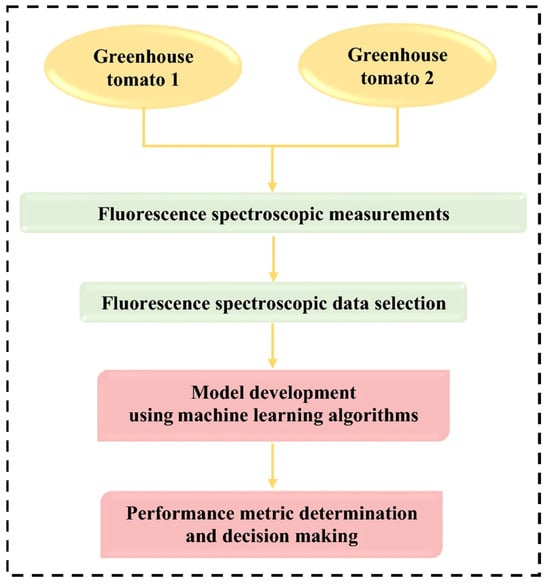
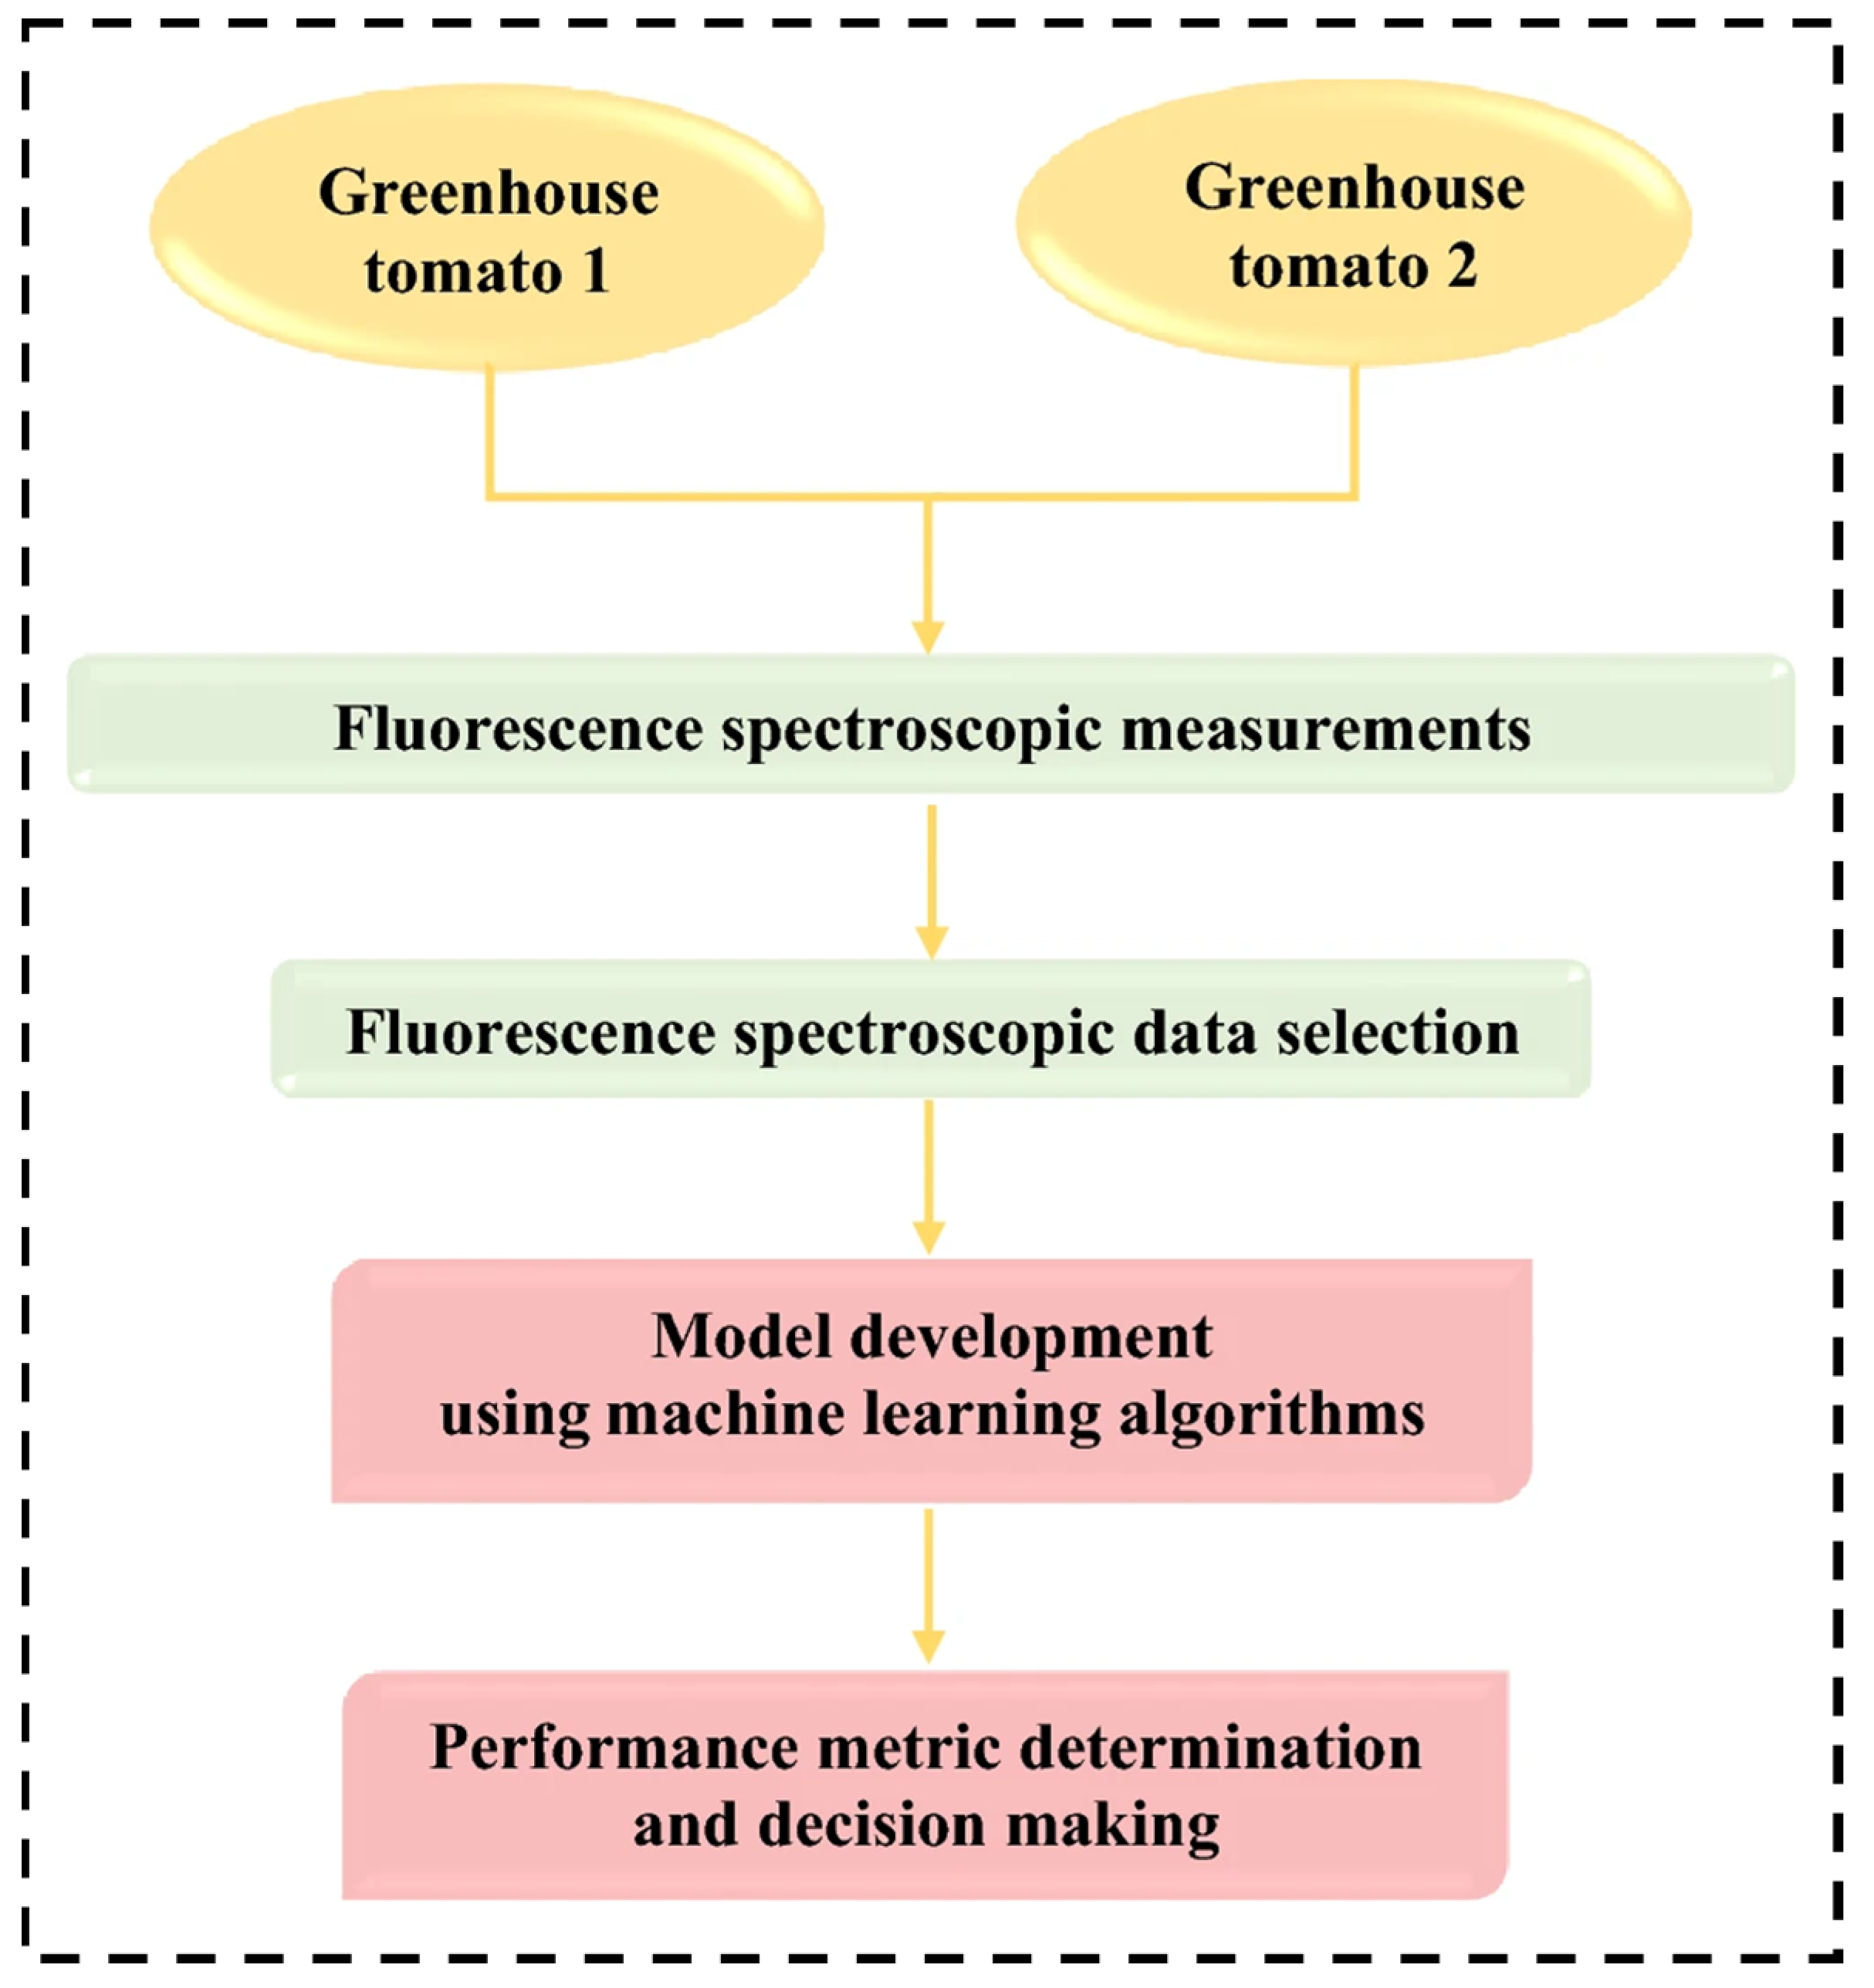
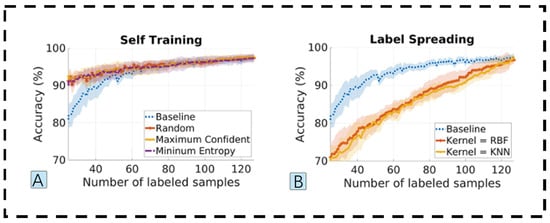
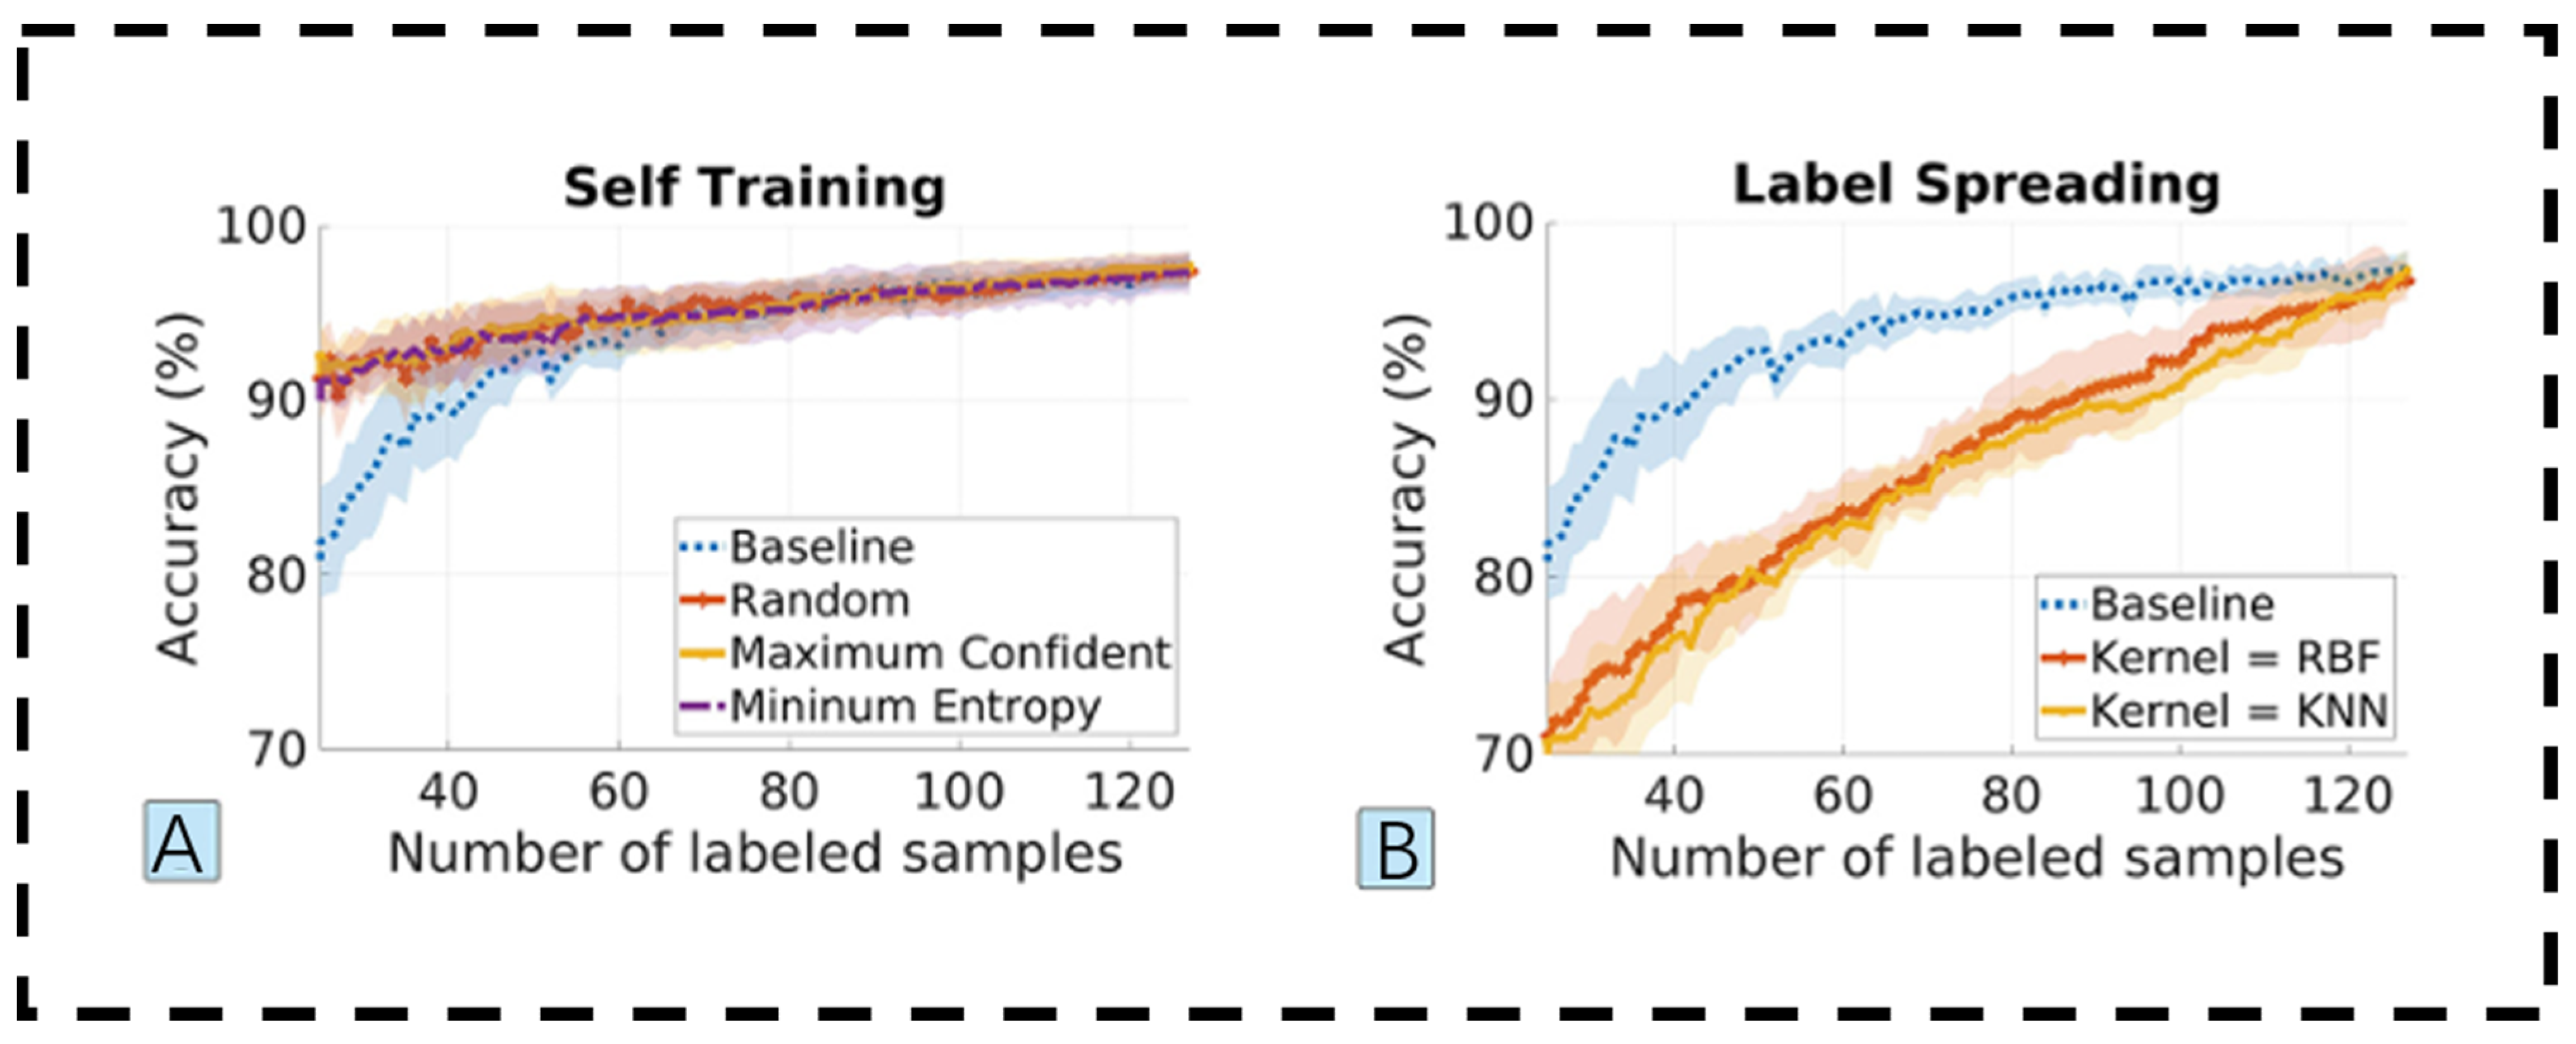
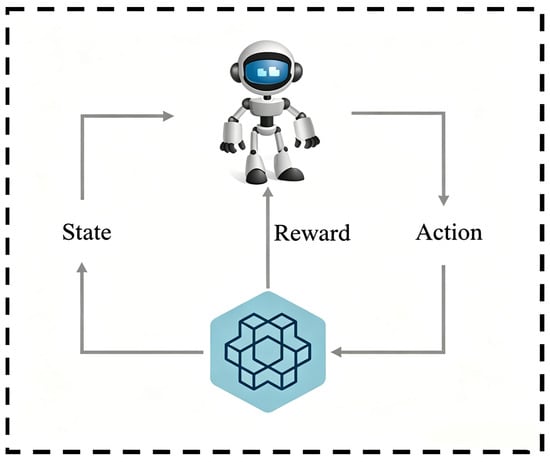
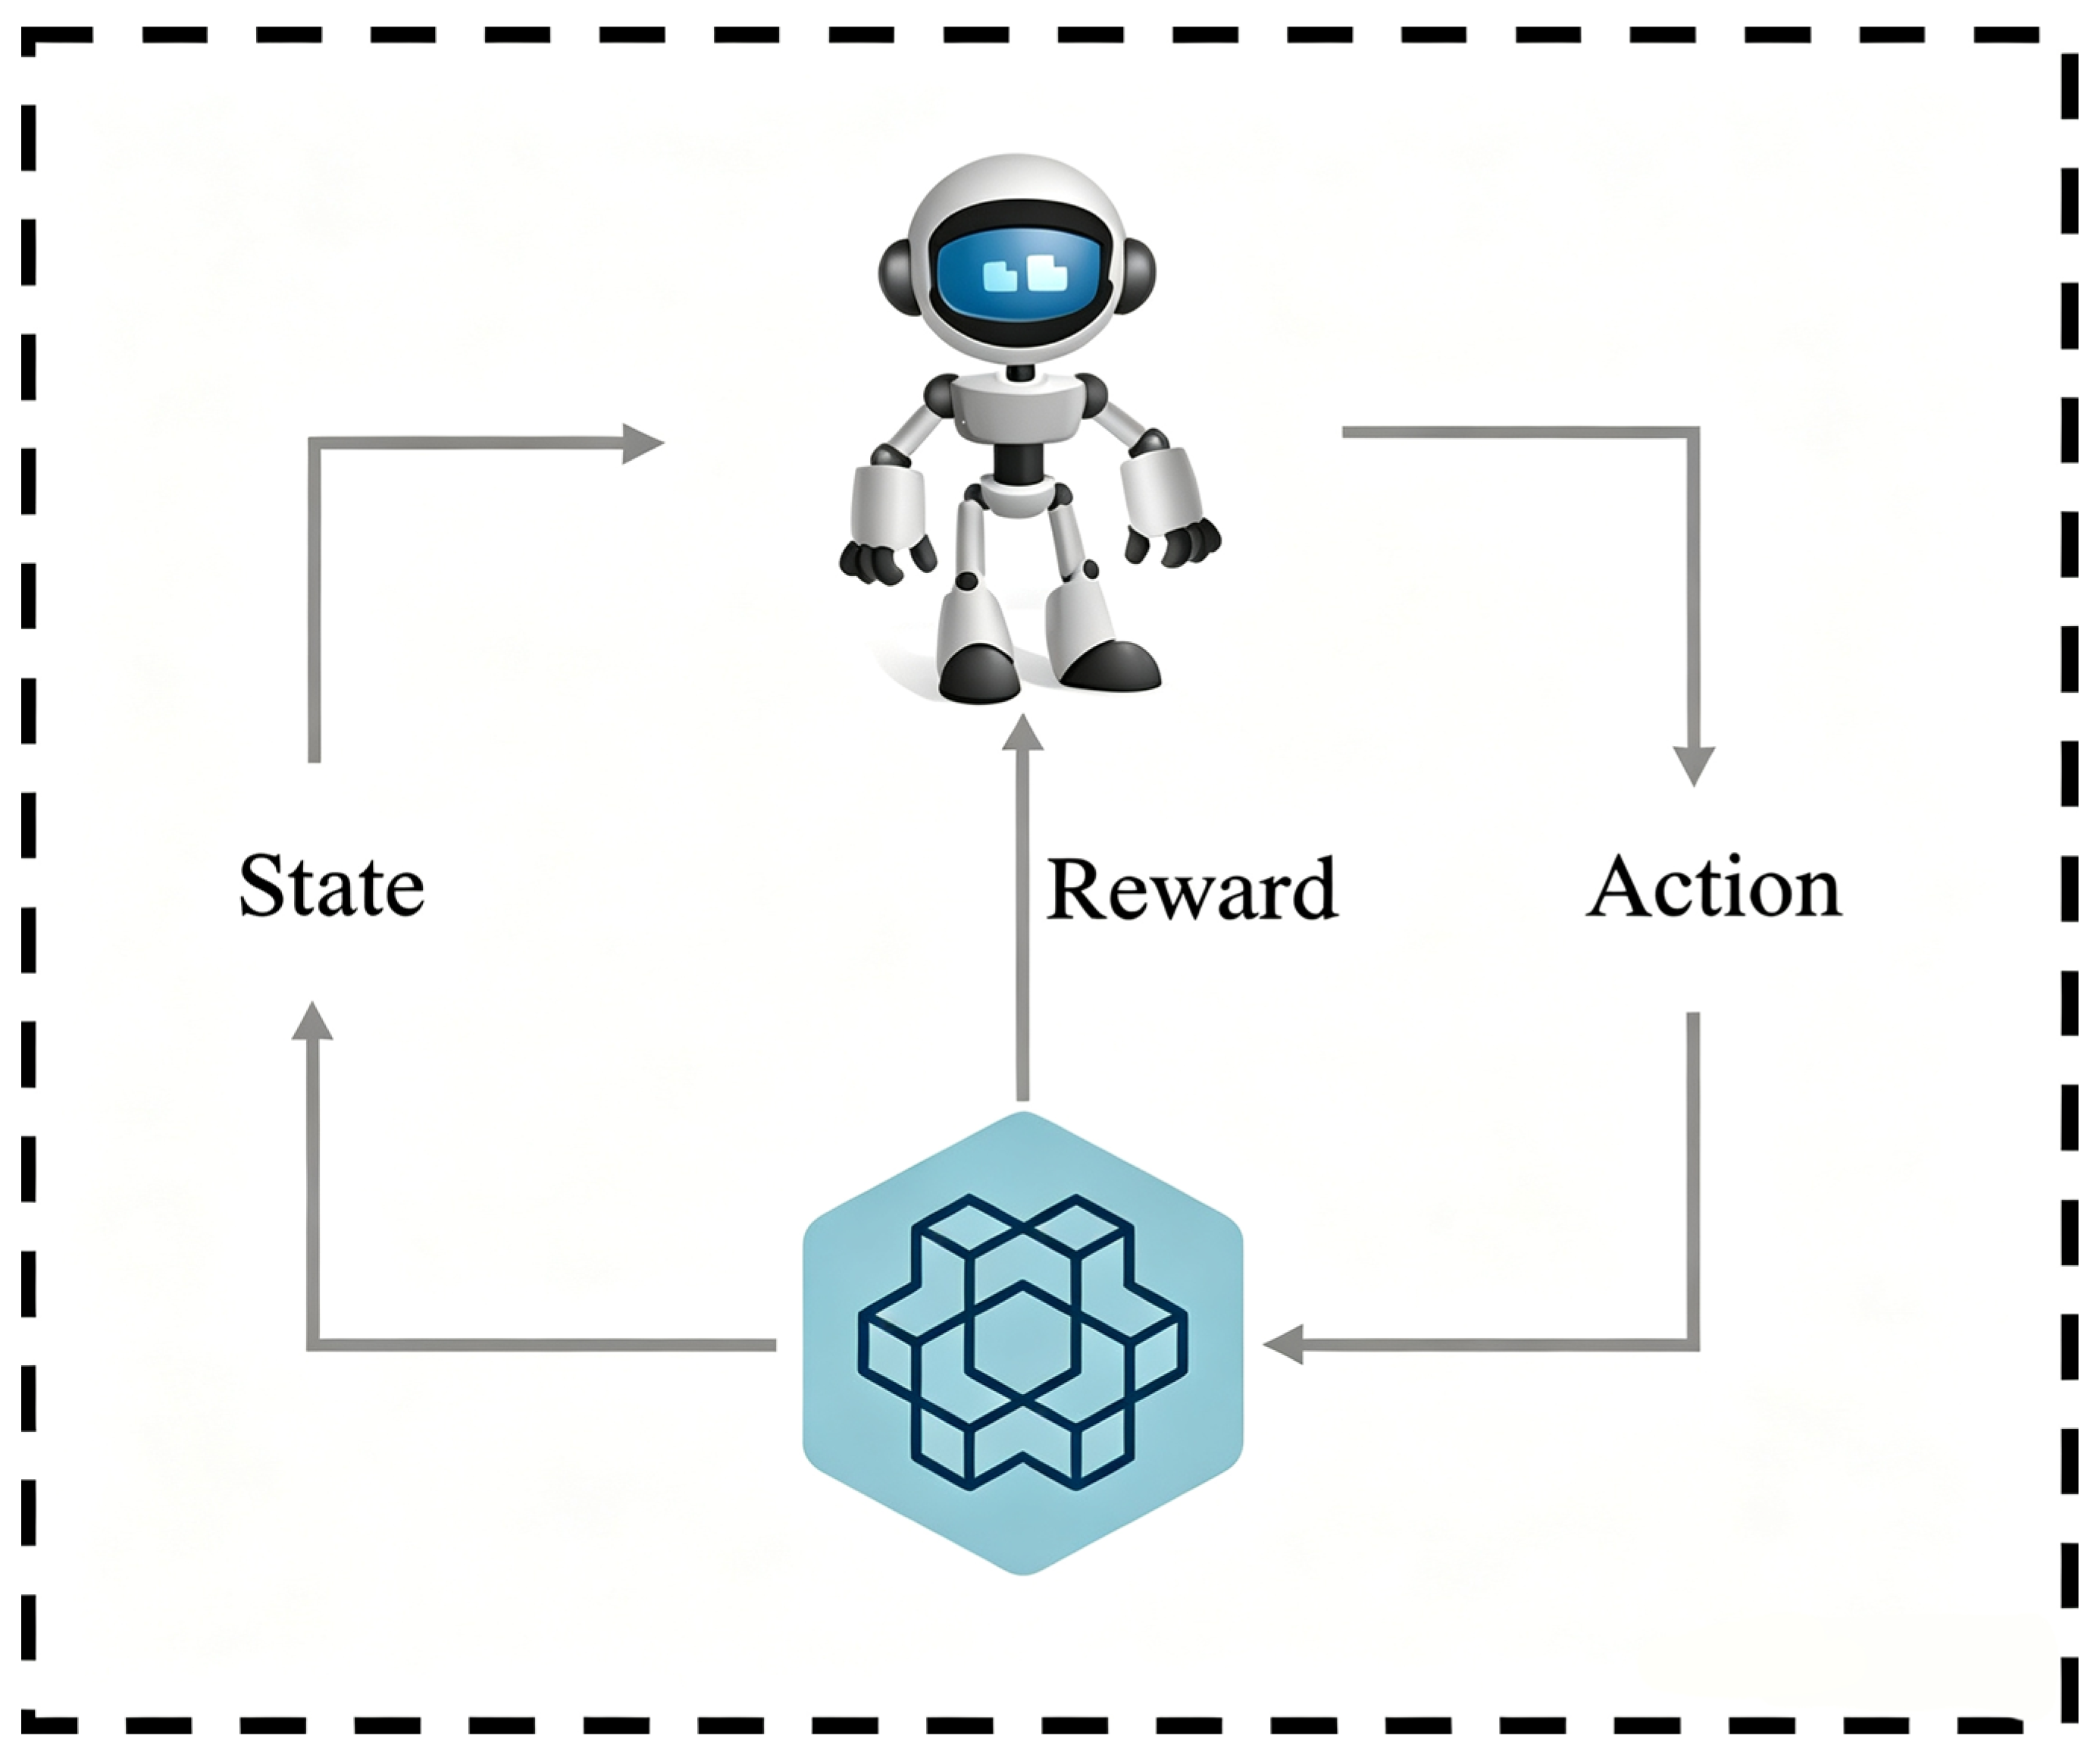
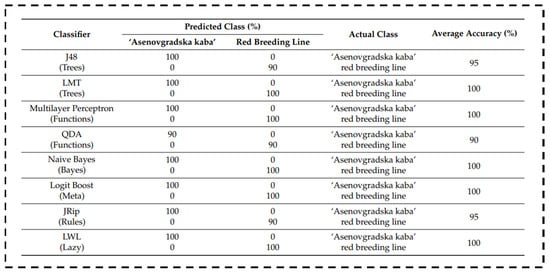
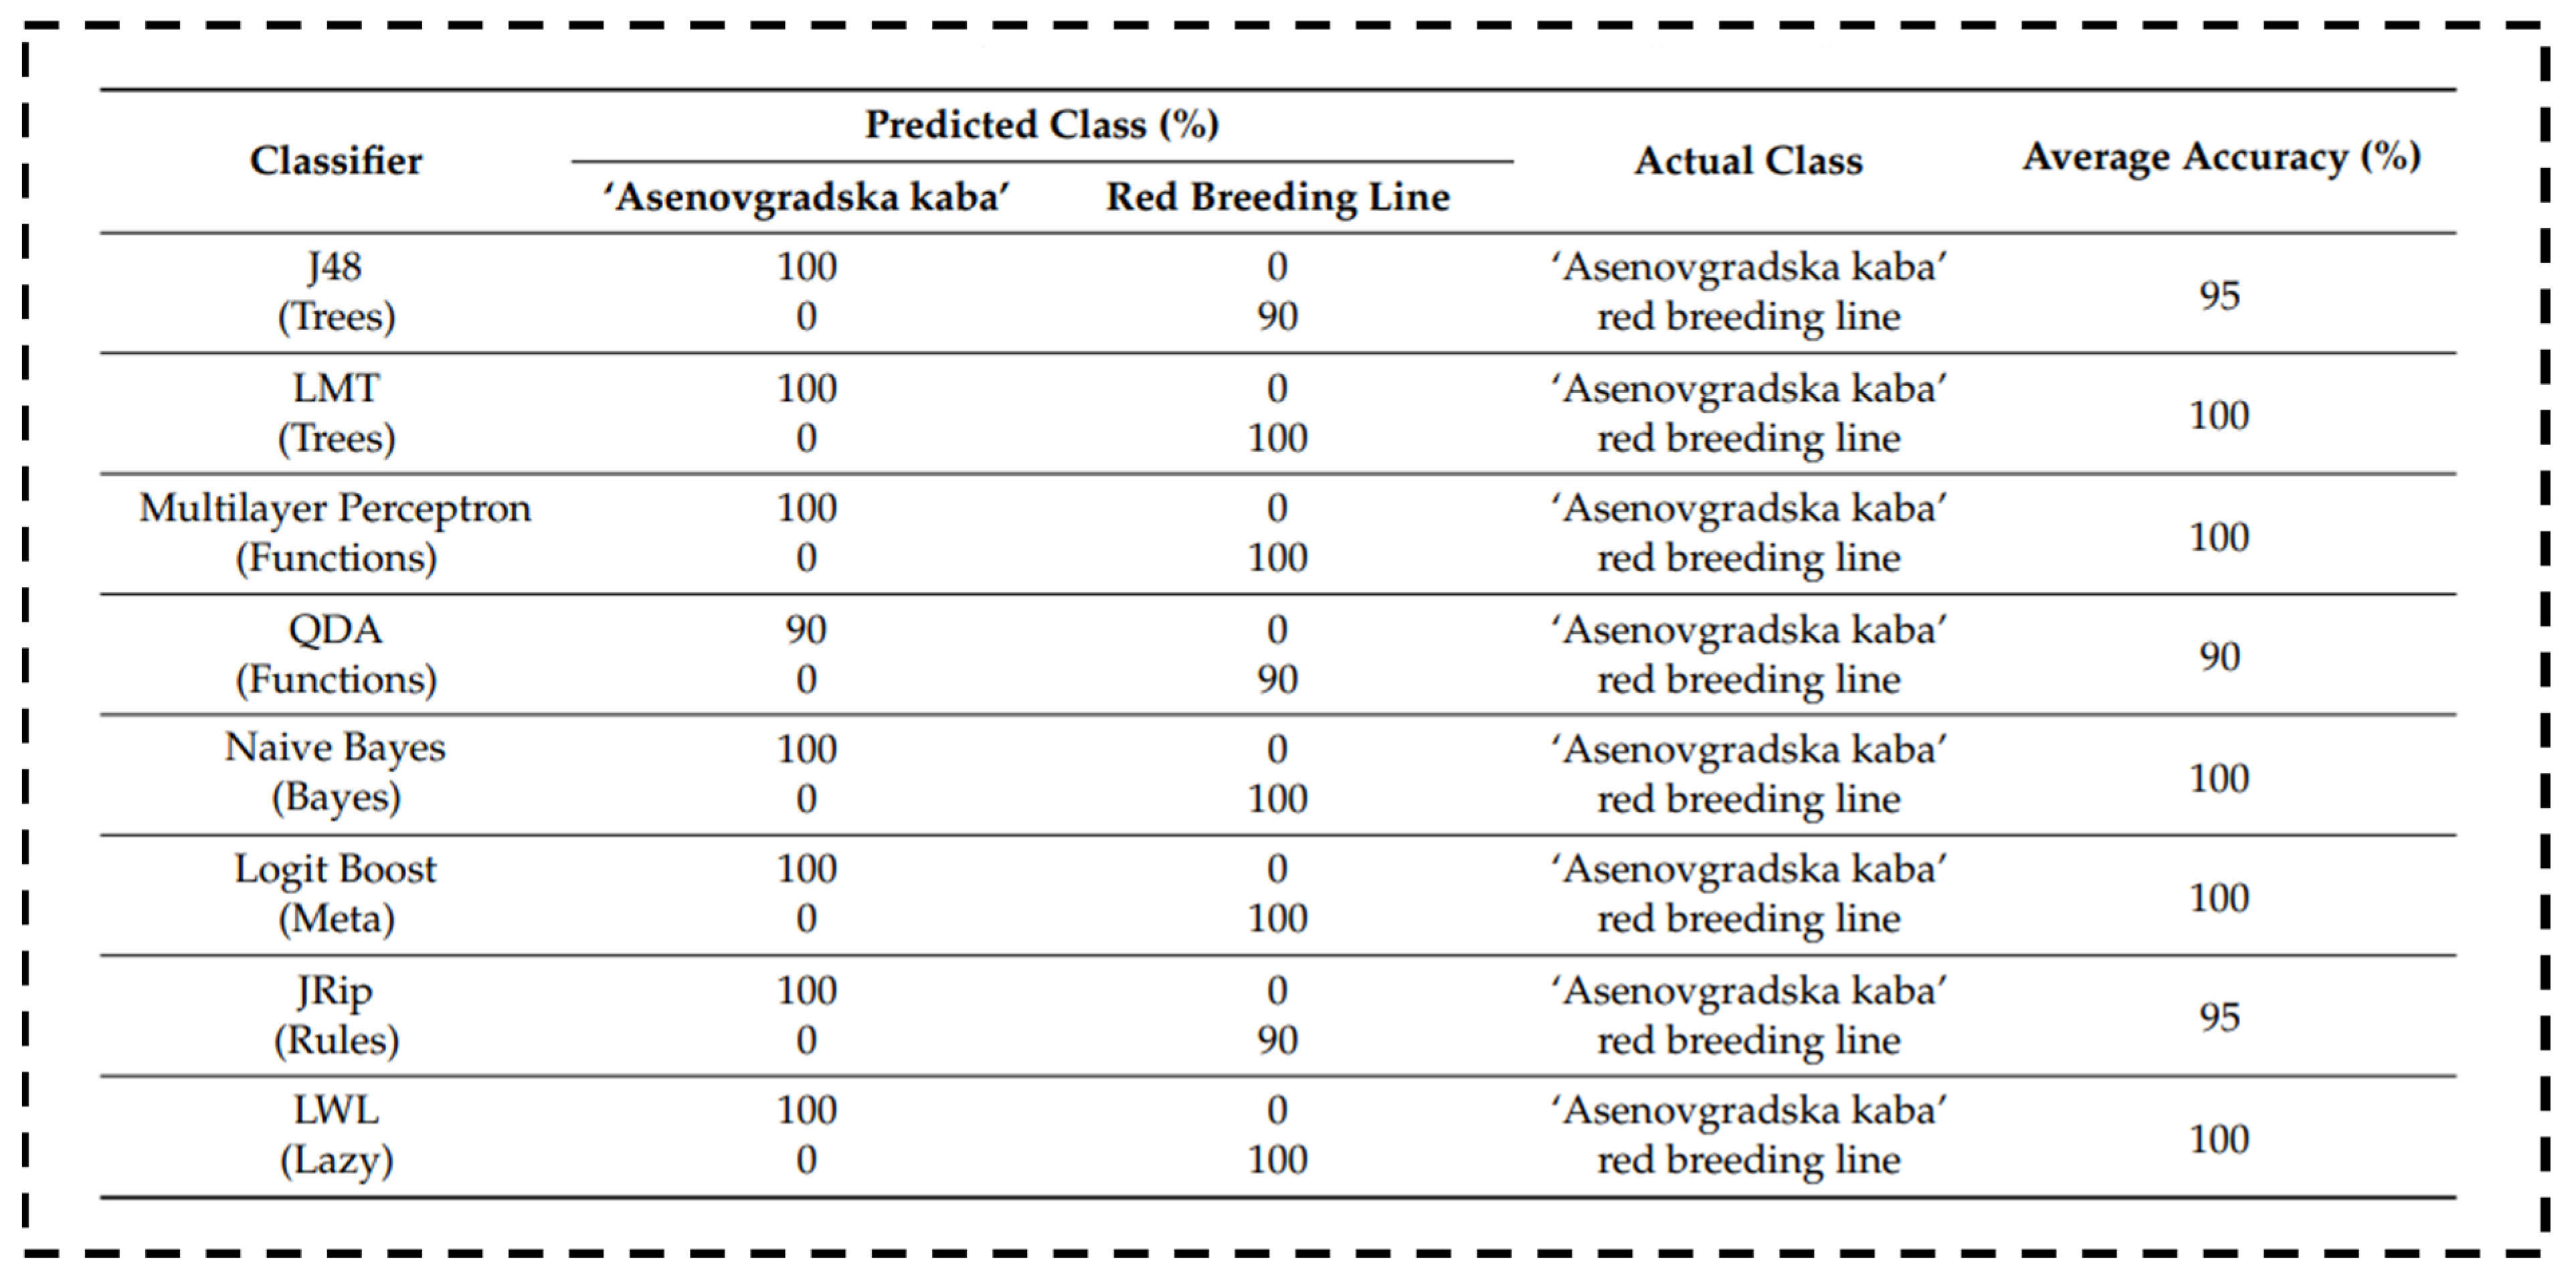
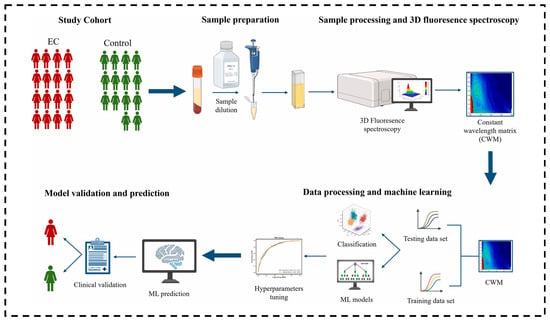
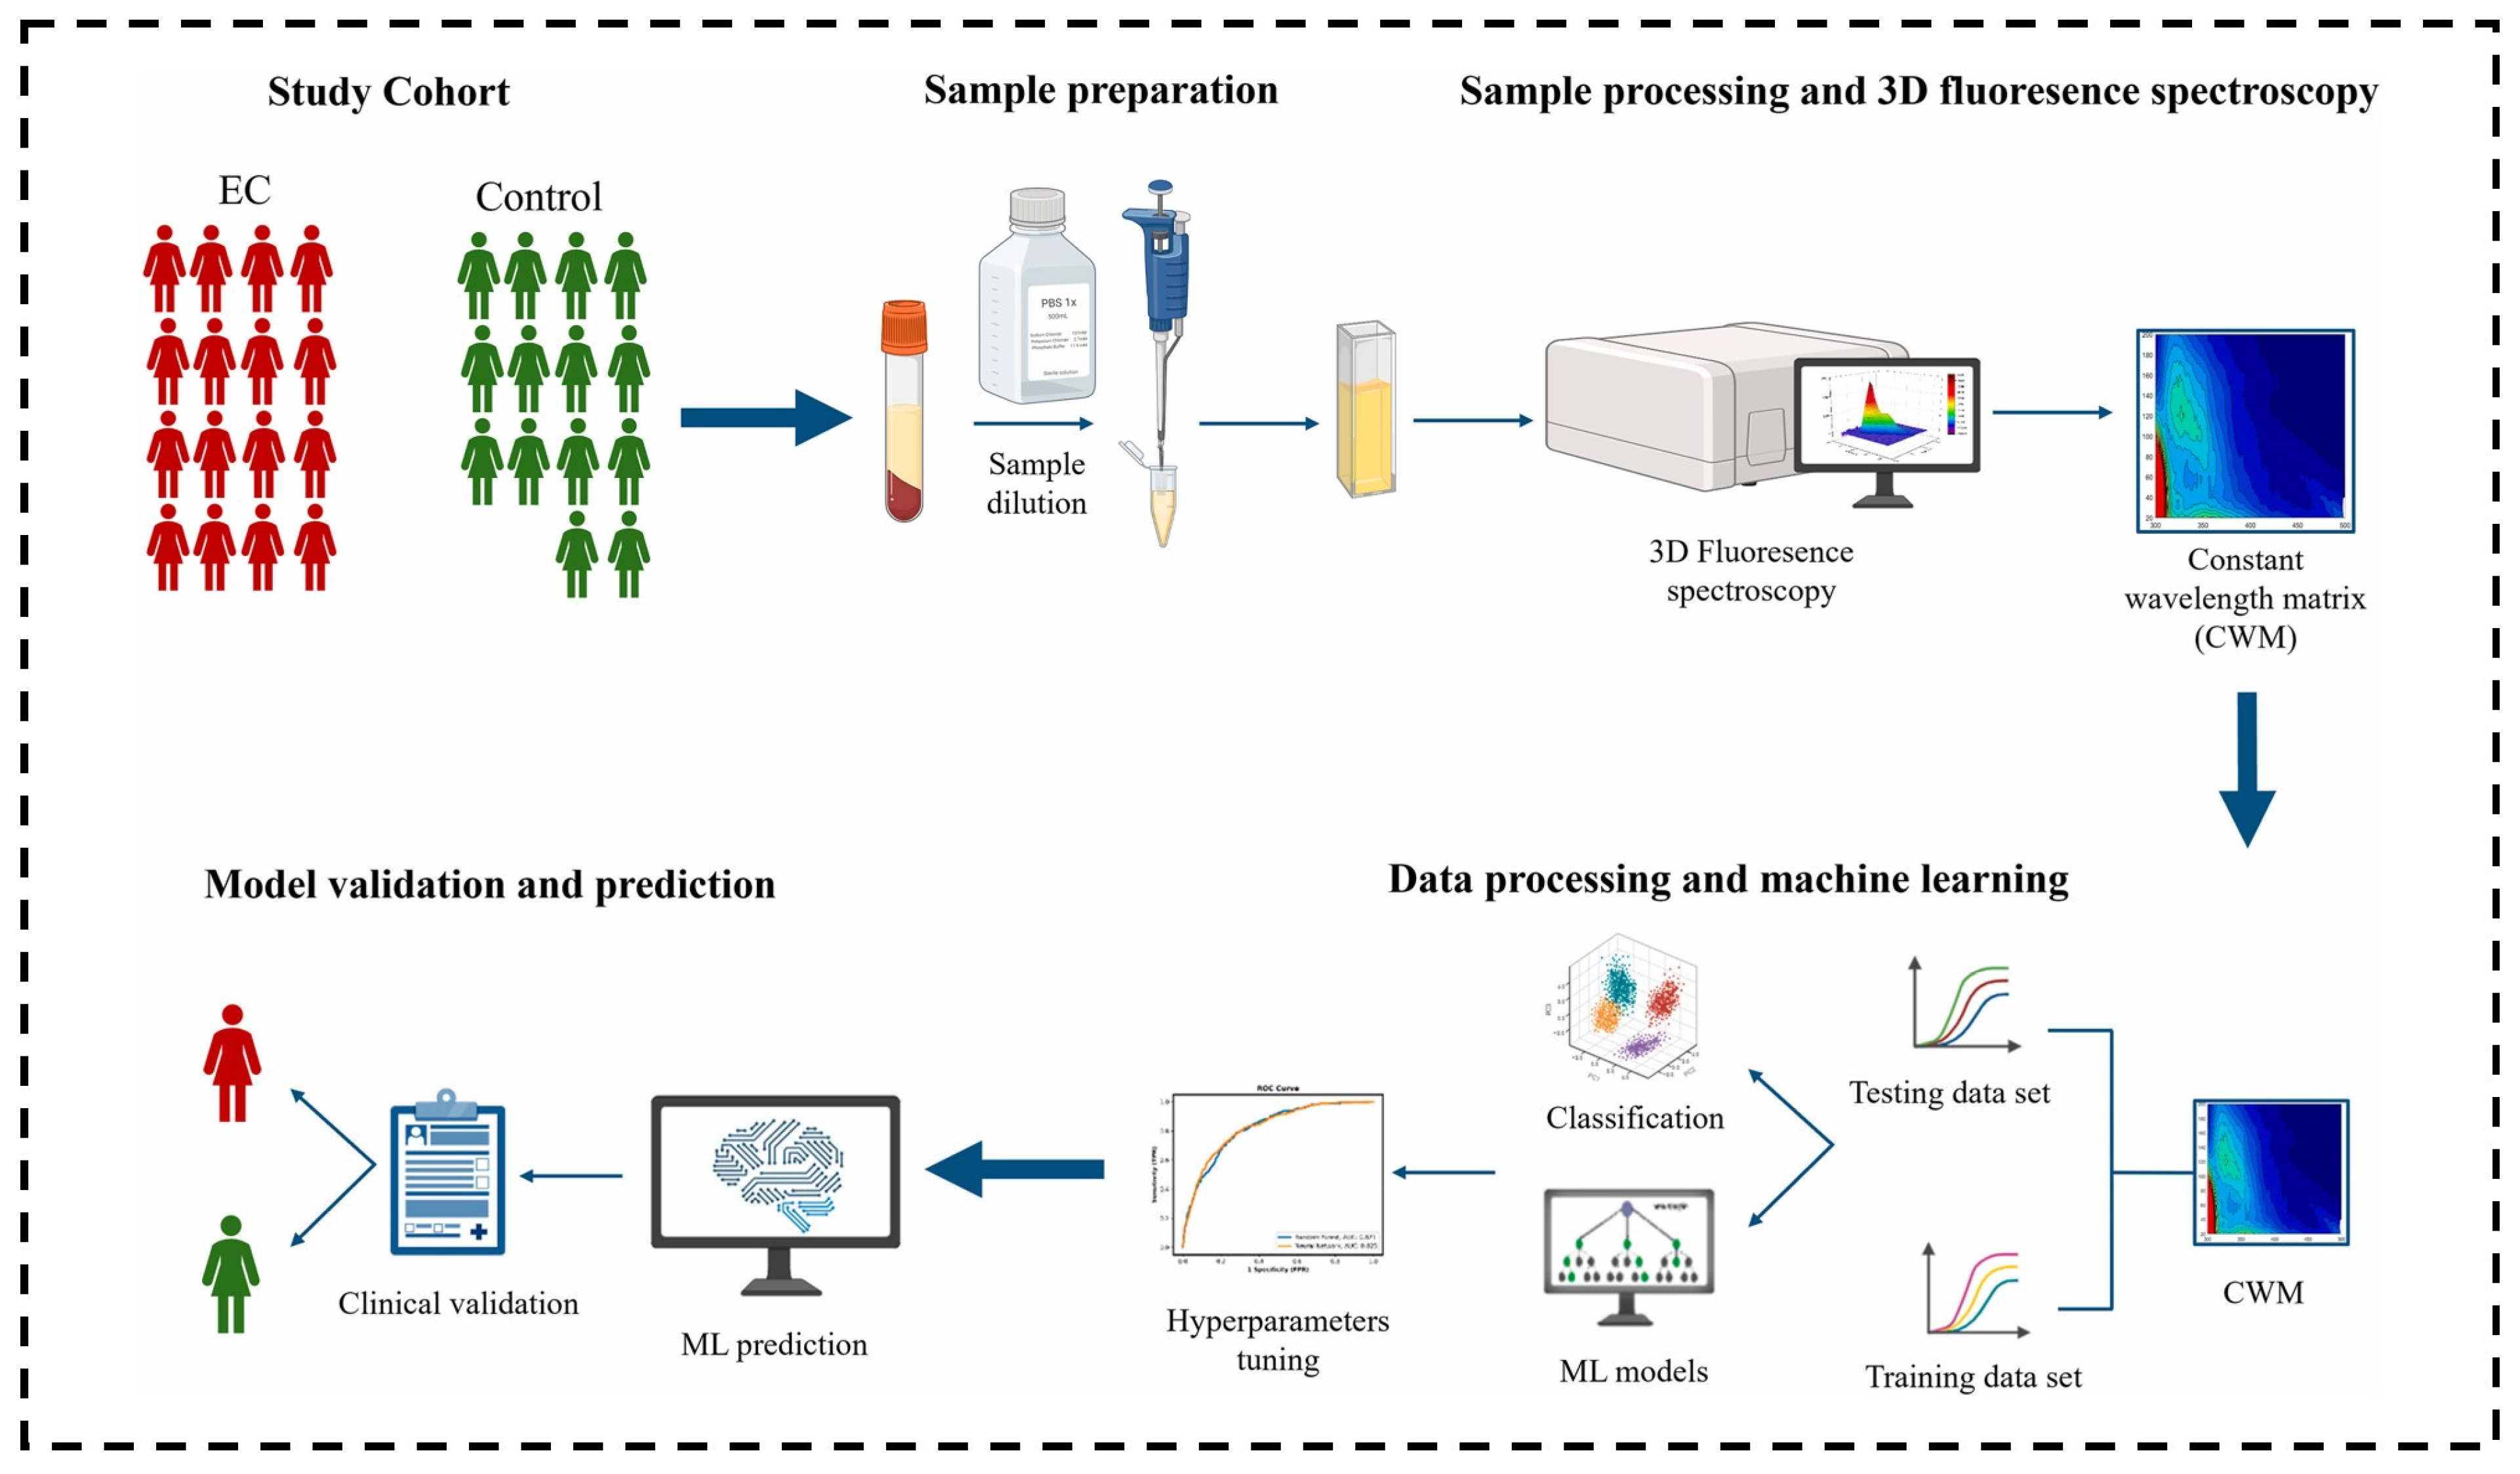
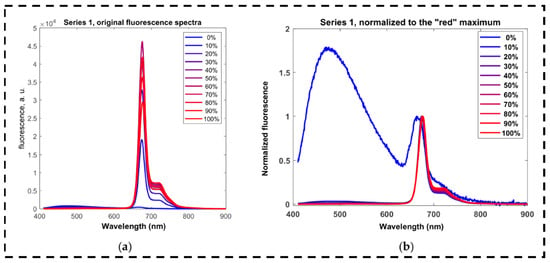
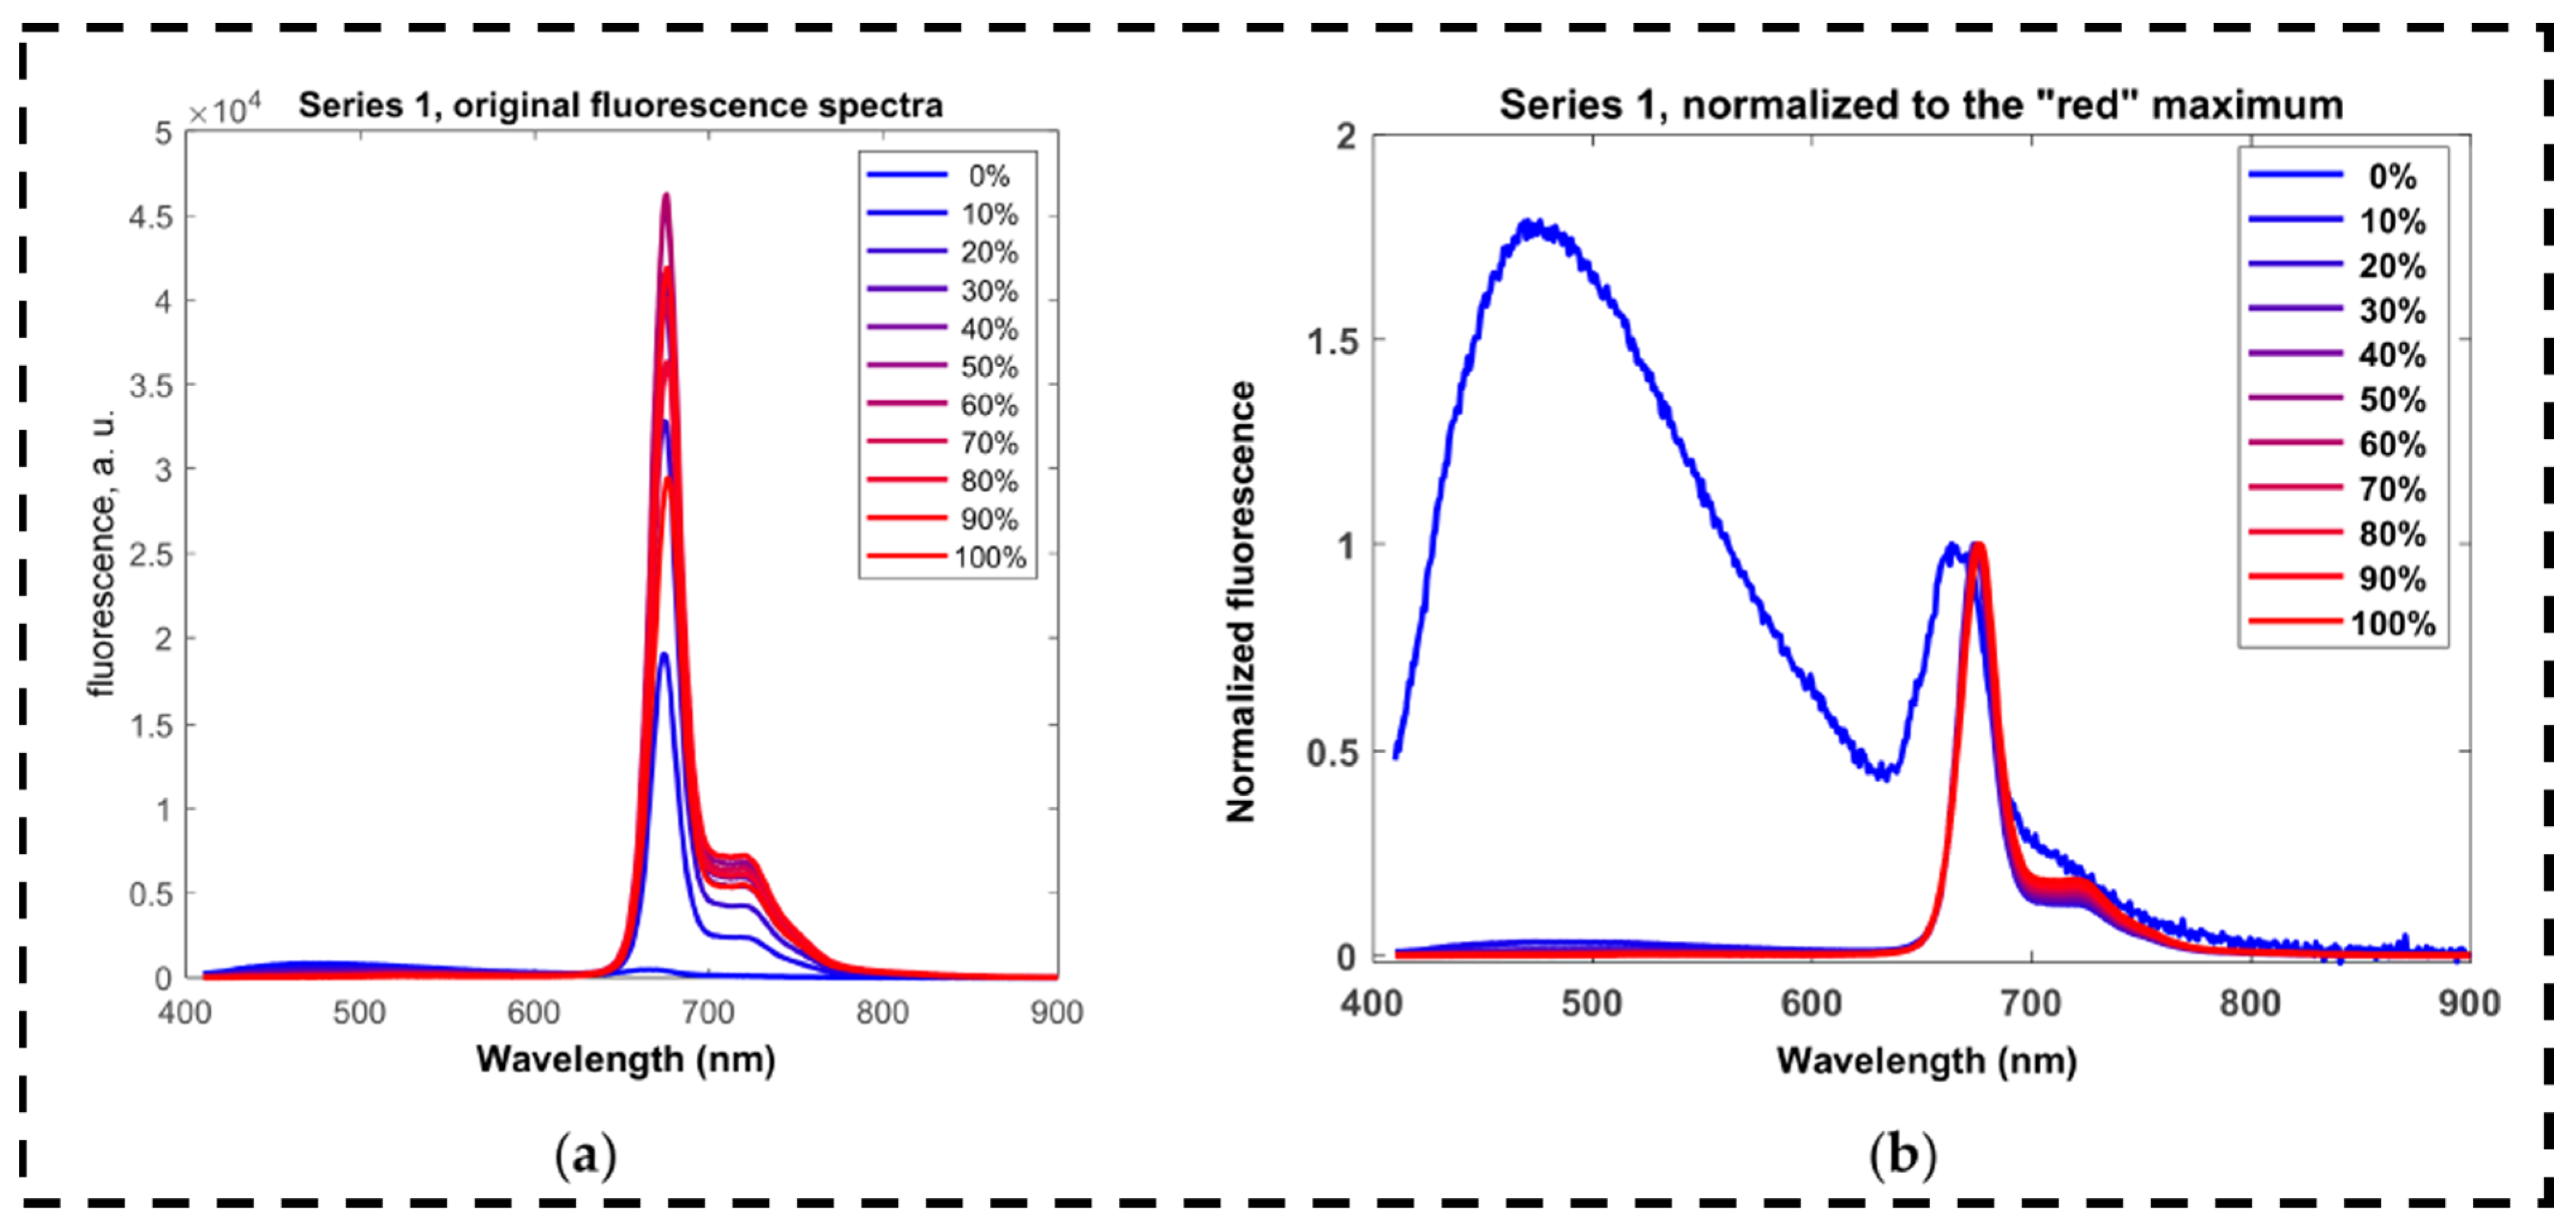
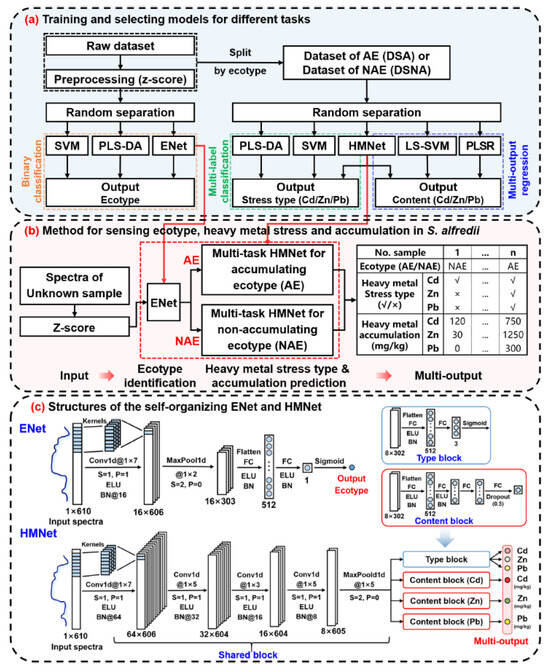
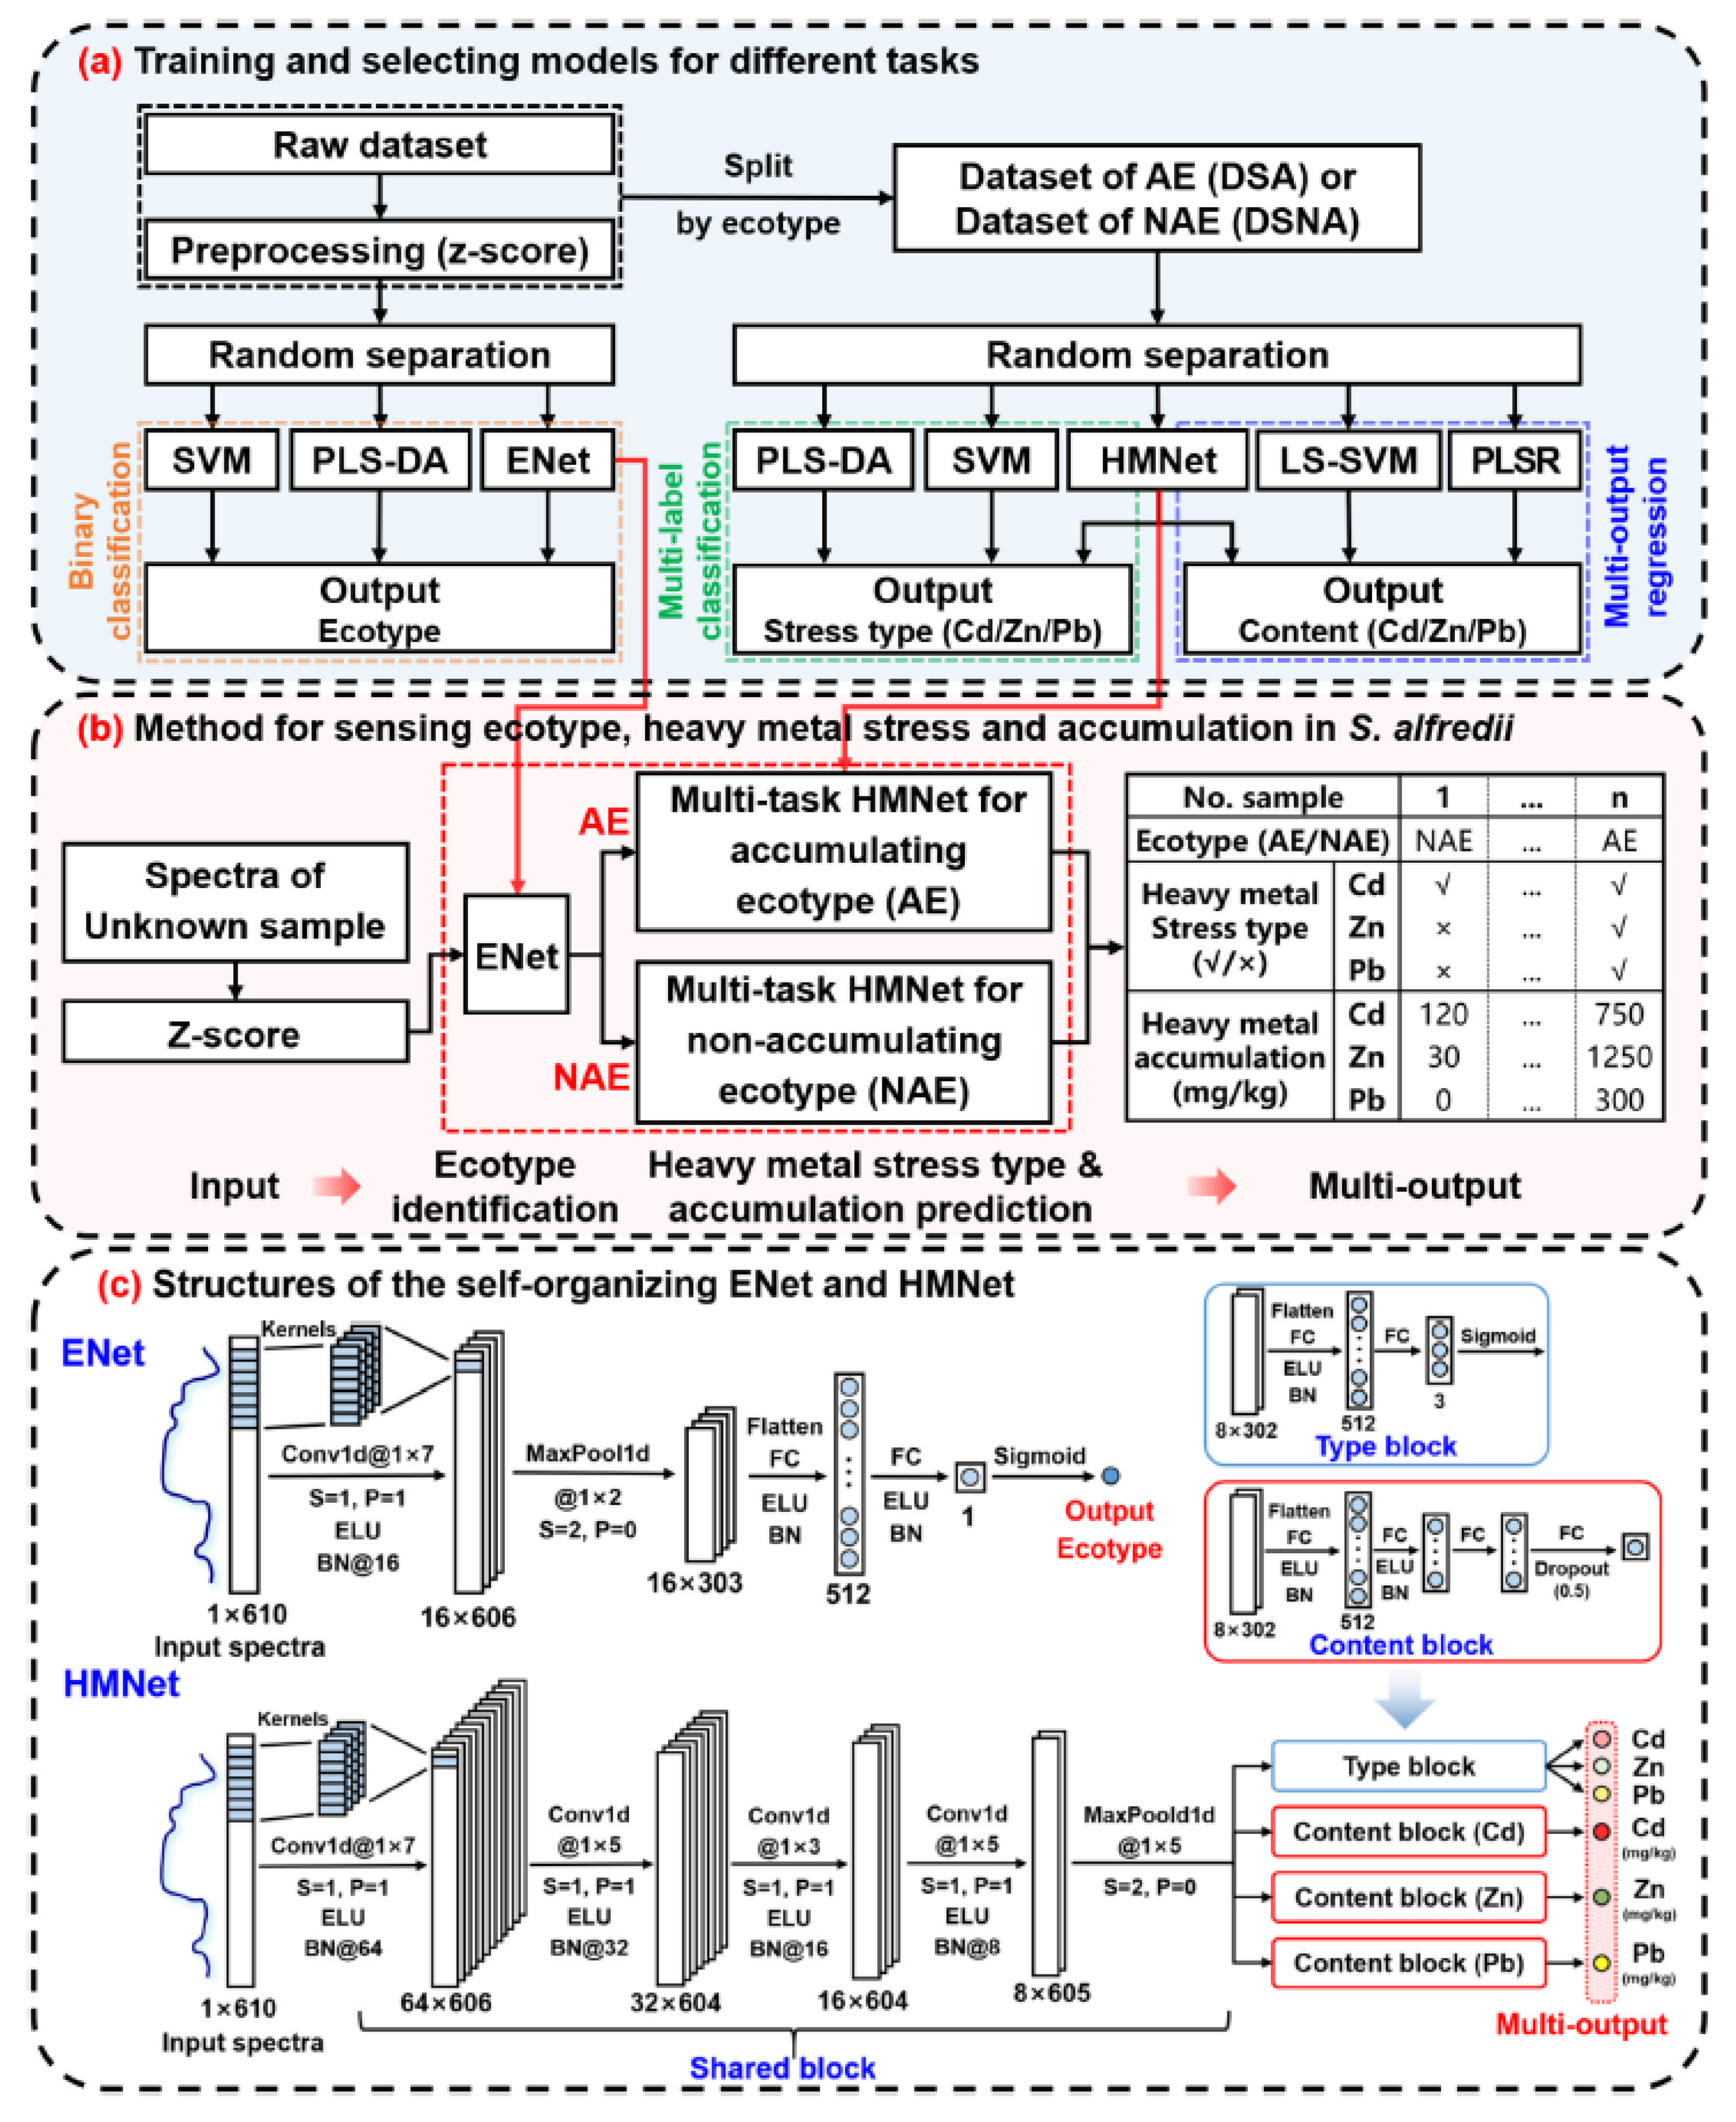
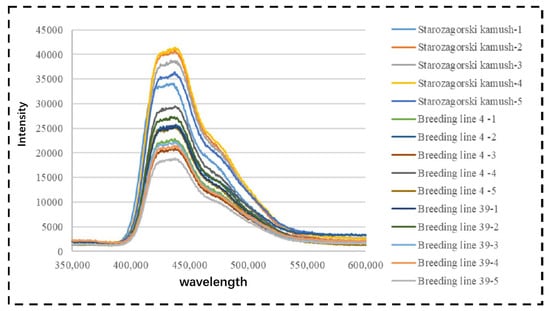
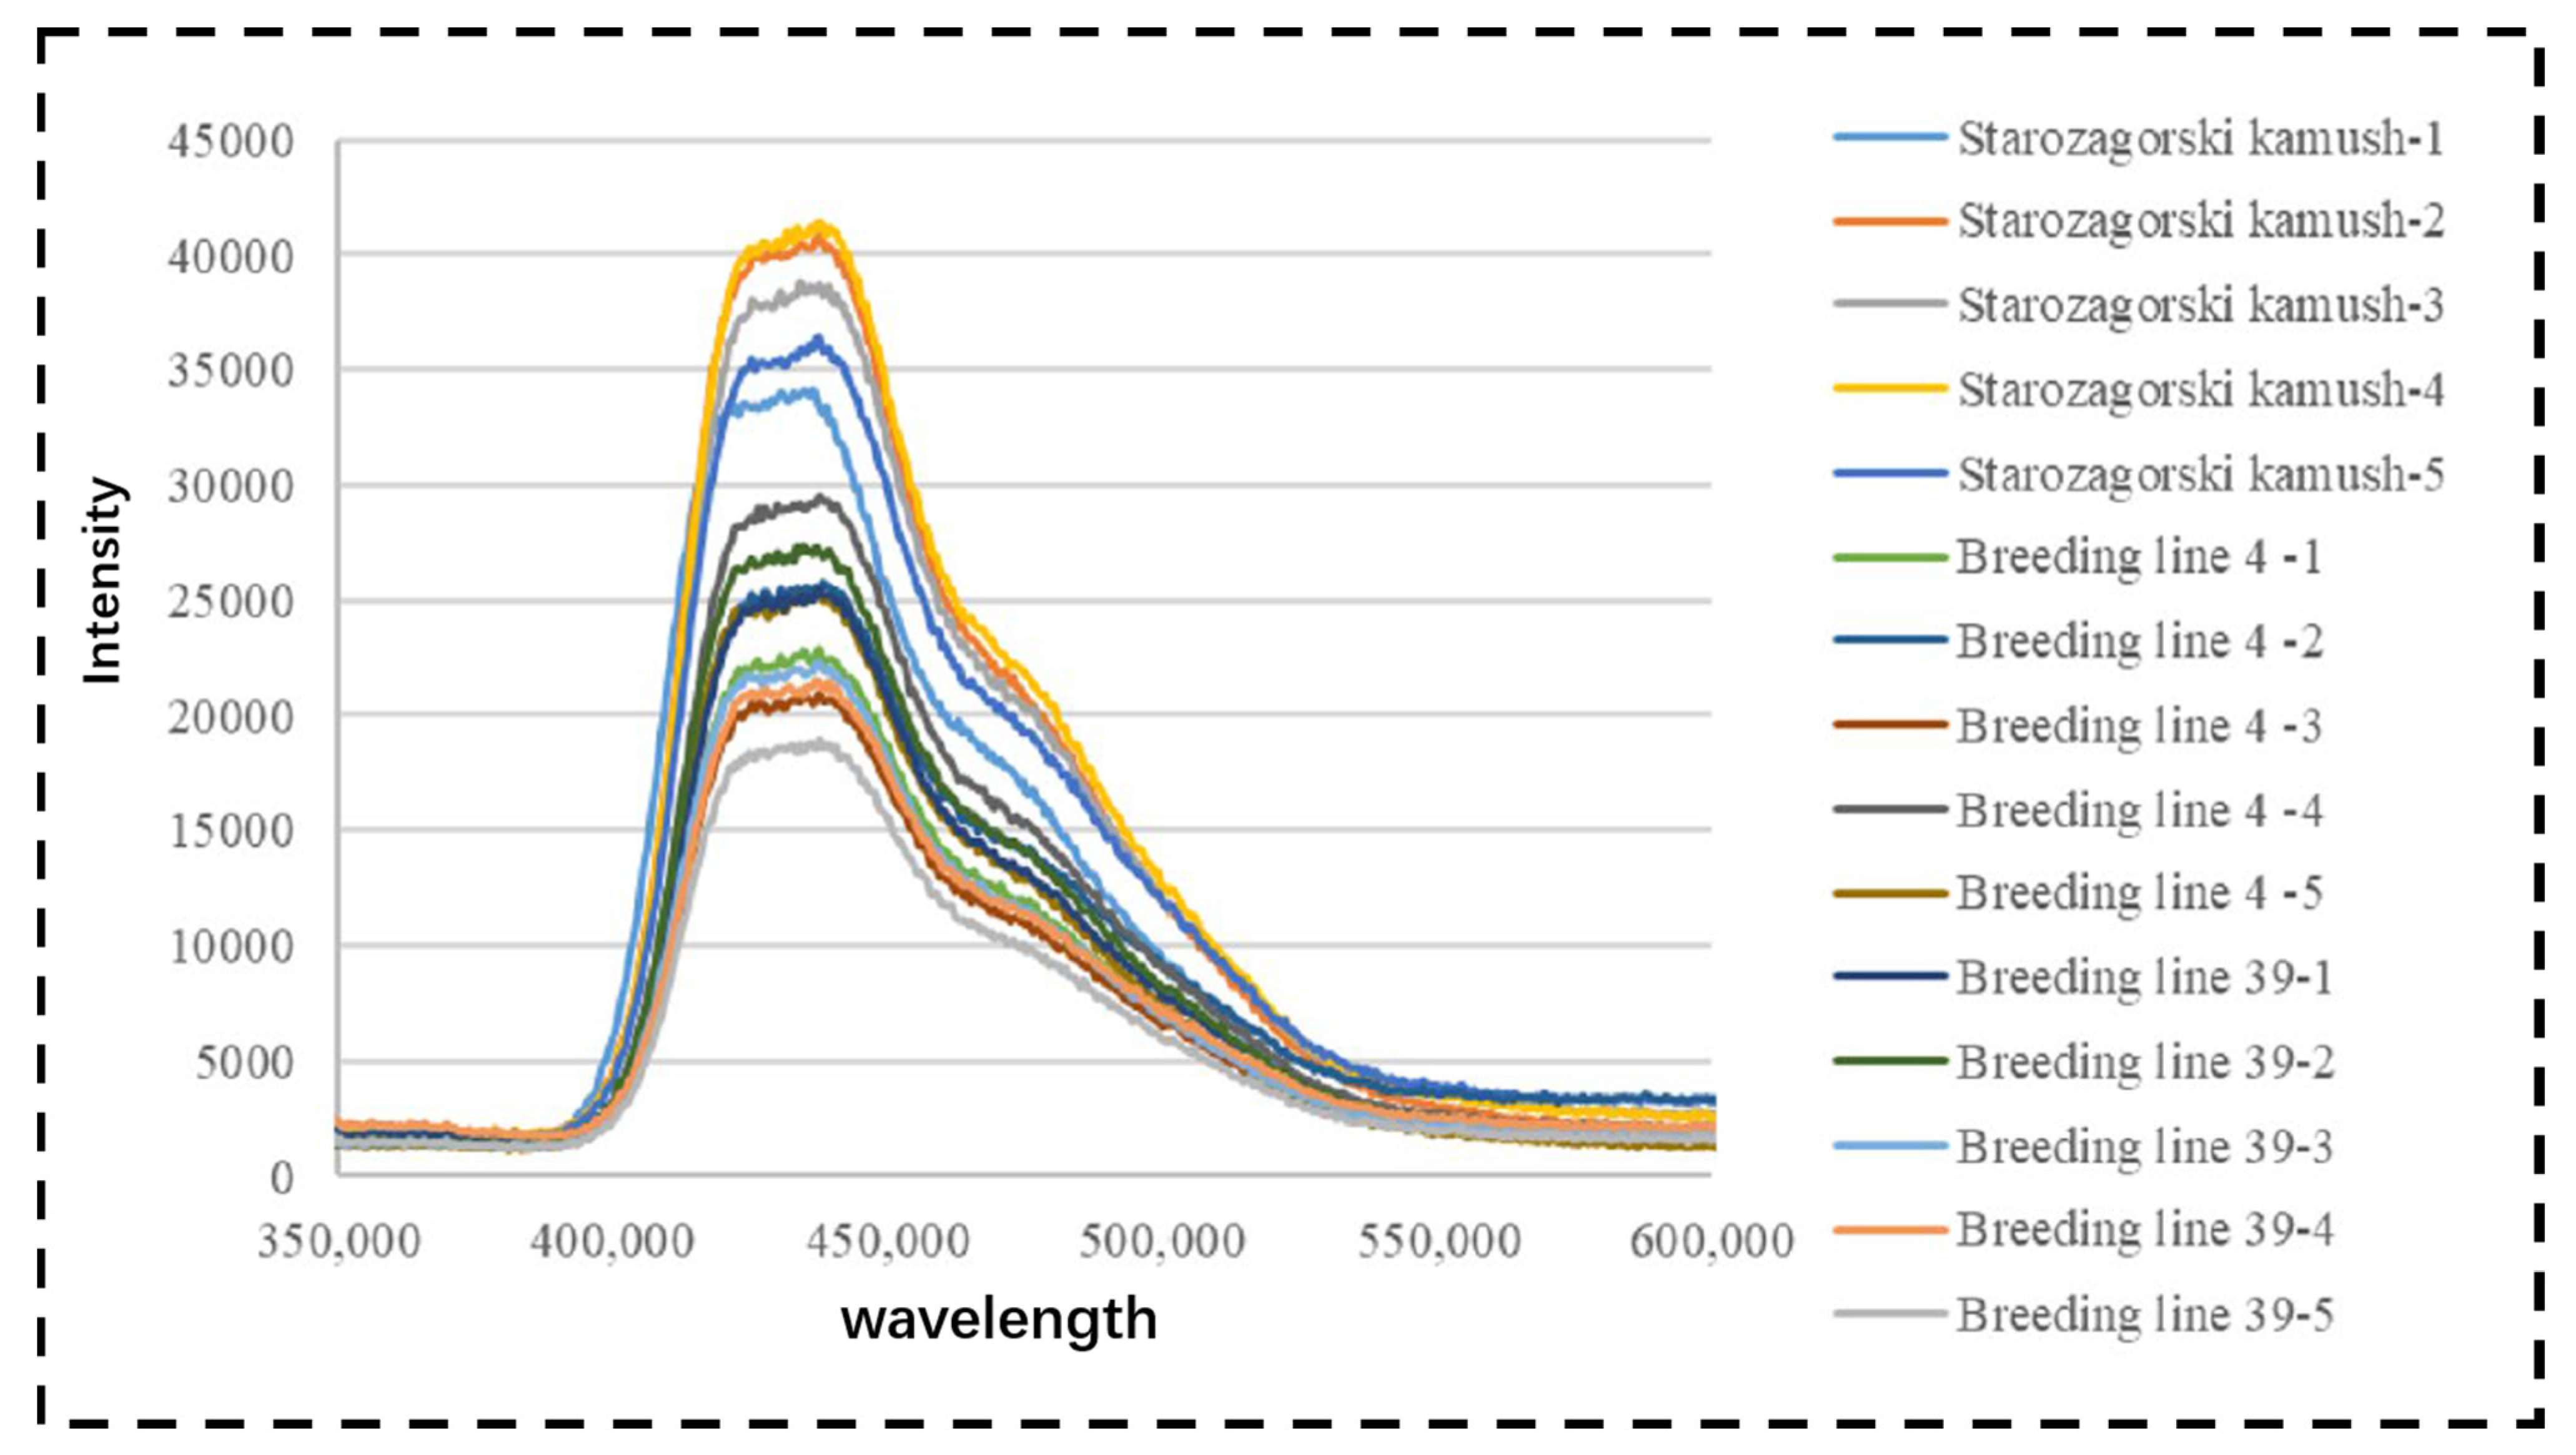
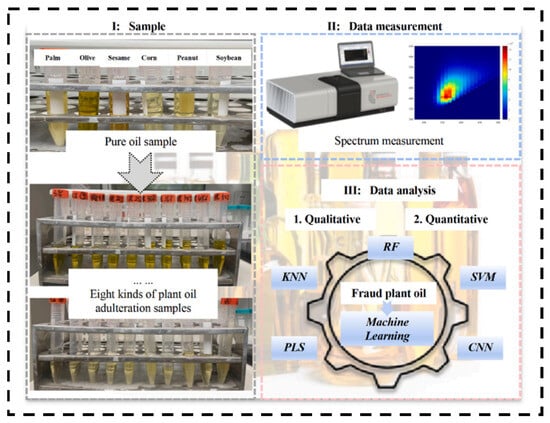
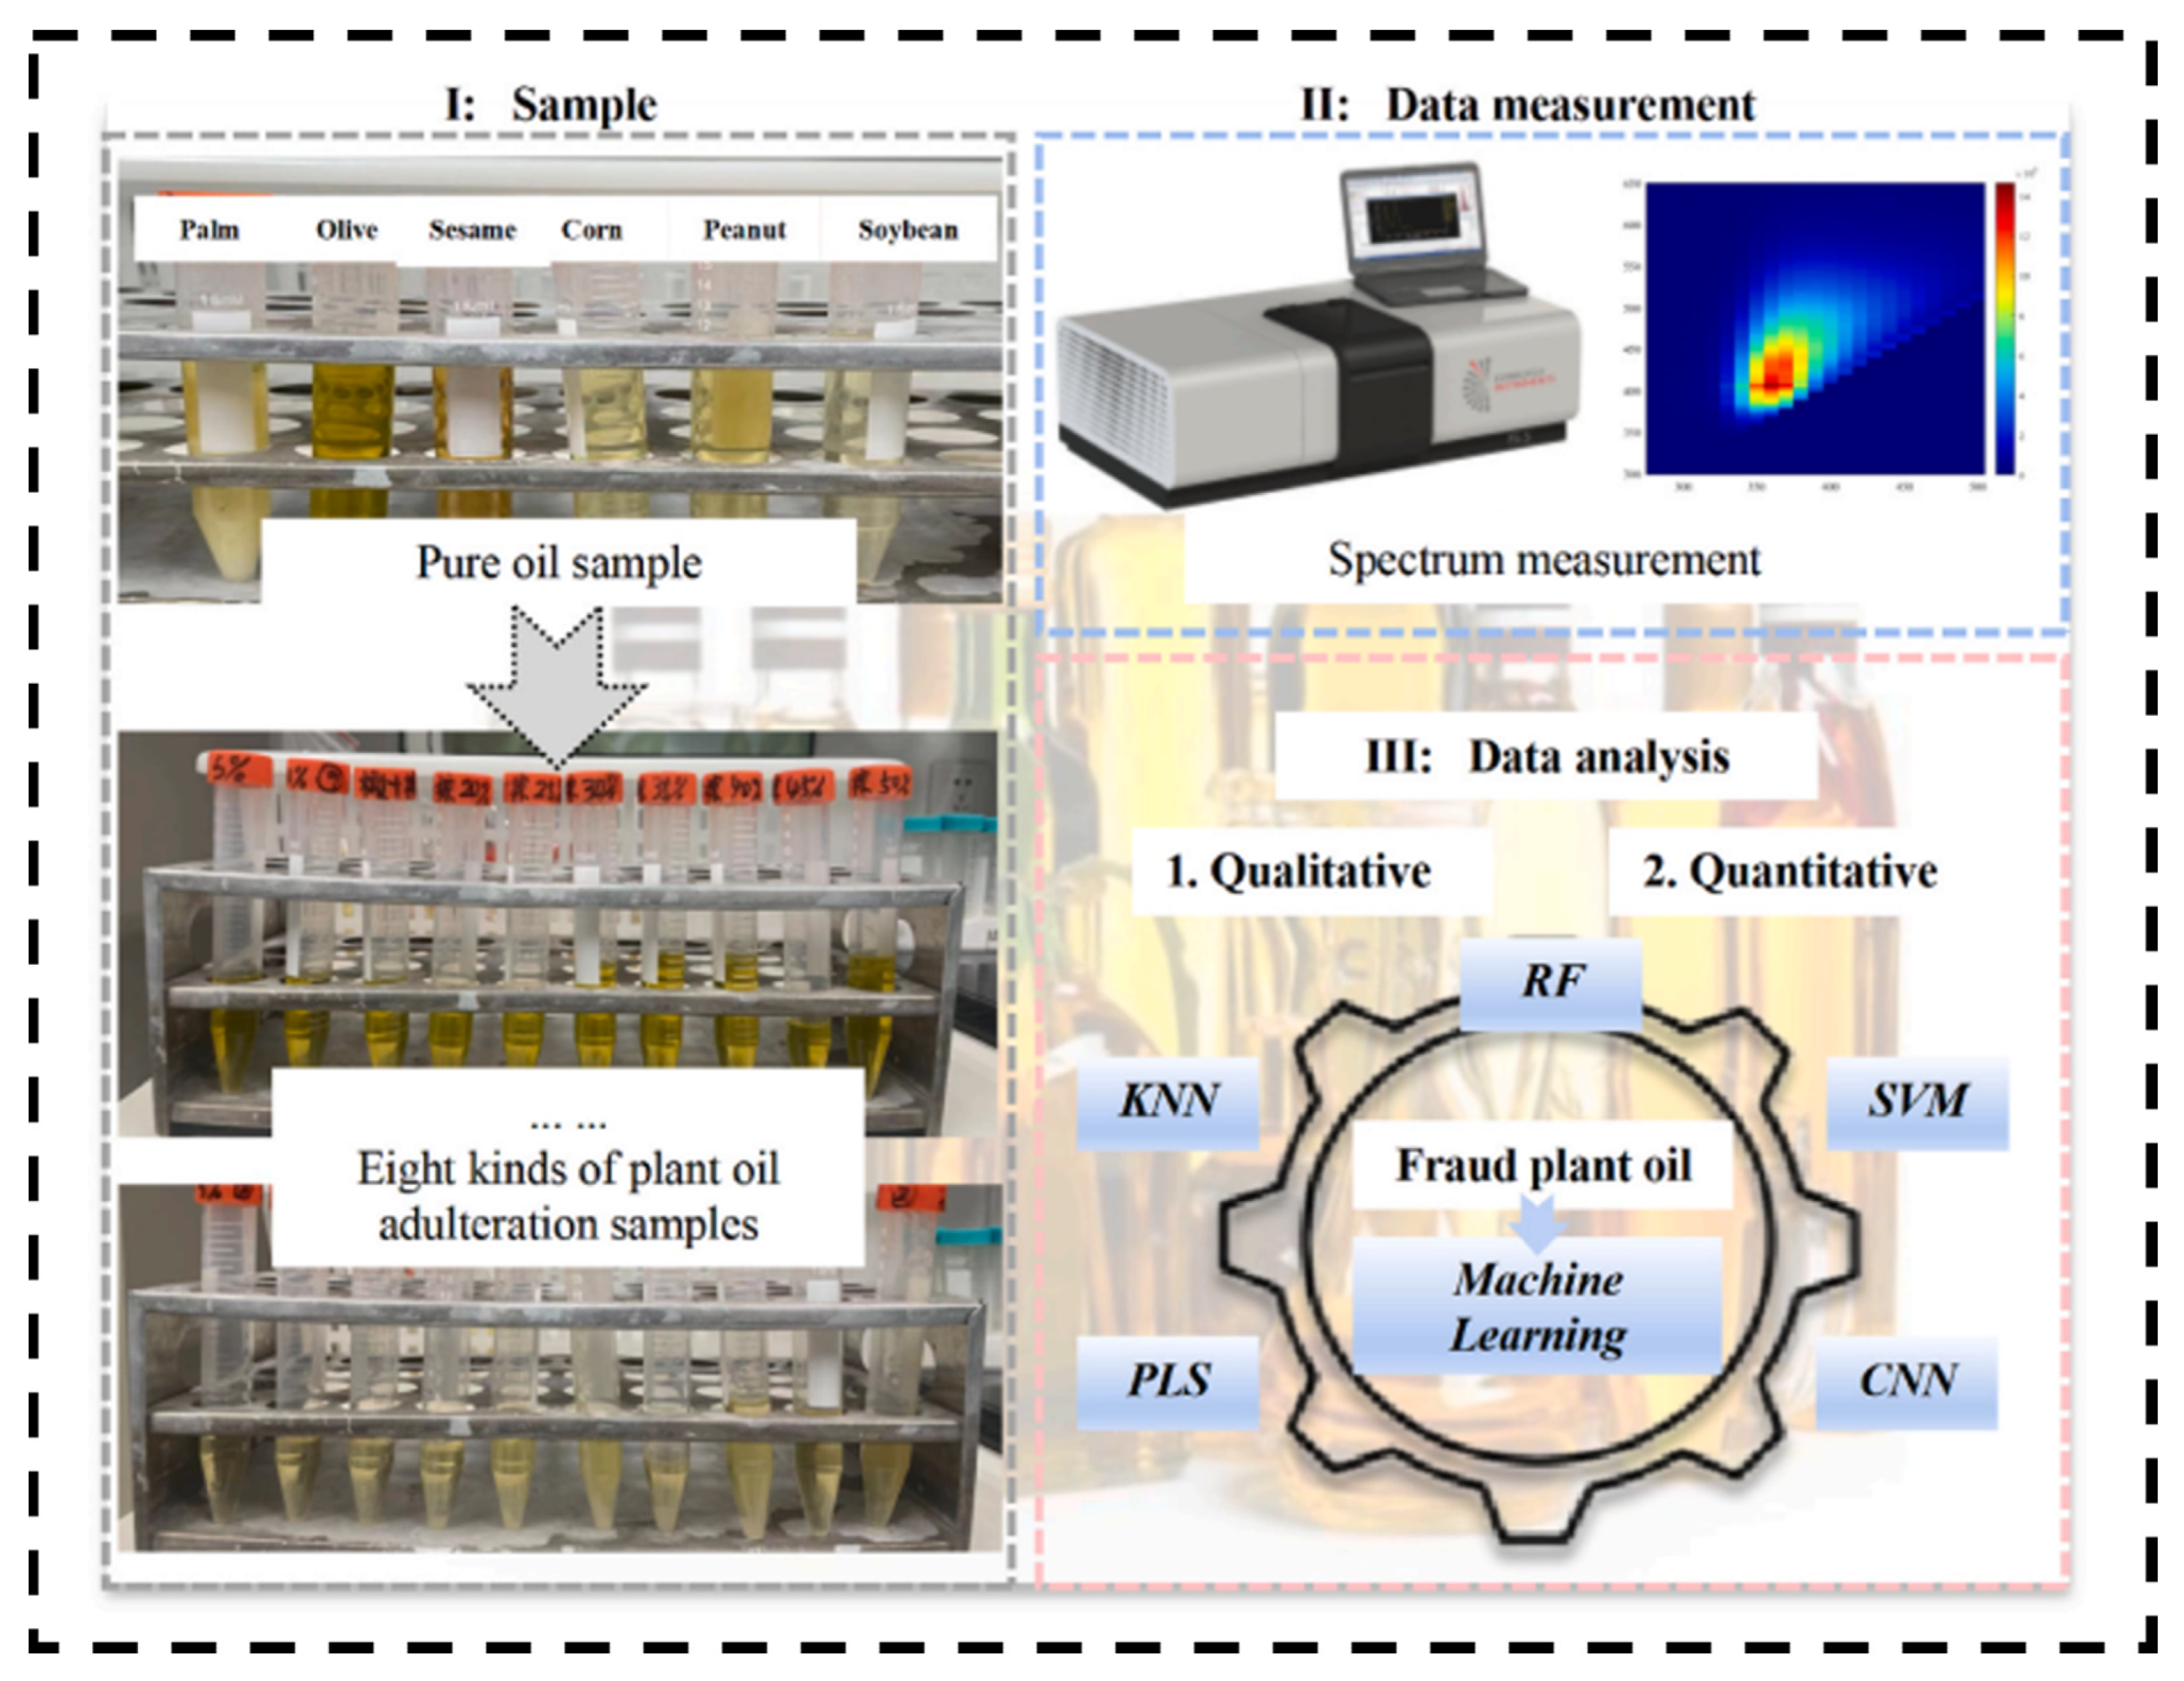
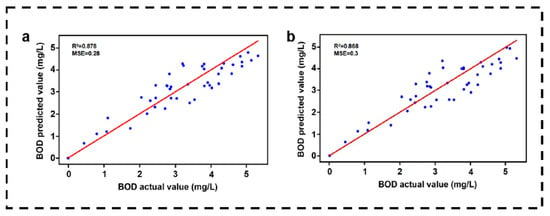
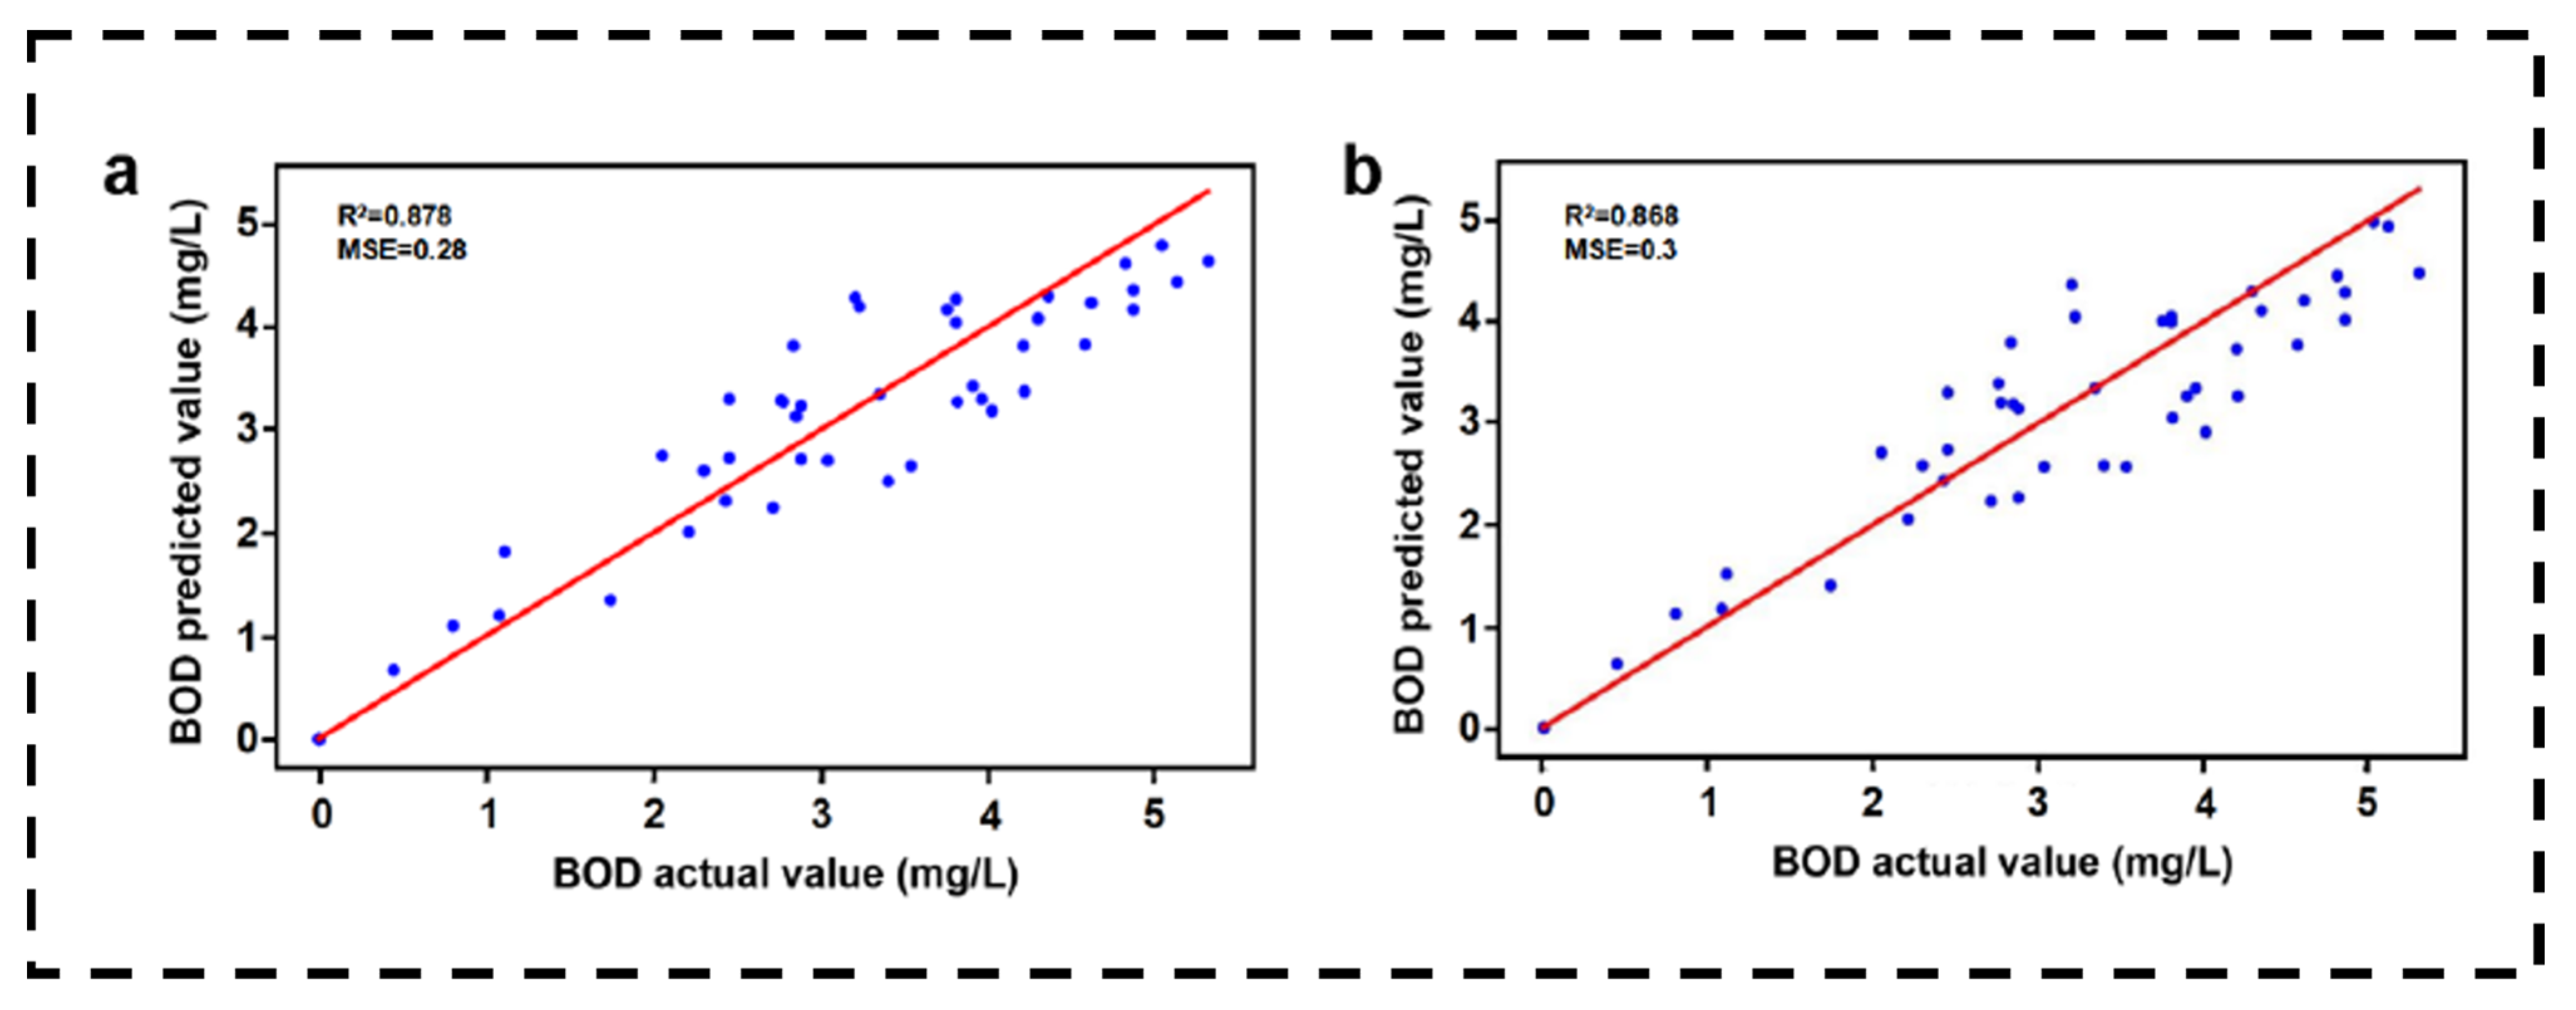
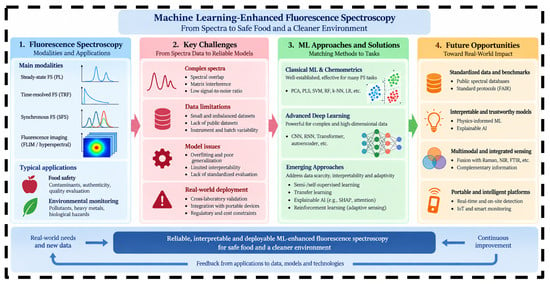
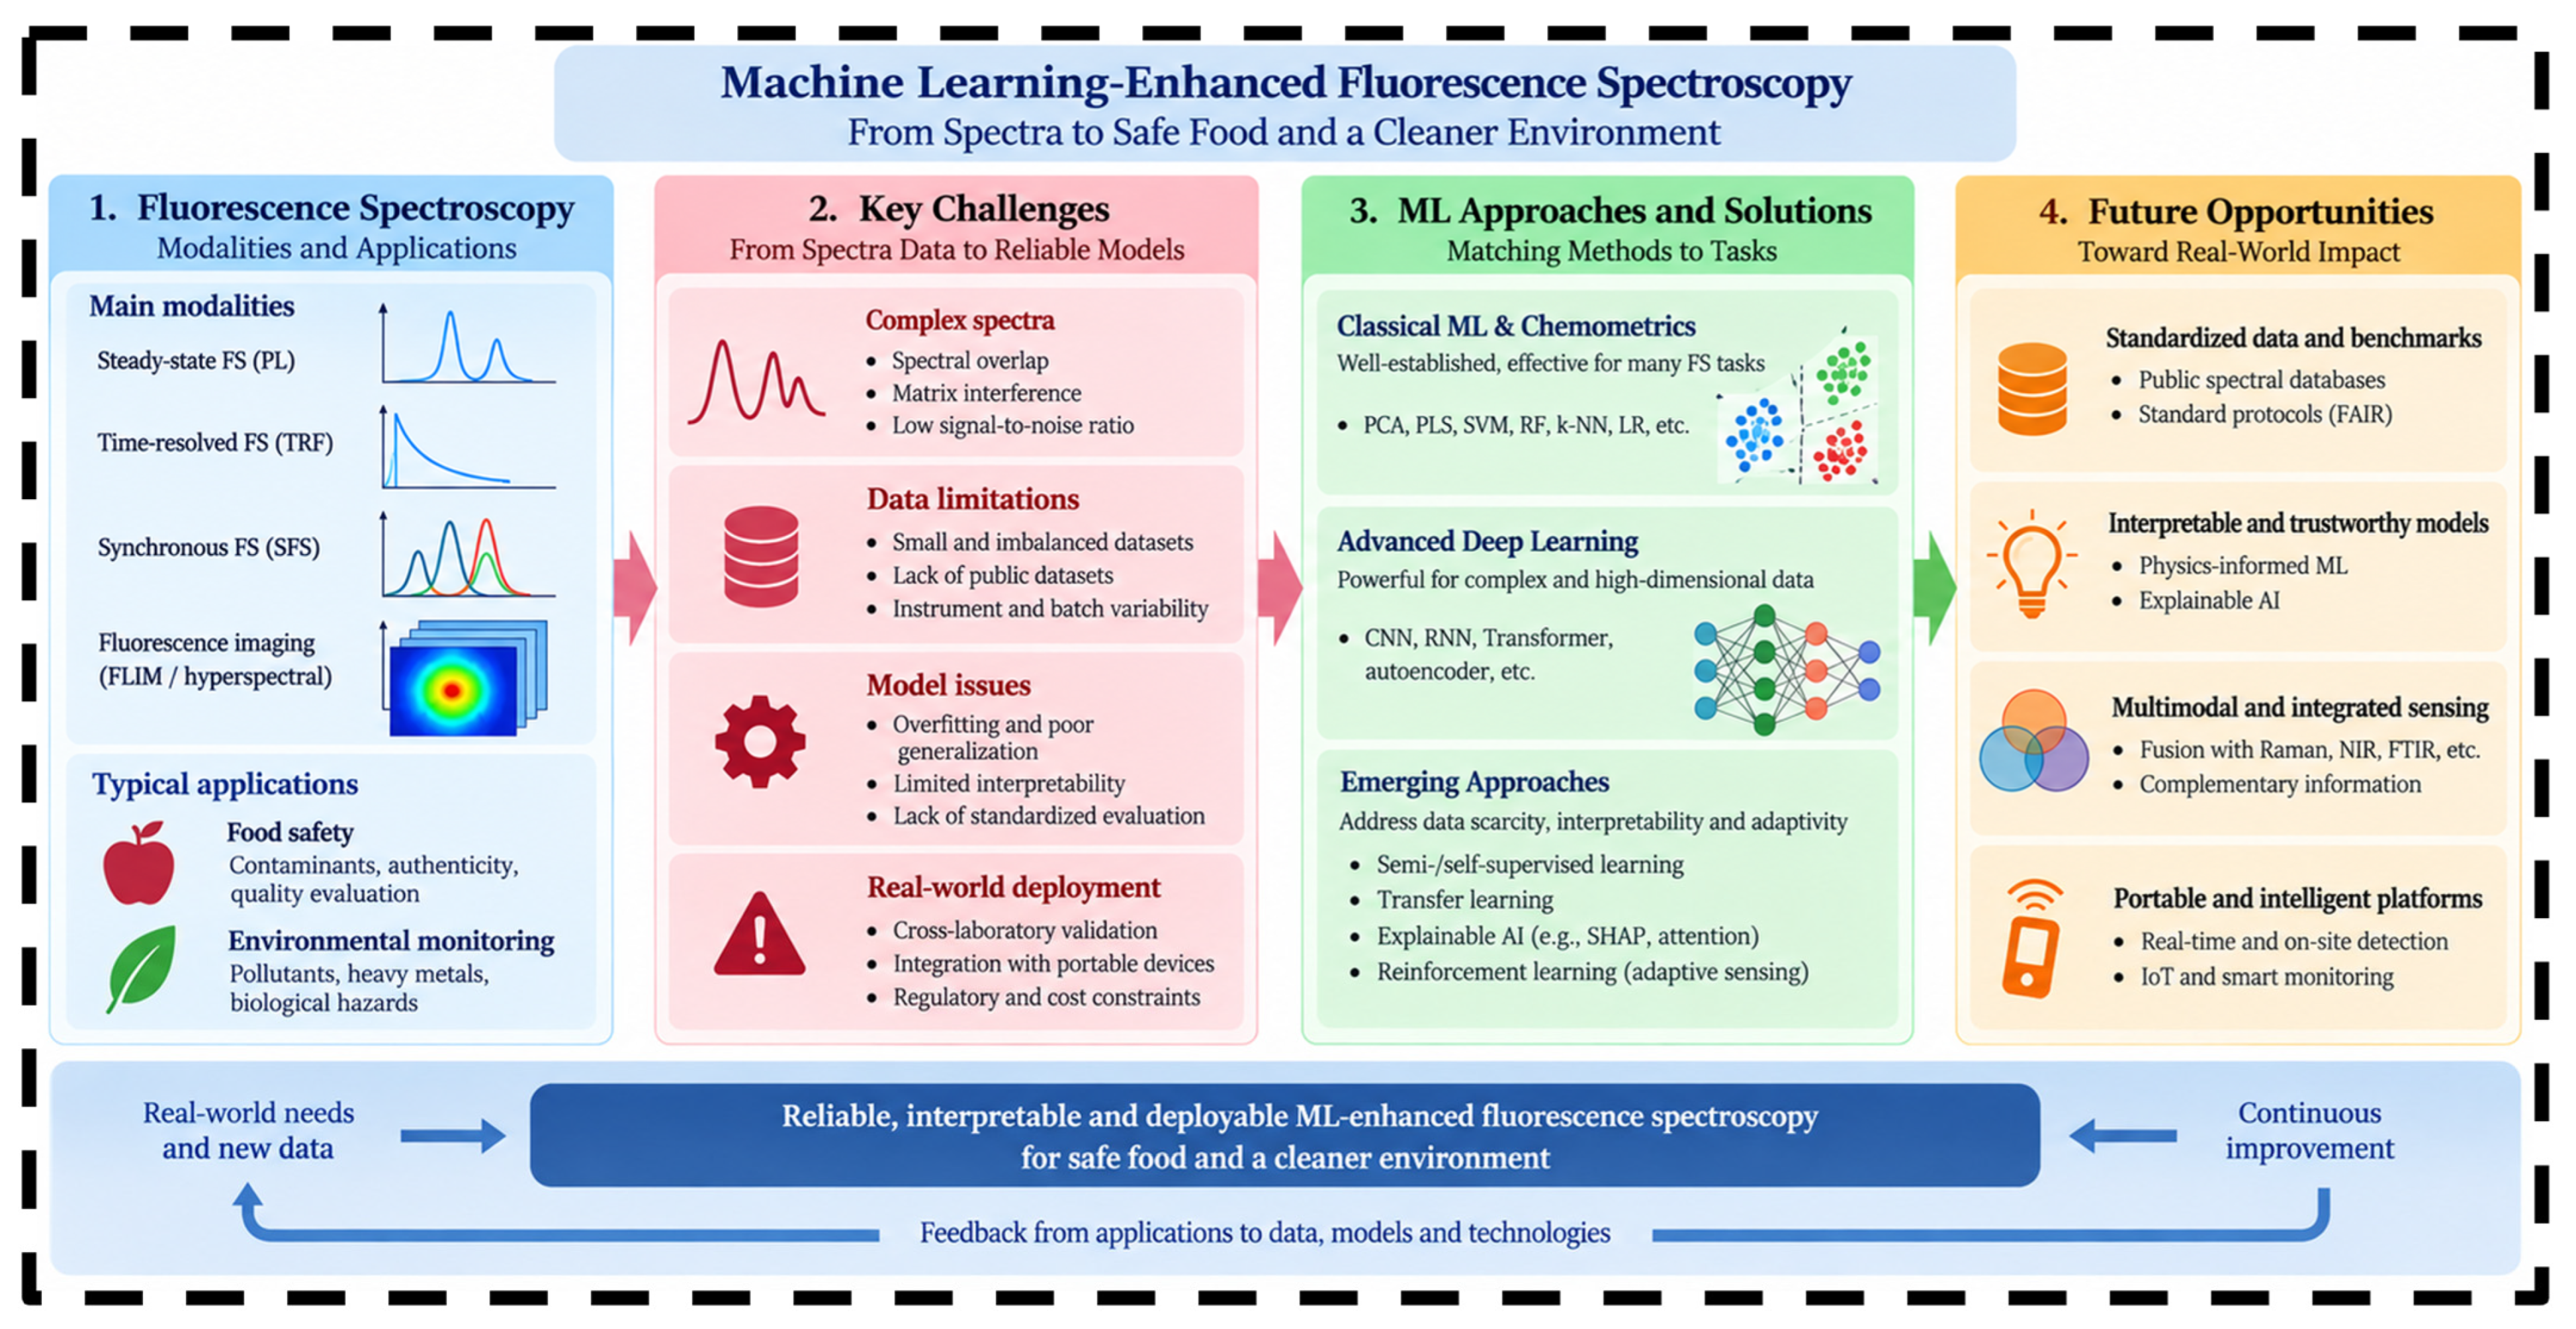

Disclaimer/Publisher’s Note: The statements, opinions and data contained in all publications are solely those of the individual author(s) and contributor(s) and not of MDPI and/or the editor(s). MDPI and/or the editor(s) disclaim responsibility for any injury to people or property resulting from any ideas, methods, instructions or products referred to in the content. |
© 2026 by the authors. Licensee MDPI, Basel, Switzerland. This article is an open access article distributed under the terms and conditions of the Creative Commons Attribution (CC BY) license.