


Abstract
Rockfall motion on high and steep forest-covered slopes is controlled by multiple factors, including source-area conditions, block characteristics, slope topography, and surface conditions. Differences among numerical models in representing block geometry, contact and impact processes, and forest-induced retardation may lead to inconsistent predictions of hazard extent and protection requirements. This study investigates a high and steep forest-covered rock slope in Qingtian, Zhejiang Province, China. A high-resolution digital elevation model (DEM) was constructed from LiDAR point-cloud data, and potential source areas, surface types, and forest parameters were determined through field investigations. Rectangular, ellipsoidal, and discoidal blocks of approximately equal volume were simulated under unprotected and flexible-barrier conditions using Rockyfor3D, a representative point-mass model, and RAMMS::ROCKFALL, a rigid-body dynamics model. Both models predicted the lowest downslope mobility for rectangular blocks and the highest for discoidal blocks. However, their dynamic responses to block shape differed markedly. Rockyfor3D predicted higher kinetic energies and bounce heights for ellipsoidal and discoidal blocks, whereas RAMMS::ROCKFALL predicted higher corresponding values for rectangular blocks. RAMMS::ROCKFALL also predicted a wider lateral spread for ellipsoidal blocks and more road crossings for discoidal blocks. The energy rating, height, and length of the barriers determined from the two models differed considerably, although both protection schemes substantially reduced the number of blocks crossing the road monitoring line. The trajectory envelopes predicted by both models did not cover the three historical rockfall deposition zones identified in the field, and the minimum distances to the nearest deposition zone were 61.1 m and 40 m, respectively. The incomplete identification of potential source areas, changes in historical terrain and vegetation conditions, the irregular geometry of natural rock blocks, and uncertainties in model parameters may all affect the reproduction of the actual spatial distribution of rockfalls. Overall, Rockyfor3D is more appropriate for rapid regional-scale probabilistic screening, whereas RAMMS::ROCKFALL is preferable for detailed assessments of critical slope sections requiring explicit consideration of rock-block geometry and rotational dynamics. In engineering applications, field evidence of rockfall should be incorporated, and multi-model cross-validation together with a conservative envelope approach should be used to delineate hazard zones and determine protection parameters.
1. Introduction
Rockfall is a common and highly destructive geological hazard in mountainous regions, characterized by sudden occurrence, high movement velocity, large impact energy, and complex trajectories. Earthquakes, intense rainfall, freeze–thaw cycles, root wedging, rock-mass weathering, and human engineering activities may trigger or intensify rockfall events [1,2,3,4,5], posing serious threats to transportation infrastructure in mountainous areas, settlements along transportation corridors, passing vehicles, and human safety [6,7,8]. After detaching from the parent rock mass, rock blocks generally undergo free fall, impact and rebound, rolling, and sliding. Their trajectories, velocities, kinetic energies, and bounce heights are jointly controlled by topography, surface materials, slope roughness, vegetation conditions, and block geometry, resulting in pronounced nonlinearity and uncertainty [9,10,11,12]. Reliable prediction of rockfall runout extent and dynamic response is therefore fundamental to hazard assessment and protective-engineering design.
With advances in digital elevation model (DEM) generation and high-performance numerical computing, three-dimensional numerical simulation has become an important tool in rockfall research. According to the representation of block geometry and the numerical treatment of rock block–slope contact, existing models can generally be classified as point-mass models, rigid-body dynamics models, and hybrid models [12,13,14,15,16]. Rockyfor3D is a representative point-mass model that combines deterministic motion calculations with stochastic parameter sampling to simulate ballistic motion, slope impacts and rebounds, and collisions with trees. It is suitable for rapid evaluation of trajectory probabilities, preferential rockfall pathways, and the spatial distribution of kinematic parameters, while rolling is generally approximated by a sequence of short, continuous rebounds. In contrast, RAMMS::ROCKFALL is based on three-dimensional rigid-body dynamics and nonsmooth contact mechanics and simultaneously solves block translation, rotation, and contact response. It can explicitly account for geometry, mass distribution, impact orientation, and rotational state [17,18,19]. The two model classes differ in block idealization, contact treatment, and energy-conversion mechanisms and may therefore yield different trajectory and dynamic predictions for the same slope.
Rock block shape is an important factor controlling rockfall motion. Blocks with different shapes exhibit different mass distributions, moments of inertia, and attitude stability, which in turn affect the contact configuration, rebound response, and partitioning of translational and rotational energy during block–slope impacts. Previous laboratory experiments and numerical studies have shown that blocks with different shapes exhibit significant differences in coefficients of restitution, rebound variability, and energy dissipation [3,20,21,22,23,24,25]. These shape-related differences in impact behaviour continuously influence the subsequent motion of the blocks during downslope propagation and are ultimately reflected in differences in bounce height, lateral spreading, runout distance, and final deposition position. Full-scale field experiments have further shown that, under specific conditions, the influence of block shape on runout may exceed that of block mass [26]. Therefore, the use of only spherical or a single standardized block geometry may not adequately represent the motion characteristics of naturally irregular rock blocks and may underestimate the spatial extent and engineering protection requirements associated with certain unfavourable block shapes.
Forest vegetation is another important environmental factor affecting rockfall propagation. After entering a forested area, rock blocks may dissipate energy through collisions with tree stems, obstruction by understory vegetation and fallen logs, and surface friction, thereby altering their direction, velocity, bounce height, and runout distance. The forest mitigation effect is controlled not only by vegetation conditions such as stand density, tree diameter at breast height, and spatial structure, but also by block shape [27,28,29]. Previous studies have shown that blocks of different shapes may exhibit different energy dissipation and trajectory deflection characteristics when interacting with trees, indicating that block shape may further modulate the influence of forests on rockfall propagation [28,29,30]. Both Rockyfor3D and RAMMS::ROCKFALL can account for forest effects, but they differ in the representation of stand parameters and the treatment of collisions between trees and blocks of different shapes. On forest-covered slopes, the combined effects of block geometry and forest conditions may therefore further amplify differences between the two models in predicted trajectories and dynamic parameters.
Although Rockyfor3D and RAMMS::ROCKFALL have been widely used in rockfall engineering analysis, previous studies have directly compared the prediction results of the two models based on field-observed rockfall trajectories and deposited blocks [31]. However, existing studies have mainly focused on the consistency between model simulation results and actual rockfall events, while systematic research is still lacking on the differences in predictions between the two models caused by different block geometries under consistent forested slope conditions, as well as the implications of these differences for the assessment of flexible barrier protection requirements. This study focuses on a representative high and steep forest-covered rock slope in Qingtian County, Zhejiang Province, China. A high-resolution DEM was constructed from LiDAR point-cloud data, and potential source areas, surface types, and forest parameters were determined through field investigations. Three representative block shapes—rectangular, ellipsoidal, and discoidal—with approximately equal volumes were simulated under unprotected and protected conditions using Rockyfor3D and RAMMS::ROCKFALL.
Based on the preceding analysis, this study proposes three research hypotheses. First, under the same slope, potential source areas, and environmental conditions, different block shapes are expected to result in identifiable differences in rockfall propagation capacity, dynamic responses, and reach characteristics at key areas. Second, for the same slope and block shape, because Rockyfor3D and RAMMS::ROCKFALL employ different modelling frameworks, their predictions of rockfall trajectory extent and dynamic parameters may exhibit different characteristics. Third, the above differences in predictions are expected to further propagate into flexible rockfall barrier design, thereby resulting in differences in the required barrier location, length, height, and energy rating.
To test the above hypotheses and further evaluate their engineering implications, this study focuses on the following five aspects: (1) comparing the predictions of runout distance, lateral spread, trajectory envelope extent, kinetic energy, bounce height, and road-reaching characteristics for blocks of different shapes; (2) analyzing how model differences affect the location, energy rating, height, and length of flexible rockfall barriers and to evaluate the simulated interception performance of each protection scheme; (3) assessing the ability of simulated trajectories to reproduce the actual spatial distribution of rockfall by comparison with historical deposition zones and to analyze the discrepancies; (4) explaining the sources of differences between the two models in terms of block representation, contact and impact treatment, energy dissipation, forest effects, and parameter systems; and (5) comprehensively evaluating the applicability, advantages, and limitations of the two models in rockfall hazard assessment and protective-engineering design for forest-covered slopes.
2. Overview of the Study Area
2.1. Topographic and Geomorphological Characteristics
The study area is located in the mountainous region south of Dayanxia Village, Beishan Town, Qingtian County, Lishui City, Zhejiang Province, China. It is generally characterized by mountainous slope landforms, with an overall morphology that is steep in the upper part and gentle in the lower part (Figure 1). The upper slope consists of high and steep bedrock cliffs, whereas colluvial–talus deposits are developed in the middle and lower parts. Roads and residential areas are distributed at the slope toe. Natural slope gradients generally range from 30° to 50°, whereas unstable-rock zones commonly exceed 75°, with some local sections steeper than 80°. The large topographic relief and continuously steep slope provide favourable conditions for rock blocks to attain high velocities and kinetic energies.
Figure 1.
Location of the study area and overview of the high and steep rock slope: (a) location within China; (b) DEM of Lishui City; (c) DEM of Qingtian County; (d) field overview of the study area; and (e) field photograph of the studied slope.
2.2. Geological Setting and Rock-Mass Structure
An NE–SW-trending transtensional fault, designated F2, is developed in the study area, with an orientation of approximately 320–335°∠70–80°. The fault obliquely cuts across the mountain and forms a relatively steep fault scarp. The rock mass adjacent to the fault is highly fractured, with well-developed joints and fissures. Surficial deposits on the natural slope mainly comprise Quaternary residual–colluvial deposits and colluvial–talus deposits. The overburden is approximately 0.5–1.0 m thick along the ridge and on gentle slope sections, whereas it is thin or absent at the top of the steep cliff, where moderately weathered bedrock is directly exposed. Colluvial–talus accumulations are visible at the slope toe. The bedrock is predominantly tuff, characterized by a tuffaceous texture and massive structure. The principal joint sets are J1 (232°∠20–25°, dipping out of the slope) and J2 (275°∠85°, nearly vertical).
2.3. Failure Modes of Unstable Rock Masses and Rockfall Field Evidence
Unmanned aerial vehicle (UAV) imagery and field investigations indicate that the unstable rock masses are mainly distributed on exposed rock faces at elevations of 329.3–339.1 m and slope gradients greater than 80°. The unstable rock masses occur in an interlocked arrangement, with locally undercut bases, while their rear margins are dissected by the F2 fault and joint fractures. Blocks controlled by outward-dipping discontinuities may undergo sliding under the combined effects of self-weight and rainfall infiltration, whereas locally developed combinations of anti-dipping discontinuities may undergo toppling under overturning moments induced by self-weight, pore-water pressure, and seismic inertial forces (Figure 2a). Based on the field survey data, combined with the slope orientation and photogrammetry-derived discontinuity orientation parameters of the potentially unstable rock masses, kinematic analyses of the three identified potentially unstable rock masses (Figure 2b) were conducted using stereographic projection. The slope at WY1 is nearly vertical. A joint set with an orientation of 245.3°∠32° dips gently into the slope, while the base is locally unsupported and the rear part is cut by the F2 fault and joint fractures, providing the kinematic conditions for toppling deformation. At WY2, local wedge sliding has already occurred, resulting in an unsupported rock face. The rock mass is cut by two joint sets with orientations of 303°∠63° and 22°∠79°, forming a wedge that satisfies the kinematic conditions for wedge sliding. At WY3, the slope surface corresponds to an old sliding surface formed by an earlier wedge failure. The rock mass is cut by two joint sets with orientations of 22°∠79° and 295°∠33°, forming a wedge that likewise satisfies the kinematic conditions for wedge sliding. These results are consistent with the qualitative field assessment.
Figure 2.
Failure modes (a) and kinematic analysis (b) of unstable rock masses.
In addition, field investigations identified three relatively concentrated historical rockfall deposition zones (DA1–DA3) at the slope toe and around the residential area. These zones are located near the residential area, below the outer side of the road (i.e., on the downslope side after rockfalls crossed the road), and to the lower left of the residential area, respectively (Figure 3), with planimetric areas of approximately 255 m2, 250 m2, and 170 m2, respectively. Based on field measurements and estimates from UAV imagery, the volumes of historically deposited blocks are mainly approximately 0.2–4.8 m3, with a few individual blocks reaching approximately 5.5 m3. These deposition zones indicate evidence of long-term, multiple episodes of rockfall activity in the study area. However, because the specific source areas, occurrence times, and subsequent disturbance processes of these historically deposited blocks remain unclear, and the rockfall occurrence frequency cannot be reliably determined from them, they are primarily used in this study as field evidence for evaluating the simulated hazard extent and spatial coverage, rather than as a basis for rigorous model validation.
Figure 3.
Classification of surface units and distribution of the principal elements at risk in the study area. DA1–DA3 denote the three historical rockfall deposition areas.
3. Numerical Models and Parameter Settings
3.1. DEM Construction and Potential Rockfall Source Areas
A high-resolution DEM with a spatial resolution of 1 m was constructed for the study area from LiDAR point-cloud data through ground-point classification and extraction, spatial interpolation, and rasterization. Potential rockfall source areas were delineated by integrating unmanned aerial vehicle imagery, topographic characteristics of the steep cliffs, and field investigation results for unstable rock masses. To minimize differences in fundamental inputs, the same topographic extent and potential source-area boundaries were used in both models.
3.2. Rock-Block Geometry and Physical Parameters
According to the field investigation, the representative volume of unstable rock blocks in the study area is approximately 5.0 m3, and the density of the tuff was set to 2600 kg/m3. Because the source areas are located on steep cliffs, the local elevation difference between the block detachment position and the first slope-impact position is approximately 10 m. An equivalent initial fall height of 10 m was therefore specified to approximate the free-fall process and the velocity and kinetic energy acquired before the first impact. To investigate the influence of block geometry, three regular block shapes—rectangular, ellipsoidal, and discoidal—were adopted, with reference volumes controlled at approximately 5.0 m3 (Table 1) to minimize the influence of differences in block mass.
Table 1.
Geometric parameters of the rock blocks.
3.3. Surface and Forest Parameters
Based on surface-material composition, cover characteristics, and road distribution, the study area was divided into surface units comprising residual–colluvial deposits, colluvial–talus deposits, talus deposits, bedrock, and asphalt pavement (Figure 3). In Rockyfor3D (v5.2), the impact response and energy-dissipation characteristics of the different surface units were represented primarily by the slope-roughness parameters Rg70, Rg20, and Rg10 together with the soil-type parameter. In RAMMS::ROCKFALL (v1.8), corresponding combinations of contact parameters were assigned according to the surface-material category. Because the two software packages use different parameter definitions and contact–impact mechanisms, their parameter systems cannot be matched on a strict one-to-one basis. Approximate correspondences were therefore established according to the material composition and cover characteristics of each surface unit (Table 2 and Table 3), with the objective of maintaining consistency in the geological meaning of model inputs rather than direct numerical equivalence.
Table 2.
Surface-roughness parameters used in Rockyfor3D.
Table 3.
Approximate correspondence between surface-material types in the two models.
Based on the field vegetation survey, a forest-covered area of 150,983.58 m2 was delineated within the distribution area of the Quaternary Holocene talus deposits (Figure 3). Stand density was set to 1000 trees/ha, mean diameter at breast height (DBH) to 30 cm, and the standard deviation to 5 cm. The proportion of coniferous trees was set to 30% in Rockyfor3D. RAMMS::ROCKFALL does not distinguish tree-species composition and uses only stand density and diameter at breast height.
3.4. Unprotected Simulation Scenarios
Under conditions without protective structures, both models were used to simulate rectangular, ellipsoidal, and discoidal blocks. For each model, 1300 simulated blocks of each shape were released, resulting in six unprotected scenarios (Table 4). In Rockyfor3D, the rockfall source area shown in Figure 3 comprised 13 source raster cells, all of which were assigned the rock density determined from field investigations, and 100 independent simulations were performed for each source cell. In RAMMS::ROCKFALL, 13 release points were defined within the same source area, with 100 random initial directions simulated at each release point. Block-shape representation, stochastic sampling mechanisms, and contact parameters followed the respective model frameworks.
Table 4.
Simulation scenarios without protective barriers. Scenario IDs combine a model abbreviation and a block-shape abbreviation. RF3D and RAMMS denote Rockyfor3D and RAMMS::ROCKFALL, respectively; Rect, Ellip, and Disc denote rectangular, ellipsoidal, and discoidal blocks, respectively.
3.5. Determination of Barrier Parameters
The protection schemes were determined from the trajectory distributions under unprotected conditions and from kinetic energy and bounce height at the upslope-side boundary of the road. To reduce the influence of differences in barrier location on model comparison, the barriers in the two models were placed, wherever possible, in the same or adjacent principal rockfall corridors near the upslope-side road boundary. Because the models predicted different trajectory extents and dynamic parameters, the exact barrier location, energy rating, height, and length were determined separately from the corresponding simulation results rather than forced to be numerically identical. Protected-condition simulations were then conducted while keeping the potential source areas, number of released blocks, and other fundamental conditions unchanged.
Virtual monitoring lines were established along the direction of rockfall motion at the upslope-side road boundary, downstream of the barriers, and along the residential-area boundary. The number of blocks crossing each line and their residual kinetic energy, bounce height, and velocity at the crossing were recorded. For the two-tier barrier system, monitoring lines were placed downstream of each barrier to identify continued propagation after the first barrier and the supplementary interception provided by the second barrier.
3.6. Evaluation Indices and Statistical Methods
To consistently characterize rockfall runout, the horizontal projected distance from the source area to the farthest deposition point along the principal direction of motion was denoted by Lh, and the elevation difference between the two points by ΔH. The maximum longitudinal runout distance was defined as S = (Lh2 + ΔH2)1ᐟ2. This index represents the straight-line distance between the two points in the longitudinal profile rather than the actual trajectory length of the block. The maximum horizontal distance between the left and right outer envelopes of all simulated trajectories was defined as the lateral spread width W, and the dimensionless ratio W/S was used to characterize relative lateral spread. To further quantitatively compare the differences in the spatial distribution of trajectories predicted by the two models, trajectory envelope areas for Rockyfor3D and RAMMS::ROCKFALL were constructed based on the spatial outer boundaries of all simulated trajectories. A trajectory similarity index (TSI) was then introduced to characterize the degree of spatial overlap between the trajectories predicted by the two models:
where ER and EM represent the trajectory envelope areas of Rockyfor3D and RAMMS::ROCKFALL, respectively, while A(ER ∩ EM) and A(ER ∪ EM) represent the overlap area and union area of the two trajectory envelopes, respectively. The TSI ranges from 0 to 1, with a higher value indicating a greater degree of spatial overlap between the trajectories predicted by the two models.
The statistical characterization of dynamic parameters was treated separately according to the analysis scale and the output definitions of the two models. For the full-domain results of RAMMS::ROCKFALL, 95th-percentile statistics were used, with E95, H95, and V95 representing the 95th-percentile values of kinetic energy, bounce height, and translational velocity, respectively. For the full-domain results of Rockyfor3D, the software outputs E95CL, Ph95CL, and the maximum velocity Vmax were used directly, where E95CL and Ph95CL represent the software-defined statistics of maximum kinetic energy and maximum passing height (i.e., bounce height) at the 95% confidence level, respectively, and are not equivalent to 95th-percentile values. Therefore, for the full-domain dynamic results, this study mainly compares the dynamic response characteristics and variation trends exhibited by the two models with changes in block shape. For engineering control sections, including the road boundary, barrier locations, and monitoring lines, both models used the blocks reaching the corresponding sections as the statistical samples, and the 95th percentile values of kinetic energy, bounce height, and velocity were calculated to enable direct quantitative comparison of rockfall dynamic characteristics at critical engineering locations. These results were further used to support the determination of engineering parameters, such as barrier energy class and height.
Based on the statistics from the virtual monitoring lines, the simulated interception rate was defined as η = (1 − Np/Nu) × 100%, where Nu and Np are the numbers of blocks crossing the same target monitoring line under unprotected and protected conditions, respectively. When Nu = 0, this index was not calculated. The simulated interception rate quantifies the relative reduction in crossings of the target monitoring line produced by the protection measures under the specified model parameters and computational conditions.
4. Rockfall Motion Characteristics Under Unprotected Conditions
4.1. Trajectories and Deposition Locations
The Rockyfor3D results showed clear differences in trajectory distribution and deposition location among block shapes. Rectangular blocks followed relatively concentrated trajectories, with limited lateral spread and longitudinal runout, and were deposited mainly below the source area. Ellipsoidal blocks exhibited greater trajectory dispersion and longer runout, with deposition zones extending farther toward the slope toe. Discoidal blocks had the widest trajectory coverage and the greatest longitudinal mobility, with the farthest deposition points located at the greatest distance from the source area (Figure 4).
Figure 4.
Trajectories (a) and deposition locations (b) of the three block shapes simulated using Rockyfor3D.
The RAMMS::ROCKFALL results likewise exhibited pronounced shape-dependent differences. Rectangular blocks had relatively short longitudinal runout, although their trajectories still showed some lateral spread, and their deposition locations were generally close to the source area. Ellipsoidal blocks displayed the most pronounced lateral spread, with deposition extending markedly toward the slope toe. The trajectories of discoidal blocks were relatively concentrated above the road, but diverged into two principal pathways after crossing the road. They had the longest longitudinal runout, and their deposition locations were concentrated near the road and in distal areas near the slope toe (Figure 5 and Figure 6). Overall, both models predicted weaker longitudinal mobility for rectangular blocks and the strongest longitudinal mobility for discoidal blocks, but differed markedly in their predictions of the lateral spread of ellipsoidal and discoidal blocks.
Figure 5.
Trajectories of the three block shapes simulated using RAMMS::ROCKFALL: (a) rectangular blocks, (b) ellipsoidal blocks, and (c) discoidal blocks.
Figure 6.
Spatial distributions of deposited blocks simulated using RAMMS::ROCKFALL: (a) rectangular blocks, (b) ellipsoidal blocks, and (c) discoidal blocks.
4.2. Dynamic Parameters and Arrival Characteristics in Key Areas
4.2.1. Rockyfor3D Results
The Rockyfor3D results showed that E95CL, Ph95CL, and Vmax increased successively from rectangular to ellipsoidal and discoidal blocks (Table 5). For discoidal blocks, E95CL, Ph95CL, and Vmax were 20,104.30 kJ, 41.60 m, and 54.00 m/s, respectively, the highest values among the three block shapes, indicating strong bouncing and impact potential within the Rockyfor3D framework. At the road monitoring line, 1 rectangular, 84 ellipsoidal, and 422 discoidal blocks crossed, whereas only 13 discoidal blocks crossed the residential-area monitoring line. The maximum longitudinal runout distances S of the three block shapes were 413.19 m, 499.56 m, and 801.44 m, respectively. These results indicate that discoidal blocks not only produced strong dynamic responses but also retained substantial long-distance mobility after passing through the forest-covered area. In comparison, rectangular blocks showed weak road-reaching and longitudinal-runout capacities.
Table 5.
Comparison of unprotected simulation results from the two models.
Preferential pathways for the three block shapes were extracted from the arrival-probability raster (Figure 7), and the variations in E95CL and Ph95CL along these pathways were analyzed (Figure 8). Kinetic energy and bounce height along the preferential pathway were generally higher for discoidal blocks than for rectangular and ellipsoidal blocks. The peak along-path E95CL values for rectangular, ellipsoidal, and discoidal blocks were 3675.22 kJ, 12,326.86 kJ, and 13,271.83 kJ, respectively. The peaks for rectangular, ellipsoidal, and discoidal blocks occurred at approximately 265.68 m, 261.09 m, and 304.06 m, respectively, along the dominant path from the source area. For bounce height, along-path Ph95CL was lowest for rectangular blocks, generally 0.8–0.9 m, with a peak of 3.07 m near the source area. Ph95CL for ellipsoidal blocks was generally 3.6–6.0 m, with a peak of 9.98 m approximately 261.09 m from the source area. Ph95CL for discoidal blocks was generally 4.2–10.0 m and reached a peak of 21.42 m approximately 320.55 m from the source area. Overall, Rockyfor3D produced the most adverse predictions of kinetic energy, bounce height, and long-distance arrival for discoidal blocks.
Figure 7.
Rockfall reach–probability distributions and preferential travel paths simulated using Rockyfor3D for (a) rectangular blocks, (b) ellipsoidal blocks, and (c) discoidal blocks.
Figure 8.
Variations in terrain elevation, maximum rockfall elevation, and kinetic energy along the preferential travel paths simulated using Rockyfor3D: (a) rectangular blocks, (b) ellipsoidal blocks, and (c) discoidal blocks. At each position along the path, the maximum bounce height is given by the vertical difference between the maximum rockfall elevation and terrain elevation curves.
4.2.2. RAMMS::ROCKFALL Results
The RAMMS::ROCKFALL results showed that E95, V95, and the 95% confidence-level maximum rotational speed R95 decreased successively from rectangular to ellipsoidal and discoidal blocks. H95 was highest for rectangular blocks, followed by discoidal blocks, and lowest for ellipsoidal blocks (Table 5). For rectangular blocks, E95, H95, V95, and R95 were 7423.76 kJ, 16.56 m, 33.67 m/s, and 2.72 rot/s, respectively.
Arrival characteristics in key areas showed a different pattern. No rectangular blocks crossed the road or residential-area monitoring lines. For ellipsoidal blocks, 136 and 4 crossed the road and residential-area monitoring lines, respectively, whereas 1027 and 62 discoidal blocks crossed the corresponding lines. The maximum longitudinal runout distances S of rectangular, ellipsoidal, and discoidal blocks were 352.06 m, 813.97 m, and 864.52 m, respectively. These results show that, in the RAMMS::ROCKFALL simulations, statistical values of kinetic energy, velocity, and rotational speed did not have a simple positive correspondence with longitudinal runout or the ability to reach key areas.
4.3. Comparison of the Two Models
Table 5 summarizes the principal results of the two models. For longitudinal runout, the maximum distances S predicted by Rockyfor3D and RAMMS::ROCKFALL were 413.19 m and 352.06 m for rectangular blocks and 801.44 m and 864.52 m for discoidal blocks, indicating relatively limited inter-model differences for these two shapes. In contrast, the predictions for ellipsoidal blocks differed substantially: the S value predicted by RAMMS::ROCKFALL was 813.97 m, 1.63 times the Rockyfor3D value of 499.56 m. Overall, both models predicted the weakest longitudinal mobility for rectangular blocks and the strongest for discoidal blocks, but RAMMS::ROCKFALL predicted a larger long-distance runout range for ellipsoidal blocks.
For lateral spread, Rockyfor3D predicted widths W of 96.99 m, 159.98 m, and 316.01 m for rectangular, ellipsoidal, and discoidal blocks, respectively, whereas the corresponding RAMMS::ROCKFALL values were 139.94 m, 353.65 m, and 227.91 m. The largest inter-model difference occurred for ellipsoidal blocks, for which the W predicted by RAMMS::ROCKFALL was 2.21 times that predicted by Rockyfor3D. For discoidal blocks, Rockyfor3D predicted the greater lateral spread width. Using W/S to characterize relative lateral spread, the values for the three block shapes were 23.47%, 32.02%, and 39.43% in Rockyfor3D and 39.75%, 43.45%, and 26.36% in RAMMS::ROCKFALL. Thus, Rockyfor3D predicted the greatest relative lateral spread for discoidal blocks, whereas RAMMS::ROCKFALL predicted the most pronounced relative lateral spread for ellipsoidal blocks. The spatial overlap analysis of the trajectory envelopes showed that the TSI values for rectangular, ellipsoidal, and discoidal blocks were 0.45, 0.36, and 0.39, respectively (Table 5). The two models exhibited a relatively higher degree of spatial overlap in the predicted trajectories of rectangular blocks, whereas relatively larger differences were observed in the predicted spatial distribution of trajectories for ellipsoidal blocks.
The inter-model differences in dynamic parameters exhibited a clear dependence on block shape. In Rockyfor3D, E95CL, Ph95CL, and Vmax increased successively as the block shape changed from rectangular to ellipsoidal and then to discoidal. In contrast, in RAMMS::ROCKFALL, E95 and V95 decreased successively following the same sequence of block shapes, whereas H95 was highest for rectangular blocks, followed by discoidal blocks, and lowest for ellipsoidal blocks.
Arrival characteristics in key areas showed that both models predicted the strongest road-reaching capacity for discoidal blocks, although the predicted numbers of crossings differed substantially. Rockyfor3D and RAMMS::ROCKFALL predicted 422 and 1027 road crossings by discoidal blocks, respectively, with the latter approximately 2.43 times the former. The corresponding numbers for ellipsoidal blocks were 84 and 136. At the residential-area monitoring line, Rockyfor3D recorded only 13 discoidal-block crossings, whereas RAMMS::ROCKFALL recorded four ellipsoidal-block and 62 discoidal-block crossings. Overall, the two models produced broadly consistent rankings of mobility among block shapes, both indicating relatively weak mobility for rectangular blocks and stronger mobility for discoidal blocks. However, clear differences occurred in the longitudinal runout and lateral spread of ellipsoidal blocks, the numbers of discoidal blocks reaching the road and residential area, and the magnitudes and trends of dynamic parameters among block shapes. The causes of these differences are discussed further in Section 6.
4.4. Sensitivity and Uncertainty Analysis of Key Input Parameters
Rockfall simulation results are influenced not only by the representation methods of rockfall motion processes in different models but also by uncertainties in initial conditions and field-derived model input parameters. To evaluate the effects of variations in key input parameters on simulation results, a one-factor-at-a-time parameter perturbation method was adopted for sensitivity and uncertainty analysis. While keeping other input conditions unchanged, the initial free-fall height, block volume, forest density, and DBH were varied individually, and S, E95/E95CL, and H95/Ph95CL were selected as the main response indicators. The ranges of parameter values were determined based on field investigation results, representative block sizes, and software input constraints (Table 6). To control the influence of block geometry on parameter responses, ellipsoidal blocks were consistently adopted in the parameter perturbation analysis.
Table 6.
Results of sensitivity and uncertainty analysis of rockfall simulation responses to key input parameters.
First, the initial free-fall height of 10 m adopted in this study was determined based on the elevation difference between the potential source area and the first impact location. However, this height remains subject to certain uncertainties due to potential source-area identification and local topographic conditions. Therefore, the initial free-fall height was set to 5 m and 10 m for comparative analysis while keeping other input parameters unchanged. Since the initial free-fall height in Rockyfor3D is defined using discrete preset values, the 15 m scenario is not included in its available height options. Therefore, the 15 m scenario was only considered as a supplementary case in RAMMS::ROCKFALL to further examine the model response to increased initial free-fall height. Under the 5 m scenario, the predicted S, E95CL, and Ph95CL values from Rockyfor3D were 529.41 m, 14,724.5 kJ, and 20.59 m, respectively, corresponding to changes of +5.98%, −0.93%, and −4.63% compared with the 10 m baseline scenario. The corresponding indicators in RAMMS::ROCKFALL changed by +0.05%, −3.69%, and −0.27%, respectively. Within the investigated range of 5–10 m, the main response indicators of both models exhibited weak responses to changes in initial free-fall height, indicating that this parameter variation had an overall limited influence on the simulation results. Under the supplementary 15 m scenario of RAMMS::ROCKFALL, S and E95 were 814.5 m and 5173.78 kJ, respectively, with changes in only +0.27% and +0.09% compared to the 10 m scenario. The H95 value was 9.37 m, which decreased by 14.90% compared to the 10 m scenario, corresponding to an absolute change of 1.64 m. Although H95 decreased, none of the three indicators exhibited a large response magnitude, further indicating that within the range investigated in this study, variations in initial free-fall height had a limited influence on the predictions of RAMMS::ROCKFALL.
Based on this, a block volume of approximately 5 m3, a forest density of 1000 trees/ha, and a DBH of 30 cm were selected as the baseline condition. The block volume, forest density, and DBH were further varied to investigate their effects on the simulation results. The block volumes were set to approximately 3 m3, 5 m3, and 6 m3, the forest densities were set to 800, 1000, and 1200 trees/ha, and the DBH values were set to 25, 30, and 35 cm.
Table 6 shows that the two models exhibited different response characteristics to variations in key input parameters, and the effects of individual parameters on S and the corresponding dynamic output indicators of each model were different. For Rockyfor3D, when block volume decreased from the baseline value of 5.089 m3 to 2.945 m3, S, E95CL, and Ph95CL decreased by 16.16%, 73.77%, and 71.19%, respectively. When the volume increased to 6.049 m3, S and E95CL increased by 6.31% and 52.54% compared with the baseline values, whereas Ph95CL decreased by 6.76%. Block volume variation had a more pronounced influence on E95CL and Ph95CL, while its influence on S was relatively limited. When forest density decreased from 1000 trees/ha to 800 trees/ha, S, E95CL, and Ph95CL increased by 5.62%, 27.88%, and 21.77%, respectively. When forest density increased to 1200 trees/ha, the three indicators decreased by 8.24%, 38.69%, and 3.71%, respectively. Among these indicators, E95CL exhibited a relatively clear response to changes in forest density, whereas variations in S and Ph95CL were comparatively limited. When DBH decreased from 30 cm to 25 cm, S, E95CL, and Ph95CL increased by 7.46%, 14.09%, and 47.61%, respectively. When DBH increased to 35 cm, the three indicators changed by +5.95%, −31.04%, and −29.60%, respectively. Among them, Ph95CL showed the strongest response to DBH variation, whereas the change in S was relatively small.
For RAMMS::ROCKFALL, when block volume decreased from approximately 5 m3 to 2.945 m3, S, E95, and H95 changed by −1.57%, −53.71%, and −35.60%, respectively. When the volume increased to 5.97 m3, the three indicators changed by +0.49%, +25.48%, and −9.45%, respectively. Block volume variation had a significant influence on E95, while H95 exhibited certain variations and S remained generally stable. When forest density decreased from 1000 trees/ha to 800 trees/ha, S, E95, and H95 changed by −0.40%, −15.38%, and −13.81%, respectively. When forest density increased to 1200 trees/ha, the three indicators changed by −39.21%, −4.51%, and −13.00%, respectively. Among these indicators, S exhibited a stronger response to increased forest density, whereas the variations in E95 and H95 were relatively limited. In contrast, within the DBH range of 25–35 cm, all three indicators showed relatively limited responses. The variation in S was less than 1%, while the variations in E95 and H95 were approximately 8–12% and 11–14%, respectively.
In summary, the dynamic response of Rockyfor3D was more sensitive to variations in block volume and DBH, whereas the dynamic response of RAMMS::ROCKFALL was mainly influenced by changes in block volume, and its runout distance showed a stronger response to variations in forest density. The differences in model responses may be related to differences between the two models in block motion representation, contact–impact treatment, and the simulation of forest retardation mechanisms. However, the single-factor parameter perturbation analysis cannot further distinguish the relative contributions of input parameter variations and model framework differences to the predicted results. In addition, both models employ stochastic trajectory simulation mechanisms, and different trajectory sample sets under the same input conditions may still lead to a certain degree of variation in outputs. Therefore, the analysis in this study is mainly used to evaluate the effects of variations within reasonable parameter ranges on model outputs. During result interpretation, the uncertainty caused by stochastic trajectory variations was considered to avoid attributing all observed differences among different simulation scenarios to a single input parameter.
5. Flexible Rockfall Barrier Design and Simulation-Based Evaluation
5.1. Determination of Protection Schemes
The road lies at the lower edge of the principal rockfall pathway in the study area and is the main protection target of this study. The protection schemes were determined from the trajectory distribution and dynamic parameters on the upslope side of the road under unprotected conditions. Barrier locations were preferentially selected in sections above the road where trajectories were relatively concentrated and engineering installation was feasible. Barrier length was determined from the lateral coverage of rockfall trajectories at the installation location, whereas the energy rating and height were determined from E95 and H95 of the blocks reaching that location and rounded upward to available barrier specifications. For scenarios where the predicted E95 exceeds the maximum energy level of currently available standardized products in China, a multi-level interception strategy was adopted, and the protection scheme was determined based on the dynamic characteristics of blocks that were not effectively intercepted by the preceding barrier and continued to move downslope. It should be noted that the purpose of setting the protection parameters in this study was to compare the simulated interception requirements under different models and block-shape scenarios, rather than to conduct a final protection structure design in the regulatory sense. Therefore, a unified structural safety factor was not additionally introduced during the selection of protection energy levels. In addition, in practical engineering applications, the maximum dynamic deformation, effective clearance behind the barrier, and conditions for block removal after interception of specific protection products still require dedicated verification considering product performance and site conditions.
In the Rockyfor3D simulations, E95 values of rectangular, ellipsoidal, and discoidal blocks on the upslope side of the road were 41.0 kJ, 2708.9 kJ, and 7475.8 kJ, respectively, and the corresponding H95 values were 0.9 m, 2.2 m, and 3.7 m. In the RAMMS::ROCKFALL simulations, rectangular blocks did not reach the road; E95 values for ellipsoidal and discoidal blocks were 378.0 kJ and 1539.22 kJ, and the corresponding H95 values were 1.59 m and 1.47 m, respectively (Table 7). Both models used the principal rockfall pathways above the road as the protection zones and adopted the same parameter-selection principles. However, because the models differed in their predictions of trajectory distribution, arrival number, kinetic energy, and bounce height, the exact location, energy rating, height, and length of each barrier were determined from the corresponding model results (Figure 9 and Table 8).
Table 7.
Dynamic statistics at the upslope-side road boundary under unprotected conditions.
Figure 9.
Locations of the flexible rockfall barriers In the scenario IDs, RF3D and RAMMS denote Rockyfor3D and RAMMS::ROCKFALL, respectively; Rect, Ellip, and Disc denote rectangular, ellipsoidal, and discoidal blocks, respectively; B denotes a scenario with a flexible rockfall barrier, whereas B1 and B2 denote the first- and second-tier flexible rockfall barriers, respectively.
Table 8.
Barrier-protected simulation schemes. In the scenario IDs, RF3D and RAMMS denote Rockyfor3D and RAMMS::ROCKFALL, respectively; Rect, Ellip, and Disc denote rectangular, ellipsoidal, and discoidal blocks, respectively; B denotes a scenario with a flexible rockfall barrier.
The E95 of discoidal blocks predicted by Rockyfor3D at the upslope side of the road was 7475.8.4 kJ, exceeding the maximum protection energy level of 5000 kJ for passive flexible protection systems specified in the current Chinese industry standard JT/T 1328—2020. Considering the residual kinetic energy and trajectory distribution of blocks escaping from the first barrier, this study adopted a serial multi-level interception scheme consisting of two 5000 kJ barriers. The first barrier provided primary interception, while the second barrier provided supplementary interception for blocks that were not effectively intercepted by the first barrier and continued to move downslope; single barriers were used for the other scenarios. In RAMMS::ROCKFALL, rectangular blocks did not reach the road, and no barrier was therefore installed for this scenario. In this study, the residential area was used only as a monitoring target for rockfall arrival, and no separate protective facility was installed there. This treatment merely defines the scope of the present numerical comparison and does not imply that the residential area requires no protection. Actual protection decisions for the residential area must consider rockfall frequency, the exposure of people and buildings, potential consequences, and acceptable-risk criteria.
5.2. Rockyfor3D Results Under Protected Conditions
After barrier installation, all four rectangular blocks reaching the barrier were intercepted, and no block crossings were recorded at either the road or residential-area monitoring line. Of the ellipsoidal blocks, 142 reached the barrier; after protection, two still crossed the road monitoring line, but none reached the residential-area monitoring line. For discoidal blocks, 627 were intercepted by the first barrier, whereas 233 continued downslope. After further retardation by the two-tier barrier system, two blocks still crossed the road monitoring line and another seven crossed the residential-area monitoring line (Figure 10 and Table 9).
Figure 10.
Simulated rockfall trajectories and interception by flexible rockfall barriers using Rockyfor3D: (a) rectangular blocks, (b) ellipsoidal blocks, and (c) discoidal blocks.
Table 9.
Statistics at key locations under protected conditions in Rockyfor3D.
Based on the numbers of blocks crossing the road monitoring line under unprotected and protected conditions, the simulated interception rates for rectangular, ellipsoidal, and discoidal blocks were 100%, 97.62%, and 99.53%, respectively (calculated based on a limited sample size for rectangular blocks). The protection schemes substantially reduced the numbers of all three block shapes reaching the road, although a small number of ellipsoidal and discoidal blocks still crossed after barrier installation. The residual kinetic energy and bounce height of discoidal blocks after crossing the barriers remained high, indicating that this block shape represented a relatively adverse protected scenario in the Rockyfor3D simulations.
5.3. RAMMS::ROCKFALL Results Under Protected Conditions
In the RAMMS::ROCKFALL simulations, all rectangular blocks stopped above the road owing to forest-induced retardation and energy dissipation during slope contact; no barrier was therefore installed for this scenario. After a barrier was installed for ellipsoidal blocks, no crossings were recorded at the road monitoring line, although six blocks still crossed the residential-area monitoring line. After a barrier was installed for discoidal blocks, no crossings occurred at either the road or residential-area monitoring line (Figure 11 and Table 10).
Figure 11.
Simulated rockfall trajectories and interception by flexible rockfall barriers using RAMMS::ROCKFALL: (a) ellipsoidal blocks and (b) discoidal blocks.
Table 10.
Results under protected conditions in RAMMS::ROCKFALL.
Using the road monitoring line as the evaluation target, the simulated interception rates for ellipsoidal and discoidal blocks were both 100%. The rate was not calculated for rectangular blocks because they did not reach the road under unprotected conditions. Under the idealized protection conditions implemented in RAMMS::ROCKFALL, the adopted schemes prevented ellipsoidal and discoidal blocks from continuing into the road area. Nevertheless, residual crossings of ellipsoidal blocks still occurred at the residential-area monitoring line.
5.4. Comparison of Protected-Condition Results
The protected-condition simulations from both models showed that flexible rockfall barriers substantially reduced the number of blocks crossing the road monitoring line, but the models differed markedly in their predicted protection requirements and residual crossings. Rockyfor3D predicted higher kinetic energies and bounce heights for ellipsoidal and discoidal blocks within the principal pathways above the road, together with broader trajectory coverage. Consequently, the barrier energy ratings, heights, and installation lengths determined from Rockyfor3D were greater than those determined from RAMMS::ROCKFALL. For discoidal blocks, two blocks still crossed the road monitoring line in Rockyfor3D even after a two-tier 5000 kJ barrier system was installed. In contrast, after a single barrier with an energy rating of 2000 kJ and a height of 2 m was installed in RAMMS::ROCKFALL, no blocks crossed either the road or residential-area monitoring line. These results indicate that inter-model differences in trajectory and dynamic predictions under unprotected conditions further affected both the parameter configuration of protection schemes and the residual crossings after barrier installation.
6. Discussion
6.1. Discrepancies Between Simulated Predictions and Field Rockfall Distribution
Based on the three historical rockfall deposition zones (DA1–DA3) identified in the field, a spatial overlay analysis was conducted between these zones and the trajectory extents predicted by the two models (Figure 12). The results show that the simulations generally reproduced the main trend of block movement from the upper steep source areas toward the middle and lower slope, the road, and the slope toe, with the predicted trajectories under some simulation scenarios reaching the road and residential areas. However, the trajectories predicted by neither model fully covered the three historical deposition zones. The minimum planar distances between the trajectory extent predicted by Rockyfor3D and DA1, DA2, and DA3 were 80.31, 138.20, and 61.13 m, respectively, whereas the corresponding distances for RAMMS::ROCKFALL were 73.12, 117.41, and 40.02 m, respectively. These results indicate that the current simulations can effectively identify the main rockfall movement directions and potential impact areas within the study area, although some spatial discrepancies remain between the simulated trajectories and the historical deposition zones.
Figure 12.
Comparison of trajectory coverage predicted by Rockyfor3D and RAMMS::ROCKFALL with rockfall deposition zones identified in the field.
Several factors may account for these discrepancies. First, the source areas in this study were delineated from the present-day survey of unstable rock masses, whereas the three deposition zones may contain blocks derived from unidentified secondary source areas, remobilization of blocks deposited on the slope, or historical source areas that have already failed, been treated, or become obscured by vegetation. Second, the field deposition zones are the cumulative result of multiple rockfall events over a long period, whereas the simulations used the present-day DEM and a relatively fixed set of surface and forest parameters. Road excavation, gully evolution, adjustment of deposits, and vegetation growth may have caused the topography and surface conditions during historical events to differ from those at present. Third, angularity, surface irregularity, mass eccentricity, initial attitude, angular velocity, and impact-induced fragmentation of natural unstable blocks were not fully represented by the three regular block shapes. Local obstacles such as small-scale protrusions, grooves, fallen logs, and isolated boulders may have also been smoothed during DEM rasterization and parameter zoning. Therefore, failure of simulated trajectories to reach a historical deposition zone does not imply that the zone is free of rockfall hazard. In engineering assessments, field-observed deposited blocks, tree-impact scars, historical event records, and the outer envelopes of trajectories predicted by multiple models should be comprehensively cross-validated. Particular attention should be given to areas below the road and around the settlement where the simulations provide insufficient spatial coverage despite clear field evidence.
6.2. Theoretical Interpretation of Differences Between the Two Models
Differences between the predictions of the two models may be mainly attributed to their numerical algorithms, including the representation of block geometry and motion state, contact–impact solution methods, parameter systems, stochastic mechanisms, and forest effects. Rockyfor3D primarily computes the motion of the block centre of mass and describes ballistic motion, slope rebound, and tree collisions through deterministic motion calculations combined with stochastic rebound parameters. Block shape affects impact response mainly through equivalent dimensions and corresponding empirical rules, whereas spatial attitude, moment of inertia, and sustained contact are not solved using a six-degree-of-freedom rigid-body formulation. Rolling is generally approximated by successive short rebounds, and sliding is not treated as an independent mode of motion. This framework is computationally efficient, however, for discoidal, elongated, or highly angular blocks, slope-conforming rolling, sliding, lateral overturning, and complex attitude evolution that may occur during actual motion may not be fully represented, thereby affecting the statistical results for parameters such as bounce height, velocity, and kinetic energy.
RAMMS::ROCKFALL is based on nonsmooth rigid-body dynamics and simultaneously solves block translation, rotation, and attitude evolution. Post-impact motion is jointly controlled by block geometry, moment of inertia, instantaneous contact location, the local slope-normal vector, and contact material, while its friction formulation allows mechanical energy to be exchanged between translational and rotational components. Based on the above mechanical mechanisms, the relevant simulation phenomena presented in Section 4 can be explained to some extent. Discoidal blocks exhibited longer runout distances and greater numbers of blocks reaching the road, while their E95 and V95 values were lower than those of rectangular blocks. This may be related to their ability to maintain downslope motion through rolling or continuous overturning, while part of the mechanical energy may be partitioned into rotational motion or dissipated during frequent contacts. The higher statistical values of velocity, kinetic energy, and bounce height for rectangular blocks may be associated with stronger rebound responses under specific contact attitudes. The greater lateral spreading of ellipsoidal blocks may be related to asymmetric contact and lateral deflection arising from continuous changes in attitude. The above analysis represents an interpretative inference based on the mechanical mechanisms of the models and the simulated phenomena, and the relevant mechanisms require further verification through full-scale experiments, laboratory model tests, or traceable rockfall events.
In addition, the surface and forest parameters of the two models cannot be matched strictly on a one-to-one basis. Rockyfor3D controls rebound, energy loss, and forest-induced retardation primarily through slope-roughness quantiles, soil type, and tree-species composition, whereas RAMMS::ROCKFALL represents block–slope interaction through material classes and internal contact parameters. Its forest module also differs from Rockyfor3D in parameter expression and tree-collision treatment. The present comparison therefore concerns the outputs of two complete modelling systems under a common geological and engineering scenario rather than a pure algorithmic validation under fully equivalent parameters. On the basis of a single case, neither model can be considered universally more accurate, and the differences should not be attributed simply to the theoretical superiority or inferiority of point-mass and rigid-body approaches.
6.3. Applicability of the Two Models to Rockfall Hazard Assessment
Rockyfor3D offers high computational efficiency, convenient raster-based parameter input, and strong batch stochastic-simulation capability. It can output trajectory coverage, arrival probability, preferential pathways, and spatial distributions of dynamic parameters and is therefore suitable for rapid rockfall-hazard screening at regional scales and under multiple-source and multiple-scenario conditions. For forest-covered slopes, stand density, diameter at breast height, and tree-species composition can be spatially assigned, facilitating identification of principal pathways, trajectory-convergence zones, and sections where forest-induced retardation is relatively weak. Its limitation is the strong simplification of block geometry, spatial attitude, and rotation. For platy, columnar, or highly angular blocks, it cannot fully represent attitude change, lateral overturning, and sustained contact and should not be used alone to interpret detailed shape-controlled dynamic mechanisms.
RAMMS::ROCKFALL can directly represent three-dimensional block geometry, moment of inertia, and contact attitude and is more suitable for detailed local analysis of identified unstable blocks, areas adjacent to critical infrastructure, and sections where shape effects are pronounced. If realistic block geometries are obtained through LiDAR or photogrammetry, the model can further analyze the effects of initial attitude, rotational state, and contact mode on trajectory dispersion and dynamic response. However, it is relatively sensitive to block geometry, initial conditions, local topography, and material parameters and requires more parameters and greater computational cost. In the absence of field calibration, a more complex mechanical description does not necessarily lead to more reliable predictions.
Overall, a staged joint-assessment approach of “regional-scale probabilistic screening followed by detailed analysis of critical sections” can be adopted in engineering practice. Rockyfor3D may first be used for large-area probabilistic simulation to identify principal rockfall pathways, trajectory-convergence zones, and areas of high kinetic energy and bounce height. RAMMS::ROCKFALL may then be applied to detailed rigid-body simulations of irregular unstable blocks that pose substantive threats to roads, settlements, proposed barrier locations, and other critical sections. Areas classified as high hazard by both models should receive priority treatment, whereas areas with large differences in predicted extent or dynamic indices should be verified using historical rockfall evidence, parameter-sensitivity analysis, and, where necessary, physical testing.
6.4. Differences in the Application of the Two Models to Protective-Engineering Design
Flexible rockfall barrier design involves two interrelated but distinct questions. The first is whether the protection system can spatially intercept rockfall, which is controlled primarily by the trajectory envelope, lateral spread, and bounce height at the installation location. The second is whether the structure can withstand rockfall impact, which depends mainly on kinetic energy, impact velocity, incidence angle, and repeated-impact conditions at the barrier location. In this study, Rockyfor3D predicted higher Ph95 and E95 values for ellipsoidal and discoidal blocks, leading to greater barrier-height and energy-rating requirements. RAMMS::ROCKFALL predicted a wider lateral spread for ellipsoidal blocks and more road arrivals for discoidal blocks, producing more adverse results in terms of required spatial coverage and residual arrival risk. Thus, the relative conservatism of the two models varies among design indices, and neither model can be regarded as uniformly more conservative.
Engineering design should not directly adopt the complete set of protection parameters produced by a single model. Instead, a conservative multi-model envelope should be applied separately to different design indices. Barrier location and installation length may be based on the outer envelope of the trajectory extents predicted by both models and then optimized according to topographic conditions and construction feasibility. Barrier height should be determined from field-calibrated H95 at the installation location, with an appropriate clearance allowance. Energy rating should integrate E95, impact velocity, incidence angle, and the possibility of repeated impacts, with safety reserves specified in accordance with relevant standards. For blocks such as discoidal forms that exhibit strong long-distance mobility and large prediction uncertainty, integrated mitigation combining active source stabilization, slope guidance, and multilevel flexible barriers may be adopted. For high-consequence elements at risk, including settlements, road vehicles, and people, a small number of arrivals in a limited simulation set should not be used alone to conclude that protection is unnecessary; historical events, occurrence frequency, exposure characteristics, and acceptable-risk criteria must also be evaluated.
It should be noted that the barrier modules in both software packages simplify the protection system as an idealized interception boundary. Their principal purpose is to evaluate the spatial coverage and blocking effect of a proposed barrier layout on simulated trajectories and to examine the compatibility between the selected barrier energy rating and the simulated rockfall kinetic-energy level. The simulated interception rate is therefore essentially a trajectory-level numerical index and cannot directly represent the actual dynamic response, structural capacity, or safety reserve of a flexible protection system. Actual impact resistance is jointly affected by large deformation of the net, forces in support ropes, energy dissipation by brake rings, post stability, bearing capacity of anchorage foundations, impact position and direction, repeated impacts, and rock fragmentation. Rockfall-motion simulations can support determination of barrier location, coverage, and design impact load, but final structural selection, energy-rating determination, and safety verification must comply with relevant technical standards and incorporate full-scale product impact tests and, where necessary, structural dynamic analysis.
6.5. Study Limitations and Engineering Implications
This study has several limitations. First, only three regular block shapes were considered. Angularity, surface irregularity, mass eccentricity, and impact-induced fragmentation of natural unstable blocks were not included, and the three block volumes still differed slightly, potentially affecting strict comparability of mass, moment of inertia, and dynamic indices. Second, the two software packages use different parameter definitions and computational mechanisms for contact and impact, slope roughness, and forest effects. Although sensitivity and uncertainty analyses of key input parameters, including the initial free-fall height, block volume, forest density, and tree diameter at breast height, have been conducted, these analyses were mainly based on limited parameter scenarios and single-factor perturbations. The systematic quantification of parameter probability distributions, interactions among parameters, and random trajectory variations has not been further considered, and the uncertainties in model inputs and outputs still require further investigation. Third, neither model fully covered the three historical rockfall deposition zones identified in the field, indicating limitations in potential source-area identification, reconstruction of historical topography, investigation of remobilization of slope deposits, and sampling of low-probability trajectories. Finally, only one high and steep forest-covered rock-slope case was examined, and the barriers were simplified as idealized interception boundaries. The observed model differences and engineering applicability therefore require further verification under different lithologies, topographies, forest structures, and protection conditions.
Future research should reconstruct realistic unstable-block geometries using three-dimensional laser scanning or photogrammetry, consider different release positions, initial attitudes, and rotational states, and incorporate impact-induced fragmentation and remobilization of blocks deposited on the slope. Key parameters should be inversely calibrated and subjected to sensitivity analysis using field-deposited blocks, tree-impact scars, and traceable historical events. In engineering applications, a closed-loop technical workflow of “field investigation–multi-model simulation–uncertainty analysis–protection system design and structural verification” should be established. Hazard extents and protection schemes should be determined by integrating field rockfall evidence, conservative envelopes of multi-model predictions, and the safety reserves required by technical standards.
7. Conclusions
This study investigated rockfall hazards on steep forested rock slopes. Under consistent topographic, geological, and forest conditions, Rockyfor3D and RAMMS::ROCKFALL were employed to systematically compare rockfall motion responses, spatial propagation characteristics, and flexible barrier protection requirements associated with different block geometries.
- (1)
- Under the topographic, forest, and parameter conditions of the study area, rock-block geometry exerted a pronounced influence on longitudinal runout, lateral spread, dynamic parameters, and arrival at the road and residential area. Both models predicted the weakest longitudinal mobility for rectangular blocks and the strongest for discoidal blocks. The maximum longitudinal runout distances of discoidal blocks were 801.44 m in Rockyfor3D and 864.52 m in RAMMS::ROCKFALL, and their road-crossing numbers were the highest among the three shapes in both models. The models nevertheless showed different shape-dependent trends in dynamic parameters. In Rockyfor3D, E95CL, Ph95CL, and Vmax increased successively from rectangular to ellipsoidal and discoidal blocks, with E95CL and Ph95CL for discoidal blocks reaching 20,104.30 kJ and 41.60 m, respectively. RAMMS::ROCKFALL predicted the highest E95, H95, and V95 for rectangular blocks. These differences are associated with differences between the models in block-geometry representation, translational–rotational coupling, contact–impact solution methods, forest effects, and parameter systems.
- (2)
- The trajectory extents predicted by Rockyfor3D and RAMMS::ROCKFALL did not fully cover the three historical rockfall deposition zones identified in the field. Simulations based solely on present-day source areas, topography, and parameter conditions were therefore insufficient to reproduce the spatial distribution of multi-stage rockfall activity in the study area. Possible causes include incomplete identification of potential source areas, historical changes in topography and vegetation, remobilization of blocks deposited on the slope, irregular natural block geometry, and insufficient sampling of low-probability deviating trajectories owing to the finite number of simulations. Rockfall hazard extent should therefore not be determined solely from the trajectory envelope of a single model. Field-deposited blocks, tree-impact scars, historical event records, and multi-model predictions should be jointly evaluated. Areas with clear field evidence of rockfall should remain subject to hazard review even when they are not covered by simulated trajectories.
- (3)
- Under the corresponding model parameters and idealized protection conditions, the flexible-barrier schemes in both models substantially reduced the number of simulated blocks crossing the road monitoring line, but their predictions of protection requirements differed markedly. Rockyfor3D produced more adverse predictions of impact kinetic energy and bounce height for ellipsoidal and discoidal blocks, whereas RAMMS::ROCKFALL produced more adverse predictions of the lateral spread of ellipsoidal blocks and the number of discoidal blocks reaching the road. Engineering design should not directly adopt the complete set of protection parameters from either model. After field-evidence verification and parameter calibration, a conservative multi-model envelope should be applied separately to barrier location, installation length, barrier height, and energy rating.
- (4)
- Overall, Rockyfor3D is more suitable for regional-scale probabilistic screening, preferential-pathway identification, and rapid multi-scenario assessment, whereas RAMMS::ROCKFALL is more suitable for detailed rigid-body analysis of unstable blocks with pronounced geometric effects and of critical slope sections. Practical projects should adopt a combined strategy of regional screening and local detailed analysis and incorporate historical-event calibration, realistic three-dimensional block reconstruction, parameter-sensitivity analysis, and structural dynamic verification to improve the reliability of hazard determination and protection decisions.
Author Contributions
Conceptualization, Y.-F.T. and Z.-M.J.; Methodology, Y.-F.T., P.A. and F.-Q.W.; Software, P.A. and Y.-F.T.; Validation, Y.-F.T., Z.-M.J. and T.-H.W.; Investigation, Z.-M.J. and F.-Q.W.; Resources, D.-P.W.; Writing—original draft preparation, Y.-F.T. and Z.-M.J.; Writing—review and editing, P.A., Z.-M.J., Y.-F.T., T.-H.W. and D.-P.W.; Supervision, Z.-M.J.; Project administration, F.-Q.W.; Funding acquisition, Z.-M.J. and F.-Q.W. All authors have read and agreed to the published version of the manuscript.
Funding
This work was financially supported by the National Natural Science Foundation of China (Grant No. U2244228; Grant No. 42307250), Opening Fund of State Key Laboratory of Geohazard Prevention and Geoenvironment Protection (Chengdu University of Technology) (Grant No. SKLGP2023K007), Key Technologies R&D Programme of Henan Province (Grant No. 262102321024), China Postdoctoral Science Foundation (Grant No. 2022M721033), Doctoral Research Fund of Henan Polytechnic University (Grant No. B2025-82).
Data Availability Statement
The original contributions presented in this study are included in the article. Further inquiries can be directed to the corresponding authors.
Conflicts of Interest
The authors declare no conflict of interest.
References
- Attewell, P.B.; Farmer, I.W. Principles of Engineering Geology; Chapman and Hall: London, UK, 1976. [Google Scholar] [CrossRef] [Scilit]
- Tunusluoglu, M.C.; Zorlu, K. Rockfall hazard assessment in a cultural and natural heritage site: Ortahisar Castle, Cappadocia, Turkey. Environ. Geol. 2009, 56, 963–972. [Google Scholar] [CrossRef] [Scilit]
- Asteriou, P.; Saroglou, H.; Tsiambaos, G. Geotechnical and kinematic parameters affecting the coefficients of restitution for rock fall analysis. Int. J. Rock Mech. Min. Sci. 2012, 54, 103–113. [Google Scholar] [CrossRef] [Scilit]
- Saroglou, H.; Marinos, V.; Marinos, P.; Tsiambaos, G. Rockfall hazard and risk assessment: An example from a high promontory at the historical site of Monemvasia, Greece. Nat. Hazards Earth Syst. Sci. 2012, 12, 1823–1836. [Google Scholar] [CrossRef] [Scilit]
- Wang, X.L.; Frattini, P.; Stead, D.; Sun, J.J.; Liu, H.Y.; Valagussa, A.; Li, L.H. Dynamic rockfall risk analysis. Eng. Geol. 2020, 272, 105622. [Google Scholar] [CrossRef] [Scilit]
- Abu Seif, E.-S.S.; Bahabri, A.A. Rockfall hazards assessment along the Aswan–Cairo highway, Sohag Governorate, Upper Egypt. Nat. Hazards 2019, 99, 991–1005. [Google Scholar] [CrossRef] [Scilit]
- Keskin, B.; Bacak, G.; Bilir, M.E.; Geniş, M. Investigation of rockfall potential of Zonguldak–Kilimli roadway (Turkey). Arab. J. Geosci. 2020, 13, 805. [Google Scholar] [CrossRef] [Scilit]
- Zhou, Y.T.; Shi, S.W.; Tang, H.M.; Wang, L.F. Assessment of rockfall hazards of Moziyan in Hechuan District, Chongqing, China. Geotech. Geol. Eng. 2020, 38, 5805–5817. [Google Scholar] [CrossRef] [Scilit]
- Hu, J.; Li, S.C.; Li, L.P.; Shi, S.S.; Zhou, Z.Q.; Liu, H.L.; He, P. Field, experimental, and numerical investigation of a rockfall above a tunnel portal in southwestern China. Bull. Eng. Geol. Environ. 2018, 77, 1365–1382. [Google Scholar] [CrossRef] [Scilit]
- Sun, S.Q.; Li, L.P.; Li, S.C.; Zhang, Q.Q.; Hu, C. Rockfall hazard assessment on Wangxia rock mass in Wushan (Chongqing, China). Geotech. Geol. Eng. 2017, 35, 1895–1905. [Google Scholar] [CrossRef] [Scilit]
- San, N.E.; Topal, T.; Akin, M.K. Rockfall hazard assessment around Ankara Citadel (Turkey) using rockfall analyses and hazard rating system. Geotech. Geol. Eng. 2020, 38, 3831–3851. [Google Scholar] [CrossRef] [Scilit]
- Ji, Z.M.; Chen, T.L.; Wu, F.Q.; Li, Z.H.; Niu, Q.H.; Wang, K.Y. Assessment and prevention on the potential rockfall hazard of high-steep rock slope: A case study of Zhongyuntai Mountain in Lianyungang, China. Nat. Hazards 2023, 115, 2117–2139. [Google Scholar] [CrossRef] [Scilit]
- Dorren, L.K.A. A review of rockfall mechanics and modelling approaches. Prog. Phys. Geogr. Earth Environ. 2003, 27, 69–87. [Google Scholar] [CrossRef] [Scilit]
- Volkwein, A.; Schellenberg, K.; Labiouse, V.; Agliardi, F.; Berger, F.; Bourrier, F.; Dorren, L.K.A.; Gerber, W.; Jaboyedoff, M. Rockfall characterisation and structural protection—A review. Nat. Hazards Earth Syst. Sci. 2011, 11, 2617–2651. [Google Scholar] [CrossRef] [Scilit]
- Li, L.P.; Lan, H.X. Probabilistic modeling of rockfall trajectories: A review. Bull. Eng. Geol. Environ. 2015, 74, 1163–1176. [Google Scholar] [CrossRef] [Scilit]
- Pradhan, B.; Fanos, A.M. Rockfall hazard assessment: An overview. In Laser Scanning Applications in Landslide Assessment; Pradhan, B., Ed.; Springer: Cham, Switzerland, 2017; pp. 299–322. [Google Scholar] [CrossRef] [Scilit]
- Dorren, L.K.A. Rockyfor3D (v5.2) Revealed—Transparent Description of the Complete 3D Rockfall Model; ecorisQ Paper; International ecorisQ Association: Geneva, Switzerland, 2015; 32p. [Google Scholar]
- Bartelt, P.; Bieler, C.; Buhler, Y.; Christen, M.; Dreier, L.; Gerber, W.; Glover, J.; Schneider, M. RAMMS::ROCKFALL User Manual v1.8; WSL Institute for Snow and Avalanche Research SLF: Davos, Switzerland, 2024. [Google Scholar]
- Vo, D.T. RAMMS::Rockfall Versus Rockyfor3D in Rockfall Trajectory Simulations at the Community of Vik, Norway. Master’s Thesis, Department of Geosciences, University of Oslo, Oslo, Norway, 2015. [Google Scholar]
- Chau, K.T.; Wong, R.H.C.; Liu, J.; Wu, J.J.; Lee, C.F. Shape effects on the coefficient of restitution during rockfall impacts. In Proceedings of the 9th ISRM Congress, Paris, France, 25–28 August 1999; pp. 541–544. [Google Scholar]
- Buzzi, O.; Giacomini, A.; Spadari, M. Laboratory investigation on high values of restitution coefficients. Rock Mech. Rock Eng. 2012, 45, 35–43. [Google Scholar] [CrossRef] [Scilit]
- Ji, Z.M.; Chen, Z.J.; Niu, Q.H.; Wang, T.H.; Wang, T.J.; Chen, T.L. A calculation model of the normal coefficient of restitution based on multi-factor interaction experiments. Landslides 2021, 18, 1531–1553. [Google Scholar] [CrossRef] [Scilit]
- Qin, S.W.; Liu, X.W.; Peng, S.Y.; Zhang, C.B.; Yao, J.Y.; Lv, J.F.; Wan, F. Effect of rockfall shape on the coefficient of restitution: Insights from laboratory rockfall multi-parameter experiments. Rock Mech. Rock Eng. 2026, 59, 855–879. [Google Scholar] [CrossRef] [Scilit]
- Yan, P.; Zhang, J.H.; Fang, Q.; Zhang, Y.D. Numerical simulation of the effects of falling rock’s shape and impact pose on impact force and response of RC slabs. Constr. Build. Mater. 2018, 160, 497–504. [Google Scholar] [CrossRef] [Scilit]
- Zhu, C.; He, M.C.; Karakus, M.; Zhang, X.H.; Guo, Z. The collision experiment between rolling stones of different shapes and protective cushion in open-pit mines. J. Mt. Sci. 2021, 18, 1391–1403. [Google Scholar] [CrossRef] [Scilit]
- Caviezel, A.; Ringenbach, A.; Demmel, S.E.; Dinneen, C.E.; Krebs, N.; Bühler, Y.; Christen, M.; Meyrat, G.; Stoffel, A.; Hafner, E.; et al. The relevance of rock shape over mass—Implications for rockfall hazard assessments. Nat. Commun. 2021, 12, 5546. [Google Scholar] [CrossRef] [Scilit]
- Dorren, L.K.A.; Berger, F.; Jonsson, M.; Krautblatter, M.; Mölk, M.; Stoffel, M.; Wehrli, A. State of the art in rockfall–forest interactions. Schweiz. Z. Forstwes. 2007, 158, 128–141. [Google Scholar] [CrossRef] [Scilit]
- Lu, G.; Ringenbach, A.; Caviezel, A.; Sanchez, M.; Christen, M.; Bartelt, P. Mitigation effects of trees on rockfall hazards: Does rock shape matter? Landslides 2021, 18, 59–77. [Google Scholar] [CrossRef] [Scilit]
- Ringenbach, A.; Bebi, P.; Bartelt, P.; Rigling, A.; Christen, M.; Bühler, Y.; Stoffel, A.; Caviezel, A. Shape still matters: Rockfall interactions with trees and deadwood in a mountain forest uncover a new facet of rock shape dependency. Earth Surf. Dyn. 2023, 11, 779–801. [Google Scholar] [CrossRef] [Scilit]
- Toe, D.; Bourrier, F.; Olmedo, I.; Monnet, J.-M.; Berger, F. Analysis of the effect of trees on block propagation using a DEM model: Implications for rockfall modelling. Landslides 2017, 14, 1603–1614. [Google Scholar] [CrossRef] [Scilit]
- Noël, F.; Nordang, S.F.; Jaboyedoff, M.; Digout, M.; Guerin, A.; Locat, J.; Matasci, B. Comparing Flow-R, Rockyfor3D and RAMMS to Rockfalls from the Mel de la Niva Mountain: A Benchmarking Exercise. Geosciences 2023, 13, 200. [Google Scholar] [CrossRef] [Scilit]
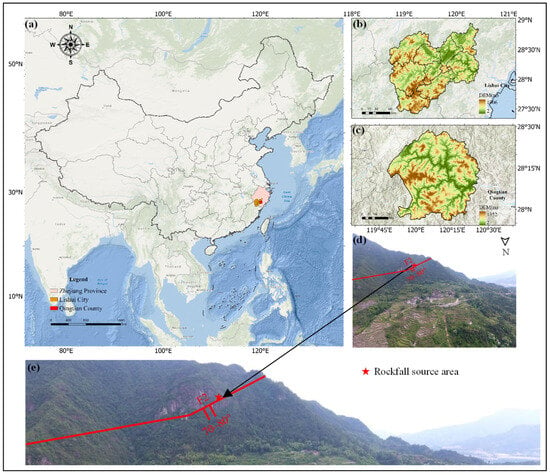
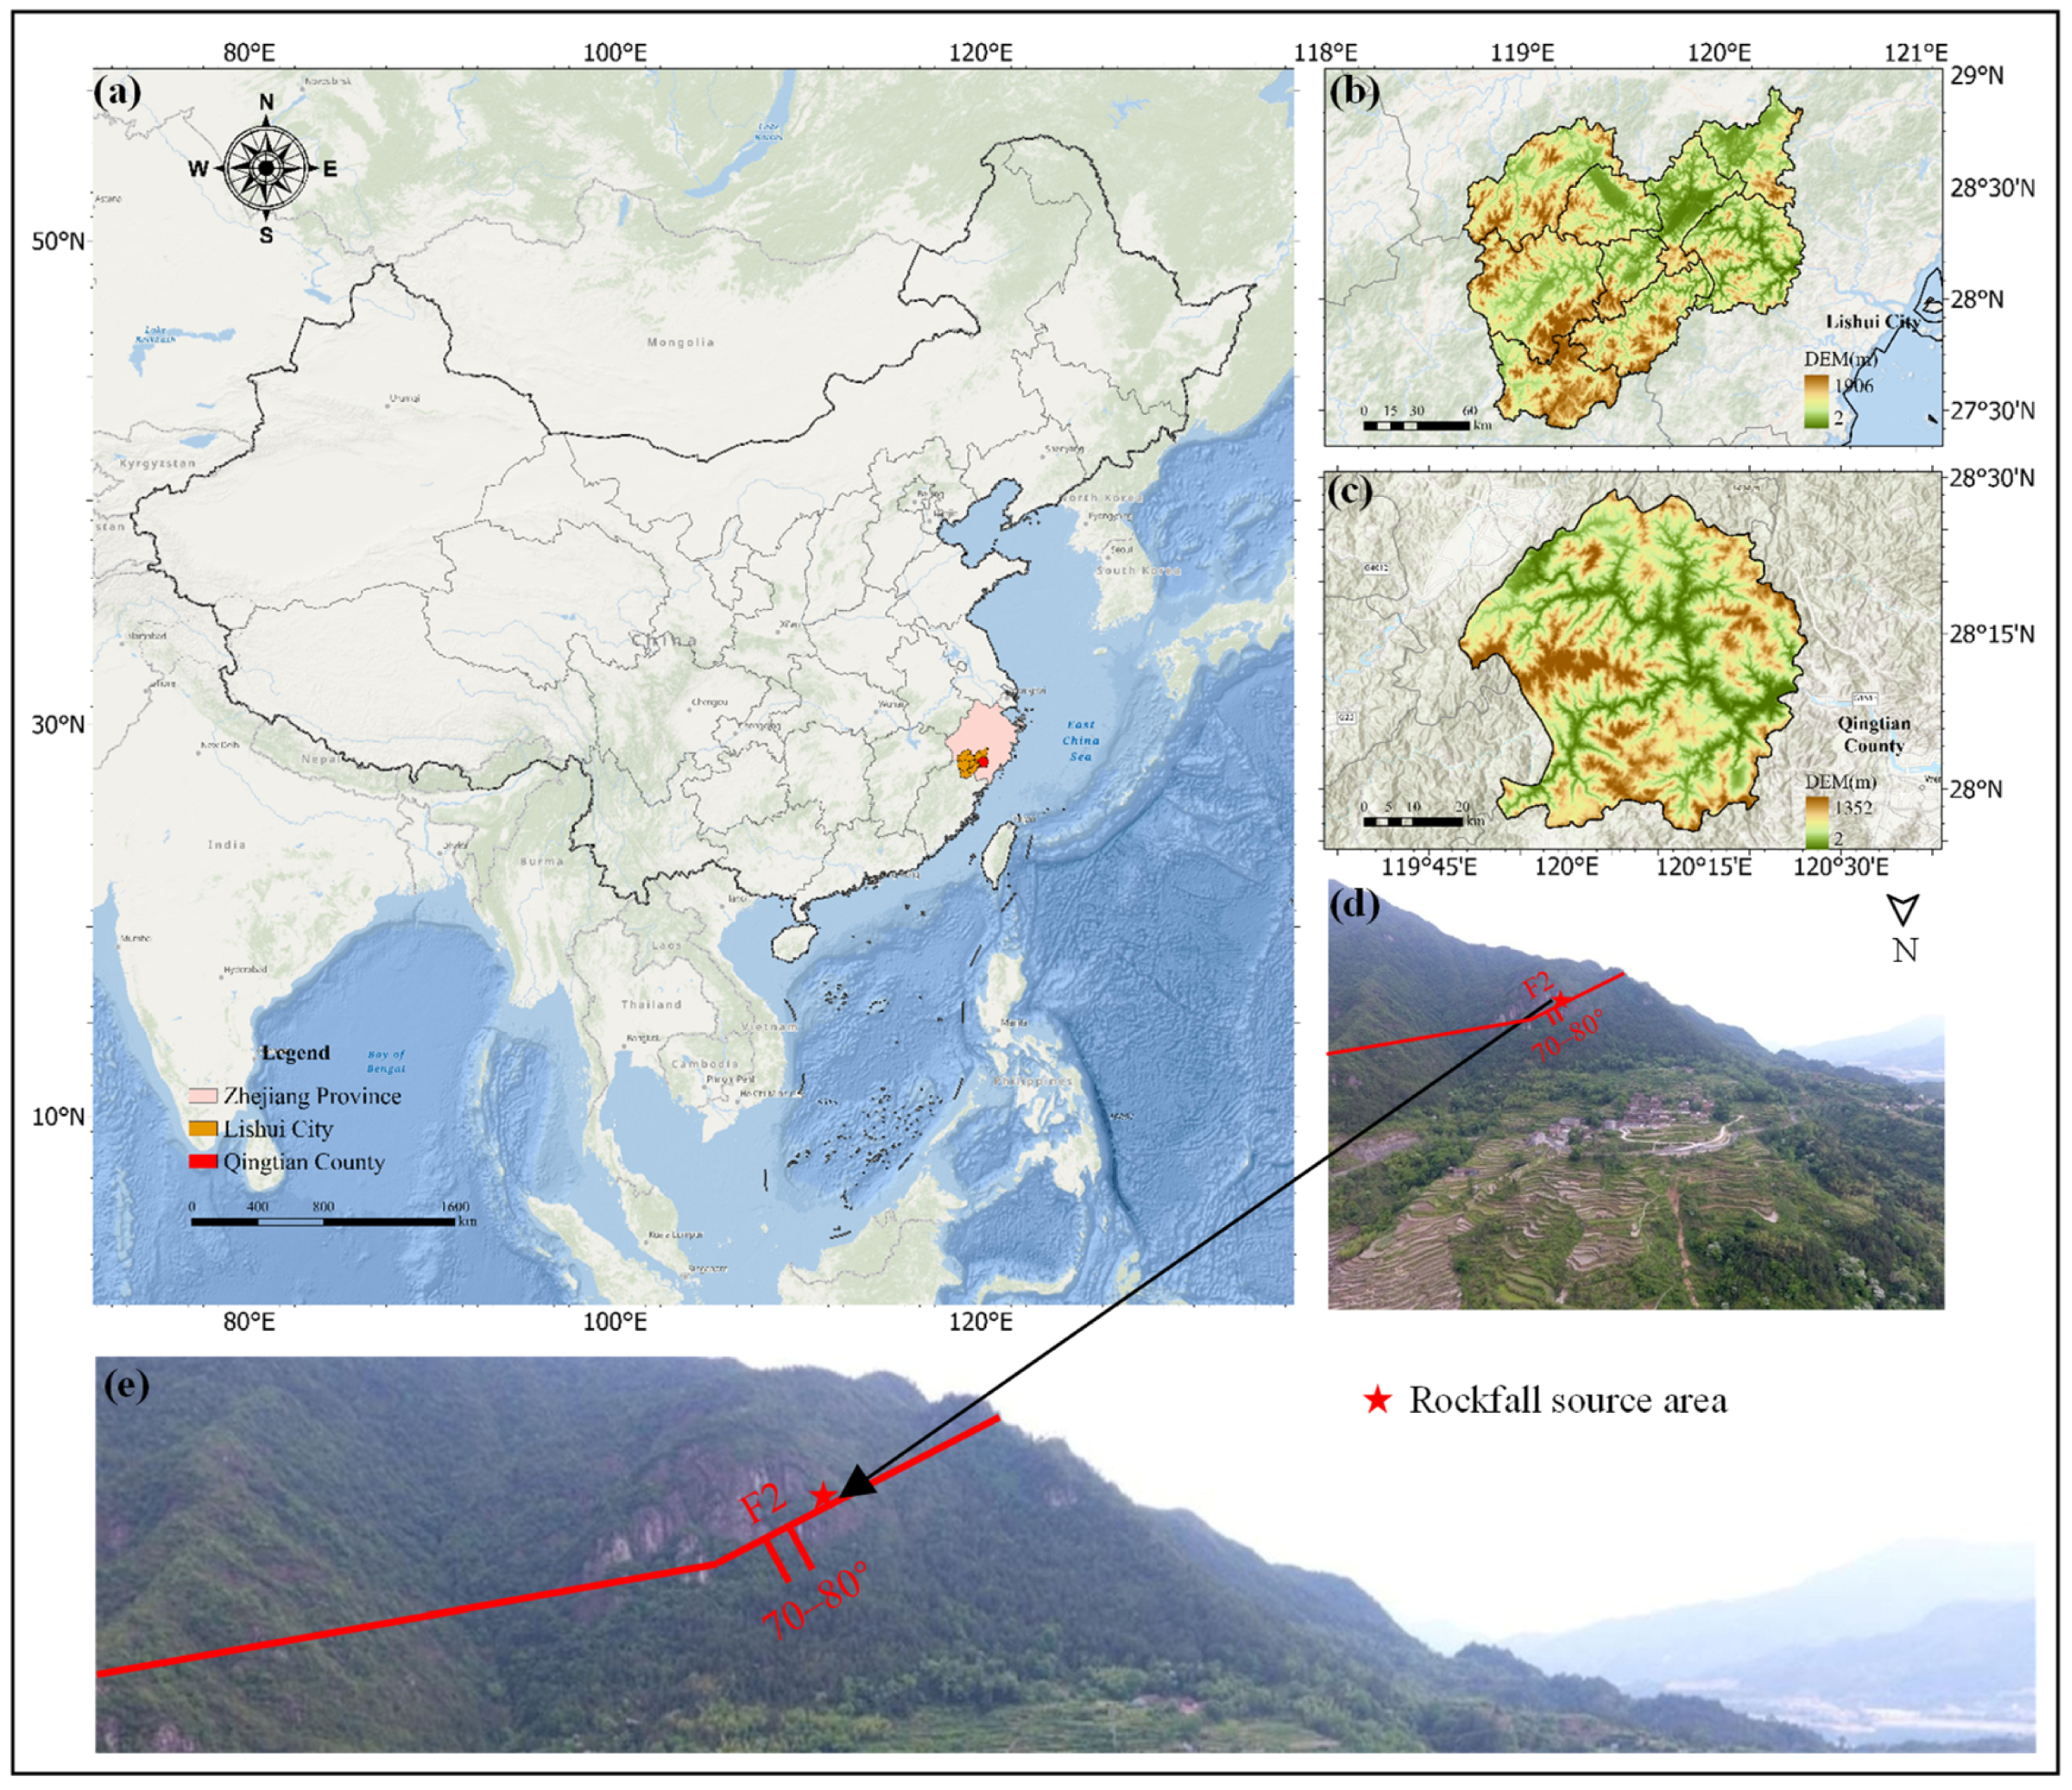
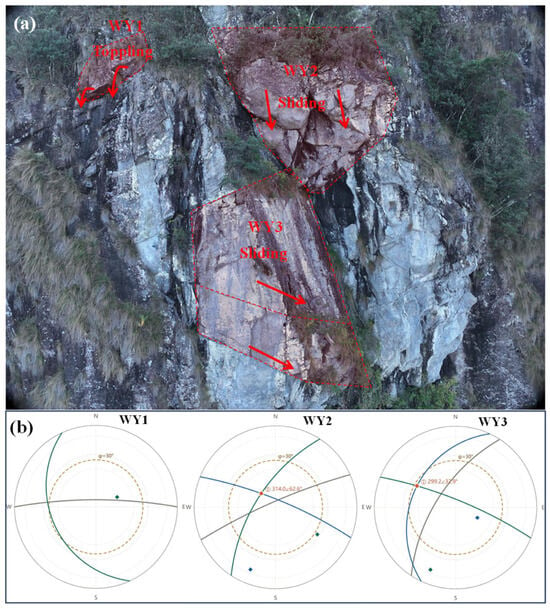
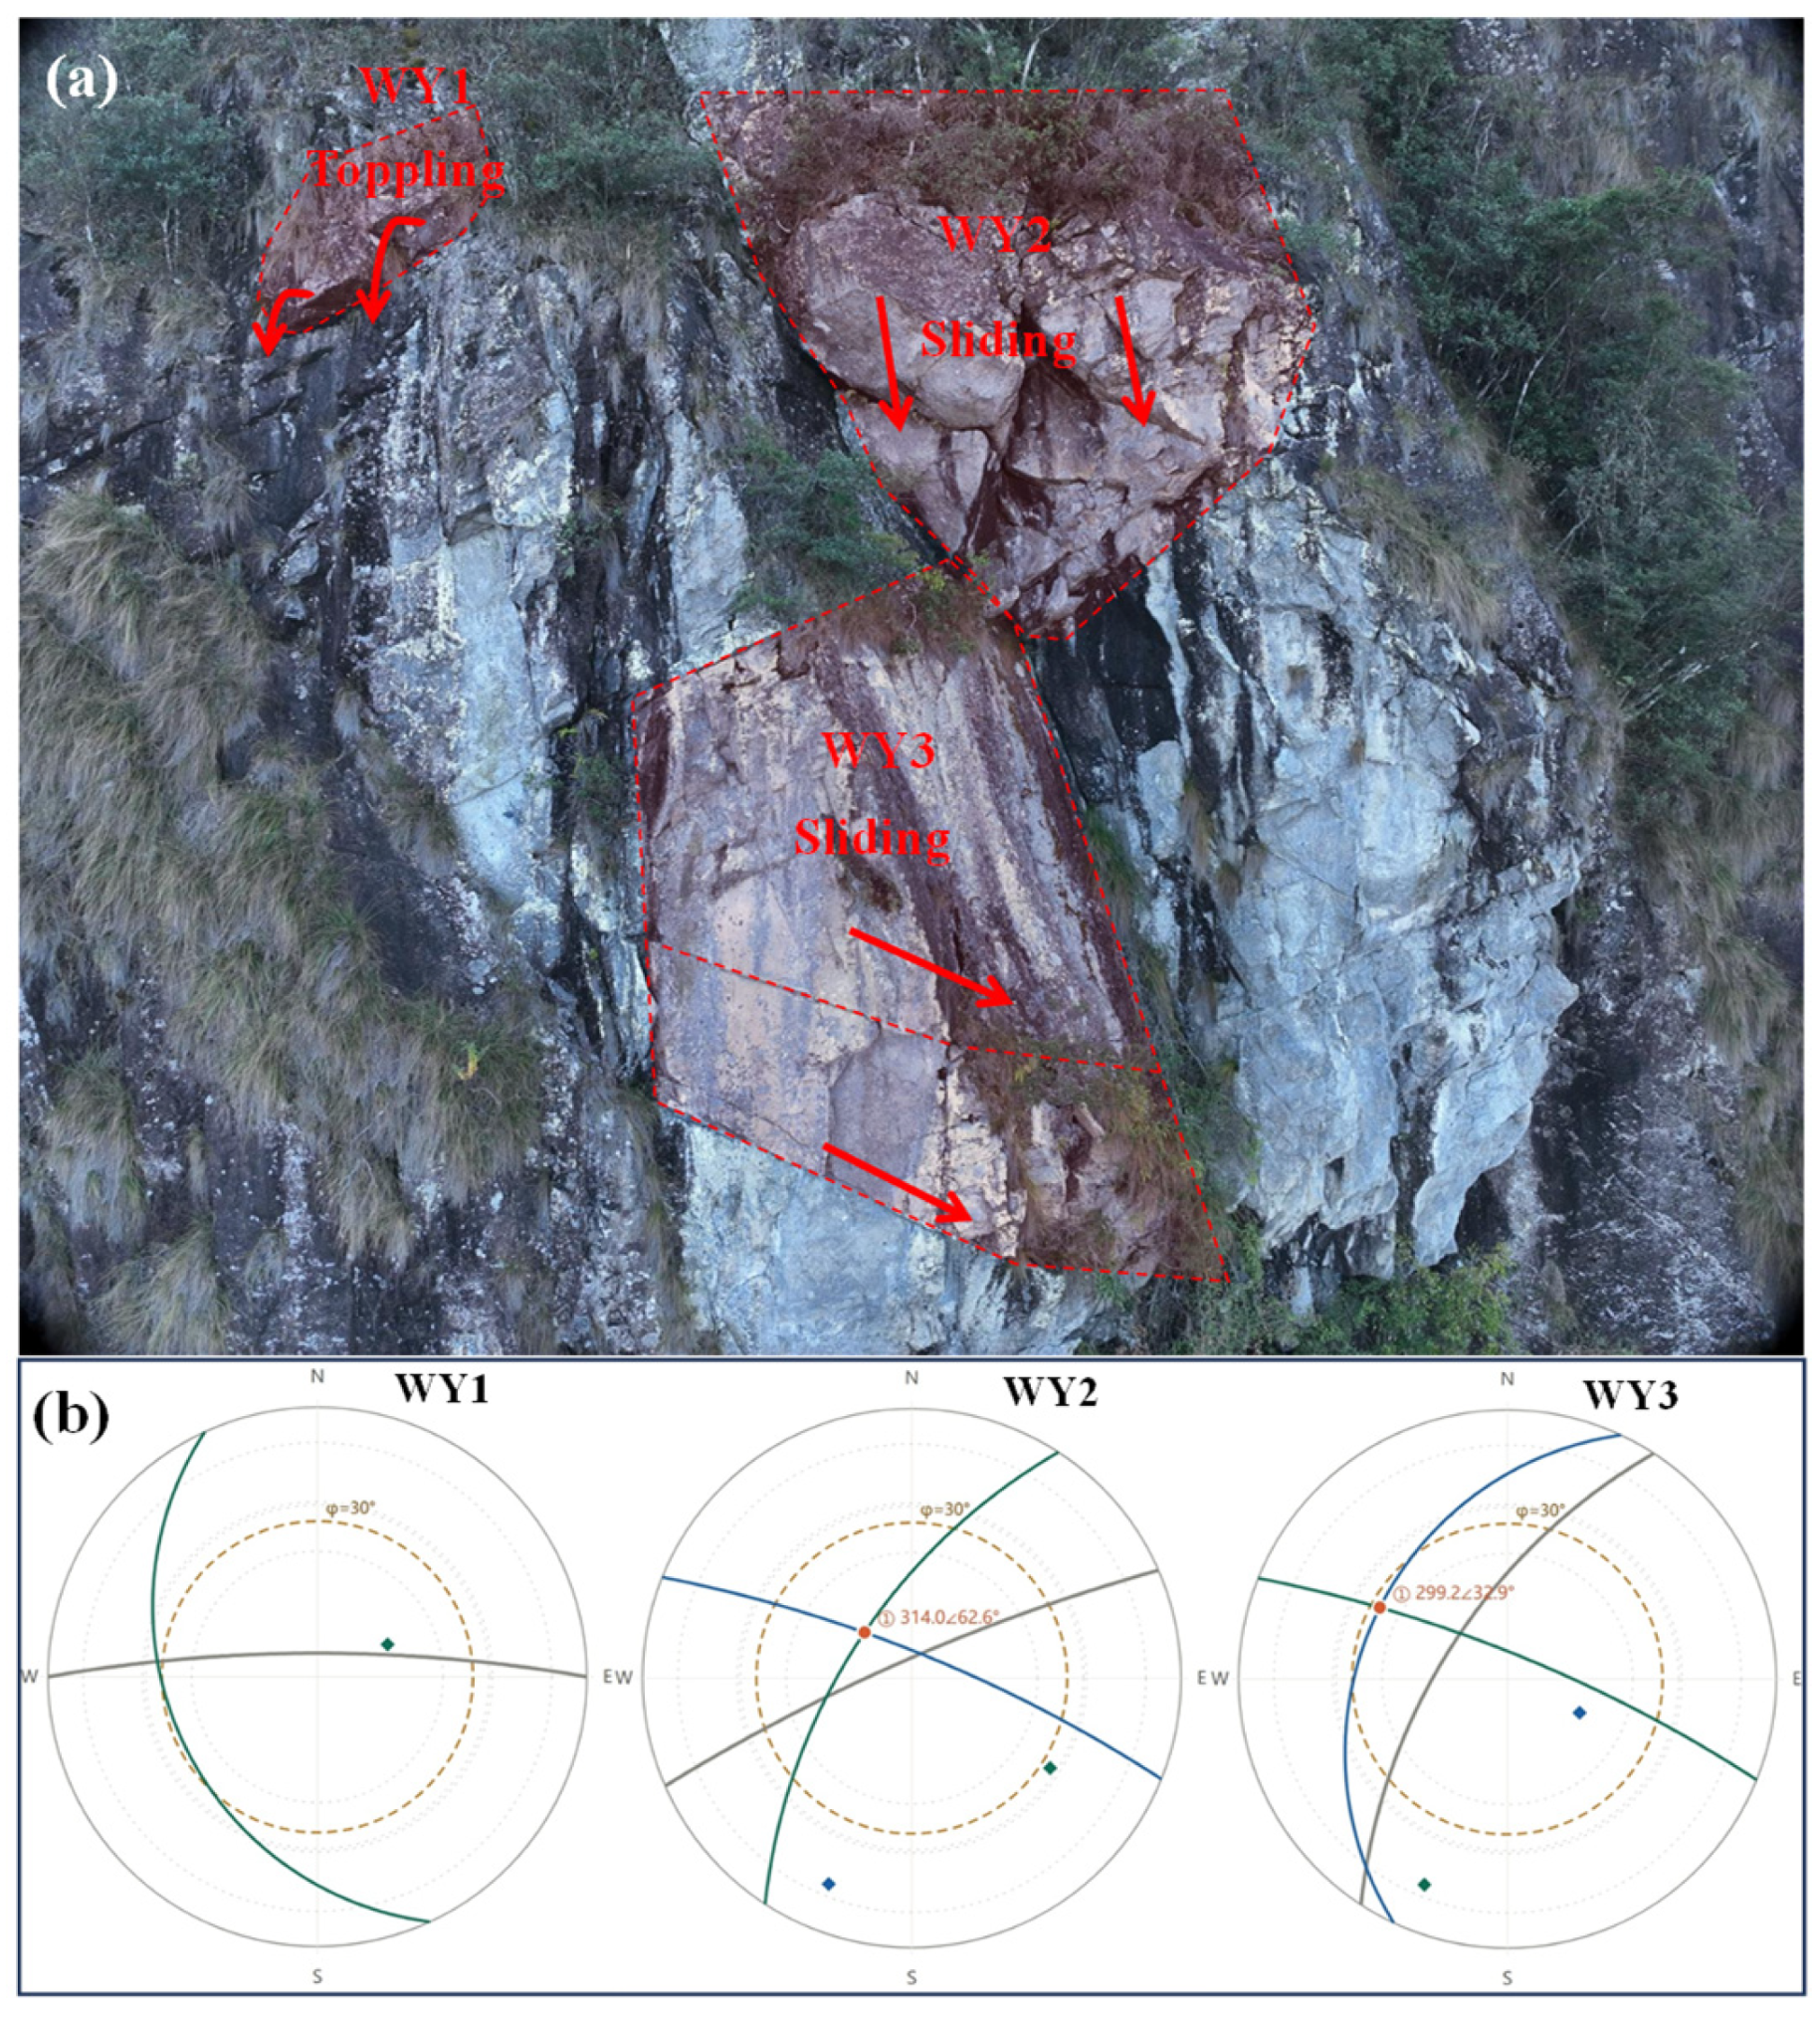
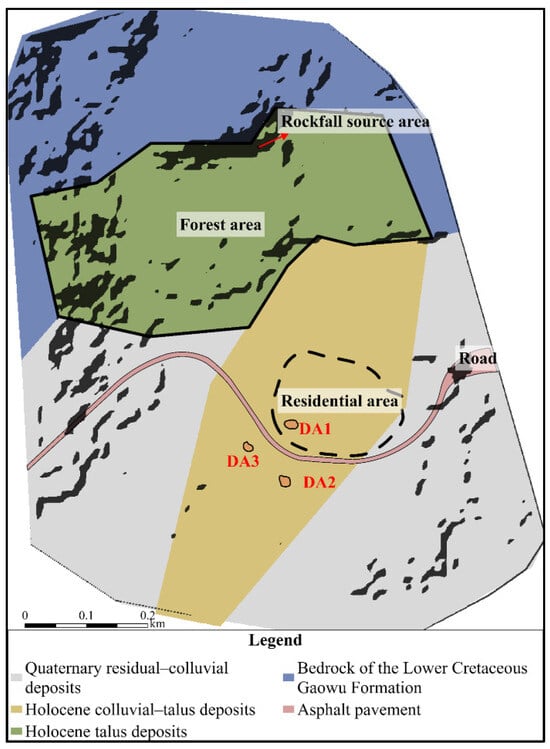
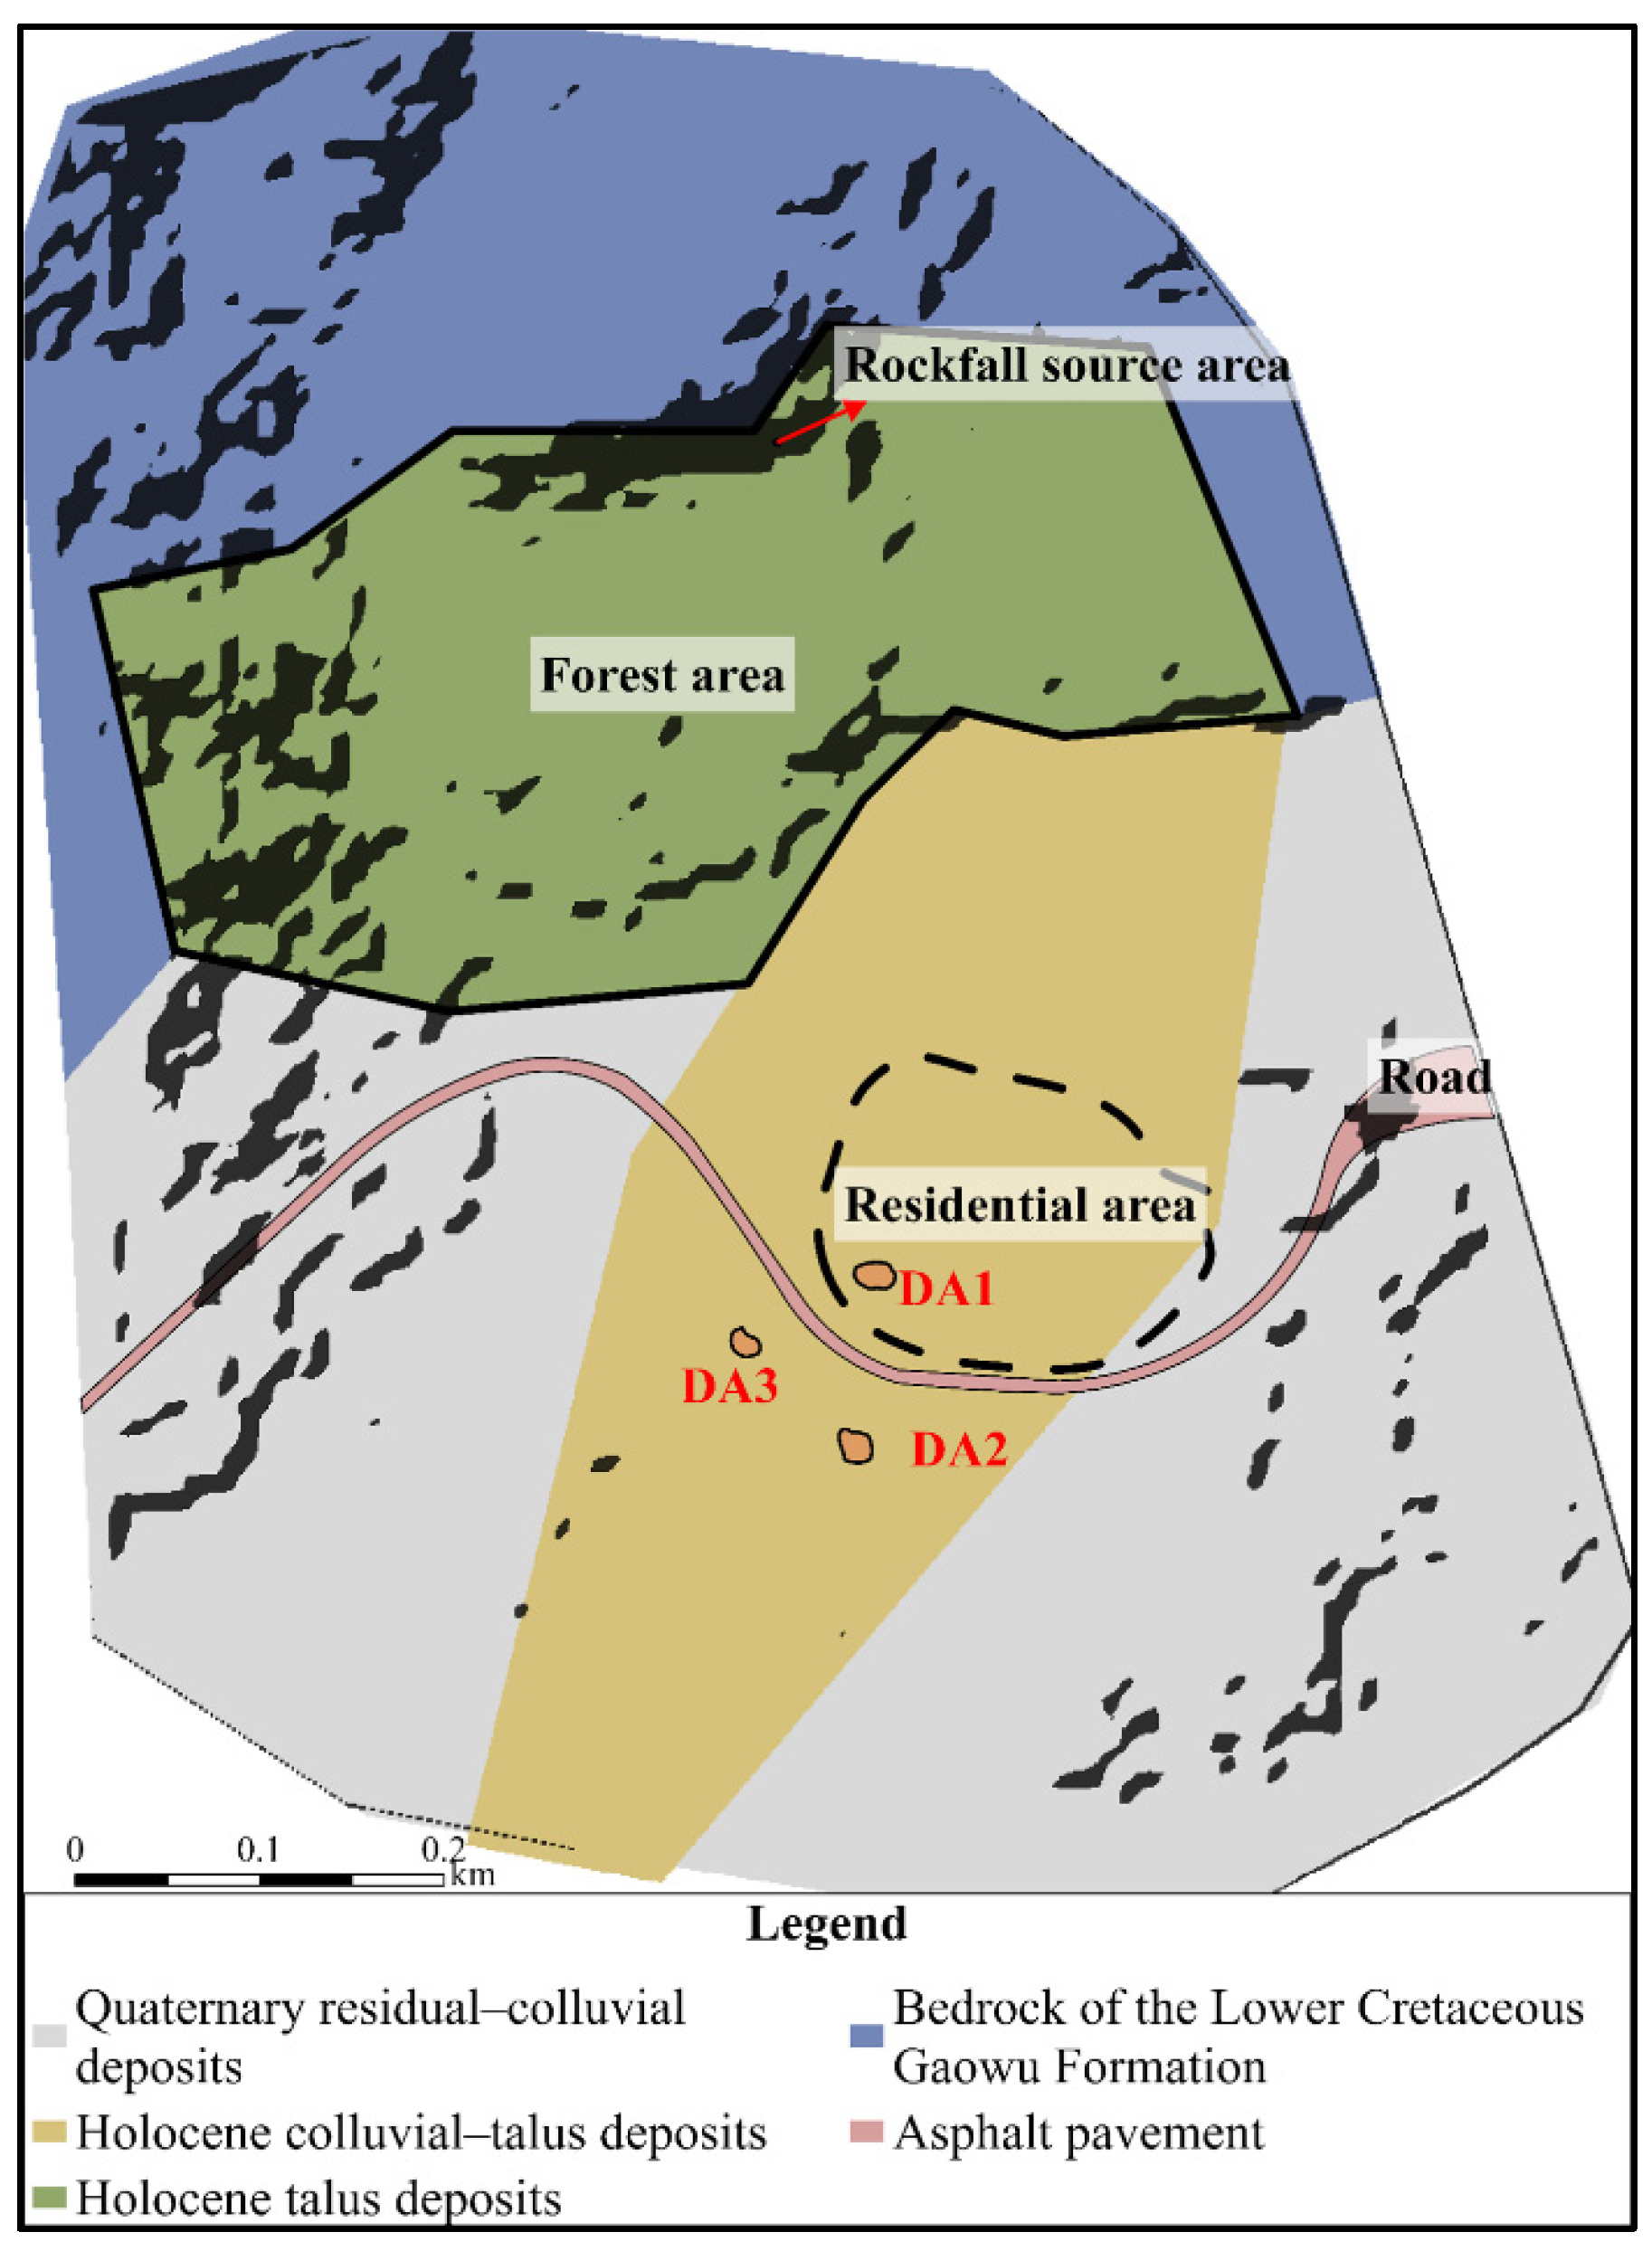
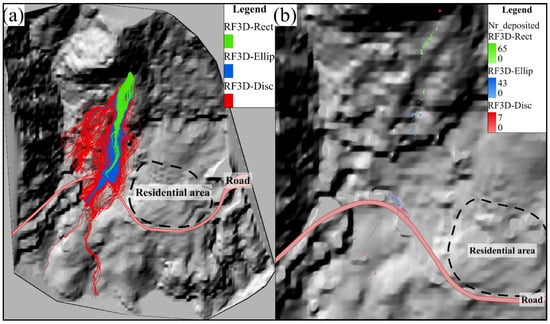
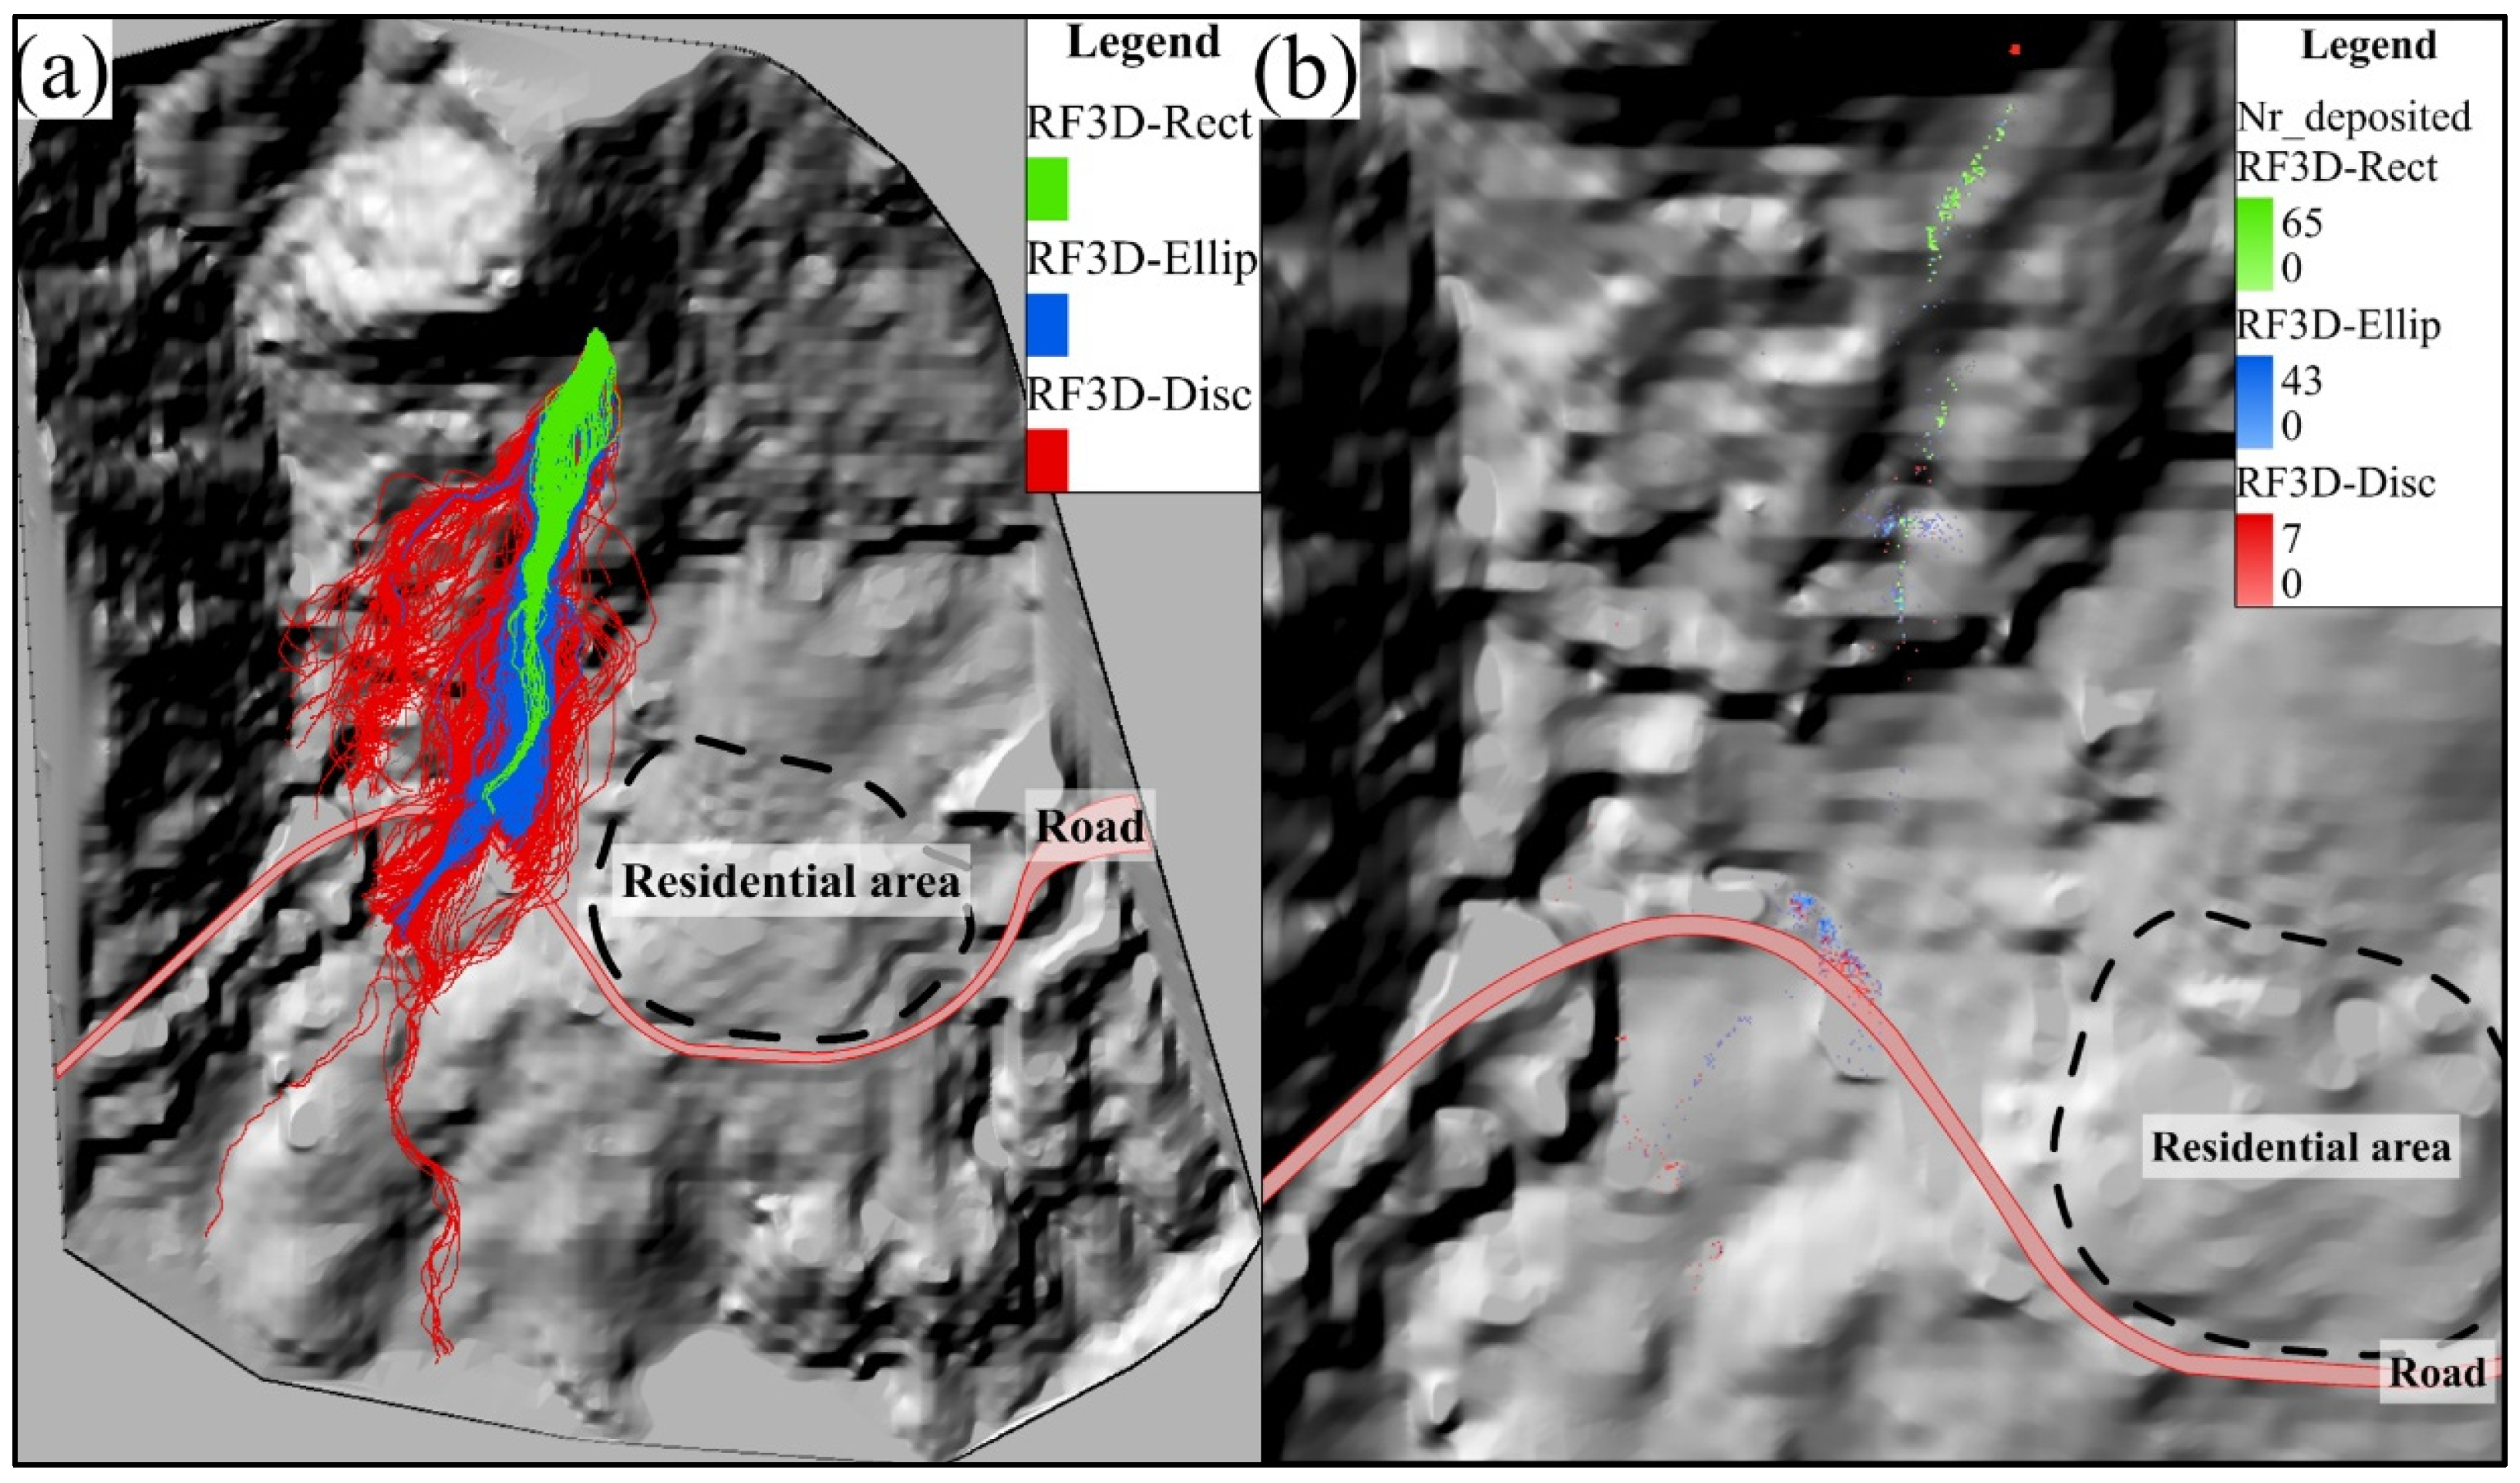
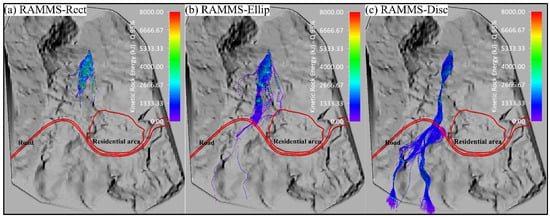
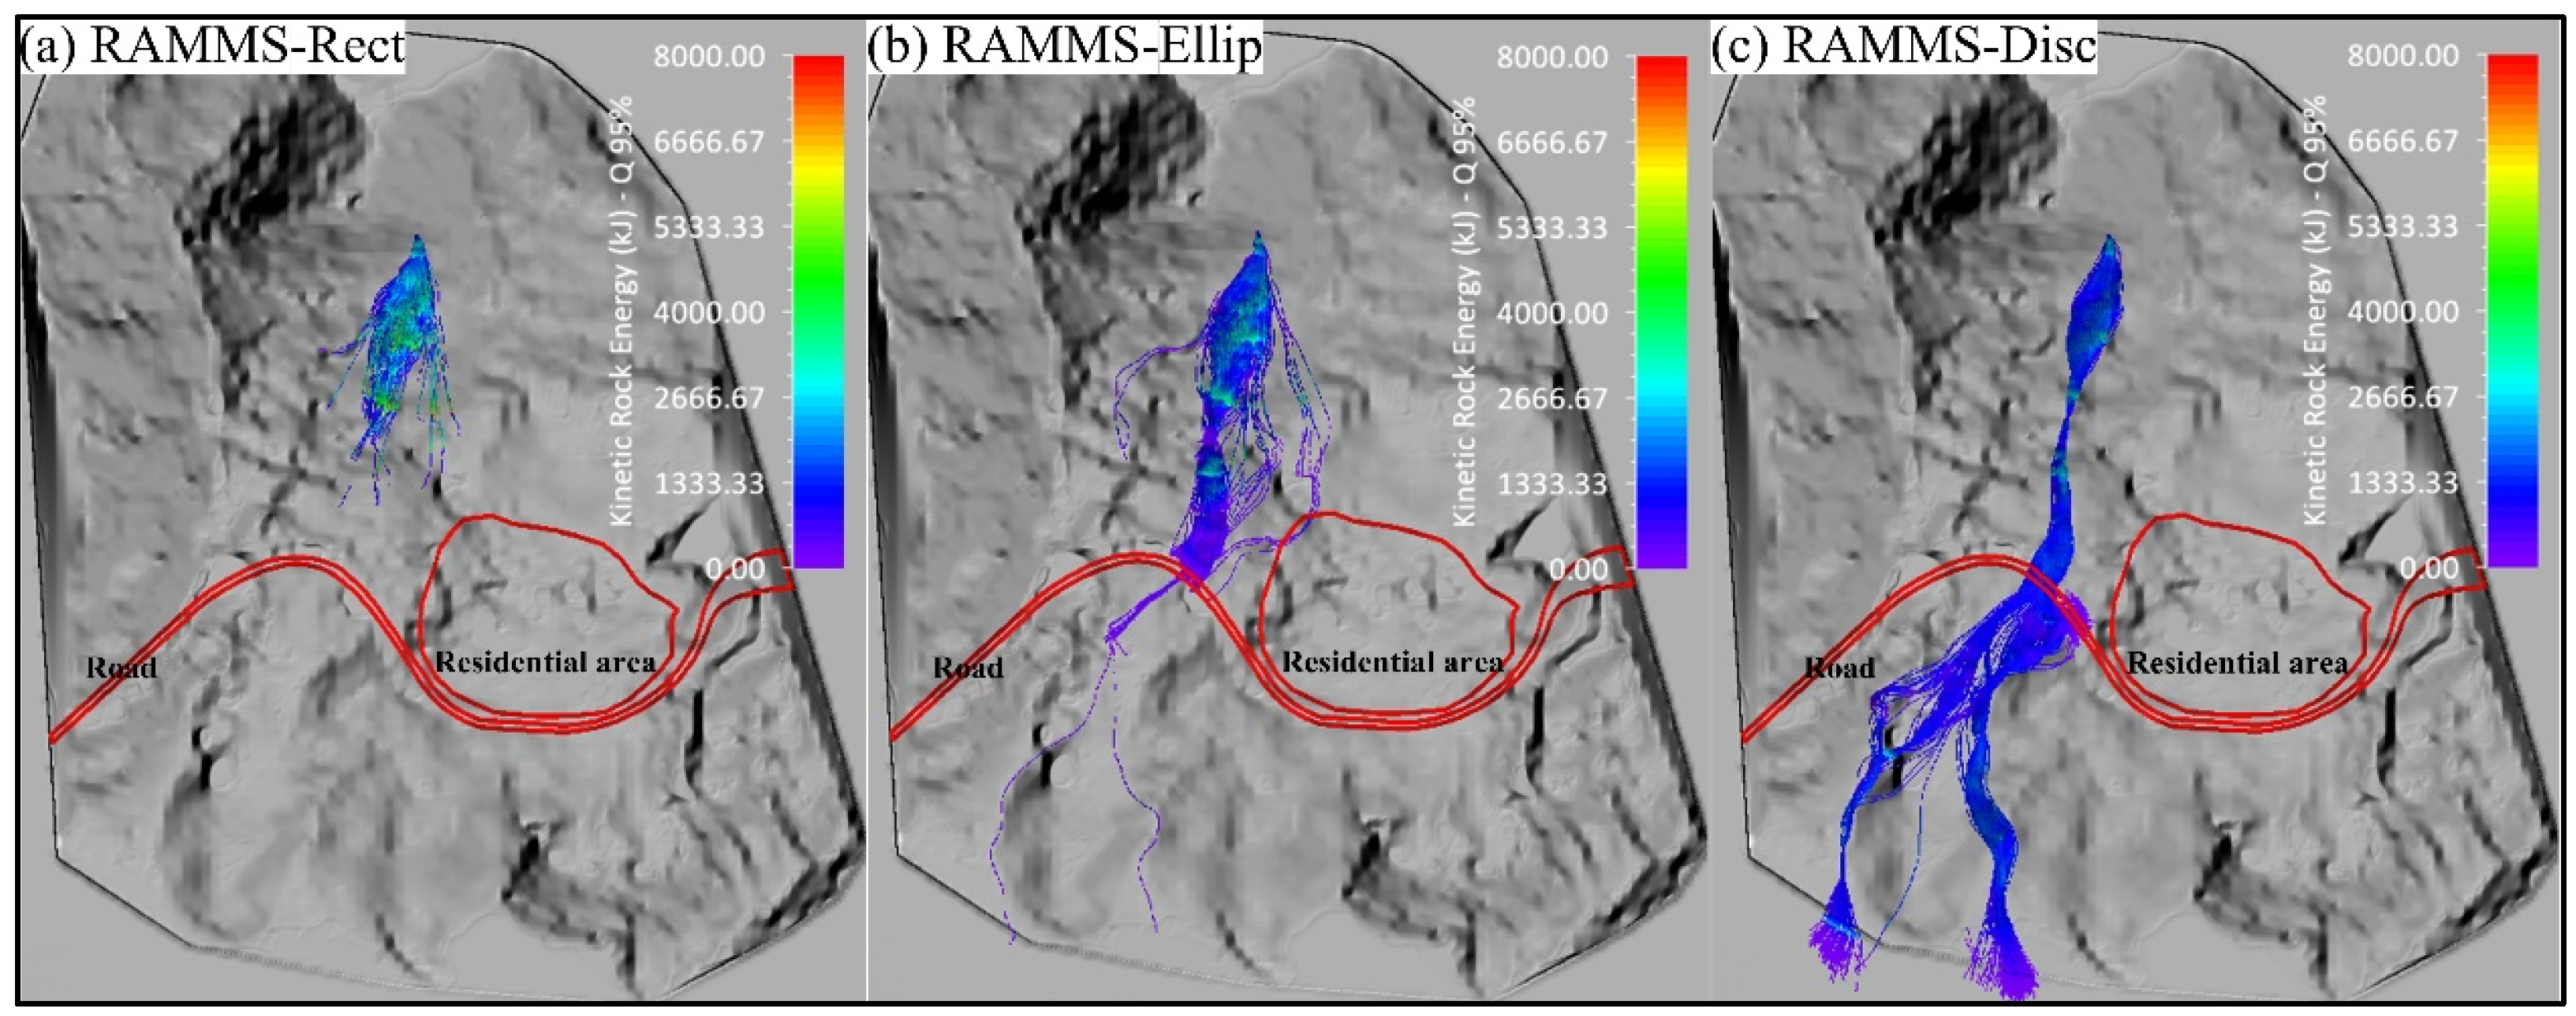
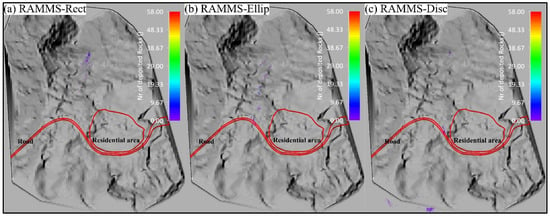
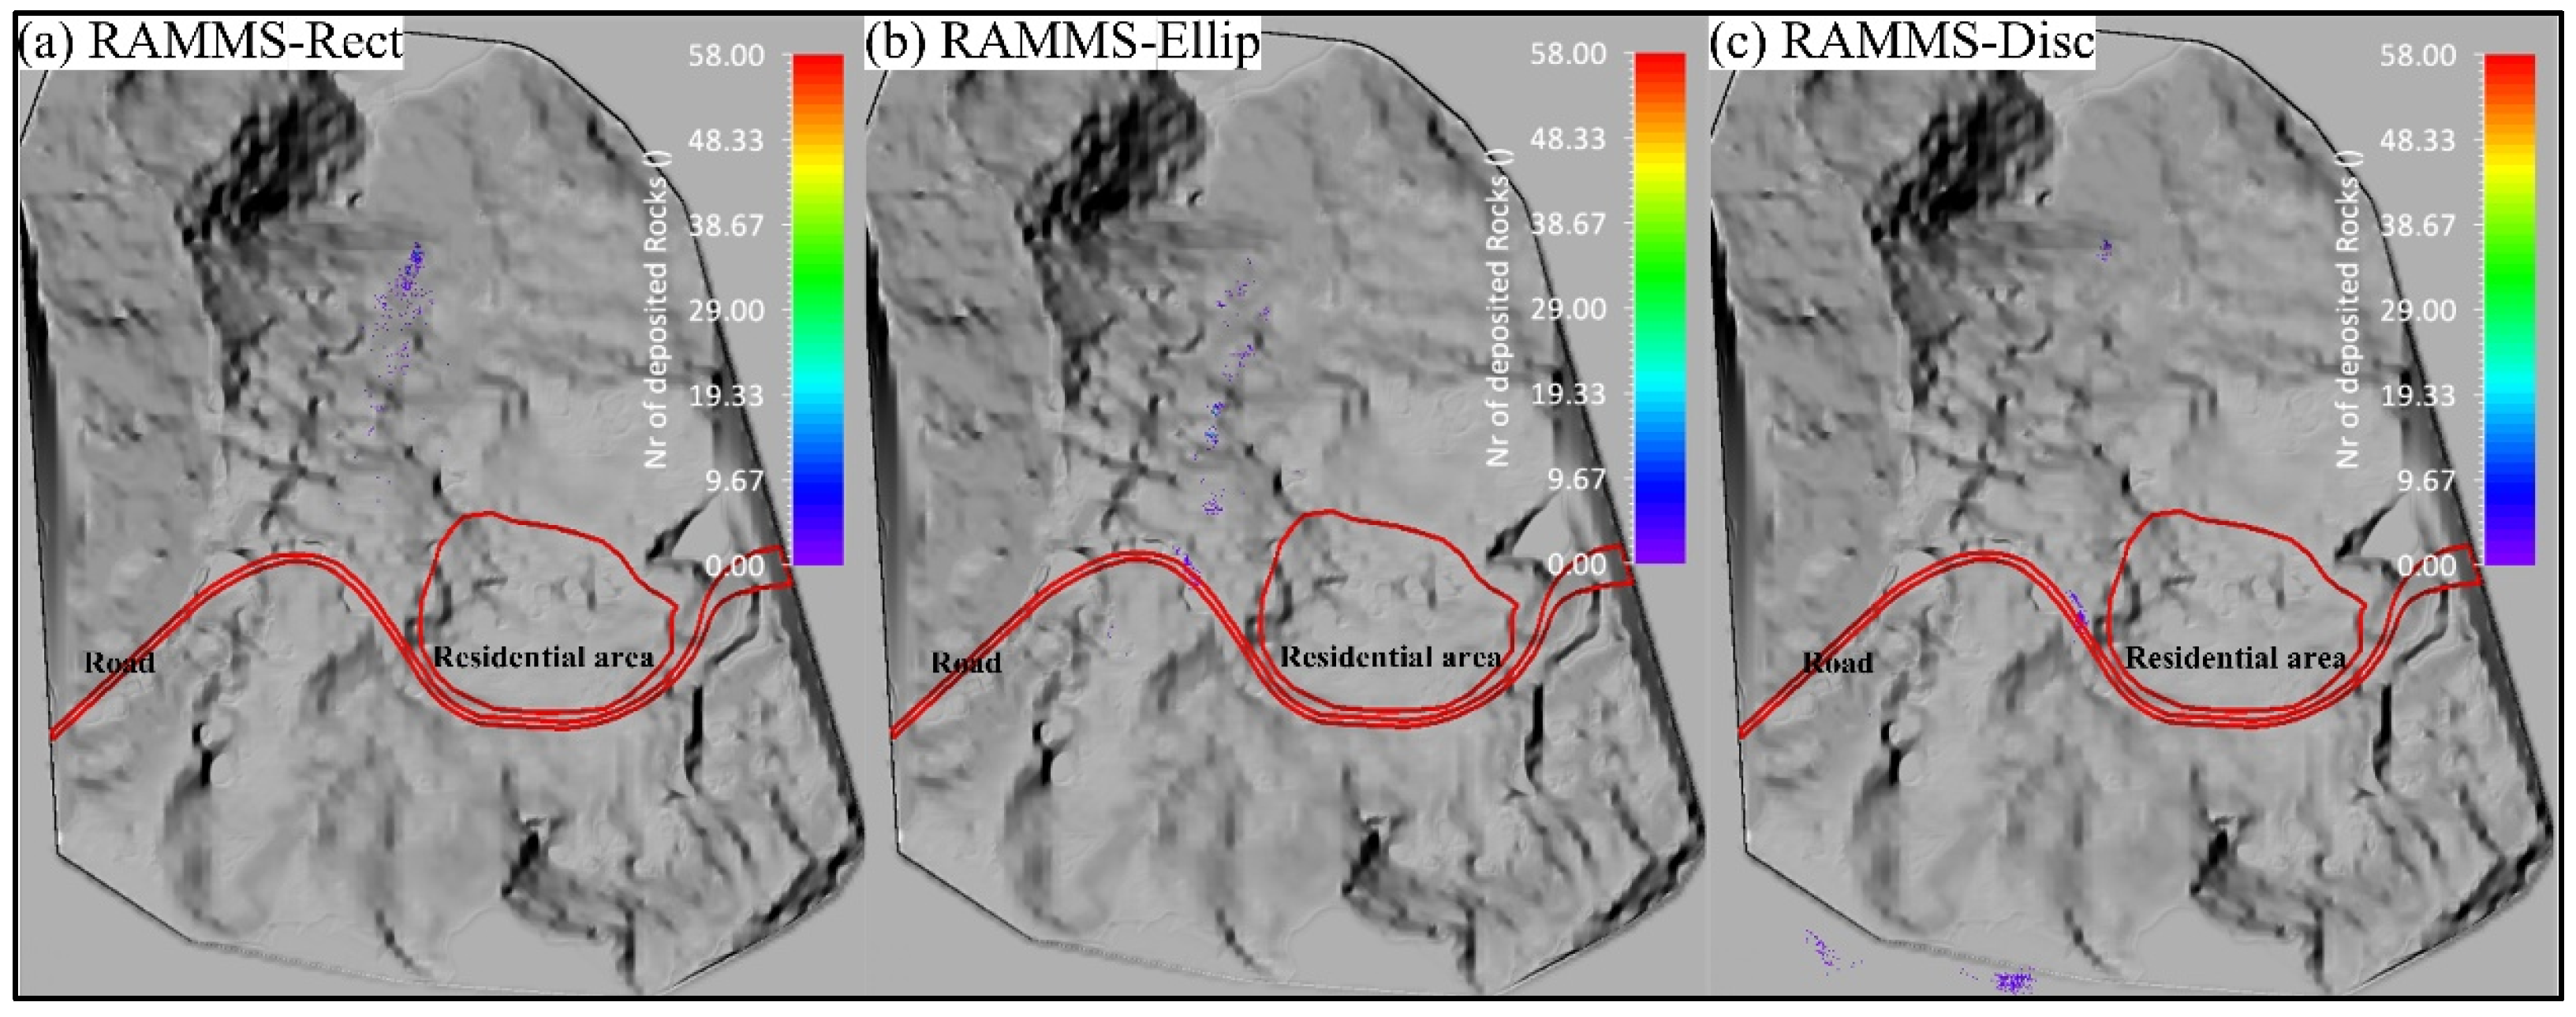
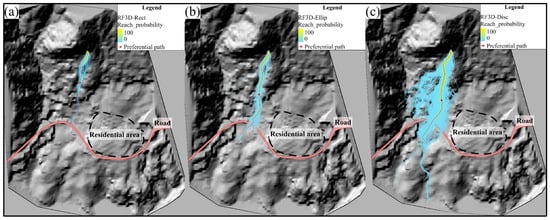
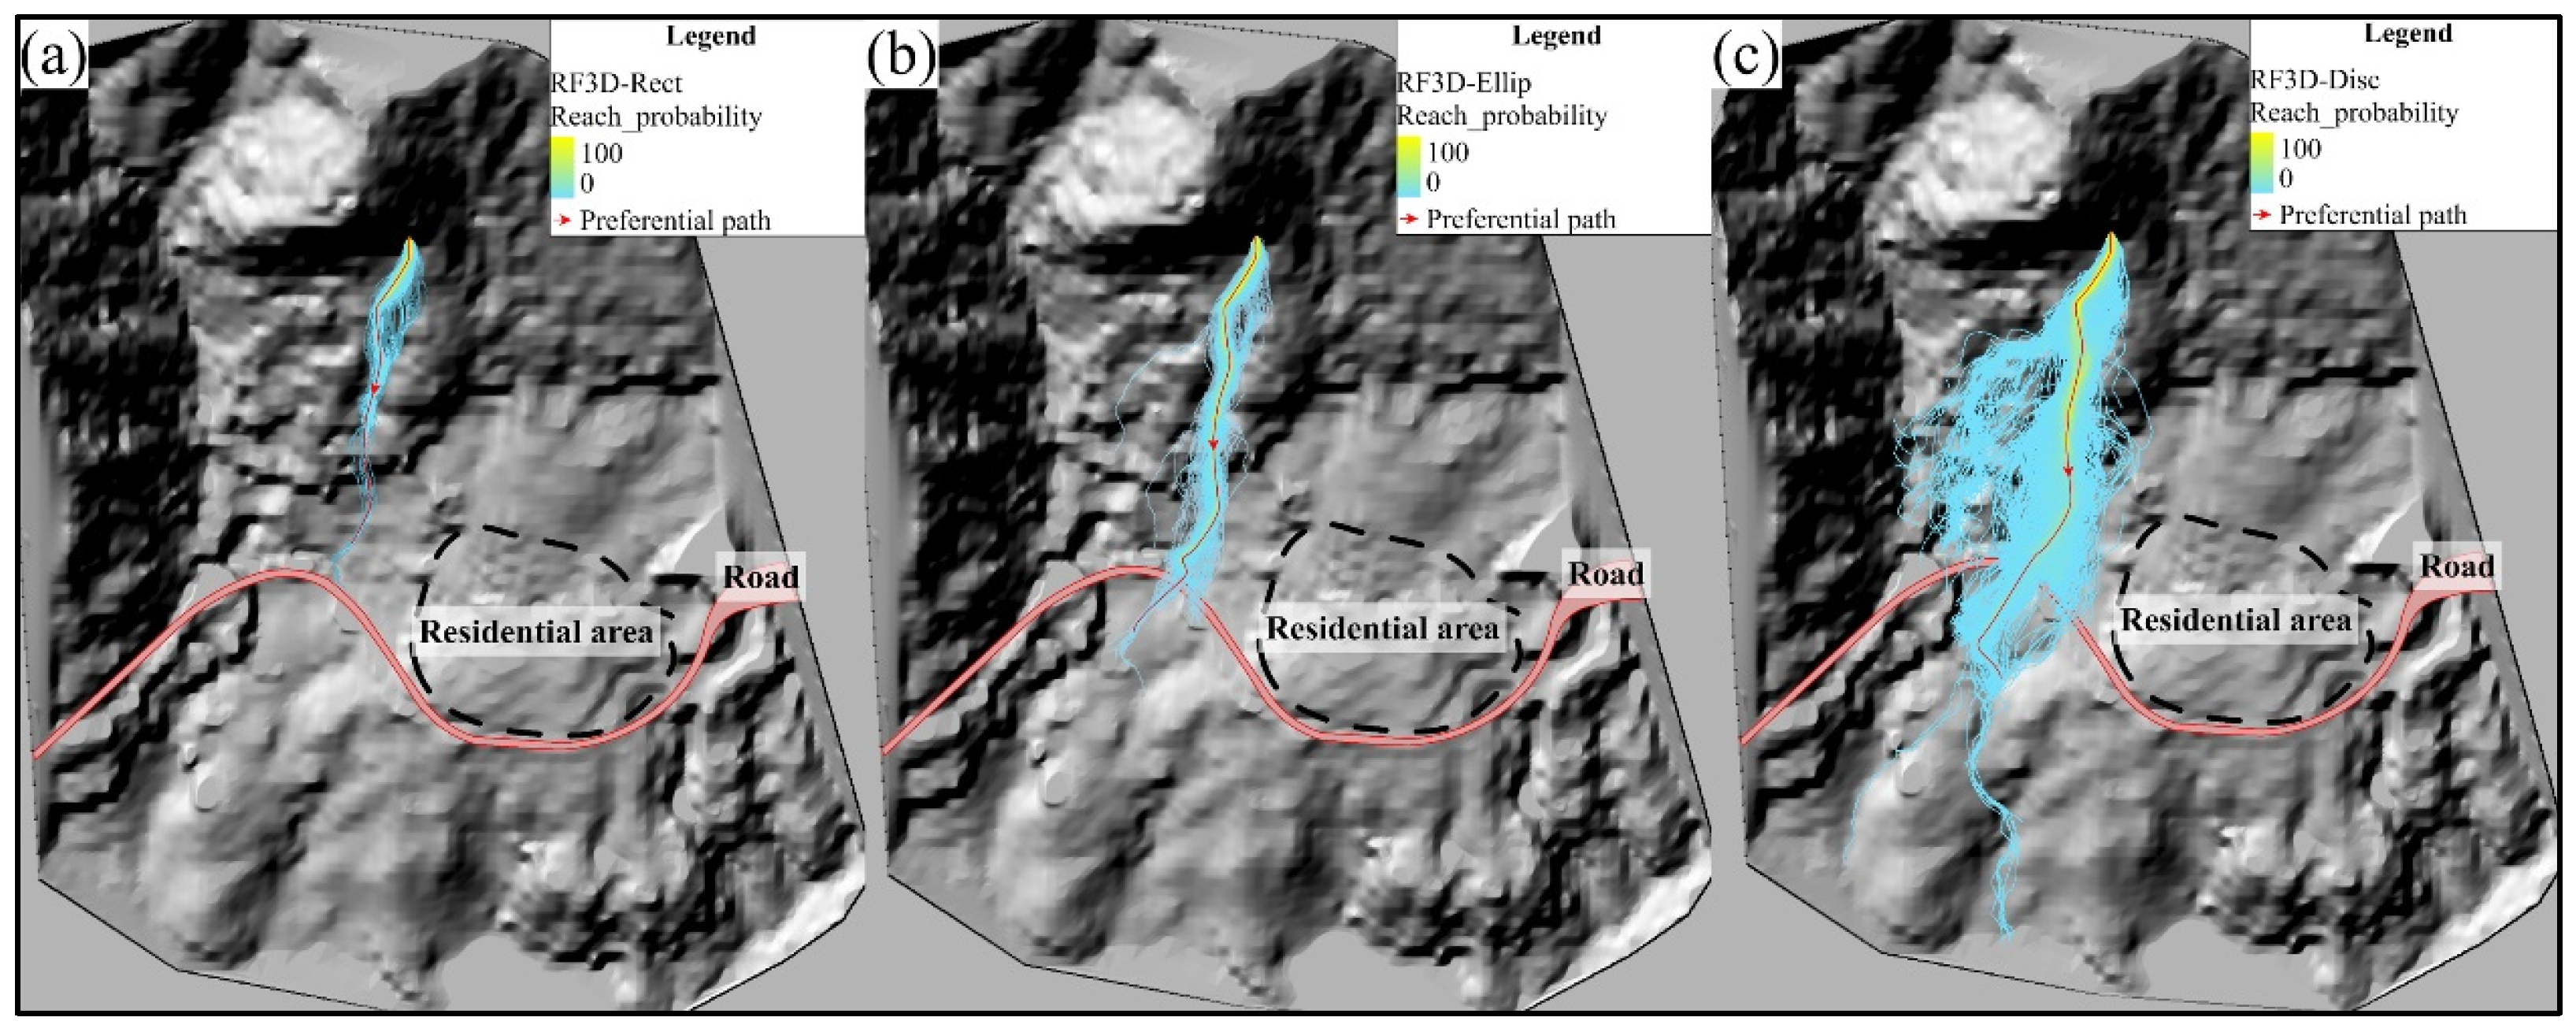
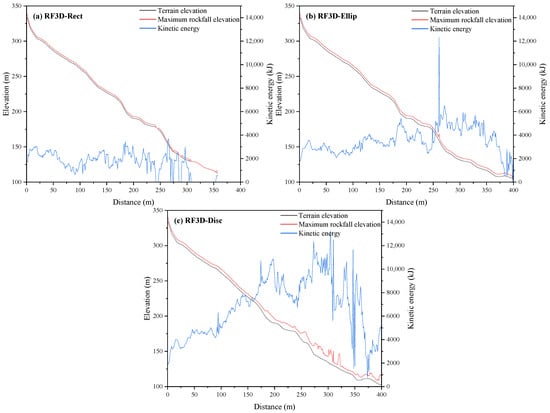
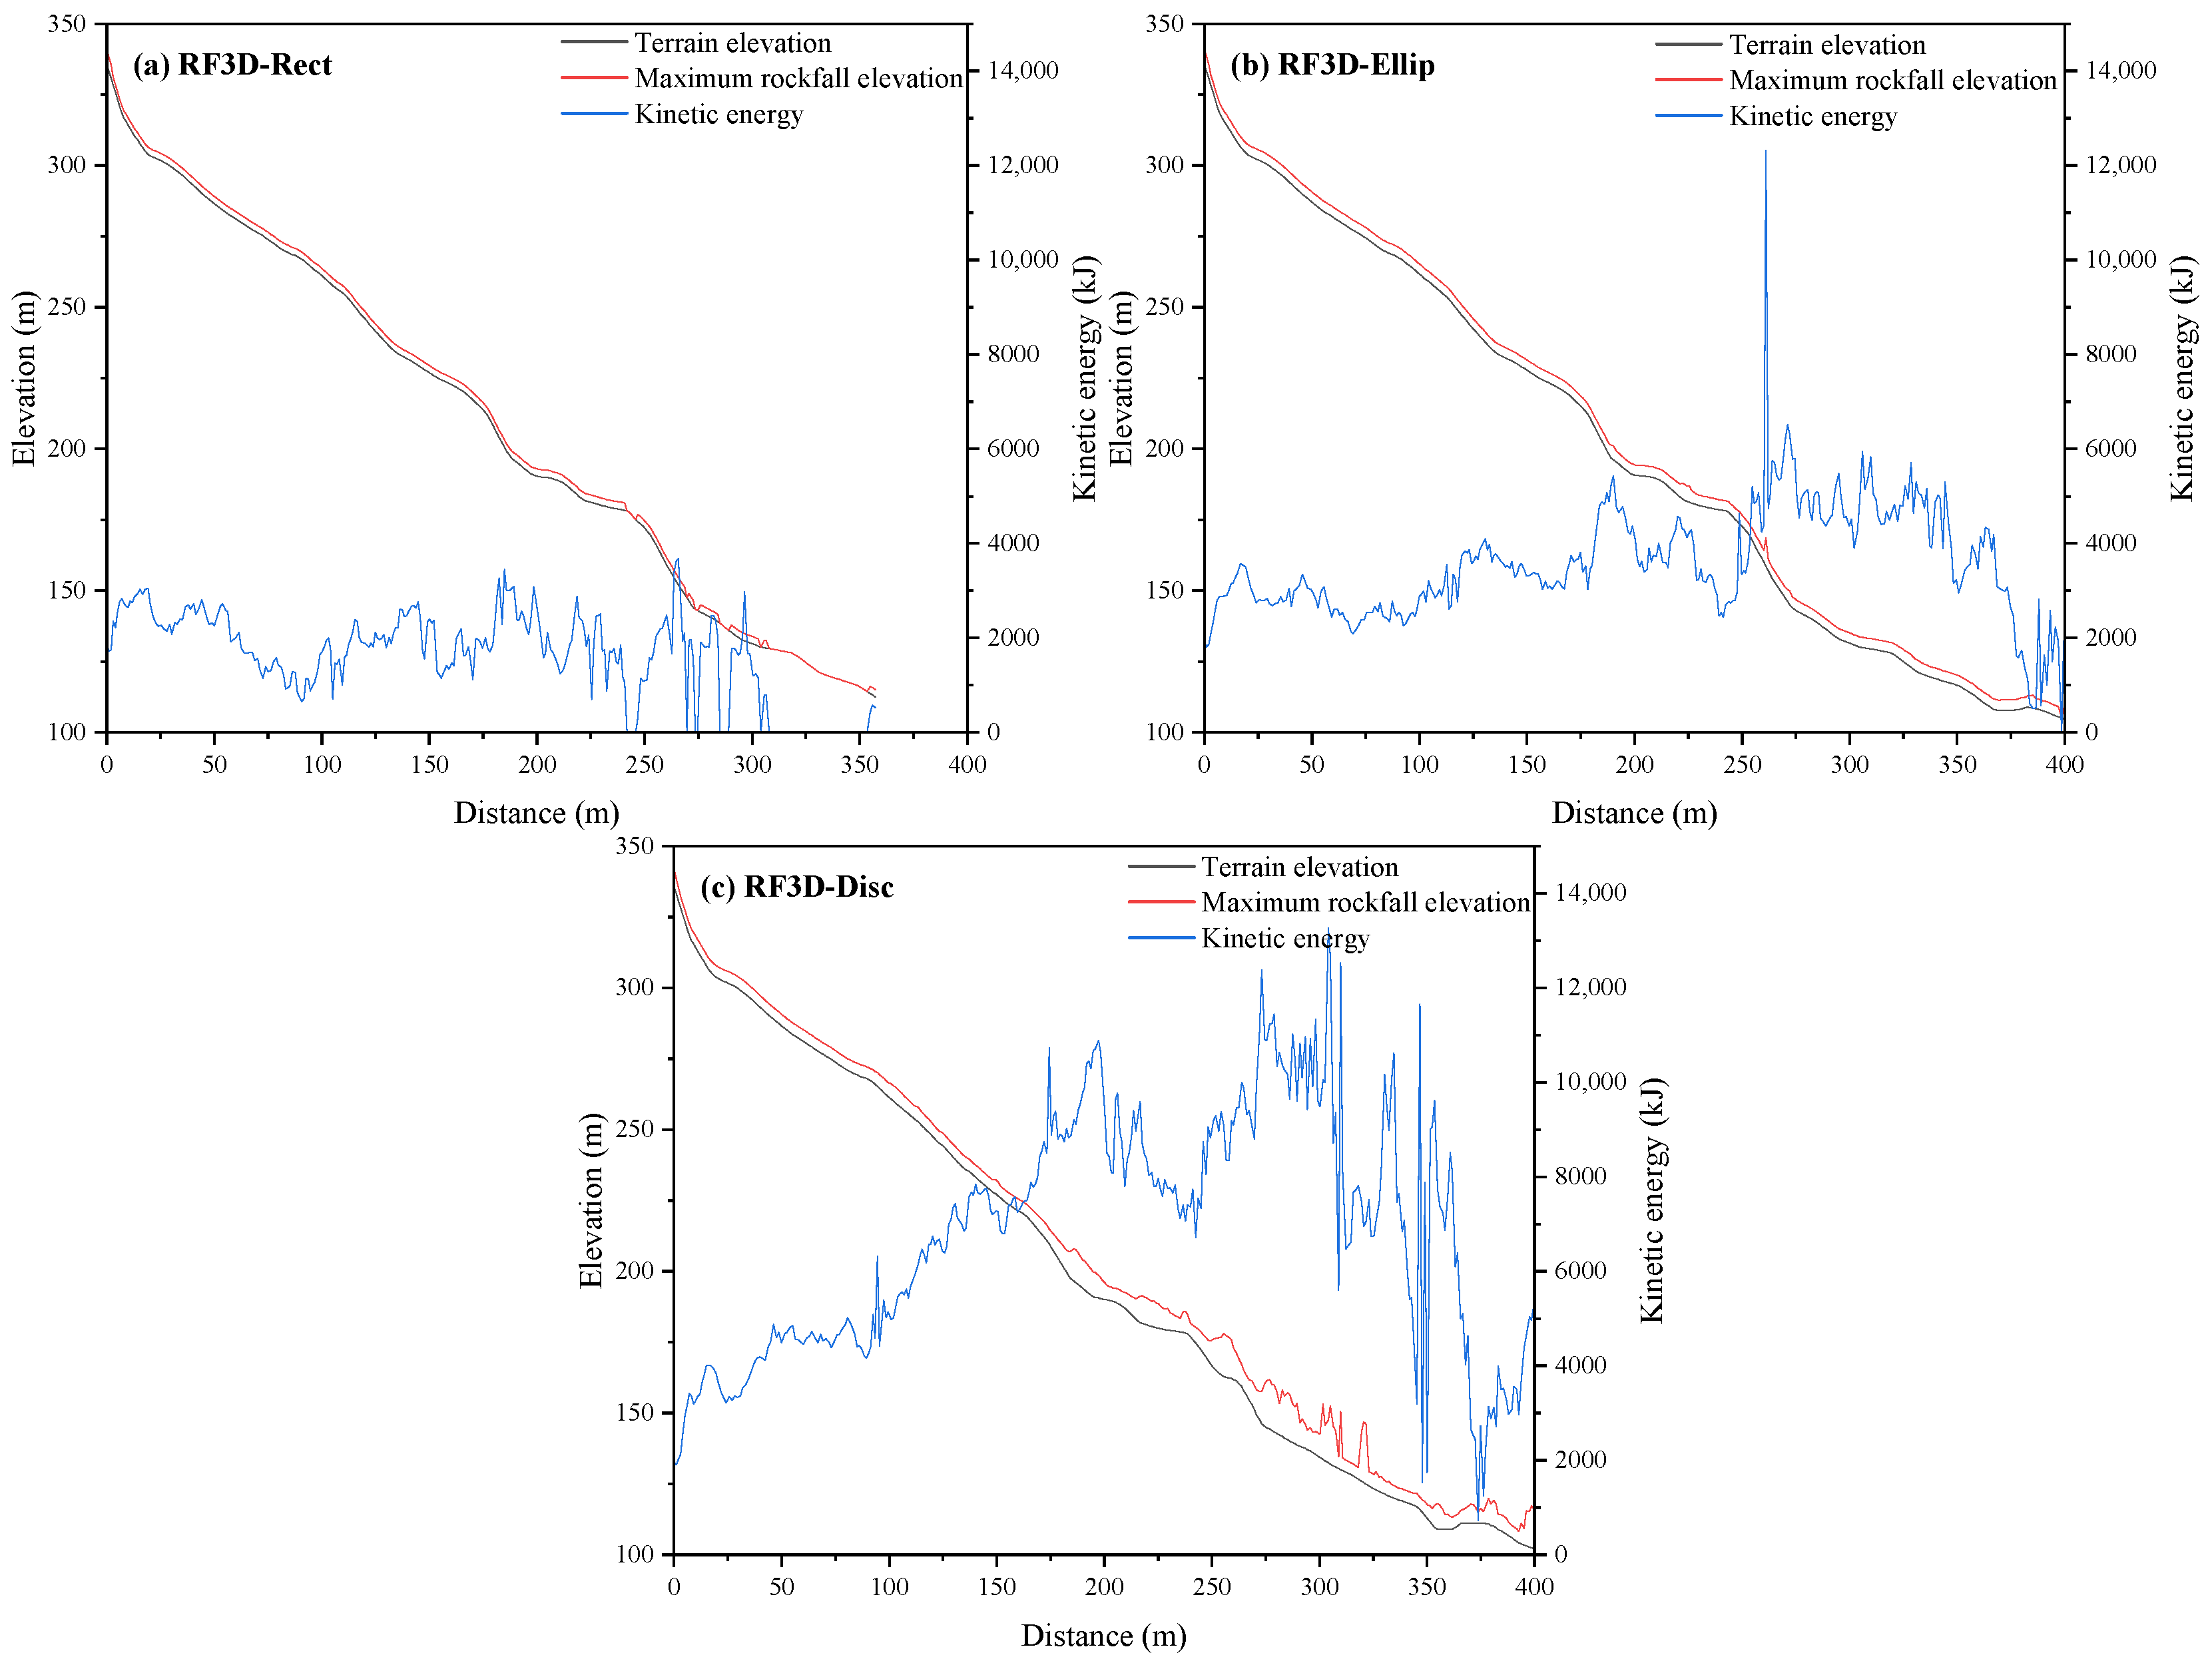
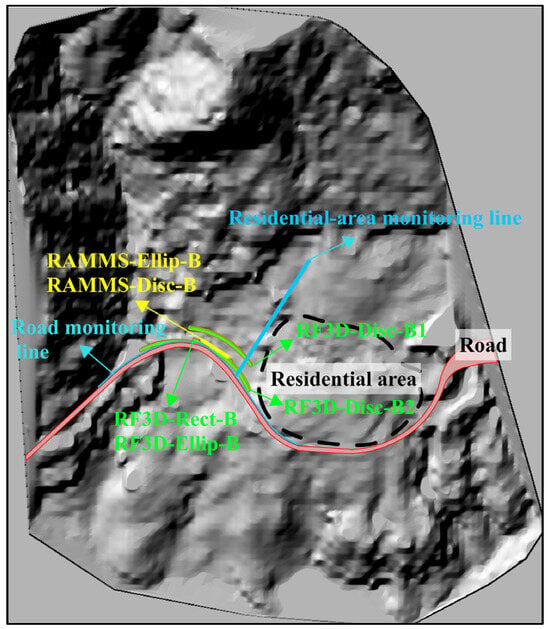
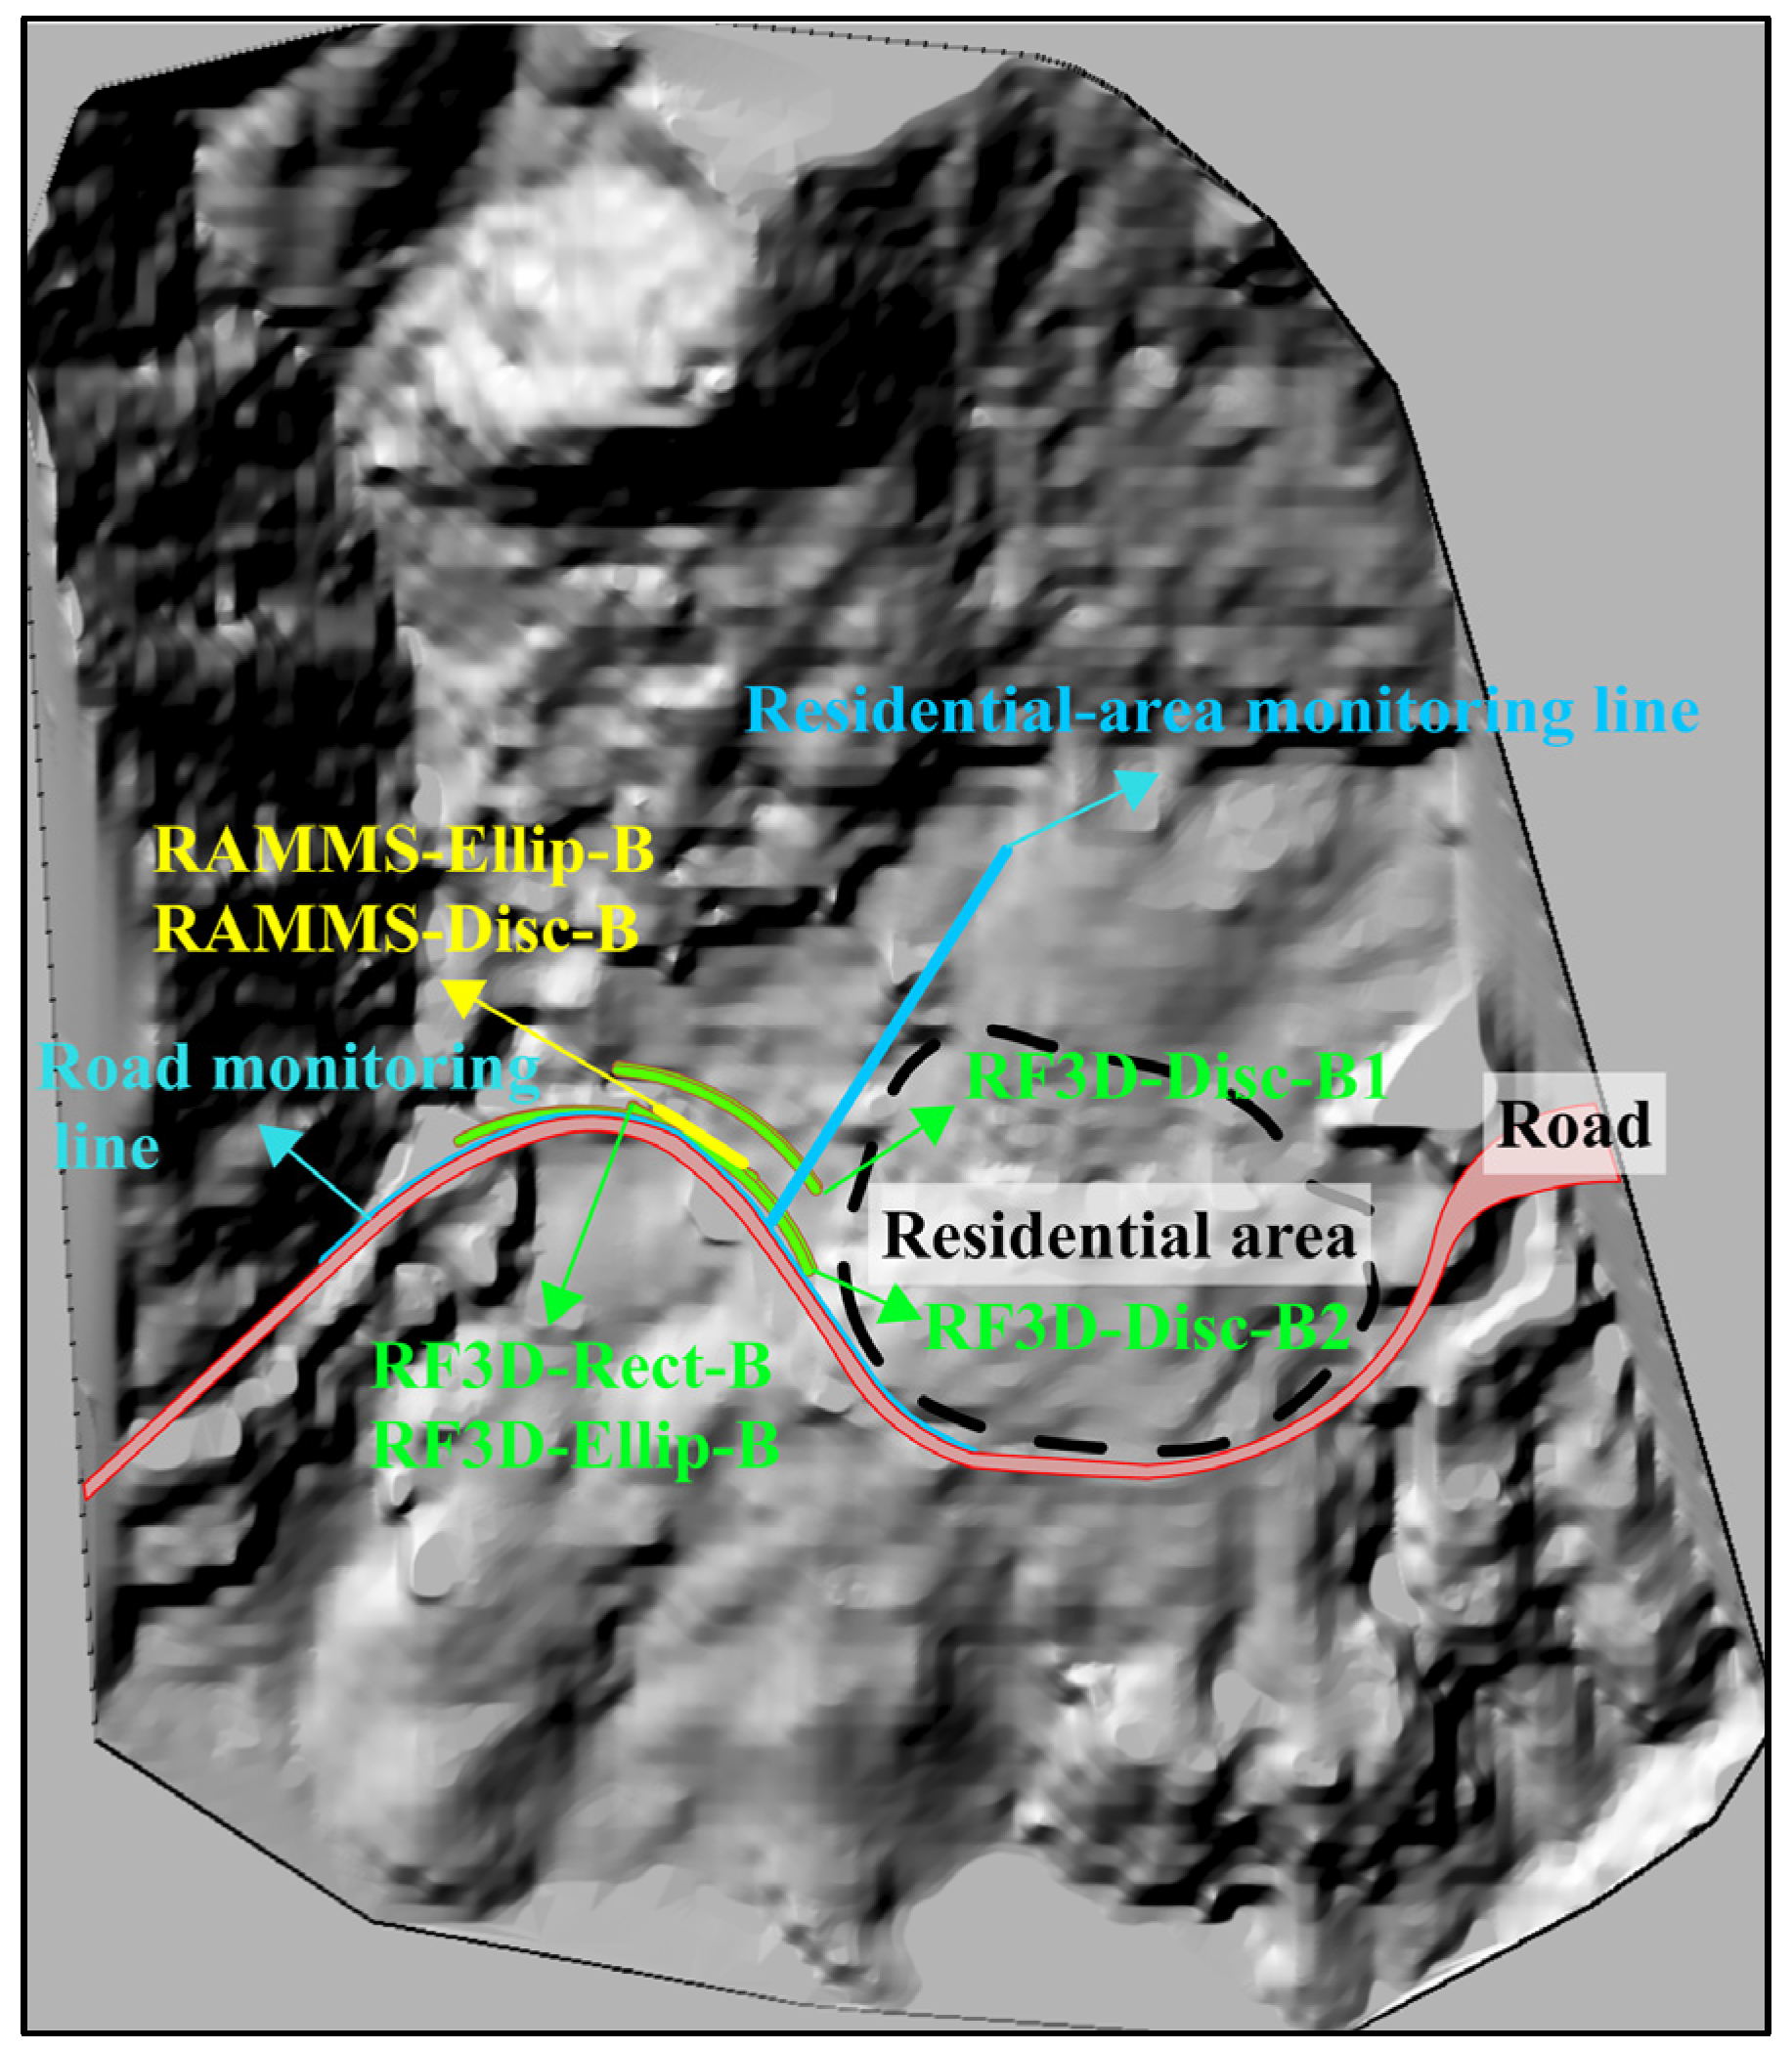
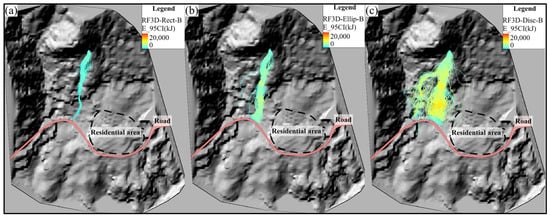
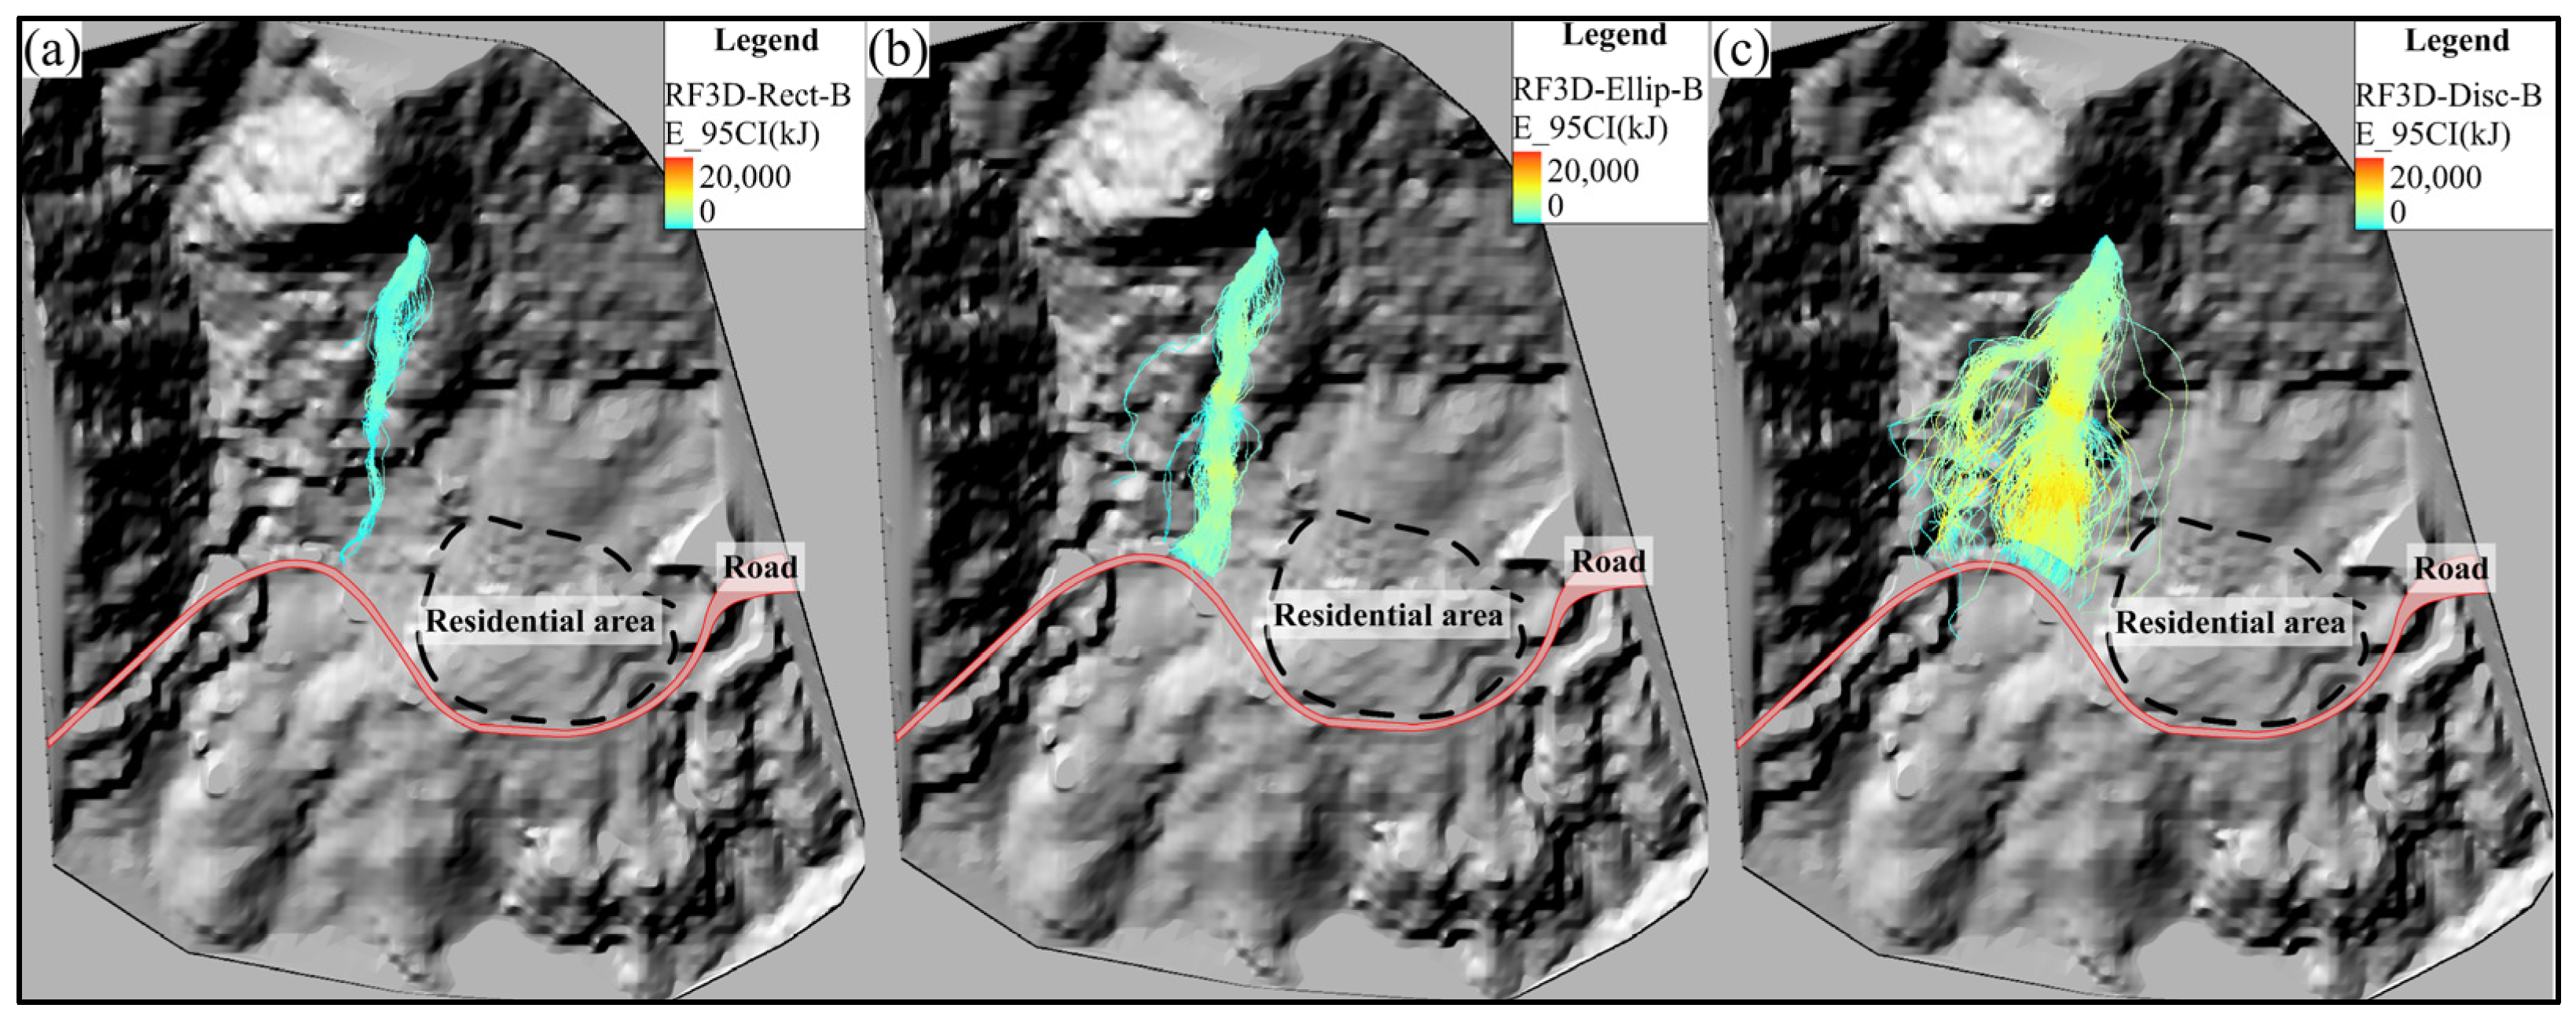
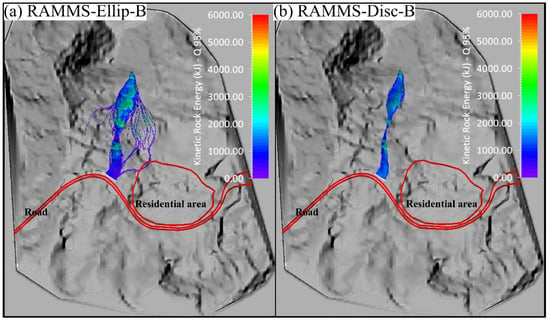
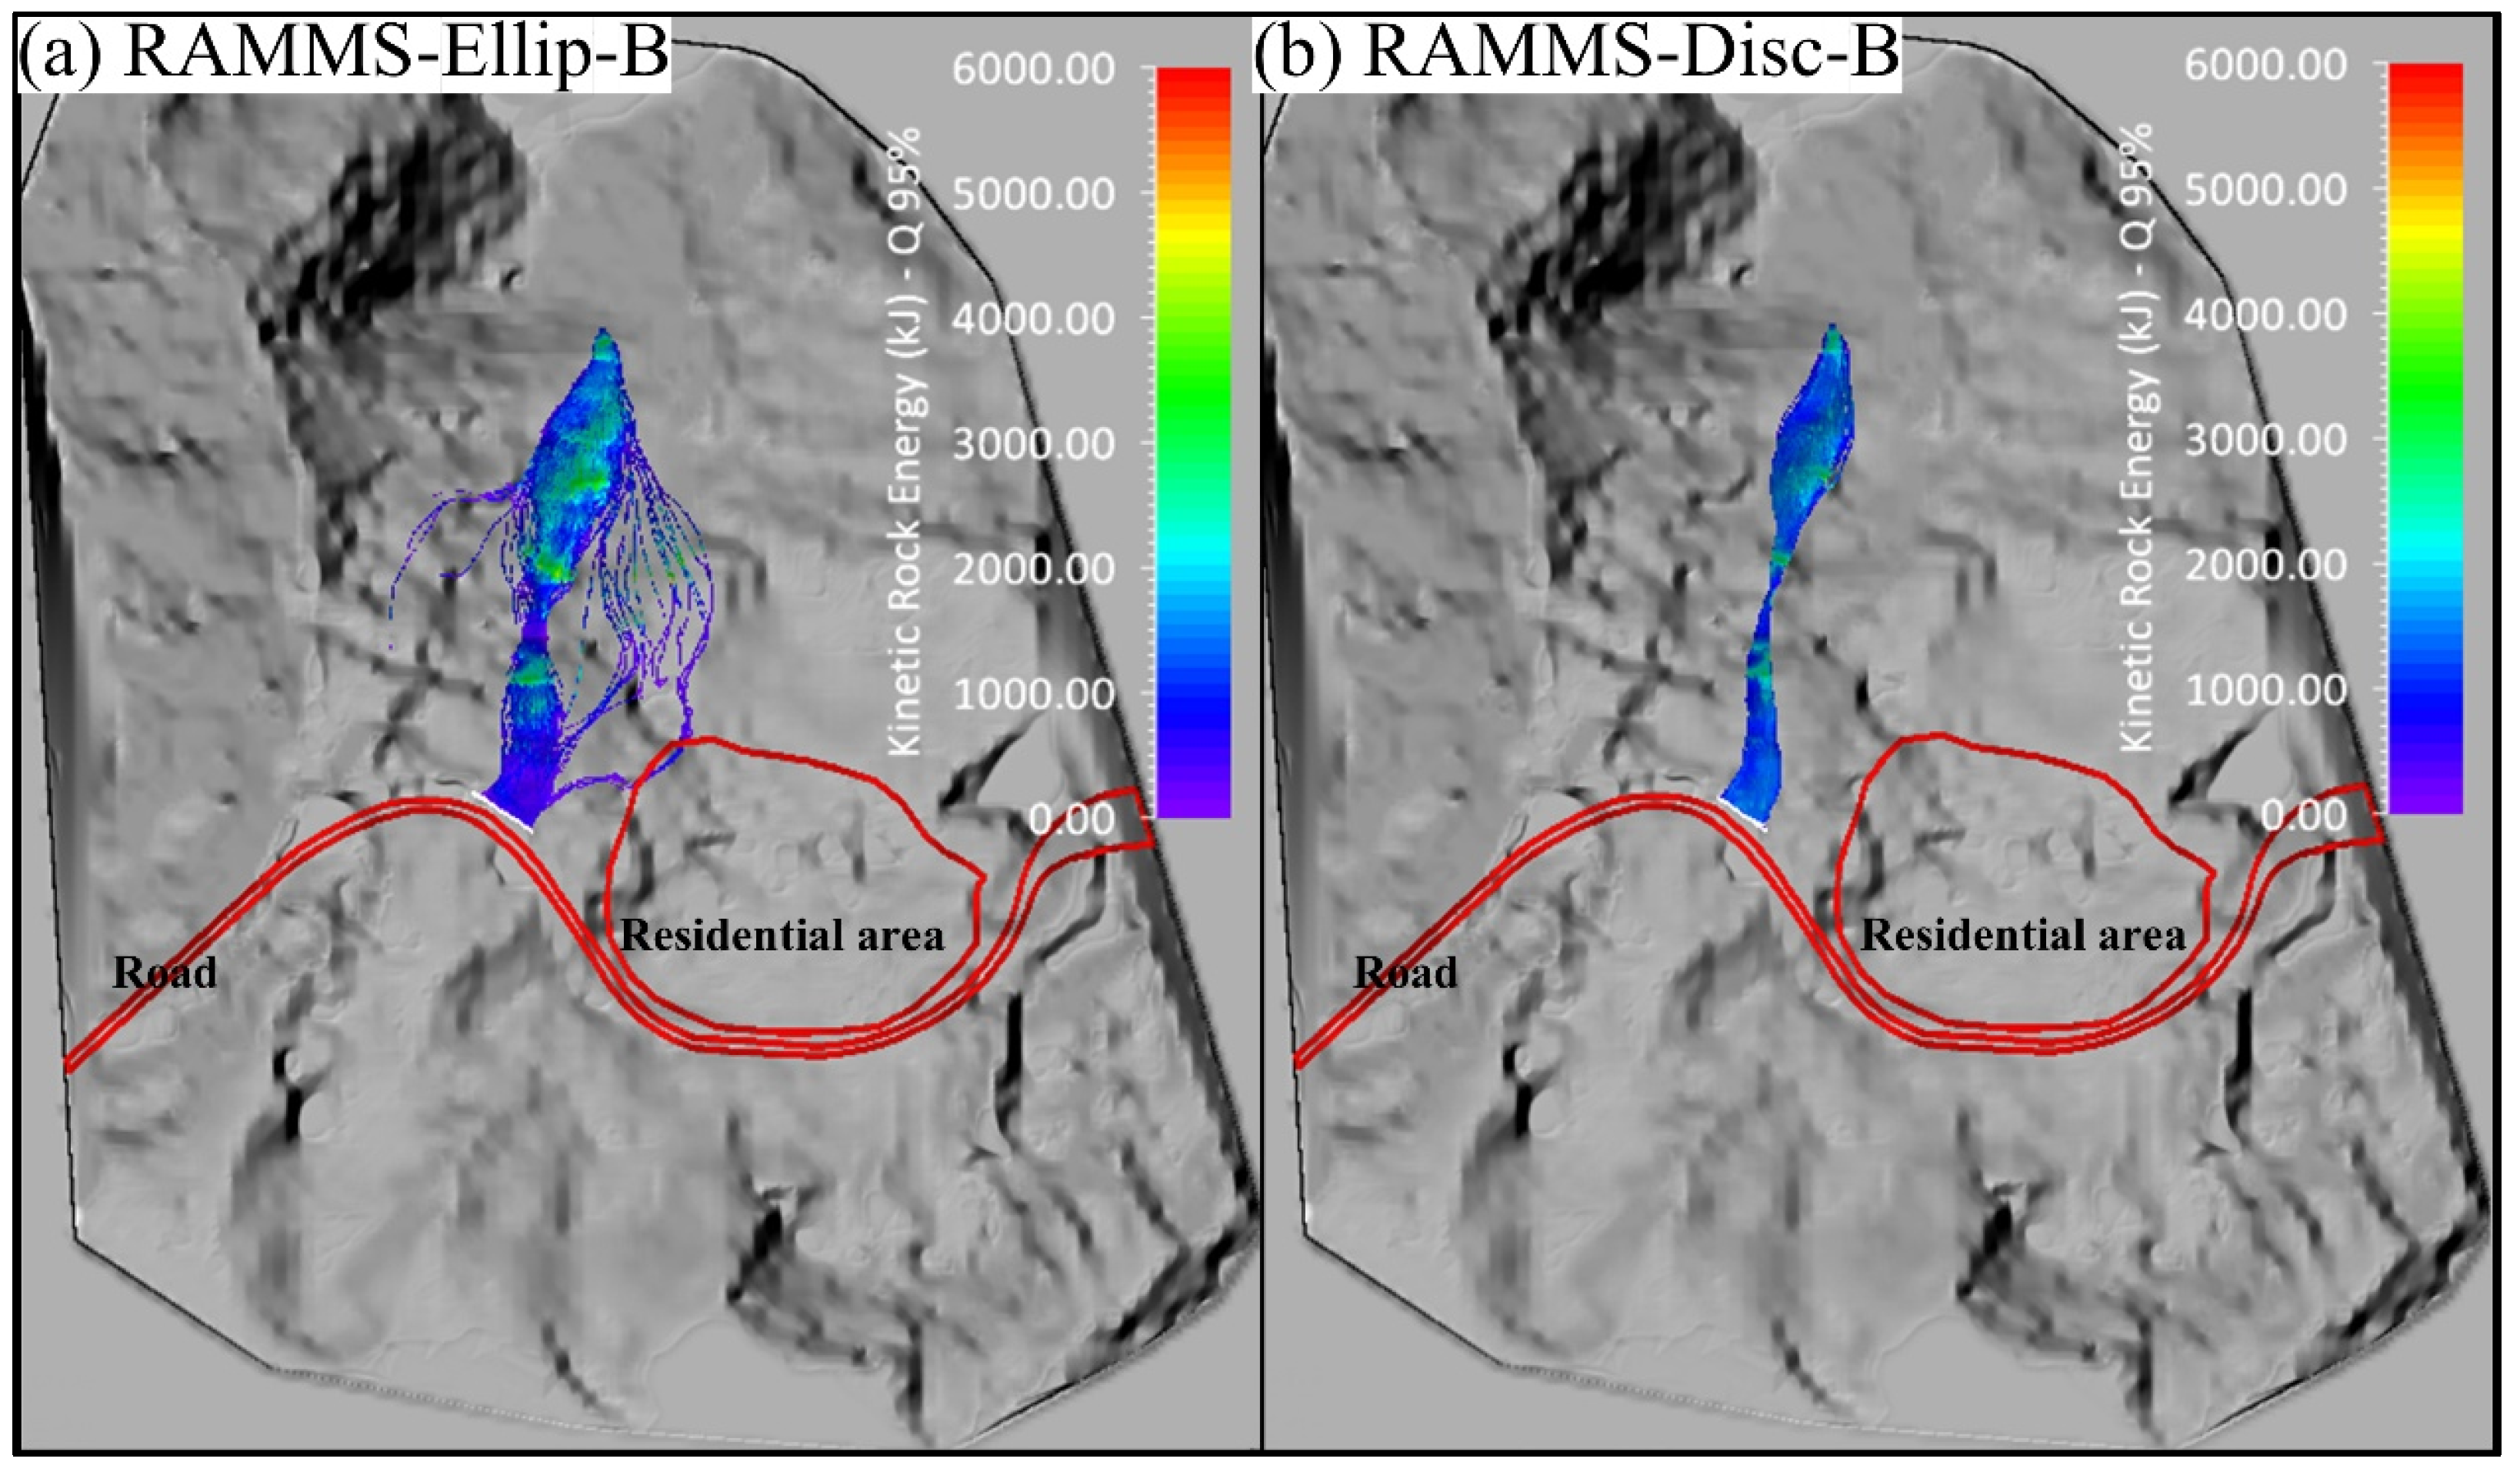
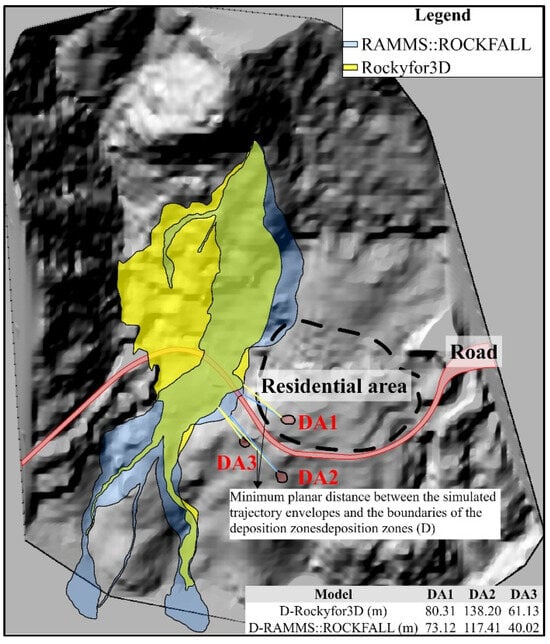
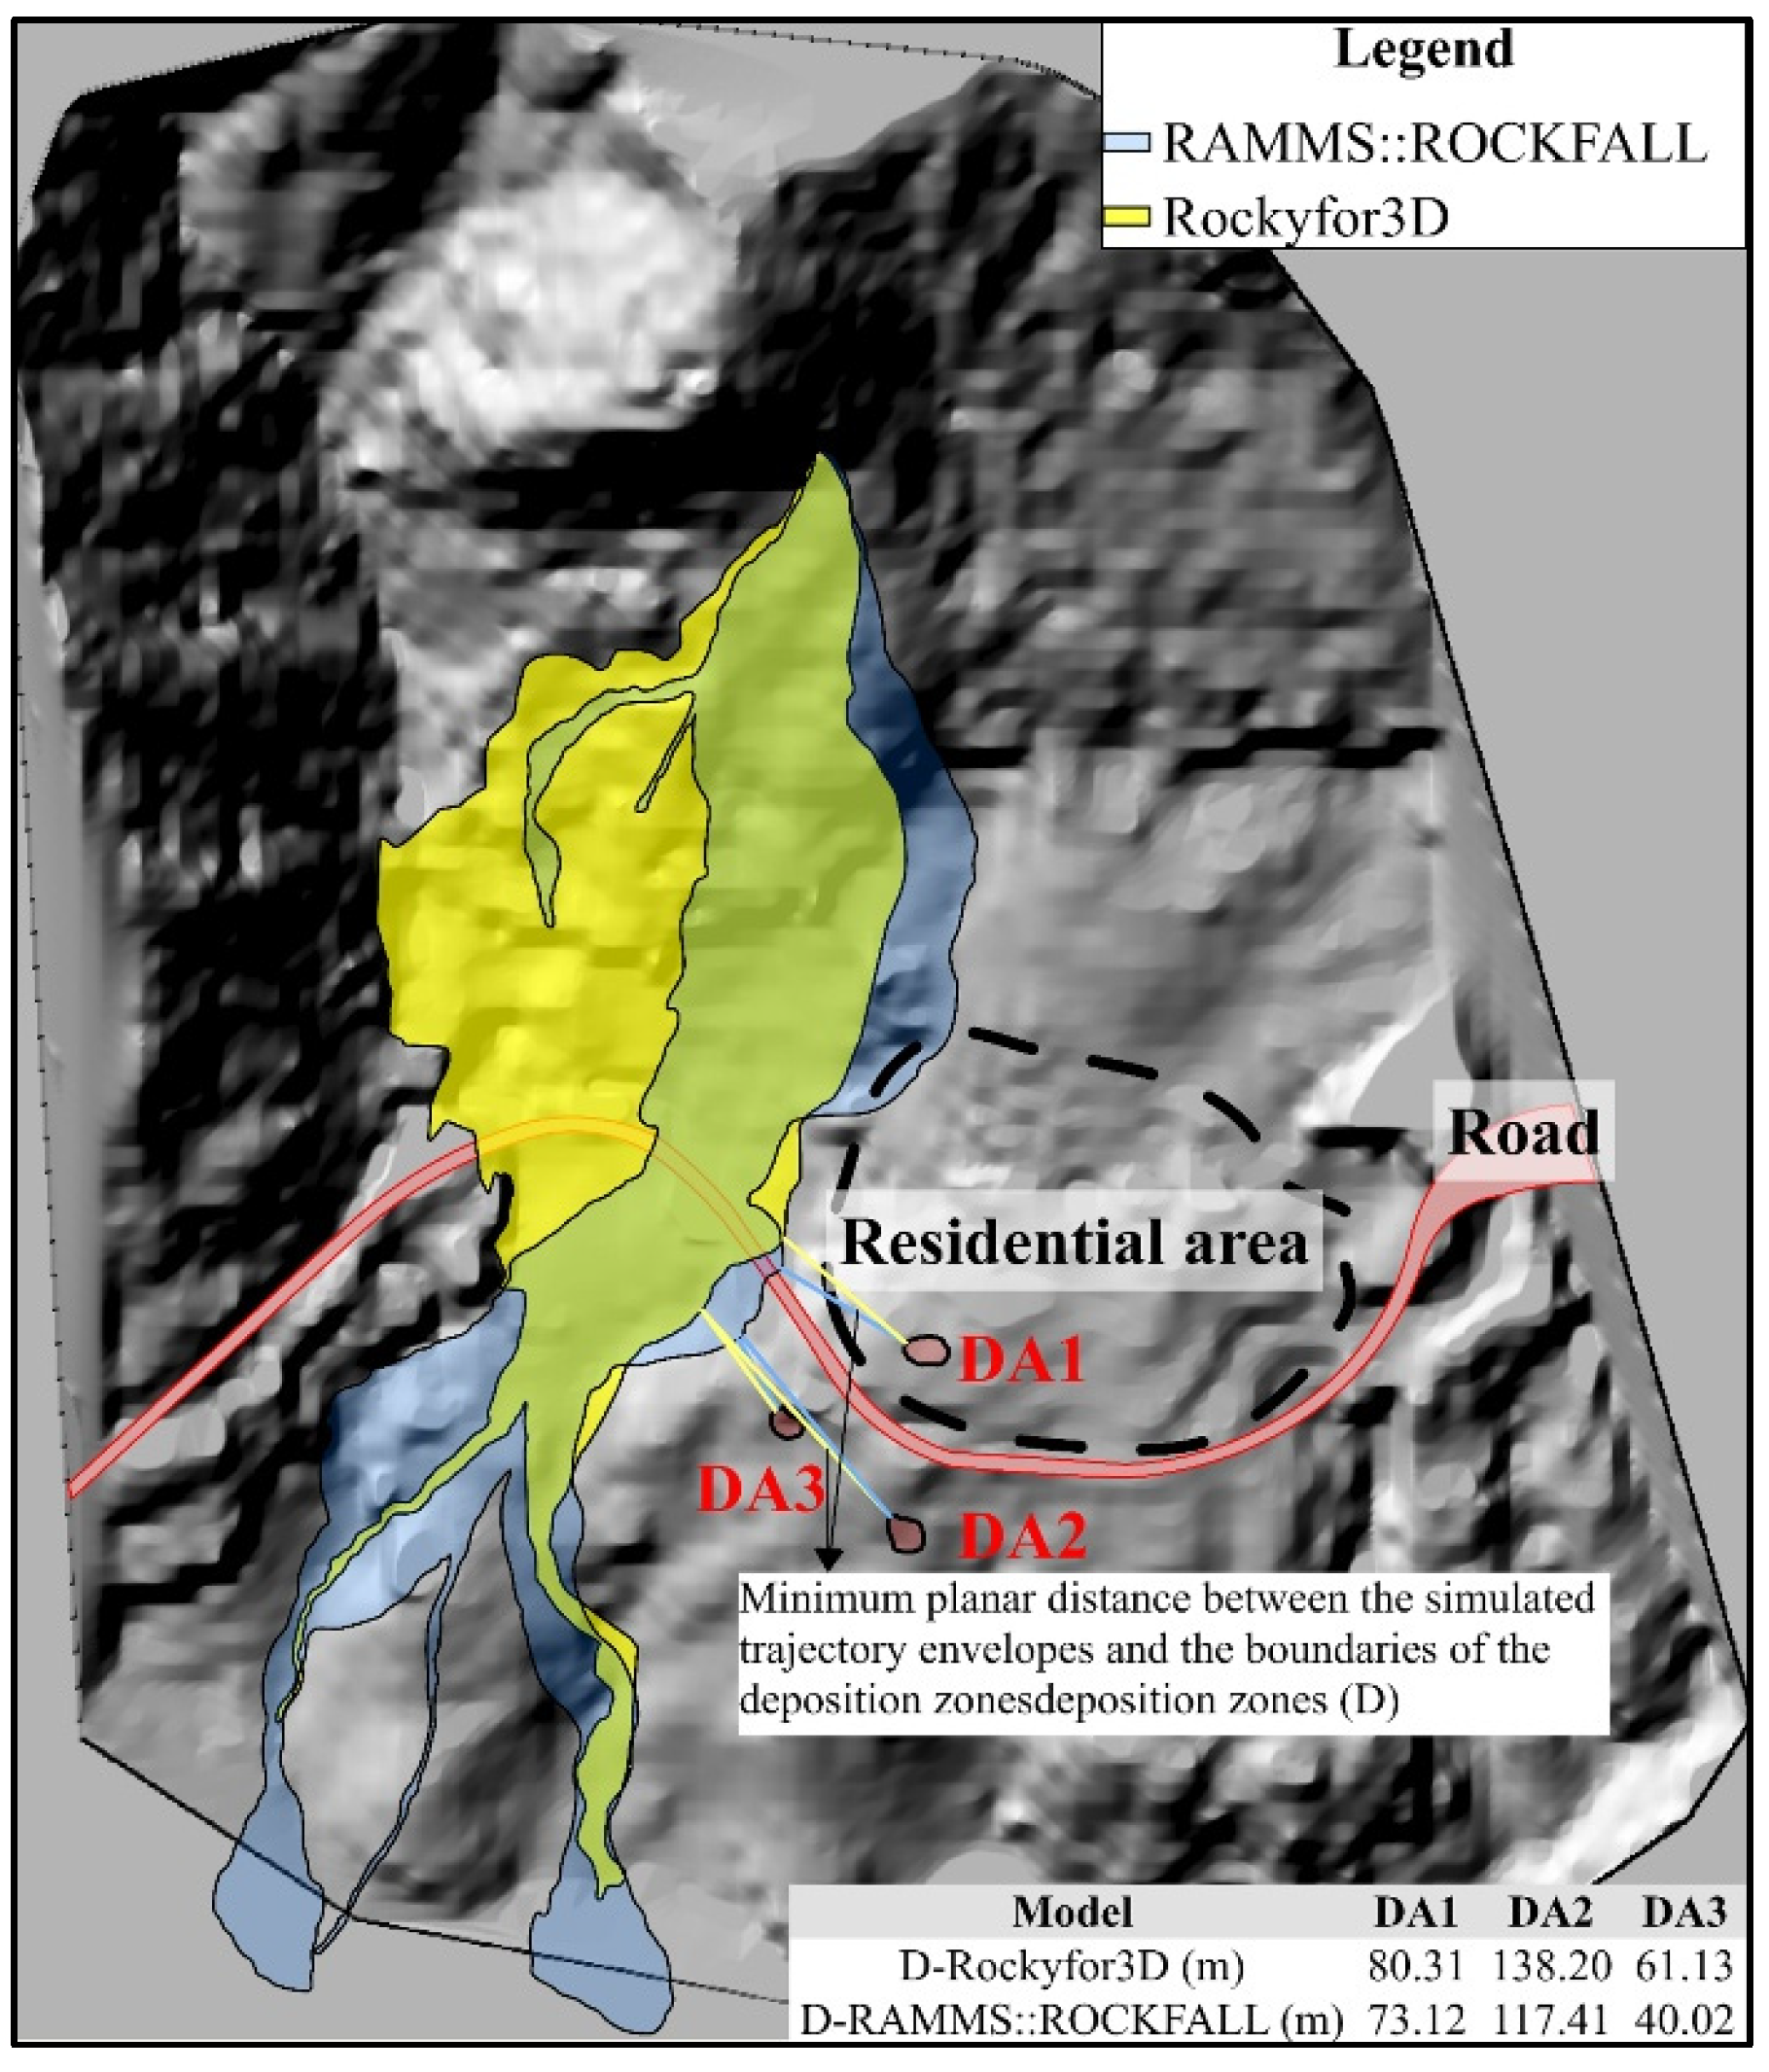



Disclaimer/Publisher’s Note: The statements, opinions and data contained in all publications are solely those of the individual author(s) and contributor(s) and not of MDPI and/or the editor(s). MDPI and/or the editor(s) disclaim responsibility for any injury to people or property resulting from any ideas, methods, instructions or products referred to in the content. |
© 2026 by the authors. Licensee MDPI, Basel, Switzerland. This article is an open access article distributed under the terms and conditions of the Creative Commons Attribution (CC BY) license.