


Abstract
Classifying Arabic music genres is a challenging task because Arabic music encompasses a wide range of rhythms, melodies, and musical structures. Multimodal learning combines complementary information from multiple representations to improve classification; however, it can produce new feature spaces with potentially weak or redundant dimensions that can adversely affect classification performance. Explainable AI methods such as SHapley Additive exPlanations (SHAP) are usually used after model training for interpretation, yet they are not often used to improve the training process itself. In this work, we propose an explainability-guided evolutionary optimization method for audio–symbolic Arabic music genre classification. First, Genetic Algorithm (GA), Particle Swarm Optimization (PSO), and Evolution Strategy (ES) are applied directly to the original fused representations to establish optimization-only baselines. Next, the framework uses global SHAP importance values and transforms them into bounded continuous feature weights, assigning higher weights to the most informative dimensions. A validation-guided pruning step is then performed to remove low-importance dimensions only when their removal improves validation performance. The resulting representation is used for evolutionary classifier hyperparameter optimization. Experiments are conducted on 1800 aligned audio–symbolic pairs from six Arabic music genres. Under the matched per-seed optimization protocol, the validation-selected SHAP-refined CNN14+BERT system achieved 95.30% mean accuracy, compared with 94.40% for the corresponding optimization-only control. The additional accuracy differences between the SHAP-refined and matched optimization-only conditions were +0.90, +0.50, +0.20, and 0.00 percentage points for CNN14+BERT, CNN14+RoBERTa, ResNet50+RoBERTa, and MobileNetV3-Large+XLNet, respectively. Across the staged controls, evolutionary optimization was the largest incremental contributor to the final performance gain, while SHAP-guided representation refinement provided a smaller, architecture-dependent benefit beyond the matched optimization-only controls.
1. Introduction
Music Information Retrieval (MIR) is an emerging field that focuses on the automatic processing of large music collections for tasks such as music recommendation systems and digital libraries. One important MIR task is music genre classification. With recent advances in deep learning, substantial improvements have been achieved in classification accuracy. However, music genre classification can be challenging, particularly for genres such as Arabic music, which exhibit diverse rhythmic, melodic, and structural characteristics. Music classification methods typically rely on handcrafted audio features, such as Mel-Frequency Cepstral Coefficients (MFCCs), spectral descriptors, and rhythmic features, together with traditional or deep learning classifiers. These features provide important acoustic information, but audio features alone may not fully capture higher-level musical structures and temporal sequences. Many existing music classification studies are based on acoustic information and do not use complementary higher-level representations [1,2]. Multimodal learning seeks to combine different types of information from multiple modalities, producing complementary representations and improving classification performance [3,4]. Other methods, such as Genetic Algorithms (GAs), Particle Swarm Optimization (PSO), and Evolution Strategies (ESs), are commonly applied for feature selection and parameter tuning to improve classification accuracy [5,6,7]. Muthusamy et al. [6] show that PSO can identify highly discriminative features. However, these evolutionary techniques for optimizing classifier hyperparameters usually prioritize predictive accuracy and do not directly account for attribution information describing how specific feature dimensions contribute to model predictions. Explainable Artificial Intelligence (XAI) has also become increasingly important for interpreting machine-learning models. Zuliani [8] presents interpretable approaches based on mid-level musical features and relevance propagation techniques. Karki et al. [9] examine how different features influence model predictions using SHAP and LIME. Likewise, Singh and Arora [10] show that explainability methods can help connect model decisions with musically meaningful information. In many cases, explainability is applied after training to analyze the behavior of an already trained model.
The main research gap addressed in this study is how explanation-derived feature importance can be used to refine an already fused multimodal representation before evolutionary classifier optimization. Although previous studies have combined explainability, feature selection, and optimization in different ways, attribution information has generally been used for interpretation or hard feature selection rather than as a bounded continuous transformation of a fused multimodal representation before optimization. This paper addresses this gap through an explainability-guided evolutionary optimization approach for multimodal Arabic music genre classification. The proposed method uses SHAP importance to reshape the fused audio–symbolic feature space before evolutionary optimization. It adopts a bounded weighting scheme that preserves the effect of highly important features while attenuating less important ones without immediately eliminating them. A validation-guided pruning stage then evaluates whether removing low-importance dimensions from the weighted representation improves validation performance. Furthermore, GA, PSO, and ES are used to optimize the classifier hyperparameters on the resulting representation. In this way, explainability is used not only to interpret the multimodal model, but also as an active signal for refining the representation passed to the optimization phase.
Before proceeding to the optimization stage, several audio–symbolic multimodal models and feature representations were evaluated. Based on these experiments, four high-performing multimodal systems—CNN14+BERT, CNN14+RoBERTa, ResNet50+RoBERTa, and MobileNetV3-Large+XLNet—were selected for the experiments in this study. GA, PSO, and ES were first applied directly to their original fused representations to establish an optimization-only reference. The proposed SHAP-guided transformation was then applied through bounded feature weighting and validation-guided pruning, followed by evolutionary optimization of the resulting representation. This incremental design enables the effect of SHAP-guided representation refinement to be assessed alongside evolutionary optimization of the original feature space.
The main contributions of this study are as follows:
- 1.
- A bounded SHAP-guided feature-weighting method is proposed, in which global feature attributions continuously reshape the fused audio–symbolic representation while preserving a minimum weight for weakly attributed dimensions.
- 2.
- A validation-guided pruning strategy is introduced to determine whether additional removal of low-importance dimensions is beneficial rather than imposing a fixed pruning level.
- 3.
- The proposed framework is evaluated incrementally against direct SHAP-based pruning and optimization-only controls, with GA, PSO, and ES applied to both the original and SHAP-transformed representations across four high-performing multimodal systems.
This design allows for the effects of SHAP-guided representation refinement and evolutionary classifier optimization to be distinguished and evaluated both independently and in combination.
2. Related Work
This section reviews the most relevant recent literature with a focus on audio and multimodal music classification, explainability in music and audio analysis, and optimization using explainability-guided feature selection. It then identifies the research gap and highlights the contributions of this study.
2.1. Audio and Multimodal Music Classification
Deep learning methods have shown strong performance in Arabic music classification using audio representations. Almazaydeh et al. [1] evaluated LeNet5, AlexNet, VGG, ResNet50, and LSTM-CNN with spectrogram-based and MFCC-based inputs for five Arabic music genres, and the highest accuracy they reported was 96% with AlexNet. AL-Makhlafi et al. [2] introduced the YMIR dataset, which includes 1475 clips from five Yemeni genres, and examined six acoustic representations with five CNN architectures; their YMCM model achieved 98.83% accuracy using Mel-spectrograms. These two studies show strong results, although their classification systems remain based on audio.
Other studies on Arabic music also show the importance of representation design. Elshaarawy et al. [11] applied CNNs with Mel-spectrograms to classify Egyptian composers and reported a test accuracy of 81.43% on 256 songs. Ahmed et al. [12] examined Arabic Maqam recognition using Chroma CQT, Chroma STFT, HPCP, Mel-spectrograms, and multiple classifiers. An MLP using only Chroma CQT achieved a Macro-F1 score of 0.68, whereas combining Chroma CQT, Chroma STFT, and HPCP produced about 0.61. This result indicates that adding more features does not always produce a better representation.
Multimodal approaches aim to use complementary information beyond audio signals. Oramas et al. [3] integrated audio tracks, text reviews, and album-cover images through modality-specific representations and a shared multimodal space, and they reported better performance than when each modality was used alone. However, their work focused on learning and combining modalities rather than examining the role of each dimension after fusion. Chen and Li [4] combined audio and lyrics for music emotion classification using CNN-LSTM and DNN branches with stacking. The audio-only and lyric-only models achieved about 68% and 74% accuracy, whereas feature-level fusion, decision-level fusion, and stacking achieved 72.4%, 74.8%, and 78.2%, respectively. These findings indicate both the value of complementary modalities and the importance of the fusion method.
Similar findings have been reported in multimodal music emotion recognition. Pandeya and Lee [13] obtained an accuracy of 88.56% and an F1 score of 0.88 by applying deep late fusion to audio and visual data. Later, Pandeya et al. [14] combined music, video, and facial expression cues through intermediate information sharing, and their best model achieved 74% accuracy and an F1 score of 0.73. Their results indicated that adding more modalities did not improve all architectures to the same degree. Hao et al. [15] addressed high-dimensional multimodal features by combining audio, visual, and physiological signals through feature compression and Bi-LSTM classification, and they reached 87.5% accuracy and an F1 score of 0.89 on DEAP. Ablation studies further demonstrated the value of the feature fusion module.
Representation refinement becomes particularly important when multiple modalities produce a high-dimensional fused feature space. Martín-Gutiérrez et al. [16] combined audio, lyrics, and metadata for music-popularity prediction. They used an autoencoder to reduce the concatenated representation, achieving about 83.03% accuracy and 83.02% F1 in their three-class setting. This provides a means of refining multimodal representations prior to prediction, although the approach is unsupervised and is therefore not based on how individual features affect classifier decisions. Chen and Wu [17] reported genre-classification accuracies of 91.0% and 89.91% on GTZAN and ISMIR2004, respectively, using pretrained audio-based models. In a separate experimental component of the same study, EEG and eye-movement signals were used for multimodal emotion classification, with a reported accuracy of up to 97.94%. However, the reported average accuracy across 45 experiments was 95.21% for multimodal fusion, compared with 96.23% for EEG alone and 93.06% for eye movement alone, indicating that multimodal fusion did not consistently outperform the individual modalities.
Overall, earlier studies indicate that both the design of audio representations and multimodal fusion can significantly affect music classification performance. In particular, adding features or modalities does not automatically improve classification, which has encouraged the use of fusion, compression, and representation refinement methods. However, existing approaches usually define the representation through architectural choices, fusion methods, or standard dimensionality-reduction techniques. They do not use explanation-based information from a trained classifier to iteratively strengthen or weaken specific dimensions of an already fused multimodal representation before further optimization.
2.2. Explainability in Music and Audio Classification
The application of Explainable Artificial Intelligence (XAI) techniques has increased in music and audio classification tasks to reveal the information underlying model predictions. Music and audio research often uses XAI to understand or validate a previously trained classifier, rather than to adjust its representation for further learning.
Karki et al. [9] tested different machine learning and deep learning methods for genre classification in the GTZAN dataset. The authors achieved 78.5% accuracy using XGBoost and 67% using a VGG16 model based on spectrograms. Although they mention both LIME and SHAP, their main study uses LIME to identify spectrogram regions that influenced the CNN predictions. Jenifer et al. [18] also used LIME to explain a lightweight 2D CNN architecture that combined time-domain and frequency-domain information to achieve 93.75% accuracy on the GTZAN dataset. In both cases, the explanations were generated after the classification process and were not used to modify the representation.
Singh and Arora [10] applied SoundLIME and Grad-CAM++ to explain a CNN-LSTM model for Hindustani Raga identification, obtaining a chunk-wise F1 score of 0.89. A comparison between the generated explanations and expert annotations showed that XAI can link model predictions to musically relevant information. Similarly, Zuliani [8] examined interpretable representations and explanation methods for music emotion recognition; a Vision Transformer reached 77.6% accuracy on Happy/Sad classification, and Layer-wise Relevance Propagation together with sonification was used to analyze model outputs. The study also discussed SHAP and the difficulties of using it in music, such as feature dependence and computational expense. Overall, these works focus on interpretation rather than attribution-guided representation transformation.
Li et al. [19] provided stronger quantitative evidence for attribution information in detecting machine-generated music by applying Integrated Gradients, LIME, CAM, Grad-CAM, and Occlusion methods. When the regions with the greatest influence, as identified by Integrated Gradients, were masked, accuracy decreased from 90.7% to 50.8%, indicating that attribution methods can identify information that is genuinely relevant to prediction. Their multimodal Wav2Vec2.0–mBERT model also achieved 97.5% accuracy and an F1 score of 0.975 in the reported M6 experiment. However, attribution was used to examine and validate the trained model, rather than to construct a weighted representation for subsequent optimization.
Outside music-oriented applications, SHAP has also been used directly for feature selection. Marcilio-Jr and Eler [20] generated global SHAP rankings and then retained the highest-ranked dimensions in a stepwise manner; SHAP-based selection achieved the best area under the performance-versus-retained-features curve across all five classification datasets studied. Gebreyesus et al. [21] similarly ranked variables using SHAP values from Random Forest and XGBoost models and obtained lower prediction errors than several conventional importance-ranking methods. In both studies, however, SHAP is employed to determine whether a feature is included or excluded, rather than to indicate a continuous degree of feature contribution.
Importantly, SHAP-based selection is not universally beneficial. Wang et al. [22] compared SHAP-based feature selection with conventional importance-based selection across several classifiers and subset sizes. Their overall statistical results favored conventional importance-based selection, although SHAP showed better performance for specific classifier-subset combinations. This finding suggests that low SHAP importance alone does not necessarily justify removing a feature, because its value may depend on the classifier and on the features that remain in the representation.
Overall, earlier studies identify XAI as a useful post hoc method for interpreting music models and SHAP as an effective feature-ranking approach in broader classification settings. The proposed framework draws on both lines of work but differs in how attribution information is used during learning. Rather than applying SHAP only for interpretation or directly turning its ranking into binary feature selection, global SHAP importance is first converted into bounded continuous weights that give greater emphasis to informative dimensions while still preserving weaker ones. Validation is then used to assess whether further hard pruning improves performance, after which the resulting representation is passed to evolutionary classifier optimization.
2.3. Optimization and Explainability-Guided Feature Selection
Feature selection and evolutionary optimization have been widely applied to improve classification by refining the input representation, tuning classifier parameters, or both. In audio classification, early studies showed the benefit of removing redundant information. Breebaart and McKinney [23] ranked perceptually motivated audio features according to estimated classification error and demonstrated the importance of temporal and perceptual properties in audio representations. Baniya and Lee [24] also found that reducing the feature space in music genre classification can improve both classification performance and computational efficiency. Together, these studies highlight the value of refining the feature space, although feature importance was assessed through conventional criteria rather than model-based explanations.
Evolutionary algorithms offer a flexible approach for optimizing both features and classifiers. Karkavitsas and Tsihrintzis [5] used a hybrid Genetic Algorithm (GA) for music genre classification, reducing 81 acoustic features to 36 and increasing the highest k-NN accuracy from 61.6% to 67.6%. Bang et al. [25] applied genetic programming to generate high-level features for music emotion classification, while Balochian et al. [26] used GA to optimize neural network parameters. Taken together, these studies demonstrate the varied applications of evolutionary computation in refining representations and improving classifier performance.
Particle Swarm Optimization (PSO) has also been used for refining feature spaces. Muthusamy et al. [6] introduced a two-stage method in which continuous PSO-based feature enhancement was performed first, followed by binary PSO feature selection, showing that assigning weights to features before their complete removal can be beneficial. This study is especially relevant to the current work, although its feature weights are obtained through PSO rather than inferred from model explanations. Other studies used PSO mainly for hard selection: Andono et al. [27] chose Gammatone Cepstral Coefficient features for acoustic classification, Shang et al. [28] applied binary PSO for feature selection in high-dimensional sentiment analysis, and Liu et al. [29] simultaneously tuned an SVM feature subset and classifier parameters using multi-swarm PSO.
In multimodal emotion recognition, Gharavian et al. [30] combined audio and visual information using PCA, FCBF feature selection, and PSO-based tuning of a fuzzy ARTMAP neural network, and reported an accuracy of up to 98.25%. Their findings also showed that feature selection was not equally effective across all multimodal configurations, which suggests that a feature’s usefulness may depend on the representation in which it is applied.
More recently, SHAP has been used as an explicit criterion for feature selection. Marcilio, Jr. and Eler [20] aggregated SHAP values into global rankings and retained the highest-ranked dimensions, achieving better results than several common selection methods on the classification datasets they tested. Gebreyesus et al. [21] also applied SHAP rankings derived from Random Forest and XGBoost models for data-center prediction. However, both approaches ultimately reduce SHAP importance to a binary decision of keeping or removing features. Moreover, Wang et al. [22] found that conventional importance-based selection generally outperformed SHAP across multiple classifiers and subset sizes, although SHAP performed better in some cases. Thus, a low SHAP value does not automatically imply that a feature should be discarded.
A particularly relevant integration of SHAP-based selection and subsequent optimization was presented by Liu and Yang [31]. SHAP reduced their transformer fault feature set from 19 variables to 13 features, which together accounted for more than 91.7% of the cumulative importance, after which metaheuristic optimization was used to tune the LightGBM hyperparameters. LightGBM accuracy increased from 92.86% with all 19 variables to 95.09% with the 13 SHAP-selected variables, although feature removal caused a slight decline in the performance of some other classifiers. Other studies used SHAP in a different manner: Debjit et al. [32] applied Harris Hawks Optimization to tune a COVID-19 classifier and used SHAP mainly for post hoc interpretation, whereas Kaur et al. [33] used SHAP to confirm selected wheat yield variables before Bayesian optimization of ensemble model weights rather than individual feature contributions.
Collectively, previous studies have shown the use of evolutionary optimization for hard feature selection [5,27,28], continuous feature adjustment followed by selection [6], joint optimization of features and classifiers [29], and classifier optimization alone [26,30]. SHAP has also been applied to hard feature selection [20,21,22], including as a step before metaheuristic classifier optimization [31]. Accordingly, this study does not claim novelty in any of these elements individually, nor in their mere combination. Rather, SHAP importance scores derived from an already fused multimodal representation are transformed into bounded continuous weights, so that less informative dimensions remain present but with lower influence. Hard elimination is considered only later through validation-based pruning, with the possibility of retaining all weighted features. The final representation is then fixed, and GA, PSO, and ES are used only for downstream classifier hyperparameter optimization. This design makes it possible to distinguish the effect of explainability-guided representation transformation from that of evolutionary optimization.
2.4. Research Gap and Contribution
Current literature demonstrates the effectiveness of multimodal fusion, feature-space refinement, explainability, and evolutionary optimization, but also reveals an unresolved representation-refinement problem. Multimodal music studies show that combining complementary information can improve classification [3,4,13,14,16], while feature-reduction studies demonstrate that adding dimensions does not necessarily improve performance [12,16,24]. Existing multimodal approaches, however, generally determine the fused representation through architecture design, concatenation, learned fusion, or dimensionality reduction rather than using attribution information from the trained classifier to refine individual dimensions of an already fused representation.
Explainability offers such attribution information, but its role has remained different from that proposed here. In music and audio applications, XAI has primarily been used for post hoc interpretation and validation of model decisions [8,9,10,18,19]. SHAP has also been used for hard feature selection [20,21,22], including before subsequent classifier optimization [31]. However, direct elimination based on SHAP importance is not uniformly beneficial: Wang et al. [22] found that SHAP-based selection was not consistently superior to conventional importance-based methods, while Liu and Yang [31] reported improvements for some classifiers but slight degradation for others after SHAP-based reduction. These findings are particularly relevant to multimodal representations, where individually weak dimensions may still provide complementary information.
Continuous weighting before feature selection has also been explored; notably, Muthusamy et al. [6] used PSO to optimize continuous feature weights before binary feature selection. Nevertheless, those weights were determined by evolutionary search rather than model explanations. Conversely, existing SHAP-based approaches generally use attribution for interpretation or hard selection rather than bounded continuous transformation. Thus, the research gap is not simply the absence of studies combining SHAP and optimization. Among the studies reviewed here, none uses SHAP-derived importance to first construct bounded continuous weights for an already fused multimodal representation, followed by a separate validation-guided pruning decision and evolutionary optimization restricted to downstream classifier hyperparameters.
The proposed framework therefore differs from the closest prior approaches in three connected aspects: SHAP-derived bounded continuous weighting of an already fused multimodal representation, validation-guided optional pruning, and separate evolutionary optimization of the downstream classifier.
Table 1 presents these methodological relationships. The comparison focuses on methodological elements rather than on direct performance comparisons, because the studies use different datasets, tasks, modalities, and evaluation protocols.
Table 1.
Methodological comparison of representative studies and the proposed framework.
Table 1 highlights the main methodological distinction. Existing SHAP-based approaches primarily use attribution for hard feature selection, while continuous weighting approaches such as Muthusamy et al. [6] derive their weights through optimization rather than model explanations. In the proposed framework, SHAP-derived weights refine the fused representation first, while evolutionary algorithms are reserved for subsequent classifier optimization.
3. Materials and Methods
As stated earlier, this study presents a SHAP-guided evolutionary optimization framework for audio–symbolic multimodal music classification. Using four strong multimodal systems identified in earlier experiments, the methodology first examines direct SHAP-based feature pruning and evolutionary optimization of the original fused representations as separate comparison conditions. The proposed framework then transforms the representations through bounded SHAP-guided feature weighting and validation-guided pruning before applying GA, PSO, and ES to optimize the downstream classifier. This stepwise design enables the effects of direct feature removal, representation refinement, and evolutionary optimization to be evaluated systematically.
3.1. Dataset, Multimodal Representations, and Selected Systems
Experiments are conducted on a balanced Arabic music dataset containing 1800 WAV files across six genres: Egyptian, Khaliji, Pop, Ray, Shami, and Tarab. There are 300 files in each genre. Every file was matched with a symbolic state sequence derived from the same song, resulting in 1800 aligned audio–symbolic pairs. The original dataset contained 600 recordings across six genres—Egyptian, Khaliji, Pop, Ray, Shami, and Tarab—with 100 recordings per genre, together with their corresponding symbolic representations. For the present study, the dataset was expanded by collecting and processing an additional 200 recordings per genre. The newly collected recordings were manually screened against the original collection for obvious duplicate recordings, and their corresponding symbolic sequences were generated using the same audio-to-state-sequence procedure used for the original dataset. This manual screening was subsequently supplemented by the decoded-audio fingerprint audit described below. Because verified song-version and recording-relationship metadata are not available, this screening should not be interpreted as establishing that alternate, re-recorded, live, cover, or otherwise closely related versions of the same composition are absent across the corpus. A substantial portion of the resulting corpus, comprising 1200 aligned audio–symbolic pairs (200 per genre), has been made publicly available through Harvard Dataverse [34,35,36,37]. The remaining portion of the extended dataset is retained for the experiments reported in this study and is planned for public release following completion of the associated research. The details of the corpus construction and symbolic-sequence generation procedures are provided with the published datasets.
For model development and evaluation, the 1800 aligned audio–symbolic pairs were divided using stratified train, validation, and test partitions of 70%, 15%, and 15%, respectively. Each split therefore contained 1260 training pairs, 270 validation pairs, and 270 test pairs. Because the dataset is balanced across the six genres, each genre contributed 210 training samples, 45 validation samples, and 45 test samples. Experiments were repeated using five random seeds, . For each seed, an independent stratified partition was generated while preserving the same split proportions and class counts. Within a given seed, the same paired train, validation, and test identities were maintained across the multimodal systems being compared. Audio and symbolic representations corresponding to the same recording were kept aligned throughout partitioning and subsequent fusion.
To assess exact-recording leakage, the complete 1800-recording corpus was additionally audited using SHA-256 fingerprints computed from the decoded audio waveforms. This comparison was performed on decoded audio content rather than filenames, so differently named files containing identical decoded recordings would receive the same fingerprint.
The audit identified no exact decoded-audio duplicate groups among the 1800 aligned audio–symbolic pairs. Consequently, no recording was removed from the experimental corpus. The split-integrity checks also confirmed zero pair overlap across the train, validation, and test partitions and zero exact-audio identities crossing partitions. Table 2 summarizes the exact-recording duplicate and split-integrity audit.
Table 2.
Exact-recording duplicate and split-integrity audit of the 1800-pair experimental corpus.
Verified artist, album, title/composition, composer, and song-version relationship identifiers were not collected as part of the genre-oriented corpus annotation. Accordingly, unique artist, album, and composition counts cannot be reported reliably, and relationships among alternate recordings or closely related versions of the same composition cannot be reconstructed systematically from the available metadata.
A verified artist-disjoint, album-disjoint, composition-disjoint, or song-version-disjoint partition therefore cannot be constructed without introducing unverified identities. The present evaluation establishes exact-recording disjointness across the train, validation, and test partitions, but it does not claim generalization to unseen artists, albums, compositions, or song versions.
The audio modality included complementary learned and handcrafted representations. Deep audio backbones, including CNN14, ResNet50, and MobileNetV3-Large, produced high-level acoustic features that were projected to 256 dimensions. Handcrafted MFCC, Mel-spectrogram, and rhythmic descriptors were combined and projected to 128 dimensions. Among the VAE representations derived from these acoustic descriptors, MFCC-VAE produced the most stable positive effect and was retained as a 128-dimensional latent representation. Wav2Vec was also evaluated as a learned audio feature and, when applicable, projected to 256 dimensions.
The symbolic modality used in this study is programmatically derived from the corresponding audio recording; it is not an independent lyric, MIDI, score, or notation source. For each recording, the selected middle region of the waveform is divided into non-overlapping 3 s chunks, and each chunk is represented by a 131-dimensional MIR feature vector. These chunk-level acoustic features are subsequently standardized and projected using principal component analysis (PCA), after which a Gaussian mixture model (GMM) assigns every chunk to a discrete acoustic state. The chronological sequence of these state assignments constitutes the symbolic state sequence associated with the recording.
For each experimental seed, symbolic preprocessing is performed independently after the 1800 aligned audio–symbolic pairs have been divided into the corresponding 1260 training, 270 validation, and 270 test pairs. The StandardScaler and PCA transformation are fitted using training chunks only. The number of GMM states is selected by the Bayesian information criterion (BIC) using training chunks only, and the final GMM is then fitted on the same training partition. Once these objects have been fixed, validation and test chunks are transformed without refitting any preprocessing component. Genre labels are not supplied to the StandardScaler, PCA, BIC state-count selection, or GMM fitting procedure.
The resulting state sequences are subsequently encoded using BERT, RoBERTa, or XLNet, with each encoder producing a 128-dimensional symbolic representation for downstream multimodal classification. Thus, genre labels are used later for the supervised classification task, but not for construction of the discrete acoustic-state vocabulary itself. Audio and symbolic representations corresponding to the same recording remain aligned throughout the subsequent fusion process.
Table 3 summarizes the seed-specific symbolic preprocessing obtained under this training-only procedure.
Table 3.
Seed-specific leakage-safe symbolic preprocessing. PCA dimensionality corresponds to the number of components retained to preserve approximately 95% of the training-set variance.
Earlier experiments assessed several single-modality and multimodal feature combinations. On the basis of classification performance, four strong multimodal systems were chosen, each using its best-performing feature combination:
- CNN14 + Handcrafted + MFCC-VAE + BERT.
- CNN14 + Handcrafted + MFCC-VAE + RoBERTa.
- ResNet50 + Handcrafted + Wav2Vec + MFCC-VAE + RoBERTa.
- MobileNetV3-Large + Handcrafted + Wav2Vec + MFCC-VAE + XLNet.
To clarify the architecture-selection history, these four systems were carried forward from a broader set of 14 completed full-audio audio–symbolic combinations evaluated in the preceding multimodal experiments. Table 4 summarizes that candidate pool using the five-seed performance values recorded in the original workflow.
Table 4.
Full-audio multimodal candidate pool preceding the selection of the four systems analyzed in the SHAP and optimization experiments.
The four systems carried forward to the subsequent ensemble, explainability, pruning, and optimization stages correspond to CNN14+BERT, CNN14+RoBERTa, ResNet50+RoBERTa, and MobileNetV3-Large+XLNet. The available records document the performance of the larger candidate pool but do not establish that the decision to carry forward these exact four systems was made exclusively from validation performance without reference to final test results. Accordingly, this earlier architecture pre-selection is not characterized as validation-only.
This earlier pre-selection is distinct from the model-selection decisions used in the present experiments. All subsequent choices, including checkpoint selection, SHAP-weighting parameters, pruning thresholds, evolutionary hyperparameters, and optimizer-family selection, are based only on the training and validation data. The held-out test partition is evaluated only after these decisions have been fixed.
For the SHAP interpretation, pruning, and optimization experiments considered in this study, the projected outputs of the individual feature branches were retained before the final audio-fusion compression and concatenated with the corresponding symbolic representation. The two CNN14 systems therefore use a 640-dimensional representation comprising 256 backbone, 128 handcrafted, 128 MFCC-VAE, and 128 symbolic dimensions. The ResNet50+RoBERTa and MobileNetV3-Large+XLNet systems use an 896-dimensional representation because they additionally include a 256-dimensional Wav2Vec branch. These 640- and 896-dimensional spaces correspond to the labeled feature-family representations used for SHAP-guided analysis and subsequent optimization rather than to the final compressed audio embedding used internally in the preceding multimodal classifier. Table 5 presents a summary of the four configurations.
Table 5.
Selected multimodal systems and fused representations.
These representations were used as the initial basis for the present study. The aim was not to identify new multimodal architectures, but to examine whether the selected fused representations could be enhanced through evolutionary optimization and, more importantly, through SHAP-guided refinement of the representations before optimization.
3.2. SHAP-Based Interpretability and Initial Feature Pruning
After training the four selected multimodal systems, SHapley Additive exPlanations (SHAP) were used to analyze the contribution of the individual dimensions of the retained audio–symbolic representations. The SHAP analysis was performed independently for the five experimental seeds .
The analysis was conducted at the representation-feature level. Specifically, the projected outputs of the individual audio branches were retained before their final compression into the 256-dimensional full-audio embedding and were concatenated with the corresponding 128-dimensional symbolic representation. Consequently, the CNN14+BERT and CNN14+RoBERTa systems were analyzed using 640-dimensional representations, whereas the ResNet50+RoBERTa and MobileNetV3-Large+XLNet systems were analyzed using 896-dimensional representations. These dimensions preserve the identity of the contributing feature families and therefore allow for attribution to individual representation dimensions.
The SHAP stage did not retrain the original end-to-end multimodal networks for a new classification objective. Instead, the saved representation-level outputs from the completed multimodal experiments were used to construct a representation-space classifier for explanation. The fidelity of this classifier to the corresponding original multimodal system was verified before its SHAP attributions were used for feature ranking and pruning.
Representation-Space Explainer and Fidelity Verification
The feature-level SHAP analysis was performed using an explainable classifier constructed from the saved branch-level representations of the completed multimodal experiments. This additional classifier was required because the representation retained for SHAP analysis preserves the individual projected feature families, whereas the original multimodal network subsequently compresses and combines these representations internally. Consequently, the SHAP analysis explains the behavior of a representation-space approximation of the completed multimodal system rather than directly decomposing the final end-to-end classifier.
The representation-space explainer was implemented as an XGBoost multiclass classifier with 450 trees, maximum tree depth 4, learning rate 0.035, subsample ratio 0.85, and column-subsample ratio 0.80. The classifier used the multi:softprob objective. SHAP attributions were computed using TreeSHAP through shap.TreeExplainer(xgb), where xgb denotes the trained representation-space XGBoost classifier. The implementation used XGBoost 3.4.1 and SHAP 0.52.0.
No separately sampled external background or reference matrix was supplied to TreeExplainer; therefore, no external SHAP background-set size applies to this implementation. SHAP values used for feature ranking and representation transformation were computed on the validation representation for each experimental seed. The held-out test partition was not used to determine SHAP feature weights, pruning thresholds, or optimizer-family selection.
Before using the resulting SHAP values for feature ranking and pruning, the representation-space classifier was evaluated for fidelity to the corresponding original multimodal model. Fidelity was assessed independently for every multimodal system and experimental seed using the original-model and explainer classification performance, agreement between their predicted class labels, and the difference between their predicted class-probability distributions.
Let denote the predicted class of the original multimodal model for sample i, and let denote the prediction of the representation-space explainer. Prediction agreement was calculated as
where denotes the indicator function. Larger values indicate closer agreement between the class decisions of the two classifiers.
Probability-level fidelity was quantified using the mean absolute error between their multiclass probability outputs:
where and are the probabilities assigned to class c by the original multimodal classifier and the representation-space explainer, respectively, and is the number of genre classes. Lower probability MAE indicates closer agreement between the predictive distributions.
The fidelity audit was repeated independently for all four multimodal systems and all five experimental seeds. Fidelity was evaluated on both the validation and held-out test partitions using prediction agreement and probability mean absolute error (MAE). The held-out test partition was used only for descriptive fidelity assessment and did not participate in the selection of explanations, feature subsets, weighting parameters, or pruning decisions.
To validate whether the surrogate-derived SHAP importance was also reflected in the corresponding original multimodal network, a direct feature perturbation experiment was additionally performed. One projected feature at a time was replaced by its training-set mean. Operationally, the training-standardized value of the selected feature was set to zero, after which the representation was inverse-transformed and propagated through the original multimodal network. The XGBoost surrogate was not used to score the perturbed examples.
Direct perturbation was performed using the validation partition only. The direct importance of a feature was quantified by the mean absolute change in the original network’s class-probability outputs after perturbation. The ranking obtained from these direct perturbation scores was then compared with the corresponding representation-space SHAP ranking using Spearman’s rank correlation. The comparison was performed at both the individual projected-feature level and the broader feature-family level. The complete fidelity and perturbation-validation results are reported in Section 4.2.
For each feature dimension j, global importance was quantified using the mean absolute SHAP magnitude. Let denote the SHAP attribution associated with feature j for evaluated sample i. The global importance was calculated as
where N denotes the number of evaluated samples. Absolute SHAP magnitude was used because the objective was to quantify the strength of each feature’s contribution independently of attribution direction.
Because the SHAP analysis was repeated over five experimental seeds, feature importance was also examined across repeated partitions. For feature j, the mean SHAP rank was calculated as
where denotes the SHAP rank of feature j under seed s and . The corresponding rank variability and the number of seeds in which a feature appeared in the bottom SHAP quartile were retained as indicators of cross-seed stability.
To quantify the stability of the SHAP rankings more explicitly, three additional cross-seed measures were calculated for each multimodal system. With five experimental seeds, all ten pairwise seed comparisons were considered. First, Spearman’s rank correlation was calculated between the complete coordinate-level SHAP rankings from each pair of seeds. Second, selection stability among the most highly ranked dimensions was evaluated using the Jaccard similarity of the top 10% feature sets:
where A and B denote the top-ranked feature sets obtained from two different seeds.
Because individual latent coordinates can be sensitive to correlation and seed-specific representation learning, SHAP importance was also aggregated at the feature-family level. If denotes the set of dimensions belonging to feature family g, its aggregate importance is
and its attribution share is
Feature families were ranked independently for each seed, and cross-seed family-rank stability was evaluated using Spearman’s correlation across the same ten pairwise seed comparisons.
An initial SHAP-guided pruning experiment was then performed to determine whether dimensions that were consistently weak according to the attribution analysis could be removed without degrading classification performance. Rather than pruning according to a single SHAP ranking, the procedure combined global importance, repeated-seed weakness, and genre-specific importance.
Global SHAP importance was first normalized to obtain . A pruning-priority score was then assigned to each feature:
where is the proportion of the five experimental seeds in which feature j appeared in the bottom SHAP quartile, and is the proportion of the six genre categories in which that feature appeared in the bottom importance quartile. The coefficients were predefined and kept fixed throughout the pruning experiments. Global weakness was assigned the largest contribution, followed by cross-seed weakness and category-level weakness.
Genre-specific SHAP importance was additionally used to prevent globally weak features from being removed when they remained strongly informative for a particular genre. For feature j and genre c, category-specific importance was calculated as
where denotes the number of evaluated samples belonging to genre c. A feature was protected from pruning whenever it appeared among the 20 highest-ranked dimensions for at least one of the six genres.
Cross-seed consistency provided an additional safeguard against removing features because of instability in a single experimental partition. A feature was regarded as a particularly strong pruning candidate when it appeared in the bottom SHAP quartile in at least four of the five seeds, was not protected by the genre-specific top-20 rule, and exhibited low global SHAP importance. Thus, the stability criterion required weakness in at least 80% of the repeated experiments.
Feature-level pruning was also constrained to prevent the procedure from unintentionally eliminating an entire representation family. At least 25% of the original dimensions of every feature family were therefore retained throughout pruning. This safeguard was applied consistently to the deep audio backbone, handcrafted, Wav2Vec, MFCC-VAE, and symbolic feature families present in each representation.
Candidate dimensions were removed progressively using predefined pruning levels of
At every pruning level, the representation-space classifier was retrained independently across the five experimental seeds, and classification accuracy, Macro-F1, per-genre F1, retained dimensionality, and feature-family retention were recorded.
The objective was not to maximize the number of removed dimensions, but to identify the smallest representation that preserved the predictive behavior of the complete feature space. A candidate subset was considered acceptable when its Macro-F1 remained within 0.5 percentage points of the complete representation and the F1 score of every individual genre remained within 2 percentage points of its corresponding unpruned value. Among acceptable pruning stages, the more compressed representation was preferred.
To assess the sensitivity of this pruning formulation, we also varied the pruning-score configuration and its associated safeguards. The sensitivity analysis considered alternative pruning-score weighting schemes, genre-specific top-k protection with
cross-seed weakness-consensus thresholds of
feature-family retention floors of
and pruning fractions ranging from 0% to 30%. All candidate pruning configurations were compared using validation data only. The held-out test partition was not used to select the pruning-score configuration, protection level, consensus threshold, family-retention floor, or pruning fraction.
This initial experiment therefore implemented hard feature selection: retained dimensions preserved their original values, whereas selected low-priority dimensions were removed entirely. As shown later in Section 4, this procedure improved the CNN14-based representations more substantially than the other systems. This observation motivated the proposed bounded SHAP-weighting strategy, in which attribution information is first used to continuously rescale feature dimensions before validation-guided pruning and evolutionary optimization.
3.3. Evolutionary Optimization Protocol for the Original Multimodal Representations
Following the initial SHAP-based pruning experiment, evolutionary optimization is assessed separately on the original fused representations to determine the gains from hyperparameter tuning without SHAP-based feature transformation. No weighting or pruning is used; GA, PSO, and ES adjust only the downstream classifier hyperparameters, while the multimodal representations are kept unchanged. All three optimizers explore the same six classifier hyperparameters: learning rate, weight decay, dropout, hidden-layer width, number of hidden layers, and batch size. The shared search space is reported in Table 6.
Table 6.
Classifier hyperparameter search space used by GA, PSO, and ES.
The downstream classifier used throughout the optimization experiments is a multilayer perceptron (MLP). The number of hidden layers is itself an optimized hyperparameter and can take values in . Each hidden layer follows the sequence
with the hidden width and dropout probability determined by the candidate hyperparameter configuration. The final classification layer is a linear transformation from the last hidden representation to the six Arabic music genre classes.
The classifier is trained using the AdamW optimizer and multiclass cross-entropy loss. Training mini-batches are shuffled, and the gradient norm is clipped to 1.0. Learning rate, weight decay, dropout probability, hidden-layer width, number of hidden layers, and batch size are the six quantities optimized by GA, PSO, and ES.
Each candidate is represented by a six-dimensional normalized vector in , which is then decoded into the corresponding hyperparameter values. Learning rate and weight decay are assigned on a logarithmic scale, dropout is mapped linearly, and the other coordinates are converted to their predefined discrete options. The non-optimized control uses a learning rate of 0.001, weight decay of 0.0001, dropout of 0.20, two hidden layers of width 256, and a batch size of 64. GA evolves candidate configurations through selection, crossover, and mutation [38]; PSO adjusts particles based on their own best solutions and the best solution of the swarm [39]; and ES produces offspring by perturbing selected parent solutions [7]. Their fixed search settings are shown in Table 7.
Table 7.
Evolutionary optimization settings. Budget fairness is defined by the number of unique objective-function evaluations rather than by the number of generations or offspring proposals.
Each search was limited to 48 unique decoded hyperparameter configurations per optimizer, system, seed, and experimental condition. Previously evaluated configurations were cached; duplicate proposals reused the stored objective value and did not count toward the budget. Each search therefore continued until 48 unique configurations had been evaluated.
All three optimizers used the same downstream classifier, search space, train–validation partition, and training protocol. Each candidate was trained for at most 25 epochs with early-stopping patience 4. Checkpoints were selected primarily by validation accuracy, with validation Macro-F1 used to break ties. After the search, the selected configuration was trained for up to 50 epochs with patience 7, and its best validation checkpoint was fixed before evaluation on the held-out test partition.
For reproducibility, the search procedure retained the proposal history, unique-candidate cache, best-so-far validation objective after each unique evaluation, convergence history, and final selected configuration for every optimizer run.
Evolutionary optimization was performed independently for each seed . Candidate configurations were trained on the training partition and selected using validation performance only. For each optimizer, the selected configuration was fixed before evaluation on the held-out test partition. The test set was not used for hyperparameter or optimizer-family selection, and the test performance of all three optimizers was reported across the five seeds.
The original and SHAP-refined representations used the same search space, per-seed selection protocol, and 48-unique-evaluation budget, ensuring a matched optimization opportunity.
3.4. Proposed SHAP-Guided Feature Transformation and Evolutionary Optimization
The preceding experiments assess two complementary approaches for enhancing the original multimodal systems: direct SHAP-based pruning examines how refining the fused feature space affects performance, while optimization of the original representations measures the gain from evolutionary hyperparameter search without transforming features. In light of these findings, we introduce a SHAP-guided framework that modifies the multimodal representation before evolutionary optimization.
This framework uses SHAP importance for more than a simple keep-or-remove choice. After SHAP importance is calculated and normalized, the representation is subjected to bounded continuous feature weighting, followed by pruning based on validation results. GA, PSO, and ES are then applied to the resulting representation to tune the downstream classifier hyperparameters. In this way, weak dimensions are first downweighted according to their relative importance and are removed only when validation performance supports pruning.
3.4.1. Global SHAP Importance and Relative Normalization
For each multimodal model, the fused features are standardized using statistics computed only from the training set, and the same statistics are applied to the corresponding validation and test representations. Let the standardized representation be denoted by . A baseline classifier is trained on the standardized training data, and multiclass SHAP values are computed for the validation samples.
For feature j, global SHAP importance is computed by taking the mean of the absolute SHAP values over validation samples and output classes:
where is the number of validation samples, C is the number of classes, and denotes the SHAP value of feature j for sample i and class c. In contrast to the initial SHAP-pruning stage, the proposed framework directly combines the class-specific SHAP outputs over all six classes to produce a single continuous importance score for each fused dimension. Absolute values are used to capture the overall effect independent of whether the contribution is positive or negative.
Importance is then scaled relative to the most influential feature:
yielding . The feature with the greatest influence is assigned a value of 1, whereas the remaining dimensions keep their relative SHAP importance. Normalization based on the maximum retains these proportional differences without creating the very small probability-like values that arise when normalizing by total importance.
3.4.2. Proposed Bounded SHAP Feature Weighting
Direct weighting by may overly downweight dimensions that have low individual SHAP importance, even though these features can still provide complementary information when combined with other audio or symbolic dimensions. To address this, the proposed method sets a lower bound on the feature weight:
where specifies the minimum feature weight. Its effect was evaluated using the following validation-only sensitivity grid:
The value of was selected using validation performance only, before evaluation on the corresponding held-out test partition. The resulting feature weights satisfy
Smaller values of permit stronger differentiation between high- and low-importance dimensions, whereas larger values produce progressively weaker rescaling. In the limiting case , for every feature and SHAP-based feature rescaling is therefore disabled. The most important feature retains its full standardized magnitude for all values of .
The weighted representation is
where and represent the standardized and weighted values of feature j, respectively. For each experimental split, the same feature weights are used consistently across the training, validation, and test representations.
This constrained transformation is central to the proposed framework: SHAP importance creates a gradual separation among dimensions that contribute strongly, moderately, and weakly before any feature is removed. As a result, potentially complementary information remains available to the classifier, while its effect is adjusted according to model-derived importance.
3.4.3. Validation-Guided Feature Pruning
After weighting, the framework assesses whether the least influential dimensions should be excluded. In contrast to the initial SHAP-pruning experiment, the proposed method sets the pruning threshold separately for each multimodal system and experimental split based on validation performance. The following predefined candidate relative-importance thresholds were evaluated identically for all multimodal systems and experimental seeds:
For each , the retained feature set is
and the corresponding weighted-pruned representation is
The candidate preserves the full weighted representation, so pruning can be ruled out when it does not improve validation performance; higher thresholds gradually eliminate dimensions with lower relative SHAP importance.
Each candidate is assessed using the validation set. The threshold that achieves the highest validation accuracy is chosen; if there is a tie, Macro-F1 is used as the first tiebreaker, and if both measures are still equal, the representation with the smaller number of features is preferred. Thus,
and the resulting transformed representation is
This procedure adjusts the degree of pruning according to the representation instead of applying a uniform feature-removal rate, while ensuring that the test set does not affect threshold selection.
To isolate the effect of representation transformation before evolutionary optimization, two non-optimized controls were also evaluated for every multimodal system and experimental seed. The first control trained the downstream classifier using the complete bounded-weighted representation without feature removal. The second used the validation-selected weighted-pruned representation . These controls allow for the effects of bounded weighting and validation-guided pruning to be examined separately from the subsequent gains obtained through evolutionary hyperparameter optimization.
To determine whether any improvement from weighting was attributable specifically to the SHAP-derived assignment of weights rather than to generic feature rescaling, an additional random-weighting control was evaluated. In this control, the identical numerical bounded-weight values obtained from the SHAP procedure were randomly reassigned among the feature dimensions. The complete weight distribution was therefore preserved, while the correspondence between individual SHAP importance values and feature coordinates was destroyed.
A second semantic control used native XGBoost feature importance instead of SHAP-derived importance. Both semantic controls used the same matched per-seed optimization protocol described in Section 3.3.
3.4.4. Evolutionary Optimization of the SHAP-Guided Representation
The validation-selected transformed representation is subsequently supplied independently to GA, PSO, and ES. The evolutionary algorithms do not calculate SHAP values, determine feature weights, or select pruning thresholds. Their role is restricted to optimization of the downstream classifier hyperparameters after the representation-transformation stage has been completed.
The same six-hyperparameter search space, optimizer settings, 48-unique-evaluation budget, and validation-only selection protocol described in Section 3.3 were used without modification.
The proposed pipeline is executed independently for each of the five experimental seeds. For each seed, the corresponding training, validation, and test partitions are first established. Feature standardization is fitted using the training partition only. A baseline classifier is then trained on the standardized training representation, and multiclass SHAP values are computed on the validation partition. These values are used to derive the global importance scores, relative importances, bounded feature weights, and validation-selected pruning threshold. The resulting weighted-only and weighted-pruned controls are evaluated, after which GA, PSO, and ES independently optimize the downstream classifier using the training and validation data for that seed. The optimizer-selected hyperparameters are fixed before the resulting classifier is evaluated on the corresponding held-out test partition.
Consequently, each experimental seed produces its own SHAP importance profile, bounded weight vector, retained feature set, pruning threshold, and optimizer-selected classifier configuration. At no stage are test labels or test performance used to calculate feature importance, determine feature weights, select the pruning threshold, or choose classifier hyperparameters.
Overall, the experimental design evaluates the original fused representations, direct SHAP-based hard pruning, evolutionary optimization of the original representations, bounded SHAP weighting, validation-guided pruning, and evolutionary optimization of the transformed representations. This incremental structure allows for the behavior of the individual representation-refinement stages and the complete SHAP-guided optimization pipeline to be examined separately.
3.5. Statistical Analysis
Results obtained across the five experimental seeds are summarized using the arithmetic mean and sample standard deviation. For the primary matched comparisons, statistical analysis was performed on seed-matched differences rather than on independently pooled observations.
Let denote the accuracy difference between two matched conditions for seed s. The mean paired difference was calculated as
A descriptive 95% confidence interval for the paired difference was calculated using
where is the sample standard deviation of the five paired differences and is the corresponding Student’s t critical value with four degrees of freedom.
Because only five matched seed-level observations are available, paired significance was additionally assessed using an exact two-sided sign-flip test. All possible sign assignments of the paired differences were evaluated. Consequently, the smallest possible non-zero two-sided exact p-value is 0.0625.
The five seeds correspond to different stratified partitions of the same underlying 1800-recording corpus and should therefore not be interpreted as five independent datasets. The reported confidence intervals are consequently treated as descriptive uncertainty summaries across repeated partitions, and statistical interpretation emphasizes effect magnitude, consistency across seeds, and matched controls rather than conventional significance alone.
4. Results
4.1. Original End-to-End Performance of the Selected Multimodal Systems
The four selected systems were among the strongest configurations obtained in the preceding audio–symbolic classification experiments. Their original five-seed end-to-end performance is reported in Table 8 for context.
Table 8.
Original five-seed end-to-end performance of the selected multimodal systems.
Performance was closely grouped across the four systems. CNN14+BERT achieved the highest mean accuracy, while MobileNetV3-Large+XLNet showed the lowest accuracy variability. Because the systems use different audio backbones, symbolic encoders, and fused feature compositions, they provide a useful basis for examining whether SHAP-guided refinement and evolutionary optimization behave consistently across architectures. These original end-to-end results do not include SHAP-based weighting, pruning, or evolutionary hyperparameter optimization.
4.2. Surrogate Fidelity and Direct Perturbation Validation
Because SHAP is computed using a representation-space surrogate rather than directly from the end-to-end multimodal network, its fidelity was evaluated for all four systems and all five seeds. Table 9 reports the held-out test results. Original and surrogate accuracies are five-seed means, while prediction agreement and probability MAE are reported as mean ± standard deviation.
Table 9.
Held-out test fidelity of the representation-space surrogate. Accuracy values are five-seed means; prediction agreement and probability MAE are reported as mean ± standard deviation.
Prediction agreement ranges from 89.20% to 91.60%, and probability MAE ranges from 0.034 to 0.041. The surrogate therefore approximates the original models closely, but not exactly. Its SHAP attributions should consequently be interpreted as an approximation of the original model’s behavior rather than an exact decomposition of its predictions.
We also compared the surrogate SHAP ranking with direct feature perturbation of the original multimodal network. Table 10 reports the resulting feature-level and feature-family rank correlations.
Table 10.
Agreement between surrogate SHAP importance and direct feature perturbation/ablation of the original multimodal network. Values summarize the five experimental seeds.
Feature-level correlations range from 0.39 to 0.44, showing moderate agreement between surrogate SHAP rankings and direct perturbation of the original network. Family-level correlations are much higher, ranging from 0.90 to 0.95. We therefore interpret SHAP mainly at the feature-family level and treat the exact ranking of individual latent dimensions more cautiously.
4.3. Cross-Seed SHAP Stability and Feature-Family Attribution
SHAP stability was evaluated across the five experimental seeds. Table 11 reports coordinate-level Spearman’s correlation, top-10% Jaccard’s similarity, and feature-family rank correlation across the ten seed pairs.
Table 11.
Cross-seed stability of SHAP attribution in the 1800-recording experiments. Values summarize the ten pairwise comparisons among the five experimental seeds.
Individual feature rankings show limited-to-moderate stability across seeds, and the overlap among the top-ranked coordinates is low. In contrast, feature-family rankings are highly stable. These results support interpreting SHAP primarily at the feature-family level rather than relying on the exact ordering of individual latent dimensions.
Table 12 reports the corresponding feature-family attribution shares.
Table 12.
Feature-family SHAP attribution shares across the five experimental seeds. Values are reported as mean ± standard deviation (%).
Across all four systems, the deep audio backbone has the largest attribution share, followed by the symbolic branch. Handcrafted, Wav2Vec, and MFCC-VAE features make smaller but non-zero contributions. Together with the cross-seed stability results, this pattern supports interpretation at the feature-family level.
4.4. Initial SHAP-Based Feature Pruning Results
We first evaluated whether global SHAP importance could guide direct feature pruning. Table 13 reports the selected results. Because this experiment uses the representation-level downstream classifier, its unpruned F1 values are within-experiment controls and are distinct from the original end-to-end results in Table 8.
Table 13.
Initial SHAP-based feature-pruning results using the representation-level downstream classifier. Unpruned F1 is the within-experiment control.
The effect of pruning is much stronger for the CNN14-based systems. The Macro-F1 gains are +1.29 and +1.38 percentage points for CNN14+BERT and CNN14+RoBERTa, compared with only +0.26 and +0.02 points for ResNet50+RoBERTa and MobileNetV3-Large+XLNet, respectively.
Direct SHAP-based pruning is therefore strongly representation-dependent: clear improvements occur for the CNN14 systems, whereas the other two systems show only marginal gains. This motivates the bounded weighting strategy, which attenuates low-importance dimensions before applying hard pruning only when supported by validation performance.
4.5. Equalized Evolutionary Search Budget
Each optimizer was limited to 48 unique objective-function evaluations per system, seed, and condition. Table 14 reports the realized budget and candidate training/evaluation time for the matched Condition C and Condition G experiments.
Table 14.
Optimizer budget and search time for the matched Condition C and Condition G experiments. Search time is the summed candidate training/evaluation time for one search and excludes notebook and file-I/O overhead.
Across the 120 matched searches (4 systems × 5 seeds × 2 conditions × 3 optimizers), candidate training and evaluation required approximately 3769 s (62.8 min) in total.
Experiments were executed on an NVIDIA Tesla T4 GPU using PyTorch 2.11.0 with CUDA 12.8, XGBoost 3.4.1, and SHAP 0.52.0. The reported search times cover candidate training and evaluation during evolutionary optimization, not complete notebook wall-clock time. SHAP-only wall-clock time was not recorded and is therefore not estimated retrospectively.
A representative optimizer convergence trajectory is shown in Figure 1.
Figure 1.
Representative convergence of GA, PSO, and ES for CNN14+BERT under Condition G using seed 42. The horizontal axis shows unique objective-function evaluations, and the vertical axis shows the best validation accuracy obtained up to each evaluation.
The optimizers follow different convergence trajectories under the equalized budget. For this representative CNN14+BERT Condition G run, the final best validation accuracies were 95.19% for GA, 95.56% for PSO, and 94.81% for ES.
4.6. Optimization-Only Results for the Original Multimodal Representations
We next evaluate evolutionary hyperparameter optimization on the original fused representations, without SHAP-based weighting or pruning, to isolate the effect of optimization alone. GA, PSO, and ES use the common search protocol defined in Section 3.3.
Table 15 reports their held-out test performance for each multimodal system.
Table 15.
Test performance of all evolutionary optimizers on the original multimodal representations under the validation-only selection protocol. Values are five-seed mean accuracy/Macro-F1 (%). The final column reports the optimizer selected using validation performance, not test performance.
Validation selected PSO for CNN14+BERT, ResNet50+RoBERTa, and MobileNetV3-Large+XLNet, and GA for CNN14+RoBERTa.
4.7. Results of the Proposed SHAP-Guided Framework
For the matched analysis, Condition C denotes the original representation with per-seed evolutionary optimization, whereas Condition G denotes SHAP-guided weighting and validation-guided pruning followed by the same optimization protocol. Both conditions use the matched search procedure defined in Section 3.3.
4.7.1. Evolutionary Optimization of the SHAP-Refined Representation
Table 16 reports the held-out test performance of GA, PSO, and ES after applying the SHAP-guided representation transformation.
Table 16.
Test performance of GA, PSO, and ES on the SHAP-refined representations under the matched per-seed validation-only selection protocol. Values are five-seed mean accuracy/Macro-F1 (%). The final column reports the optimizer selected using validation performance.
Validation selected PSO for CNN14+BERT and ResNet50+RoBERTa, GA for CNN14+RoBERTa, and ES for MobileNetV3-Large+XLNet. Table 17 summarizes the five-seed variability of these validation-selected final Condition G configurations.
Table 17.
Five-seed performance of the validation-selected final Condition G configurations. Values are reported as mean ± standard deviation.
The final validation-selected Condition G configurations therefore show consistent five-seed performance in both accuracy and Macro-F1, with standard deviations ranging from 0.60 to 1.06 percentage points for accuracy and from 0.64 to 1.10 percentage points for Macro-F1.
4.7.2. Weighting and Pruning Sensitivity Analysis
The weighting and pruning parameters were selected using validation data only. Table 18 reports the resulting architecture-specific configurations.
Table 18.
Validation-selected weighting and pruning configurations for the 1800-recording experiments.
The selected settings are strongly architecture-dependent. The preferred weighting strength becomes progressively weaker from CNN14+BERT () to MobileNetV3-Large+XLNet (), while pruning also decreases across these systems. MobileNetV3-Large+XLNet selects and , so neither SHAP-based rescaling nor pruning is applied. These results do not support a universal lower weighting bound of ; weighting strength and pruning should instead be selected jointly using validation performance.
Table 19 shows the corresponding feature-family retention under the validation-selected pruning masks.
Table 19.
Retained dimensions and retention percentages by feature family for the validation-selected SHAP-guided representations. Values are reported as retained/original dimensions, with the corresponding percentage in parentheses. The symbolic column denotes BERT, RoBERTa, or XLNet, as applicable.
Pruning is generally modest and architecture-dependent. CNN14+BERT shows the largest family-level reductions, whereas ResNet50+RoBERTa retains more than 93% of every feature family. MobileNetV3-Large+XLNet retains all dimensions, consistent with its validation-selected decision not to prune.
4.7.3. Random-Weighting and Non-SHAP Importance Controls
To test whether any benefit depends specifically on SHAP-derived feature assignment, Condition F (SHAP weighting) was compared with Condition H (the same weights randomly reassigned) and Condition I (XGBoost feature importance), all under matched per-seed optimization. Table 20 reports these semantic weighting controls.
Table 20.
Semantic weighting controls under matched per-seed optimization. Accuracy values are five-seed mean ± standard deviation.
The SHAP-specific assignment shows its clearest advantage in the CNN14-based systems, while the differences are small for ResNet50+RoBERTa and MobileNetV3-Large+XLNet. These controls therefore indicate a modest, architecture-dependent SHAP-specific benefit rather than a universal advantage over generic rescaling or XGBoost-based importance.
4.7.4. Matched Optimization-Only Versus SHAP-Refined Comparison
The primary analysis compares Condition C, evolutionary optimization of the original representation, with Condition G, the complete SHAP-refined pipeline under the same per-seed optimization protocol. Table 21 reports the matched results.
Table 21.
Matched comparison between per-seed evolutionary optimization of the original representation (Condition C) and the complete SHAP-guided representation followed by per-seed evolutionary optimization (Condition G). Accuracy values are five-seed mean ± standard deviation. Confidence intervals refer to the paired G–C seed-level differences.
The additional effect of SHAP-guided refinement is architecture-dependent. CNN14+BERT shows the clearest gain (+0.90 percentage points), followed by CNN14+RoBERTa (+0.50) and ResNet50+RoBERTa (+0.20), while MobileNetV3-Large+XLNet is unchanged on average. Only the CNN14+BERT confidence interval remains entirely above zero.
None of the exact paired tests reaches the conventional threshold. With five paired seeds, the smallest attainable non-zero two-sided sign-flip p-value is 0.0625. Interpretation therefore emphasizes effect size, confidence intervals, and consistency across the matched controls.
Table 22 summarizes the complete A–I control matrix. Condition B is retained as an earlier fixed-configuration reference, whereas Conditions A and C–I follow the validation-based protocol used in the present experiments.
Table 22.
Complete A–I experimental control matrix. Values are five-seed mean held-out test accuracy (%). A: Original representation without optimization. B: Earlier fixed-configuration reference. C: Original representation with matched per-seed optimization. D: SHAP-weighted representation without optimization. E: SHAP-weighted and validation-pruned representation without optimization. F: SHAP-weighted representation with matched per-seed optimization. G: Complete SHAP-weighted, validation-pruned, and matched optimized pipeline. H: Randomly reassigned identical SHAP weight distribution with matched optimization. I: Native XGBoost-importance weighting with matched optimization.
Condition C is the primary optimization-only control for Condition G. Conditions D and E isolate weighting and pruning before optimization, while F, H, and I distinguish SHAP-specific weighting from alternative weighting controls.
Using the values in Table 22, the combined A–E gains from SHAP weighting and pruning are +0.60, +0.30, +0.20, and 0.00 percentage points for CNN14+BERT, CNN14+RoBERTa, ResNet50+RoBERTa, and MobileNetV3-Large+XLNet, respectively. The subsequent E–G gains from evolutionary optimization are larger at +1.20, +0.70, +0.30, and +0.10 points. Evolutionary optimization is therefore the largest incremental contributor, while SHAP-guided representation refinement provides a smaller, architecture-dependent contribution.
Table 23 reports five-seed mean class-wise F1 for the final Condition G configurations. Aggregate row-normalized confusion matrices are provided in the Supplementary Materials.
Table 23.
Five-seed mean class-wise F1 scores (%) for the validation-selected Condition G configurations.
Ray has the highest class-wise F1 across all four systems, whereas Shami is generally the most difficult genre. The class-wise results also show that the aggregate performance is not driven by a single genre.
5. Discussion
5.1. Comparison with Existing Literature
Direct numerical comparison with previous studies should be made cautiously because datasets, genre definitions, modalities, and evaluation protocols differ substantially. Recent Arabic music studies have demonstrated strong audio-based classification performance [1,2], while multimodal studies have shown the value of combining complementary audio, text, visual, and metadata representations [3,4,13,16]. The present work addresses a different problem: refining an already fused audio–symbolic representation using model-attribution information before classifier optimization.
Feature selection and evolutionary optimization are also well established. Previous studies have used GA and PSO for feature selection, continuous feature weighting, and classifier optimization [5,6,30]. SHAP has been used for feature ranking and hard subset selection [20,21,22], including before subsequent optimization [31]. Other studies use SHAP mainly for interpretation after optimization [32,33]. The distinction of the present framework is that SHAP importance is first converted into bounded continuous weights, validation determines whether additional pruning is useful, and evolutionary algorithms then optimize only the downstream classifier.
The matched experiments show that the additional benefit of SHAP-guided representation refinement varies across architectures. The clearest gain is observed for CNN14+BERT, followed by a smaller effect for CNN14+RoBERTa, a marginal effect for ResNet50+RoBERTa, and no mean improvement for MobileNetV3-Large+XLNet. The staged controls also show that evolutionary hyperparameter optimization contributes more to the final performance gain than SHAP-guided weighting and pruning.
The sensitivity analysis supports the same architecture-dependent pattern. Validation selects stronger SHAP-based weighting and more pruning for the CNN14 representations, weaker transformation for ResNet50+RoBERTa, and no rescaling or pruning for MobileNetV3-Large+XLNet. One possible explanation is that useful information is distributed differently across the fused feature spaces. The larger ResNet50- and MobileNetV3-Large-based representations also contain a Wav2Vec branch that is absent from the CNN14 representations. However, this should be treated as an empirical interpretation rather than a demonstrated causal mechanism.
The semantic controls further limit the strength of the SHAP-specific claim. SHAP-derived weighting shows its clearest advantage over random reassignment for the CNN14 systems, while the differences are small for the other architectures and XGBoost importance remains competitive. The results therefore support a modest, architecture-dependent SHAP-specific benefit rather than a universal advantage over other feature-weighting approaches.
Interpretation of the SHAP results is also constrained by the representation-space surrogate. The surrogate approximates the original multimodal networks but does not reproduce them exactly. Direct perturbation and cross-seed stability analyses both provide much stronger support at the feature-family level than at the level of individual latent coordinates. Therefore, the most reliable interpretation concerns broad feature-family patterns rather than the exact ranking of individual dimensions.
Overall, these findings extend the usual role of XAI in music classification, where explanation methods are primarily used after training [8,9,10,18,19]. Here, attribution is also used as an active signal for representation refinement. Its benefit, however, depends on the underlying representation and should be evaluated against matched optimization and alternative weighting controls.
5.2. Limitations
Several limitations should be considered. First, the weighting and pruning parameters were selected from predefined discrete validation grids rather than continuous search spaces. The semantic controls also show that the additional value of SHAP-specific weighting is modest and architecture-dependent. In addition, all experiments use the same Arabic music collection, and both SHAP estimation and evolutionary optimization add computational cost.
Second, SHAP is estimated through a representation-space surrogate rather than directly from the complete end-to-end multimodal network. Surrogate fidelity is substantial but imperfect, and both direct perturbation and cross-seed stability analyses provide stronger support at the feature-family level than at the level of individual latent coordinates. Exact coordinate-level SHAP rankings should therefore be interpreted cautiously.
Third, the four multimodal architectures were selected earlier from a larger set of 14 completed systems. The available records do not establish that this pre-selection was based exclusively on validation performance. The four architectures are therefore treated as fixed starting points; all subsequent weighting, pruning, checkpoint, hyperparameter, and optimizer decisions use validation-only selection.
Fourth, verified artist, album, composition, composer, and song-version identifiers are unavailable. Although the decoded-audio audit found no exact duplicate recordings crossing the train, validation, and test partitions, artist-disjoint, album-disjoint, composition-disjoint, and song-version-disjoint evaluation could not be established. The results therefore demonstrate exact-recording-level generalization but should not be interpreted as evidence of generalization to unseen artists, compositions, or related recording versions.
The symbolic representation is also derived programmatically from the same audio recording rather than from an independently acquired symbolic source. The reported multimodal setting therefore combines complementary audio-derived representations rather than fully independent audio and symbolic modalities.
Finally, statistical inference is limited by five repeated stratified partitions of the same corpus. These seeds are not independent datasets, and the exact two-sided sign-flip test cannot produce a non-zero p-value below 0.0625 with five paired observations. Effect sizes, confidence intervals, and cross-seed consistency should therefore be considered together. The selected evolutionary optimizer also varies across representations, so no single optimizer can yet be considered universally preferable.
6. Conclusions
This study examined whether SHAP-derived feature importance can refine fused audio–symbolic representations before evolutionary classifier optimization. The proposed framework converts global SHAP importance into bounded continuous feature weights, applies pruning only when supported by validation performance, and then uses GA, PSO, or ES to optimize the downstream classifier.
Under the matched protocol, CNN14+BERT achieved the strongest final result at 95.30% mean accuracy, compared with 94.40% for evolutionary optimization of its original representation. Across the four systems, the additional effect of SHAP-guided refinement decreases from CNN14+BERT to MobileNetV3-Large+XLNet. The staged controls show that evolutionary optimization provides the largest incremental improvement, while SHAP-guided representation refinement contributes a smaller and architecture-dependent benefit.
Future work will examine continuous or adaptive weighting and pruning, additional audio and symbolic architectures, independent Arabic music and multimodal MIR datasets, and more efficient SHAP and optimization procedures. Class-specific and hierarchical attribution may also help clarify interactions among audio backbones, handcrafted features, Wav2Vec, MFCC-VAE, and symbolic representations.
Supplementary Materials
The following supporting information can be downloaded at: https://www.mdpi.com/article/10.3390/app16199613/s1.
Author Contributions
Conceptualization, L.S., M.I. and M.M.; methodology, L.S., I.E. and M.I.; software, L.S.; validation, L.S., I.E. and M.I.; formal analysis, L.S. and I.E.; investigation, L.S.; data curation, L.S.; writing—original draft preparation, L.S. and M.I.; writing—review and editing, M.I. and A.E.C.; visualization, L.S.; supervision, M.I. and I.E.; project administration, L.S. and M.I. All authors have read and agreed to the published version of the manuscript.
Funding
This research received no external funding.
Institutional Review Board Statement
Not applicable.
Informed Consent Statement
Not applicable.
Data Availability Statement
A publicly released portion of the dataset used in this study, comprising 1200 aligned audio–symbolic pairs (200 pairs per genre), is available through Harvard Dataverse. The audio recordings are available in two parts at https://doi.org/10.7910/DVN/BJLJE8 and https://doi.org/10.7910/DVN/ZFNSQC, and the corresponding symbolic sequence representations are available at https://doi.org/10.7910/DVN/POV3TU and https://doi.org/10.7910/DVN/ZQRJDB. The complete experimental corpus used in this study contains 1800 aligned audio–symbolic pairs (300 pairs per genre). The remaining 600 aligned pairs, together with the complete research implementation and associated experimental artifacts, form part of an ongoing PhD research program and are currently being used in continuing analyses and related publications. These materials are planned for public release following completion of the associated doctoral research and publications.
Acknowledgments
During the preparation of this manuscript, the authors used OpenAI ChatGPT (GPT-5.6 Sol) for language editing, organizational refinement, and assistance with LaTeX formatting. The authors reviewed and edited all AI-assisted output and take full responsibility for the content of the publication.
Conflicts of Interest
Author Mohamad Moussa is employed by Microsoft. The remaining authors declare no conflicts of interest.
Abbreviations
The following abbreviations are used in this manuscript:
| MIR | Music Information Retrieval |
| MFCC | Mel-Frequency Cepstral Coefficient |
| CNN | Convolutional Neural Network |
| VAE | Variational Autoencoder |
| BERT | Bidirectional Encoder Representations from Transformers |
| GA | Genetic Algorithm |
| PSO | Particle Swarm Optimization |
| ES | Evolution Strategy |
| XAI | Explainable Artificial Intelligence |
| SHAP | SHapley Additive exPlanations |
| MAE | Mean Absolute Error |
| SD | Standard Deviation |
References
- Almazaydeh, L.; Atiewi, S.; Al Tawil, A.; Elleithy, K. Arabic music genre classification using deep convolutional neural networks (CNNs). Comput. Mater. Contin. 2022, 72, 5443–5458. [Google Scholar] [CrossRef] [Scilit]
- AL-Makhlafi, M.; AlKannad, A.A.; Almekhlafi, E.; Mohammed, N.Q.O.A.; Qaid, S. YMIR: A new benchmark dataset and model for Arabic Yemeni music genre classification using convolutional neural networks. arXiv 2026, arXiv:2604.05011. [Google Scholar] [CrossRef] [Scilit]
- Oramas, S.; Barbieri, F.; Nieto, O.; Serra, X. Multimodal deep learning for music genre classification. Trans. Int. Soc. Music Inf. Retr. 2018, 1, 4–21. [Google Scholar] [CrossRef] [Scilit]
- Chen, C.; Li, Q. A multimodal music emotion classification method based on multifeature combined network classifier. Math. Probl. Eng. 2020, 2020, 4606027. [Google Scholar] [CrossRef] [Scilit]
- Karkavitsas, G.V.; Tsihrintzis, G.A. Automatic music genre classification using hybrid genetic algorithms. In Intelligent Interactive Multimedia Systems and Services; Tsihrintzis, G.A., Virvou, M., Jain, L.C., Howlett, R.J., Eds.; Springer: Berlin/Heidelberg, Germany, 2011; Volume 11, pp. 323–335. [Google Scholar] [CrossRef] [Scilit]
- Muthusamy, H.; Polat, K.; Yaacob, S. Particle swarm optimization based feature enhancement and feature selection for improved emotion recognition in speech and glottal signals. PLoS ONE 2015, 10, e0120344. [Google Scholar] [CrossRef] [Scilit]
- Le, T.C.; Winkler, D.A. Discovery and optimization of materials using evolutionary approaches. Chem. Rev. 2016, 116, 6107–6132. [Google Scholar] [CrossRef] [Scilit]
- Zuliani, G. Explainability Methods in Music Emotion Recognition. Master’s Thesis, Politecnico di Torino, Turin, Italy, 2025. [Google Scholar]
- Karki, B.; Chaudhary, B.H.; Jaiswal, A.K.; Dev, J.; Karki, P.; Sangroula, P. Classifying music genres using machine learning and deep learning with explainable AI (XAI). In Proceedings of the IOE Graduate Conference; Institute of Engineering, Pulchowk Campus: Lalitpur, Nepal, 2025. [Google Scholar]
- Singh, P.; Arora, V. Explainable deep learning analysis for raga identification in Indian art music. IEEE/ACM Trans. Audio Speech Lang. Process. 2025, 33, 2302–2311. [Google Scholar] [CrossRef] [Scilit]
- Elshaarawy, M.; Saeed, A.; Sheta, M.; Said, A.; Bakr, A.; Bahaa, O.; Gomaa, W. Arabic music classification and generation using deep learning. arXiv 2024, arXiv:2410.19719. [Google Scholar] [CrossRef] [Scilit]
- Ahmed, M.; Fadel, S.; Helal, M.E.; Wahdan, A.M. Arabic music genre identification. J. Adv. Res. Appl. Sci. Eng. Technol. 2024, 46, 187–200. [Google Scholar] [CrossRef] [Scilit]
- Pandeya, Y.R.; Lee, J. Deep learning-based late fusion of multimodal information for emotion classification of music video. Multimed. Tools Appl. 2021, 80, 2887–2905. [Google Scholar] [CrossRef] [Scilit]
- Pandeya, Y.R.; Bhattarai, B.; Lee, J. Deep-learning-based multimodal emotion classification for music videos. Sensors 2021, 21, 4927. [Google Scholar] [CrossRef] [Scilit]
- Hao, X.; Li, H.; Wen, Y. Real-time music emotion recognition based on multimodal fusion. Alex. Eng. J. 2025, 116, 586–600. [Google Scholar] [CrossRef] [Scilit]
- Martín-Gutiérrez, D.; Hernández-Peñaloza, G.; Belmonte-Hernández, A.; Álvarez, F. A multimodal end-to-end deep learning architecture for music popularity prediction. IEEE Access 2020, 8, 39361–39374. [Google Scholar] [CrossRef] [Scilit]
- Chen, W.; Wu, G. A multimodal convolutional neural network model for the analysis of music genre on children’s emotions influence intelligence. Comput. Intell. Neurosci. 2022, 2022, 5611456. [Google Scholar] [CrossRef] [Scilit]
- Jenifer, A.E.; Abirami, K.S.; Rajeshwari, M. Enhanced audio signal classification with explainable AI: Deep learning approach in time and frequency domain analysis. Procedia Comput. Sci. 2025, 258, 2372–2381. [Google Scholar] [CrossRef] [Scilit]
- Li, Y.; Sun, Q.; Li, H.; Specia, L.; Schuller, B.W. Explainable detection of machine generated music and early systematic evaluation. Sci. Rep. 2026, 16, 13757. [Google Scholar] [CrossRef] [Scilit]
- Marcilio, W.E., Jr.; Eler, D.M. From explanations to feature selection: Assessing SHAP values as feature selection mechanism. In Proceedings of the 2020 33rd SIBGRAPI Conference on Graphics, Patterns and Images (SIBGRAPI), Recife, Brazil, 7–10 November 2020; pp. 340–347. [Google Scholar] [CrossRef] [Scilit]
- Gebreyesus, Y.; Dalton, D.; Nixon, S.; De Chiara, D.; Chinnici, M. Machine learning for data center optimizations: Feature selection using Shapley Additive exPlanation (SHAP). Future Internet 2023, 15, 88. [Google Scholar] [CrossRef] [Scilit]
- Wang, H.; Liang, Q.; Hancock, J.T.; Khoshgoftaar, T.M. Feature selection strategies: A comparative analysis of SHAP-value and importance-based methods. J. Big Data 2024, 11, 44. [Google Scholar] [CrossRef] [Scilit]
- McKinney, M.F.; Breebaart, J. Features for audio and music classification. In Proceedings of the 4th International Conference on Music Information Retrieval (ISMIR), Baltimore, MD, USA, 26–30 October 2003; pp. 151–158. [Google Scholar]
- Baniya, B.K.; Lee, J. Importance of audio feature reduction in automatic music genre classification. Multimed. Tools Appl. 2016, 75, 3013–3026. [Google Scholar] [CrossRef] [Scilit]
- Bang, S.-W.; Kim, J.; Lee, J.-H. An approach of genetic programming for music emotion classification. Int. J. Control Autom. Syst. 2013, 11, 1290–1299. [Google Scholar] [CrossRef] [Scilit]
- Balochian, S.; Seidabad, E.A.; Rad, S.Z. Neural network optimization by genetic algorithms for the audio classification to speech and music. Int. J. Signal Process. Image Process. Pattern Recognit. 2013, 6, 47–54. [Google Scholar]
- Andono, P.N.; Shidik, G.F.; Prabowo, D.P.; Yanuarsari, D.H.; Sari, Y.; Pramunendar, R.A. Feature selection on gammatone cepstral coefficients for bird voice classification using particle swarm optimization. Int. J. Intell. Eng. Syst. 2023, 16, 254–264. [Google Scholar] [CrossRef] [Scilit]
- Shang, L.; Zhou, Z.; Liu, X. Particle swarm optimization-based feature selection in sentiment classification. Soft Comput. 2016, 20, 3821–3834. [Google Scholar] [CrossRef] [Scilit]
- Liu, Y.; Wang, G.; Chen, H.; Dong, H.; Zhu, X.; Wang, S. An improved particle swarm optimization for feature selection. J. Bionic Eng. 2011, 8, 191–200. [Google Scholar] [CrossRef] [Scilit]
- Gharavian, D.; Bejani, M.; Sheikhan, M. Audio-visual emotion recognition using FCBF feature selection method and particle swarm optimization for fuzzy ARTMAP neural networks. Multimed. Tools Appl. 2017, 76, 2331–2352. [Google Scholar] [CrossRef] [Scilit]
- Liu, C.; Yang, W. Transformer fault diagnosis using machine learning: A method combining SHAP feature selection and intelligent optimization of LGBM. Energy Inform. 2025, 8, 52. [Google Scholar] [CrossRef] [Scilit]
- Debjit, K.; Islam, M.S.; Rahman, M.A.; Pinki, F.T.; Nath, R.D.; Al-Ahmadi, S.; Hossain, M.S.; Mumenin, K.M.; Awal, M.A. An improved machine-learning approach for COVID-19 prediction using Harris Hawks optimization and feature analysis using SHAP. Diagnostics 2022, 12, 1023. [Google Scholar] [CrossRef] [Scilit]
- Kaur, S.; Singh, G.; Kumar, A.; Singh, A. Improvised wheat yield forecasting via SHAP-based feature selection and Bayesian optimized weighted ensemble model. Environ. Res. Commun. 2025, 7, 125016. [Google Scholar] [CrossRef] [Scilit]
- Soboh, L.; Elkabani, I. Arabic Music Genre Audio Dataset—Part 1 (Egyptian, Khaliji, and Pop); Harvard Dataverse: Cambridge, MA, USA, 2026. [Google Scholar] [CrossRef]
- Soboh, L.; Elkabani, I. Arabic Music Genre Audio Dataset—Part 2 (Ray, Shami, and Tarab); Harvard Dataverse: Cambridge, MA, USA, 2026. [Google Scholar] [CrossRef]
- Soboh, L.; Elkabani, I. Arabic Music Genre Symbolic Sequence Dataset—Part 1 (Egyptian, Khaliji, and Pop); Harvard Dataverse: Cambridge, MA, USA, 2026. [Google Scholar] [CrossRef]
- Soboh, L.; Elkabani, I. Arabic Music Genre Symbolic Sequence Dataset—Part 2 (Ray, Shami, and Tarab); Harvard Dataverse: Cambridge, MA, USA, 2026. [Google Scholar] [CrossRef]
- Immanuel, S.D.; Chakraborty, U.K. Genetic algorithm: An approach on optimization. In Proceedings of the 2019 International Conference on Communication and Electronics Systems (ICCES), Coimbatore, India, 17–19 July 2019; pp. 701–708. [Google Scholar] [CrossRef] [Scilit]
- Kennedy, J.; Eberhart, R. Particle swarm optimization. In Proceedings of the ICNN’95—International Conference on Neural Networks, Perth, WA, Australia, 27 November–1 December 1995; Volume 4, pp. 1942–1948. [Google Scholar] [CrossRef] [Scilit]
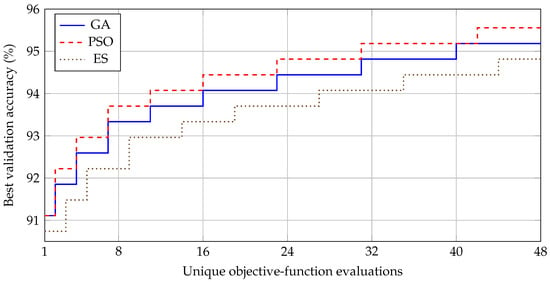
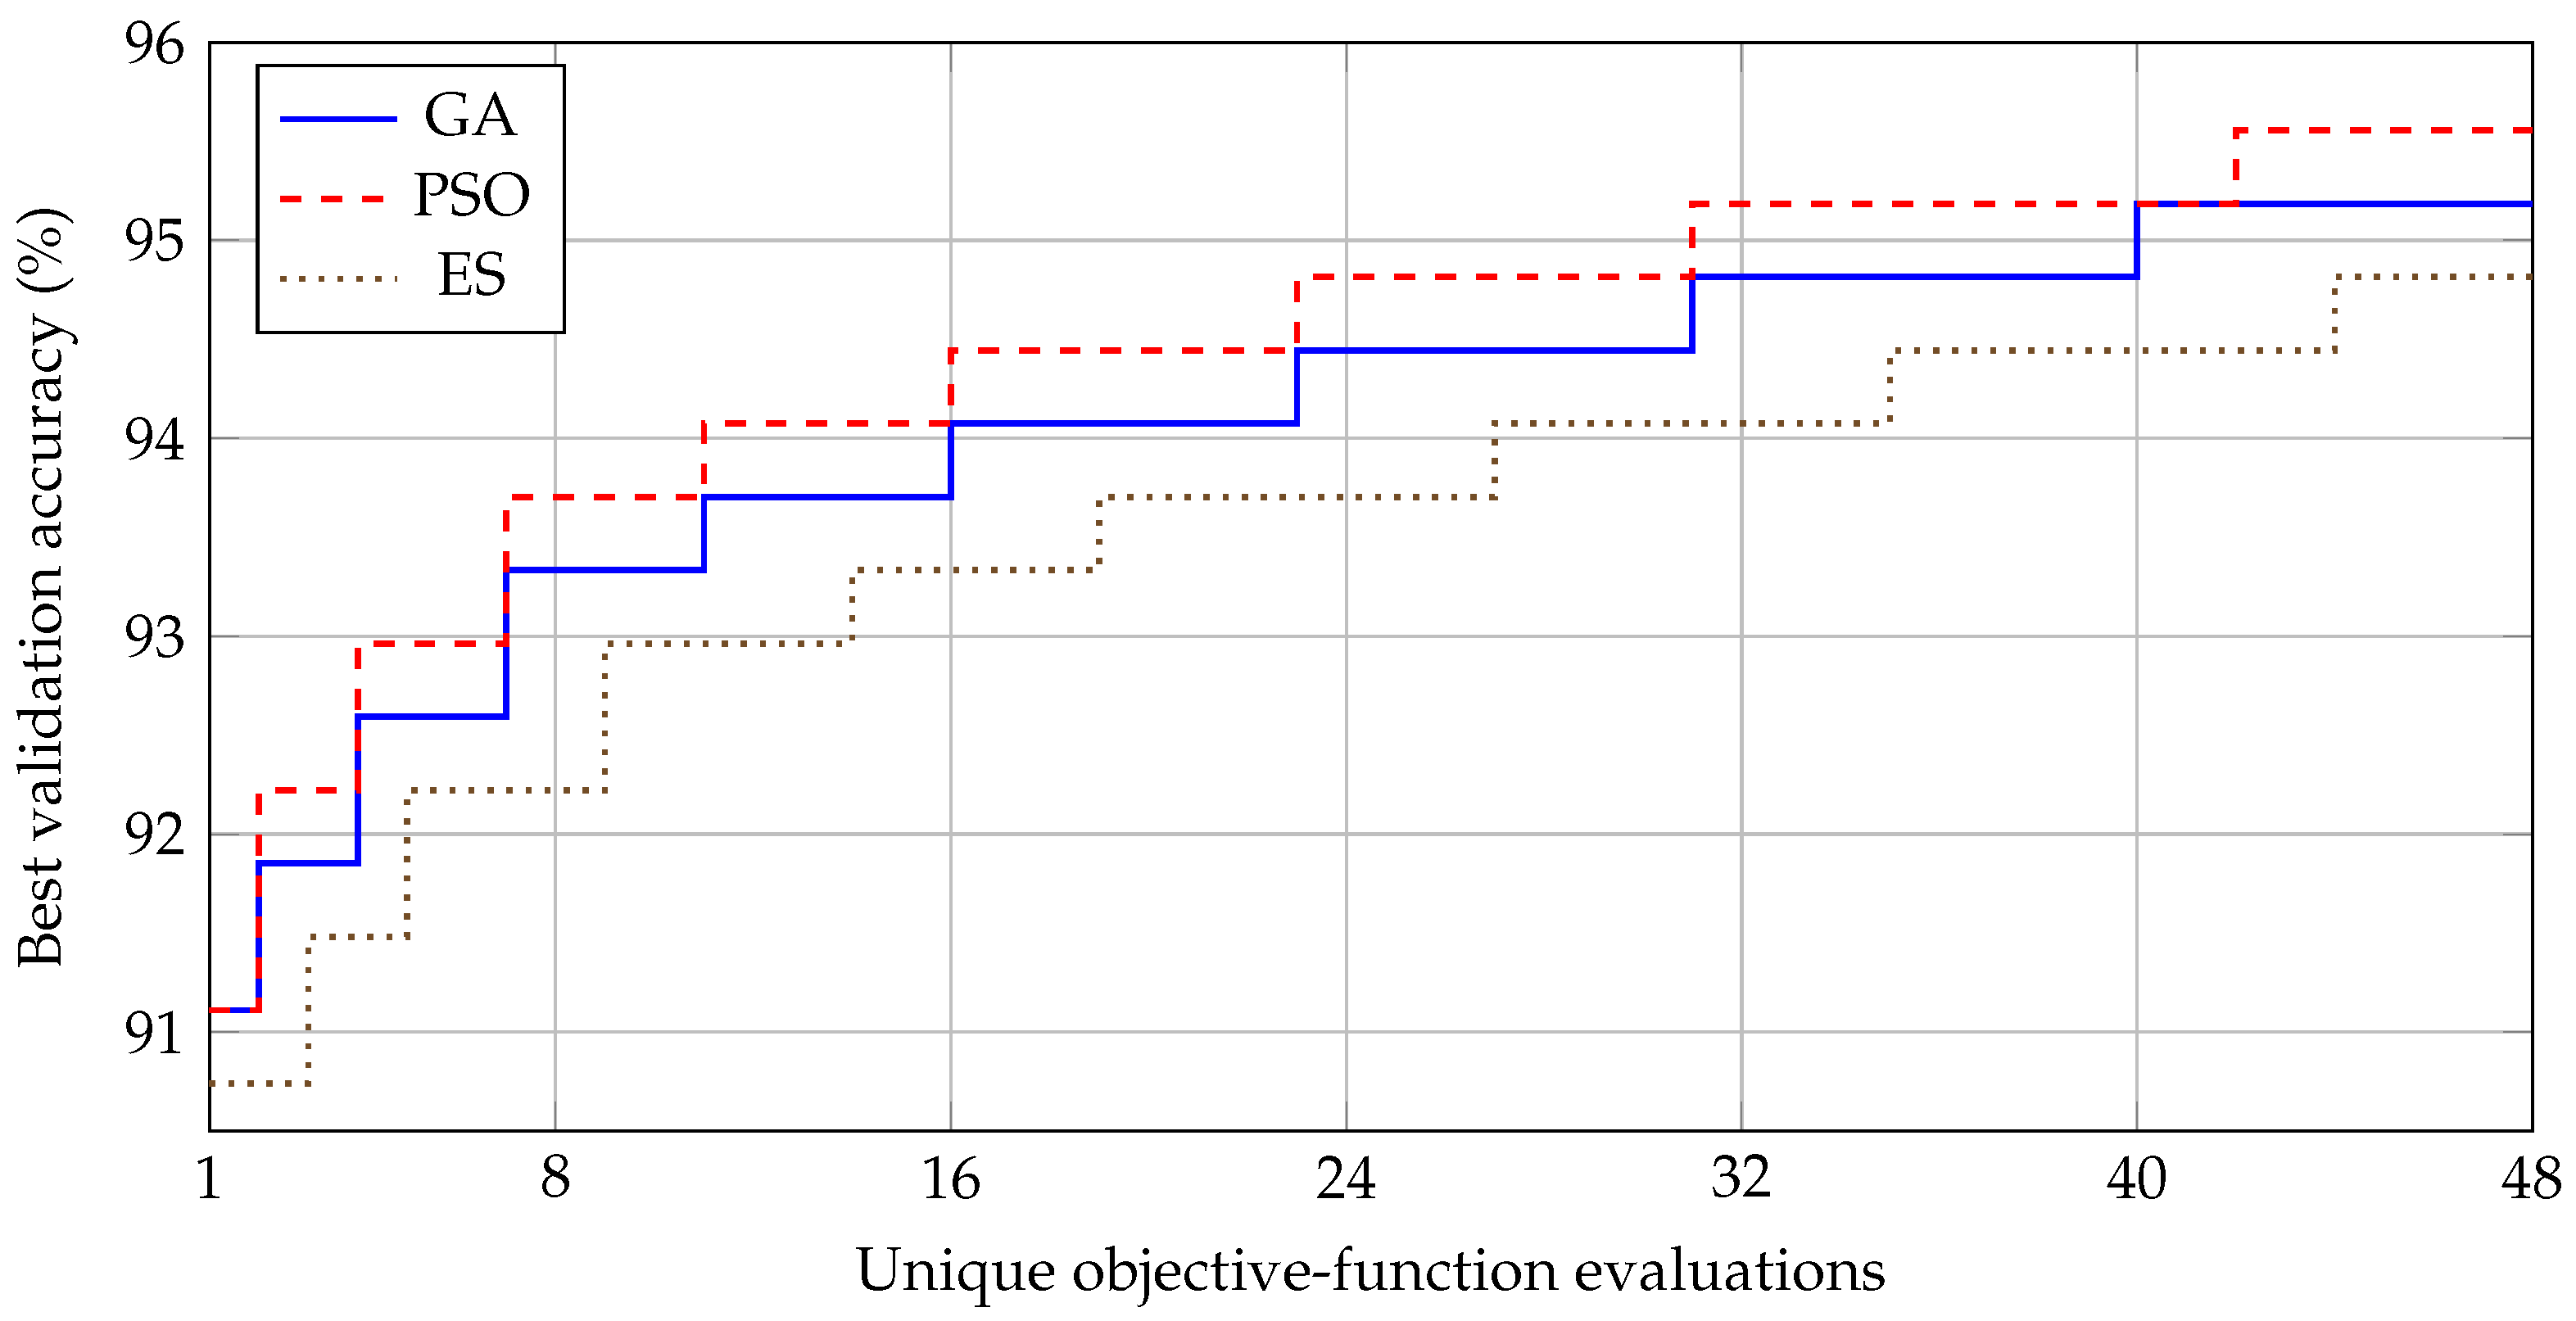

Disclaimer/Publisher’s Note: The statements, opinions and data contained in all publications are solely those of the individual author(s) and contributor(s) and not of MDPI and/or the editor(s). MDPI and/or the editor(s) disclaim responsibility for any injury to people or property resulting from any ideas, methods, instructions or products referred to in the content. |
© 2026 by the authors. Licensee MDPI, Basel, Switzerland. This article is an open access article distributed under the terms and conditions of the Creative Commons Attribution (CC BY) license.