


Abstract
This study investigates the stress behavior of the L-shaped pipeline elbows at LNG receiving terminals. A finite element model is developed to investigate the effects of internal pressure, temperature, and their coupling on the stress field at the 45° cross-section of the elbow. The numerical result is compared with experimental results to evaluate its accuracy. For internal pressure loading alone, the peak stress is governed by hoop tension and located at the intrados. In contrast, under thermal loading alone, compressive hoop stress shifts the critical location to the crown. When both loads are applied simultaneously, competition between two high-stress zones causes the peak location to jump among 0°, 57°, and 83° as the relative dominance of thermal and pressure effects varies, challenging conventional fixed-location inspection strategies. A response surface model is constructed to predict extreme stress magnitudes, and multinomial logistic regression is employed to establish quantitative classification boundaries for the peak stress location as a function of temperature and pressure. Within the investigated range, the critical pressures predicted by the logistic regression model agree well with the finite element results. These findings provide a predictive basis for risk-based inspection prioritization and failure probability assessment of cryogenic pipeline elbows under operational thermal-pressure conditions.
1. Introduction
Liquefied natural gas (LNG) receiving terminals are vital nodes in the global energy supply chain that connect maritime transport and onshore pipeline networks [1,2]. Failure at LNG receiving terminals can lead to catastrophic consequences, including LNG leakage [3], pool fires with lethal thermal radiation [4], flammable vapor cloud formation and dispersion [5], and vapor cloud explosions with destructive overpressure [6,7], posing severe threats to personnel safety and regional energy security. Within LNG terminals, cryogenic pipelines serve the core processes of LNG unloading, storage, vaporization, and export, making them key components of overall terminal integrity [8,9].
Field investigations have documented typical failure incidents in cryogenic LNG pipelines, including elbow perforation due to erosion–corrosion under high-pressure differential flow [10], weld cracking accelerated by compressor vibrations [11], and valve bonnet flange cracking due to stress corrosion cracking under combined thermal stress and corrosive environments [12]. These incidents indicate that geometric discontinuities in the pipeline as structurally vulnerable positions prone to stress concentration, which can significantly increase the risk of local failure [13]. Regarding stress concentration, assessment must address not only the magnitude of the peak stress, but also where the peak occurs [14], since the region of maximum stress concentration serves as the primary site for crack initiation and propagation [15]. Therefore, accurate identification of the value and the location of the maximum stress of pipelines is essential for risk-based inspection planning and structural integrity assessment.
Unlike conventional oil and gas transmission pipelines, LNG pipelines are installed at ambient temperature but operated at ultra-low temperatures below −160 °C. The large temperature difference between installation and operation induces substantial thermal contraction [16]. When the thermal contraction is constrained by supports, anchor points, and adjacent structures, it can induce thermal stress in the pipelines. In an LNG receiving terminal, L-shaped configurations are the most common turning units. For such a section, differential thermal displacements at the two straight segments induce additional bending moments at the elbow. Subjected to these moments, the elbow cross-section undergoes significant deformation due to its nonuniform circumferential stiffness [17]. Counteracting this effect, internal pressure tends to restore the cross-section to a more circular shape, suppressing ovalization and enhancing stiffness [18]. Thermal contraction and internal pressure thus exert opposing influences on elbow deformation; their relative dominance shifts with operating conditions, altering both the magnitude and location of maximum stress. The present study focuses specifically on the elbow of L-shaped configuration, the stress behavior of which depends on knowledge of both LNG pipeline stress analysis and elbow mechanical response, which have been extensively studied but largely in isolation.
Research on LNG pipeline stress behavior has primarily focused on temperature fields and heat transfer, mechanical properties of materials at cryogenic temperatures, or overall pipeline stress evaluation. With respect to thermal behavior, Yang et al. [19] developed theoretical relations for predicting wall temperatures during precooling of terminal unloading pipelines, identifying natural convection intensity as the key factor controlling circumferential temperature differences. Wu et al. [20] performed transient thermal analysis on cryogenic bellows hoses and found that thermal stress is governed by the combined influence of boundary constraints and local temperature gradients. Zhou et al. [21] simulated flow and heat transfer during precooling, cool-down, and unloading phases of LNG tank feed pipelines. In terms of material performance at cryogenic temperatures, tensile tests have been conducted to examine the strain-hardening characteristics of 304/304L stainless steel at various temperatures [22,23]. Tomota [24] investigated the fracture toughness of austenitic stainless steel at 293 K and 77 K through Charpy impact tests. Baek [25] studied fatigue crack growth rates in 304/304L stainless steel and weld metal at −162 °C. Sanchez et al. [26] confirmed that long-term cryogenic cycling and marine exposure did not induce embrittlement or performance degradation in 304 stainless steel pipelines after over 40 years of service. For overall pipeline stress evaluation, BS EN 13480-3:2002 [27] and ASME B31.1 [28] remain the most widely used design standards, and Hwang et al. [29] applied these standards to LNG carriers using CAESAR II beam-element models. Lou et al. [30] investigated plastic buckling of π-shaped compensators under monotonic displacement. He et al. [31] examined flange connections at LNG bunkering stations using a combined experimental and thermal–structural coupled approach.
For elbow mechanical behavior, the theoretical foundation was established by von Kármán [32], who derived the flexibility factor of curved pipes using the minimum potential energy method, revealing the central role of cross-sectional ovalization. Internal pressure effects on elbow flexibility were subsequently incorporated by Rodabaugh and George [33]. These classical solutions, however, assume isotropic thin-shell behavior under proportional loading and do not account for material nonlinearity or temperature-dependent constitutive response. Modern design codes have adopted these formulations with empirical adjustments for internal pressure. However, as demonstrated by Jacimović [34], the stress intensification factors in ASME B31.1 may significantly underestimate the actual stresses in elbows. Moreover, these codes do not explicitly address the combined effect of thermal contraction-induced secondary stresses and internal pressure on stress redistribution in elbows, nor do they provide guidance for predicting the shift of peak stress location under cryogenic thermal loading. The central feature governing elastic elbow response is cross-sectional ovalization. While this phenomenon has been extensively characterized under isothermal mechanical loading [35,36,37], its interaction with thermally induced bending moments—resulting from constrained thermal contraction in cryogenic pipelines—has received limited attention. Karamanos and Houliara [38,39] conducted systematic numerical and experimental investigations on elbows under combined internal pressure and in-plane bending, demonstrating that internal pressure suppresses ovalization through stress stiffening and alters the circumferential stress distribution around the cross-section. Crucially, their work did not address cryogenic temperature effects, leaving open the question of whether similar stress migration patterns prevail when thermal contraction introduces additional bending moments competing with pressure-induced stiffening. On the numerical side, specialized pipe elements incorporating ovalization degrees of freedom [40,41] have enabled efficient simulation of elbow response within global pipeline models. However, such elements, based on classical shell kinematics and uniform material assumptions, may not adequately capture through-wall thermal gradients or local stress redistributions associated with temperature-dependent material properties. Recent research has expanded toward engineering complexities including thermal transients [42], corrosion defects [43], and local wall thinning [44,45].
Despite advances in understanding elbow behavior under mechanical loading and internal pressure, the coupled effect of cryogenic thermal contraction and internal pressure on stress redistribution in L-shaped configurations remains inadequately characterized. In particular, no quantitative relationship has been established between the relative dominance of thermal versus pressure loading and the resulting peak stress magnitude and location. Consequently, risk-based inspection planning and structural integrity assessment for L-shaped LNG pipelines lack a quantitative basis, as the critical damage location may migrate with operational conditions and cannot be reliably identified under existing design standards.
To address the aforementioned issues, this study focuses on a typical L-shaped pipeline in an LNG receiving terminal, with the 45° cross-section of the elbow identified as the critical monitoring plane. Finite element simulations are performed to systematically examine the stress redistribution behavior of the elbow cross-section under internal pressure, thermal loading, and their combined action. Particular attention is given to the distribution and evolution of hoop stress, axial stress, and von Mises equivalent stress, as well as cross-sectional ovalization. A response surface model is developed to predict the peak equivalent stress, and multinomial logistic regression is employed to construct decision boundaries that characterize the location of the peak stress as a function of temperature and internal pressure. Through this integrated approach, predictive models for the magnitude and location of the peak stress are established, providing a quantitative tool for prioritizing inspection points and estimating failure probability in L-shaped LNG pipelines under operational thermal-pressure conditions.
2. Methods
2.1. Model
2.1.1. Geometry Model
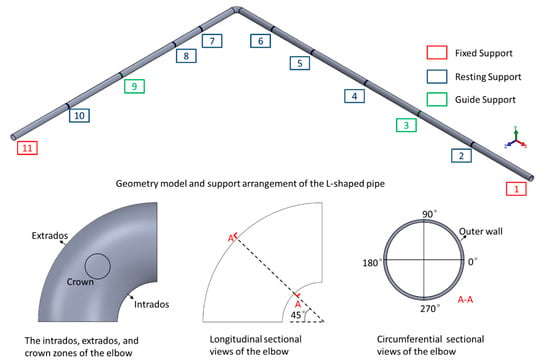
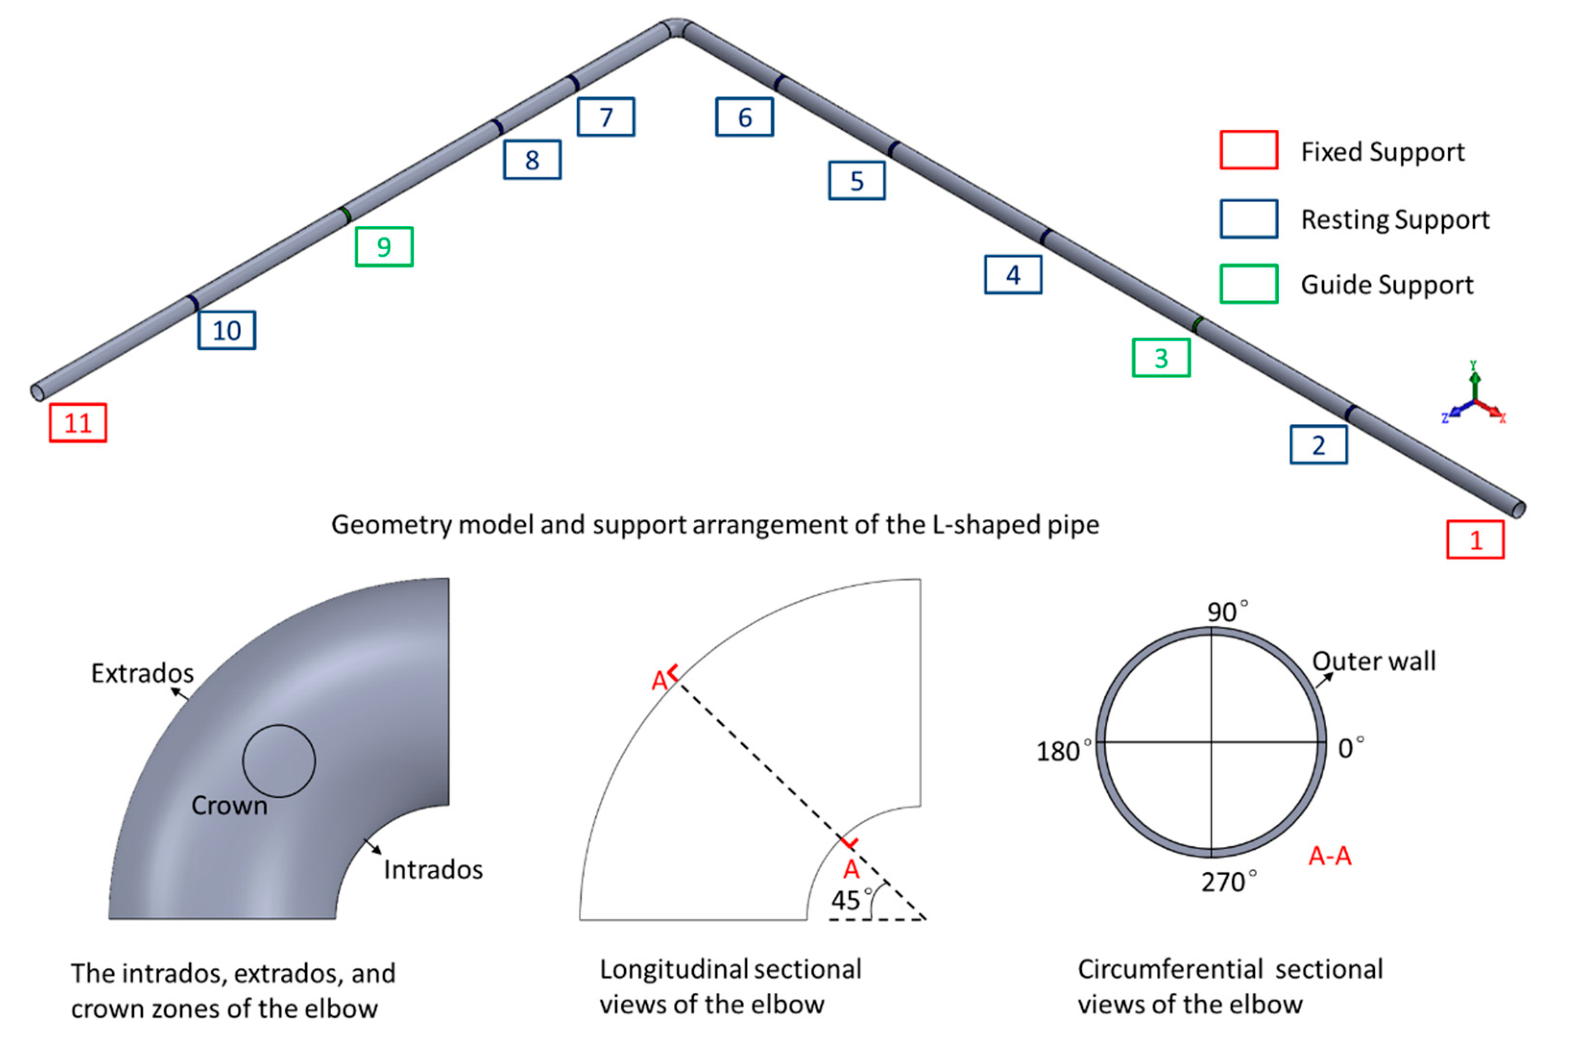
The geometry of the selected L-shaped pipeline unit is shown in Figure 1. The pipeline is subjected to an installation temperature of 22 °C and an operating temperature of −162 °C, with geometric parameters as follows: outer diameter 1000 mm, wall thickness 10 mm, horizontal (X-direction) length 65,400 mm, vertical (Z-direction) length 49,400 mm, and centerline bend radius 1000 mm. The pipeline is supported by three types of restraints: fixed supports, guided supports, and sliding supports, with their coordinate positions listed in Table 1. The 45° cross-section of the elbow is selected as the critical monitoring plane. The circumferential angle is defined with 0° at the intrados, 90° at the top, 180° at the extrados, and 270° at the bottom of the elbow, as illustrated in Figure 2. Finite element simulations are conducted using ANSYS 2021 R2 to examine the stress response under three loading conditions including internal pressure alone, thermal loading alone, and combined thermal–pressure loading. In the simulations, large deflection is activated to account for geometric nonlinearity. The classical findings demonstrate that the 45° cross-section is where the peak stresses occur at the elbow under bending [46]; therefore, the analysis focuses on the distribution patterns of hoop stress, axial stress, and von Mises equivalent stress on the 45° elbow cross-section. Considering surface-breaking defects that threaten structural integrity typically initiate at the external surface, the outer wall at the 45° elbow cross-section is of particular concern.
Figure 1.
Geometric model of the L-shaped pipeline unit.
Table 1.
Support coordinates.
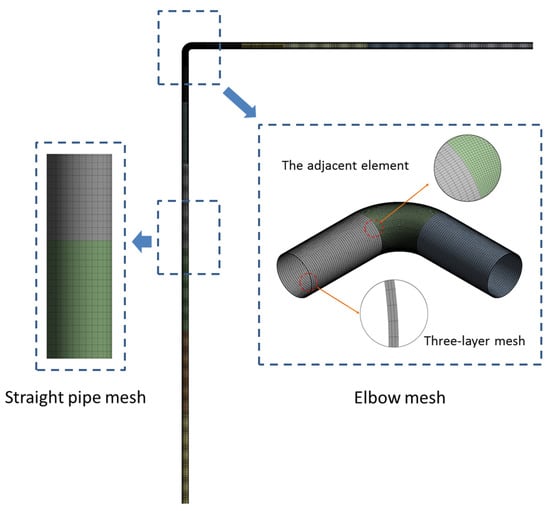
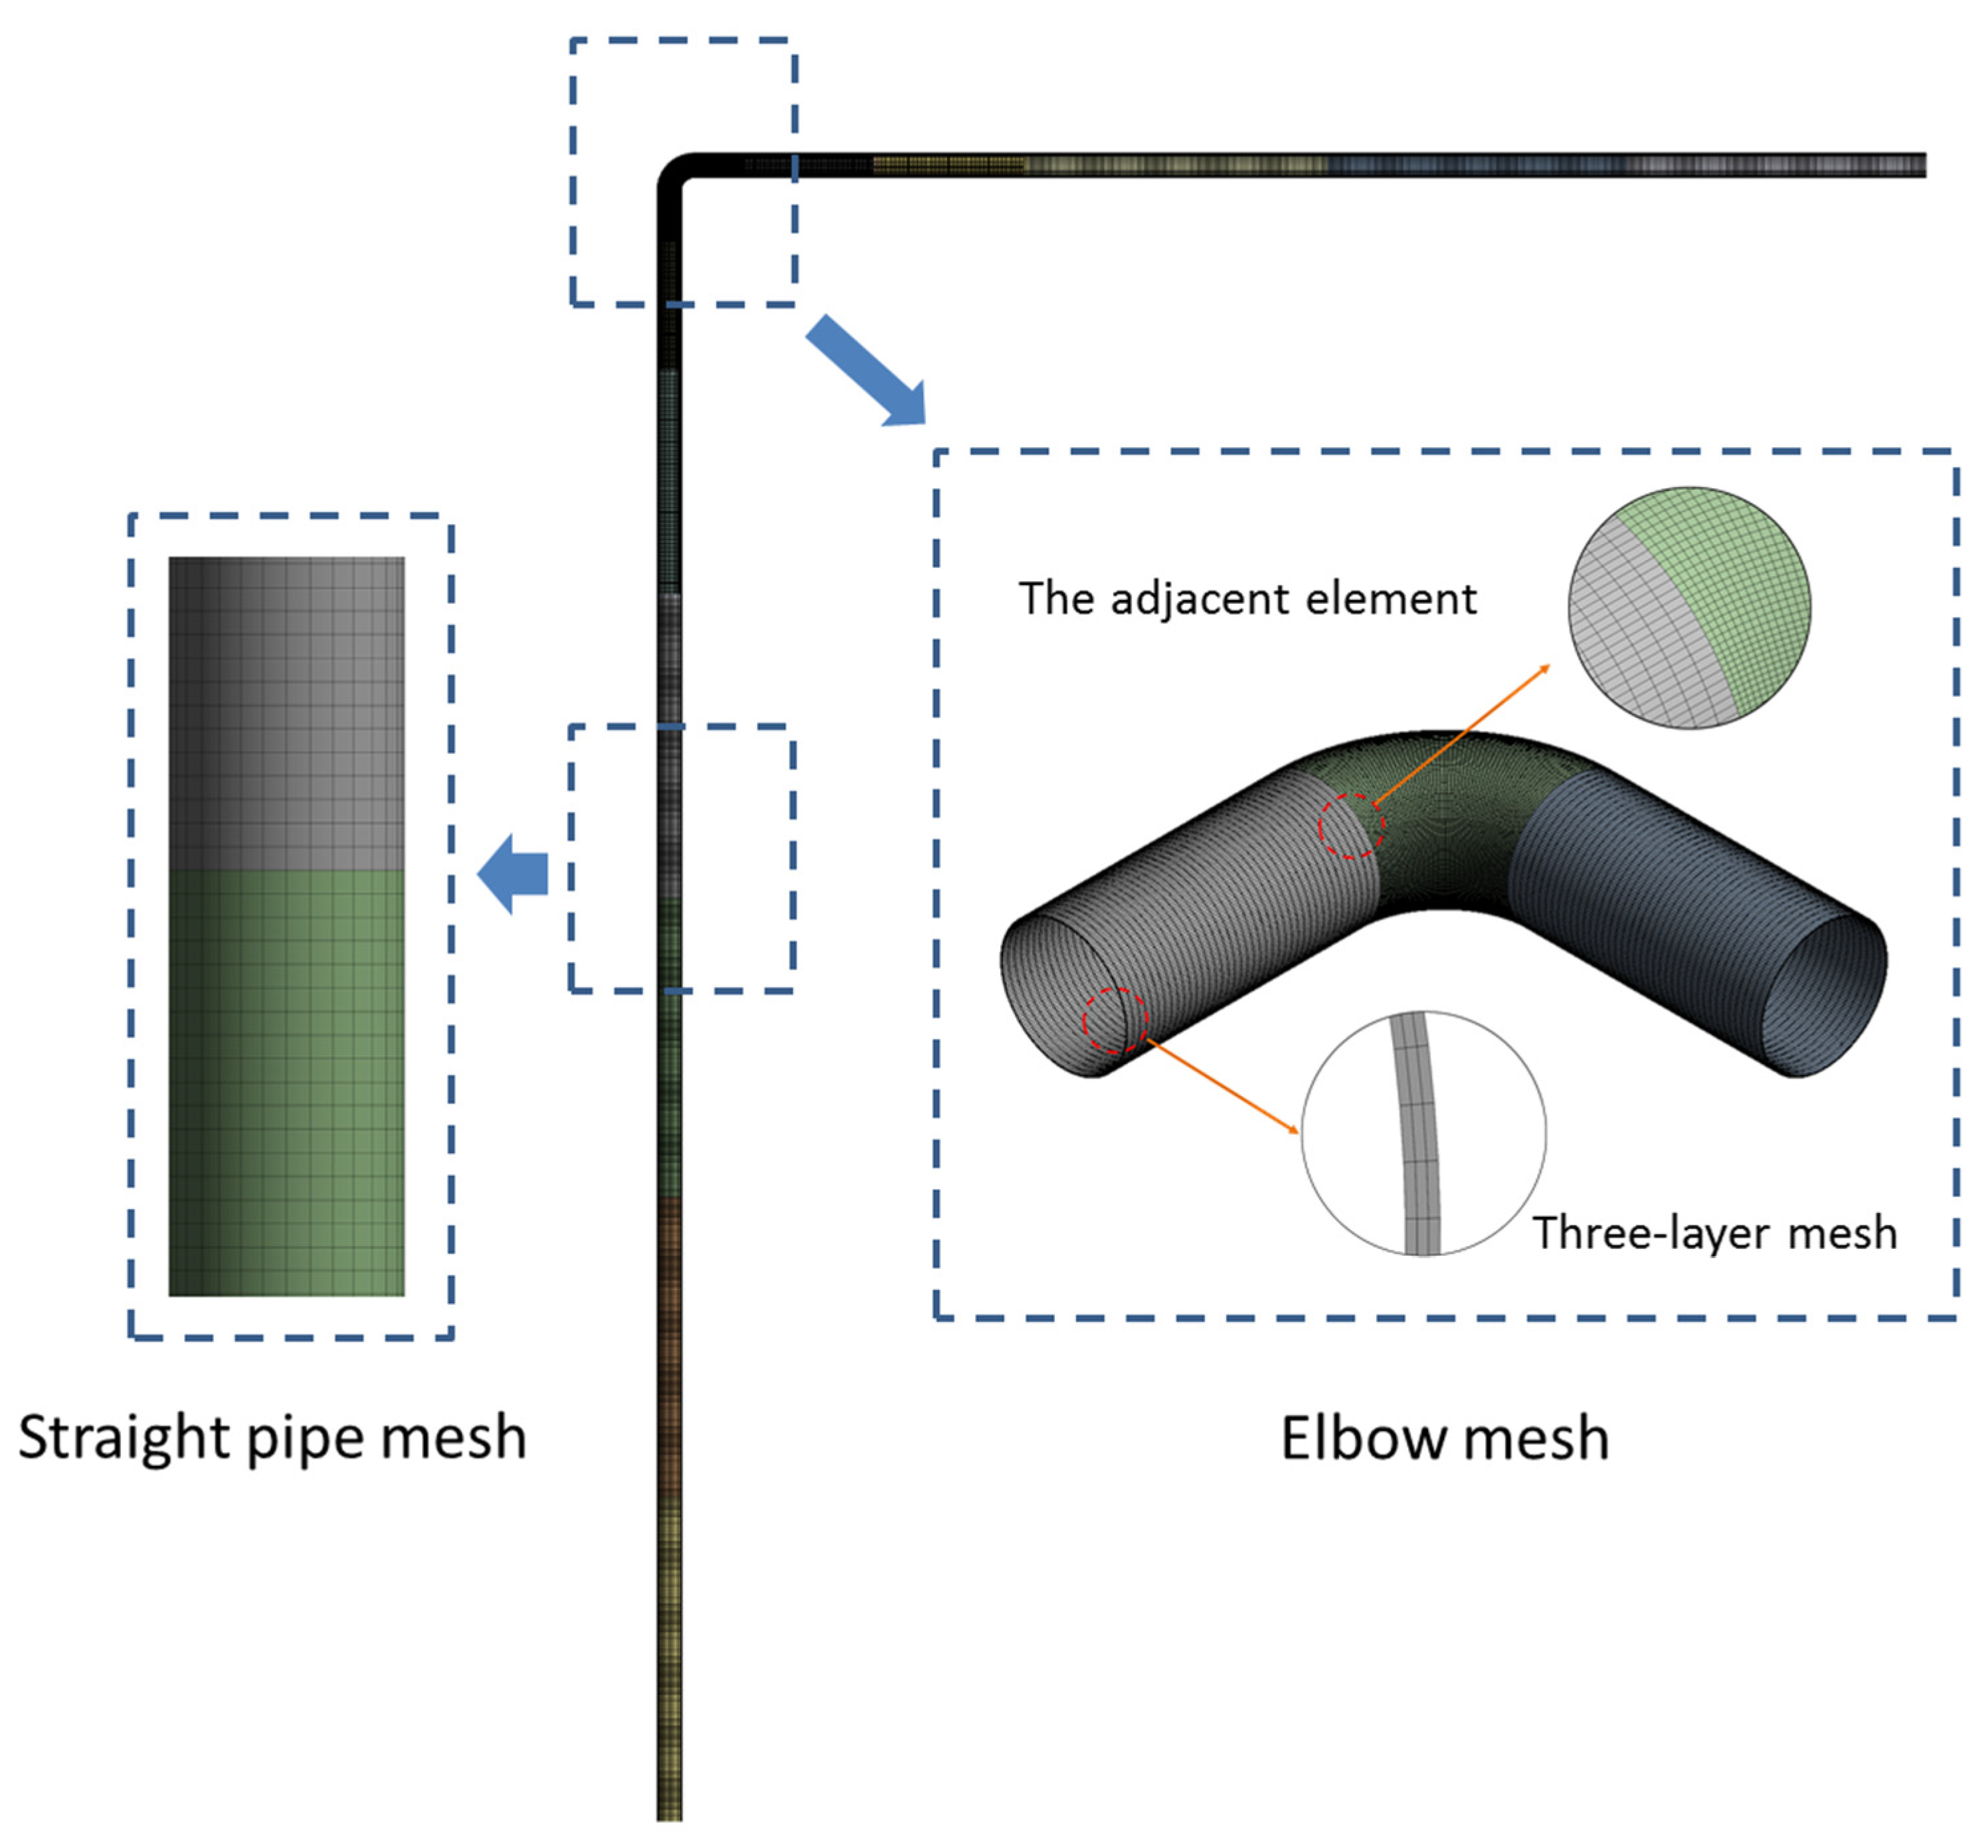
Figure 2.
Finite element mesh of the L-shaped pipeline.
2.1.2. Material Properties
All analyses are performed under the assumption of linear elasticity. The LNG pipeline is made of austenitic stainless steel. Its elastic modulus and coefficient of thermal expansion are temperature-dependent and are taken from ASME B31.3 [47], as listed in Table 2. For intermediate temperatures not explicitly listed in the table, linear interpolation was applied in ANSYS using the adjacent data points. Poisson’s ratio is set to 0.3 for all temperatures, and the density is 7980 kg/m3.
Table 2.
Temperature-dependent coefficient of linear thermal expansion and elastic modulus for austenitic stainless steel.
2.1.3. Boundary and Loading Conditions
Based on the support types defined in the geometry model, the corresponding boundary conditions are applied in the finite element model. Sliding supports restrain only the vertical translational degree of freedom (UY = 0), permitting upward movement while preventing downward displacement. Guide supports constrain both vertical and lateral translations, with boundary conditions UX = 0 and UY = 0. Fixed supports, located at both ends of the pipeline, fully restrain all translational degrees of freedom (UX = UY = UZ = 0).
The loads applied to the LNG pipeline include thermal loading and internal pressure. The thermal loading is imposed as a uniform temperature drop from the installation temperature of 22 °C to the cryogenic operating temperature, with no through-wall temperature gradient. Internal pressure acts as a uniform normal load on the inner wall and remains constant during thermal loading. A comparative analysis showed that the combined weight of the pipe, insulation layer, and LNG medium (or vaporized medium at higher temperatures) contributes less than 2% of the thermal-induced stress. Gravity is therefore not considered in the analysis. A sequential thermal–structural coupling analysis is performed. The temperature field is first computed and then imported as a predefined field into the subsequent static structural analysis, where it is combined with internal pressure.
2.1.4. Mesh and Independence Verification
The L-shaped pipeline finite element model is meshed using hexahedral elements with three layers through the wall thickness, as shown in Figure 2. In the elbow region, where stress concentration is expected, the mesh is locally refined with limiting the maximum element size ratio between adjacent elements not exceeding 2:1 to ensure mesh quality. To verify mesh independence, three mesh densities including coarse, medium, and fine were examined under identical loading conditions, with the maximum von Mises equivalent stress at the elbow taken as the convergence criterion. As shown in Table 3, the stress difference between the coarse and medium meshes is 2.2%; further refinement to the fine mesh changes this value by only 0.1%, indicating convergence.
Table 3.
Mesh independence verification results of the finite element model.
2.1.5. Validation of the Numerical Model
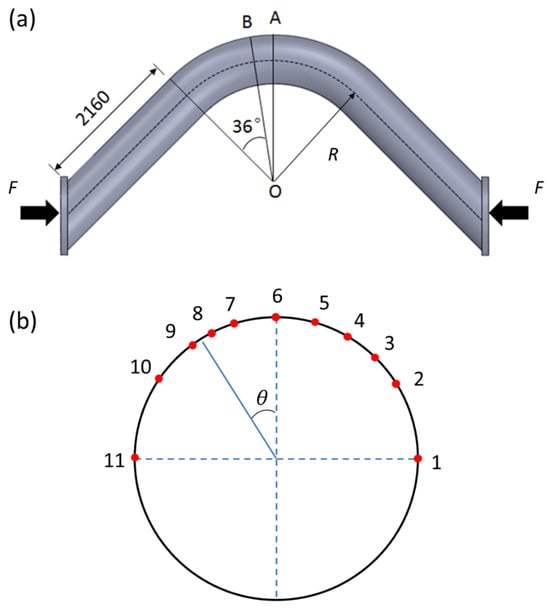
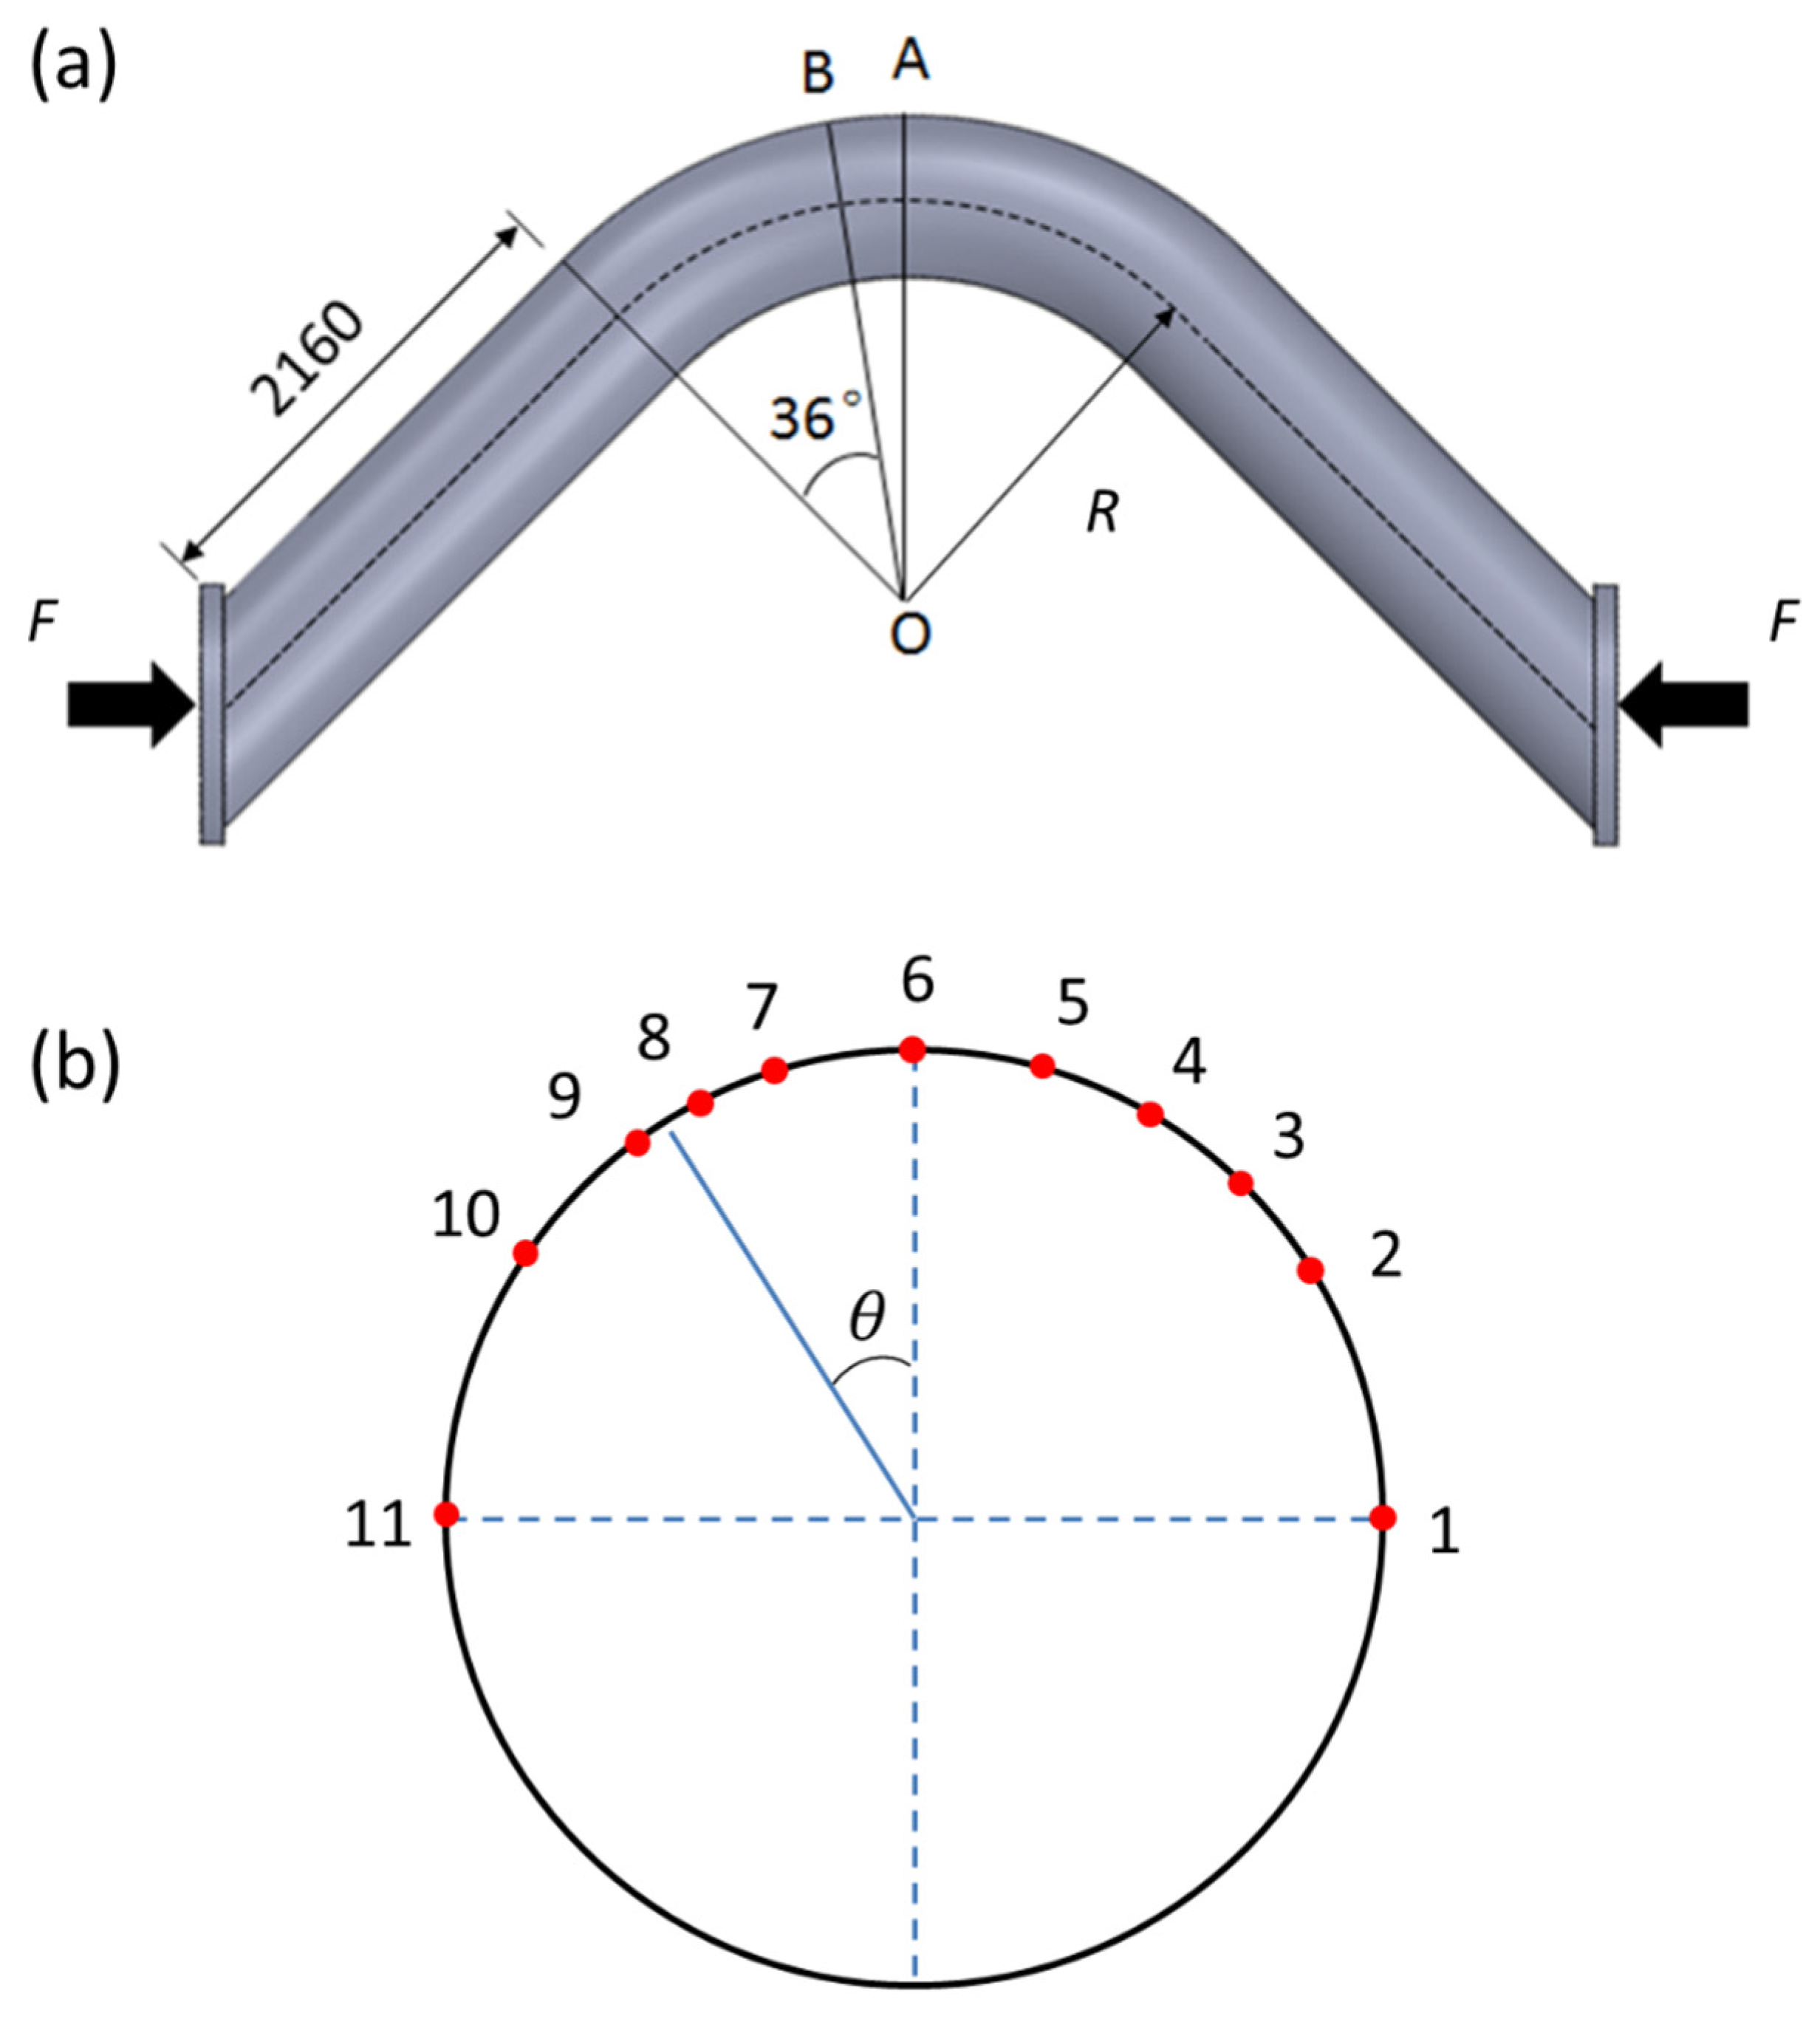
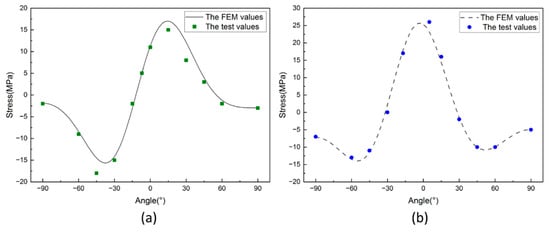
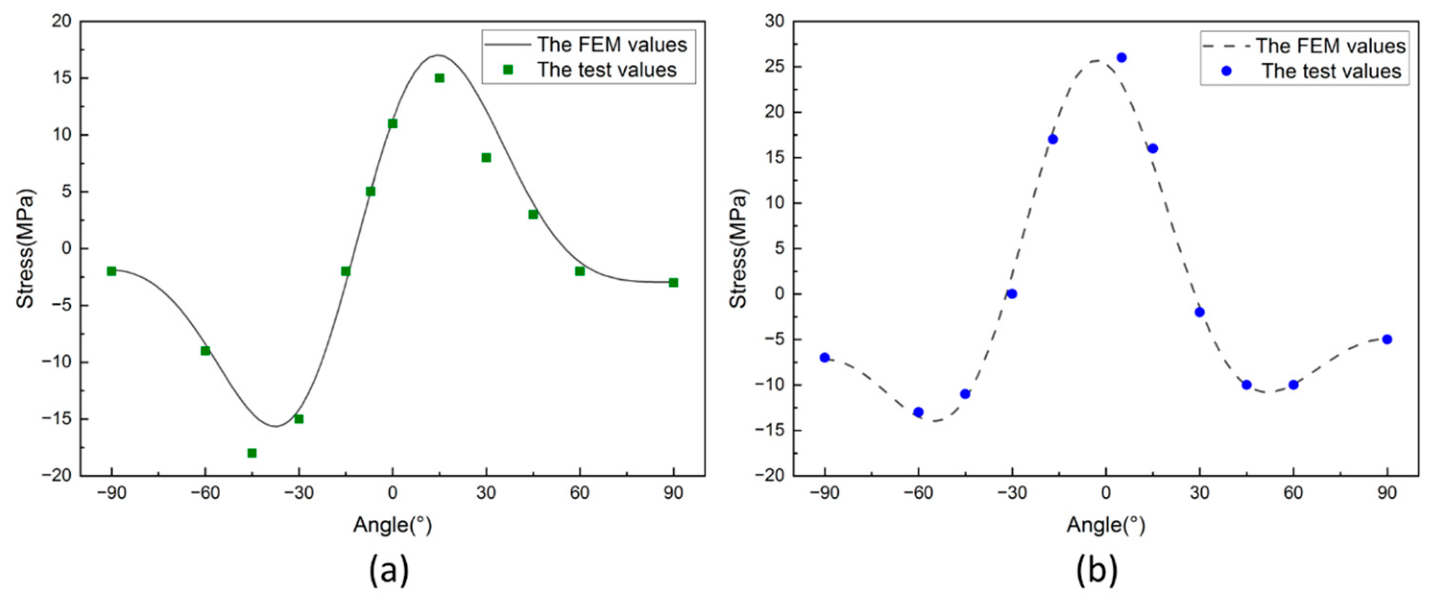
To validate the numerical model, a verification model was established based on the experimental setup of a large-diameter 90° elbow shown in Figure 3 [48]. The experimental pipe has an outer diameter of d = 720 mm, wall thickness t = 11.8 mm, bend radius R = 1800 mm, elastic modulus of 206 GPa, and Poisson’s ratio of 0.3. The elbow was meshed with 180 elements circumferentially and 60 elements axially. Force-controlled loading was applied to match the experimental procedure. The experimental and simulated results at Section B are compared in Figure 4. At an applied load of F = 9.81 kN, the computed hoop and axial stresses at Section B are in reasonable agreement with the experimental data, which provides supporting evidence for the reliability of the present modeling approach within the validated range.
Figure 3.
The experimental model (a) and cross-section B measuring point layout (b).
Figure 4.
Comparison of computed and experimental stresses at Section B: (a) axial stress, (b) hoop stress.
2.1.6. Justification for the Critical Cross-Section
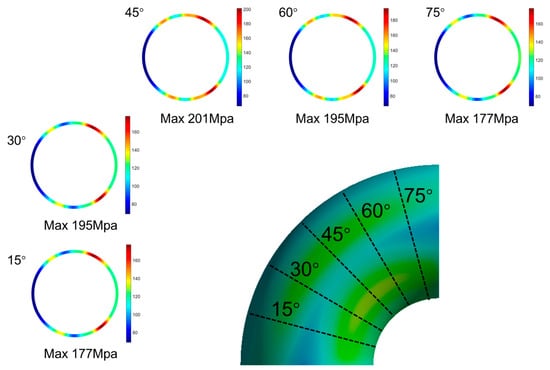
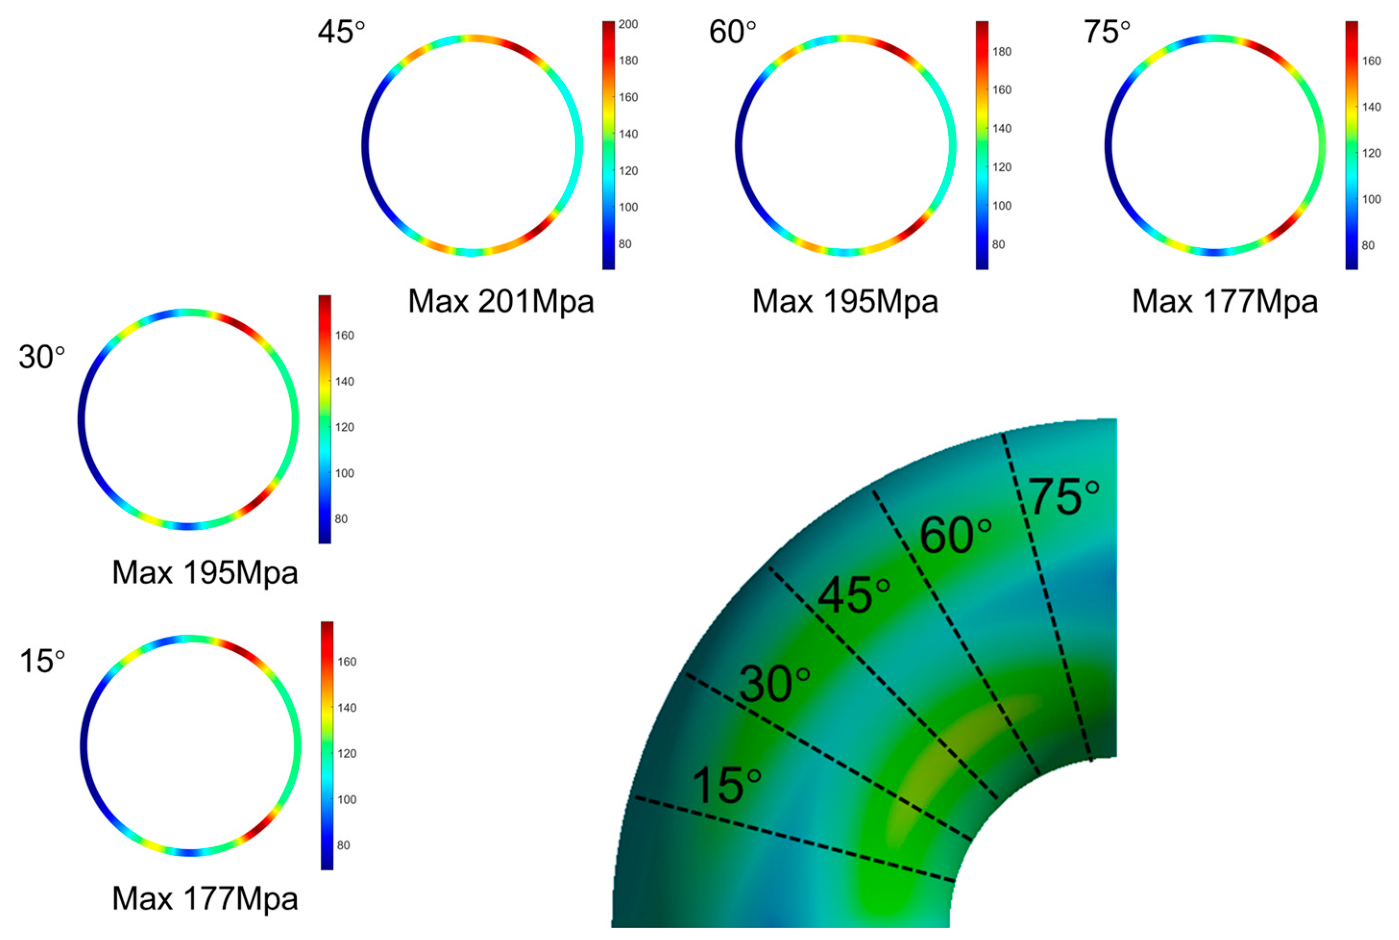
Figure 5 presents the von Mises stress distribution on the outer wall at different cross-sections of the elbow under combined loading at −165 °C and 1.6 MPa. The stress distribution along the elbow arc is approximately symmetric about the 45° cross-section and reaches its maximum at this section. It should be noted that the two arms of the L-shaped pipeline in this study are unequal in length, which would theoretically preclude a perfectly symmetric stress distribution. The approximate symmetry observed here indicates that the effect of unequal arm lengths on the stress distribution is small. The peak stress occurs at the 45° cross-section, consistent with the classical pipe bend theory that maximum ovalization and peak stresses under in-plane bending occur near the mid-arc of the bend. Therefore, the selection of the 45° cross-section as the critical monitoring plane is justified.
Figure 5.
von Mises stress distribution on the outer wall at different cross-sections of the elbow under combined loading at −165 °C and 1.6 MPa.
2.2. Response Surface Methodology
Response Surface Methodology (RSM) is a statistical technique that combines experimental design with regression analysis to construct surrogate models. In this study, RSM is employed to establish a quantitative relationship between the operating conditions (temperature and internal pressure) and the resulting peak equivalent stress at the elbow, enabling prediction without exhaustive full-factorial simulations. The relationship is approximated by a second-order polynomial regression model [49]:
where y is the predicted response; xi and xj are the coded levels of the design variables; k is the total number of variables; β0 is the intercept; βi, βii, and βij are the coefficients of the linear, quadratic, and interaction terms, respectively; and ε is the random error.
To capture the synergistic effects of thermal and pressure loading on stress redistribution, temperature and internal pressure were selected as the two independent design variables. Temperature was varied from −165 °C to −15 °C, representing steady-state thermal conditions at which the pipeline is assumed to reach uniform temperature, covering typical steady-state cryogenic operation, shutdown and idle periods; internal pressure was varied from 0.6 MPa to 1.6 MPa, representing typical operating pressures in LNG receiving terminals. The maximum equivalent stress at the elbow was taken as the response variable. A face-centered central composite design (CCD) was adopted within the RSM framework, and 11 simulation cases were generated according to this design scheme, as listed in Table 4.
Table 4.
RSM-CCD experimental design matrix.
2.3. Multinomial Logistic Regression Classification
To predict the location of the peak equivalent stress at the elbow under varying temperature and internal pressure, a multinomial logistic regression (MLR) model was employed as a classifier. MLR extends binary logistic regression to problems with more than two categorical outcomes, where one category is designated as the reference (baseline) and the log-odds of the remaining categories relative to this baseline are modeled as linear functions of the predictors. The MLR model was constructed to predict the probability of each category based on temperature and internal pressure, as described by Equations (2)–(4) [50].
where represents the probability for outcome is logit function; is the input feature, and is the corresponding coefficient for the parameter of the model.
3. Results and Discussion
3.1. Deformation Under the Internal Pressure and Thermal Loading
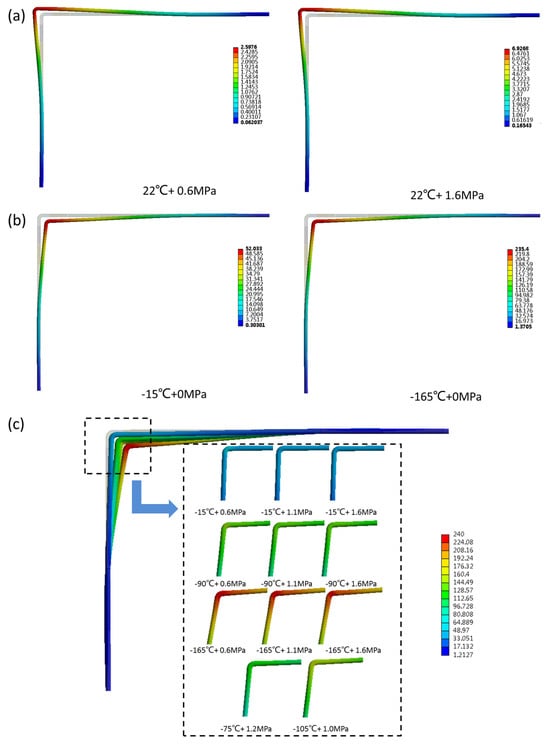
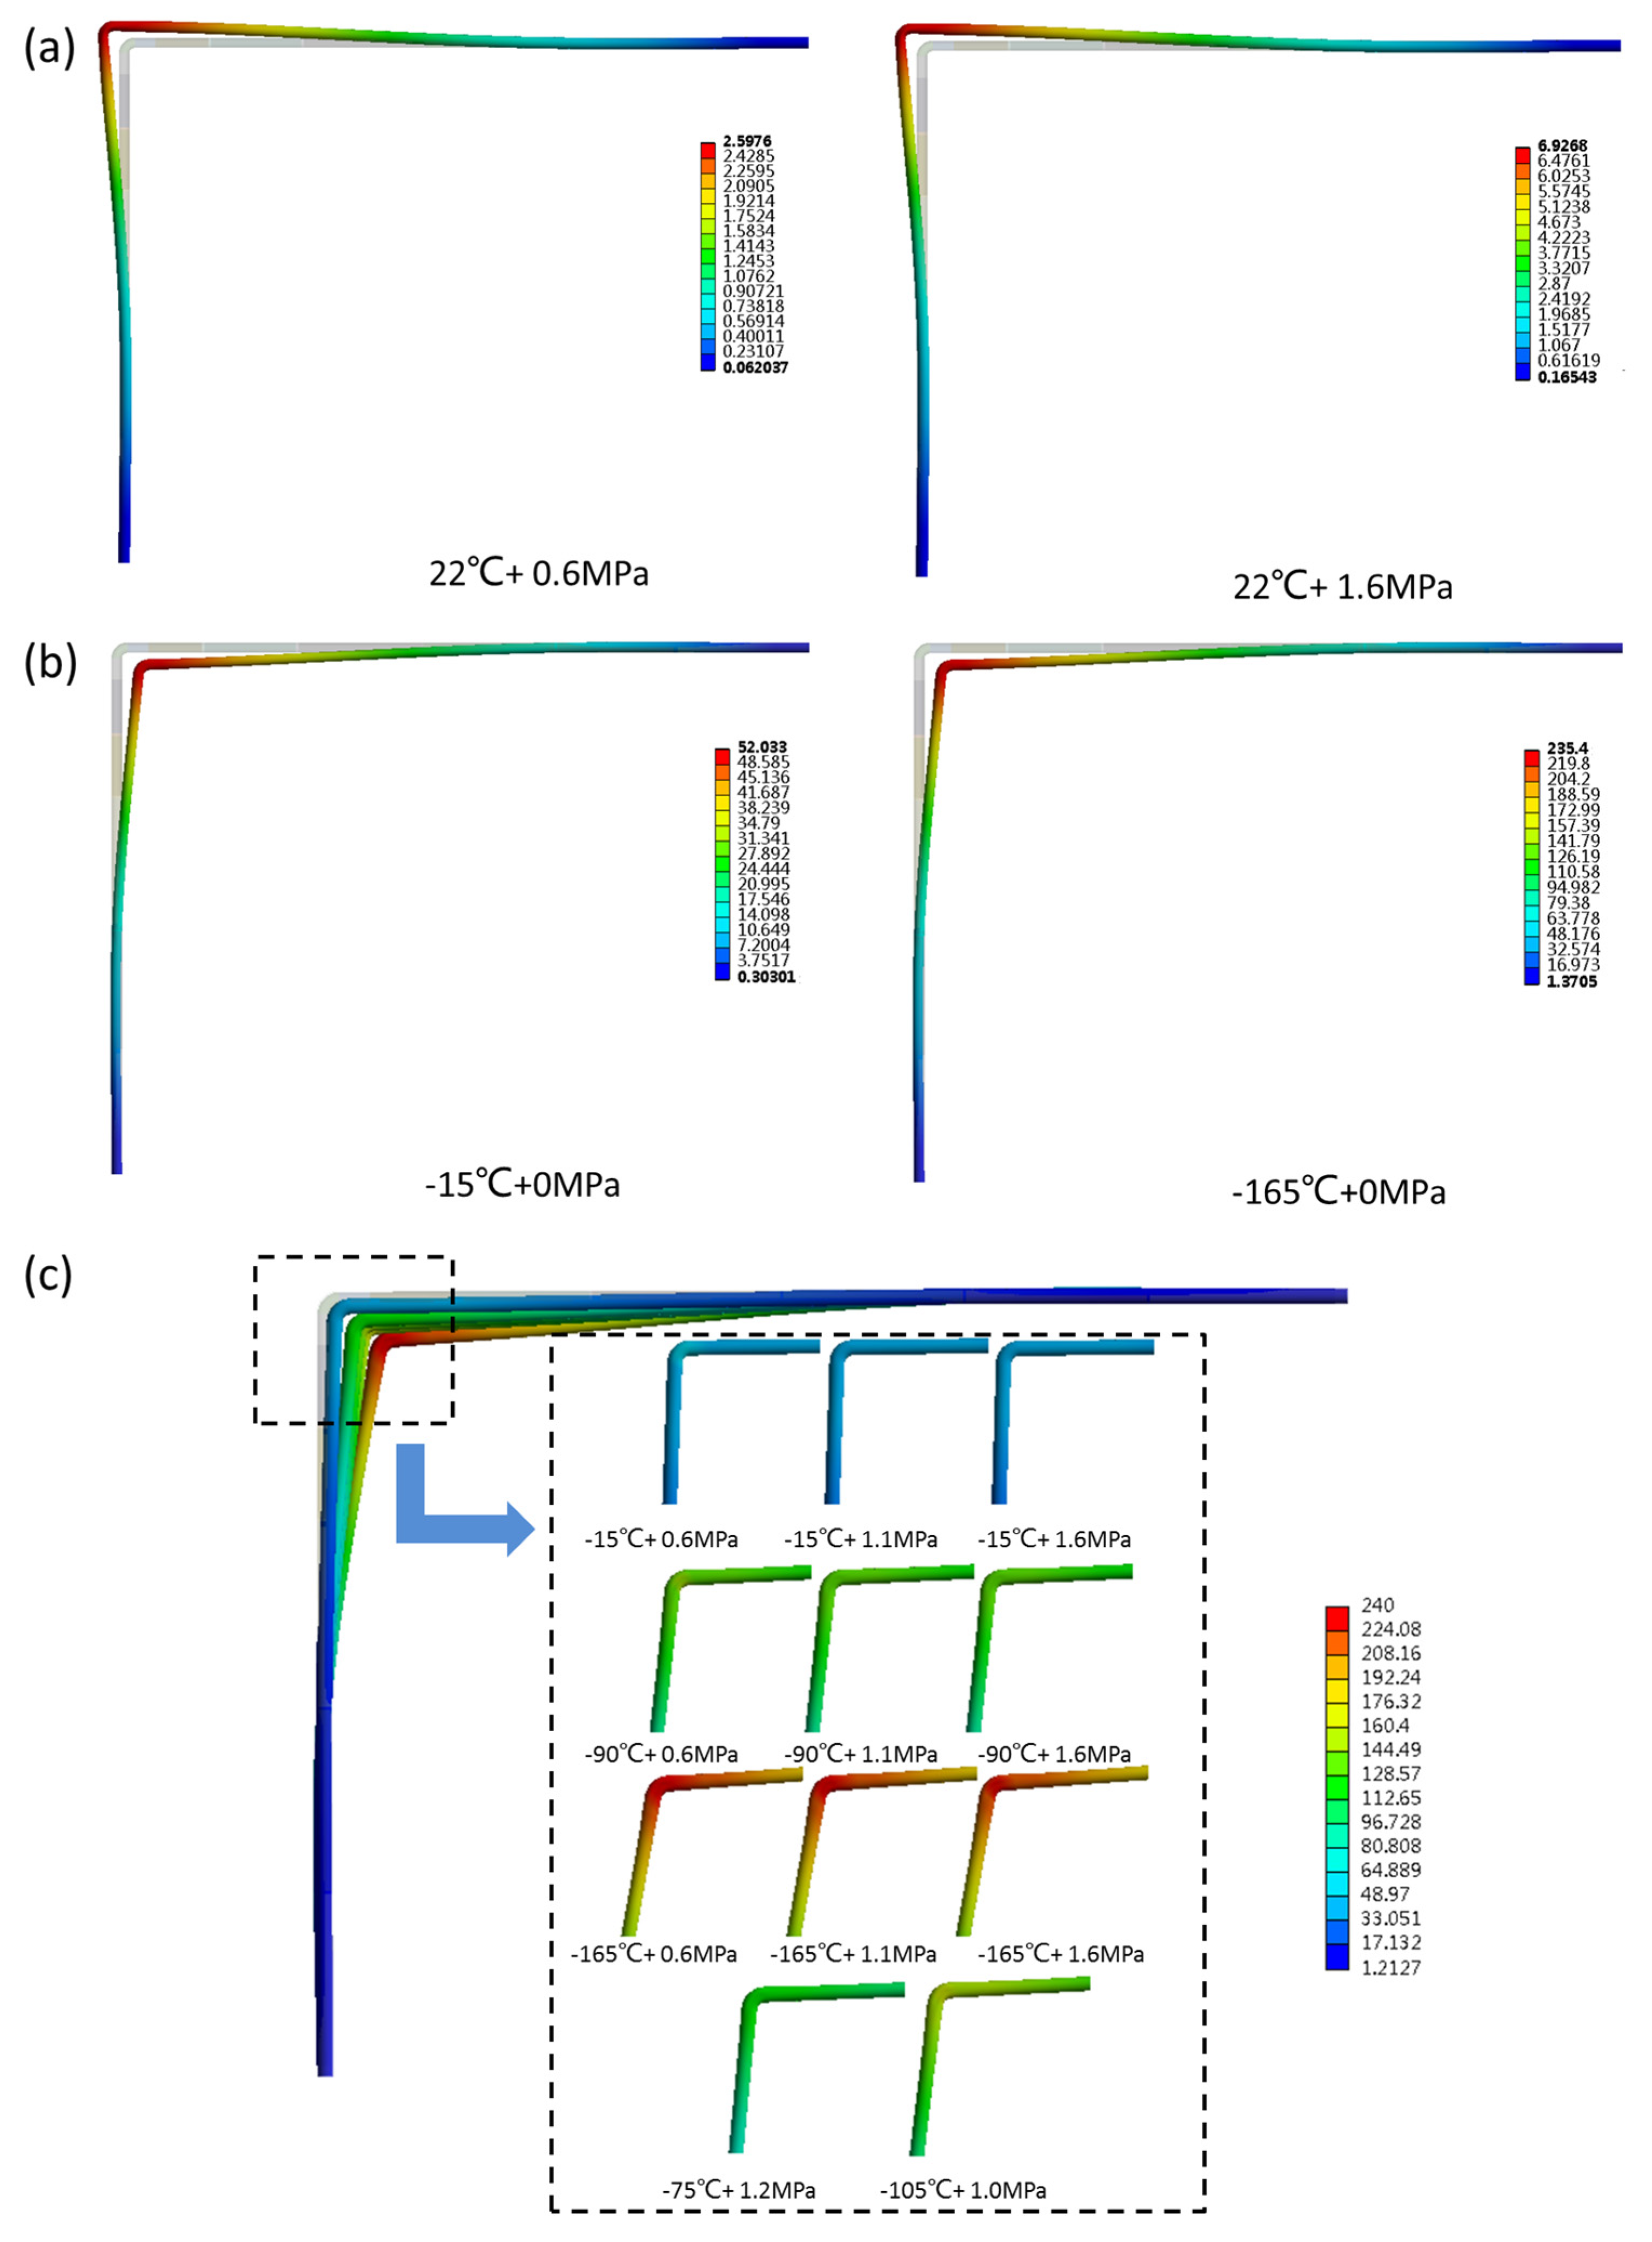
The deformations of the L-shaped pipeline under internal pressure alone, thermal loading alone, and their combined effect are presented in Figure 6, with two representative cases shown for each loading condition. Figure 6a shows the deformation contours at 22 °C under internal pressures of 0.6 MPa and 1.6 MPa. Under internal pressure alone, the elbow section undergoes closing bending, characterized by a decrease in both the elbow angle and the bend radius. For an isolated elbow with free ends, the pressure acting on the intrados and extrados of the elbow generates a net thrust, according to the Bourdon effect, tends to straighten the elbow—increasing the bend radius and producing an opening bending deformation [51]. In the present L-shaped piping system, however, the elbow is connected at both ends to long straight pipe sections whose ends are constrained by fixed and guide supports. When the elbow tends to open under internal pressure, the adjacent straight pipes cannot deform freely and thus exert restraining forces on the elbow. These restraining forces can be represented as an in-plane bending moment opposing the Bourdon opening moment, thereby forming a closing moment. Dominated by this closing moment, the elbow section ultimately exhibits closing bending. Figure 6b presents the deformation under an internal pressure of 0 MPa at −15 °C and −165 °C. Thermal loading alone induces opening bending in the elbow section. This occurs because the two arms of the L-shaped pipeline are of unequal length. The longer arm undergoing greater thermal contraction during cooling than the shorter arm, leading to a mismatch in contraction displacements between the two arms. The contraction of the longer arm is resisted by the shorter arm through the elbow connection, generating a bending moment that increases the elbow angle, equivalent to an applied opening moment.
Figure 6.
Deformation of the L-shaped pipeline under internal pressure (a), thermal loading (b), and their combined effects (c).
Figure 6c illustrates the deformation under combined internal pressure and thermal loading. Although internal pressure alone induces closing bending and thermal loading alone induces opening bending, their combined action results in net opening bending. This indicates that thermal contraction dominates the deformation direction: the opening moment generated by thermal contraction overcomes the closing moment induced by internal pressure, causing the elbow to open.
3.2. Stress Distribution Under the Effects of the Internal Pressure and Thermal Loading
3.2.1. Stress Distribution Under Internal Pressure
To isolate the effect of internal pressure on the stress distribution at the elbow cross-section, finite element simulations were conducted on the L-shaped pipeline at a constant temperature of 22 °C under varying internal pressure levels. The pressures considered were 0.6, 0.8, 1.0, 1.2, 1.4, and 1.6 MPa, covering the operational range of LNG pipelines from low-pressure precooling to near the design pressure limit.
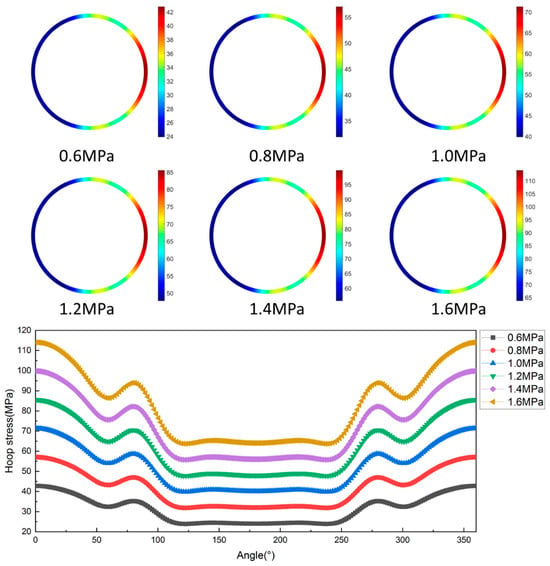
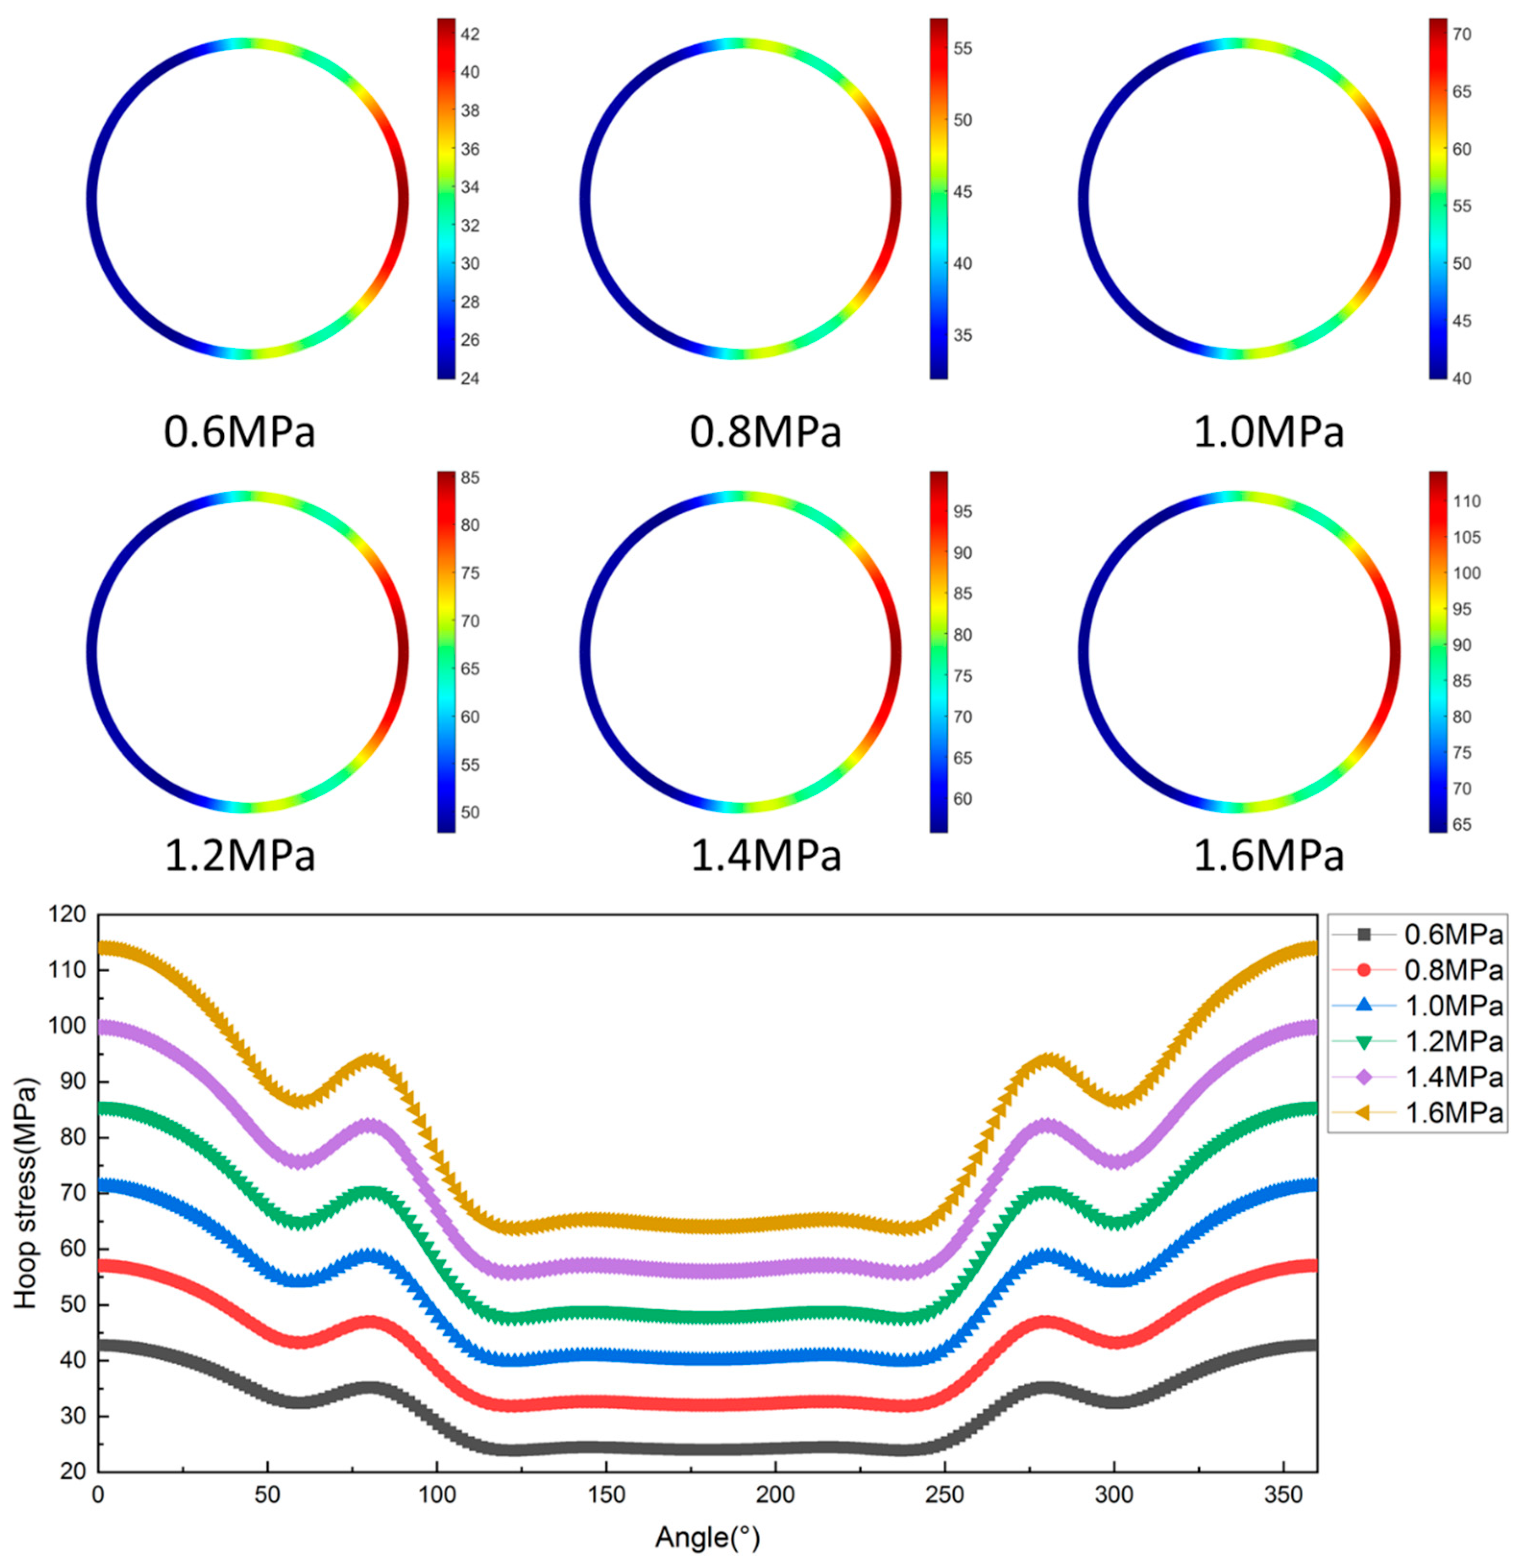
Figure 7 presents the hoop stress distribution on the outer wall of the 45° cross-section under different internal pressures. Under internal pressure alone, all hoop stresses at this cross-section are tensile, with the maximum at the intrados and the minimum at the extrados. Internal pressure induces hoop membrane stress in the elbow, the magnitude of which depends on the local curvature radius, such that a smaller radius produces a larger membrane stress. Since the curvature radius at the intrados is smaller than that at the extrados, the hoop membrane stress at the intrados is higher, making this the primary reason why the maximum hoop stress occurs at the intrados.
Figure 7.
Hoop stress distribution on the outer wall of the 45° cross-section under different internal pressure levels.
Beyond the membrane stress, ovalization-induced hoop stresses also contribute to the final distribution. Under closing bending, the cross-section ovalizes with its short axis within the bending plane and the long axis perpendicular to it. This deformation generates additional tensile stress at the extrados and compressive stress at the intrados, which tends to increase the hoop stress at the extrados while reducing it at the intrados. After superposition of the membrane and ovalization-induced components, however, the hoop stress at the intrados remains higher than that at the extrados, indicating that the curvature effect of membrane stress governs the overall hoop stress distribution. As internal pressure increases, the hoop stress rises in an approximately linear manner, while the locations of the maximum and minimum stresses remain fixed at the intrados and extrados, respectively, with no observable shift.
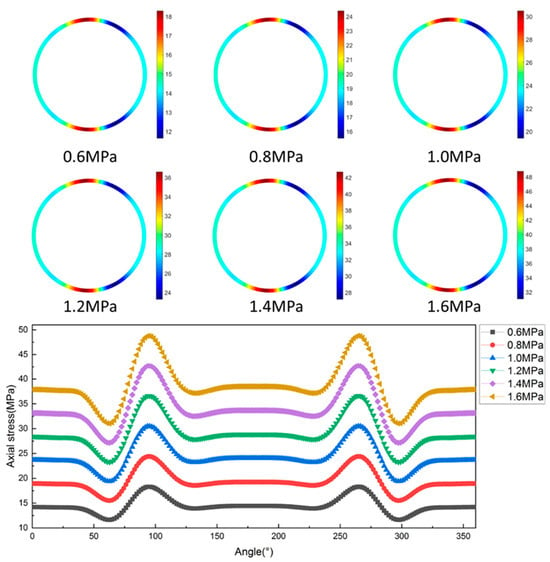
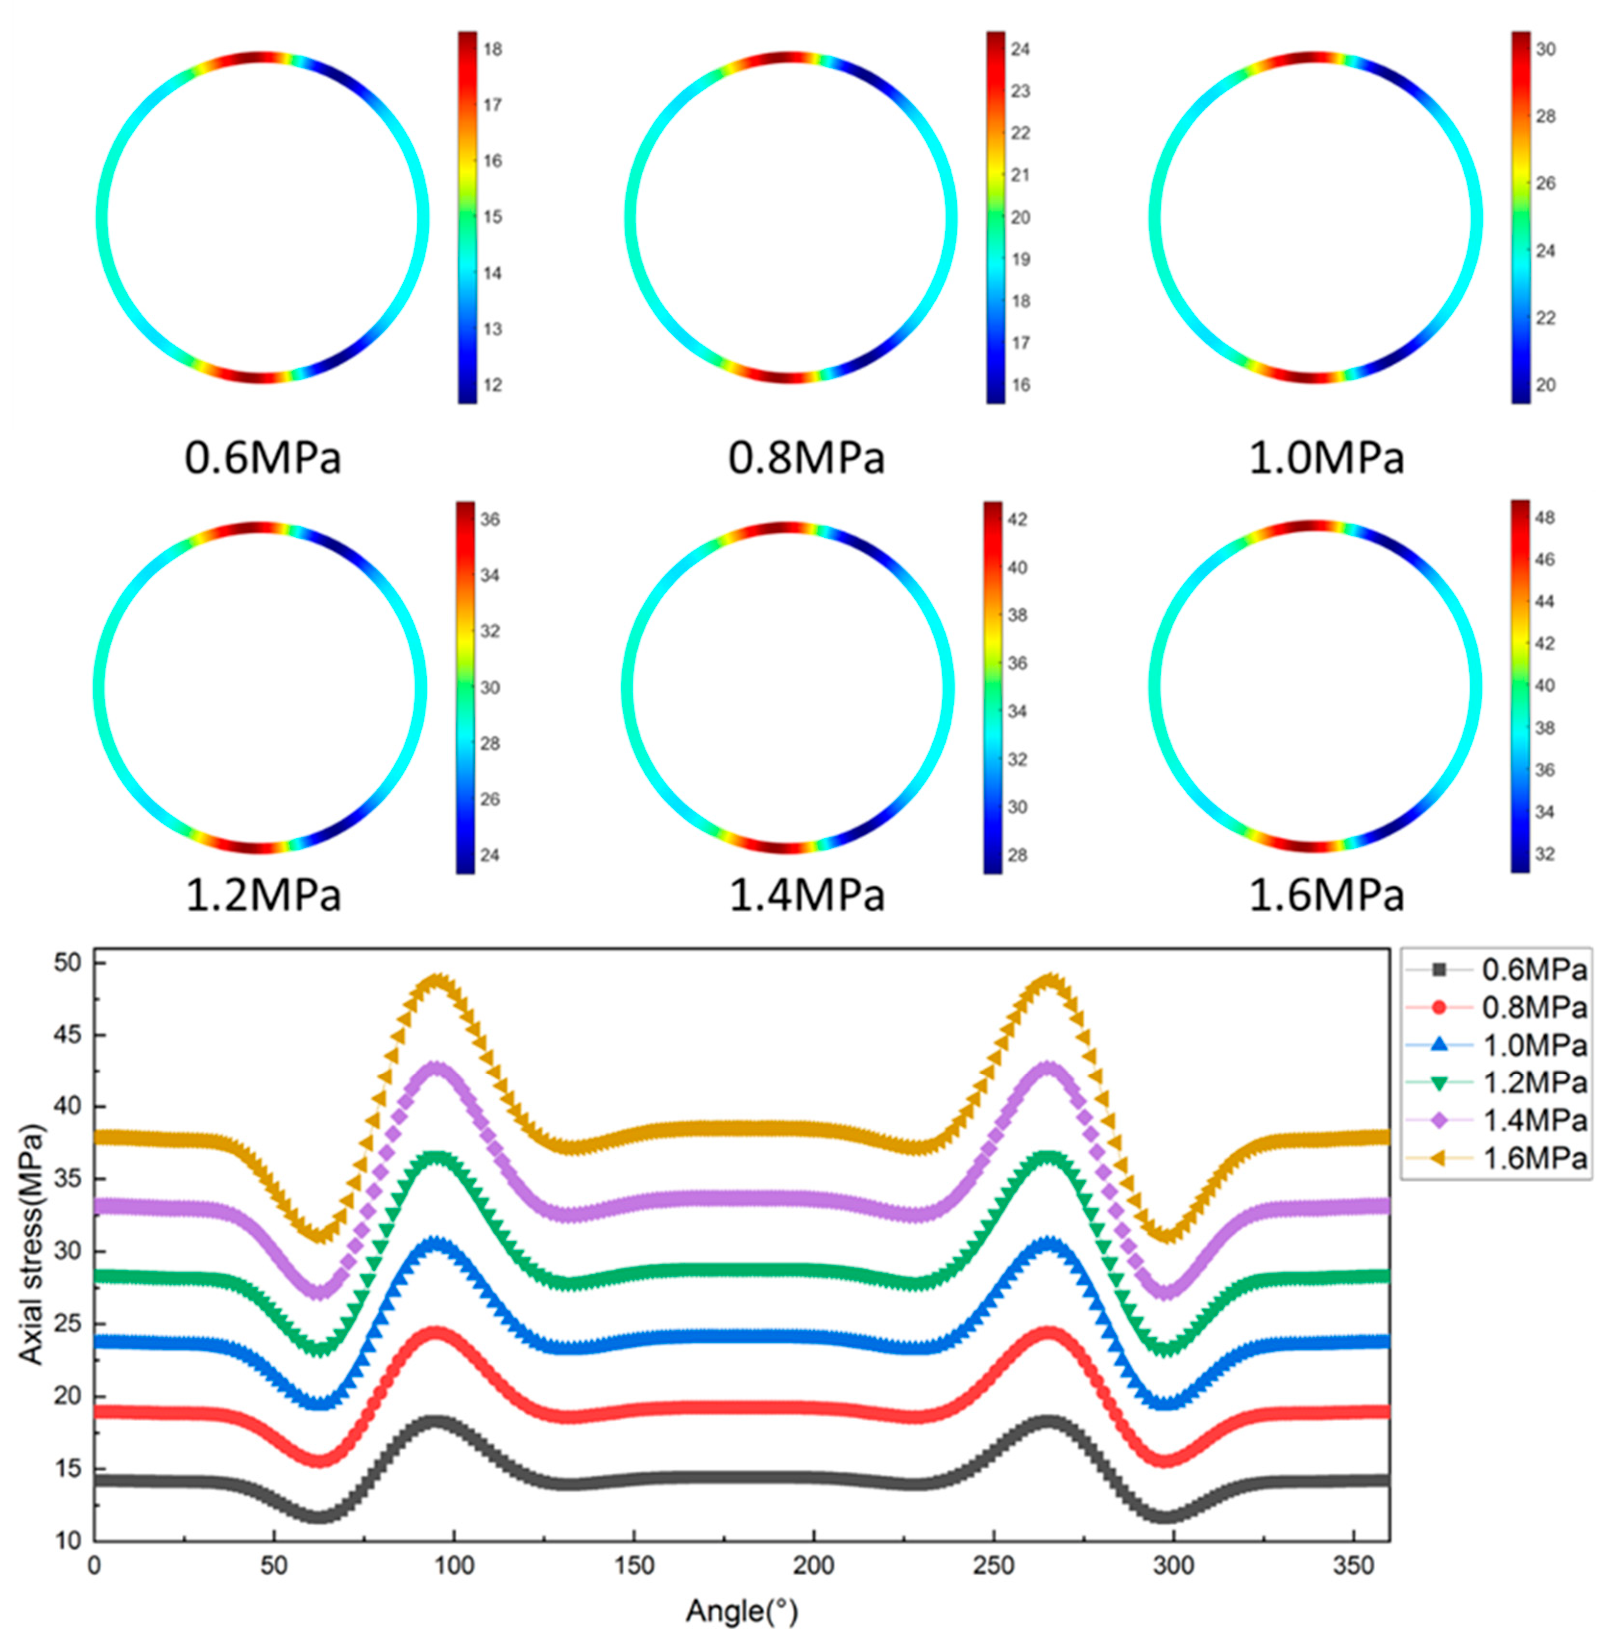
Figure 8 presents the axial stress distribution on the outer wall of the 45° cross-section under different internal pressures. Under internal pressure alone, all axial stresses at this cross-section are tensile. Unlike the hoop stress, however, the axial stress exhibits a more complex distribution that varies periodically along the circumference. The minima occur in the top and bottom regions near the intrados, whereas the maxima appear in the top and bottom regions near the extrados. The axial stress magnitude increases with internal pressure, yet the locations of the extrema remain essentially unchanged.
Figure 8.
Axial stress distribution on the outer wall of the 45° cross-section under different internal pressure levels.
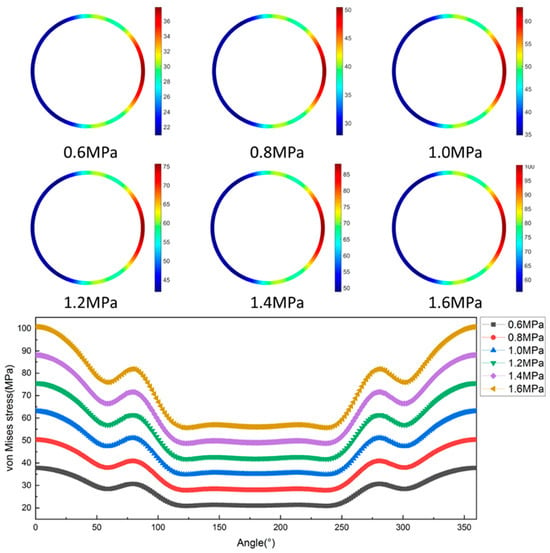
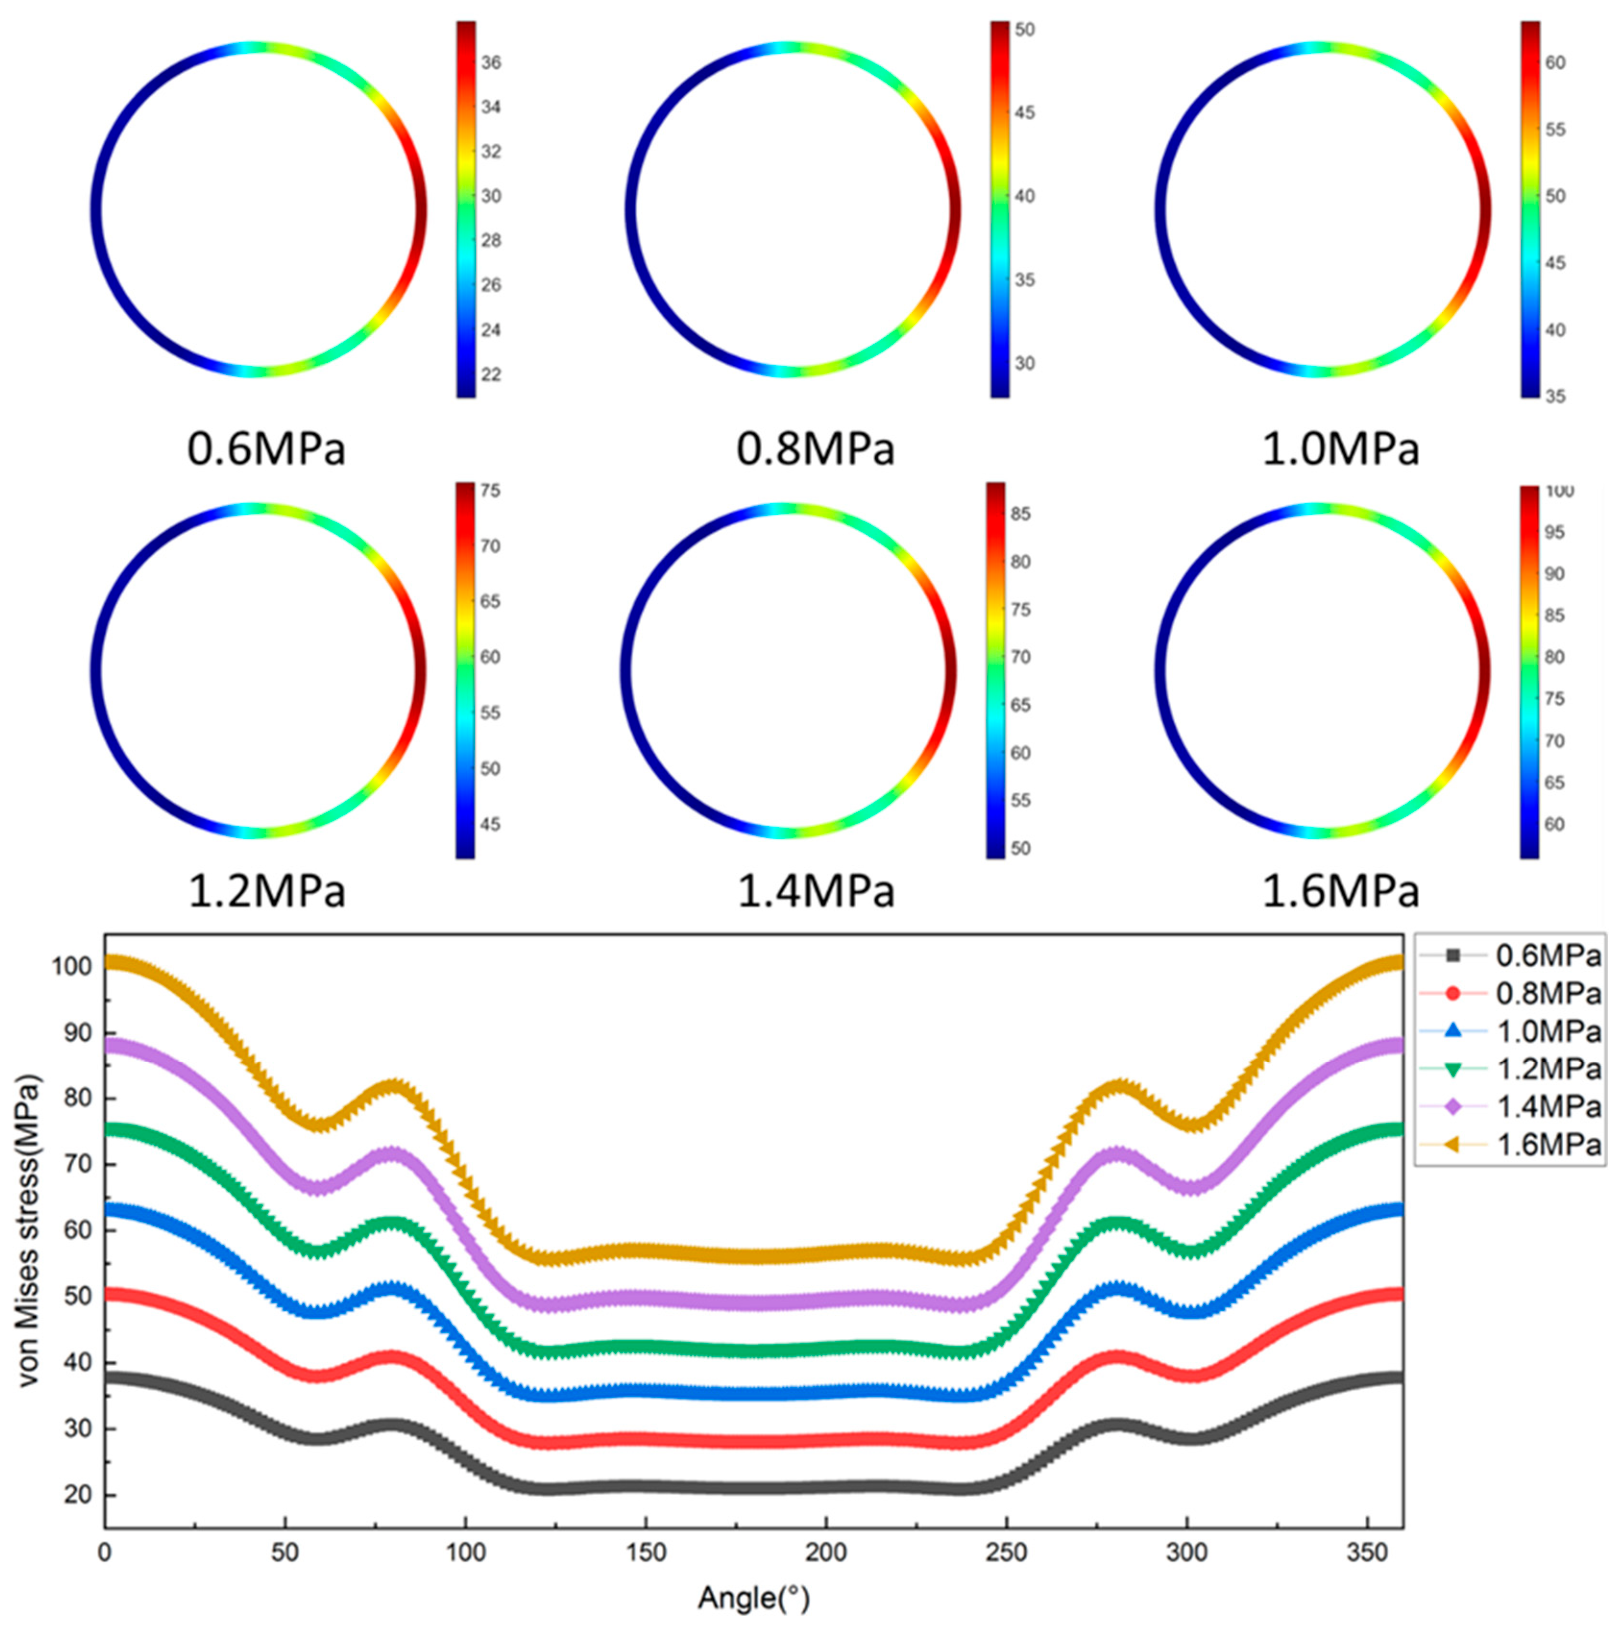
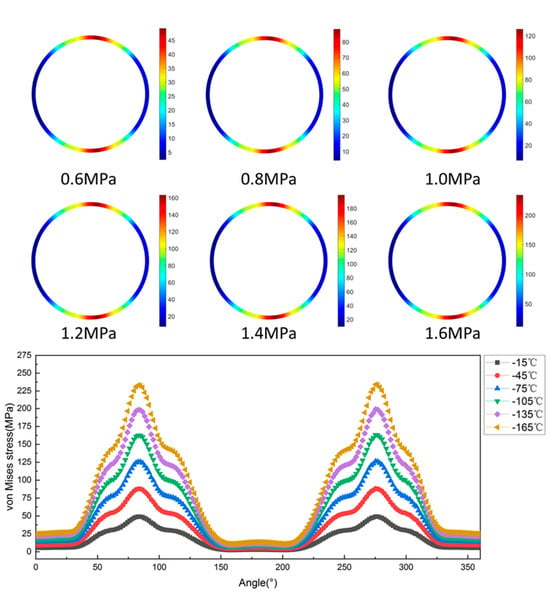
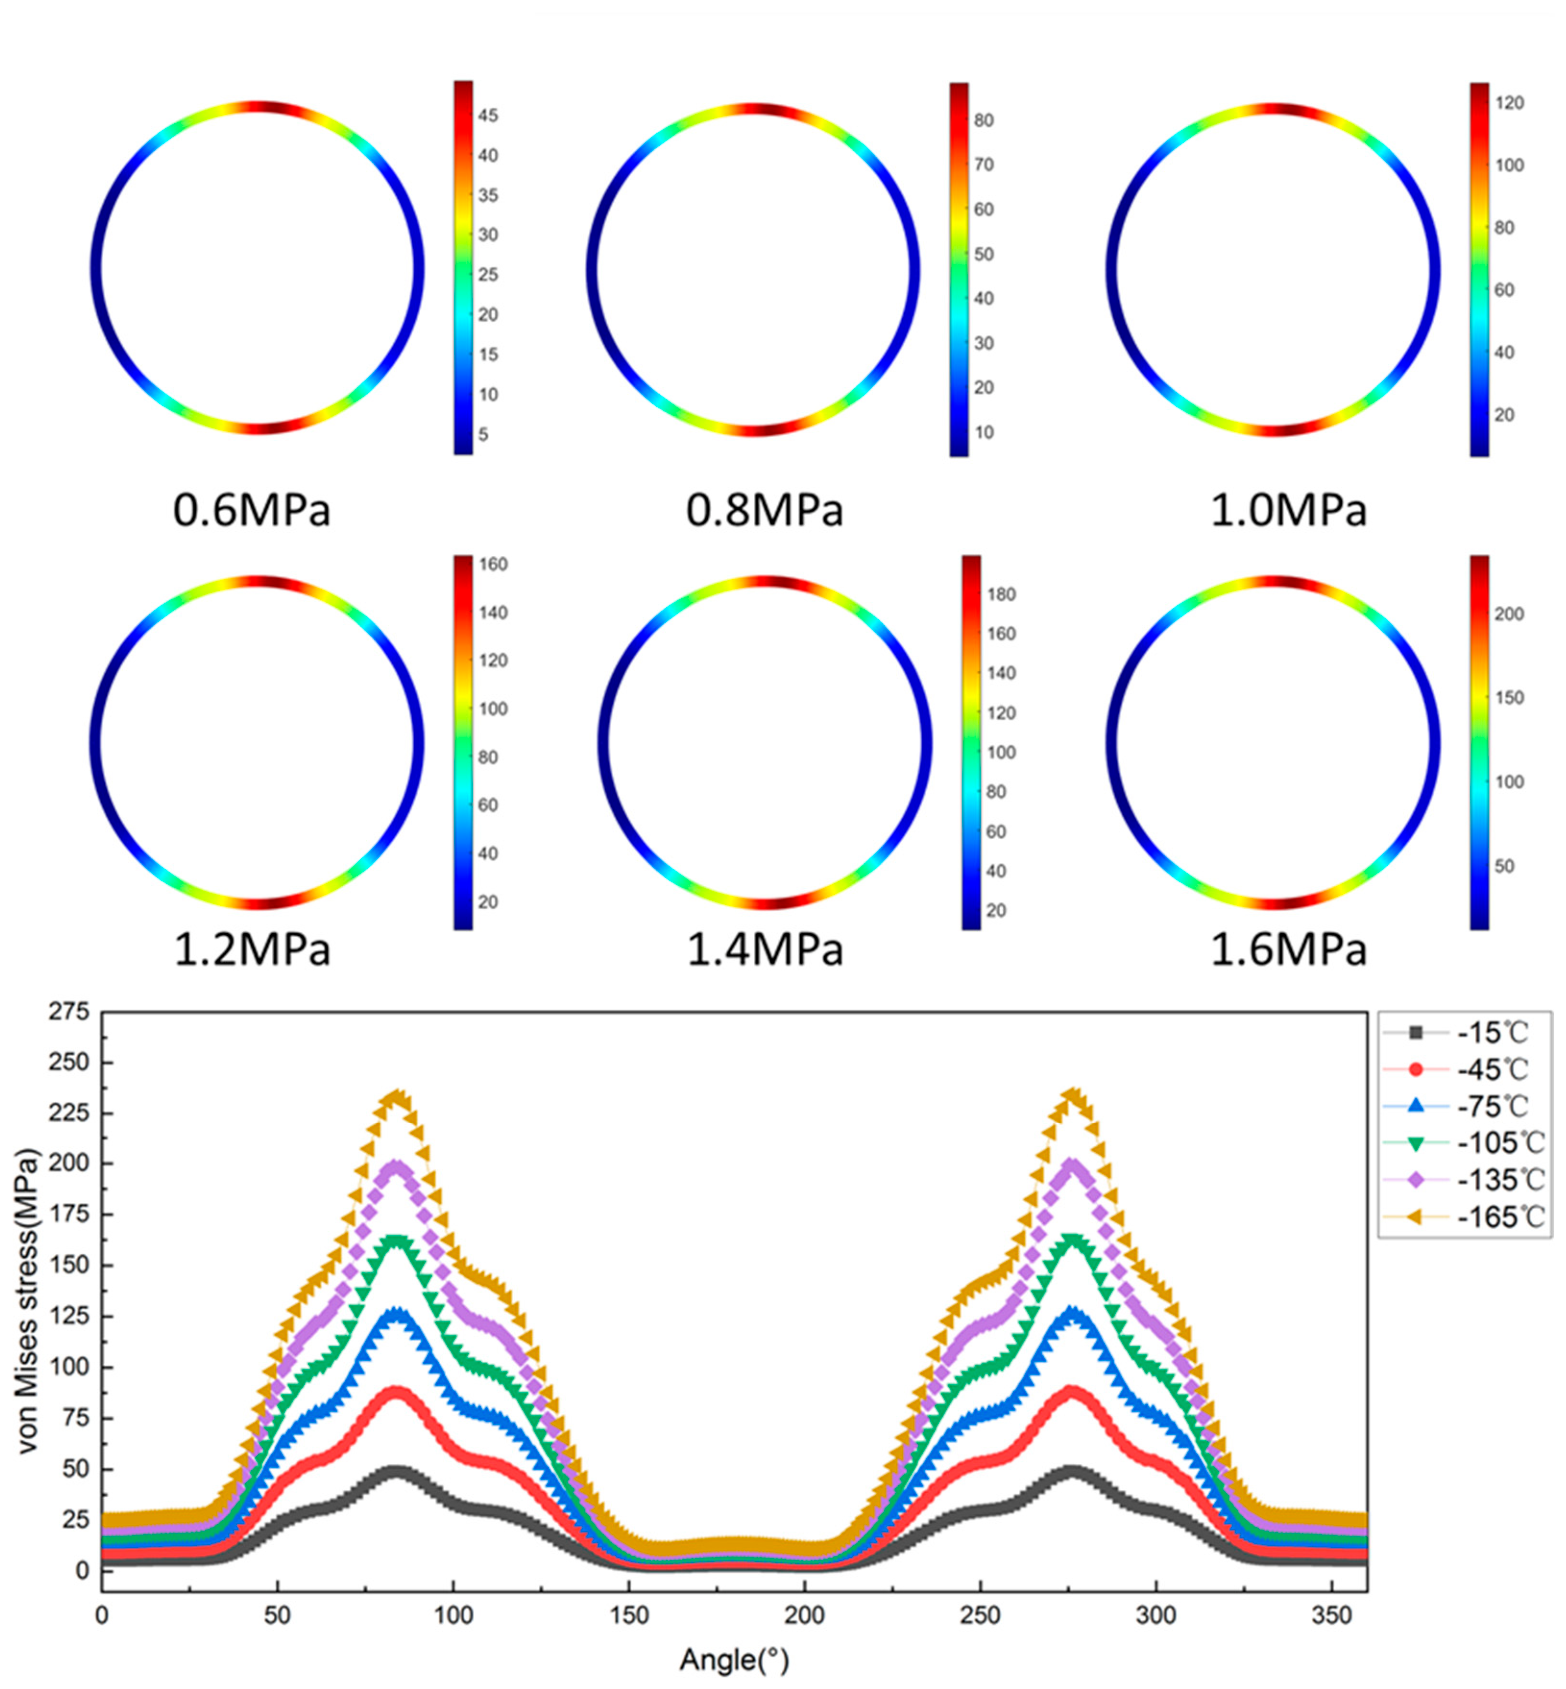
Figure 9 presents the von Mises stress distribution on the outer wall of the 45° cross-section under different internal pressures. The maximum von Mises stress occurs at the intrados and the minimum at the extrados, matching the hoop stress pattern in Figure 7. This is because the von Mises stress is determined by both hoop and axial components, with the hoop stress dominating across the cross-section. Throughout the cross-section, the hoop stress is substantially higher than the axial stress, confirming that membrane stress predominates under internal pressure-dominated conditions. Consequently, the von Mises stress distribution is governed by the hoop stress, and the extrema positions of the von Mises stress are identical to those of the hoop stress.
Figure 9.
von Mises stress distribution on the outer wall of the 45° cross-section under different internal pressure levels.
3.2.2. Stress Distribution Under Thermal Loading
To isolate the effect of temperature on the stress distribution at the elbow cross-section, finite element simulations were performed on the L-shaped pipeline at a fixed internal pressure of 0 MPa under varying temperatures. The temperatures considered were −165, −135, −105, −75, −45, and −15 °C, covering the operational range of LNG pipelines from the precooling stage to near the installation temperature.
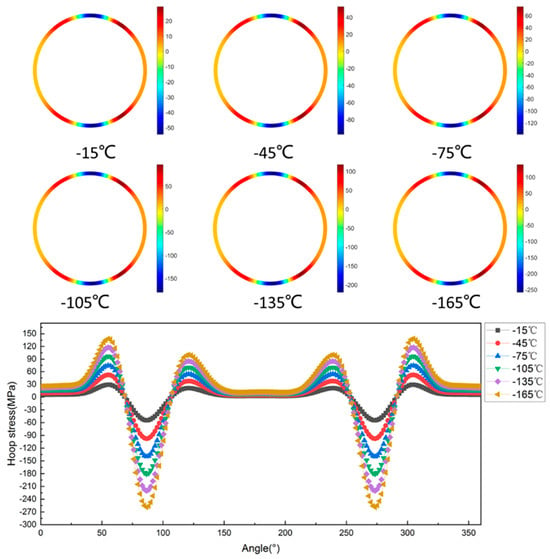
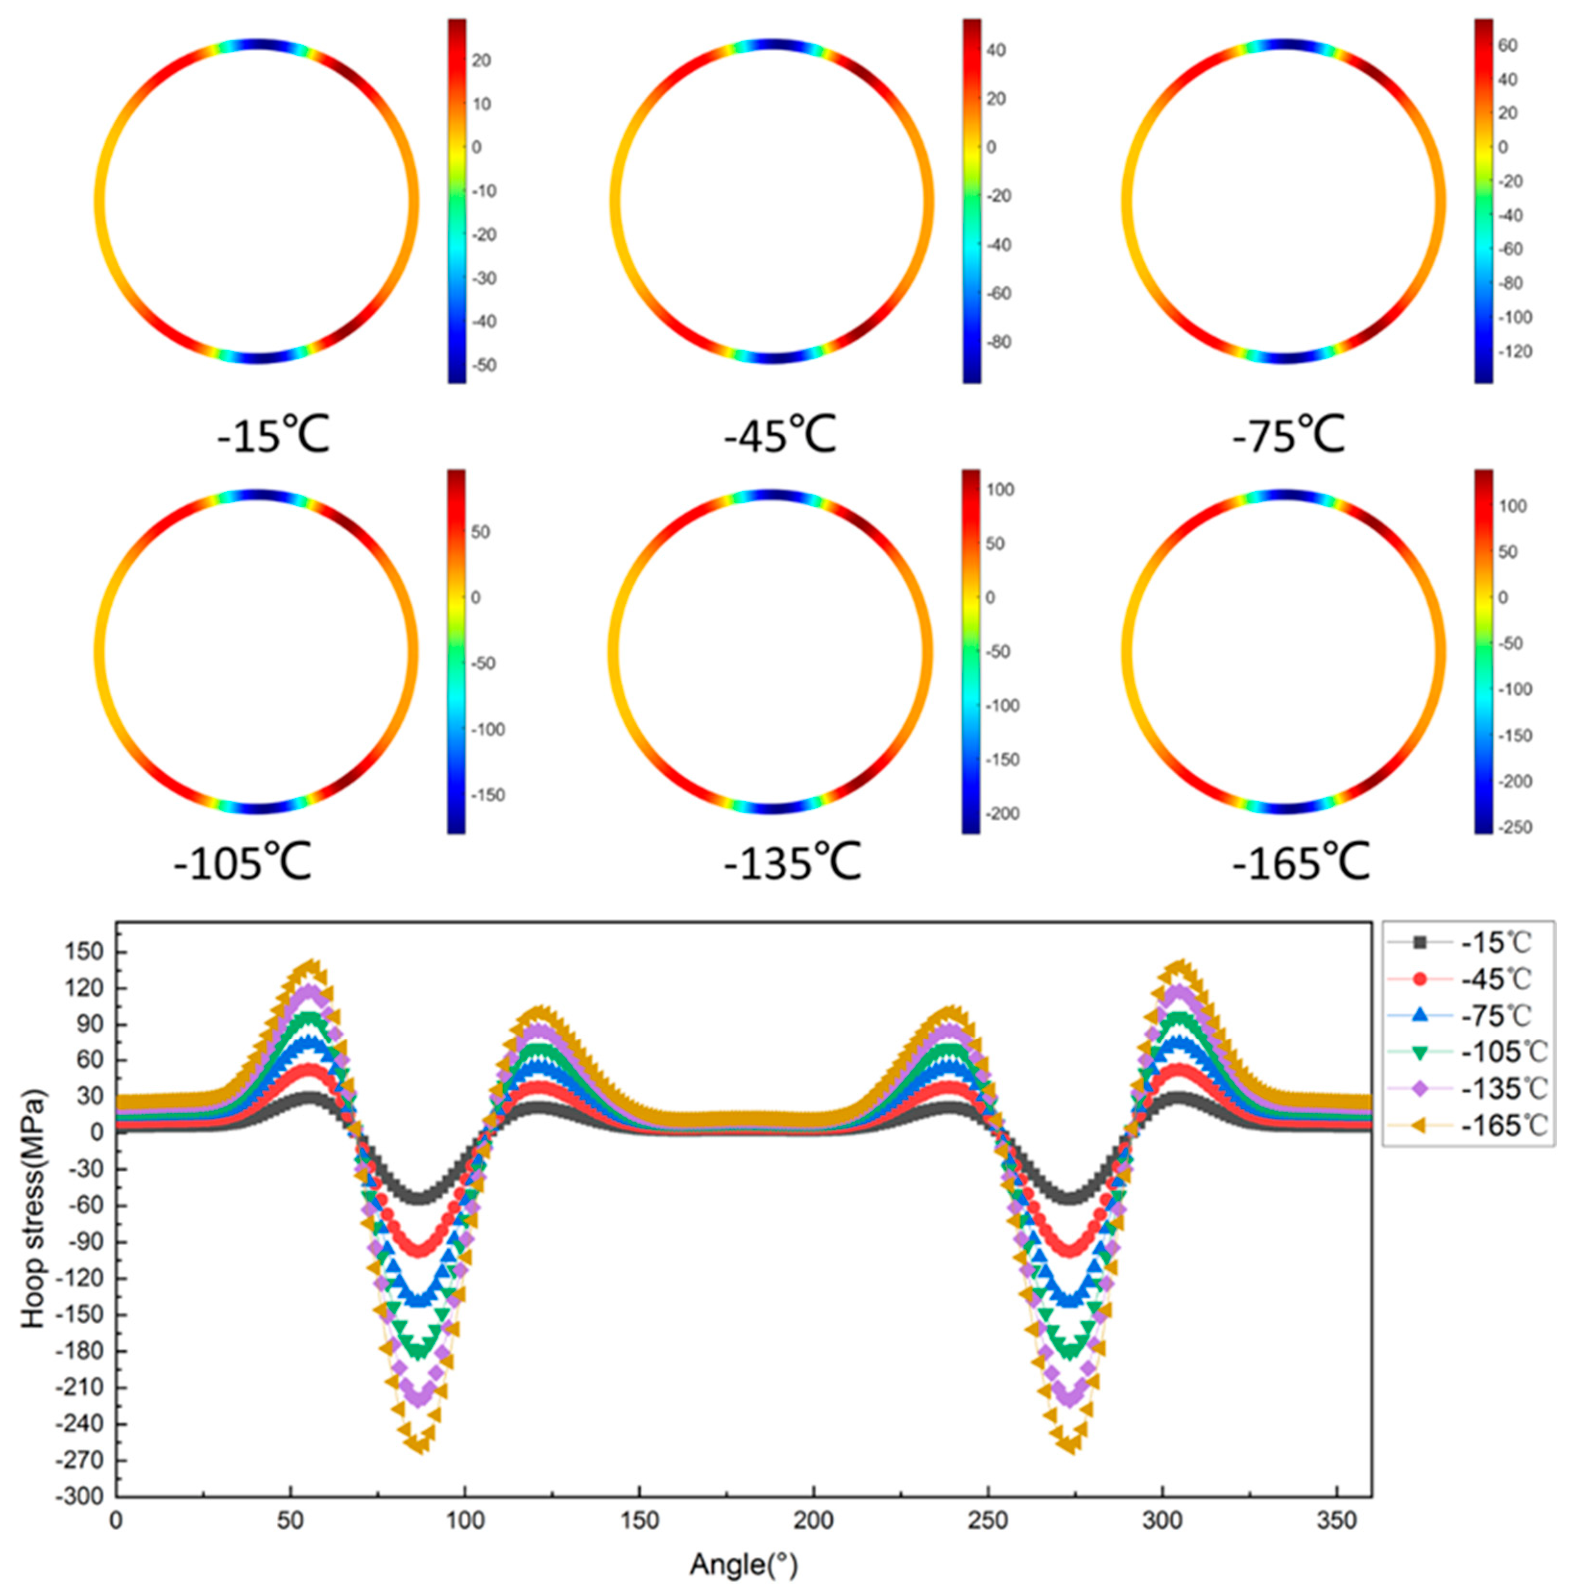
Figure 10 presents the hoop stress distribution on the outer wall of the 45° cross-section under different temperature conditions. Under thermal loading alone, the hoop stress is generated by cross-sectional ovalization resulting from opening bending of the elbow. This ovalization modifies the cross-sectional geometry: the short axis, oriented perpendicular to the bending plane, corresponds to the top and bottom regions of the elbow, where radial inward displacement induces compressive hoop stress; the long axis, lying within the bending plane, corresponds to the intrados and extrados regions, where radial outward displacement induces tensile hoop stress. Because the hoop stiffness at the top and bottom regions is lower than that at the intrados and extrados, the same opening bending moment causes greater ovalization at the top and bottom, leading to larger absolute values of compressive hoop stress in these regions compared with the tensile hoop stress at the intrados and extrados. As the temperature decreases, the hoop stress magnitude increases accordingly; however, the locations of the absolute maximum and minimum remain unchanged—the absolute maximum always occurs at the top and bottom regions, and the absolute minimum at the intrados and extrados.
Figure 10.
Hoop stress distribution on the outer wall of the 45° cross-section under different temperature levels.
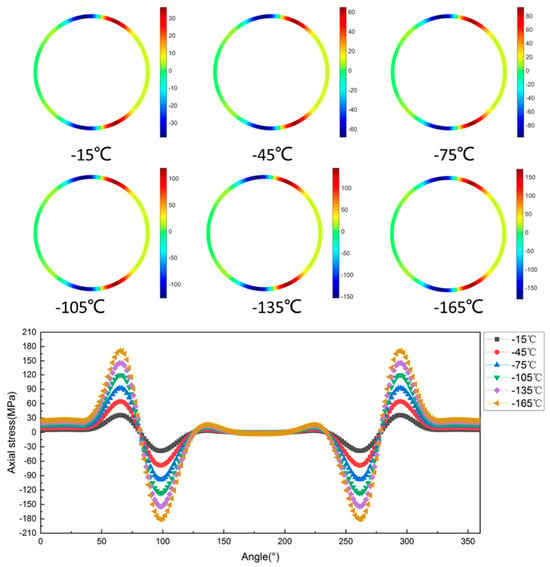
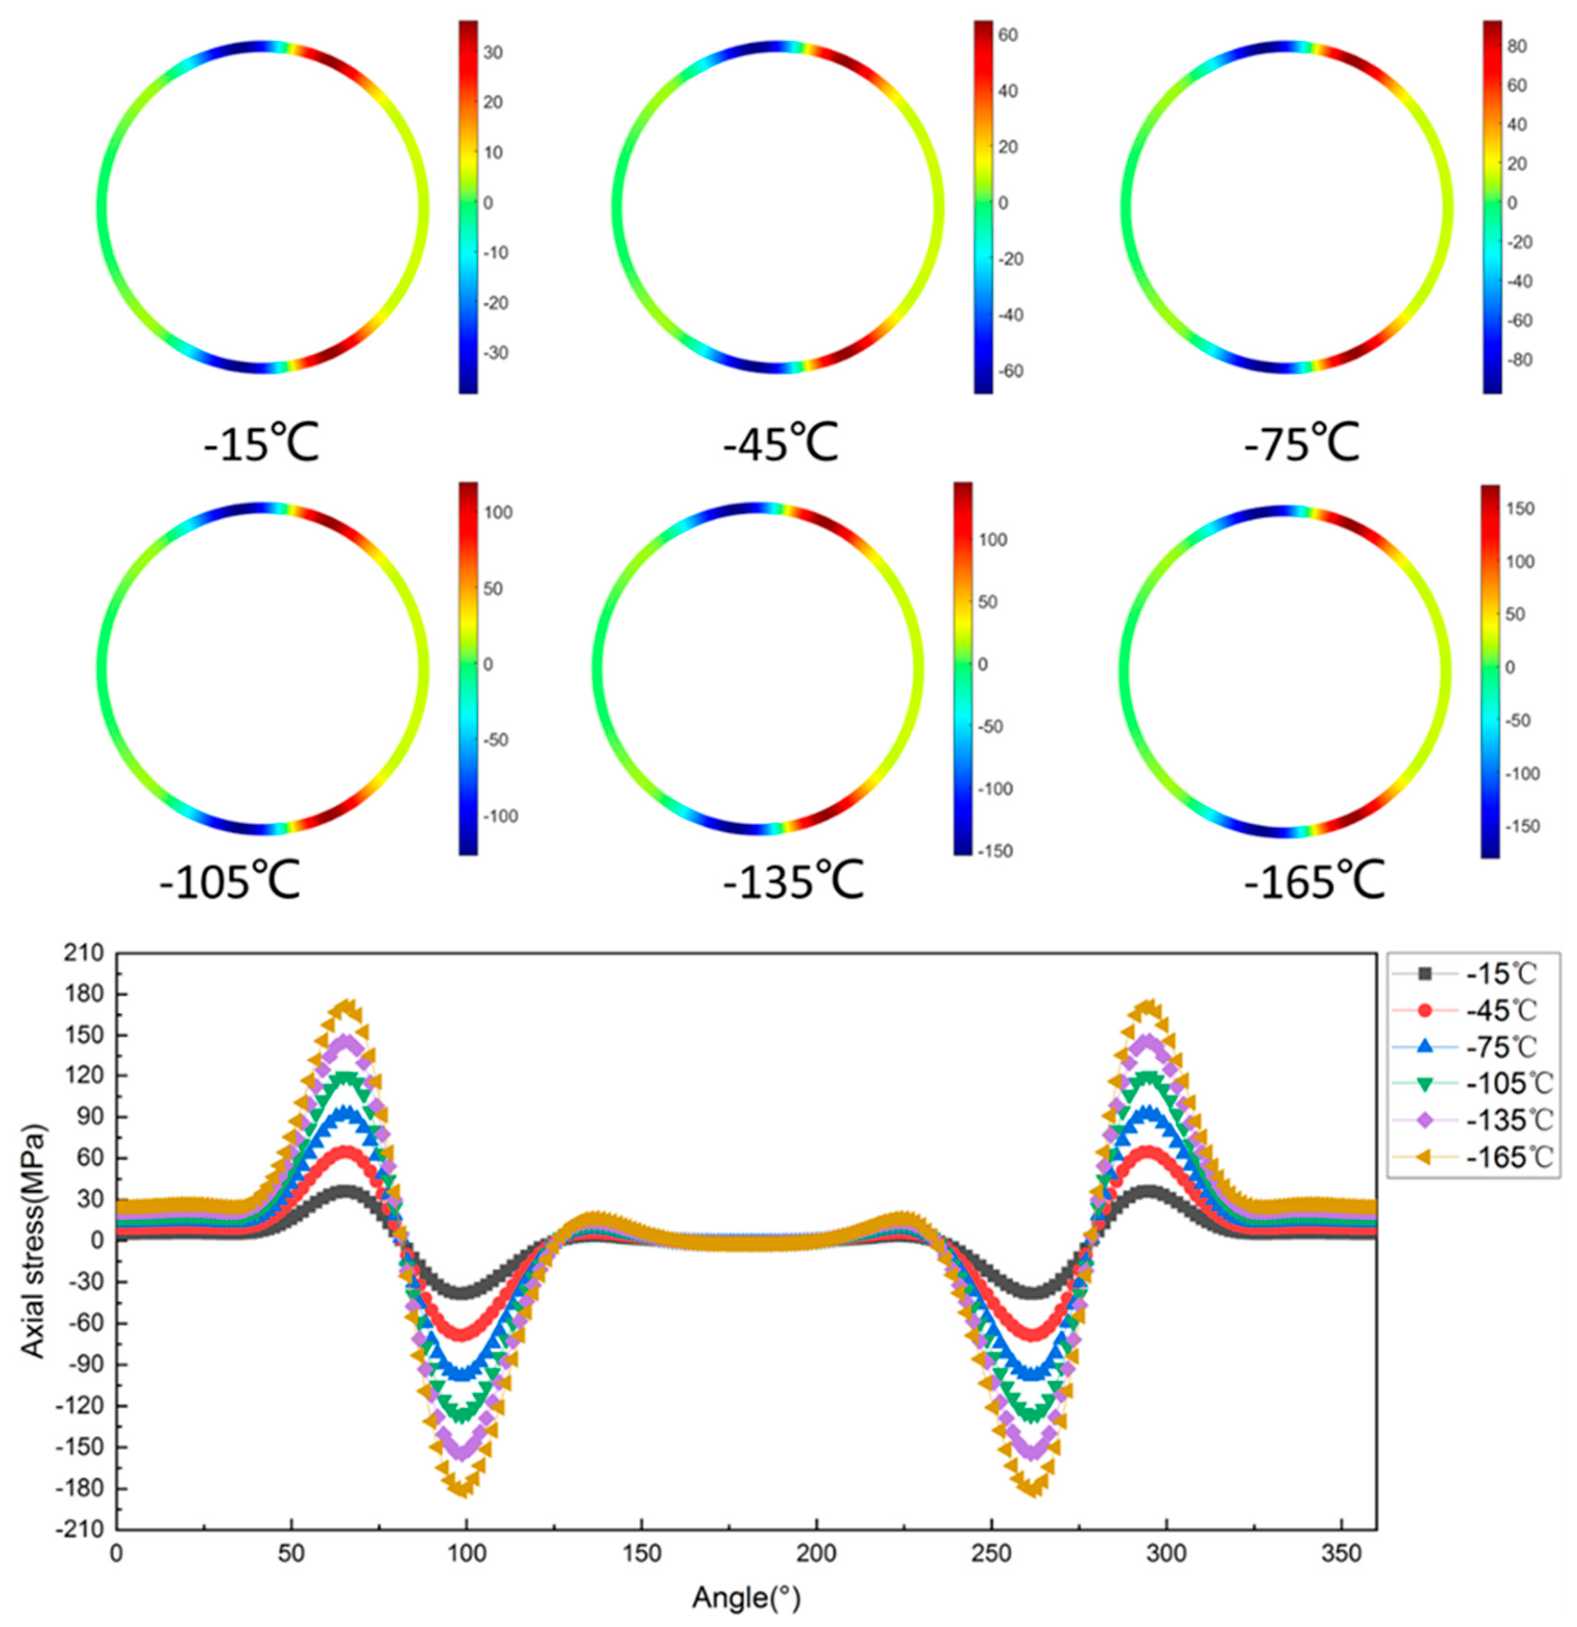
Figure 11 presents the axial stress distribution on the outer wall of the 45° cross-section under different temperature conditions. Under thermal loading alone, the axial stress distribution is characterized by compressive stress on the extrados side and tensile stress on the intrados side. This pattern is attributed to opening bending of the elbow, which compresses the extrados and stretches the intrados. As the temperature decreases, the axial stress magnitude increases accordingly, while the locations of the extrema remain unchanged. The axial stress distribution under thermal loading shares a common feature with that under internal pressure: the minimum and maximum stresses alternate circumferentially. However, a key difference lies in the positions of these extrema. Under thermal loading, the compressive axial stress peaks in the top and bottom regions near the extrados, while the tensile axial stress peaks near the intrados. This positional reversal is directly related to the bending mode: internal pressure induces closing bending, while thermal loading induces opening bending. As a result, the locations of the maximum and minimum axial stresses are interchanged between the two loading conditions.
Figure 11.
Axial stress distribution on the outer wall of the 45° cross-section under different temperature levels.
Figure 12 presents the von Mises stress distribution on the outer wall of the 45° cross-section under different temperature conditions. The maximum von Mises stress occurs near the top and bottom regions of the elbow, while the minimum appears at the intrados and extrados. Under the same thermal loading condition, the peak von Mises stress closely coincides with the negative peak of the hoop stress, indicating that the von Mises stress distribution is primarily governed by the hoop stress component. In the top and bottom regions where the von Mises stress attains its maximum, the axial stress approaches zero, whereas the compressive hoop stress reaches its maximum. Therefore, under cryogenic conditions, the von Mises stress is dominated by the compressive hoop stress, and the critical cross-section corresponds to the location where the compressive hoop stress is maximal.
Figure 12.
von Mises stress distribution on the outer wall of the 45° cross-section under different temperature levels.
3.2.3. Stress Distribution Under Combined Internal Pressure and Thermal Loading
To investigate the combined effect of internal pressure and temperature on the stress distribution at the elbow cross-section, finite element simulations were performed on the L-shaped pipeline under 11 load cases generated by the response surface design. The temperature ranged from −165 °C to −15 °C, and the internal pressure from 0.6 MPa to 1.6 MPa.
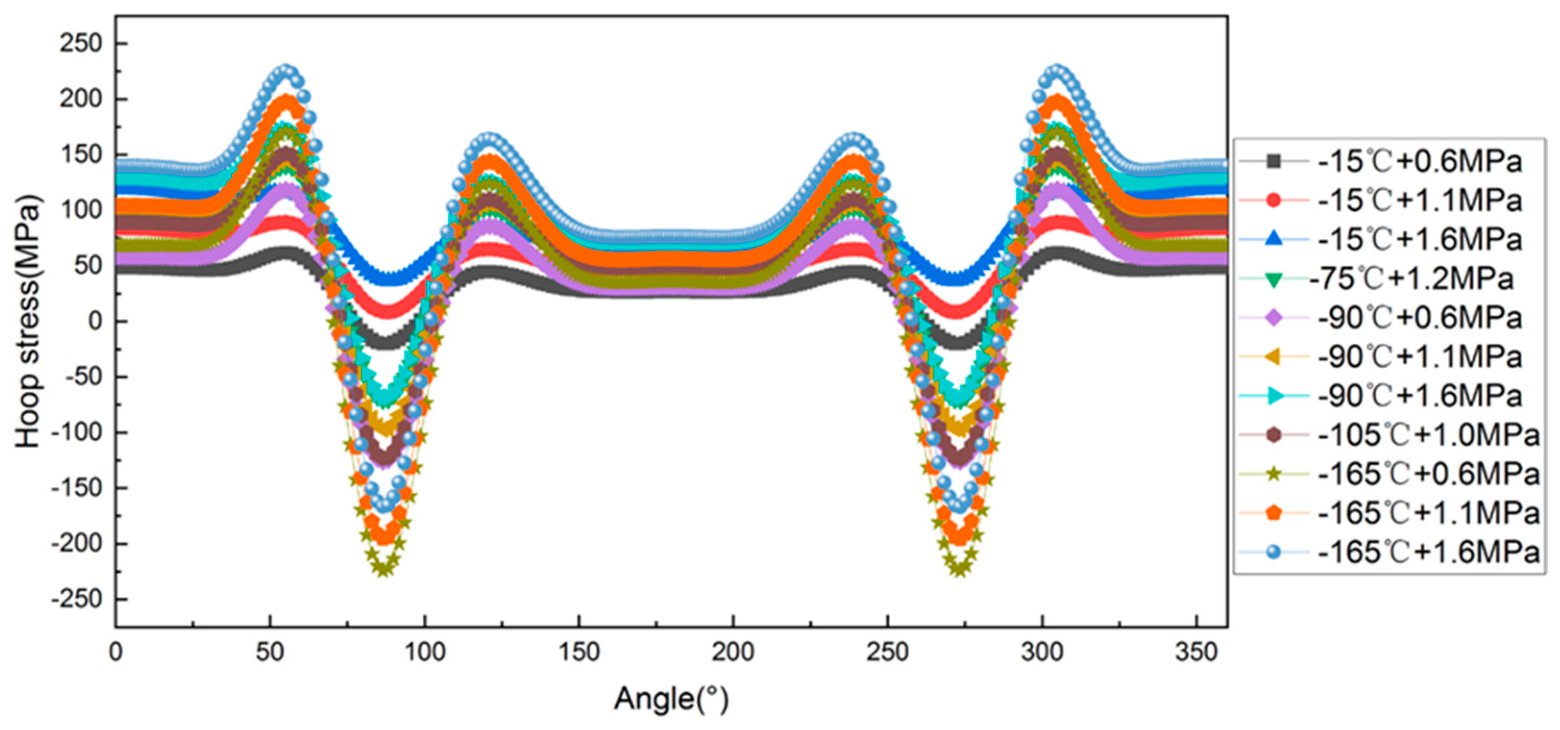
Figure 13 presents the hoop stress distribution on the outer wall of the 45° cross-section under combined loading conditions. Within the 0–180° angular range, tensile hoop stresses attain local maxima near 55° on the intrados side and approximately 120° on the extrados side of the elbow, while the maximum compressive stress occurs near the crown at approximately 85°. As the temperature decreases from −15 °C to −165 °C, the magnitude of the compressive stress increases sharply from approximately 50 MPa to 220 MPa, while increasing internal pressure linearly elevates the tensile hoop stress. Overall, the hoop stress magnitude on the intrados side exceeds that on the extrados side.
Figure 13.
Hoop stress distribution on the outer wall of the 45° cross-section under combined internal pressure and thermal loading.
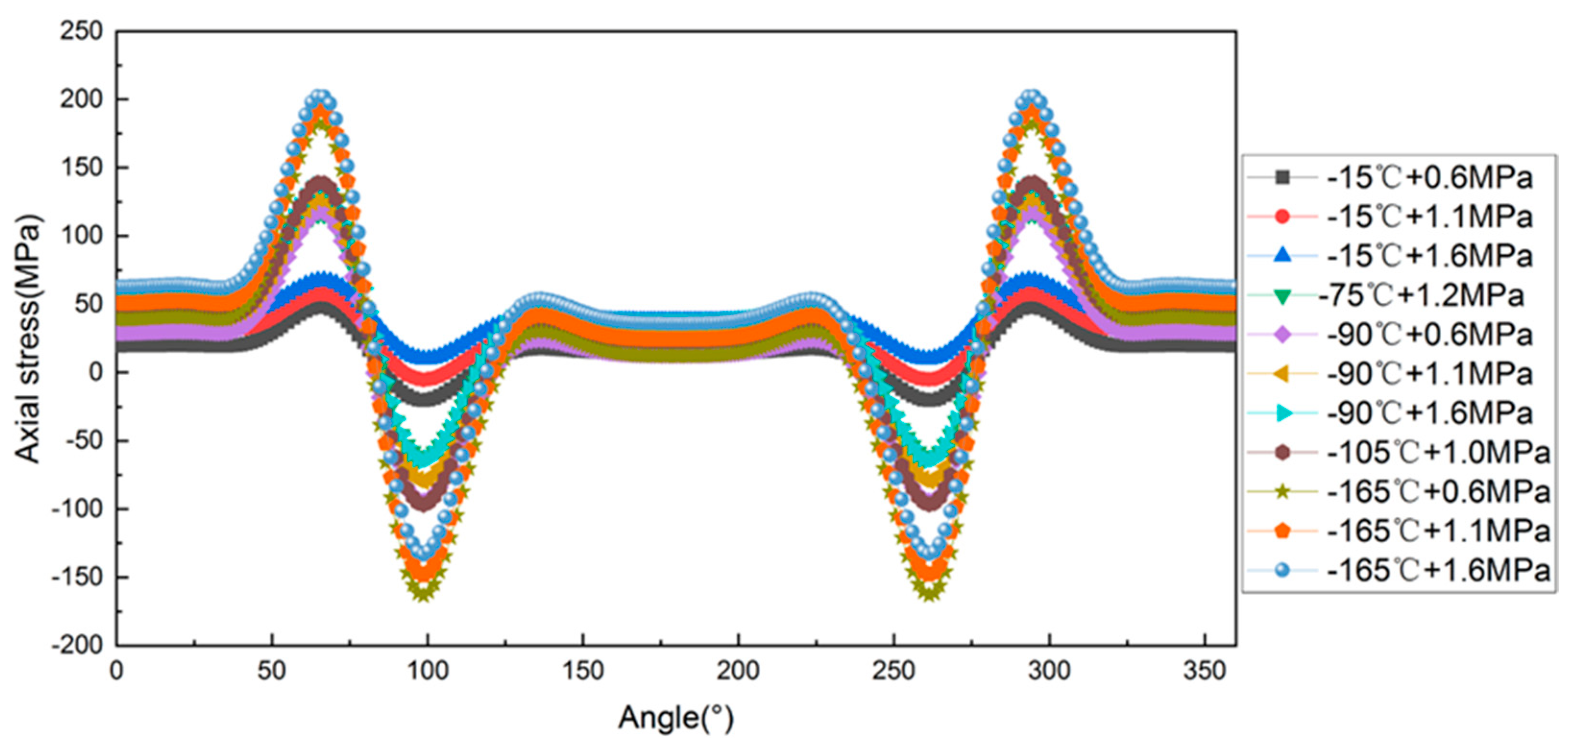
Figure 14 presents the axial stress distribution on the outer wall of the 45° cross-section under combined internal pressure and thermal loading. Within the 0–180° angular range, the maximum axial tensile stress occurs near 65° on the intrados side, while the maximum axial compressive stress appears near 95° on the extrados side. The transition from tension to compression occurs near 80° at the crown of the elbow. As the temperature decreases, the stress magnitude increases notably, while internal pressure exerts a relatively minor influence on its amplitude but elevates the overall baseline stress level. The axial stress distribution is governed predominantly by temperature, with internal pressure playing a secondary role without altering the deformation mode.
Figure 14.
Axial stress distribution on the outer wall of the 45° cross-section under combined internal pressure and thermal loading.
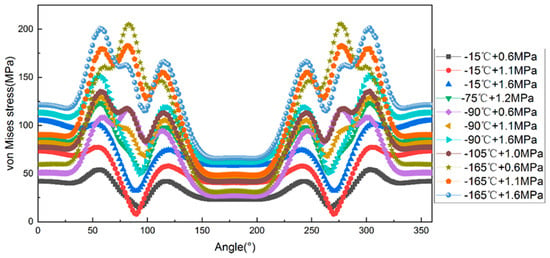
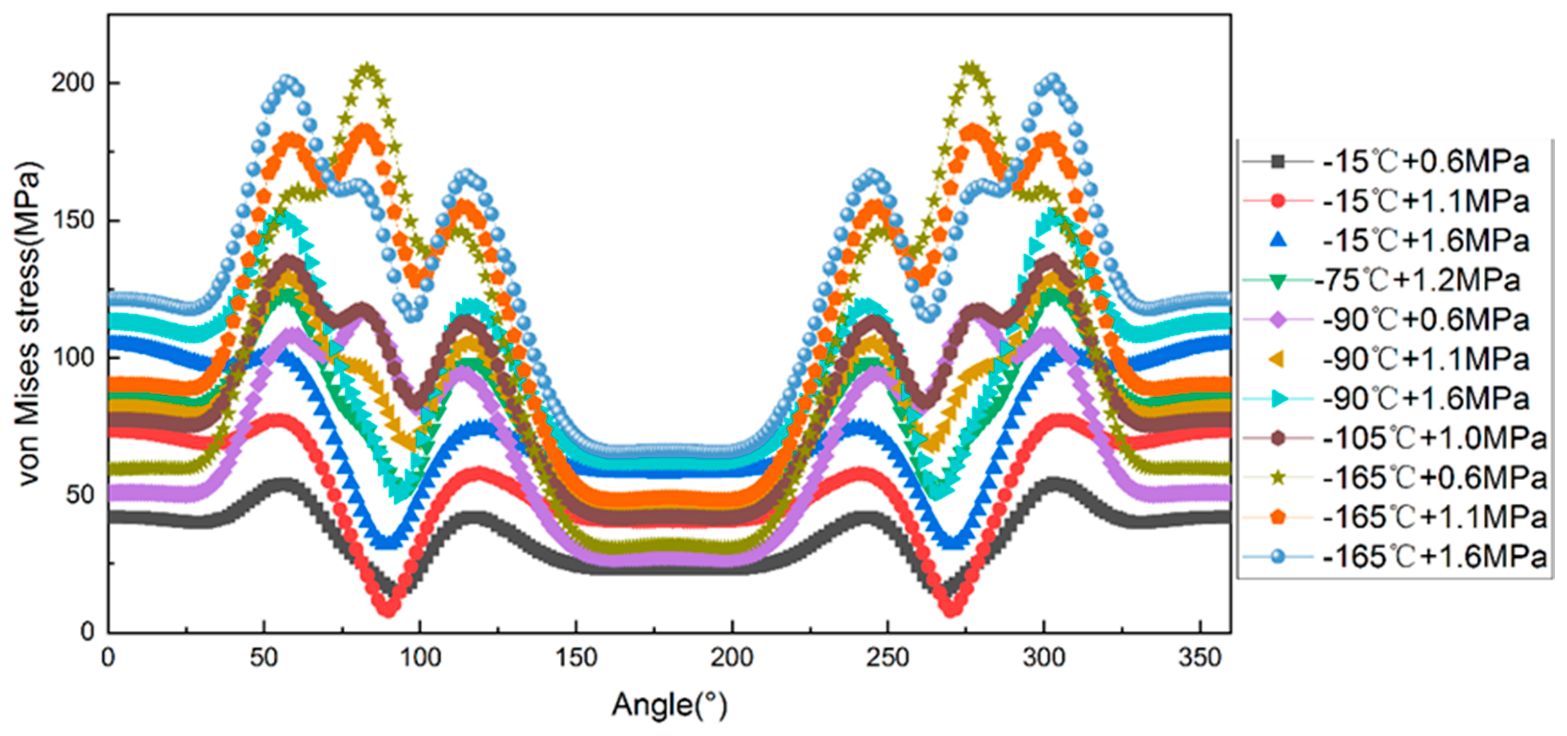
Figure 15 presents the von Mises stress distribution on the outer wall of the 45° cross-section under combined internal pressure and thermal loading. Within the 0–180° angular range, the von Mises equivalent stress forms two high-stress regions near 57° and 83° on the intrados side of the elbow, while the lowest stress occurs near 180° on the extrados side. Both decreasing temperature and increasing internal pressure contribute to elevated von Mises stress levels. However, as the temperature drops to −165 °C, the distribution pattern of the von Mises stress changes, and the dominant high-stress region shifts with increasing pressure. At 0.6 MPa, the stress near 57° on the intrados side dominates; as the pressure increases to 1.6 MPa, the stress near 83° near the crown gradually becomes predominant. At −165 °C, the von Mises stress at 0.6 MPa is 205.2 MPa, slightly higher than 200.8 MPa at 1.6 MPa, which may be attributed to the effect of pressure stiffening.
Figure 15.
von Mises stress distribution on the outer wall of the 45° cross-section under combined internal pressure and thermal loading.
3.3. Response Surface Analysis of Maximum von Mises Stress
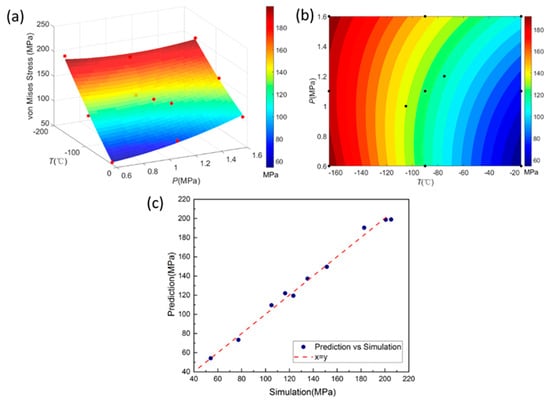
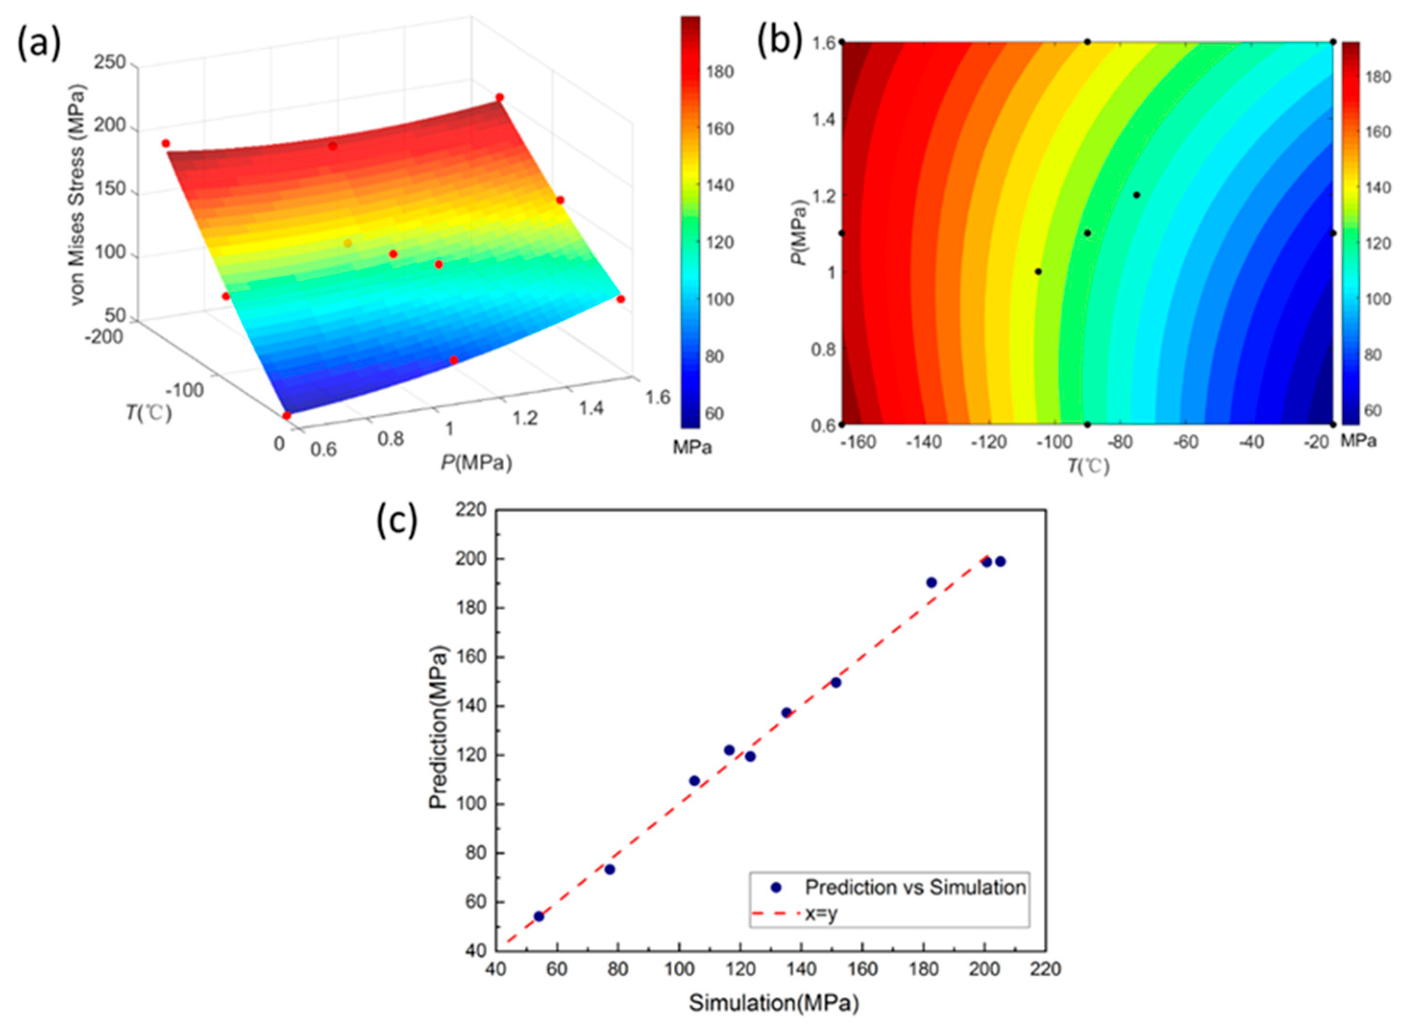
The influence of temperature and internal pressure on the maximum von Mises stress at the outer wall of the 45° elbow cross-section was evaluated using the simulation results from the 11 cases generated by the response surface design. Figure 16 presents the response surface analysis results for the maximum von Mises stress under combined internal pressure and thermal loading. Figure 16a shows the three-dimensional response surface, which illustrates the interactive effect of temperature and internal pressure on the maximum von Mises stress. The response surface exhibits a monotonic rise from the high-temperature, low-pressure region toward the low-temperature region, with the gradient along the temperature direction considerably steeper than that along the pressure direction, indicating that temperature is the dominant factor governing the von Mises stress. Correspondingly, the two-dimensional contour plot in Figure 16b shows diagonally arranged contours extending from the upper-left (high temperature, low pressure) toward the lower-right (low temperature), with the contours becoming denser in the low-temperature region, implying that the stress increases more rapidly as temperature decreases. Among the simulated cases, the highest von Mises stress (205.2 MPa) occurs at −165 °C and 0.6 MPa, while the lowest (54.1 MPa) occurs at −15 °C and 0.6 MPa, representing a nearly four-fold difference.
Figure 16.
Response surface analysis results of maximum von Mises stress under combined internal pressure and thermal loading: (a) three-dimensional response surface; (b) two-dimensional contour plot; (c) model validation. The black and red dots denote the simulated data points obtained from the finite element analysis in (a,b).
A second-order polynomial regression analysis was performed on the numerical simulation data to establish the response surface model, as expressed in Equation (5). The model is highly significant overall, with an F-value of 117.12 and a p-value of 3.55 × 10⁻⁵. The coefficient of determination R2 is 0.9915, and the adjusted R2 is 0.9831, indicating excellent fitting accuracy. Figure 16c presents the model validation results. The simulated data points cluster closely around the diagonal line, and the predicted values agree well with the simulated ones, indicating that the established response surface model can provide reasonable predictions of the maximum von Mises stress on the outer wall of the elbow cross-section within the investigated design space.
where σmax is the maximum von Mises stress (MPa), T is the temperature (°C), and P is the internal pressure (MPa).
σmax = 37.90 − 1.042T − 14.08P + 0.370TP + 0.0008T2 + 34.06P2
Table 5 summarizes the ANOVA results for the regression model. The p-values for the linear terms of temperature (T) and internal pressure (P), as well as their interaction (T·P), are 2.84 × 10⁻⁶, 0.0029, and 0.0068, respectively, indicating that temperature, internal pressure, and their synergistic effect all exert highly significant influences on the stress response. In contrast, the quadratic terms T2 and P2 yield p-values of 0.304 and 0.085, respectively, neither reaching statistical significance. This indicates that, within the experimental range, a linear-plus-interaction model provides an adequate approximation of the response surface, and the quadratic terms can be safely omitted.
Table 5.
ANOVA and significance test results for the regression model.
To further validate the predictive capability of the RSM model, three independent verification points—(−130 °C, 0.8 MPa), (−130 °C, 1.4 MPa), and (−50 °C, 1.0 MPa)—were selected within the design space but not included in the CCD design. The maximum von Mises stresses at these points were predicted by the RSM model and compared with finite element results. The relative errors between the predicted and simulated values are 2.2%, 1.7%, and 3.7%, respectively, which supports the predictive capability of the established RSM model within the investigated range.
3.4. Location Analysis of Maximum von Mises Stress Based on a Logistic Regression Boundary Model
As internal pressure and temperature vary, the location of the maximum von Mises stress on the outer wall of the 45° elbow cross-section does not shift continuously; rather, it switches among a few discrete positions. This observation suggests that the location is inherently a categorical variable, and its variation reflects transitions among distinct stress patterns rather than continuous numerical changes. To model this discrete behavior, a multinomial logistic regression approach is adopted to establish the boundary model that relates temperature and internal pressure to the location of the maximum von Mises stress.
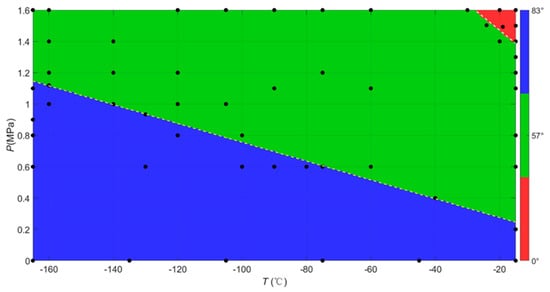
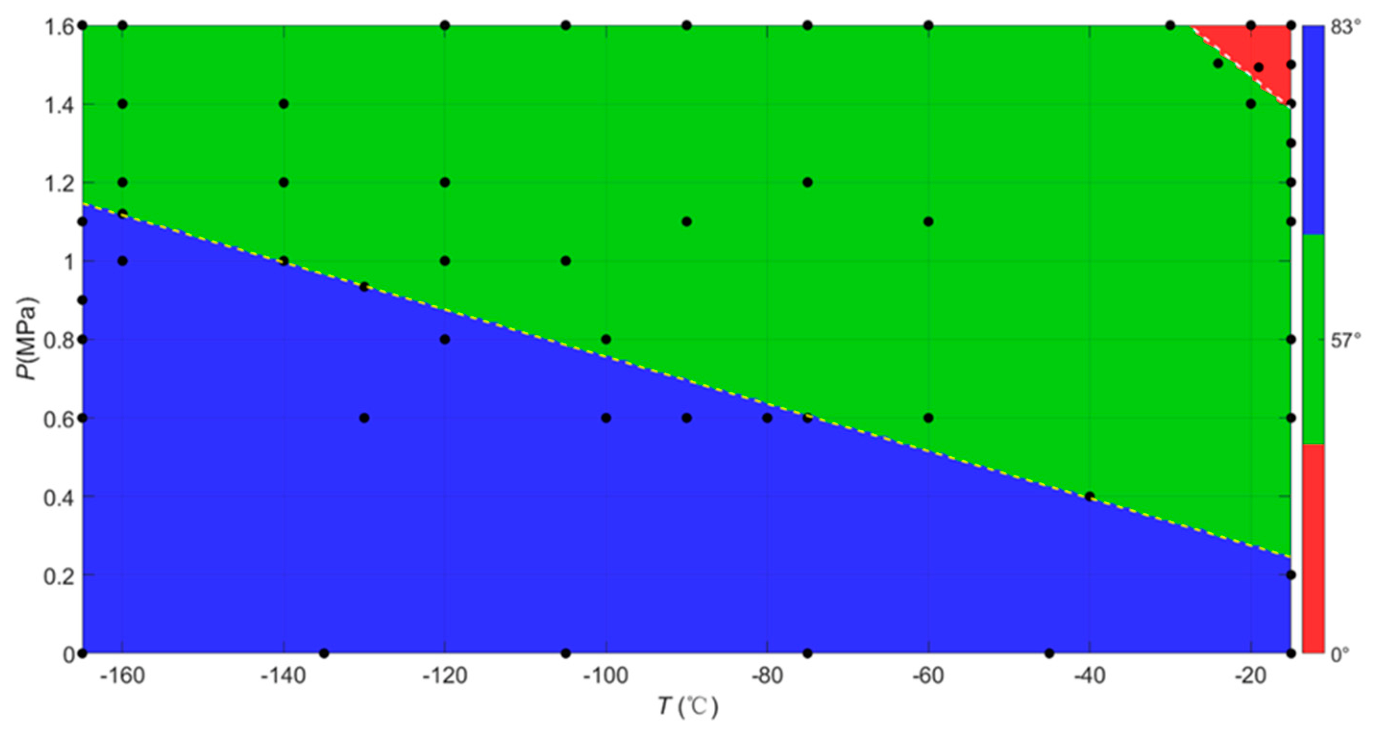
Figure 17 presents the multinomial logistic regression results for the location of the maximum von Mises stress as a function of temperature and internal pressure. The decision boundary distribution partitions the entire parameter space into three distinct regions, corresponding to the angular locations of 0° (blue), 57° (green), and 83° (red). Both decision boundaries on the P–T plane are linear. The boundary between the 0° and 57° regions is given by
and that between the 57° and 83° regions by
P = 0.8464 − 0.0356T
P = 0.1553 − 0.0060T
Figure 17.
Multinomial logistic regression decision boundaries for the location of maximum von Mises stress on the P–T plane. The black dots denote the simulated data points obtained from the finite element analysis.
The negative slopes indicate that temperature and internal pressure act in opposite directions to maintain the boundary location, implying a coupled influence on the maximum stress position. For example, when the temperature decreases, the internal pressure must be increased to keep the maximum stress location on the same boundary.
The classification of the maximum von Mises stress location is governed by the following two linear discriminant functions:
where D1 distinguishes the 0° category from the 57° category, and D2 distinguishes the 57° category from the 83° category.
D1 = −2865.9599 + 120.4328T + 3386.0231P
D2 = −96.3749 + 3.7176T + 620.7257P
The blue region occupies a large portion of the parameter space, covering the lower-left and central areas. In terms of the discriminant functions, this region is defined by the joint conditions D1 > 0 and D2 > 0, with D1 > 0 serving as the primary constraint that delimits its extent. As temperature increases, this boundary descends steeply, causing the extent of the blue region in the pressure direction to gradually diminish.
The green region lies between the blue and red regions, forming a band-shaped zone across the middle of the parameter space. It is characterized by D1 < 0 and D2 > 0. The difference in slopes between the two boundary lines determines the shape of the green region, which is wider at low temperatures and progressively narrows toward the high-temperature end. Specifically, the steep decline of the D1 boundary, together with the gentler decline of the D2 boundary, produces a relatively large pressure span near T ≈ −80 °C. As temperature approaches-20 °C, the upper and lower boundaries converge, compressing the green region into a narrower band.
The red region is confined to a small zone in the upper-right corner of the parameter space, corresponding to the condition D2 < 0. This indicates that this category imposes relatively specific coupling requirements on temperature and internal pressure—namely, temperatures near −15 °C combined with relatively high internal pressure. Such combinations therefore occupy only a limited portion of the overall parameter space.
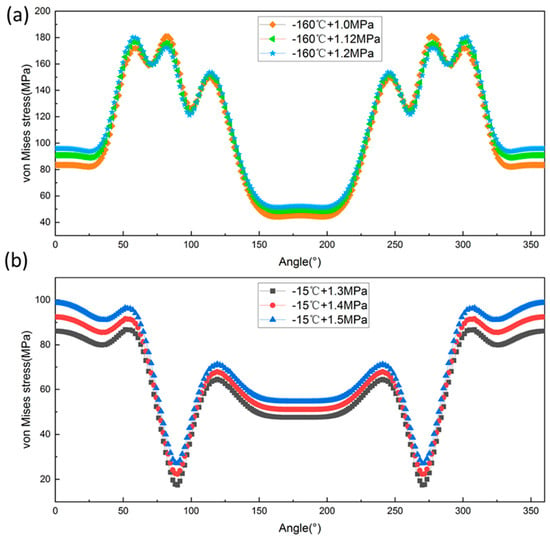
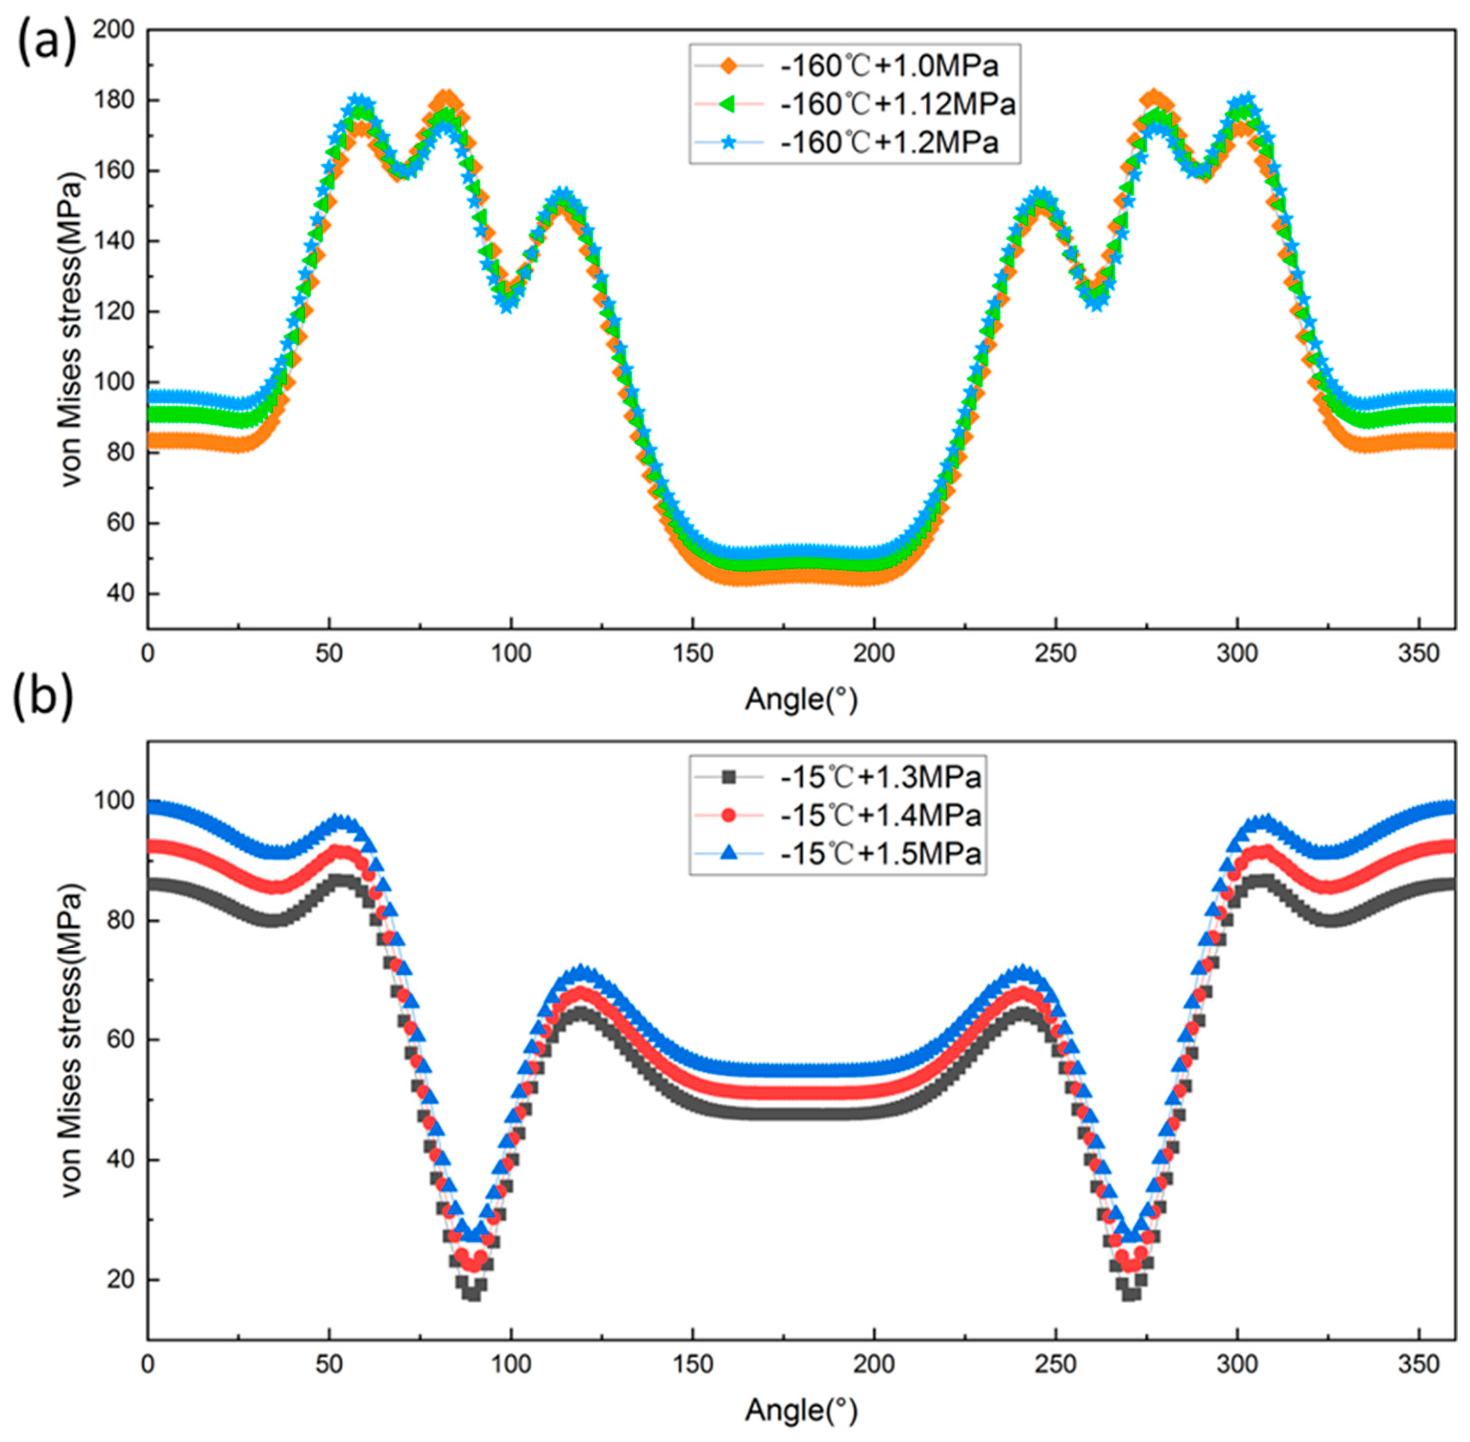
To further examine the transition behavior of the maximum von Mises stress location near the decision boundaries, two sets of load cases adjacent to the boundaries were selected for detailed examination. Figure 18a presents the von Mises stress distributions at −160 °C under internal pressures of 1.0, 1.12, and 1.2 MPa, corresponding to positions near and on the boundary between the 57° and 83° regions in Figure 16. At 1.0 MPa, the maximum von Mises stress occurs at 83°; at 1.12 MPa, the stresses at both 57° and 83° simultaneously reach the same maximum value; and at 1.2 MPa, the maximum shifts to 57°. This progressive evolution demonstrates that as internal pressure increases monotonically, the location of the peak stress transitions completely from 83° to 57°, passing through an intermediate stage where both positions exhibit equal maxima. The pressure of 1.12 MPa thus identifies the critical transition point.
Figure 18.
Transition of maximum von Mises stress location across decision boundaries: (a) boundary between 57° and 83° regions at −160 °C; (b) boundary between 0° and 57° regions at −15 °C.
Similarly, Figure 18b presents the von Mises stress distributions at −15 °C under internal pressures of 1.3, 1.4, and 1.5 MPa, corresponding to positions near and on the boundary between the 57° and 0° regions in Figure 16. At 1.3 MPa, the maximum is located at 57°; at 1.4 MPa, the stresses at both 57° and 0° simultaneously reach the same maximum; and at 1.5 MPa, the maximum shifts to 0°. Again, as internal pressure increases, the maximum stress location transitions completely from 57° to 0°, with 1.4 MPa serving as the critical pressure for this transition.
The critical pressures identified above agree well with the predictions of the decision boundary equations, confirming the reliability of the logistic regression model. This consistency indicates that the decision boundaries are not merely statistical classification lines; they physically correspond to the critical loading conditions at which the stresses at two competing locations are equal. The results therefore provide validation of the logistic regression model for predicting the location of the maximum von Mises stress.
3.5. Effect of Temperature on Cross-Sectional Ovalization of the Elbow
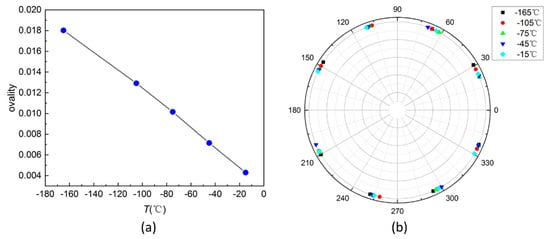
Figure 19a illustrates the variation of ovality at the outer wall of the 45° elbow cross-section under different thermal loading conditions. The cross-sectional ovality increases progressively as temperature decreases. Given that the diameter-to-thickness ratio of the L-shaped pipeline in the present model is 100—which classifies it as a typical thin-walled pipe—the cross-sectional deformation induced by bending is not limited to a simple second-order ovalization but may involve significant higher-order deformation components.
Figure 19.
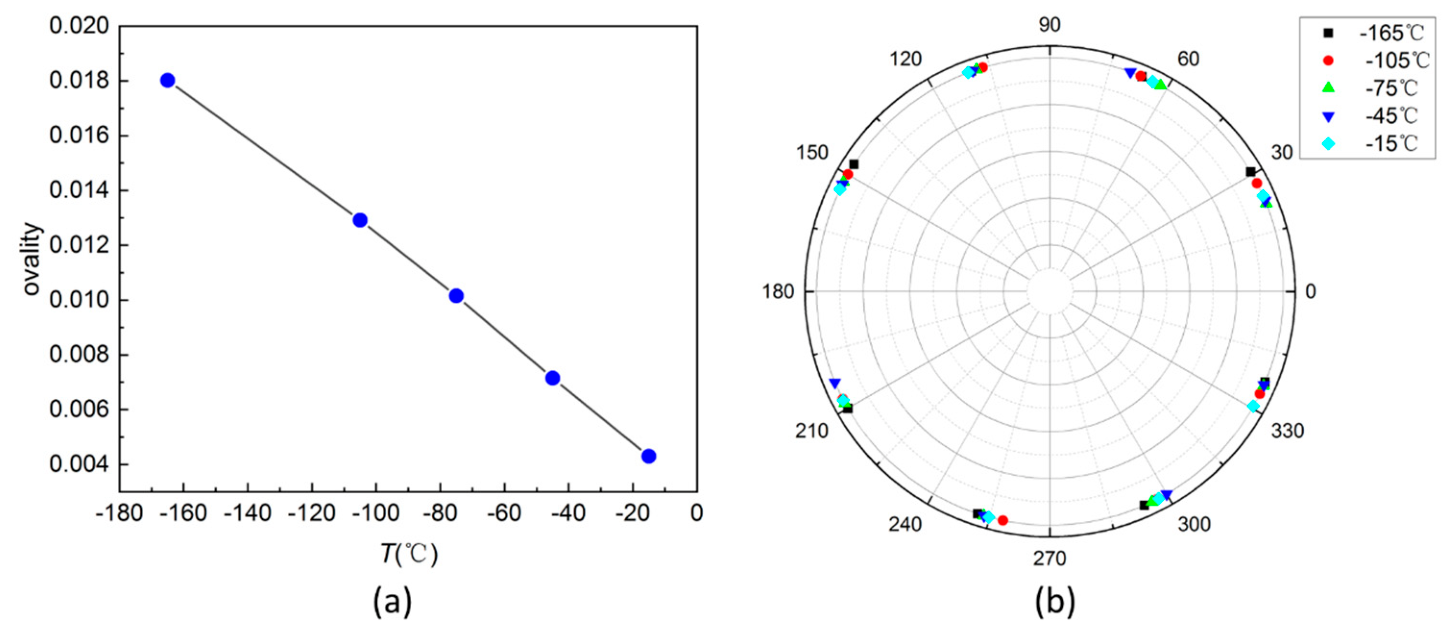
Effect of temperature on cross-sectional ovalization: (a) ovality variation with temperature; (b) intersection distribution between measured profile and fitted second-order ellipse.
To further investigate this behavior, a least-squares elliptical fitting was performed on the simulated cross-sectional profile of the elbow. Figure 19b presents the intersection distribution between the measured profile and the fitted second-order ellipse. The comparison reveals that the measured profile intersects the fitted ellipse at eight distinct points, corresponding to circumferential angles of 23.45°, 63.61°, 106.6°, 157.6°, 206°, 252.1°, 296.55°, and 337.22°. The presence of these multiple intersections further confirms the existence of higher-order deformation components beyond conventional second-order ovalization.
Based on the Love–Kirchhoff thin-shell theory, the radial displacement field on the elbow cross-section can be expressed as a Fourier series:
where θ denotes the circumferential angle of the elbow cross-section θ ∈ [0,2π), and the coefficients am and bm are governed by the specific loading and boundary conditions.
The Fourier decomposition presented here is applied to the displacement field obtained from the finite element analysis, in which geometric nonlinearity is accounted for. For a second-order ovalization, only the m = 0 and m = 2 terms are retained, yielding
When the actual deformation is truncated at the fourth order, i.e., including m = 0, 2, and 4, the deviation between the measured profile and the fitted second-order ellipse becomes
The intersection points between the measured profile and the fitted ellipse satisfy Δω(θ) = 0, which leads to
Solving this trigonometric equation gives
with
This indicates that within the range [0,2π), the second-order ellipse and the fourth-order harmonic intersect at eight distinct points. Furthermore, under the in-plane bending induced by thermal loading, the cross-sectional deformation remains symmetric about the bending plane, which forces the sine terms to vanish and yields b4 = 0. Equation (14) then reduces to
The theoretically predicted intersection angles—22.5°, 67.5°, 112.5°, 157.5°, 202.5°, 247.5°, 292.5°, and 337.5°—are in excellent agreement with the finite element results shown in Figure 19b, confirming that the elbow cross-section undergoes fourth-order deformation. The above analysis thus establishes that, under thermal loading, the actual deformation mode of the elbow cross-section is a superposition of second-order and fourth-order components (i.e., m = 0, 2, 4). It should be noted that the m = 2 and m = 4 harmonics represent mathematical modal components of the cross-sectional displacement field, rather than a manifestation of physical nonlinear ovalization.
In terms of stress contribution, the second-order ovalization component (m = 2) primarily governs the circumferential membrane stress distribution, determining both the macroscopic tension–compression partitioning between the bending plane (intrados/extrados) and the perpendicular plane (top/bottom), and the overall stress level. In contrast, the fourth-order component (m = 4), though contributing less to the total hoop stress, plays a critical role in shaping the axial stress distribution. The local curvature variations introduced by the fourth-order deformation generate significant axial bending stresses that fluctuate in a four-lobed pattern around the circumference. This four-lobed fluctuation is precisely what gives rise to the alternating distribution of axial stress extrema along the circumferential direction.
4. Conclusions
This study investigates a typical L-shaped pipeline in an LNG receiving terminal through finite element simulations, with a focus on the stress distribution, cross-sectional deformation, and migration of the peak stress location at the 45° elbow cross-section under internal pressure, thermal loading, and their combined effects. The main conclusions are summarized as follows:
(1) Loading conditions determine the bending mode, with thermal contraction dominating under combined loading. Under internal pressure alone, the elbow undergoes closing bending, with entirely tensile hoop stress—maximum at the intrados and minimum at the extrados—governed by membrane stress curvature effects. Under thermal loading alone, opening bending occurs, with larger-magnitude compressive hoop stresses at the top and bottom and tensile stresses at the intrados and extrados, attributable to ovalization and nonuniform circumferential stiffness. Under either single loading, peak stress locations remain fixed with increasing load magnitude. Under combined loading, thermal contraction dominates, producing net opening bending while the peak stress location shifts with operating conditions.
(2) The peak von Mises stress location shifts from the intrados side (55°) toward the crown (83°) as internal pressure increases under combined loading. This migration results from competition between the thermal-induced opening moment and the pressure-induced closing moment; higher internal pressure strengthens the closing effect, shifting the peak location toward the crown.
(3) The RSM and MLR models can provide reasonable predictions of the peak stress magnitude and its location, respectively, within the investigated range. The second-order RSM model shows good accuracy within the investigated range, with temperature exerting a stronger effect than pressure and their interaction being significant. The MLR model partitions the temperature–pressure space into three regions (0°, 57°, 83°), with linear decision boundaries that agree well with the finite element validation within the investigated range. This suggests that temperature and pressure jointly govern the peak stress location and exert opposite effects along the boundaries. Together, the two models provide a quantitative tool for risk-based inspection planning.
(4) A fourth-order deformation component is identified in the elbow cross-section under thermal loading. Fourier analysis confirms superposition of second-order ovalization and fourth-order components. The second-order component (m = 2) governs hoop stress via stiffness variation, while the fourth-order component (m = 4) underlies the four-lobed alternating axial stress distribution via local curvature changes. This finding extends classical ovalization-only elbow theory and carries theoretical significance within thin-shell theory.
The present study focuses on a single pipe geometry (D/t = 100, R/D = 1). The migration behavior and classification boundaries of the peak stress under thermal–mechanical coupling require further investigation for pipelines with varying diameter-to-thickness ratios, bend radius ratios, and more complex configurations. In addition, the interpretation of membrane stress dominance is based on the outer-wall stress distribution; without a through-wall decomposition into membrane and bending components, this conclusion should be regarded as an interpretation rather than a rigorous decomposition of the stress state. Future work may extend the current framework by performing through-wall stress decomposition to rigorously quantify the contributions of membrane and bending components. It is also recommended that future studies establish normalized decision boundary maps covering a wider range of geometric parameters to enhance the engineering applicability of the model.
Author Contributions
S.Z.: Writing—Original Draft, Methodology; T.L.: Investigation, Visualization; Q.Q.: Investigation, Review and Editing; J.X.: Investigation, Review and Editing; D.H.: Investigation, Review and Editing; R.L.: Writing—Review and Editing, Project Administration. All authors have read and agreed to the published version of the manuscript.
Funding
This research received no external funding.
Data Availability Statement
The original contributions presented in this study are included in the article. Further inquiries can be directed to the corresponding author.
Conflicts of Interest
Author Qi Qin was employed by the company Zhejiang Oilfield Branch, China National Petroleum Corporation. Author Jianlong Xu was employed by the company Zhongkong Innovation (Beijing) Energy Technology Co., Ltd. Author Rongsheng Lin was employed by the company Xinjiang Jurong Energy (Group) Co., Ltd. The remaining authors declare that the research was conducted in the absence of any commercial or financial relationships that could be construed as a potential conflict of interest.
References
- Deng, Y.; Liu, Z.; Zhang, T.; Zhou, L.; Yu, B. Numerical simulation of throughput enhancement in natural gas pipelines via direct LNG injection. Energy 2026, 350, 140723. [Google Scholar] [CrossRef] [Scilit]
- Chen, H.; Wu, T.; Wan, Z.; Wang, H.; Xu, P.; Yang, G.; Wu, J. Numerical analysis of LNG rollover in large membrane tank under sloshing excitations. Energy 2025, 315, 134351. [Google Scholar] [CrossRef] [Scilit]
- Wang, K.; Liu, Z.Y.; Qian, X.; Huang, P. Long-term consequence and vulnerability assessment of thermal radiation hazard from LNG explosive fireball in open space based on full-scale experiment and PHAST. J. Loss Prev. Process Ind. 2017, 46, 13–22. [Google Scholar] [CrossRef] [Scilit]
- Wang, J.; Tian, C.; Zhang, G.; Liang, Y.; Guo, Y.; Song, Z. Consequence assessment of large-scale pool fires at an LNG receiving terminal. J. Loss Prev. Process Ind. 2025, 99, 105830. [Google Scholar] [CrossRef] [Scilit]
- Yue, C.; Chen, L.; Xiang, H.; Xu, L.; Yang, S.; Li, Z.; Xia, C.; Fang, Q. Assessment of cascading accidents of frostbite, fire, and explosion caused by liquefied natural gas leakage. Adv. Civ. Eng. 2020, 2020, 8867202. [Google Scholar] [CrossRef] [Scilit]
- Li, Y.Y.; Oyang, D.; Song, M.; Shi, H.X. The response characteristics and damage effects of large LNG storage tanks subject to the coupled effects of explosion shock waves and fire. Nat. Gas Ind. B 2024, 11, 303–315. [Google Scholar] [CrossRef] [Scilit]
- Li, W.; Wang, P. Numerical simulation of gas explosion in a LNG terminal. In Proceedings of the 3rd International Symposium on Safety Science and Technology. Progress in Safety Science and Technology; Science Press: Beijing, China, 2002; Volume III, pp. 1077–1081. [Google Scholar]
- Li, M.; Zhou, Y.; Yu, B.; Shi, G.Z.; Xia, H.B. Low-temperature heat transfer and stress analysis of LNG loading arm pipeline supports. J. Phys. Conf. Ser. 2022, 2395, 012002. [Google Scholar] [CrossRef] [Scilit]
- Hao, G.; Hu, H.; Liu, X.; Duan, Z. Field Application Research on On-Line Inspection Technology for LNG Pipelines LNG Pipeline On-Line Inspection Technology Pilot Study and Field Validation. In Proceedings of the International Conference on Energy Engineering and Environmental Engineering; Springer Nature: Cham, Switzerland, 2025; pp. 291–301. [Google Scholar]
- Liang, X.; Li, Y.; Zhuo, H.; Zheng, J.; Ma, W.; Wang, K.; Ren, J.; Dang, W.; Nie, H. Perforation failure analysis of pipeline elbow at a receiving station. Eng. Fail. Anal. 2024, 158, 108071. [Google Scholar] [CrossRef] [Scilit]
- Liu, Q.; Yu, H.; Zhu, G.; Tong, K.; Wang, P.-B.; Song, S.-Y. Investigation of weld cracking of a BOG booster pipeline in an LNG receiving station. Eng. Fail. Anal. 2021, 122, 105247. [Google Scholar] [CrossRef] [Scilit]
- Huang, Y.; Li, Y.; Li, Y.; Chen, H.; Liu, K.; Zhu, Z.; Feng, Z.; Feng, H.; Nong, J.; Zhang, X. Failure analysis of cryogenic valve in liquefied natural gas storage and distribution station. Eng. Fail. Anal. 2026, 184, 110328. [Google Scholar] [CrossRef] [Scilit]
- Vijaya Kumar, S.D.; Karuppanan, S.; Perumal, V.; Ovinis, M. Failure pressure prediction of high-strength steel pipe bend considering pipe and corrosion geometry. Discov. Appl. Sci. 2024, 6, 165. [Google Scholar] [CrossRef] [Scilit]
- Wang, Y.; Zhou, H.; Liu, X. Stress Analysis and Crack Formation Mechanism of Cryogenic LNG Pipeline. In Proceedings of the Pressure Vessels and Piping Conference; American Society of Mechanical Engineers: New York, NY, USA, 2025; p. V003T03A015. [Google Scholar]
- Gong, D.; Zhao, L.; Han, G. Design and experimental validation of mmm-based pipeline stress concentration detection system. Results Eng. 2025, 27, 106834. [Google Scholar] [CrossRef] [Scilit]
- Xu, Q.; Gao, B.; Fan, X.; Sun, W.; Yan, G.; Gao, H.; Guo, A.; Lin, P.; Zhang, M.; Ren, H. Numerical simulation and safety control strategy of LNG storage tank and pipeline pre-cooling process. J. Phys. Conf. Ser. 2025, 3084, 012035. [Google Scholar] [CrossRef] [Scilit]
- Fonseca, E.M.M.; Melo, F.J.M.Q.D.; Oliveira, C.A.M. The thermal and mechanical behaviour of structural steel piping systems. Int. J. Press. Vessels Pip. 2005, 82, 145–153. [Google Scholar] [CrossRef] [Scilit]
- Ramaswami, P.; Velmurugan, P.S.; Rajasekar, R. Effect of Ovality in Inlet Pigtail Pipe Bends Under Combined Internal Pressure and In-Plane Bending for Ni-Fe-Cr B407 Material. Arch. Metall. Mater. 2017, 62, 1881–1887. [Google Scholar] [CrossRef] [Scilit][Green Version]
- Yang, W.G.; Li, X.Y.; Gao, W.; Mi, X.; Zhang, J. Research on the temperature variation law during the nitrogen pre-cooling process in LNG unloading pipelines. Int. J. Heat Mass Transf. 2024, 228, 125678. [Google Scholar]
- Wu, C.; Zhang, J.; Cheng, Z.; Wang, J.; Zhang, Y.; Liu, J. Transient thermal analysis on precooling process of LNG cryogenic corrugated hose. China Offshore Oil Gas 2023, 35, 165–172. [Google Scholar]
- Zhou, H.Y.; Sun, X.; Di, T.; Liu, X.; Zhang, H. A numerical study on flow and heat transfer characteristics of the LNG storage tank feed pipeline. J. Pipeline Sci. Eng. 2026, 6, 100396. [Google Scholar] [CrossRef] [Scilit]
- Soares, G.; Rodrigues, M.; Santos, L. Influence of temperature on mechanical properties, fracture morphology and strain hardening behavior of a 304 stainless steel. Mater. Res. 2017, 20, 20217. [Google Scholar] [CrossRef] [Scilit]
- Woong, S.; Seong, W.; Myung, H.; Lee, J.M. Strain-rate effects on the mechanical behavior of the AISI 300 series of austenitic stainless steel under cryogenic environments. Mater. Des. 2010, 31, 3630–3640. [Google Scholar] [CrossRef] [Scilit]
- Tomota, Y.; Xia, Y.; Inoue, K. Mechanism of low temperature brittle fracture in high nitrogen bearing austenitic steels. Acta Mater. 1998, 46, 1577–1587. [Google Scholar] [CrossRef] [Scilit]
- Baek, J.; Kim, Y.; Kim, W.; Kho, Y.-T. Fracture toughness and fatigue crack growth properties of the base metal and weld metal of a type 304 stainless steel pipeline for LNG transmission. Int. J. Press. Vessels Pip. 2001, 78, 351–357. [Google Scholar] [CrossRef] [Scilit]
- Sanchez, J.; Galao, O.; Torres, J.; Fullea, J.; Andrade, C.; Garcia, J.C.; Ruesga, J.; Cano, P. 40 years old LNG stainless steel pipeline: Characterization and mechanical behaviour. Eng. Fail. Anal. 2017, 79, 876–888. [Google Scholar] [CrossRef] [Scilit]
- BS EN 13480-3; Metallic Industrial Piping—Part 3: Design and Calculation. British Standards Institution: London, UK, 2002.
- ASME B31.1; Power Piping. ASME Code for Pressure Piping, B31. American Society of Mechanical Engineers: New York, NY, USA, 2018.
- Hwang, S.Y.; Kim, M.S.; Lee, J.H. Thermal stress analysis of process piping system installed on LNG vessel subject to hull design loads. J. Mar. Sci. Eng. 2020, 8, 926. [Google Scholar] [CrossRef] [Scilit]
- Lou, Y.F.; Li, H.B.; Hu, Y.X.; Gui, J.; Huang, P. Numerical simulation of plastic buckling of LNG pipeline π-shaped compensator with large diameter–thickness ratio under monotonic displacement. Geosystem Eng. 2025, 28, 119–128. [Google Scholar] [CrossRef] [Scilit]
- He, B.Y.; Jiao, B.B.; Wan, Q.H.; Nie, R.; Yang, J. Strength and tightness evaluation method for pipe flange connections considering thermal effects. Int. J. Press. Vessels Pip. 2024, 210, 105237. [Google Scholar]
- Von Kármán, T. Über die Formänderung dünnwandiger Rohre, insbesondere federnder Ausgleichrohre. Z. Ver. Dtsch. Ingenieure 1911, 55, 1889–1895. [Google Scholar]
- Rodabaugh, E.C.; George, H.H. Effect of internal pressure on the flexibility and stress intensification factors of curved pipe or welding elbows. Trans. ASME 1957, 79, 939–948. [Google Scholar] [CrossRef] [Scilit]
- Jaćimović, N. Uncertanties in expansion stress evaluation criteria in piping codes. Int. J. Press. Vessels Pip. 2019, 169, 230–241. [Google Scholar] [CrossRef] [Scilit]
- Wang, S.; Shi, R.; Wu, J.; Yang, C.; Liu, H. Investigation on optimization of finite element model for stress analysis of 12Cr1MoV main steam pipeline elbow. Crystals 2025, 15, 207. [Google Scholar] [CrossRef] [Scilit]
- Sobel, L.H.; Newman, S.Z. Simplified, detailed and isochronous analysis and test results for the in-plane elastic-plastic and creep behavior of an elbow. J. Press. Vessel Technol. 1986, 108, 297–304. [Google Scholar] [CrossRef] [Scilit]
- Gresnigt, A.M. Plastic design of buried steel pipelines in settlement areas. Heron 1986, 31, 1–113. [Google Scholar]
- Karamanos, S.A.; Giakoumatos, E.; Gresnigt, A.M. Nonlinear response and failure of steel elbows under in-plane bending and pressure. J. Press. Vessel Technol. 2003, 125, 393–402. [Google Scholar] [CrossRef] [Scilit]
- Karamanos, S.A.; Tsouvalas, D.; Gresnigt, A.M. Ultimate bending capacity and buckling of pressurized 90 deg steel elbows. J. Press. Vessel Technol. 2006, 128, 348–356. [Google Scholar] [CrossRef] [Scilit]
- Bathe, K.J.; Almeida, C.A. A pipe elbow element for nonlinear analysis of piping systems. In Proceedings of the 4th International Conference on Structural Mechanics in Reactor Technology, San Francisco, CA, USA, 15–19 August 1977. [Google Scholar]
- Karamanos, S.A.; Tassoulas, J.L. Advanced finite element formulation for the analysis of buried pipe elbows. In Proceedings of the 1996 ASME Pressure Vessels and Piping Conference, Montreal, QC, Canada, 21–26 July 1996. [Google Scholar]
- Simandjuntak, S.; Lin, B.; Affendy, B.; Akther, F. Combined residual stresses and fluid-structure interaction finite element analysis on bent pipes. Int. J. Press. Vessels Pip. 2021, 194, 104506. [Google Scholar]
- Gong, C.; Guo, S.; Zhang, R.; Frangopol, D.M. Prediction of burst pressure of corroded thin-walled pipeline elbows subjected to internal pressure. Thin-Walled Struct. 2024, 196, 111501. [Google Scholar] [CrossRef] [Scilit]
- Kim, D.J.; Hwang, J.H.; Park, S.H.; Hong, S.-P. Elastic stress analysis of complex piping junctions: Solution for elbow-straight pipe configurations under internal pressure. Int. J. Precis. Eng. Manuf. 2026, 27, 205–224. [Google Scholar] [CrossRef] [Scilit]
- Ramos-Cruz, L.; Hernández-Gómez, L.H.; Garibaldi-Márquez, F.; García-Illescas, R.; Armenta-Molina, A.; Guzman-Escalona, M.A.; García, A.V. Environmentally assisted fatigue and fracture analysis in a pipe elbow under thermal transients. Appl. Sci. 2026, 16, 2782. [Google Scholar] [CrossRef] [Scilit]
- Karamanos, S.A. Mechanical behavior of steel pipe bends: An overview. J. Press. Vessel Technol. 2016, 138, 041203. [Google Scholar] [CrossRef] [Scilit]
- ASME B31.3-2020; Process Piping. ASME Code for Pressure Piping, B31. American Society of Mechanical Engineers: New York, NY, USA, 2020.
- Mechanics Laboratory, Department of Machinery, East China Petroleum Institute. Large diameter 90 elbow strength test study. J. East China Pet. Inst. 1977, 2, 89–110+154. [Google Scholar]
- Song, H.; Dan, J.; Li, J.; Du, J.; Xiao, J.; Xu, J. Experimental study on the cutting force during laser-assisted machining of fused silica based on the Taguchi method and response surface methodology. J. Manuf. Process. 2019, 38, 9–20. [Google Scholar] [CrossRef] [Scilit]
- Sharma, V.; Shivalingaiah, S.; Peng, Y.; Euhus, D.; Gryczynski, Z.; Liu, H. Auto-fluorescence lifetime and light reflectance spectroscopy for breast cancer diagnosis: Potential tools for intraoperative margin detection. Biomed. Opt. Express 2012, 3, 1825–1840. [Google Scholar] [CrossRef] [Scilit] [PubMed]
- Abdulhameed, D.; Adeeb, S.; Cheng, R.; Martens, M. The influence of the Bourdon effect on pipe elbow. In Proceedings of the International Pipeline Conference; American Society of Mechanical Engineers: New York, NY, USA, 2016; p. V003T05A037. [Google Scholar]

Disclaimer/Publisher’s Note: The statements, opinions and data contained in all publications are solely those of the individual author(s) and contributor(s) and not of MDPI and/or the editor(s). MDPI and/or the editor(s) disclaim responsibility for any injury to people or property resulting from any ideas, methods, instructions or products referred to in the content. |
© 2026 by the authors. Licensee MDPI, Basel, Switzerland. This article is an open access article distributed under the terms and conditions of the Creative Commons Attribution (CC BY) license.