


Abstract
A digital twin (DT) of an underground utility tunnel is valuable only if it remains synchronized with the physical asset. The objective of this study is to maintain this synchronization for an operational tunnel by automatically detecting displacements of linear and point assets, using only the fixed sensors already deployed in the tunnel. However, most DT research emphasizes design and construction, rather than operational-phase change detection. The BIM–GIS-based framework of our previous study was limited to relative-coordinate reporting, offline updating, and indoor mock-up validation. To this end, this study introduces a multimodal displacement detection framework with an automated, event-driven update workflow, which addresses these limitations and is demonstrated in an operational tunnel. Linear-object sag (power cables) is extracted from sparse, fixed fiber-scan LiDAR by adapting a recursive terrain-fragmentation ground filter into a wall-as-ground context. Point-object displacement (fire extinguishers) is detected using a single fixed CCTV camera, combining a YOLOv5 detector with a perspective transform to recover absolute coordinates in a GNSS-denied corridor and differentiate between moved and toppled assets. Detected displacements are serialized as JSON and streamed via a Kafka broker into the DT service environment, integrating heterogeneous events into a unified synchronization workflow. Field validation against a co-located survey-grade scanner confirmed agreement within the 0.10 m operational validation tolerance for nominal sags of 7, 10, and 15 cm, with the largest residual at the smallest deflection. The framework maintains the virtual model consistent with a physical tunnel without additional instrumentation, enhancing disaster prevention and response.
1. Introduction
Smart cities depend on the continuous and reliable operation of their physical infrastructures, a significant portion of which is increasingly located underground. Utility tunnels consolidate essential urban lifelines—including electrical power, communications, water supply, and heating—within a single subterranean corridor. This integration minimizes the need for repeated excavation and shields critical services from surface-level hazards [1,2]. However, a single fault within these tunnels can propagate damage to both the underground and surface environments, making their operation, maintenance, and disaster safety fundamental to urban resilience. Conventional visual inspections, nevertheless, remain intermittent and difficult because of the confined, low-light, and access-restricted nature of these spaces, highlighting the need for data-driven, cyber-physical solutions that leverage three-dimensional spatial information.
Digital twins (DTs) have emerged as a foundational technology for smart cities, providing a virtual representation of physical assets that enables real-time monitoring, predictive maintenance, and data-driven decision-making in urban management [3,4,5]. In the context of the urban subsurface, a DT that integrates building information modeling with a geographic information system (BIM-GIS) delivers both the geometric fidelity and spatial-analytic capability required for effective utility tunnel management [6]. The operational value of such a DT fundamentally depends on continuous synchronization: the virtual model must accurately mirror real-time changes in the physical asset. Without this alignment, discrepancies between the cyber and physical layers emerge, undermining the twin’s ability to support reliable decision-making. For example, power cables may sag over time, and movable assets such as fire extinguishers can be displaced or knocked over. If such changes go undetected, the DT gradually loses fidelity—often in precisely those areas where safety-critical decisions rely on accurate information. Maintaining alignment between digital and physical environments is therefore essential for leveraging urban DT in effective disaster prevention and response operations.
Achieving synchronization in operational underground environments presents unique challenges that set them apart from outdoor or laboratory monitoring scenarios. The absence of global positioning signals precludes the use of GNSS for absolute localization. Fixed, lightweight sensors designed for continuous deployment, such as fiber-scan light detection and ranging (LiDAR), yield point clouds with significantly lower density compared with survey-grade scanners, thereby complicating reliable object extraction. Closed-circuit television (CCTV) systems are typically limited to single, fixed monocular cameras, which lack depth perception and are prone to perspective distortion. Moreover, although DTs for urban environments have gained considerable attention, the majority of research has focused on above-ground planning, design, and decision support. By contrast, operational-phase change detection for underground infrastructure under these stringent constraints remains comparatively underexplored [7,8,9].
Recent advances are also reshaping the two technical pillars of this work. On the perception side, foundation models and large-scale AI models are increasingly coupled with digital twins for infrastructure monitoring and scene understanding [10,11,12]. On the localization side, absolute localization from monocular vision in GNSS-denied environments—including model- and floor-plan-based visual localization and LiDAR/visual SLAM in tunnels and other underground spaces—has progressed rapidly [13,14,15,16]. However, these approaches generally presume dense sensing, large training corpora, or exploratory mobile platforms; continuous displacement monitoring of an operational utility tunnel from sparse, fixed sensors has received comparatively little attention. This study therefore adapts established, deployable techniques—ground filtering and planar homography—to these operational constraints.
In our previous work, we introduced a BIM-GIS-based DT of an underground utility tunnel, accompanied by an algorithm that decomposes the tunnel environment into point, line, and plane objects. These objects are extracted from multimodal image-sensor data using region-growing segmentation, random sample consensus (RANSAC), and an octree for change detection [6]. Related studies established the foundational methods for geospatial data acquisition, modeling, and depth estimation [17,18]. However, that framework demonstrated three explicit limitations: displacement measurements were restricted to relative coordinates, precluding accurate absolute displacement; updates required offline, manual comparison rather than automated transmission; and the algorithm was validated only with sample data from an indoor mock-up, rather than in a live operational tunnel. The present study is designed specifically to resolve these gaps and, in doing so, to make the underground twin a synchronized component of the smart city.
The objective of this study is to keep the DT of an operational underground utility tunnel synchronized with its physical counterpart, using only the fixed sensors already deployed in the tunnel. To this end, we propose a multimodal displacement detection framework with an automated, event-driven update workflow to enable DT synchronization for operational underground utility tunnels, validated through deployment in a live testbed (Ochang tunnel). Our approach extracts linear objects, such as power-line sag, from sparse fixed fiber-scan LiDAR data, whereas point objects, such as fire extinguishers, are localized using a single fixed CCTV camera. Detected displacements were encoded as structured messages and transmitted automatically to the DT upon event detection. The primary contributions of this study are as follows.
- A novel linear-object extraction method that adapts a recursive terrain fragmentation (RTF) ground filter to a wall-as-ground (X-up) reference frame, enabling effective cable–wall separation and sag quantification from low-density fiber-scan point clouds.
- A point-object localization technique that integrates YOLOv5 detection with a perspective transform (homography), allowing recovery of absolute model-plane coordinates in the georeferenced DT frame from a single fixed monocular camera in a GNSS-denied environment, and distinguishing between moved and fallen assets.
- An automated event-driven update pipeline in which the extracted displacements are serialized as JSON and transmitted via Kafka into the DT service environment, facilitating seamless integration of heterogeneous sensor data into a unified synchronization workflow.
- Quantitative field validation against a survey-grade LiDAR within the operational tunnel, demonstrating that the framework reliably meets the 0.10 m operational validation tolerance.
The remainder of this paper is organized as follows: Section 2 reviews the related studies on urban and underground DTs, point-cloud change detection, and vision-based localization. Section 3 details the test bed, sensors, DT model, displacement extraction methodologies, and pipeline updates. Section 4 presents the results and field validation. Section 5 discusses the implications for smart-city operations and outlines current limitations. Section 6 concludes the paper.
2. Literature Review
2.1. Digital Twins of Urban and Underground Infrastructure and BIM-GIS Integration
DT technology enables the creation of a virtual replica of a physical process, product, or facility, facilitating real-time analysis, early problem detection, and the evaluation of candidate solutions [3,4,5]. Its applications now extend across manufacturing, construction, transportation, and healthcare, where virtual replicas are leveraged to anticipate failures, optimize designs, and recreate hazardous scenarios. In the context of the built environment, building information modeling (BIM) provides detailed geometric and semantic representations of facilities, whereas a geographic information system (GIS) captures, analyzes, and visualizes the surrounding geospatial context. The integration of BIM and GIS (BIM-GIS) delivers both component-level fidelity and spatial-analytic capabilities, enhancing planning, construction, maintenance, and risk management [6].
For underground utility tunnels, DTs offer significant advantages owing to the inherent challenges and risks associated with conventional inspection methods. Virtual models can continuously monitor structural integrity—such as stress, strain, and vibration—by incorporating real-time sensor data into the DT [1,2]. Recent advancements have combined machine learning with tunnel monitoring to address structural problems [19,20], and Internet-of-Things-enabled DTs have been applied to smart tunnel fire-safety management [21], whereas prior studies within the present project have established geospatial acquisition, modeling, and depth-estimation frameworks necessary for developing an underground tunnel DT [6,17,18]. At the urban scale, urban DTs have garnered considerable attention [12,22]; however, a recent systematic review indicates that, despite substantial technical progress, their practical impact on urban operations and decision-making remains limited. This gap is attributed in part to challenges in maintaining synchronization between digital models and their physical counterparts [9]. Similarly, reviews of DT applications in construction highlight a predominant focus on the design and construction phases, with comparatively less emphasis on the operational phase [7,8]. The challenge of synchronization—maintaining consistency between an operational DT and a continuously evolving physical asset—remains only partially resolved for underground infrastructure.
2.2. Point-Cloud-Based Spatial Object Extraction and Change Detection
LiDAR technology determines distances by measuring the round-trip time of emitted light pulses, generating point clouds that are widely utilized for precise 3D mapping and temporal change detection [23]. These datasets are typically processed using libraries such as the Point Cloud Library or Open3D, which provide functionalities for filtering, normal and curvature estimation, registration, and shape recognition [24]. For object extraction, segmentation algorithms group spatially proximate points into coherent entities; region-growing segmentation is frequently employed, whereas RANSAC is frequently used to distinguish planar structures (floors, ceilings, and walls) from objects of interest. To localize changes in three dimensions, octree structures efficiently encode large point clouds and identify displacements by tracking the presence or absence of points across temporal datasets [6].
However, two significant challenges persist in the context of underground operations. First, a significant portion of the existing processing pipeline presumes relatively dense, well-registered point clouds. By contrast, fixed, lightweight sensors designed for continuous operation, such as fiber-scan LiDAR, produce sparse, pattern-dependent data, on which conventional segmentation degrades. Recent deep-learning pipelines for tunnel point clouds likewise presume dense mobile laser scanning [25,26]. Second, distinguishing linear assets (e.g., power cables) from surrounding structures is particularly challenging in the absence of a consistent ground plane. In this regard, ground-filtering algorithms developed for airborne LiDAR are a useful reference: the RTF filter, for example, models terrain as locally planar, homogeneous facets and recursively classifies ground and non-ground points through downward and upward fragmentation processes [27,28]. Such filters are well established for extracting terrain from aerial surveys. However, their application within tunnel environments—where the reference surface is a wall, rather than the floor—remains largely unexplored.
2.3. Vision-Based Object Localization in GNSS-Denied Indoor Environments
For point-type assets monitored by fixed cameras, deep learning-based object detection provides robust recognition under various illumination conditions. Single-stage detectors from the YOLO family are widely adopted for real-time detection tasks and have been demonstrated to be effective in safety equipment and facility monitoring applications owing to their favorable speed-accuracy trade-off [29,30]. However, object detection alone yields image-plane bounding boxes, which do not provide the spatial coordinates required to update the DT.
The complementary challenge is to recover metric or model-referenced positions from a single monocular image [13,14,15]. In a GNSS-denied underground corridor equipped with a single fixed camera, neither satellite-based positioning nor stereo depth information is available. However, the planar geometry of the scene can be leveraged: a perspective transform (homography) enables the mapping of image coordinates to a target plane, provided that four or more point correspondences are established. This technique is routinely employed for distortion correction and viewpoint rectification [31]. By associating image points with known 3D model coordinates, the homography can project the image position of a detected object into the absolute coordinate frame of the DT. Integrating a YOLO-based detector with such a transformation—where detection informs localization and localization enables displacement quantification—has received limited attention in the context of underground asset monitoring and is among the methods developed in this study.
2.4. Summary and Research Gap
In summary, although the integration of BIM-GIS DTs of underground tunnels is highly justified, these models are rarely synchronized with the operational physical asset. Existing point-cloud extraction and change-detection techniques are robust for dense survey data, but their performance diminishes with sparse, fixed-sensor inputs, and they lack strategies tailored to the linear nature of tunnel assets. Similarly, vision-based detection methods are effective for object identification but do not inherently provide the absolute spatial coordinates necessary for updating DTs in a GNSS-denied environment. This study addresses these challenges through a multimodal framework that: (i) adapts an RTF ground filter into a wall-as-ground reference frame to enable linear-object sag extraction from fiber-scan LiDAR data, (ii) combines YOLOv5-based object detection with a perspective transformation to achieve absolute localization of point objects from a single fixed camera, and (iii) integrates both approaches into an automated event-driven update pipeline, validated within an operational tunnel.
3. Methods
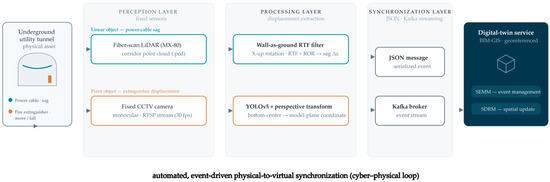
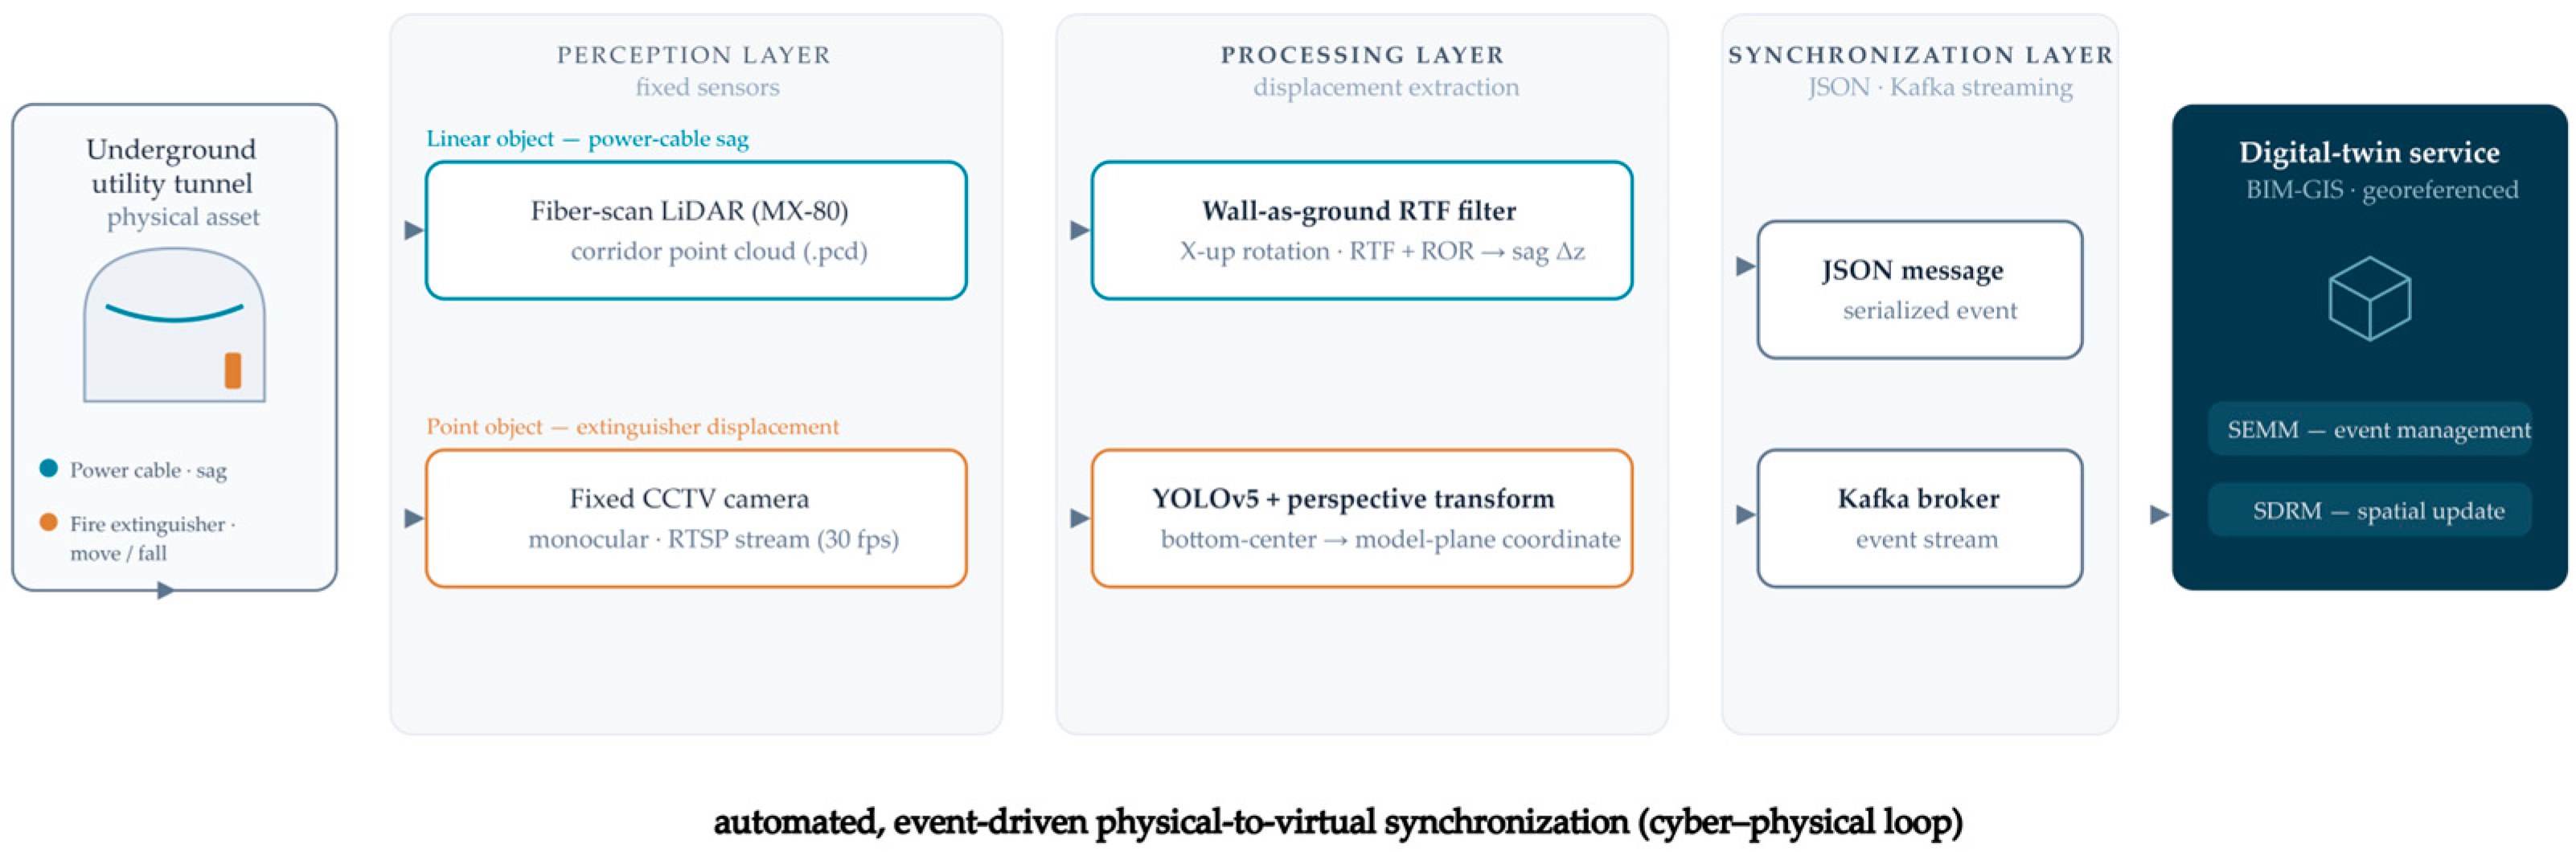
An overview of the proposed framework is shown in Figure 1: Each monitored asset is paired with a sensing modality, and the resulting displacement measurements are consolidated into a single automated event-driven data channel that synchronizes the DT with the physical tunnel. The following sections detail the testbed and sensor configurations, describe the two displacement extraction methodologies, and outline the update pipeline.
Figure 1.
Three-layer architecture of the proposed multimodal displacement-detection and DT-synchronization framework. The perception layer acquires sparse point clouds from the fixed fiber-scan LiDAR and image frames from the fixed CCTV stream. In the processing layer, cable sag is extracted through wall-as-ground RTF filtering and radius-outlier removal, whereas fire-extinguisher displacement and state are obtained through YOLOv5 detection and homography-based model-plane localization. In the synchronization layer, the resulting event data are serialized as JSON and transmitted through Kafka to the DT service environment.
3.1. Testbed, Sensors, and Digital Twin Model
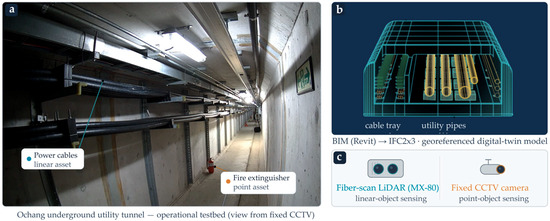
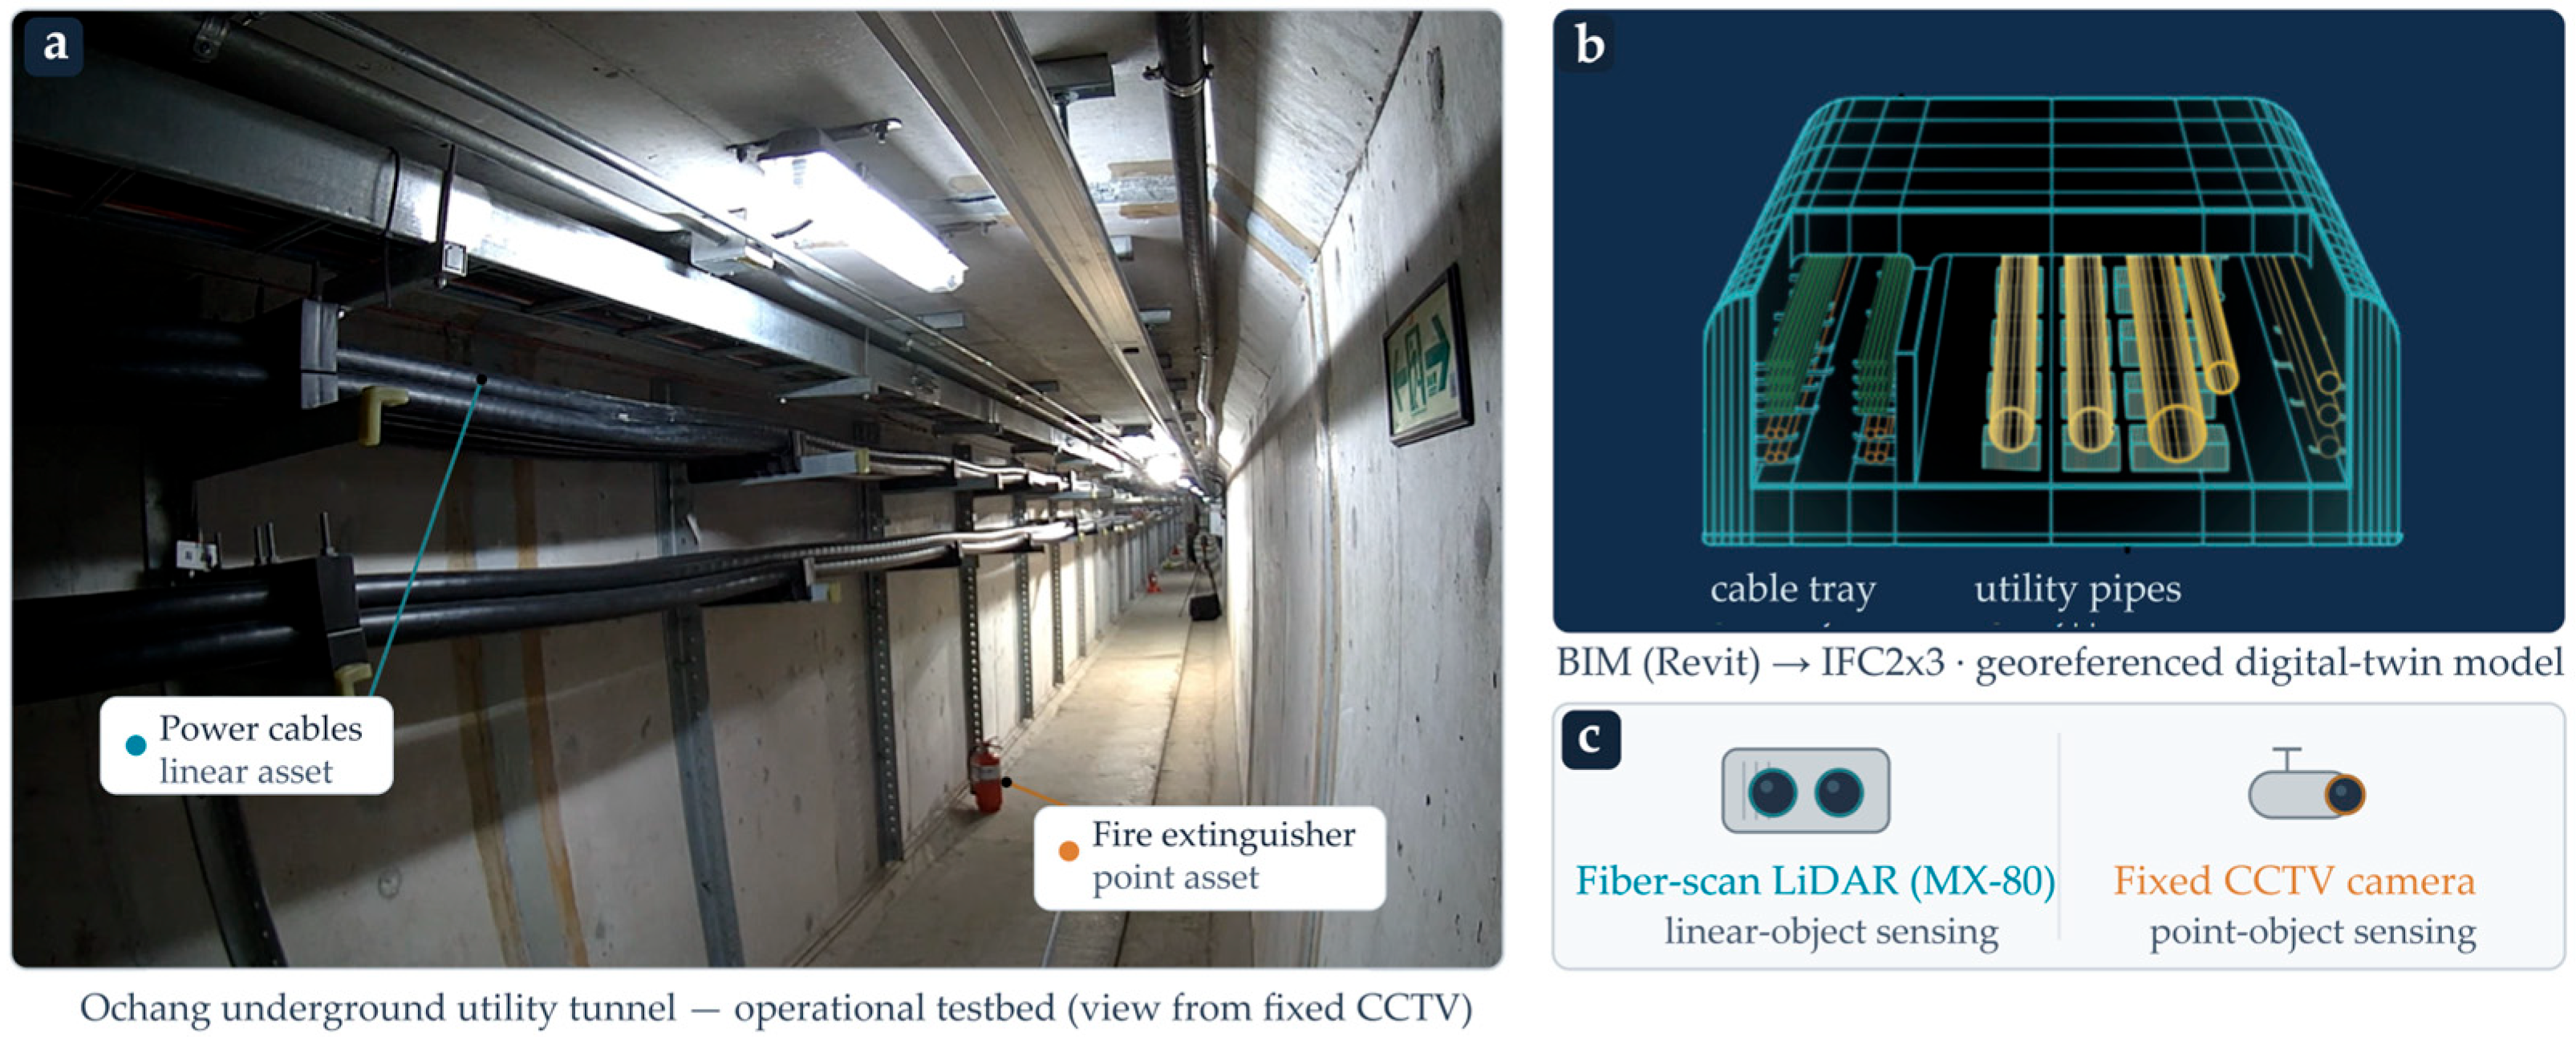
The study was conducted in the Ochang underground utility tunnel, utilizing a demonstration segment of this operational facility as the test bed (Figure 2). Two fixed sensing modalities that had already been deployed for continuous operation were employed (Figure 2c). The first modality is a fiber-scan lightweight LiDAR (MX-80) installed in the power-cable section, which streams point clouds (.pcd) of the corridor. Compared with survey-grade scanners, this device provides lower point density and demonstrates a sensor-specific scan pattern. The second modality is a fixed low-light CCTV camera monitoring the same corridor (Figure 2a), accessed via an RTSP stream, and recorded in MP4. All data processing and transmission were performed on an on-site DT service (DTS) server, with its hardware and software specifications listed in Table 1.
Figure 2.
Testbed, sensors, and digital-twin model: (a) operational testbed segment of the Ochang underground utility tunnel viewed from the fixed CCTV camera, with the monitored assets indicated (power cables, linear asset; fire extinguisher, point asset); (b) georeferenced digital-twin model authored in Revit and converted to IFC2x3, showing the cable trays and utility pipes; (c) fixed sensing modalities deployed in the corridor—the fiber-scan LiDAR (MX-80) for linear-object sensing and the fixed CCTV camera for point-object sensing.
Table 1.
Hardware and software configuration of the on-site DTS server.
The DT is based on a BIM authored in Revit 2025 (.rvt) and converted to IFC2x3 for service use (Figure 2b). Both the original BIM and IFC service models utilize a shared, georeferenced coordinate system, ensuring positional consistency between the two representations. This unified coordinate framework is essential for the absolute coordinate localization detailed in Section 3.3. The model was updated from the most recent LiDAR scans to incorporate newly installed equipment and was organized on a cell-by-cell basis, with per-object identifiers and attributes assigned to each object. While texturing and library construction were part of the DT preparation, they are peripheral to the displacement-detection methodology and are therefore only briefly summarized. Monitored assets are categorized into linear objects (e.g., power cables, treated as a single sag failure mode) and point objects (fire extinguishers), with dedicated processing pipelines for each category as described below.
3.2. Linear-Object Displacement Extraction from Fiber-Scan LiDAR
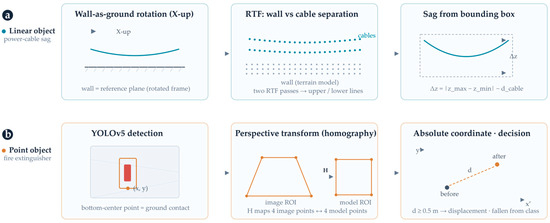
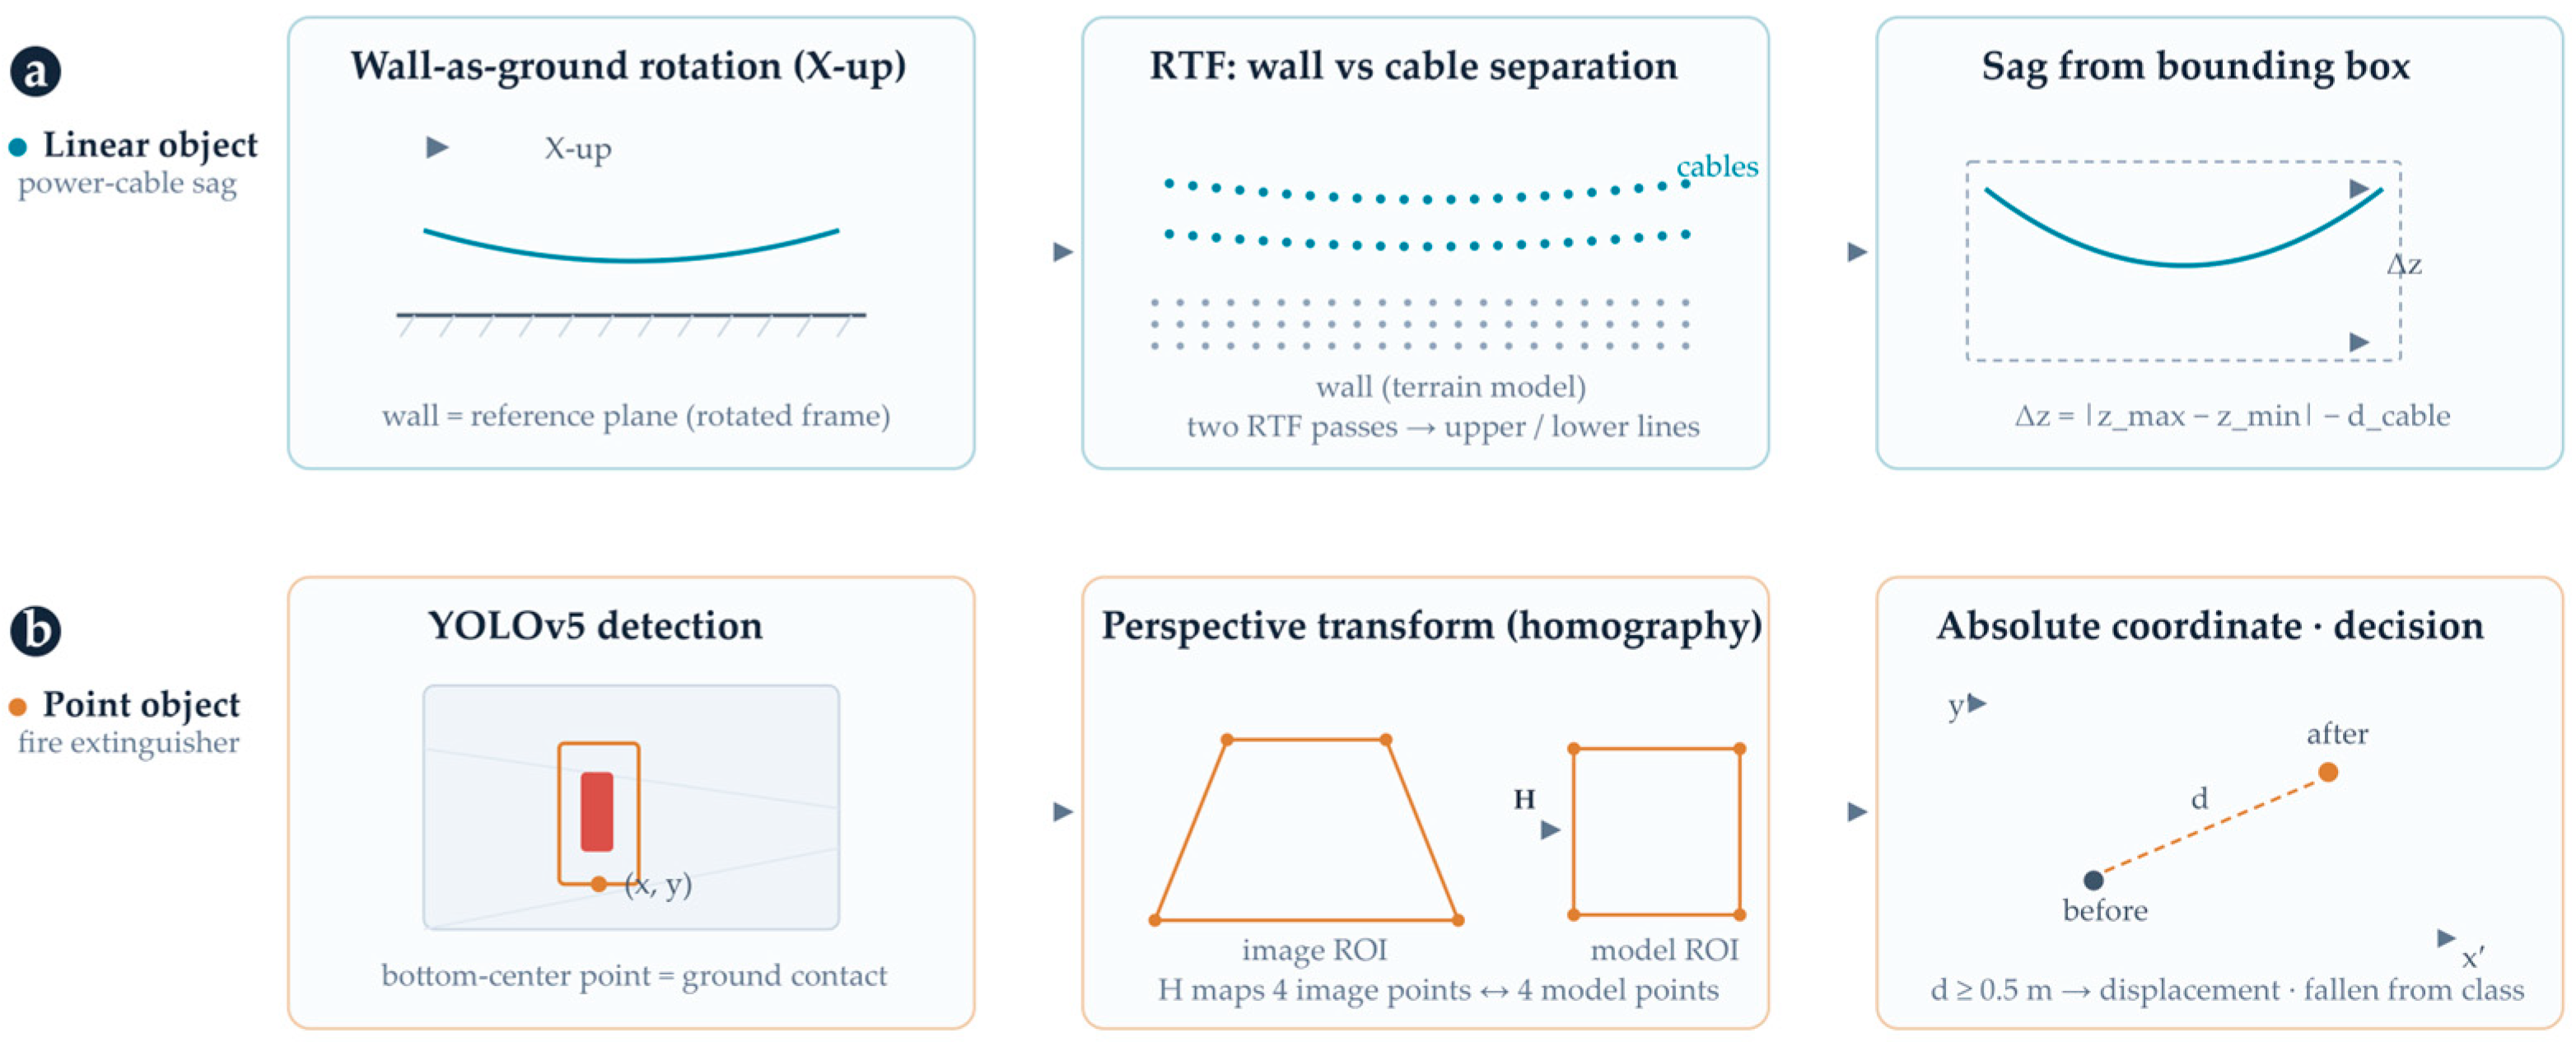
The linear-object pipeline is designed to isolate power cables from the surrounding structures within a sparse point cloud and to quantify their vertical sag. In the absence of a consistent floor plane for reference, the method adapted a ground-filtering strategy to a wall-as-ground configuration (Figure 3a).
Figure 3.
Asset-specific displacement-extraction methods. (a) The linear-object pipeline rotates the sparse LiDAR point cloud into an X-up frame, separates the wall and cables using RTF filtering, and calculates cable sag from the extracted line extent. (b) The point-object pipeline detects the fire extinguisher, identifies the bottom-center ground-contact point, and maps it to the georeferenced DT floor plane using a homography.
Filtering background. These two algorithms form the basis of this pipeline. The RTF filter assumes that natural terrain is locally simplified to homogeneous planar facets, modeling the surface as a composition of plane terrain models. Ground and non-ground points are classified through a two-stage process: downward terrain fragmentation, which constructs an initial coarse-to-fine surface, whereas upward terrain fragmentation subsequently reclassifies points within each triangulated facet to recover ground points [27,28]. The radius outlier removal (ROR) filter enhances noise removal by eliminating any point whose spherical neighborhood, defined by radius r, contains fewer than n neighboring points [24].
Preconditions. Reliable extraction is contingent upon the following: (i) The sensor, cable mounts, and wall must remain horizontal during acquisition, as displacement is calculated from an axis-aligned bounding box and no sensor-tilt compensation is applied. (ii) The number of linear objects to be extracted must be specified in advance, as this determines the number of algorithm passes required. (iii) The point pattern must remain consistent across captures; any change in sensor or acquisition conditions (such as point density or noise) will invalidate previously tuned parameters. (iv) The cable diameter (7 cm in the experiments) must be excluded when converting a height difference into sag.
Procedure. The point cloud was first rotated in an X-up orientation, aligning the wall as the ground surface. RTF was then applied independently along all three axes, and the points consistently identified as part of the terrain model are designated as the walls; the remaining points constitute the cable lines. To distinguish between upper and lower cable lines, RTF is executed a second time using distinct thresholds. The ROR filter is applied once during wall separation and again following the extraction of the lower cable line. To accommodate the sensor- and density-dependent scan patterns of the fixed fiber-scan LiDAR, four algorithm variants were available to the user (Table 2): Survey and FiberScan operate on before/after scan pairs to extract a single cable from survey-grade and fiber-scan data, respectively; FiberScan2 extracts two cables from a fiber-scan pair; and FiberScanOnly recovers the sag from the post-event scan alone, with no prior reference.
Table 2.
Extraction variants exposed by the software.
Sag computation. For each extracted line, the axis-aligned bounding box yields the vertical extent. The sag is calculated as follows:
where max and min denote the top and bottom elevations of the bounding box, respectively, and d_cable denotes the cable diameter. The result for each pass was written as an LAS file, with classes encoded in the header (wall = class 7, line = class 1), and a text file that records the bounding-box coordinates.
The complete wall-as-ground extraction procedure is formalized in Algorithm 1.
| Algorithm 1. Wall-as-ground linear-object extraction from a sparse fiber-scan point cloud. |
| Input: point cloud P; number of cables N; RTF thresholds Θ_wall, Θ_line,k; ROR parameters (r, n); cable diameter d_cable Output: wall class W; cable lines L_1…L_N; sag Δz_k per line 1: P ← Rotate(P, X-up) // align the wall as the reference “ground” 2: for each axis a ∈ {X, Y, Z} do G_a ← RTF(P, Θ_wall, a) 3: W ← G_X ∩ G_Y ∩ G_Z // consistently classified as terrain = wall 4: C ← P \ W // candidate cable points 5: C ← ROR(C, r, n) // noise removal during wall separation 6: for k = 1…N do // second RTF pass separates upper/lower lines 7: L_k ← RTF(C, Θ_line,k); C ← C \ L_k 8: if L_k is the lower line then L_k ← ROR(L_k, r, n) 9: B_k ← AxisAlignedBoundingBox(L_k) 10: Δz_k ← |B_k.z_max − B_k.z_min| − d_cable 11: return W, {L_k}, {Δz_k} // LAS export: wall = class 7, line = class 1 |
The tuned parameter values of the RTF thresholds, the ROR radius and minimum-neighbor counts, and the clustering settings (K-nearest-neighbor and minimum-cluster size), together with the rotation applied for the X-up alignment, are specific to the scan pattern of the deployed sensor and were tuned empirically on site; the tuned parameter configuration used in the field validation is available from the corresponding author upon reasonable request (see the Data Availability Statement).
3.3. Point-Object Localization from a Single Fixed CCTV Camera
The point-object pipeline detects fire extinguishers in CCTV imagery and maps their image positions to the absolute coordinate frame of the DT (Figure 3b). Two displacement modes were defined: movement (forward, backward or lateral) and falling (toppling).
Detection. A YOLOv5 detector [29,30] was trained to recognize two classes—an upright fire extinguisher and a fallen fire extinguisher, enabling explicit classification of toppled extinguishers rather than inferring their state from the bounding-box geometry. The training data combined frames captured from the tunnel CCTV stream (relabeled with the extinguisher positions) and an open dataset, both annotated and augmented in Roboflow. The augmentation settings and dataset partitioning used for training are available from the corresponding author upon reasonable request. Detections were retained at a confidence threshold of 0.7. An OpenCV-drawn bounding box was generated, and the bottom center point of the box was used as the ground contact of the asset.
YOLOv5 was selected because it was a mature and widely adopted detector when the on-site system was commissioned, with an established deployment ecosystem and a suitable speed–accuracy trade-off for the available server configuration (Table 1). The proposed framework treats the detector as a modular component: the localization contribution lies in coupling the detection output with the perspective transform, so that more recent detectors (e.g., YOLOv8–v11) can be substituted without altering the pipeline; benchmarking newer detector versions is identified as future work.
Image-to-model mapping. Given that the corridor is monitored by a single fixed monocular camera and GNSS positioning is unavailable underground, depth recovery is not possible. Instead, planar scene geometry is leveraged through a perspective transform. Four image points (xi, yi) defining the measurement region and their four corresponding coordinates on the DT floor plane (x′i, y′i) are selected. A 3 × 3 homography H is estimated in homogeneous coordinates [31]:
Expanding the projective division results in the mapping
The eight unknowns a, …, h are obtained by substituting the four-point correspondences into the resulting linear system and solving via matrix inversion. Once H is known, the bottom-center image coordinate of any detected extinguisher within the region is projected to its absolute model coordinate (x′, y′).
The four correspondences are selected according to four criteria: (i) all four points lie on the corridor floor plane—the same plane on which the ground-contact points of the monitored assets lie and for which the homography is valid; (ii) they are permanent, visually unambiguous structural features (e.g., floor-joint corners and wall–floor edge intersections) identifiable both in the image and in the georeferenced BIM, from which their model coordinates are read; (iii) they enclose the measurement region of interest, so that the mapping of detected assets is interpolative rather than extrapolative; and (iv) they are non-collinear and well spread across the region, which conditions the linear system for H.
Displacement decision. The bottom-center points from before- and after-event detections are both mapped to absolute coordinates, and their planar Euclidean distances are computed. A displacement event is registered when this distance exceeds a 0.5 m threshold, which accounts for the inherent error in the YOLOv5 bounding-box coordinates. A fallen state is registered directly from the corresponding detection class.
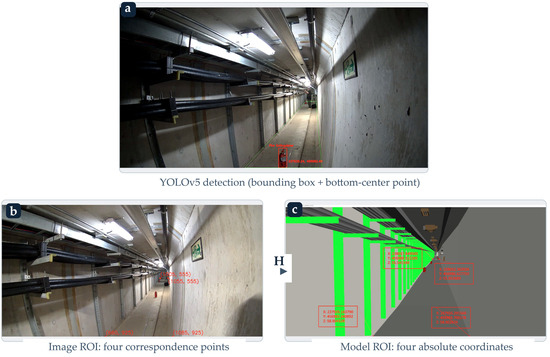
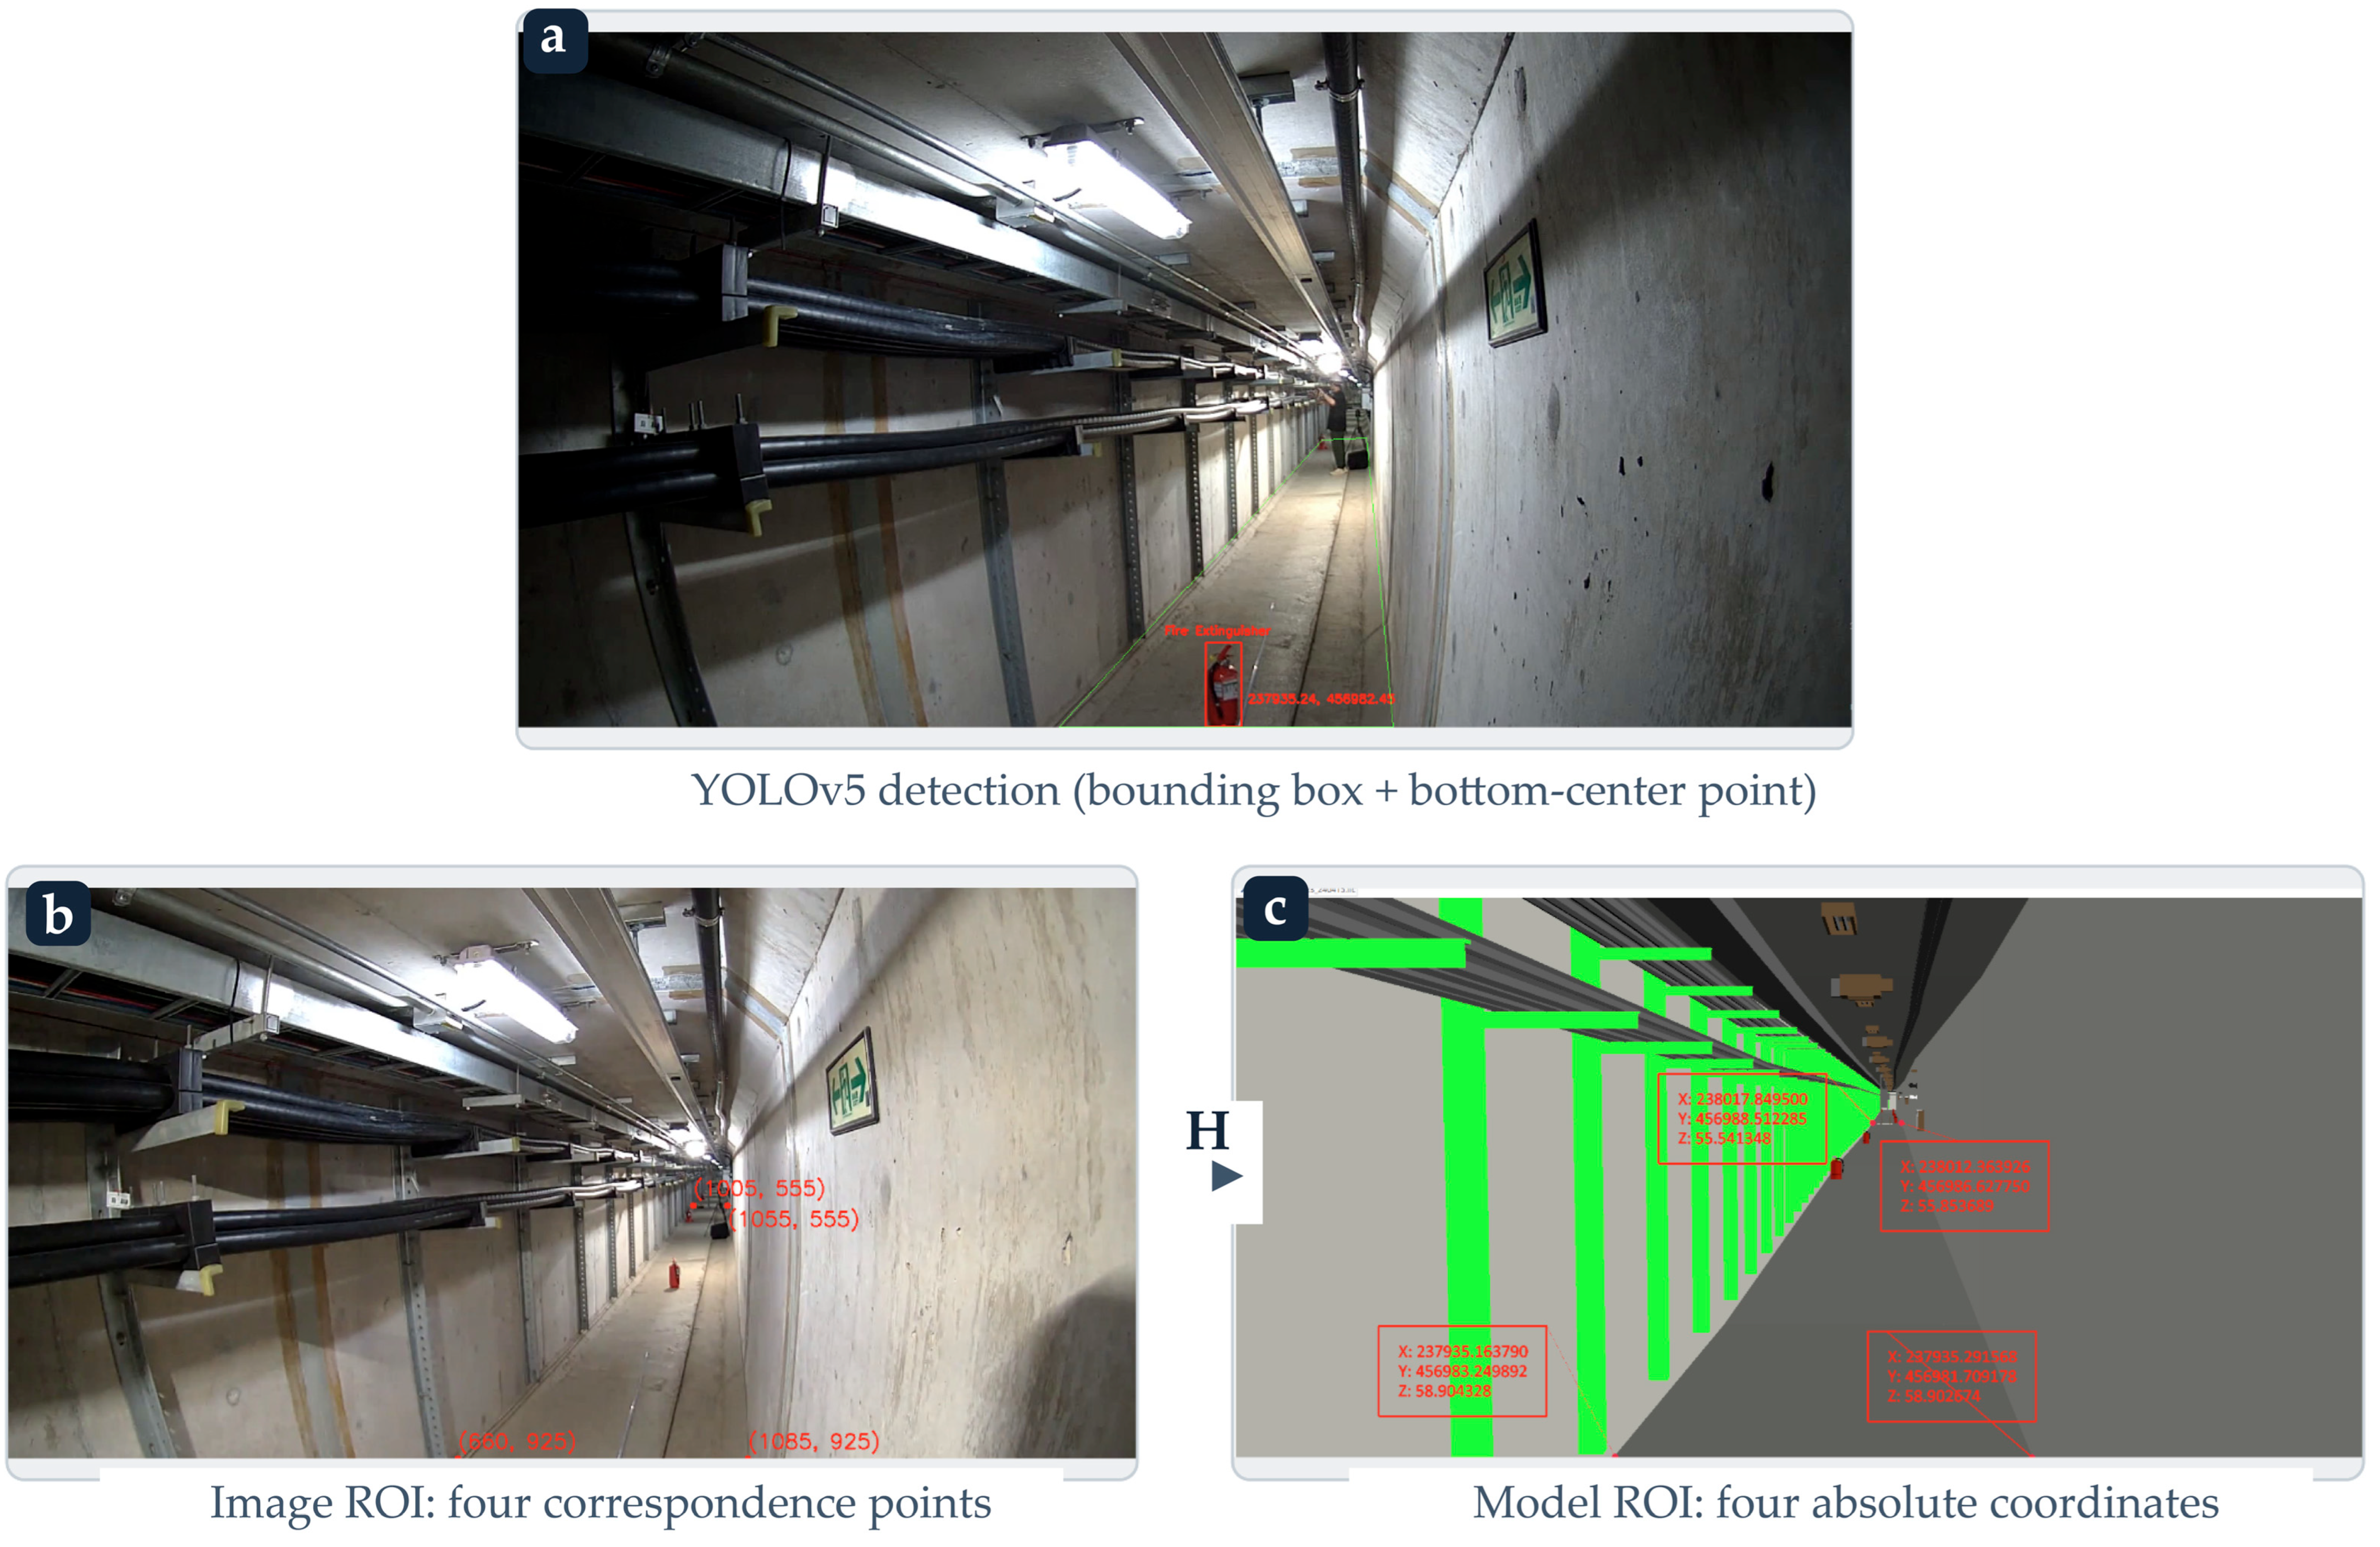
The 0.5 m decision tolerance was determined from an analytical localization-error budget for the single-camera pipeline. Because the image-to-model mapping is projective, its metric scale varies spatially; the localization uncertainty was therefore evaluated using the local sensitivity (Jacobian) of the homography at the designated extinguisher monitoring position, rather than a single global distance-to-pixel ratio. Using the four image-to-model correspondences shown in Figure 4, the representative extinguisher bottom-center location is approximately (u, v) = (876, 924) pixels, at which the maximum local homography sensitivity is approximately s_max = 0.026 m/pixel.
Figure 4.
Point-object (fire extinguisher) detection and localization: (a) YOLOv5 detection showing the bounding box and the bottom-center ground-contact point; (b) image region of interest with the four selected correspondence points; (c) model region of interest with the four absolute coordinates on the georeferenced DT floor plane, related to (b) by the homography H.Frame-by-frame detector-jitter statistics were not retained; therefore, a conservative engineering bound of p = 8 pixels was adopted for the uncertainty of the detected bounding-box bottom edge. This value is explicitly treated as an analytical assumption rather than as an empirically estimated standard deviation. It corresponds to a maximum model-plane position error of e_obs = s_max · p = 0.026 m/pixel × 8 pixels = 0.208 m for an individual observation. If the before- and after-event localization errors are treated as independent, their root-sum-square combination is e_Δ,RSS = √2 · e_obs = 0.294 m; a stricter deterministic bound, in which the two errors occur in opposite directions, is e_Δ,max = 2 · e_obs = 0.416 m.
The adopted threshold of 0.5 m lies above this conservative analytical bound, so that the assumed bounding-box localization uncertainty alone cannot trigger a displacement event, while remaining below the 0.63 m displacement observed in the representative relocation trial (Table 3): 0.294 m (RSS) < 0.416 m (worst case) < 0.50 m (threshold) < 0.63 m (observed event). Movements below 0.5 m are therefore intentionally treated as non-events, whereas gross relocation from the designated extinguisher station is reported to the DT service environment.
Table 3.
Point-object (fire extinguisher) displacement check from CCTV: pre- and post-event absolute coordinates, planar distance, and decision against the 0.5 m tolerance.
This tolerance applies to the designated near-field monitoring zone containing the fire-extinguisher station. Because homography sensitivity increases toward the perspective-compressed far end of the corridor, the 0.5 m value should not be interpreted as the intrinsic localization accuracy of YOLOv5 or as a uniform specification for the entire camera field of view; extending the method to a broader region would require a spatially varying uncertainty model or a position-dependent decision threshold.
3.4. Automated Event-Driven Update and Transmission Pipeline
Both pipelines feed into a unified update mechanism that synchronizes the DTs. For each detected event, the displacement information was serialized as a structured JSON message. The LiDAR (linear-object) message includes the sensor and robot identifiers, object class (E for power line), bounding-box center point, and Δz. The CCTV (point-object) message includes the model and camera identifiers, object class (with ‘F’ representing a fire extinguisher), bottom-center point, fallen-state flag, and displacement. In the linear scenario, the upper and lower cables were measured independently and combined into a single message.
The proposed pipeline automates event serialization and transmission without requiring manual comparison of before- and after-event datasets, in explicit contrast to the offline workflow of our previous study [6]. Because end-to-end latency was not instrumented during the field deployment, this study does not claim a quantitatively validated real-time or near-real-time latency class; a formal end-to-end latency benchmark is identified as future work (Section 5.5 and Section 5.6). The term “near-real-time” appearing in the official designation of the SDRM module denotes that module’s system name and does not represent a latency class validated in this study.
During operation, the fixed LiDAR stream point clouds were saved as Lidar_[date]_[robotID].pcd; the displacement extraction module yielded the corresponding LAS result, and the post-event point cloud was uploaded to an SFTP server. Each file record is subsequently inserted into the spatial information database. CCTV frames are processed at 30 fps; when the per-frame bottom-center displacement exceeds 0.5 m, a displacement alert is triggered. In both pipelines, the resulting JSON messages are transmitted to the DTS through a Kafka message broker, where they can be validated through a Kafka management tool and consumed by the event management (SEMM) and near-real-time spatial-update (SDRM) modules. Dedicated graphical interfaces for each pipeline enable field operators to review the extracted bounding boxes and coordinates, and to initiate transmission as needed.
4. Results and Validation
4.1. Linear-Object Extraction from Fiber-Scan LiDAR
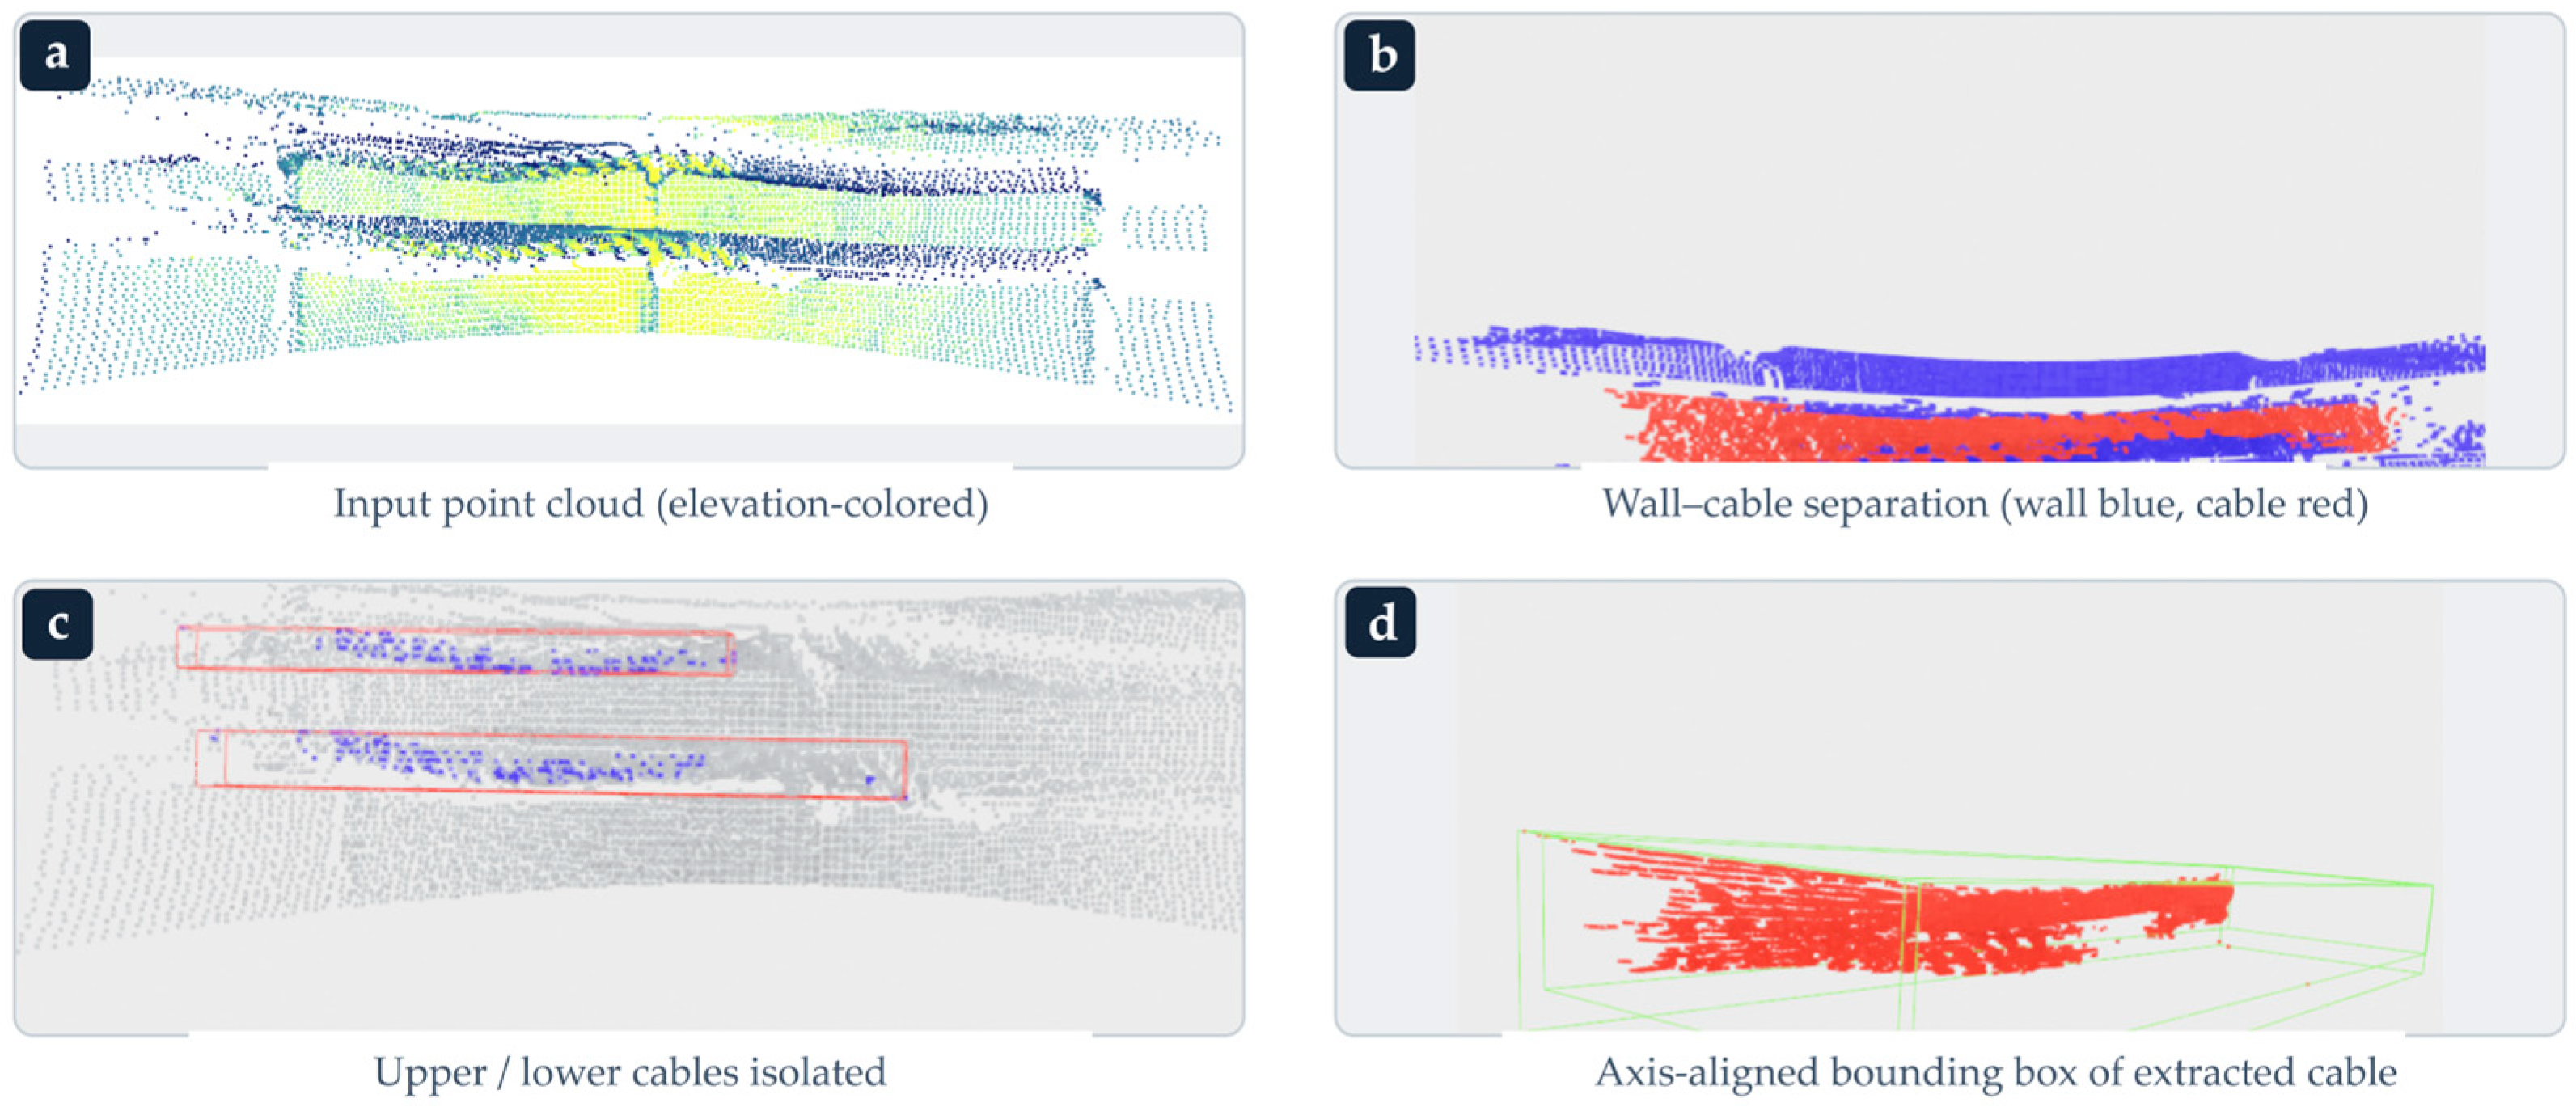
A linear-object pipeline was applied to the point clouds of the power cable section acquired by the fixed fiber-scan LiDAR, with model cables mounted and deflected to controlled sags of 7, 10, and 15 cm (Section 3.1). Starting from the raw point cloud (Figure 5a), the data were rotated to an X-up orientation. Recursive terrain fragmentation was then used to reliably separate the wall (serving as the terrain model) from the cable lines (Figure 5b). A second pass of the filter, utilizing distinct upper- and lower-line thresholds and incorporating radius outlier removal during both wall separation and lower-line extraction, successfully isolated the two cables as separate objects (Figure 5c). This procedure reduced the corridor to a wall class and one or more line classes, with axis-aligned bounding boxes that could be directly extracted (Figure 5d).
Figure 5.
Linear-object (cable) extraction from the fixed fiber-scan LiDAR point cloud: (a) input point cloud (elevation-colored); (b) wall–cable separation by the wall-as-ground RTF filter (wall in blue, cables in red); (c) upper and lower cables isolated by the second RTF pass; (d) axis-aligned bounding box of an extracted cable used for sag computation.
The four exposed variants (Table 2) performed as expected across different sensor types and scan densities: both Survey and FiberScan extracted a single cable from a before/after pair; FiberScan2 identified two cables from a single fiber-scan pair; and FiberScanOnly recovered cable sag from the post-event scan alone, without a prior reference. Owing to the significantly lower point density of the fixed tunnel LiDAR compared with the survey-grade scanner, line recognition was sensitive to the K-nearest-neighbor and minimum-cluster parameters. At lower parameter values, each cable was fragmented into multiple detected segments, whereas higher values resulted in their merger into a single line. Optimal performance was achieved by tuning these parameters to match the observed scan pattern. For each extracted line, the sag was computed as Δz = |max − min| − dcable with d_cable = 7 cm. The results were exported as LAS files (wall = class 7, line = class 1) and a text file containing the bounding box coordinates.
4.2. Point-Object Detection and Localization from CCTV
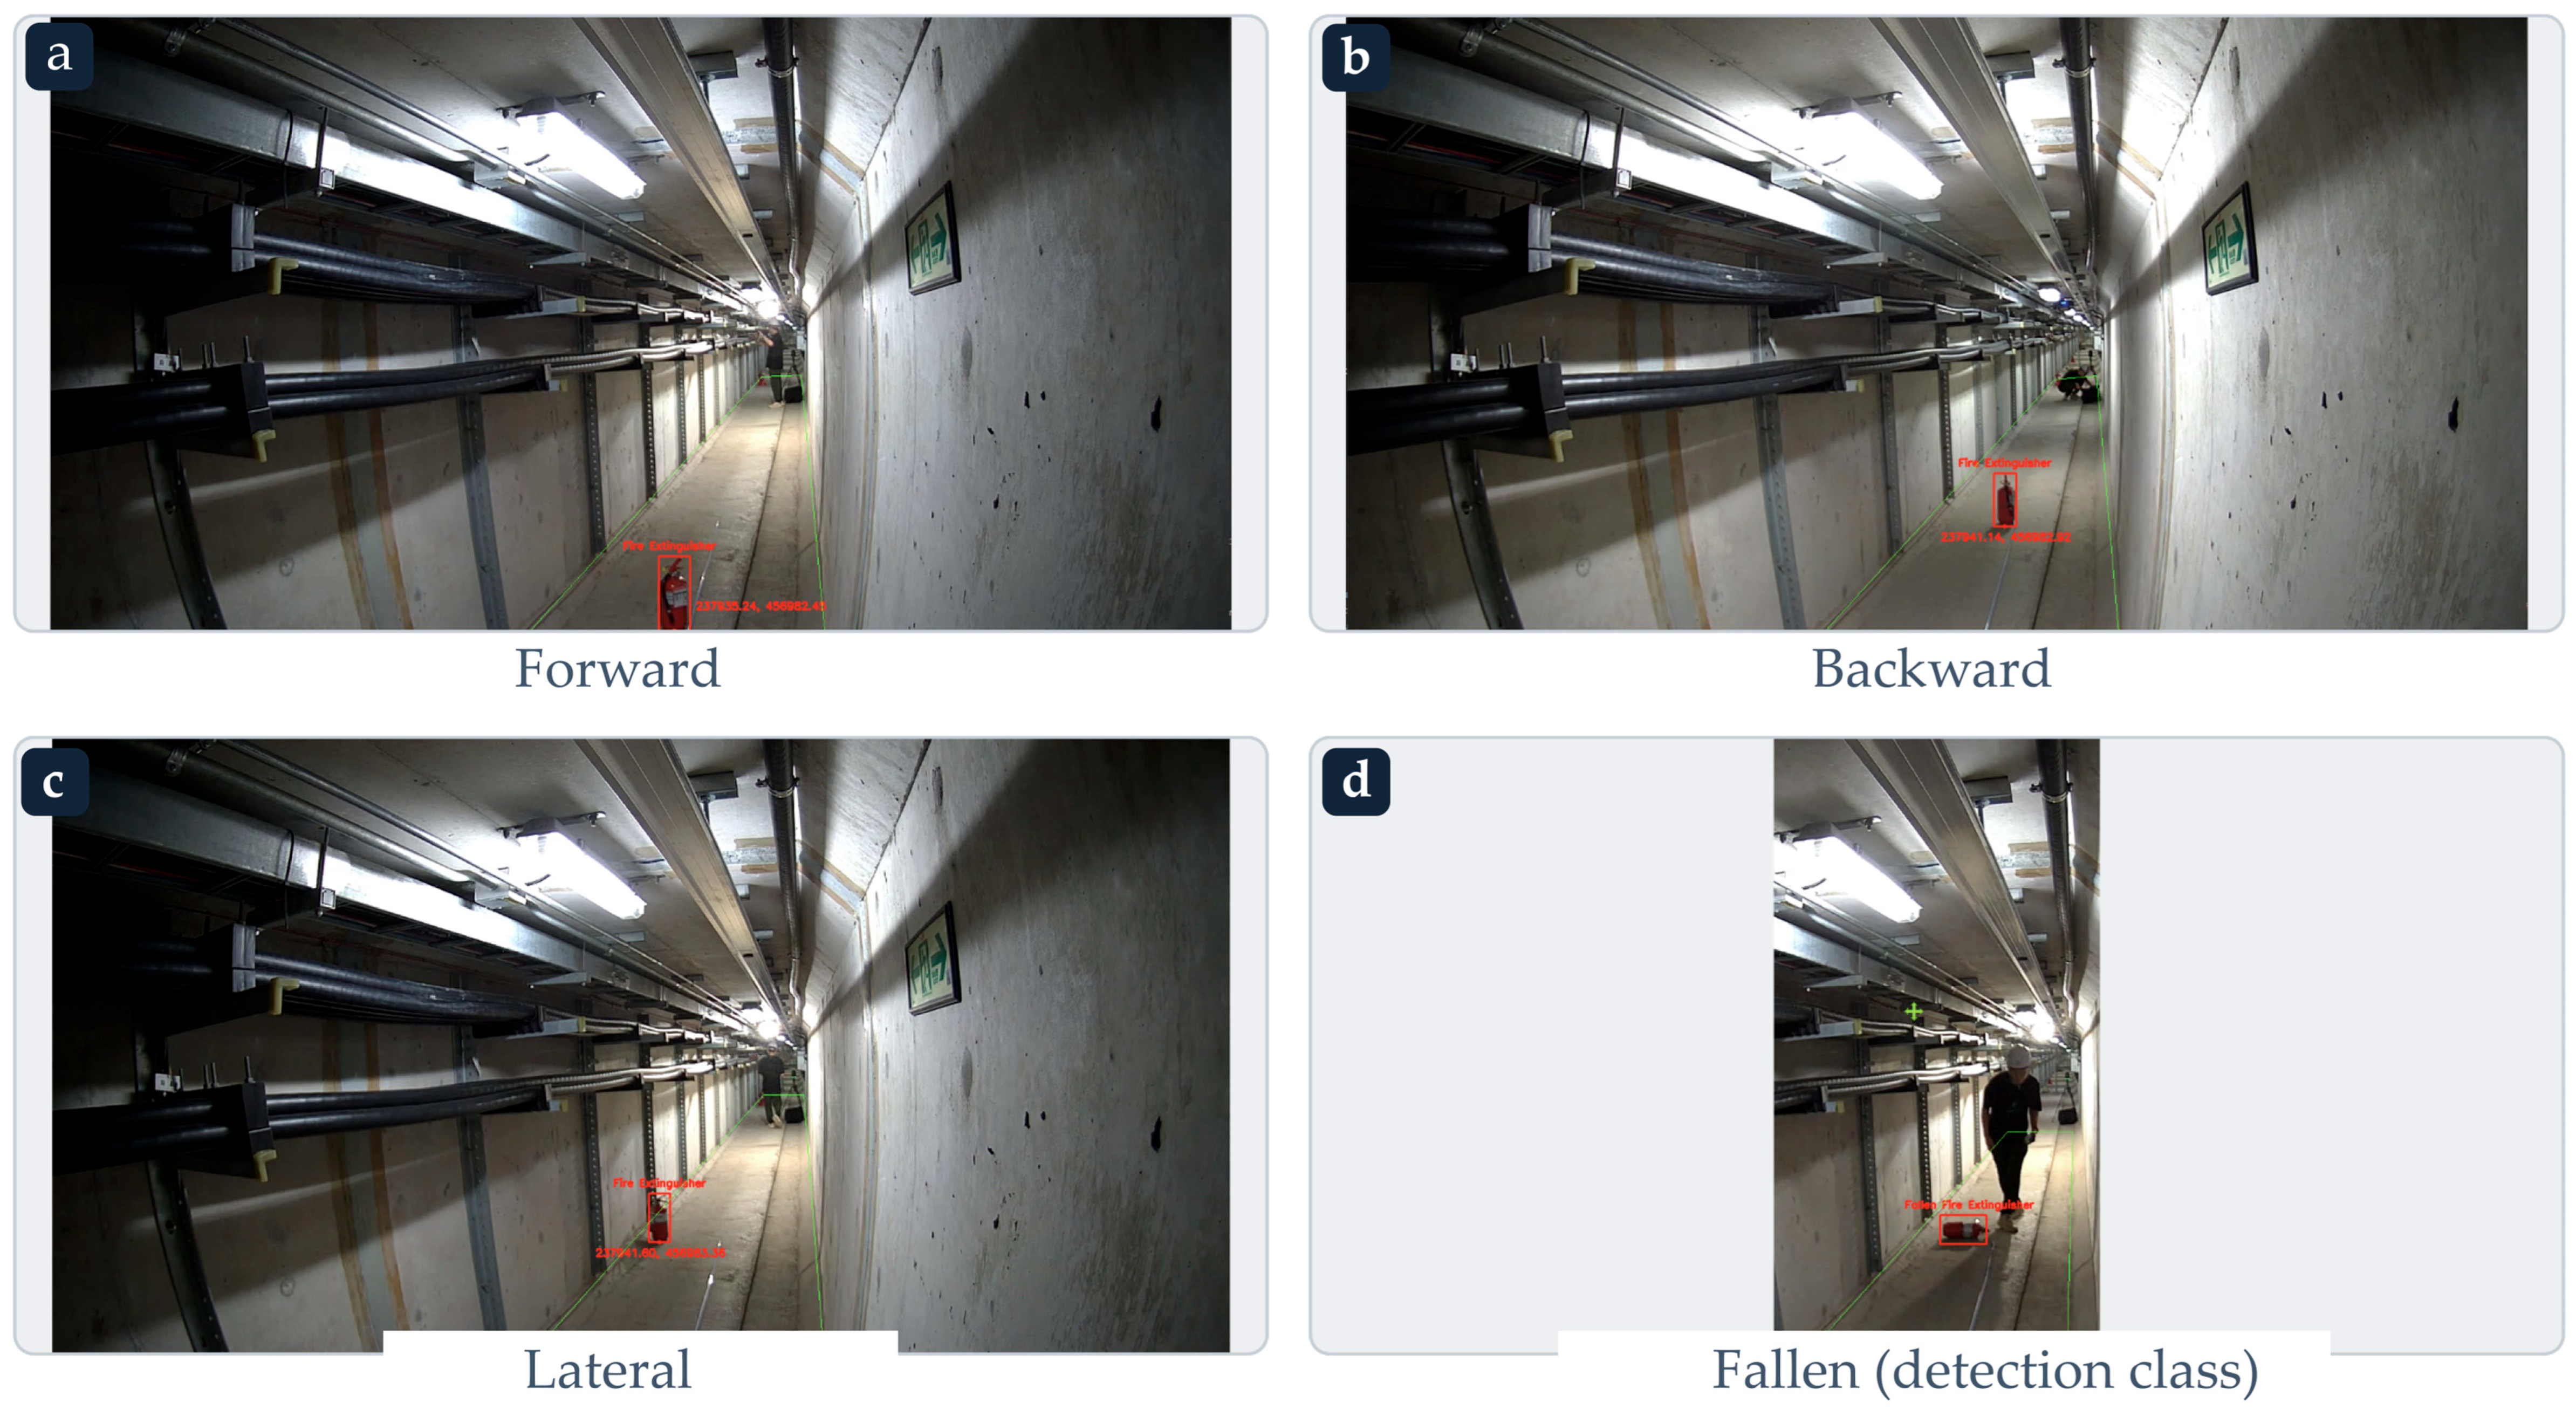
The point-object pipeline was evaluated using CCTV footage of a fire extinguisher subjected to four movement modes (forward, backward, and lateral) and the toppled state. The YOLOv5 detector, trained on the combined tunnel and open datasets with two classes (upright and fallen), recognized the extinguisher under low-light corridor conditions. Detectors were filtered at a confidence threshold of 0.7, and the bottom center of each bounding box was designated as the ground-contact point (Figure 4a). The four image-ROI points, together with their corresponding model coordinates, were used to compute the homography that maps each detected point into the absolute frame of the DT (Figure 4b,c). The toppled state was reported directly via the fallen class, rather than inferred from bounding box geometry.
A representative trial is listed in Table 3: the bottom-center point of the extinguisher mapped to (237,941.18, 456,982.81) before the event and (237,941.47, 456,983.37) afterward, corresponding to a planar displacement of 0.63 m. This exceeds the 0.5 m tolerance and is therefore registered as a displacement. The displacement modes are illustrated qualitatively in Figure 6—forward (Figure 6a), backward (Figure 6b), and lateral (Figure 6c) movements, as well as the toppled state (Figure 6d)—with an upright/fallen distinction indicated by the detection class.
Figure 6.
Extinguisher displacement modes detected by the point-object pipeline: (a) forward movement; (b) backward movement; (c) lateral movement; (d) toppled state, reported directly through the fallen detection class.
4.3. Field Validation Against Survey-Grade LiDAR
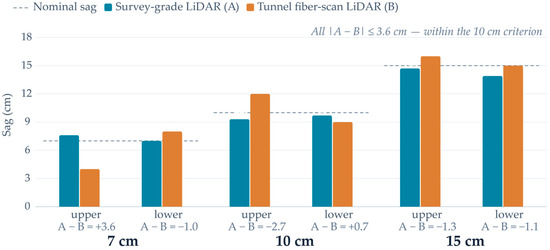
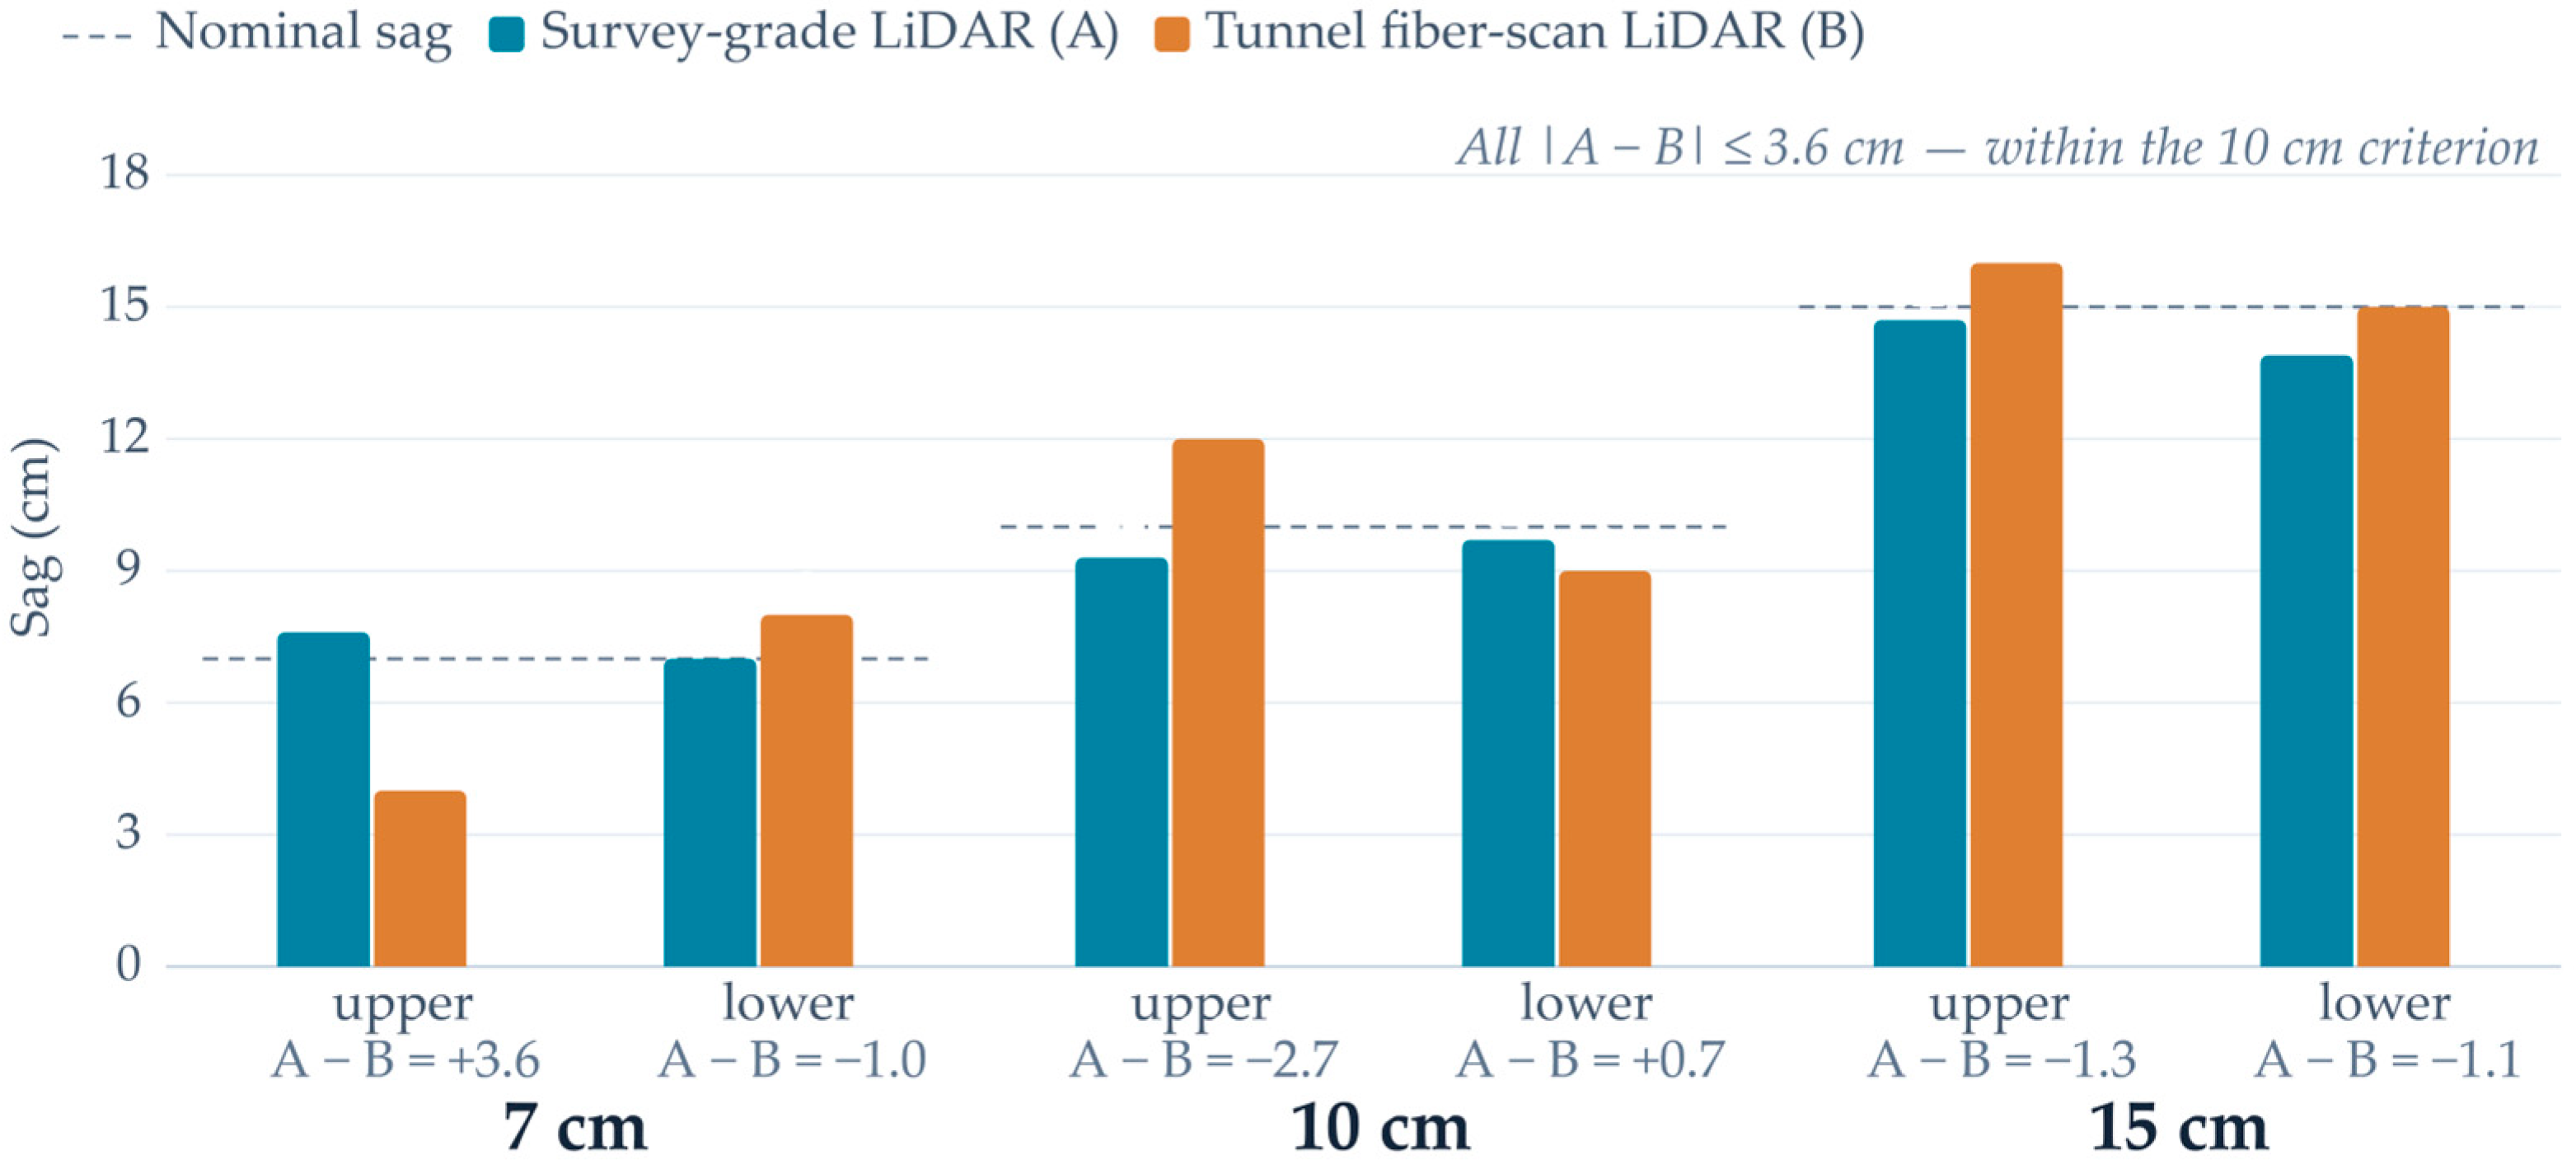
To validate the accuracy under operational conditions, model cables with nominal sags of 7, 10, and 15 cm were simultaneously captured using the fixed tunnel LiDAR and a co-located survey-grade scanner (BLK360; Leica Geosystems AG, Heerbrugg, Switzerland). For each nominal sag, the vertical sag of the survey scanner was measured three times for both the upper and lower cables and averaged (A), whereas the sag of the tunnel LiDAR was extracted using the deployed displacement-extraction software (B); the comparison is listed in Table 4 and shown in Figure 7.
Table 4.
Cable-sag validation results for nominal sag settings of 7, 10, and 15 cm. A is the mean of three survey-grade reference measurements, B is the fixed tunnel-LiDAR estimate, A − B is the signed residual, and |A − B| is the absolute residual evaluated against the 0.10 m validation tolerance.
Figure 7.
Comparison of cable-sag measurements obtained from the survey-grade reference scanner and the fixed tunnel LiDAR for nominal sag settings of 7, 10, and 15 cm. Results are reported separately for the upper and lower cables. The residual is defined as A − B, where A is the mean of three survey-grade measurements and B is the fixed-LiDAR estimate. The largest absolute residual was 3.6 cm for the upper cable at the nominal 7 cm setting.
The 0.10 m value is the maximum permissible absolute error for cable-sag estimation, adopted in this study as the operational validation tolerance; it is not a sensor-resolution specification, a displacement-event trigger, or a statistically optimized threshold. For each tested case i, the validation quantity is the absolute residual E_i = |A_i − B_i|, where A_i is the mean of three survey-grade measurements and B_i is the fixed tunnel-LiDAR estimate, with acceptance condition E_i ≤ 0.10 m. The tolerance is physically meaningful at asset scale, corresponding to an error larger than the cable diameter itself (7 cm). The maximum absolute residual observed across the six tested cases was 0.036 m, which was below the adopted 0.10 m validation tolerance.
The agreement between the two instruments consistently satisfied the 0.10 m validation tolerance, with A − B differences ranging from −2.7 cm to +3.6 cm. The most significant discrepancy was observed at the smallest sag: for the 7 cm upper cable, the tunnel LiDAR measured 4.0 cm compared with the survey mean of 7.6 cm (A − B = +3.6 cm). This reflects the challenge of accurately resolving shallow deflection of the upper line in a sparse, fixed-sensor point cloud. As the nominal sag increased to 10 and 15 cm, both instruments converged toward the intended value and the residual differences decreased (e.g., −1.3 cm and −1.1 cm for the 15 cm upper and lower cables, respectively). These results indicate that, although the fixed fiber-scan LiDAR is less precise than the survey scanner at detecting small deflections, its sag estimates remain within the operational tolerance required for displacement detection.
4.4. Operational Demonstration of the Automated Update Pipeline
The integrated pipeline was operated on an on-site DTS server. The fixed LiDAR streamed point clouds were saved as Lidar_[date]_[robot ID].pcd; the displacement-extraction module yielded the corresponding LAS result; the post-event cloud was uploaded over SFTP, and its record was inserted into the spatial-information database. The CCTV stream was processed at 30 fps, with a displacement alert triggered when the per-frame bottom-center displacement exceeded 0.5 m. In both cases, the displacement information was serialized as JSON and transmitted to the DTS through a Kafka broker, with message delivery confirmed through the management console of the broker. The graphical interfaces for both pipelines enabled field operators to review the extracted bounding boxes and absolute coordinates and to initiate data transmission, thereby completing the physical-to-virtual update loop within the operational environment.
5. Discussion
5.1. Resolution of the Limitations Identified in Previous Studies
The framework presented here was specifically developed to overcome the three key limitations identified in our previous study [6]: (1) Displacement measurement was limited by the availability of only relative coordinates; (2) updates required offline, manual comparison rather than automated transmission; and (3) validation was restricted to sample data collected in an indoor mock-up.
The coordinate limitation is addressed differently for each object type; however, in both cases, the output was referenced to the absolute coordinate frame of the DT. For point objects, a perspective transform projects the detected bottom-center point from the image coordinates to the model coordinates, allowing displacement to be expressed as a metric distance in the DT frame (0.63 m in the representative trial) rather than as a relative offset. For linear objects, sag is reported as Δz along with an absolute center point of the bounding box. Because the original BIM and IFC service models shared a unified coordinate system (Section 3.1), all reported values remained georeferenced. The updating limitation is addressed by the automated event-driven pipeline in Section 4.4, in which the extracted displacements are serialized as JSON and streamed to the service environment through a Kafka broker. This approach replaces the offline, manually compared workflow used in the previous study. The validation limitation is addressed in Section 4.3. Rather than a mock-up, the system was implemented in the operational Ochang tunnel and benchmarked against a co-located survey-grade scanner, with agreement within the 10 cm validation tolerance across all scenarios. Collectively, these findings advance the contribution of a proposed extraction algorithm to a synchronization framework validated under field conditions.
Relative to our prior framework [6], the advance can also be stated at the outcome level: the prior pipeline reported change detection in relative coordinates, validated on an indoor mock-up, whereas the present framework reports absolute, georeferenced sag values that agree with a co-located survey-grade reference within 3.6 cm worst-case (Table 4) in an operational tunnel, streamed automatically to the DT. Because the cited studies on rock-tunnel design [19] and lining-crack detection [20] address different tasks, sensors, and datasets, a direct quantitative benchmark against them is not methodologically feasible; their capabilities are instead contrasted in Table 5.
Table 5.
Capability comparison between the proposed framework and related studies.
5.2. Multimodal Strategy and Method Repurposing
The two processing pipelines were intentionally aligned with the geometry of the monitored assets. Linear assets, which were susceptible to vertical sagging, were best monitored using a sensor capable of recovering the 3D structure; accordingly, a fixed fiber-scan LiDAR was employed. By contrast, point assets, characterized by lateral displacement and visually distinctive states (e.g., upright versus fallen), are effectively monitored using a camera and an object detector. Treating these as complementary modalities within a unified update mechanism, rather than forcing a single sensor to address both asset types, enables heterogeneous events to be integrated into a common JSON/Kafka channel.
Two methodological adaptations merit particular attention. First, the RTF filter, originally developed for ground extraction from airborne LiDAR, was repurposed by rotating the cloud to an X-up frame, allowing a wall to serve as the reference surface. This adaptation enables a well-established ground/non-ground classifier to distinguish cables from structural elements in an environment for which it was not originally designed. Second, in a single-camera, GNSS-denied corridor—where neither satellite positioning nor stereo depth is available—the planar scene geometry is leveraged such that homography, rather than additional sensing hardware, provides absolute coordinates. Both approaches prioritize the adaptation of proven techniques to the operational constraints of the tunnel environment, thereby avoiding the need for more complex instrumentation.
This repurposing also explains why the components of our previous framework [6] were not retained for the present sensing configuration. Region-growing segmentation, RANSAC plane extraction, and octree change detection presume relatively dense, well-registered point clouds: under the sparse, pattern-dependent density of the fixed fiber-scan sensor, region growing fragments thin linear objects into disconnected clusters, and planar RANSAC cannot stably isolate cables from sparse wall returns. The wall-as-ground RTF adaptation was developed specifically to close this gap, which is why the comparison with the prior method is presented at the methodological and outcome levels (Section 5.1, Table 5) rather than as a numerical re-run.
5.3. Sources of Error and Operating Tolerances
The accuracy results presented in Section 4.3 also highlight the primary limitations of the proposed approach. The most significant discrepancy was observed at the smallest deflection: for the 7 cm upper cable, the fixed LiDAR underestimated sag by 3.6 cm relative to the survey mean. This outcome aligns with the low and pattern-dependent point density of the fiber-scan sensor, which makes it challenging to resolve shallow upper-line deflections and causes the bounding-box extent to be sensitive to the k-nearest-neighbor and minimum-cluster parameters. As the nominal sag increased, both instruments converged, and the residuals narrowed, indicating that the precision of the method improves with the magnitude of the displacement being measured. This characteristic is appropriate for a safety-oriented monitoring system, whose primary function is to detect and flag significant, consequential displacements.
Several modeling assumptions constrain the reported accuracy. The displacement was computed using an axis-aligned bounding box, assuming that the sensor, mount, and wall were horizontal and no compensation for sensor tilt was applied. The cable diameter (7 cm) was subtracted to convert a height difference into sag; thus, an incorrect diameter would bias Δz. For point objects, a 0.5 m decision tolerance was employed to accommodate the coordinate uncertainty inherent in the YOLOv5 bounding box, meaning that movements smaller than this threshold were intentionally not reported. These methodological choices were consistent with the operational objectives of robust event flagging, rather than millimetric metrology.
Beyond point-cloud sparsity, five further error sources contribute to the residuals in Table 4: (i) the axis-aligned bounding-box assumption with no sensor-tilt compensation, so that any residual tilt of the sensor, mounts, or wall biases the vertical extent; (ii) the cable-diameter subtraction, through which an error in the assumed 7 cm diameter propagates directly into Δz; (iii) the sensitivity of line clustering to the K-nearest-neighbor and minimum-cluster parameters under pattern-dependent density, which affects the bounding-box extent; (iv) cross-instrument discrepancy—the survey-grade reference itself deviated from the nominal setup at the smallest sag (survey mean 7.6 cm vs. nominal 7.0 cm for the upper cable), indicating that part of the residual reflects physical staging uncertainty rather than extraction error alone; (v) incidence-angle and partial-occlusion effects on the upper line, which reduce the number of returns precisely where the deflection is shallowest.
For the point-object pipeline, the practical failure modes were also examined. Missed detections arise under severe occlusion of the extinguisher, extreme low-light episodes, and motion blur, in which candidate detections fall below the 0.7 confidence threshold; this threshold deliberately trades recall for precision. False alarms could arise from frame-to-frame bounding-box jitter or transient occlusions shifting the bottom-center point; the 0.5 m decision tolerance (Section 3.3) is specifically dimensioned to absorb this jitter, so that the detection-level guard (confidence threshold) and the event-level guard (decision tolerance) play complementary roles in suppressing spurious events. A residual risk is misclassification between the upright and fallen classes under partial occlusion; systematic quantification of these rates over long-term operation is identified as future work (Section 6).
The 0.5 m tolerance is likewise an analytically bounded event-decision threshold rather than a measured localization-accuracy value. Its derivation uses the local homography sensitivity at the designated extinguisher station and a conservative ±8-pixel engineering bound for the bounding-box bottom-edge uncertainty; because this pixel bound was not estimated from long-term detector-jitter statistics, the threshold should be interpreted as a conservative operational setting for the evaluated monitoring zone. Future work should replace this fixed assumption with empirical frame-level uncertainty distributions and position-dependent thresholds derived from the local homography Jacobian throughout the camera field of view.
5.4. Implications for Smart-City Operation
Beyond the technical findings, the framework addresses a persistent gap in urban DTs: despite significant technical advancements, their practical impact on day-to-day city operations has often fallen short of expectations, partly because virtual models are not continuously synchronized with the evolving physical environment [9]. The present study directly addressed this challenge in the context of the urban subsurface, where the consequences of divergence are severe. By referencing each detected event to the DT georeferenced frame and streaming these data into the service environment automatically upon event detection, the framework allows the underground DT to function as a dynamic operational layer rather than as a static as-built record.
This approach has three practical implications for managing underground utility tunnels as smart city infrastructure. First, for disaster prevention, the continuous monitoring and flagging of cable sags or the displacement or toppling of safety assets allows latent hazards—such as an overstressed power line or a misplaced or fallen fire extinguisher—to be identified and addressed before they escalate, enabling proactive risk management beyond the capabilities of conventional periodic inspection. Second, for emergency response, an up-to-date DT provides operators with an accurate spatial representation of the tunnel environment, reducing the need to send personnel into confined or hazardous spaces and supporting rapid incident localization and intervention planning. Third, for maintenance, transitioning from manual visual inspections to sensor-driven change detection facilitates condition-based maintenance and more efficient operations. In each case, the primary value lies not in any single algorithm, but in the sustained synchronization between the physical and virtual environments, which transforms the urban DT into a reliable foundation for operational decision-making.
The framework was also designed to integrate seamlessly with the broader smart-city data ecosystem. Displacement events were published as standardized JSON messages via a Kafka broker into a DT service environment, providing a message-oriented interface that can supply control rooms, event management modules, and city-scale dashboards. This heterogeneous-sensor, automated synchronization model can be extended to other GNSS-denied or sensor-constrained urban assets—subways, underground parking, and indoor public facilities—enabling the composition of individual asset twins into a networked urban DT. Such integration is increasingly essential for resilient city operations.
5.5. Architectural Scalability and Observed System Load
During the field deployment, the system continuously ingested and processed a 30 fps CCTV stream, and no persistent frame-queue accumulation was observed by the operators. This observation supports sustained single-stream processing under the tested server configuration (Table 1); however, per-frame timestamps, dropped-frame counts, and queue-depth logs were not retained, so it does not establish a maximum per-frame latency of 33 ms. The LiDAR pipeline is event-driven at scan granularity rather than frame granularity, so point-cloud processing is not on the latency-critical path of alerting.
Kafka topics and partitions provide an architectural pathway for separating events by tunnel or sensor cell; comparable edge-computing architectures for continuous infrastructure monitoring report similar load-partitioning strategies [32]. However, concurrent multi-tunnel operation, throughput saturation, and scaling limits were not experimentally evaluated in this study. A formal end-to-end latency benchmark—average, maximum, and 95th-percentile latency, measured separately for the CCTV and LiDAR pipelines—could not be conducted because access to the operational testbed has ended; these evaluations are identified as future work rather than asserted.
5.6. Limitations and Generalizability
Certain constraints follow from field settings. The linear pipeline requires the number of cables to be specified in advance, as this determines the number of algorithm passes and assumes a consistent point pattern. Consequently, any change in sensor type or acquisition conditions necessitates re-tuning. The point pipeline depends on a single fixed camera with a manually selected region of interest for homography, and its detection performance is limited by the trained classes (upright and fallen extinguishers) as well as lighting conditions. Validation was conducted in an operational tunnel using model cables with a controlled sag and a single representative camera view; broader deployment across cells, cameras, and asset types remains to be demonstrated.
Three further evidence boundaries should be stated explicitly. First, the validation sample is small—three sag levels for linear objects (each compared against the mean of three survey-grade measurements for two cables) and one quantitative representative trial for point objects—so the results are presented as a controlled field demonstration rather than a statistical evaluation. Second, no formal end-to-end latency benchmark (average, maximum, and 95th-percentile latency) is reported (Section 5.5). Third, long-term detection-reliability statistics (precision, recall, and false-alarm rates over extended operation) were not collected. Repeating the validation at scale and supplying these benchmarks are identified as future work (Section 6).
Despite these limitations, the framework was not specific to the Ochang testbed. The wall-as-ground extraction method was applicable wherever linear assets were aligned along a reference surface in a sparse point cloud. Similarly, the detector-plus-homography localization approach can be applied to any fixed-camera, GNSS-denied corridor with approximately planar scene geometry and a georeferenced 3D model. Future extensions—such as automatic estimation of cable count and region of interest, inclusion of additional displacement classes, and fusion of further modalities—would reduce the manual configuration currently required and enhance the applicability of the system to a wider range of underground and indoor infrastructure environments.
6. Conclusions and Future Work
This study introduced a multimodal displacement detection framework with an automated event-driven update workflow for synchronizing the DT of an operational underground utility tunnel with its physical counterpart and demonstrated its operational feasibility in a live testbed at the Ochang tunnel. The framework addressed three key limitations of previous BIM-GIS DT implementations: reliance on relative coordinate measurements, lack of automated updating, and validation restricted to indoor mock-ups. These challenges were overcome by assigning each monitored asset to an optimal sensing modality and integrating data streams into a unified update channel.
The proposed framework offers three primary contributions. First, a linear object sag was quantified using a sparse, fixed fiber-scan LiDAR system. This was achieved by adapting an RTF ground filter into a wall-as-ground (X-up) frame, enabling the separation of cables from structural elements and the measurement of sag via axis-aligned bounding boxes. Second, point-object displacement was detected and localized from a single fixed CCTV camera. By combining a YOLOv5 detector with a perspective transform, the system recovered absolute coordinates in a GNSS-denied corridor and distinguished between moved and toppled assets. Third, all extracted displacement data were serialized in JSON format and streamed through a Kafka broker into the DT service environment, facilitating the integration of heterogeneous events into a single automated synchronization workflow. Field validation against a co-located survey-grade scanner demonstrated that the framework consistently satisfied the 0.10 m operational validation tolerance across all tested sag scenarios. The largest residual error was observed in the shallowest deflection case, likely associated with the combined effects of sparse point density, clustering sensitivity, acquisition geometry, and physical staging uncertainty.
The principal value of this work lies in its methodological and practical aspects, which extend beyond a single site. By anchoring all outputs to the georeferenced coordinate frame of the twin and by adapting established techniques—such as ground filtering and planar homography—to the stringent constraints of underground environments, the proposed framework maintained alignment between the virtual model and the physical asset without additional instrumentation. This synchronization is essential for leveraging DTs to monitor structural integrity, detect displacement events, and enhance disaster prevention and response within underground utility tunnels.
The results of this study can be extended in several directions. For linear objects, automating the estimation of cable counts and compensating for sensor tilt to relax the horizontal-acquisition assumption would eliminate manual configuration and increase robustness to variations in sensor placement and point distribution. For point objects, automating the selection of the homographic region of interest, expanding the classification of displacement and state classes beyond the upright/fallen dichotomy, and systematically reporting the detection and displacement classification accuracy under diverse lighting conditions would strengthen the quantitative evaluation. More broadly, integrating additional modalities (for example, thermal or radar sensing alongside LiDAR and CCTV) and repeating the validation across multiple cells, cameras, and asset types would rigorously assess generalizability and support the consolidation of this framework as a deployable component of DT-based underground infrastructure management.
In addition, four evidence-oriented tracks are identified for future work: a formal end-to-end latency benchmark reporting average, maximum, and 95th-percentile latency for both pipelines; long-term detection-reliability statistics (precision, recall, and false-alarm rates) for the point-object pipeline; benchmarking of newer detector versions within the same framework; and a side-by-side numerical comparison with the prior extraction pipeline [6] on a common sparse-LiDAR dataset.
Author Contributions
Conceptualization, C.H. and J.L.; methodology, J.L. and C.P.; software, C.P.; validation, C.P. and C.H.; formal analysis, C.P. and J.L.; investigation, C.P.; resources, C.H.; data curation, C.P.; writing—original draft preparation, J.L. and C.P.; writing—review and editing, C.H. and J.L.; visualization, C.P.; supervision, C.H.; project administration, C.H.; funding acquisition, C.H. All authors have read and agreed to the published version of the manuscript.
Funding
This work is supported by the Korea Agency for Infrastructure Technology Advancement (KAIA) grant funded by the Ministry of Land, Infrastructure and Transport (No. RS-2026-25509121, Development of technology to build and operate a spatial digital twin for complex disaster management).
Data Availability Statement
The data presented in this study are available on request from the corresponding author.
Conflicts of Interest
The authors declare that they have no known competing financial interests or personal relationships that could have appeared to influence the work reported in this paper.
Abbreviations
The following abbreviations are used in this manuscript:
| BIM | Building information modeling |
| CCTV | Closed-circuit television |
| DT | Digital twin |
| DTS | Digital twin service |
| fps | Frames per second |
| GIS | Geographic information system |
| GNSS | Global navigation satellite system |
| IFC | Industry Foundation Classes |
| JSON | JavaScript Object Notation |
| LiDAR | Light detection and ranging |
| RANSAC | Random sample consensus |
| ROI | Region of interest |
| ROR | Radius outlier removal |
| RTF | Recursive terrain fragmentation |
| RTSP | Real-time streaming protocol |
| SDRM | Near-real-time spatial-update module |
| SEMM | Event-management module |
| YOLO | You Only Look Once |
References
- El Marai, O.; Taleb, T.; Song, J. Roads infrastructure digital twin: A step toward smarter cities realization. IEEE Netw. 2020, 35, 136–143. [Google Scholar] [CrossRef] [Scilit]
- Fan, C.; Zhang, C.; Yahja, A.; Mostafavi, A. Disaster City Digital Twin: A vision for integrating artificial and human intelligence for disaster management. Int. J. Inf. Manag. 2021, 56, 102049. [Google Scholar] [CrossRef] [Scilit]
- Singh, M.; Srivastava, R.; Fuenmayor, E.; Kuts, V.; Qiao, Y.; Murray, N.; Devine, D. Applications of digital twin across industries: A review. Appl. Sci. 2022, 12, 5727. [Google Scholar] [CrossRef] [Scilit]
- Boje, C.; Guerriero, A.; Kubicki, S.; Rezgui, Y. Towards a semantic construction digital twin: Directions for future research. Autom. Constr. 2020, 114, 103179. [Google Scholar] [CrossRef] [Scilit]
- Jones, D.; Snider, C.; Nassehi, A.; Yon, J.; Hicks, B. Characterising the digital twin: A systematic literature review. CIRP J. Manuf. Sci. Technol. 2020, 29, 36–52. [Google Scholar] [CrossRef] [Scilit]
- Lee, J.; Lee, Y.; Park, S.; Hong, C. Implementing a digital twin of an underground utility tunnel for geospatial feature extraction using a multimodal image sensor. Appl. Sci. 2023, 13, 9137. [Google Scholar] [CrossRef] [Scilit]
- Opoku, D.-G.J.; Perera, S.; Osei-Kyei, R.; Rashidi, M. Digital twin application in the construction industry: A literature review. J. Build. Eng. 2021, 40, 102726. [Google Scholar] [CrossRef] [Scilit]
- Madubuike, O.C.; Anumba, C.J.; Khallaf, R. A review of digital twin applications in construction. J. Inf. Technol. Constr. 2022, 27, 145–172. [Google Scholar] [CrossRef] [Scilit]
- Azadi, S.; Kasraian, D.; Nourian, P.; van Wesemael, P. What have urban digital twins contributed to urban planning and decision making? From a systematic literature review toward a socio-technical research and development agenda. Smart Cities 2025, 8, 32. [Google Scholar] [CrossRef] [Scilit]
- Huang, J.; Bibri, S.E.; Keel, P. Generative spatial artificial intelligence for sustainable smart cities: A pioneering large flow model for urban digital twin. Environ. Sci. Ecotechnol. 2025, 24, 100526. [Google Scholar] [CrossRef] [Scilit] [PubMed]
- Chen, C.; Zhao, K.; Leng, J.; Liu, C.; Fan, J.; Zheng, P. Integrating large language model and digital twins in the context of industry 5.0: Framework, challenges and opportunities. Robot. Comput.-Integr. Manuf. 2025, 94, 102982. [Google Scholar] [CrossRef] [Scilit]
- El-Agamy, R.F.; Sayed, H.A.; AL Akhatatneh, A.M.; Aljohani, M.; Elhosseini, M. Comprehensive analysis of digital twins in smart cities: A 4200-paper bibliometric study. Artif. Intell. Rev. 2024, 57, 154. [Google Scholar] [CrossRef] [Scilit]
- Yan, H.; Lau, A.; Fan, H. Monocular camera localization in known environments: An in-depth review. Appl. Sci. 2026, 16, 2332. [Google Scholar] [CrossRef] [Scilit]
- Lu, T.; Liu, Y.; Yang, Y.; Wang, H.; Zhang, X. A monocular visual localization algorithm for large-scale indoor environments through matching a prior semantic map. Electronics 2022, 11, 3396. [Google Scholar] [CrossRef] [Scilit]
- Lopes, C.; Maffei, R.; Kolberg, M. Monocular depth estimation applied to global localization over 2D floor plans using free space density. J. Intell. Robot. Syst. 2025, 111, 4. [Google Scholar] [CrossRef] [Scilit]
- Xu, H.; Wang, M.; Liu, C.; Guo, Y.; Gao, Z.; Xie, C. Tunnel crack assessment using simultaneous localization and mapping (SLAM) and deep learning segmentation. Autom. Constr. 2025, 171, 105977. [Google Scholar] [CrossRef] [Scilit]
- Lee, J.; Lee, Y.; Hong, C. Development of geospatial data acquisition, modeling, and service technology for digital twin implementation of underground utility tunnel. Appl. Sci. 2023, 13, 4343. [Google Scholar] [CrossRef] [Scilit]
- Park, S.; Hong, C.; Hwang, I.; Lee, J. Comparison of single-camera-based depth estimation technology for digital twin model synchronization of underground utility tunnels. Appl. Sci. 2023, 13, 2106. [Google Scholar] [CrossRef] [Scilit]
- Li, X.; Tang, L.; Ling, J.; Chen, C.; Shen, Y.; Zhu, H. Digital-twin-enabled JIT design of rock tunnel: Methodology and application. Tunn. Undergr. Space Technol. 2023, 140, 105307. [Google Scholar] [CrossRef] [Scilit]
- Zhou, Z.; Zhang, J.; Gong, C. Hybrid semantic segmentation for tunnel lining cracks based on Swin Transformer and convolutional neural network. Comput.-Aid. Civ. Infrastruct. Eng. 2023, 38, 2491–2510. [Google Scholar] [CrossRef] [Scilit]
- Zhang, X.; Jiang, Y.; Wu, X.; Nan, Z.; Jiang, Y.; Shi, J.; Zhang, Y.; Huang, X.; Huang, G.G.Q. An IoT-enabled digital twin system for smart tunnel fire safety management. Dev. Built Environ. 2024, 18, 100381. [Google Scholar] [CrossRef] [Scilit]
- Mazzetto, S. A review of urban digital twins integration, challenges, and future directions in smart city development. Sustainability 2024, 16, 8337. [Google Scholar] [CrossRef] [Scilit]
- Xue, F.; Lu, W.; Chen, Z.; Webster, C.J. From LiDAR point cloud towards digital twin city: Clustering city objects based on Gestalt principles. ISPRS J. Photogramm. 2020, 167, 418–431. [Google Scholar] [CrossRef] [Scilit]
- Rusu, R.B.; Cousins, S. 3D is here: Point cloud library (PCL). In Proceedings of the 2011 IEEE International Conference on Robotics and Automation (ICRA), Shanghai, China; Institute of Electrical and Electronics Engineers: New York, NY, USA, 2011; pp. 1–4. [Google Scholar] [CrossRef] [Scilit]
- Huang, Y.; Ye, J.; Li, X.; Du, J. Attention-guided semantic segmentation and scan-to-model geometric reconstruction of underground tunnels from mobile laser scanning. Appl. Sci. 2026, 16, 3042. [Google Scholar] [CrossRef] [Scilit]
- Kou, L.; Zhuang, Y.; Luo, H.; Liu, J.; Guo, F. Deep learning-based 3D point cloud segmentation for nondestructive evaluation and monitoring of tunnel construction. J. Nondestr. Eval. 2026, 45, 11. [Google Scholar] [CrossRef] [Scilit]
- Sohn, G.; Dowman, I.J. A model-based approach for reconstructing a terrain surface from airborne LIDAR data. Photogramm. Rec. 2008, 23, 170–193. [Google Scholar] [CrossRef] [Scilit]
- Sohn, G.; Dowman, I. Terrain surface reconstruction by the use of tetrahedron model with the MDL criterion. Int. Arch. Photogramm. Remote Sens. Spat. Inf. Sci. 2002, 34, 336–344. [Google Scholar]
- Redmon, J.; Divvala, S.; Girshick, R.; Farhadi, A. You only look once: Unified, real-time object detection. In Proceedings of the IEEE Conference on Computer Vision and Pattern Recognition (CVPR), Las Vegas, NV, USA; Institute of Electrical and Electronics Engineers: New York, NY, USA, 2016; pp. 779–788. [Google Scholar] [CrossRef] [Scilit]
- Jocher, G. YOLOv5 by Ultralytics, Version 7.0; Zenodo: Geneva, Switzerland, 2022. [Google Scholar] [CrossRef]
- Hartley, R.; Zisserman, A. Multiple View Geometry in Computer Vision, 2nd ed.; Cambridge University Press: Cambridge, UK, 2003. [Google Scholar]
- Hidalgo-Fort, E.; Blanco-Carmona, P.; Muñoz-Chavero, F.; Torralba, A.; Castro-Triguero, R. Low-cost, low-power edge computing system for structural health monitoring in an IoT framework. Sensors 2024, 24, 5078. [Google Scholar] [CrossRef] [Scilit] [PubMed]

Disclaimer/Publisher’s Note: The statements, opinions and data contained in all publications are solely those of the individual author(s) and contributor(s) and not of MDPI and/or the editor(s). MDPI and/or the editor(s) disclaim responsibility for any injury to people or property resulting from any ideas, methods, instructions or products referred to in the content. |
© 2026 by the authors. Licensee MDPI, Basel, Switzerland. This article is an open access article distributed under the terms and conditions of the Creative Commons Attribution (CC BY) license.