


Abstract
Tight sandstone reservoirs are characterized by complex pore structures and ultra-low permeability, resulting in low recovery efficiency when relying solely on formation elastic energy. Consequently, water flooding is commonly employed for reservoir development. To investigate the two-phase flow behavior and pressure response during water flooding in tight sandstone reservoirs, long-core displacement experiments were conducted using outcrop tight sandstone cores. Thirteen pressure monitoring points were distributed along the core to continuously record the pressure response during water flooding, while cumulative oil and water production were measured to characterize the displacement performance. The temporal evolution of pressure and productivity index was systematically analyzed, and numerical simulation was further performed to interpret the relationship between pressure variations and water-front propagation. The results show that the cumulative oil production reached 50.95 mL, corresponding to a final oil recovery of 31.26%. No water production was observed during the initial stage of displacement, and water production began at approximately 8000 min, after which both water production and oil production gradually approached stable levels. The pressures at different monitoring locations exhibited a characteristic increase–decrease–increase pattern during the displacement process, whereas the productivity index decreased progressively before approaching a relatively stable value. Based on the experimental observations and numerical simulation results, the pressure response characteristics were closely associated with the propagation of the water front, with distinct pressure inflection points observed at different locations along the core. The mechanisms underlying pressure fluctuations and the decline in productivity index were analyzed from two perspectives: the extensive formation of dispersed phases and the dynamic evolution of interfacial flow resistance. These results provide experimental and numerical evidence for understanding pressure propagation and productivity evolution during water flooding in tight sandstone reservoirs.
1. Introduction
Tight sandstone is generally defined as a sandstone reservoir with low matrix permeability and poor pore-throat connectivity, in which fluid flow is strongly restricted by the small pore-throat size and complex pore structure. Tight sandstone reservoirs are characterized by abundant reserves and considerable resource potential [1]. However, effective development is difficult to achieve relying solely on natural elastic energy. As a result, the primary recovery factor is usually low. Therefore, water injection development is widely adopted in field applications to maintain formation energy and improve oil recovery [2,3,4]. Compared with conventional reservoirs, tight sandstone reservoirs exhibit smaller pore sizes, poorer pore-throat connectivity, stronger heterogeneity, and lower permeability. These characteristics make the transport behavior of two-phase fluids in porous media considerably more complex [5,6]. In recent years, extensive studies have been conducted worldwide on the multiphase flow mechanisms in tight reservoirs. It is generally accepted that significant effects, including threshold pressure gradient, dynamic capillary force, and imbibition, commonly exist in tight reservoirs [7,8,9,10,11].
Some studies have mainly focused on low-velocity non-Darcy flow, threshold pressure gradient correction models, and the evaluation of water injection development performance. Extensive studies have demonstrated that a pronounced two-phase threshold pressure gradient commonly exists in tight reservoirs. Moreover, flow resistance increases significantly with increasing water saturation [11,12,13]. Several studies further introduced the concept of dynamic threshold pressure gradient. It was suggested that the dynamic threshold pressure gradient is closely related to effective stress and can significantly affect pressure propagation velocity and fluid mobilization capacity, thereby reducing the pressure propagation range around the wellbore [14]. Other studies have investigated fluid interfacial behavior and capillary-dominated flow characteristics at the micro- and nanoscale pore-throat level. These studies indicated that fluid transport during two-phase flow is controlled not only by the pressure gradient, but also by pore-throat structure, wettability, and interfacial tension [15,16,17]. Dynamic capillary pressure and interfacial hysteresis further enhance transient flow behavior, making it difficult for conventional linear Darcy models to accurately characterize two-phase flow in tight reservoirs [10,18].
With the continued development of tight oil reservoirs, imbibition has gradually been recognized as one of the key mechanisms affecting the performance of water injection development. Previous studies have shown that capillary force in micro- and nanoscale pore throats can drive the spontaneous imbibition of injected water into the rock matrix. This process alters the distribution of residual oil and improves local displacement efficiency [19,20]. Some studies have focused on the coupling between imbibition and displacement at the microscopic scale. These studies suggested that displacement dominates under high pressure gradients, whereas imbibition becomes dominant under low pressure gradients [9]. Other studies mainly concentrated on imbibition experiments combined with CT scanning and nuclear magnetic resonance characterization. The results confirmed that the contribution of imbibition is more significant in smaller pore throats [21]. To more realistically characterize fluid transport behavior in tight reservoirs, some researchers have employed long-core displacement experiments to investigate waterflood front propagation and pressure transmission behavior. Compared with conventional short-core experiments, long cores can better characterize pressure-wave propagation, waterflood front migration, and fluid redistribution processes in heterogeneous reservoirs [22,23,24].
Despite these advances, the pressure propagation behavior and its relationship with oil production during waterflooding in tight sandstone long cores remain insufficiently understood. In particularly, the mechanisms underlying pressure inflection and fluctuation during multiphase flow, as well as their implications for oil production and productivity-index evolution, require further investigation. Therefore, this study aims to investigate the pressure propagation characteristics during waterflooding in tight sandstone long cores and to clarify their relationship with oil production and productivity-index evolution. To achieve this objective, a long-core waterflooding experiment was conducted to monitor the pressure responses at multiple measurement points and the produced fluid volume over time. A numerical model was further established to simulate the pressure and water-saturation evolution and to provide a physical interpretation of the experimentally observed pressure characteristics. The experimental and numerical approaches were then used to analyze the pressure propagation characteristics and their relationship with fluid displacement and production behavior during waterflooding.
2. Materials and Methods
A waterflooding experiment was designed and conducted using a long-core model with 100% initial oil saturation. The experiment was performed to investigate the two-phase flow behavior during waterflooding under high oil-saturation conditions.
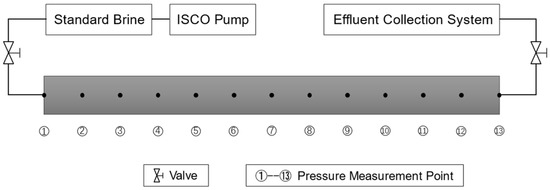
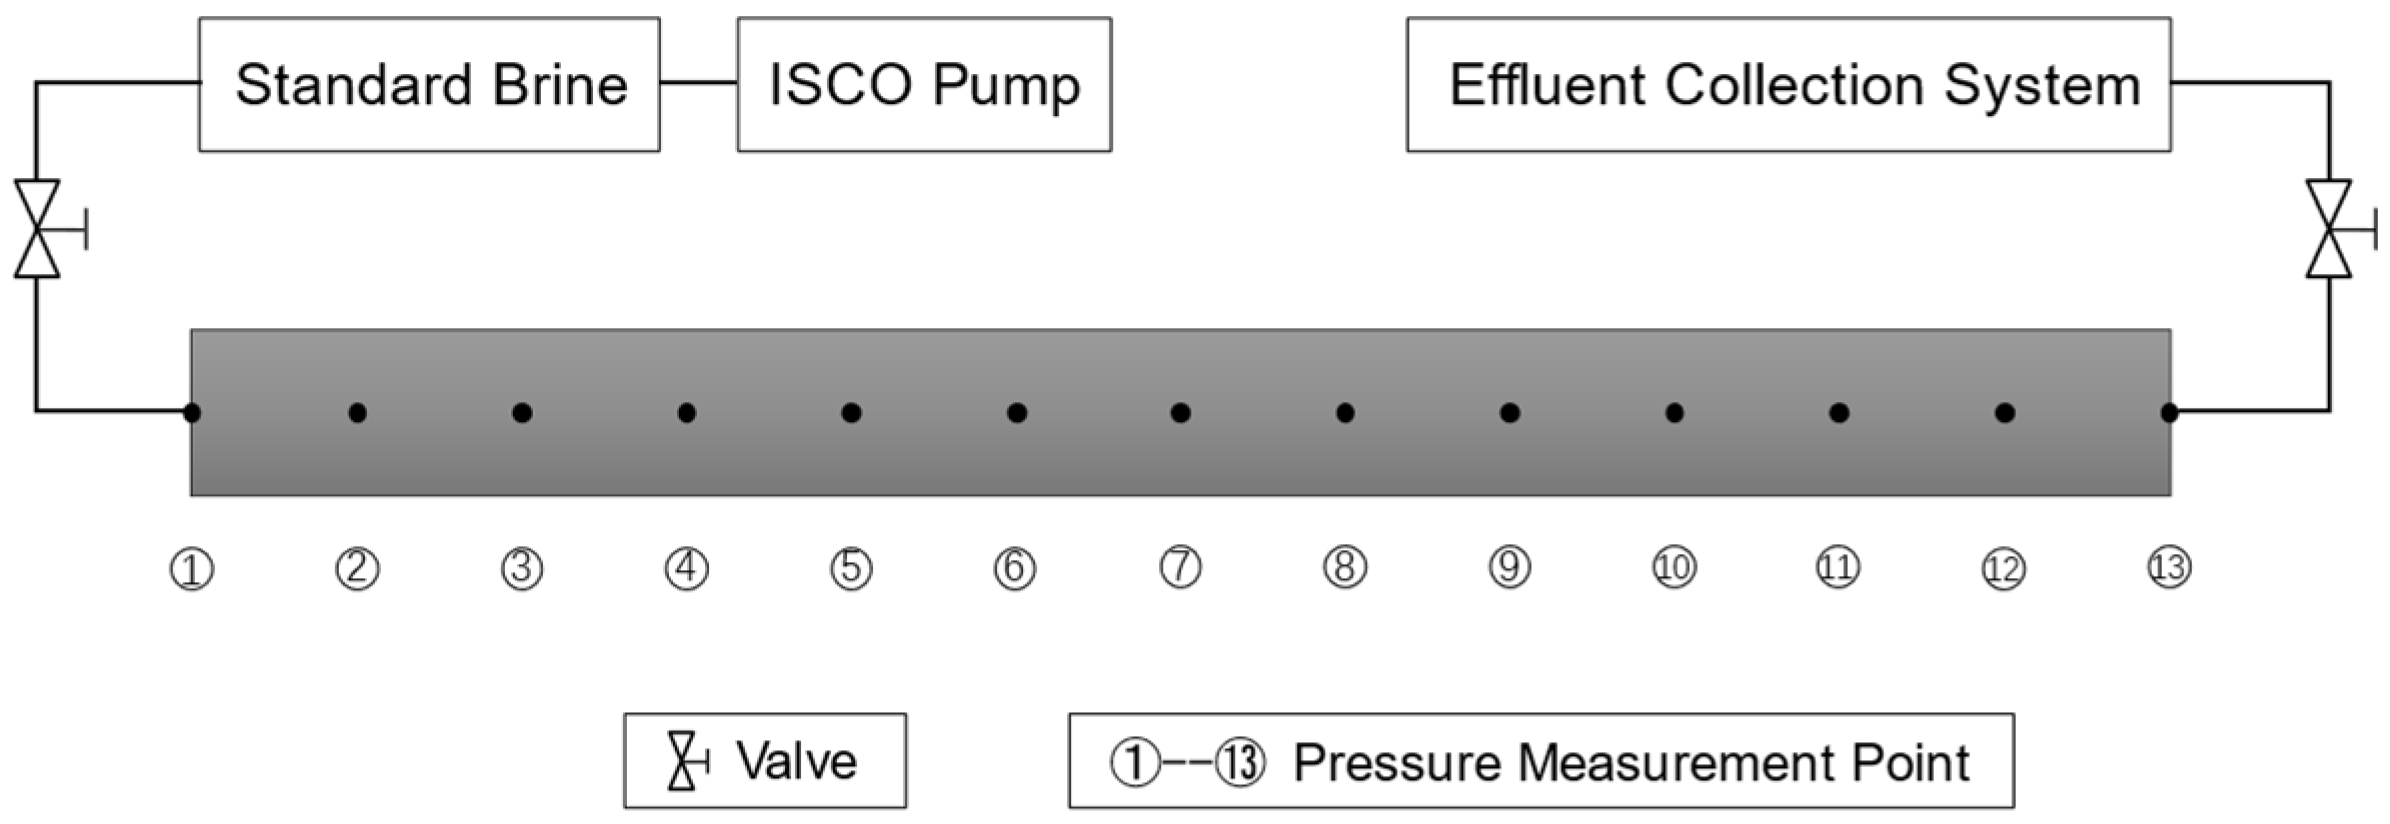
A rectangular long core was used in the experiment. The effective core length was 48 cm, and the porosity was 10.5%. Thirteen pressure measurement points were arranged during the experiment to monitor the pressure distribution at different locations in the model during waterflooding. The parameters of the experimental model are listed in Table 1. Kerosene was used as the oil-phase fluid, while 50,000 ppm standard brine was used as the water-phase fluid in the experiment.
Table 1.
Petrophysical parameters of the long-core samples.
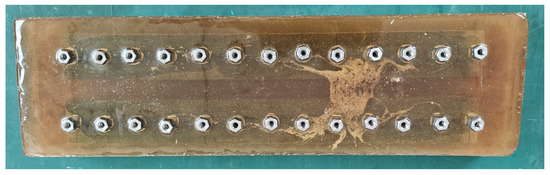
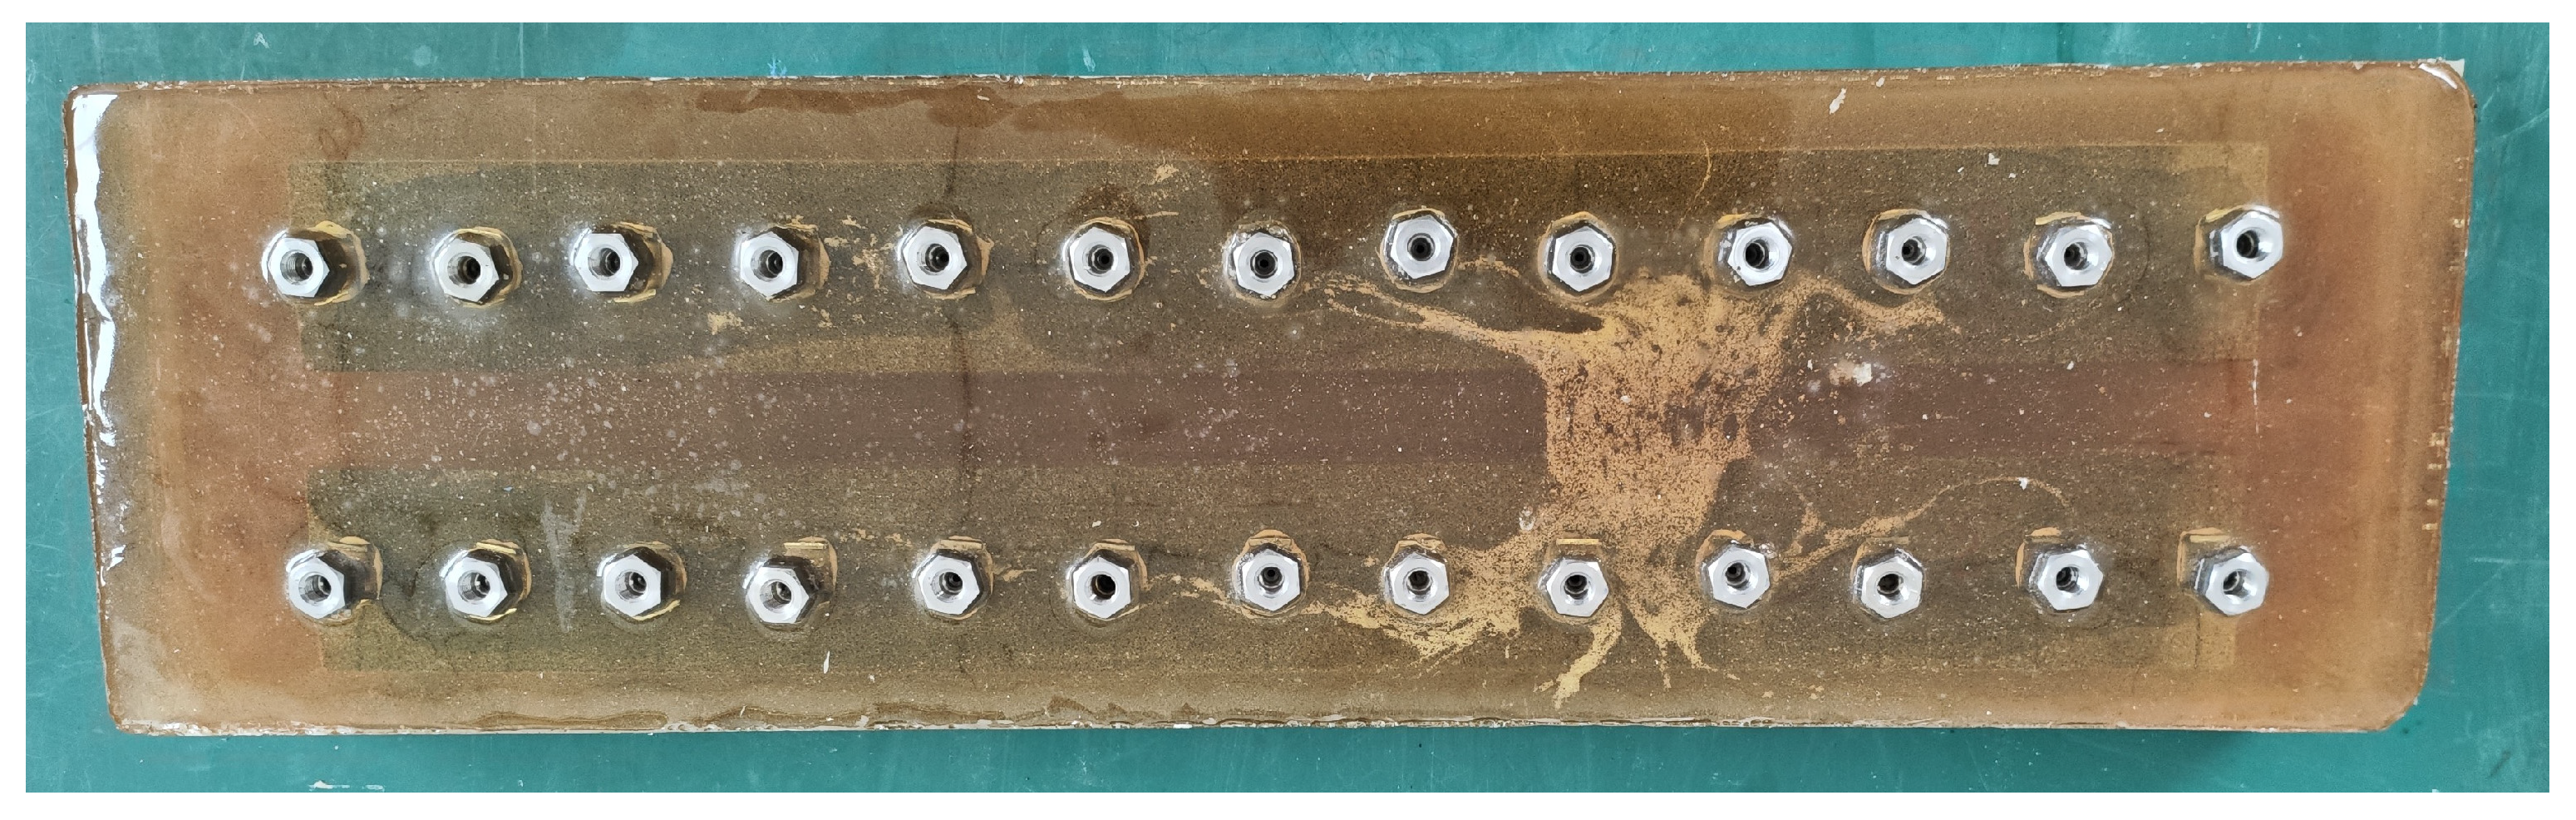
Figure 1 presents a schematic diagram of the experimental setup. The long-core sample was encapsulated with epoxy resin (Figure 2) and installed in the core holder. The core holder was used to fix and seal the core sample during the experiment. An ISCO pump (Chandler Engineering, Broken Arrow, OK, USA) was connected to the inlet of the core holder to provide a stable and controllable injection rate or pressure. A pressure monitoring system was connected to the pressure measurement points along the core to continuously record the pressure variations at different locations. The produced fluids were collected and measured at the outlet of the core holder. Through the coordinated operation of the injection, pressure monitoring, and production systems, the waterflooding process and the corresponding pressure responses along the long core were monitored throughout the experiment.
Figure 1.
Schematic diagram of the long-core displacement experimental apparatus.
Figure 2.
Photograph of the long-core experimental model.
Figure 2 shows two long cores prepared for the waterflooding experiment, with 13 pressure measurement points installed on each core. However, one of the cores exhibited unsatisfactory sealing and was therefore not used in the actual experiment. The waterflooding experiment was conducted using only the well-sealed core, which contained 13 pressure measurement points.
The experimental procedure was conducted as follows: (1) the model was vacuumed and saturated with kerosene; (2) the model was installed in a large-scale outcrop-model experimental system, and a waterflooding experiment was performed under a constant-pressure condition of 1 MPa; (3) after approximately 2800 min of operation, the injection pressure was increased to 2 MPa for the subsequent waterflooding experiment; (4) after another approximately 2800 min, the injection pressure was increased to 3 MPa; and (5) after an additional approximately 2800 min, the injection pressure was further increased to 4 MPa until the experiment was completed. During the experiment, the pressure at each measurement point and the produced fluid volume were continuously recorded as functions of time. Four displacement stages were designed in the experiment, and each stage was conducted under a different injection pressure. Through the analysis of these four stages, the influence of displacement pressure on the seepage process could be systematically evaluated.
The injection pressure was increased stepwise from 1 to 4 MPa, with pressure stages of 1, 2, 3, and 4 MPa. The pressure levels were selected by considering the experimental duration, core integrity, and the progression of waterflooding. At the initial injection pressure of 1 MPa, the production rate gradually decreased, while the cumulative production remained relatively low compared with the cumulative injected volume. Maintaining the pressure at 1 MPa would have resulted in an excessively long experimental duration. Therefore, the injection pressure was increased stepwise to accelerate the displacement process while maintaining a controllable experimental condition. The selected pressure levels of 2 and 4 MPa do not represent theoretically defined critical pressures or characteristic pressures. Rather, they were selected as practical pressure increments within the operating range of the experimental system. Each pressure stage was maintained for approximately 2800 min. The stage duration was determined based on the production-rate response, the overall experimental duration, and the integrity of the core sample.
3. Analysis of Experimental Results
3.1. Patterns of Change in Productivity Volume and Productivity Index
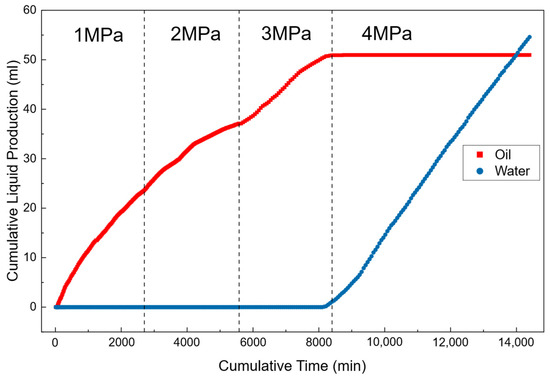
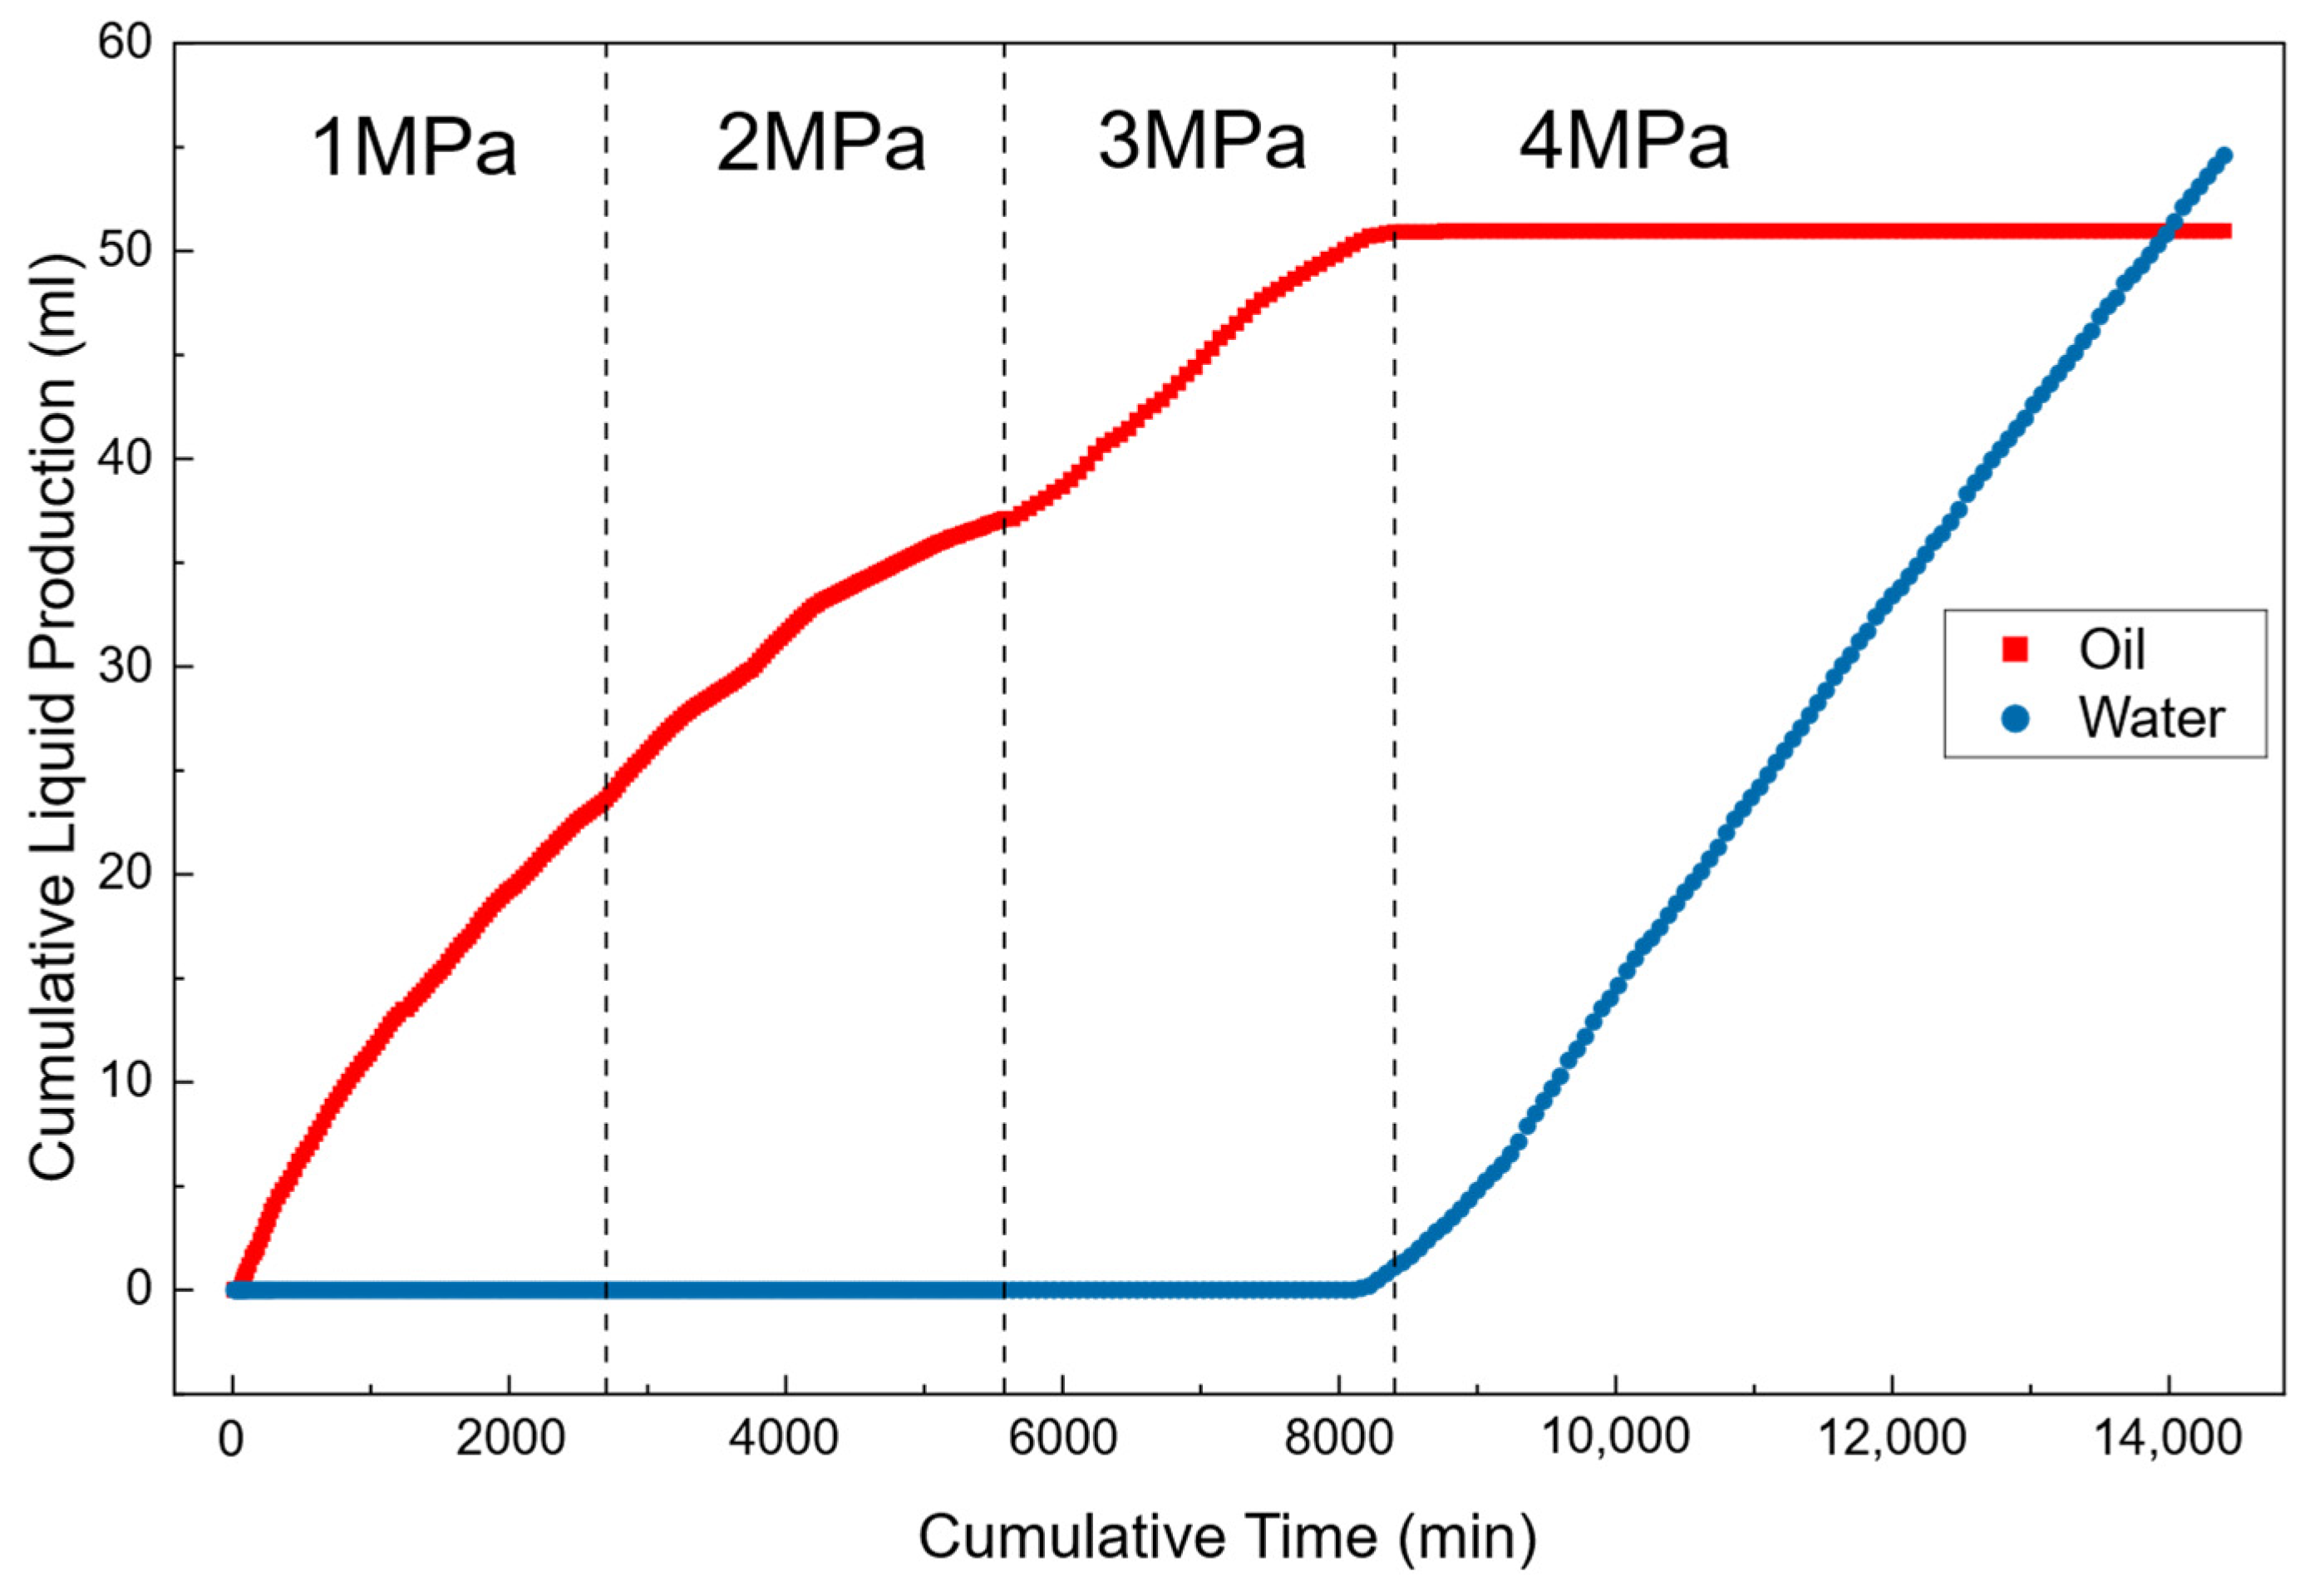
Figure 3 shows the temporal evolution of cumulative oil production and cumulative water production under an initial condition of 100% oil saturation. The total cumulative oil production obtained during the experiment was Qt = 50.95 mL, which represents the cumulative oil production over all four pressure stages, from 1 to 4 MPa, corresponding to a recovery factor of 31.26%. Thus, approximately 112.05 mL of the initial oil remained unrecovered, providing indirect macroscopic evidence of oil retention within the core. Overall, the displacement process exhibits distinct stage-dependent flow behavior, reflecting a rapid transition in oil–water flow capacity during waterflood front advancement.
Figure 3.
Variations in oil production and water production with time.
During the early stage (before approximately 8000 min), no water production was detected. This indicates that the injected water had not yet broken through to the production end. The system was still dominated by continuous oil-phase flow. In this stage, the produced fluid was contributed almost entirely by the oil phase. Therefore, oil-phase flow can be used to represent the overall fluid transport behavior. As displacement proceeds, the injected water gradually advances to the production outlet, and water breakthrough occurs.
After breakthrough (after approximately 8000 min), the cumulative water production increases rapidly and then follows an approximately linear trend in the later stage. This indicates that the flow pathways become increasingly dominated by the water phase, and the water flow capacity is significantly enhanced. Meanwhile, the cumulative oil production curve quickly flattens after water breakthrough. This suggests a sharp decline in oil production capacity, and the system rapidly enters a high-water-cut, low-oil-production regime. This behavior, characterized by rapid water-cut increase and nearly ceased oil production after breakthrough, reflects strong mobility contrast during displacement and the formation of preferential flow channels. Once breakthrough occurs, injected water preferentially flows along high-permeability pathways, thereby weakening further displacement of the remaining oil.
The productivity index (PI) is used to characterize the overall flow capacity of the system during the displacement process. It is defined as the fluid production capacity per unit pressure difference:
where is the productivity index, is the total liquid production rate, and is the displacement pressure difference. Under constant-pressure displacement conditions, the pressure difference remains constant. Therefore, variations in the productivity index directly reflect the dynamic evolution of flow resistance in the system. When flow resistance increases, fluid transport capacity decreases, and the productivity index correspondingly decreases. Conversely, when flow resistance is reduced, the productivity index shows an increasing trend.
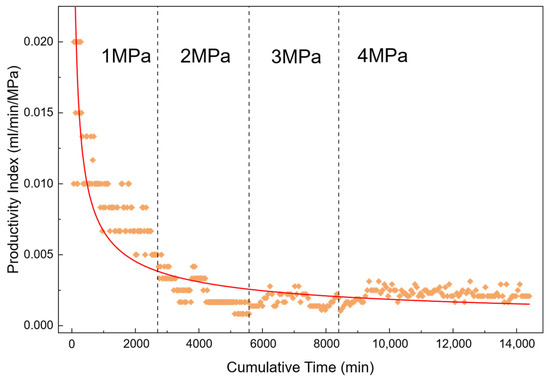
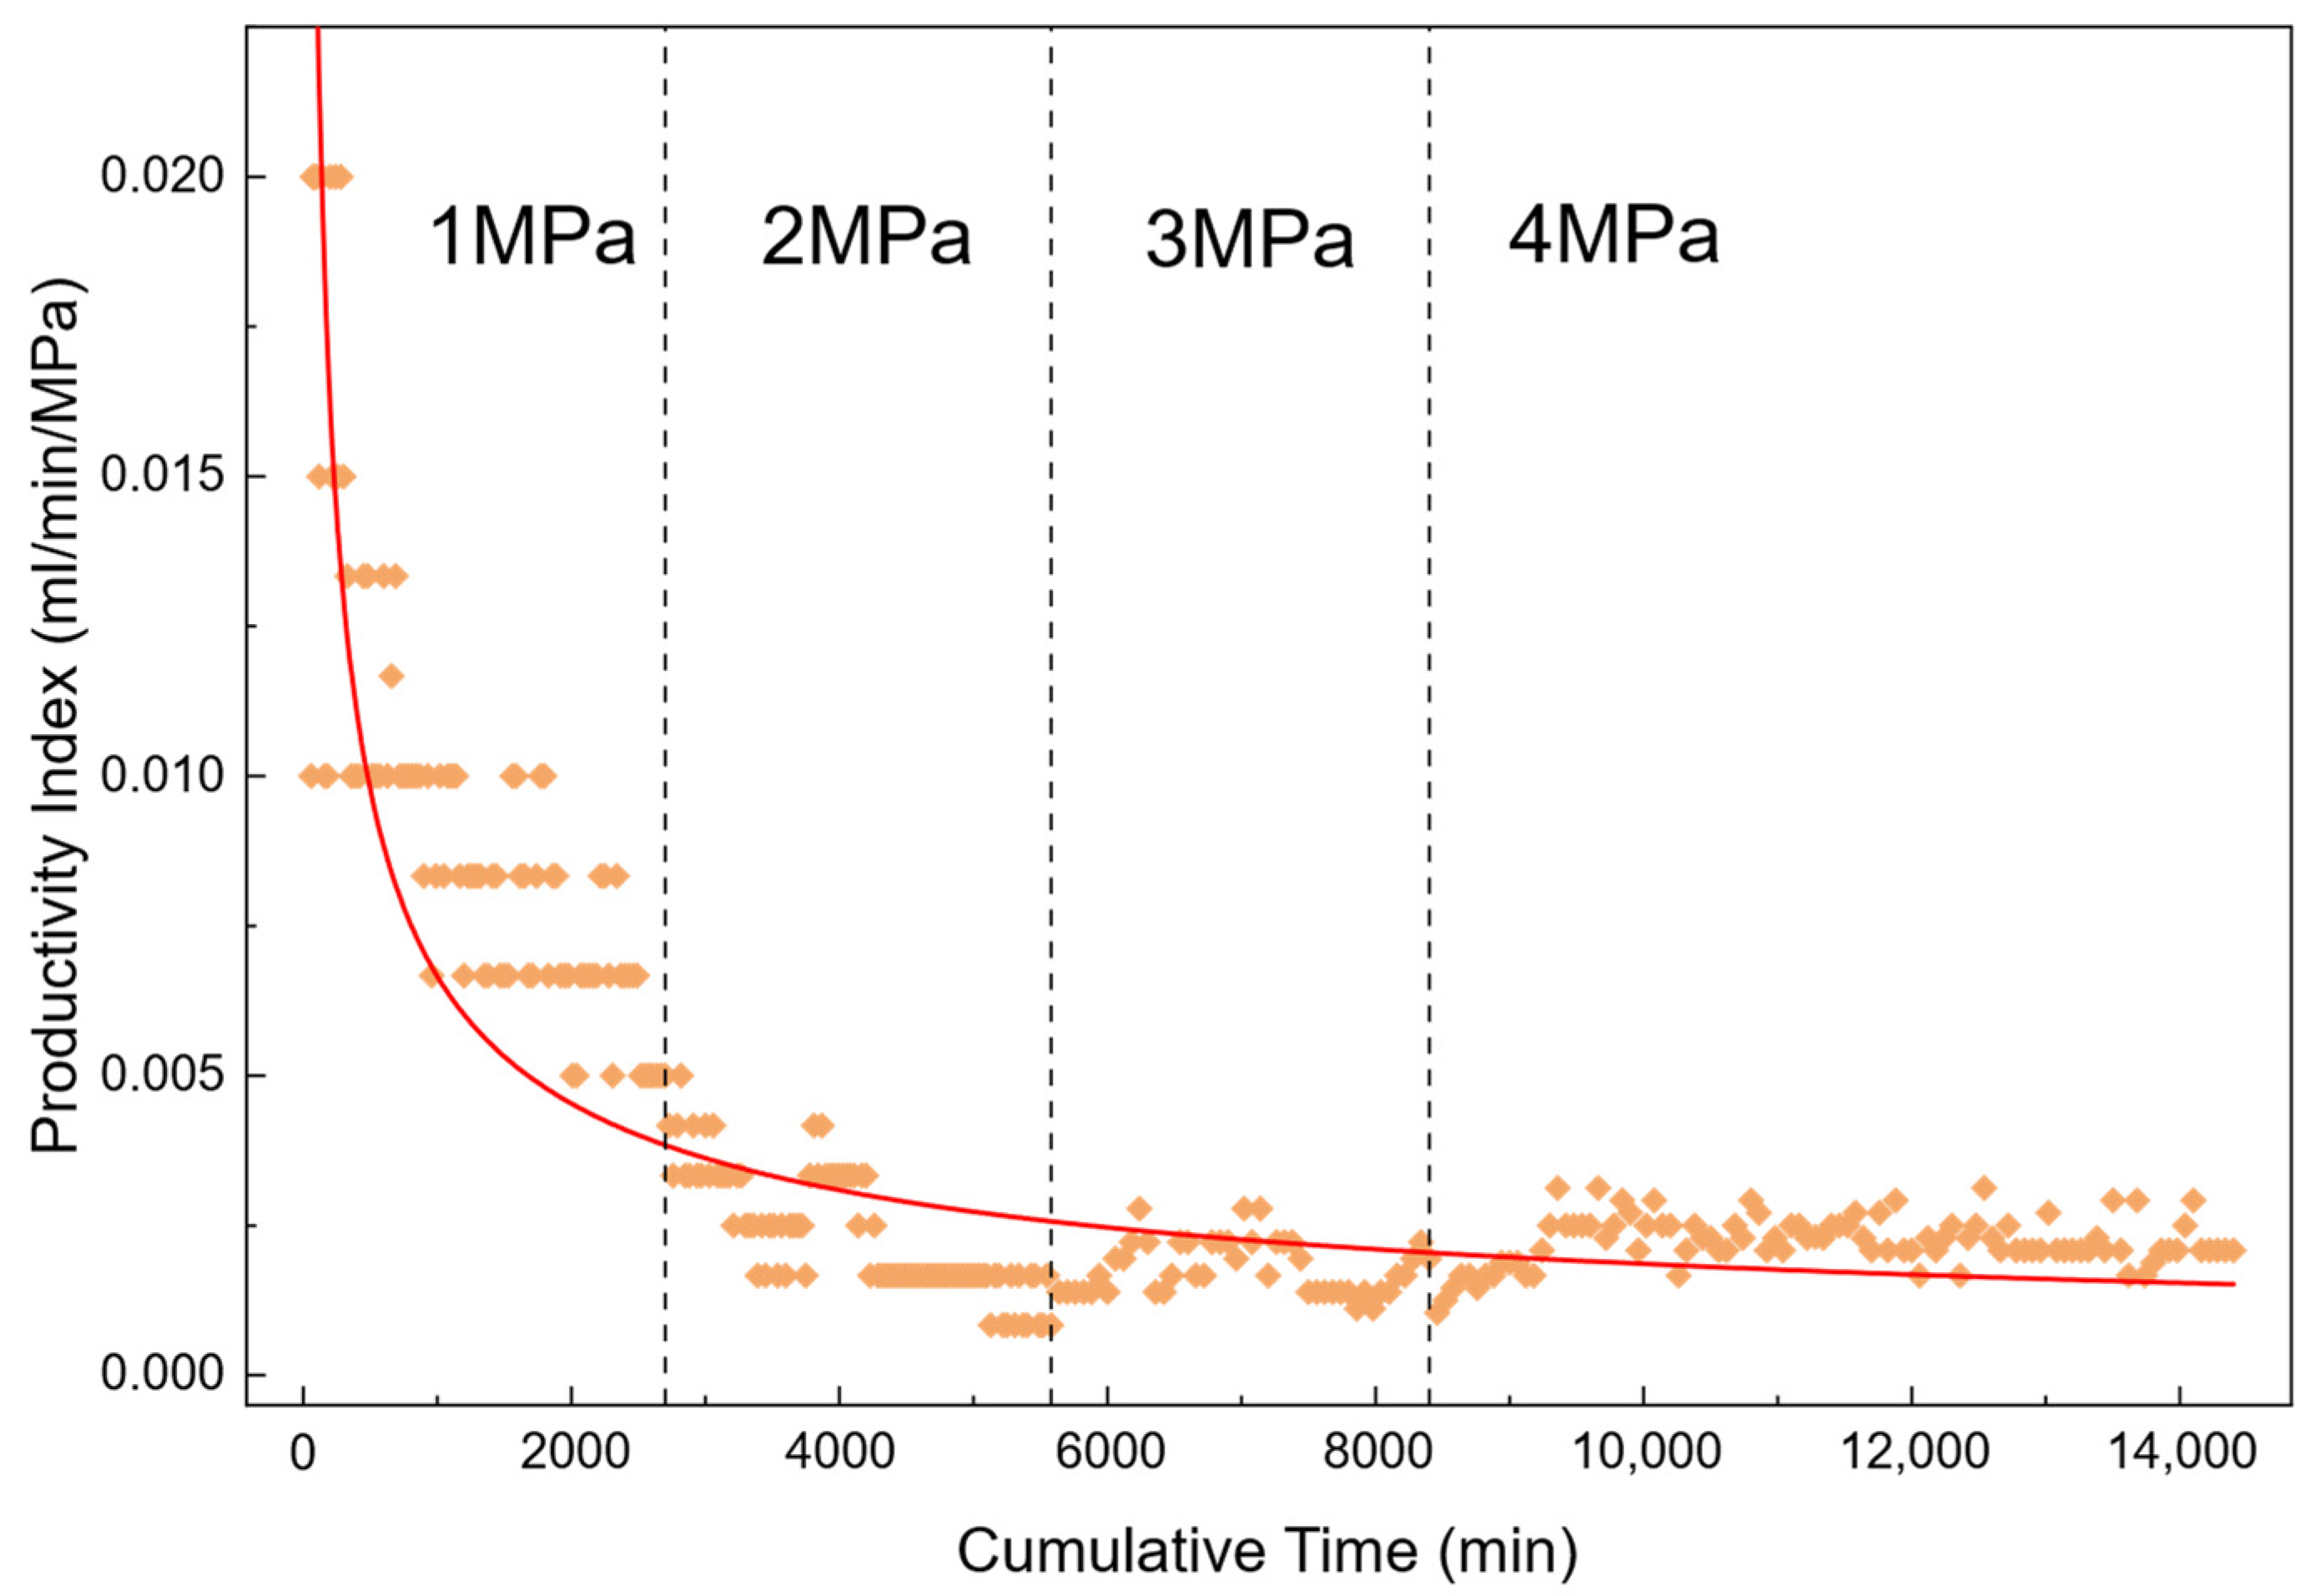
Figure 4 shows the temporal variation of the productivity index during waterflooding under an initial condition of 100% oil saturation. Overall, the curve exhibits a distinct “rapid decline in the early stage followed by a gradual stabilization in the later stage,” indicating a clear stage-dependent evolution of flow resistance during the displacement process. Based on the analysis of the displacement behavior, the increase in flow resistance is mainly attributed to interfacial resistance generated during dispersed-phase formation. Therefore, the evolution of the productivity index can indirectly reflect the formation and development of dispersed-phase interfacial resistance.
Figure 4.
Variation in productivity index with time.
At the early stage of flooding, the productivity index decreases rapidly, indicating a sharp increase in internal flow resistance. This stage corresponds to the pre-breakthrough period, during which injected water advances through the pore space and easily induces oil–water dispersion and interfacial reconstruction, leading to the formation of a large amount of dispersed-phase structures. As dispersed phases continuously develop, interfacial forces become increasingly significant, resulting in the accumulation of additional flow resistance and a rapid decline in production capacity. The experimental results show that water breakthrough occurs at approximately 8000 min. Prior to this point, dispersed-phase formation and accumulation are most active, and therefore the decline in productivity index is most pronounced.
After water breakthrough, the productivity index gradually stabilizes, indicating that flow resistance no longer increases continuously. This behavior suggests that, after breakthrough, the flow channels become progressively stabilized, and no new dispersed-phase structures are generated within the system. As a result, no additional interfacial resistance is produced. Under these conditions, the displacement process is dominated by stable flow within established channels, leading to a relatively steady productivity index. The observed stabilization further indicates that dispersed-phase generation is significantly weakened or even ceases after water breakthrough.
3.2. Analysis of Adsorption and the Influence of the Dispersed Phase
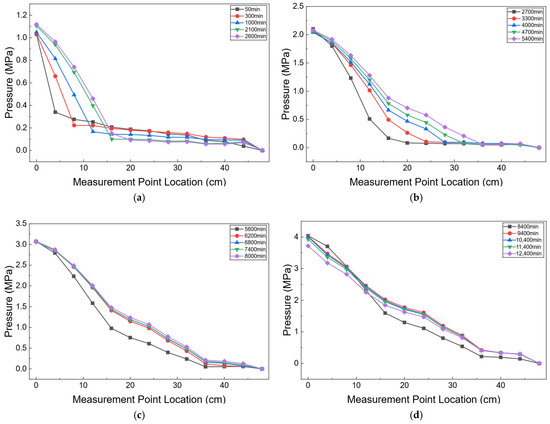
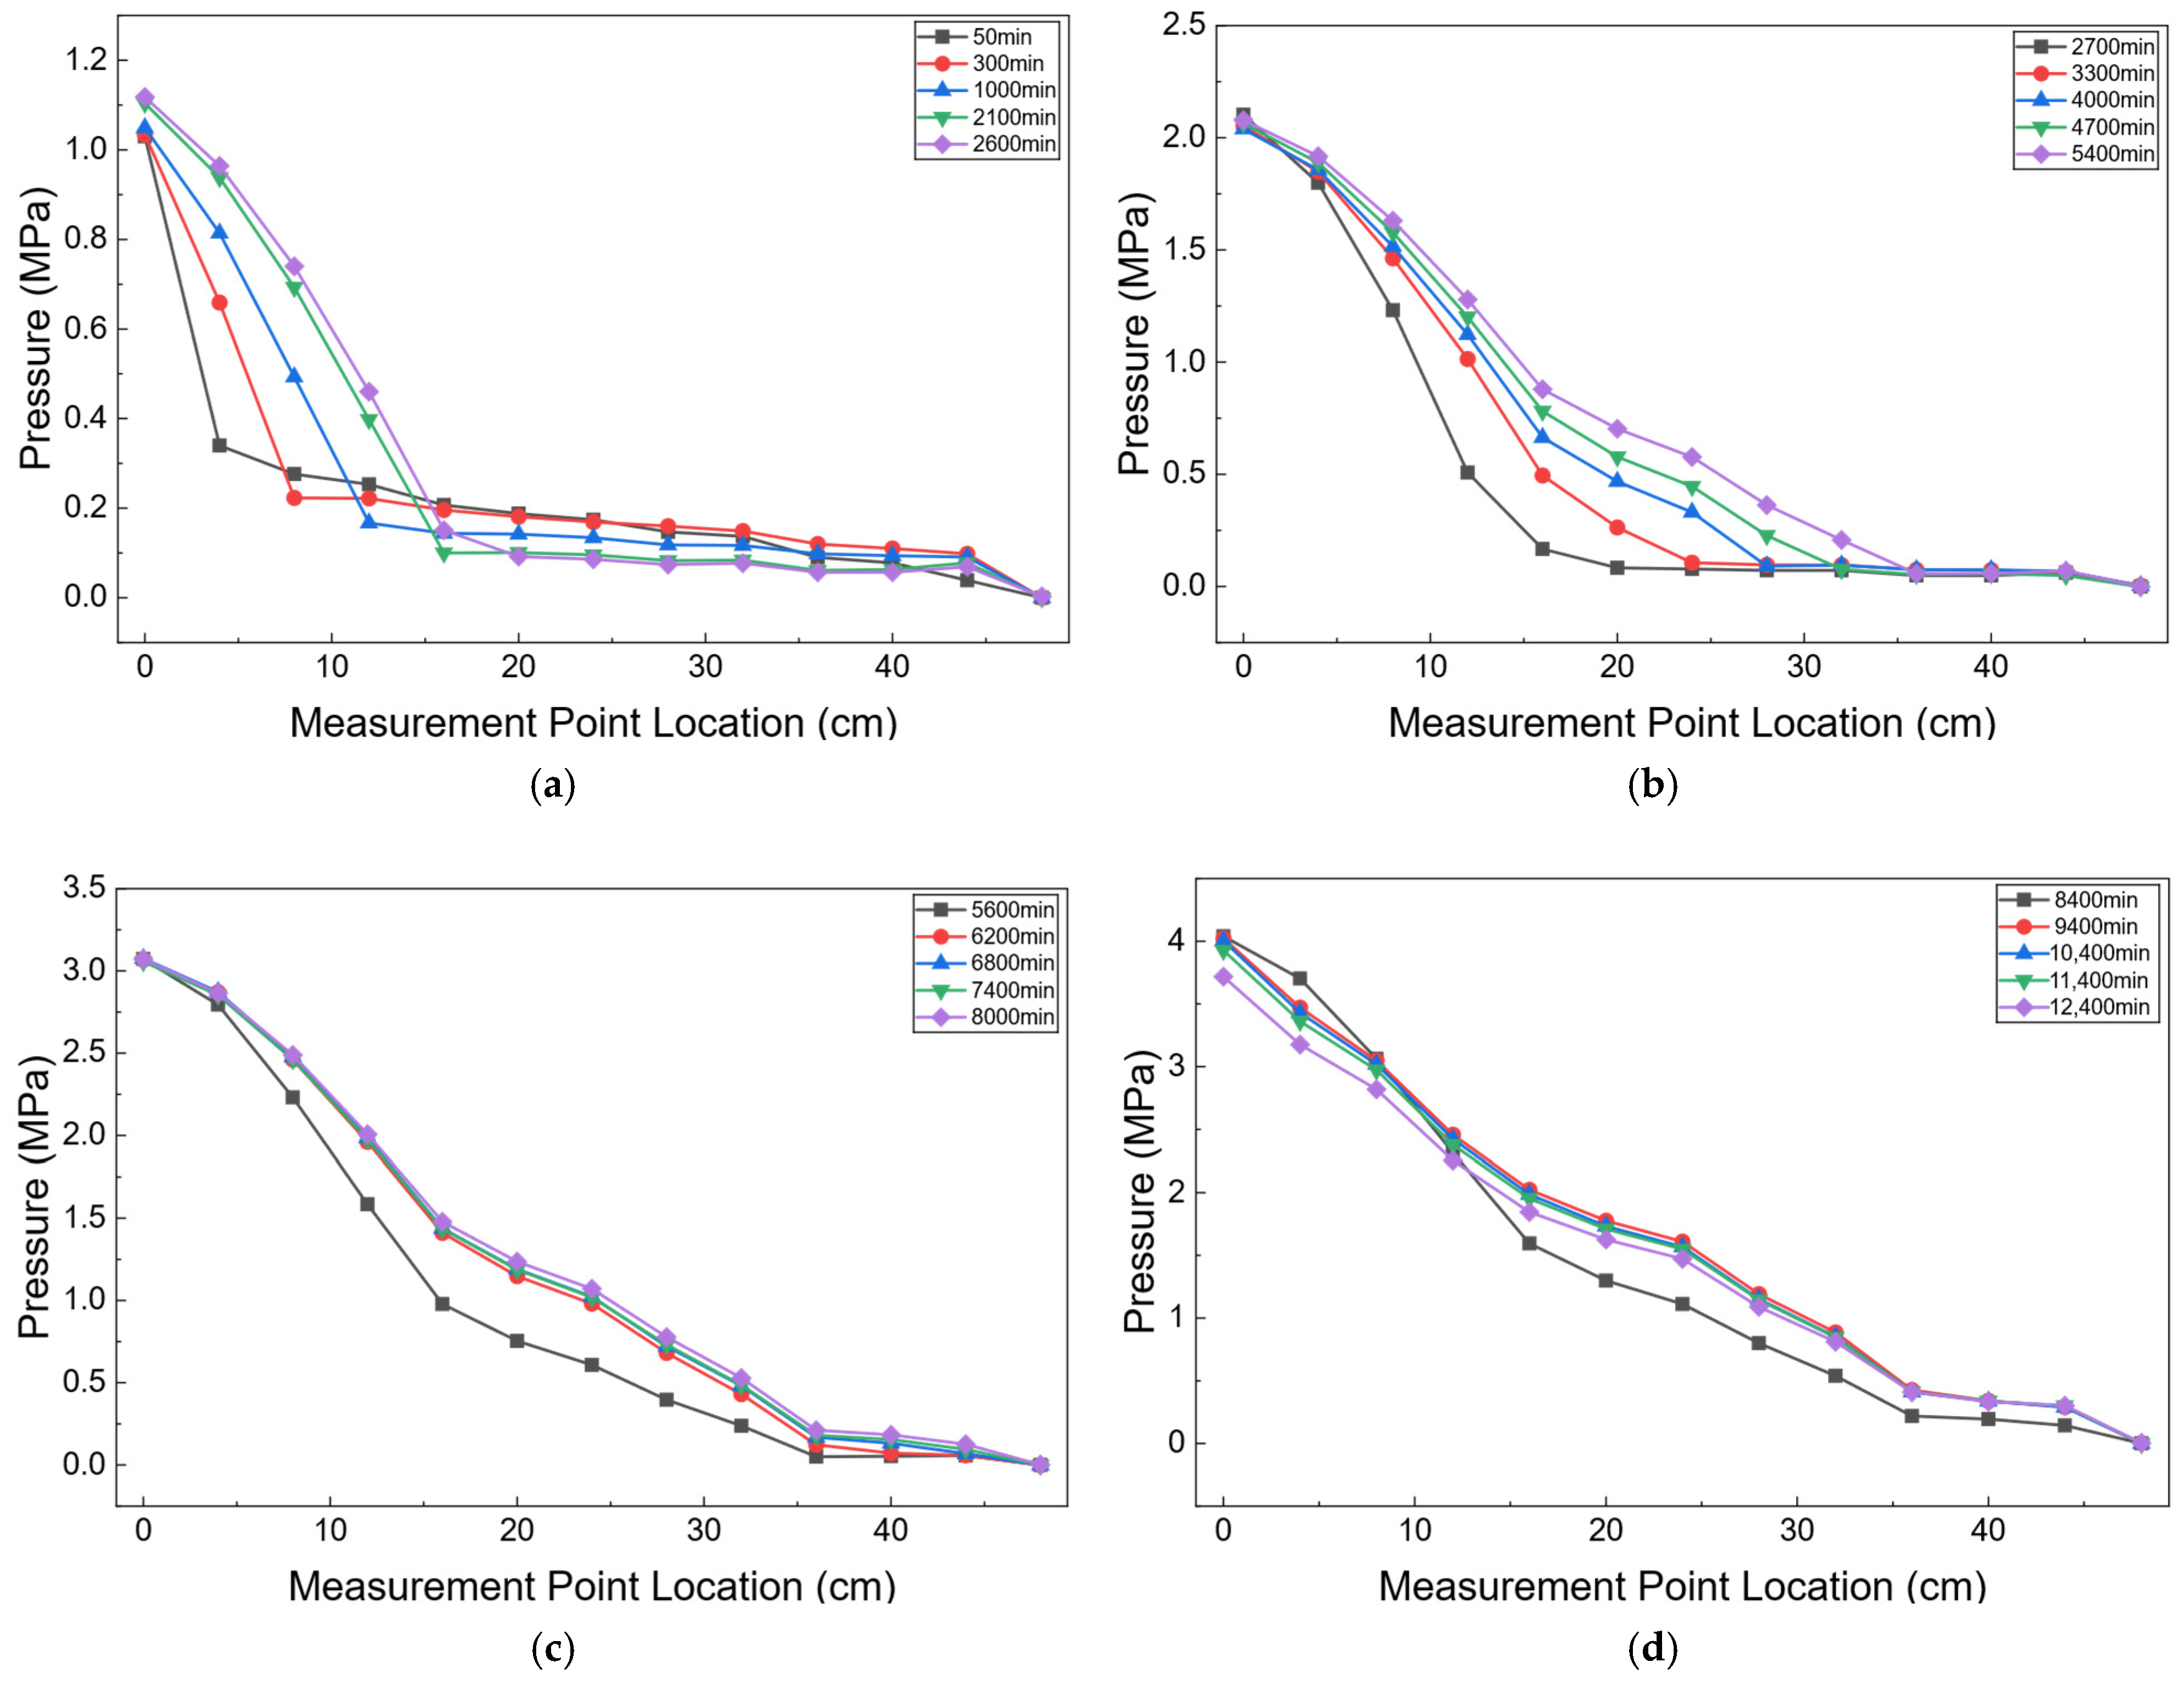
Figure 5 presents the pressure distribution profiles along the long core at selected representative times during the waterflooding process. Representative times, including 50, 300, and 1000 min, were selected to clearly illustrate the temporal evolution of pressure propagation. These time points correspond to different stages of pressure development and allow the changes in the pressure distribution along the core to be visualized more clearly. Overall, the pressure field exhibits distinct local fluctuations that progressively propagate along the displacement direction. This behavior indicates that the flow resistance inside the reservoir does not evolve uniformly during displacement. Instead, dynamic enhancement of flow resistance occur in localized regions, resulting in transient pressure fluctuation propagation. This phenomenon can be further verified by the variation in productivity index. During the early stage of displacement, the productivity index decreases rapidly, indicating a significant reduction in the overall flow capacity of the system and a continuous increase in flow resistance. At the same time, pronounced pressure fluctuations begin to appear in the pressure field. The temporal correspondence between these two phenomena suggests that pressure fluctuations and the decline in flow capacity originate from the same physical mechanism, namely the formation and accumulation of additional interfacial resistance during displacement.
Figure 5.
Pressure distribution along the long core at different injection pressures: (a) 1 MPa; (b) 2 MPa; (c) 3 MPa; and (d) 4 MPa.
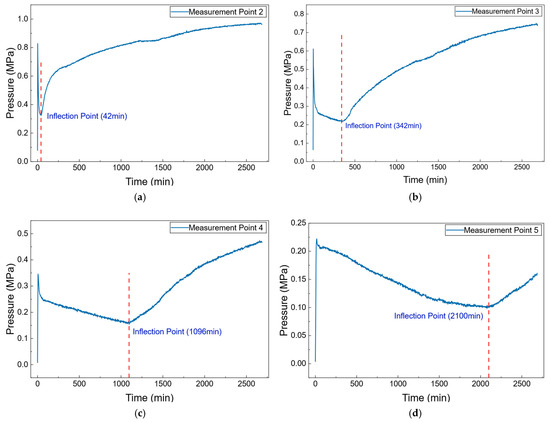
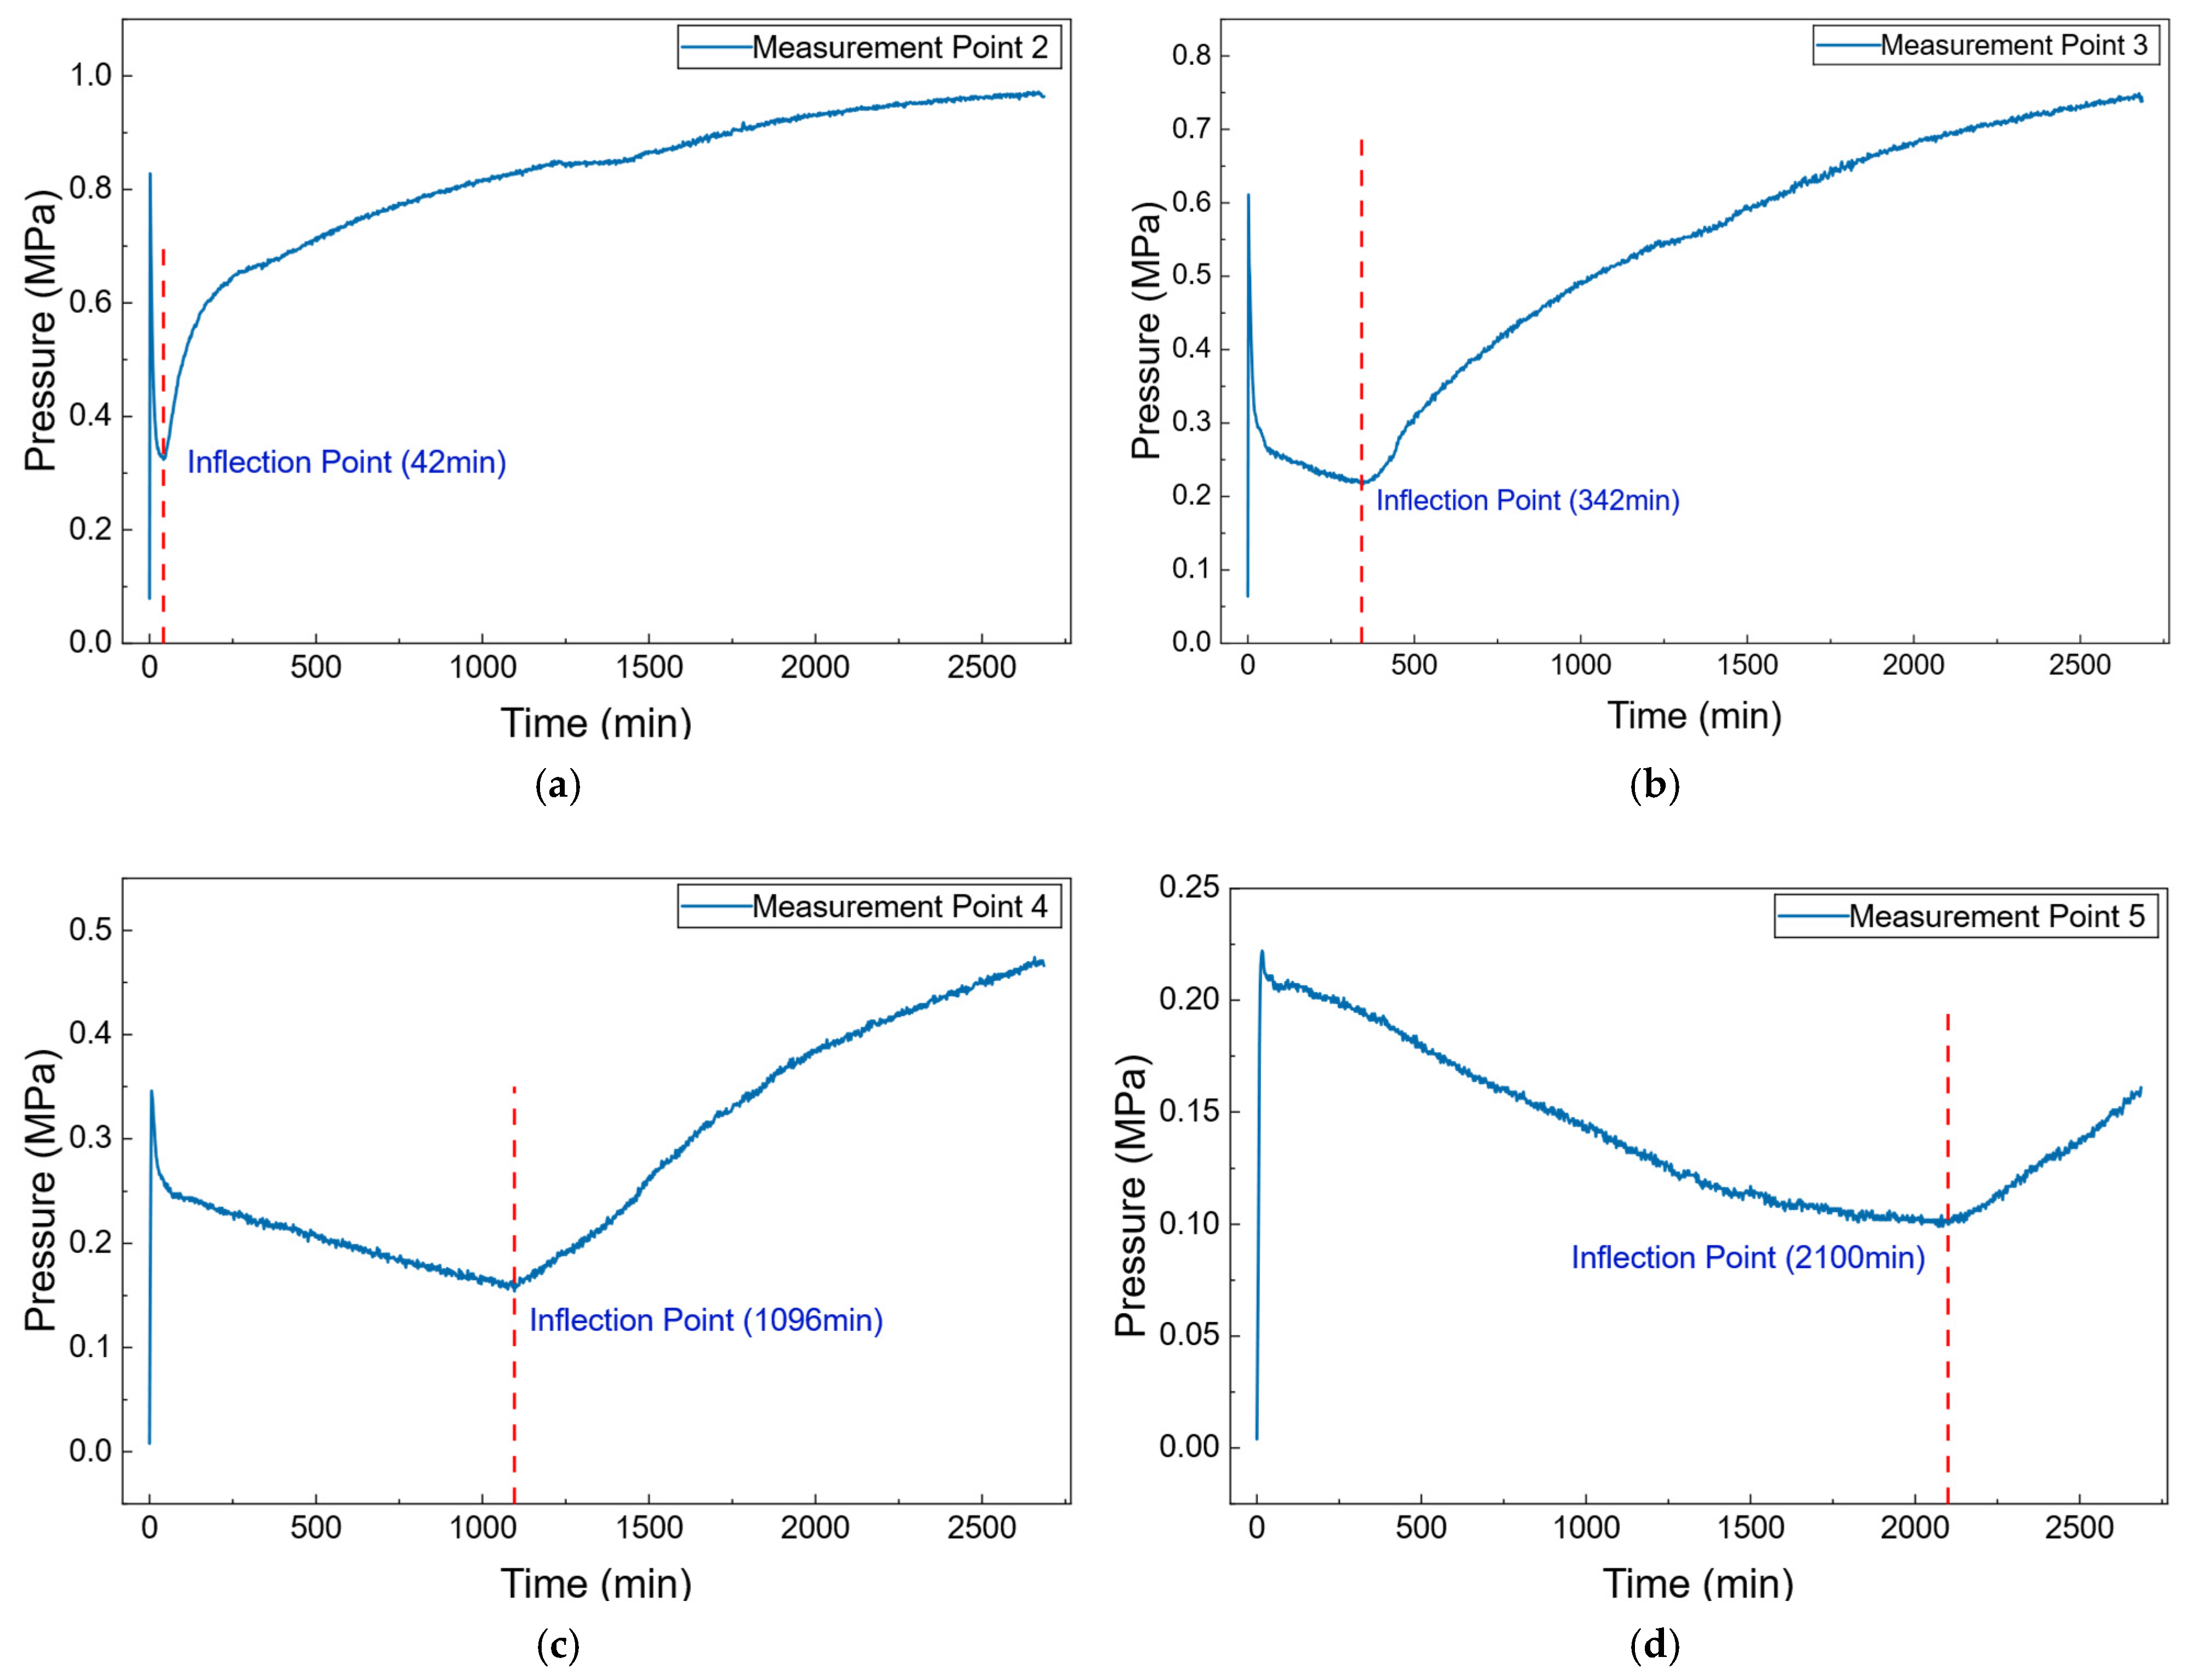
Figure 6 shows the temporal pressure variations at measurement points 2–5. Overall, except for measurement point 1 near the inlet and measurement point 13 near the outlet, where the pressure variations remain relatively stable, the pressures at the intermediate measurement points exhibit a distinct dynamic pattern characterized by “initial increase–subsequent decrease–later increase.” This behavior indicates that the pressure field inside the reservoir does not propagate steadily during waterflooding, but is jointly influenced by waterflood front advancement and dynamic variations in local flow resistance.
Figure 6.
Pressure variations with time at measurement points 2–5: (a) Measurement point 2; (b) Measurement point 3; (c) Measurement point 4; (d) Measurement point 5.
For an individual measurement point, the pressure first increases rapidly during the initial stage of displacement. This behavior is mainly attributed to the rapid transition of the system from an initial transient state to a quasi-steady flow state after water injection begins. Because pressure propagates rapidly, while no significant two-phase interfacial reconstruction has yet occurred near the measurement point, pressure can be transmitted quickly to the monitoring location, resulting in a sharp pressure increase within a short period. As the displacement process continues, the pressure at the measurement point gradually decreases. This stage corresponds to the period before the waterflood front reaches the monitoring location. However, the region near the inlet that has already been swept by injected water experiences higher flow resistance due to two-phase flow and interfacial effects, thereby consuming a larger portion of the pressure drop. Specifically, in the water-invaded region, imbibition and oil–water interfacial reconstruction induce dispersed-phase formation, which increases local additional interfacial resistance and causes more pressure to be concentrated in the swept region. Consequently, the pressure available in the unswept region gradually decreases, leading to a continuous pressure decline at the measurement point. This behavior demonstrates that pressure distribution during displacement is strongly spatially non-uniform, and the pressure field dynamically adjusts in response to local resistance variations. When the waterflood front further advances and reaches the measurement point, the pressure rises again. This occurs because the arrival of injected water alters the local flow state, causing the monitored region to sustain a larger proportion of the overall displacement pressure. Meanwhile, as stable waterflood flow channels are progressively established, pressure propagation becomes more effective, and the pressure at the measurement point gradually recovers and continues to increase. In the late stage of displacement, when waterflooding is nearly completed, the internal flow states in different regions gradually become similar, and the differences in overall flow resistance are significantly reduced. As a result, the pressure field gradually returns to a stable state, and the pressure distribution along the flow direction approaches a linear profile, as shown in Figure 5d.
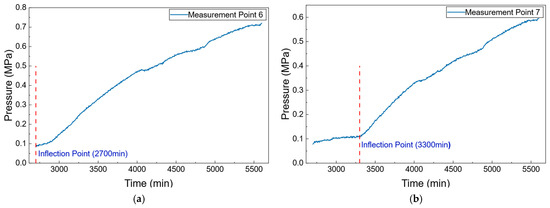
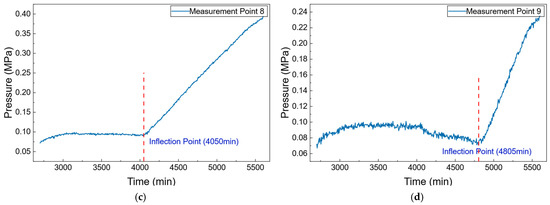
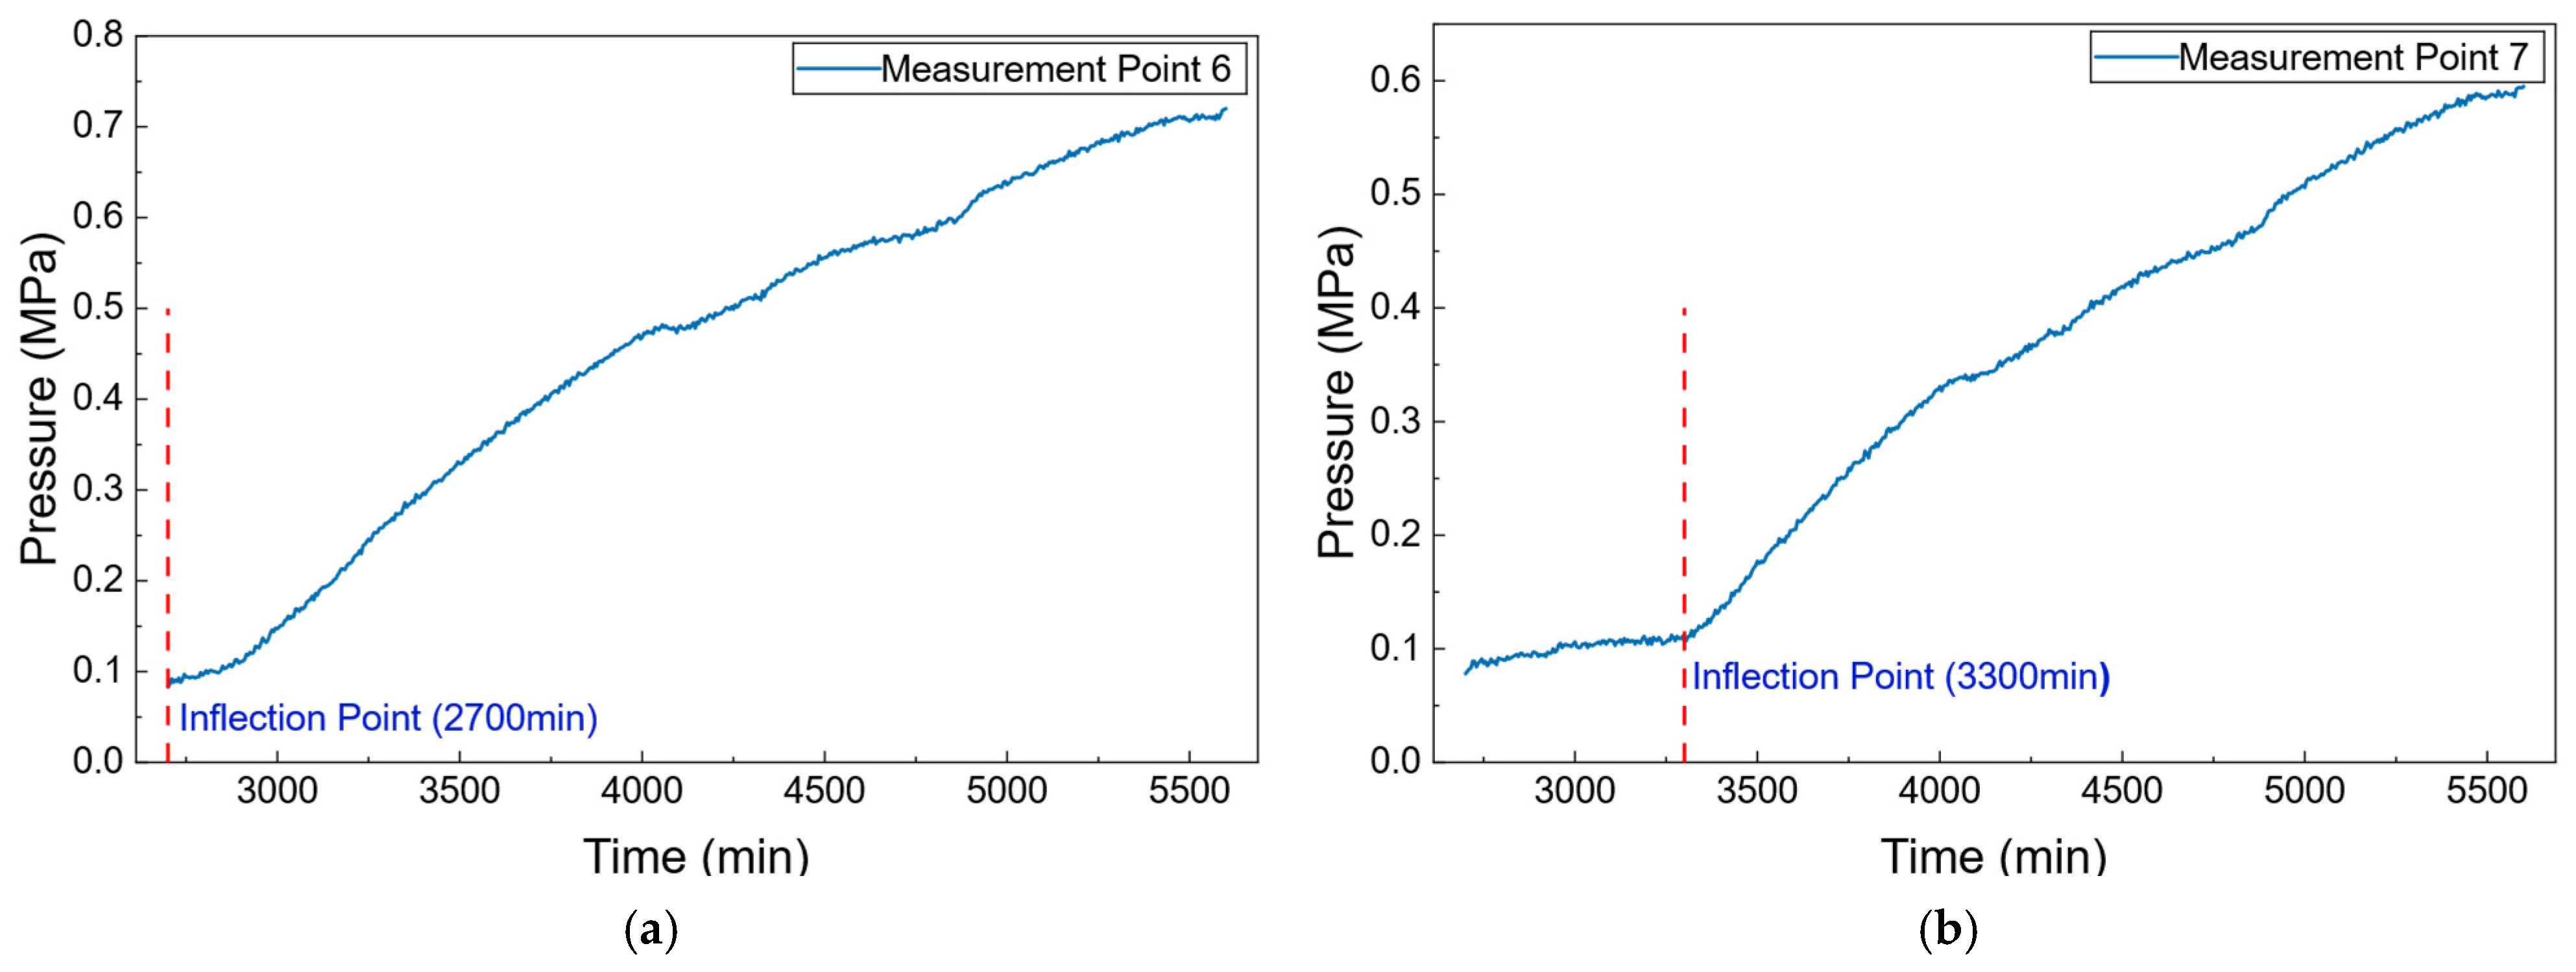
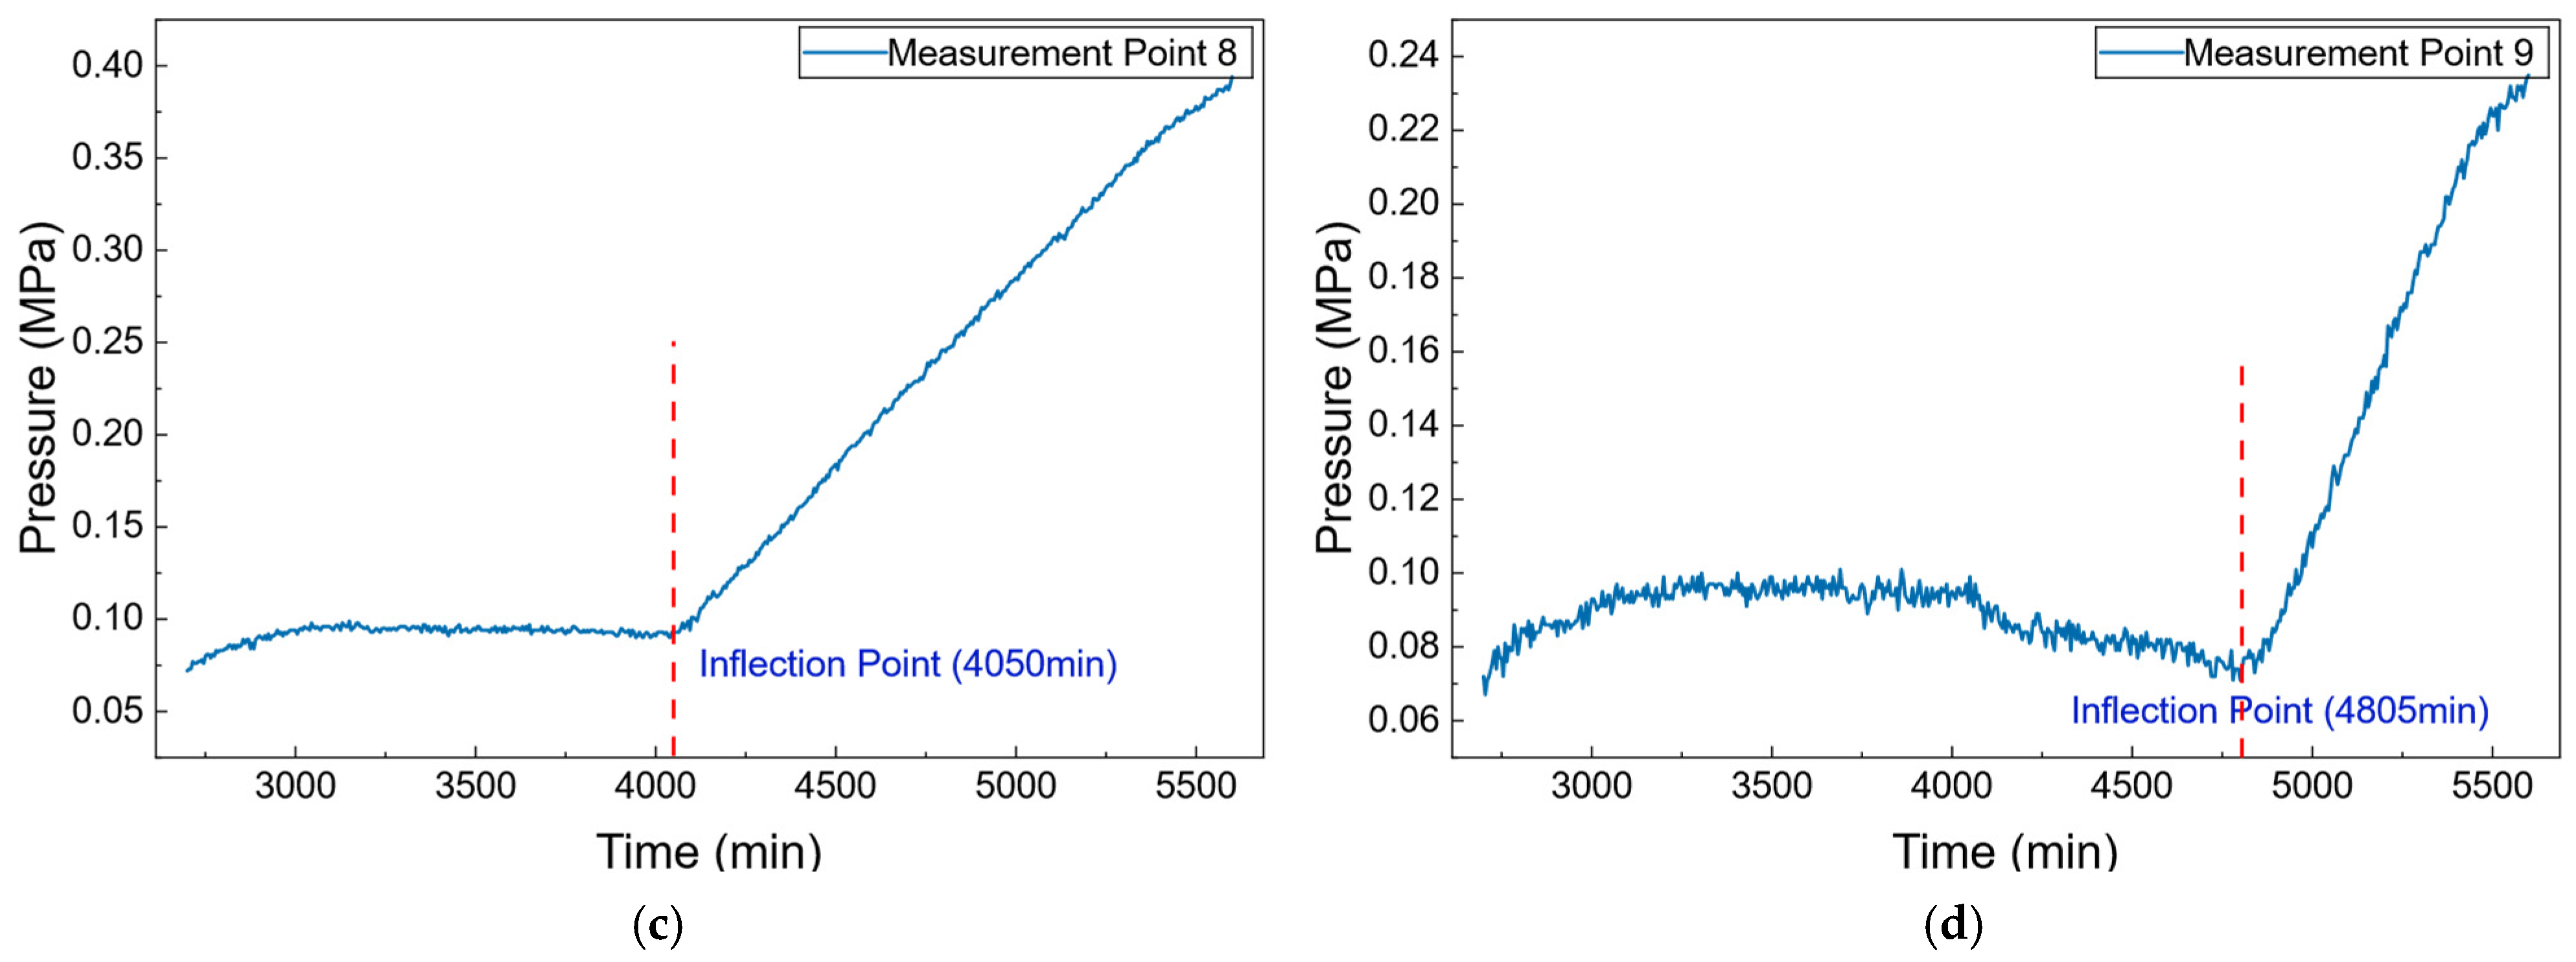
To identify the pressure inflection points, the pressure–time curves at all monitoring points were examined based on their temporal variation trends. In this study, a pressure inflection point is operationally defined as the transition point at which the pressure response at a monitoring point changes from a sustained decreasing trend to a subsequent increasing trend. The inflection point therefore corresponds to the transition between the decreasing and increasing segments of the pressure–time curve and represents a local minimum in the pressure response. To reduce the possibility of interpreting measurement fluctuations as physical responses, only transitions associated with a relatively continuous and sustained change in trend were identified as pressure inflection points. Small-amplitude fluctuations without a persistent change from decreasing to increasing pressure were regarded as experimental fluctuations and were not identified as inflection points. The corresponding times of the identified inflection points are indicated by dashed lines in Figure 6 and Figure 7.
Figure 7.
Pressure variations with time at measurement points 6–9: (a) Measurement point 6; (b) Measurement point 7; (c) Measurement point 8; (d) Measurement point 9.
Figure 7 shows the temporal pressure variations at measurement points 6–9. After approximately 2700 min, the pressure curves exhibit a relatively stable stage. This behavior is attributed to the increase in inlet pressure from 1 MPa to 2 MPa, which raises the overall pressure level of the system. However, before the waterflood front reaches the unswept region, the pressure at the monitoring points in these regions continuously decreases. The superposition of these two opposite effects results in a relatively stable pressure response over a certain time interval. As displacement further proceeds and the waterflood front advances toward the measurement points, the pressure begins to increase rapidly and exhibits a distinct inflection characteristic on the pressure curves.
Measurement points 2–9 were selected for detailed analysis because they exhibited relatively clear pressure variations and identifiable inflection characteristics, which allowed the pressure propagation behavior at different locations along the core to be compared. Measurement point 1 is located close to the injection boundary, and its pressure response is directly affected by the imposed injection condition. Measurement point 13 is close to the production boundary and is similarly influenced by the production-end boundary condition. In comparison, measurement points 10–12 are located near the production end, where the pressure response becomes relatively weak. As the waterflooding process progresses toward the production end, the transient pressure disturbance gradually attenuates under the constraint of the low-pressure production boundary, accompanied by a reduction in the local pressure gradient. Consequently, the pressure variations at points 10–12 are relatively small, and their inflection characteristics are less pronounced. Therefore, points 2–9 were selected as the primary monitoring points for subsequent analysis. The limited measurement resolution may also affect the identification of weak pressure responses.
The pressure inflection time at each measurement point was recorded, and the corresponding oil production associated with the arrival of the waterflood front at each location was calculated. The calculation equation is given as follows:
where Qx is the oil production corresponding to the moment when the waterflood front reaches measurement point X, Qt is the total oil production obtained in the experiment, Lx is the distance corresponding to measurement point X, and L is the total length of the long core.
It should be noted that Equation (2) represents an idealized macroscopic approximation rather than the actual local oil production distribution within the core. The relationship assumes that the displacement front can be approximately characterized by the ratio of the swept length to the total core length. This simplification does not account for the nonlinear two-phase flow behavior, capillary effects, relative permeability variations, pore-scale heterogeneity, or local preferential flow pathways in tight sandstone. Therefore, Equation (2) should not be interpreted as a governing equation for two-phase flow or as an accurate prediction of local oil production. Instead, it is used as a first-order estimate of the waterflood-front position based on the cumulative oil production.
In this study, the primary purpose of Equation (2) is to establish an approximate spatial relationship between the macroscopic waterflood-front position and the pressure responses at different simulation probe points. The estimated front position is subsequently compared with the times at which pressure inflection points occur at different locations. This comparison provides an indirect basis for examining whether the pressure inflection is associated with the arrival of the waterflood front. Thus, the results obtained from Equation (2) are intended for qualitative or semi-quantitative analysis, rather than for accurately reconstructing the actual spatial morphology of the waterflood front.
The calculated results are presented in Table 2.
Table 2.
Pressure inflection point times at monitoring locations and the corresponding oil production.
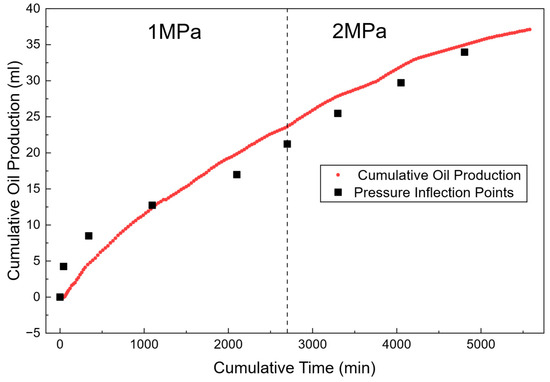
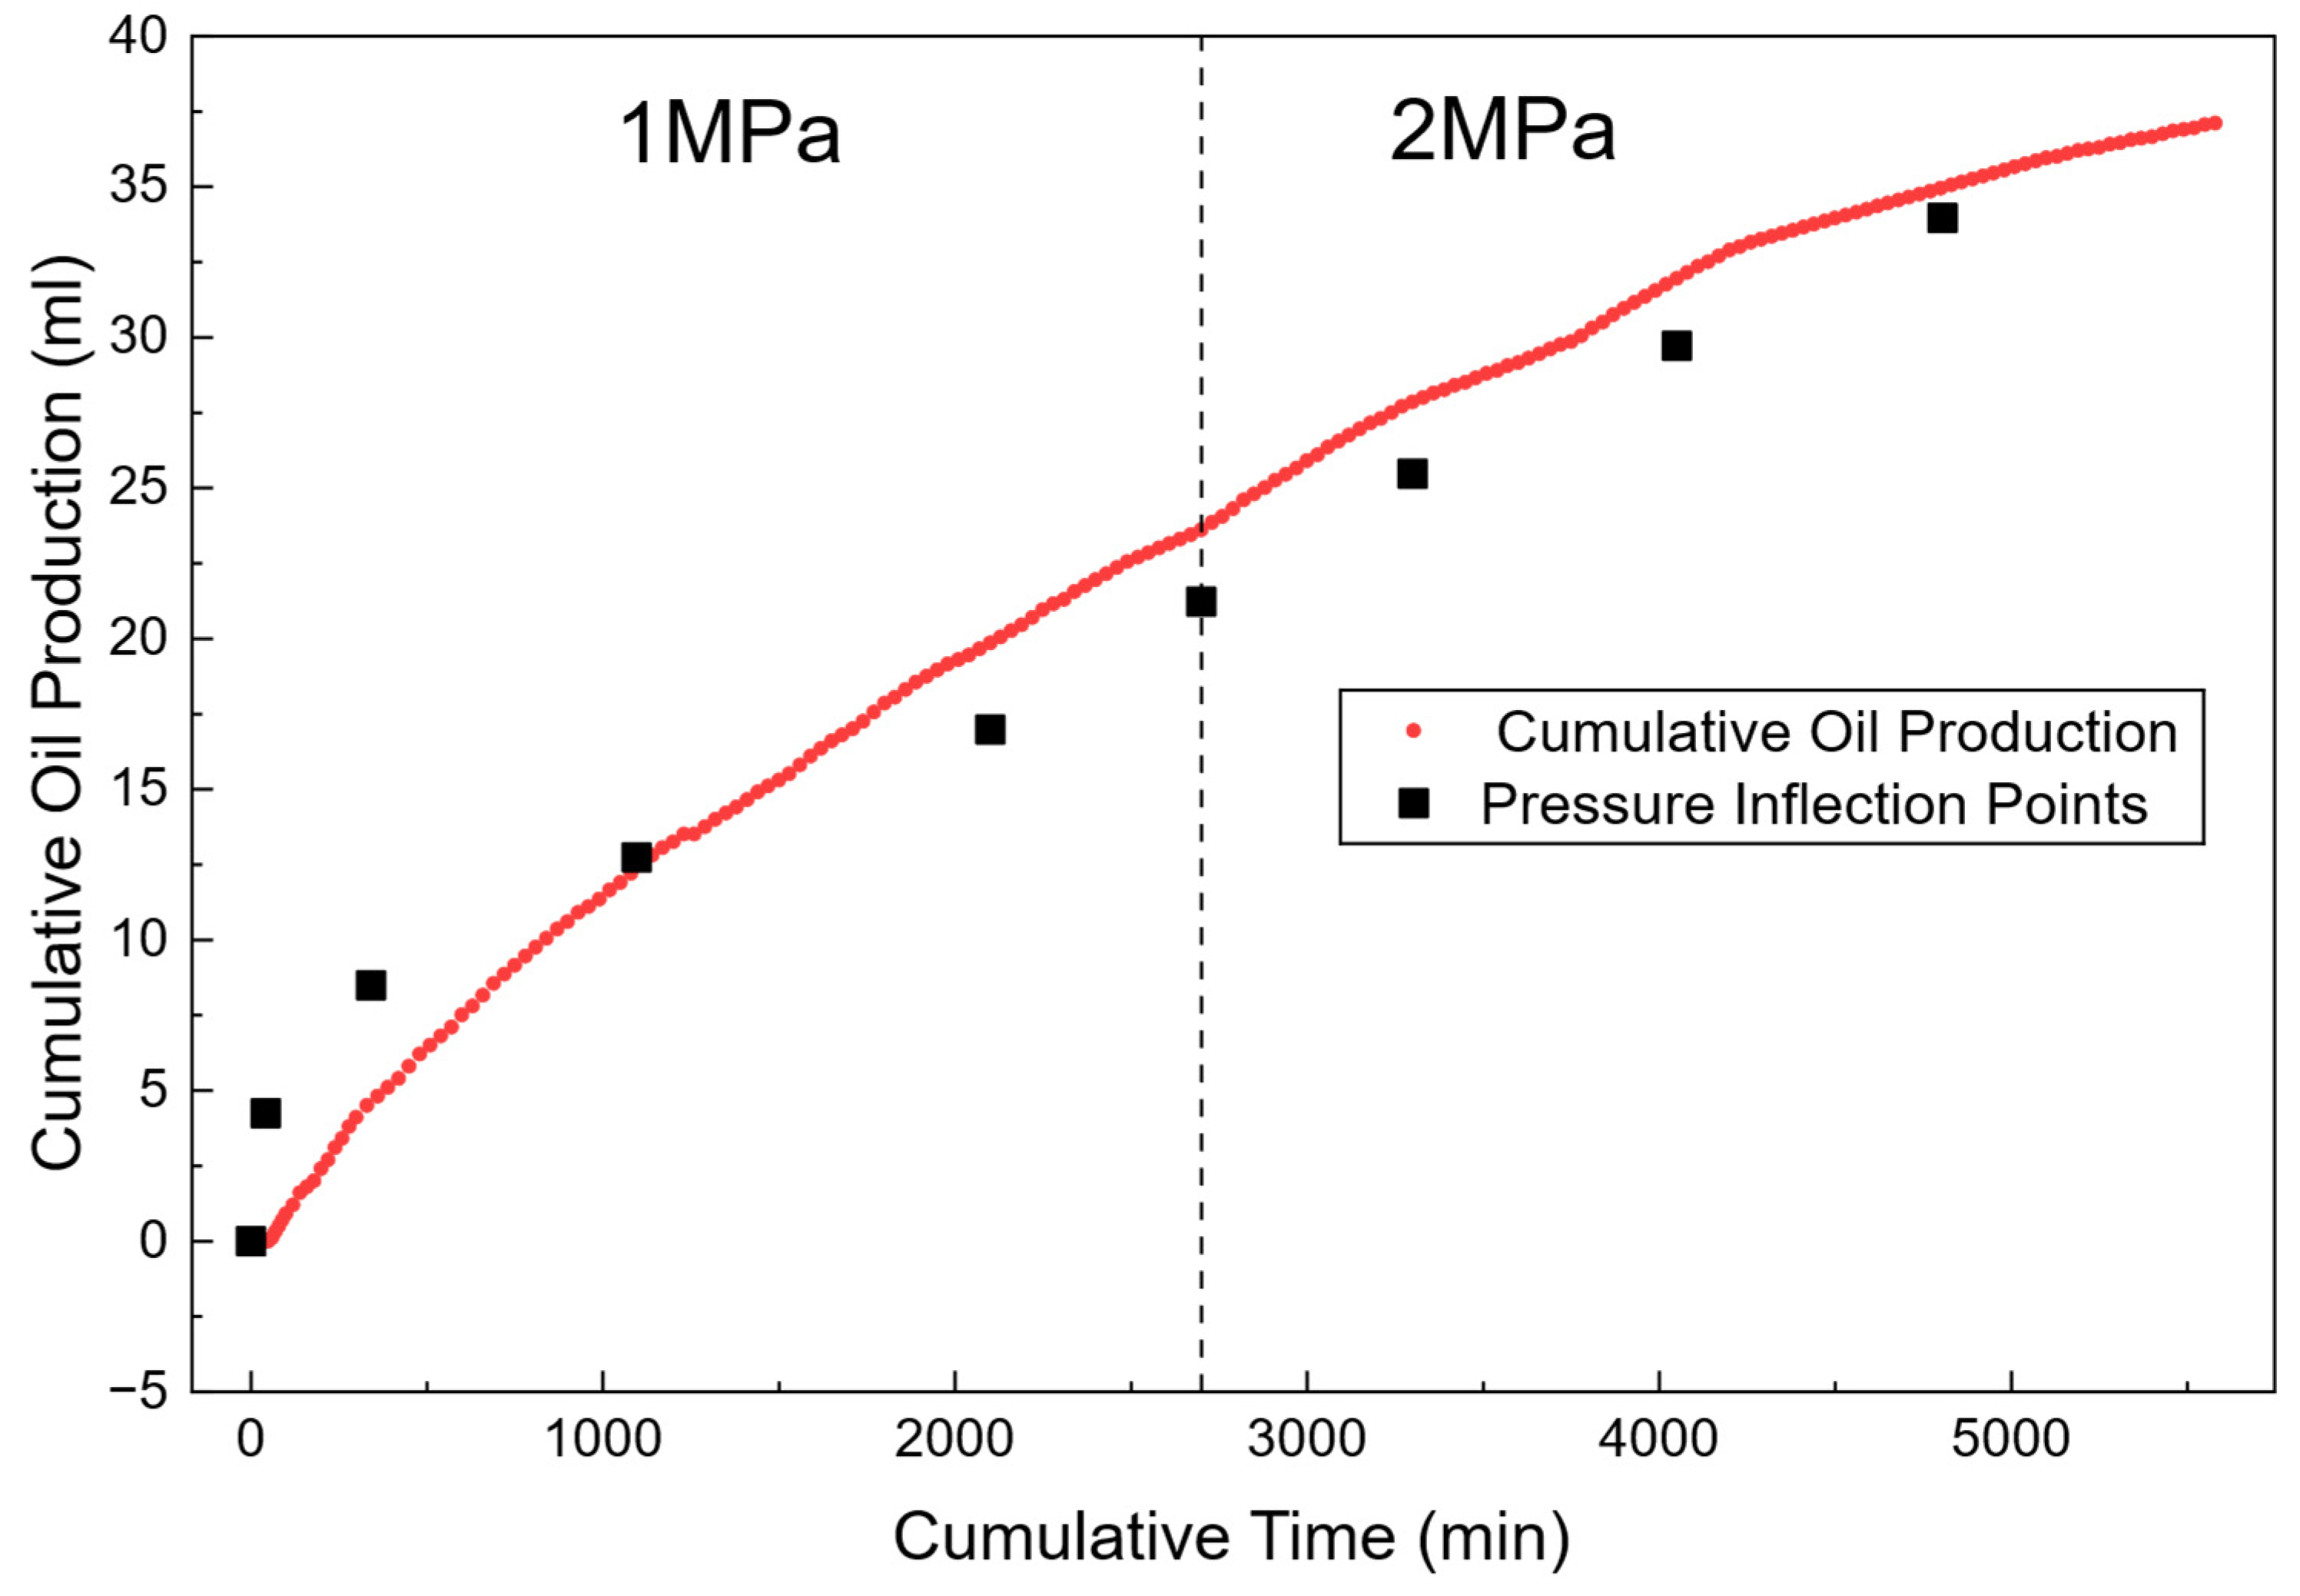
Figure 8 compares the produced fluid volumes calculated from pressure inflection points with the experimentally measured results. The inflection points observed in the pressure curves at different measurement points show good correspondence with the arrival time of the waterflood front. In addition, the cumulative oil production corresponding to these inflection times agrees well with the experimental measurements. These results indicate that the pressure variation characteristics are mainly controlled by the propagation of the waterflood front, rather than simply resulting from the gradual transition of the system from transient flow to steady-state flow. As the injected-water front propagates forward, the fluid distribution and flow resistance within the flow field change significantly, leading to redistribution of the local pressure gradient and the formation of distinct inflection points in the pressure response curves. Therefore, pressure inflection points can be regarded as important dynamic parameters characterizing waterflood front migration. Their physical essence reflects the migration behavior of the displacement interface and its influence on the seepage field. These findings further demonstrate that strong coupling exists between pressure-field evolution and saturation-front propagation during waterflood development, and that pressure variations can effectively characterize the advancement dynamics of the displacement front.
Figure 8.
Comparison between oil production calculated from pressure inflection points and measured oil production.
4. Numerical Simulation and Analysis
4.1. Model Development
To further investigate pressure propagation and oil–water two-phase transport during water flooding in tight sandstone long cores, a two-dimensional oil–water two-phase flow model was established based on the experimental study. The core was treated as a homogeneous and continuous porous medium. The oil and water phases were assumed to be immiscible and to obey Darcy’s law. Fluid compressibility was considered, whereas deformation of the rock skeleton was neglected. The microscopic effect of capillary pressure as a driving force for displacement was not considered. Because the gravitational effect was relatively small compared with the pressure gradient during the experiments, gravity was neglected in the model.
The mass conservation equations for the water and oil phases are given by:
where denotes the porosity, denotes the fluid density, denotes the phase saturation, denotes the Darcy velocity, and denotes the source/sink term.
The oil and water phases satisfy:
The Darcy velocities of the two phases are expressed as:
where denotes the absolute permeability, and denote the relative permeabilities of the water and oil phases, respectively, and and denote the fluid viscosities.
The compressibility of the fluids is described by the following equation:
When the pressure variation is relatively small, a linear approximation can be adopted:
The capillary pressure relationship between the oil and water phases is neglected:
Taking the partial derivative of y with respect to x gives:
Expanding the time-dependent term in Equation (3) gives:
Substituting Equations (6) and (13) into the above equation gives:
Similarly, Equation (4) can be rewritten as:
Substituting the capillary pressure relationship in Equation (12) and the saturation constraint in Equation (5) gives:
Combining the two equations gives:
The water saturation and pressure were selected as the dependent variables. Based on the established mathematical model for oil–water two-phase flow, numerical simulations were performed using COMSOL Multiphysics 6.4. The initial conditions, boundary conditions, and fluid and rock properties were specified according to the actual operating conditions of the long-core water-flooding experiments. The spatial distributions and temporal evolution of the pressure and water saturation fields within the core at different injection times were obtained through numerical simulation. The simulated pressure values at locations corresponding to the experimental pressure measurement points were then extracted to analyze the pressure response, pressure propagation, and their spatiotemporal evolution during water flooding. The simulation results were subsequently compared with the experimental results.
The basic input parameters used in the numerical simulation are listed in Table 3.
Table 3.
Input parameters for the numerical simulation.
To enable direct comparison with the actual pressure measurement points in the long-core water-flooding experiment, 13 equally spaced simulation probe points were established along the longitudinal direction of the core in the numerical model. All simulation probe points were located along the geometric centerline of the model. Their transverse coordinate was uniformly set to 1/2D, while their longitudinal coordinates were set to 0, L/12, 2L/12, 3L/12, …, 11L/12, and L, respectively. Therefore, the simulation probe points were spatially consistent with the 13 actual pressure measurement points in the experiment. These probe points were used to extract the pressure response at each location as a function of time and to further compare the experimental and numerical results.
4.2. Simulation Results of Pressure Response and Saturation-Field Evolution
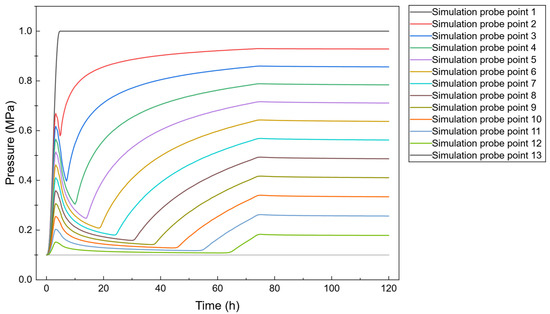
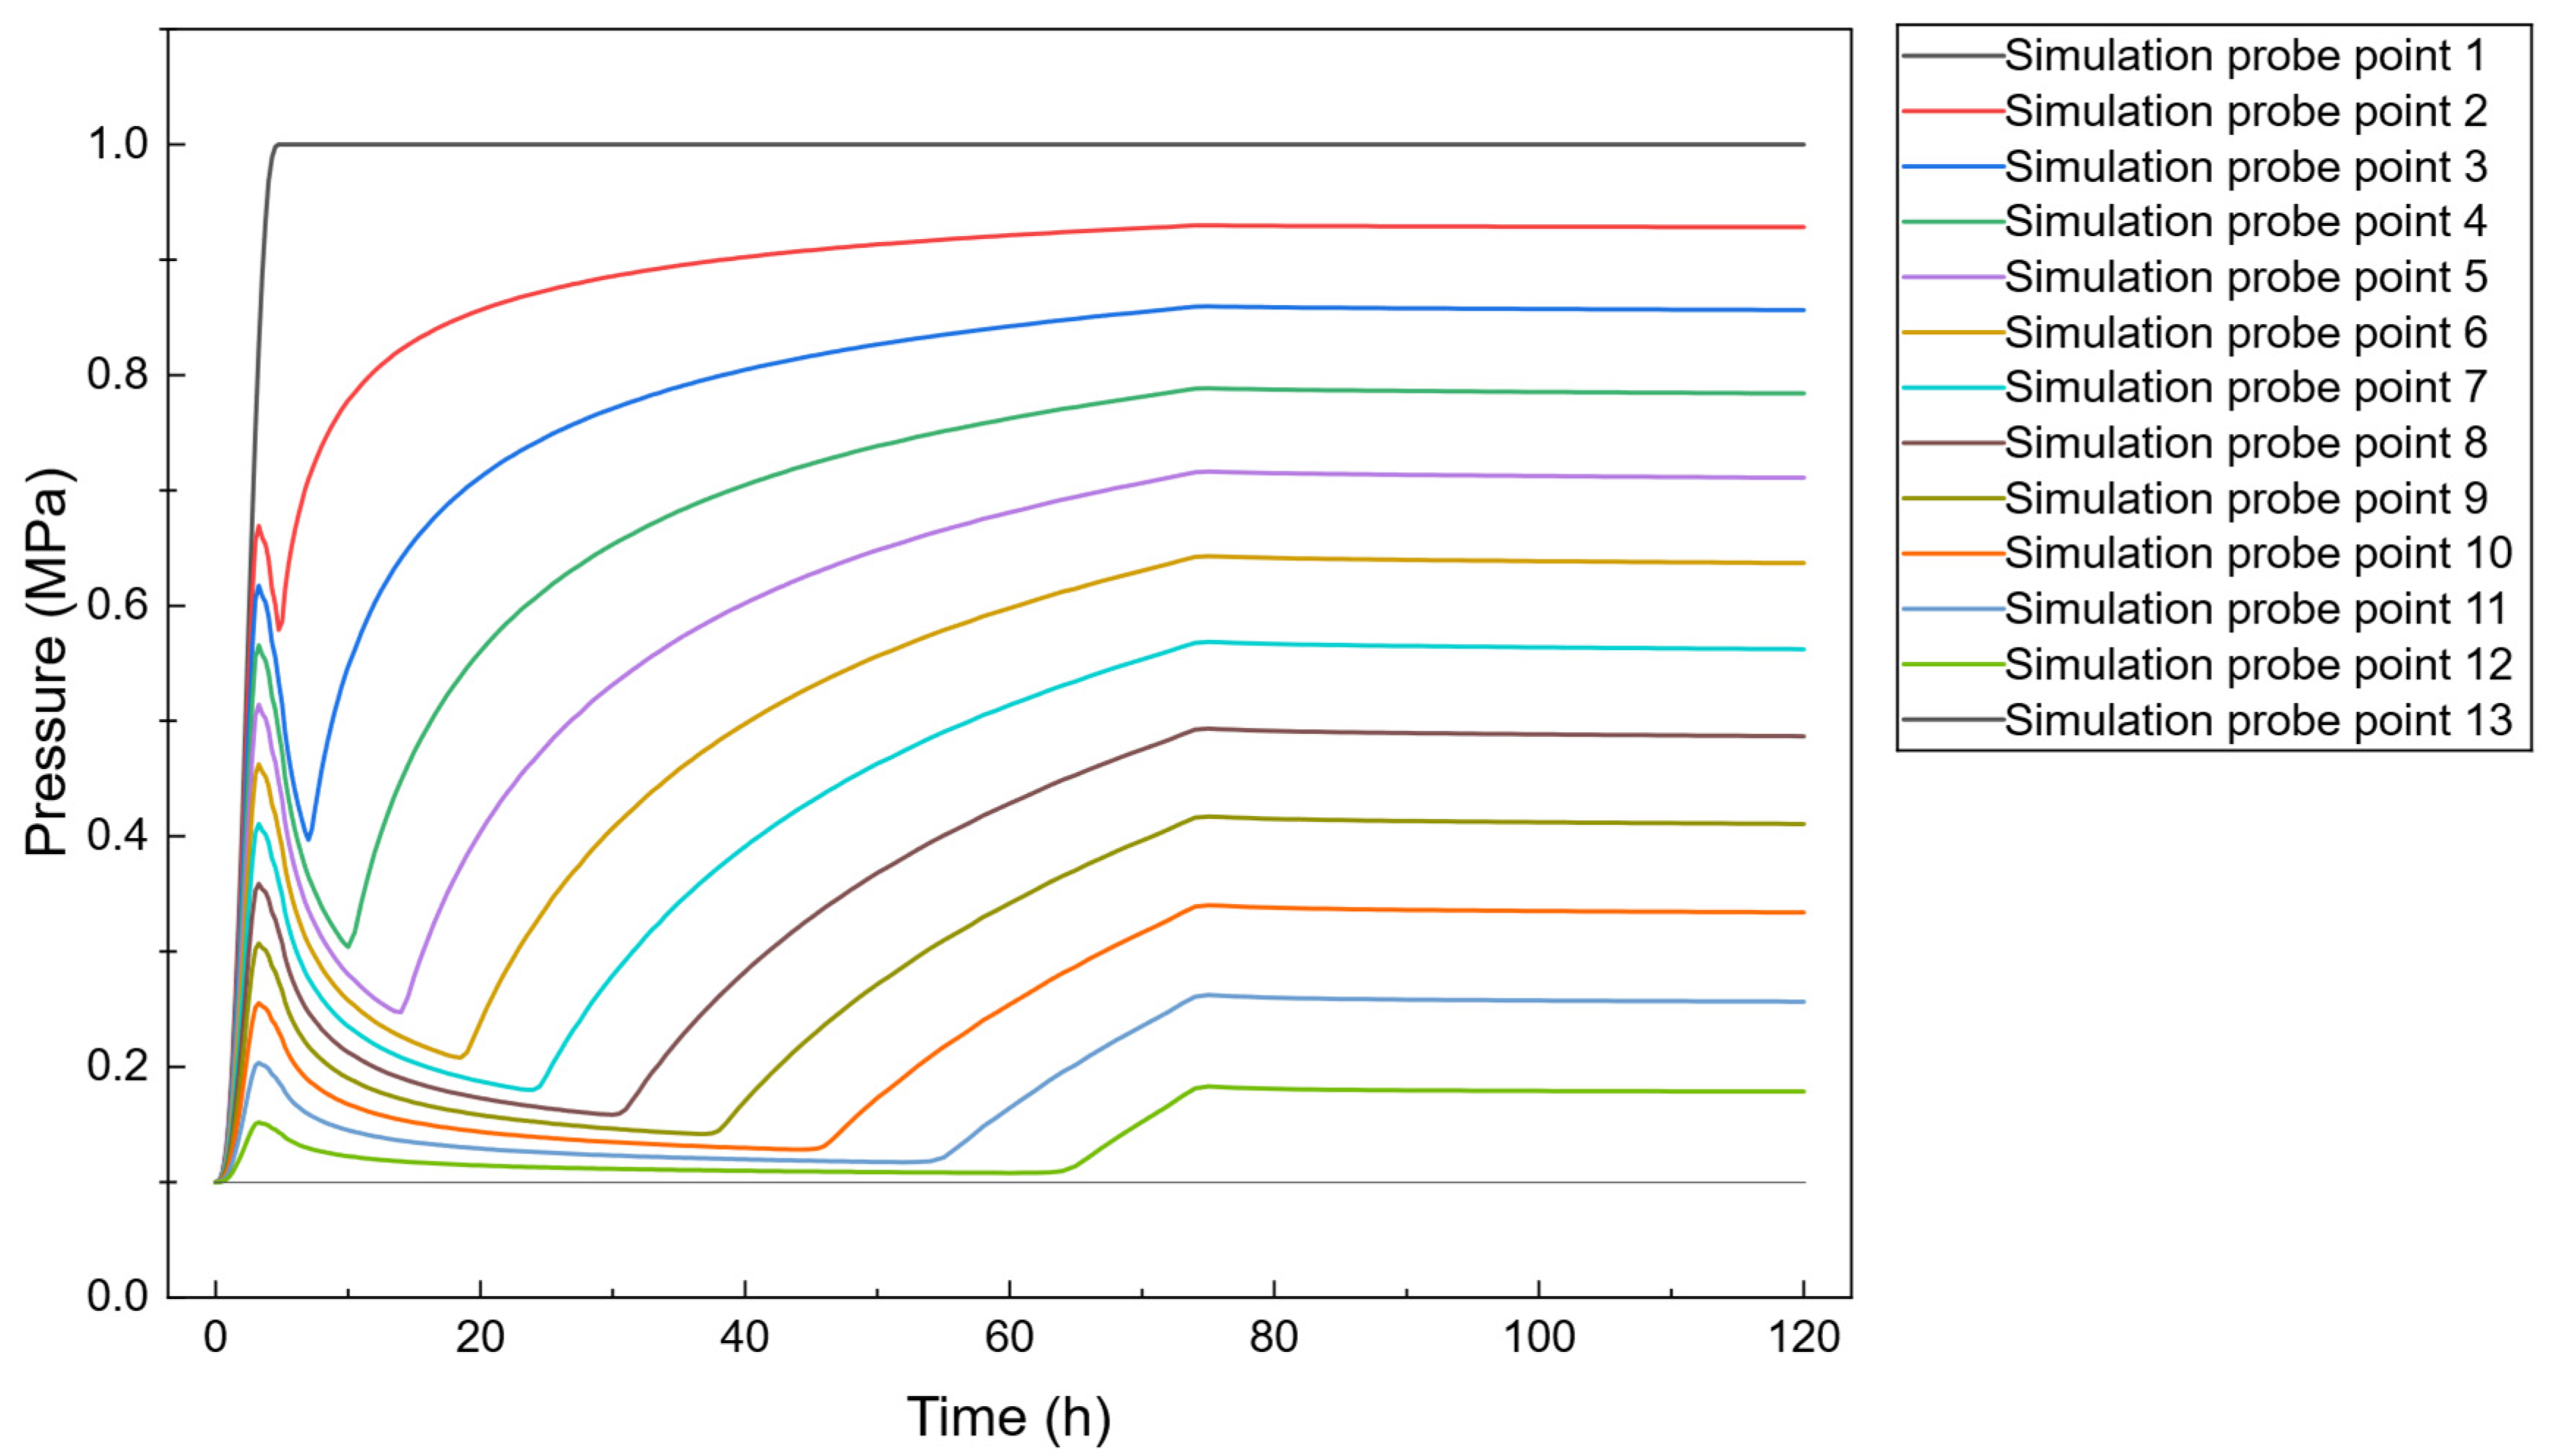
The simulation results show that, as the injected water continuously advances through the core, the pressure responses at the monitoring points exhibit a clear temporal correlation with the changes in local water saturation. Figure 9 presents the pressure variations with time at the 13 simulation probe points.
Figure 9.
Pressure evolution at the 13 simulation probe points.
Overall, the pressure responses at different monitoring locations exhibit relatively consistent stage-wise variation characteristics, although noticeable differences exist in the magnitude of pressure variation and the time at which the inflection points occur. As the injected water advances from the inlet toward the outlet, the pressure responses at the monitoring points change sequentially, indicating a pronounced spatial evolution of pressure propagation. The pressure at the monitoring points undergoes a characteristic sequence of “rapid increase–decrease–subsequent increase.” This variation is generally consistent with the pressure response observed experimentally.
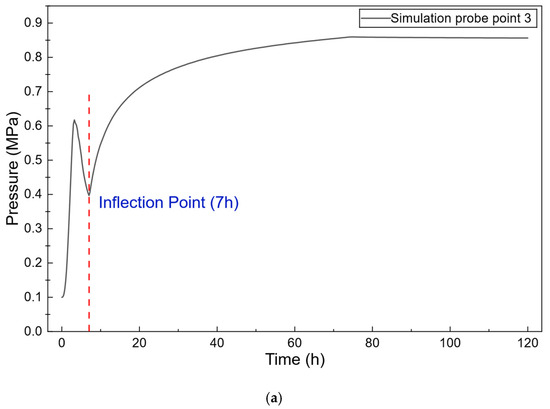
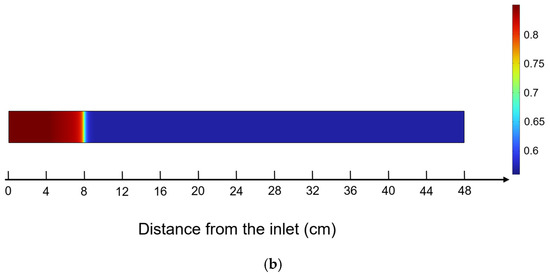
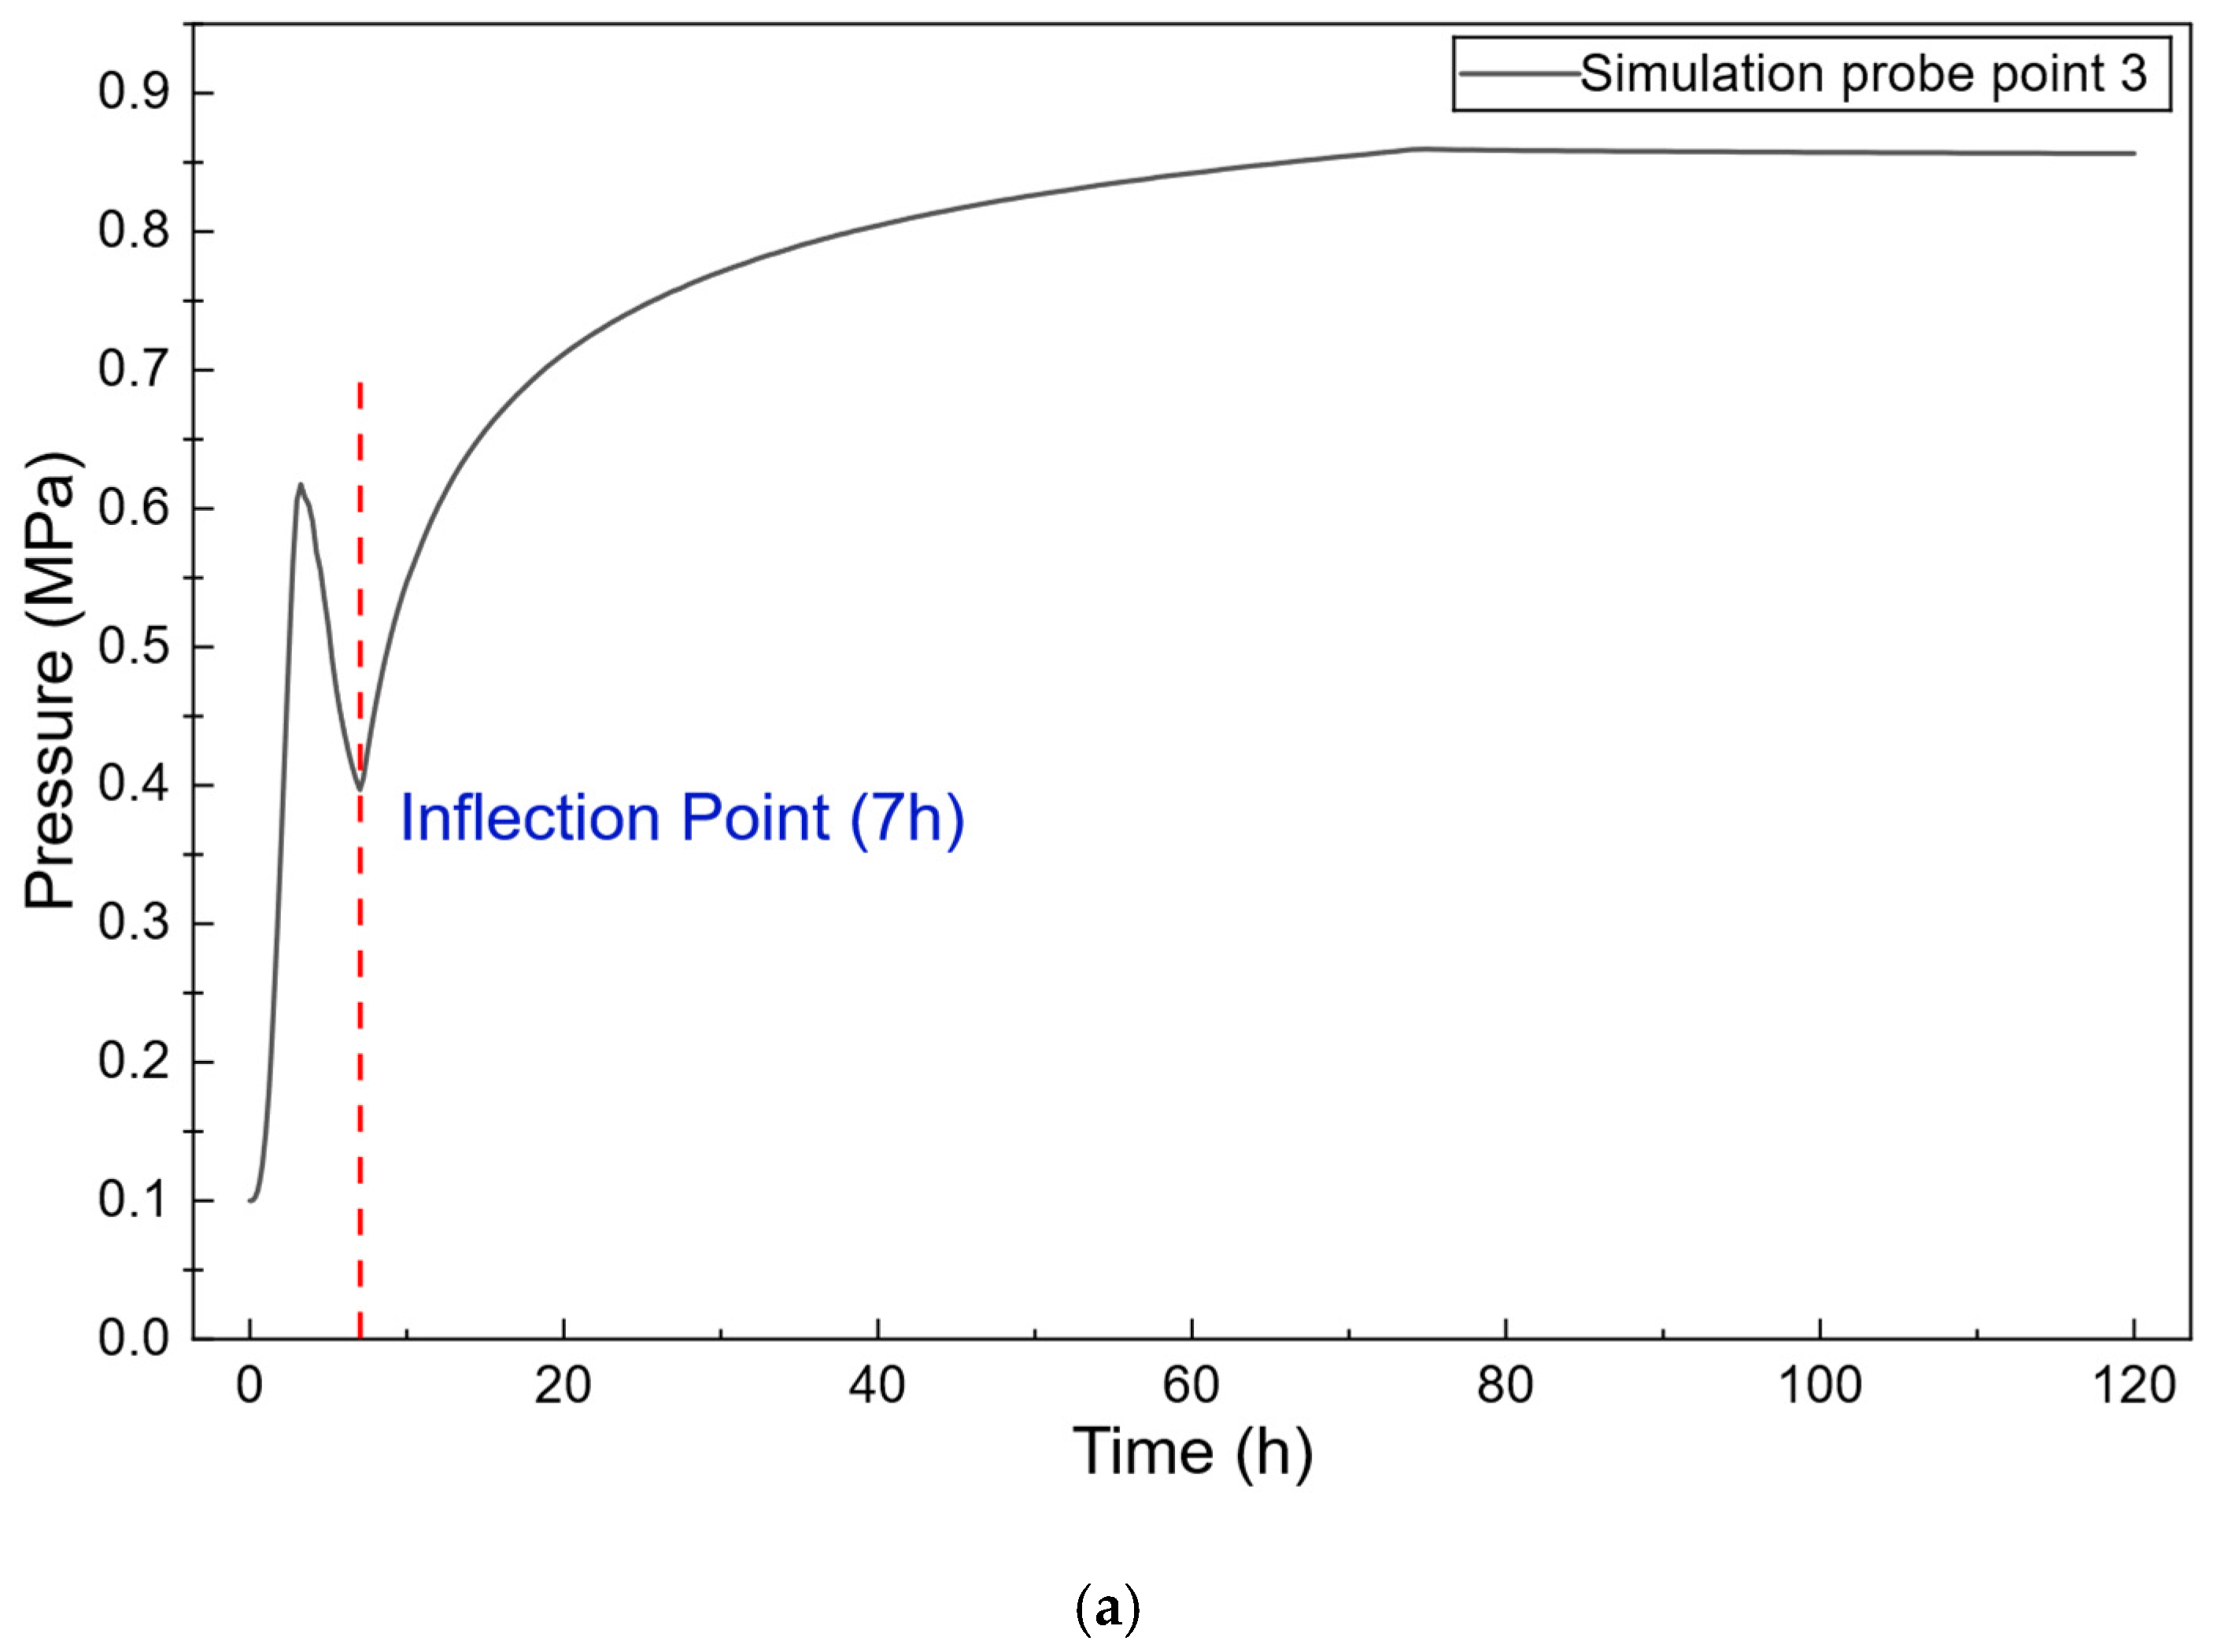
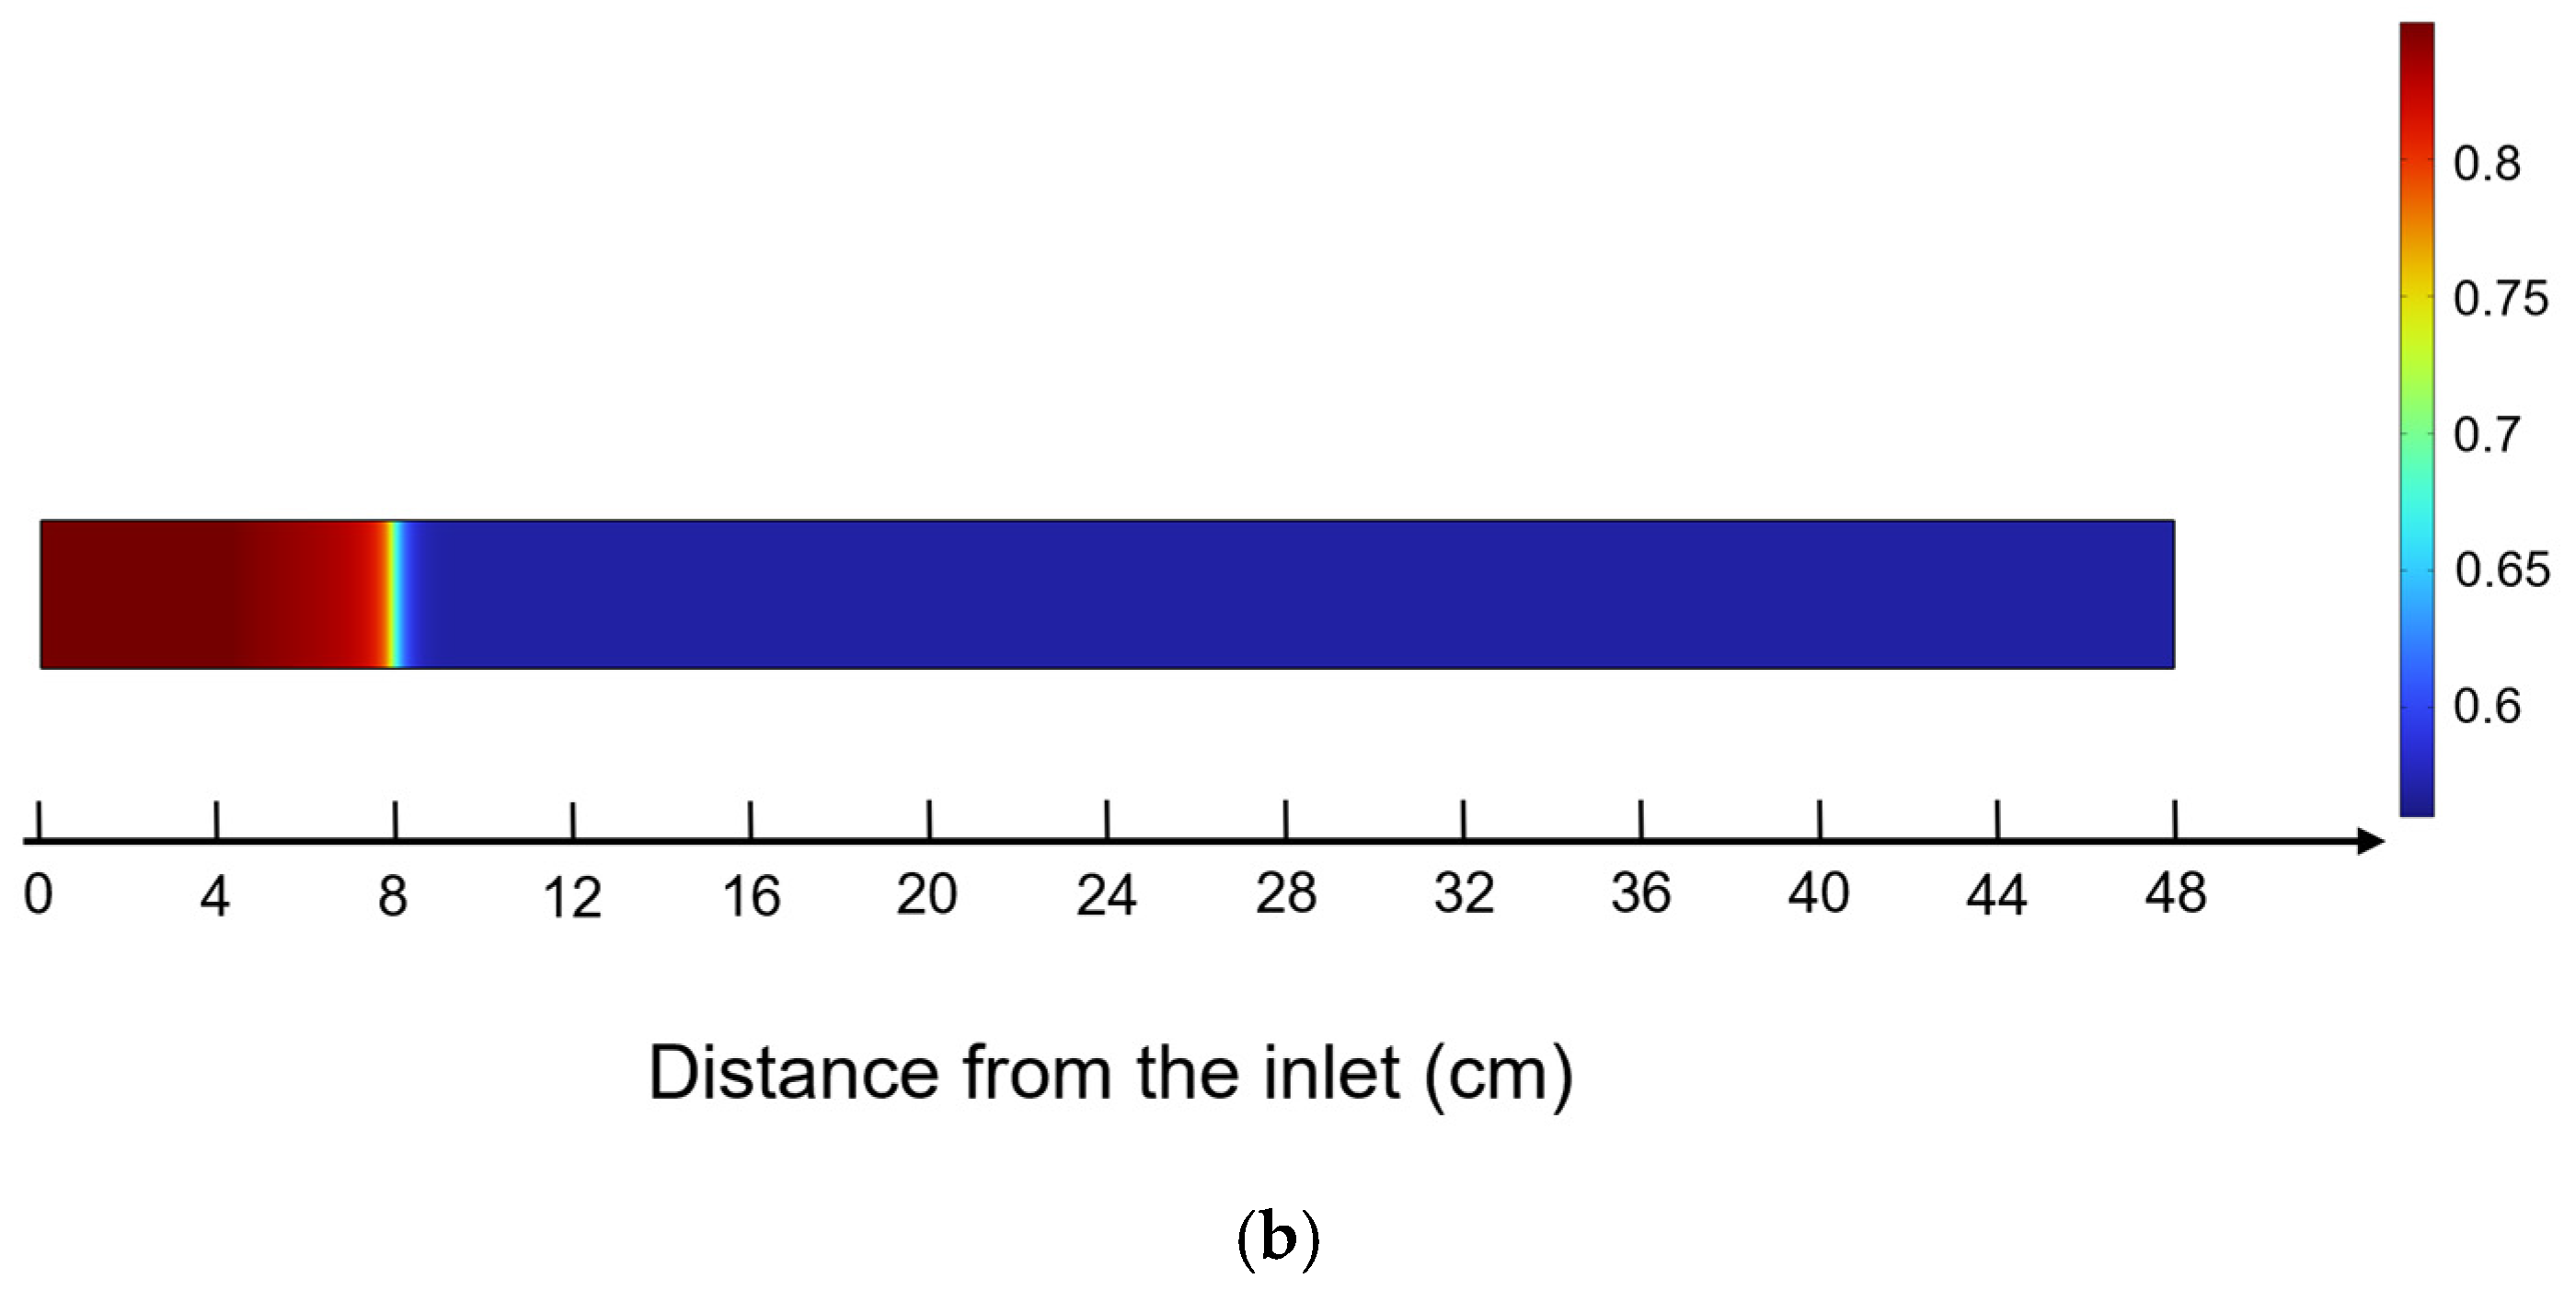
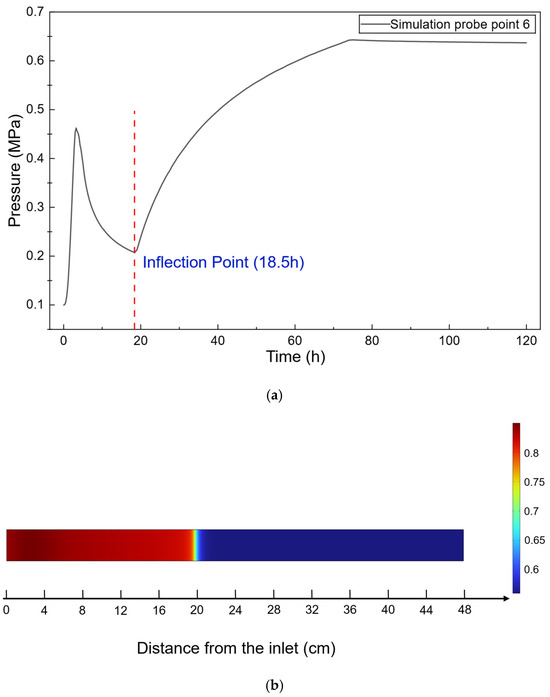
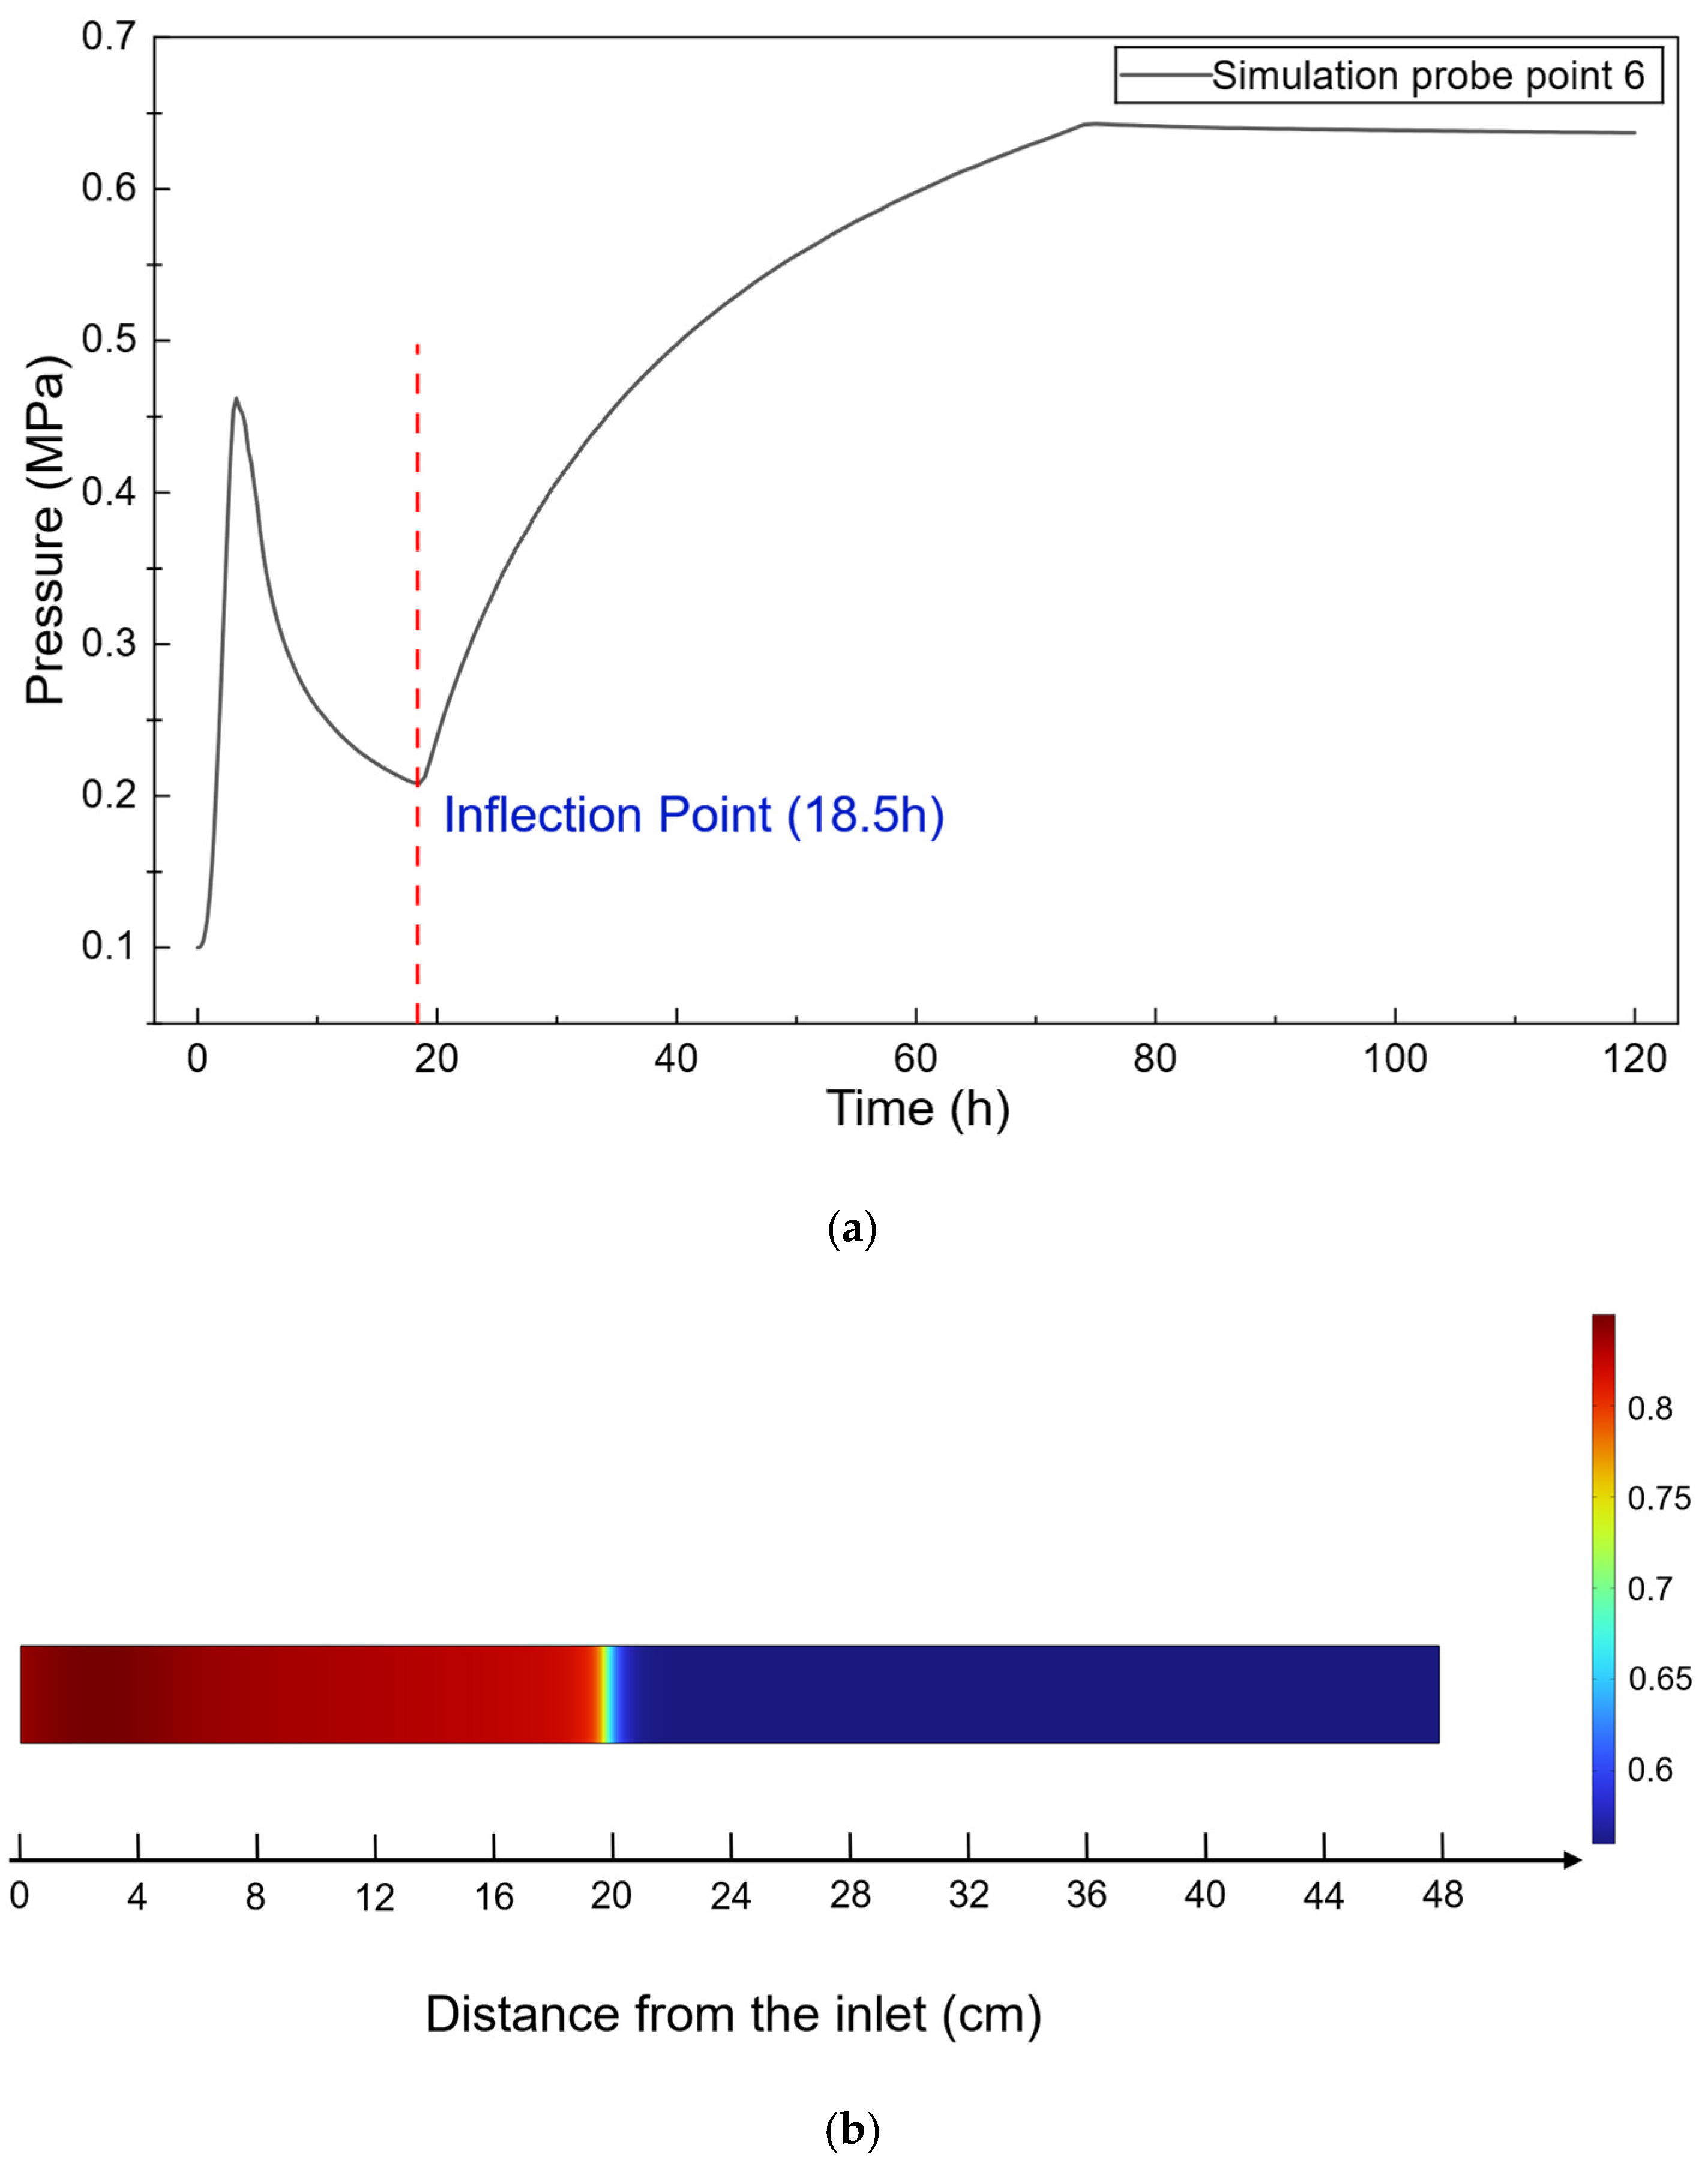
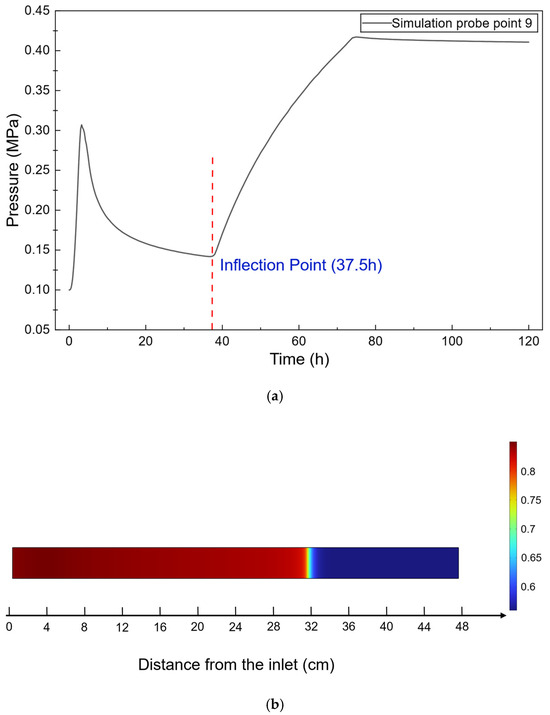
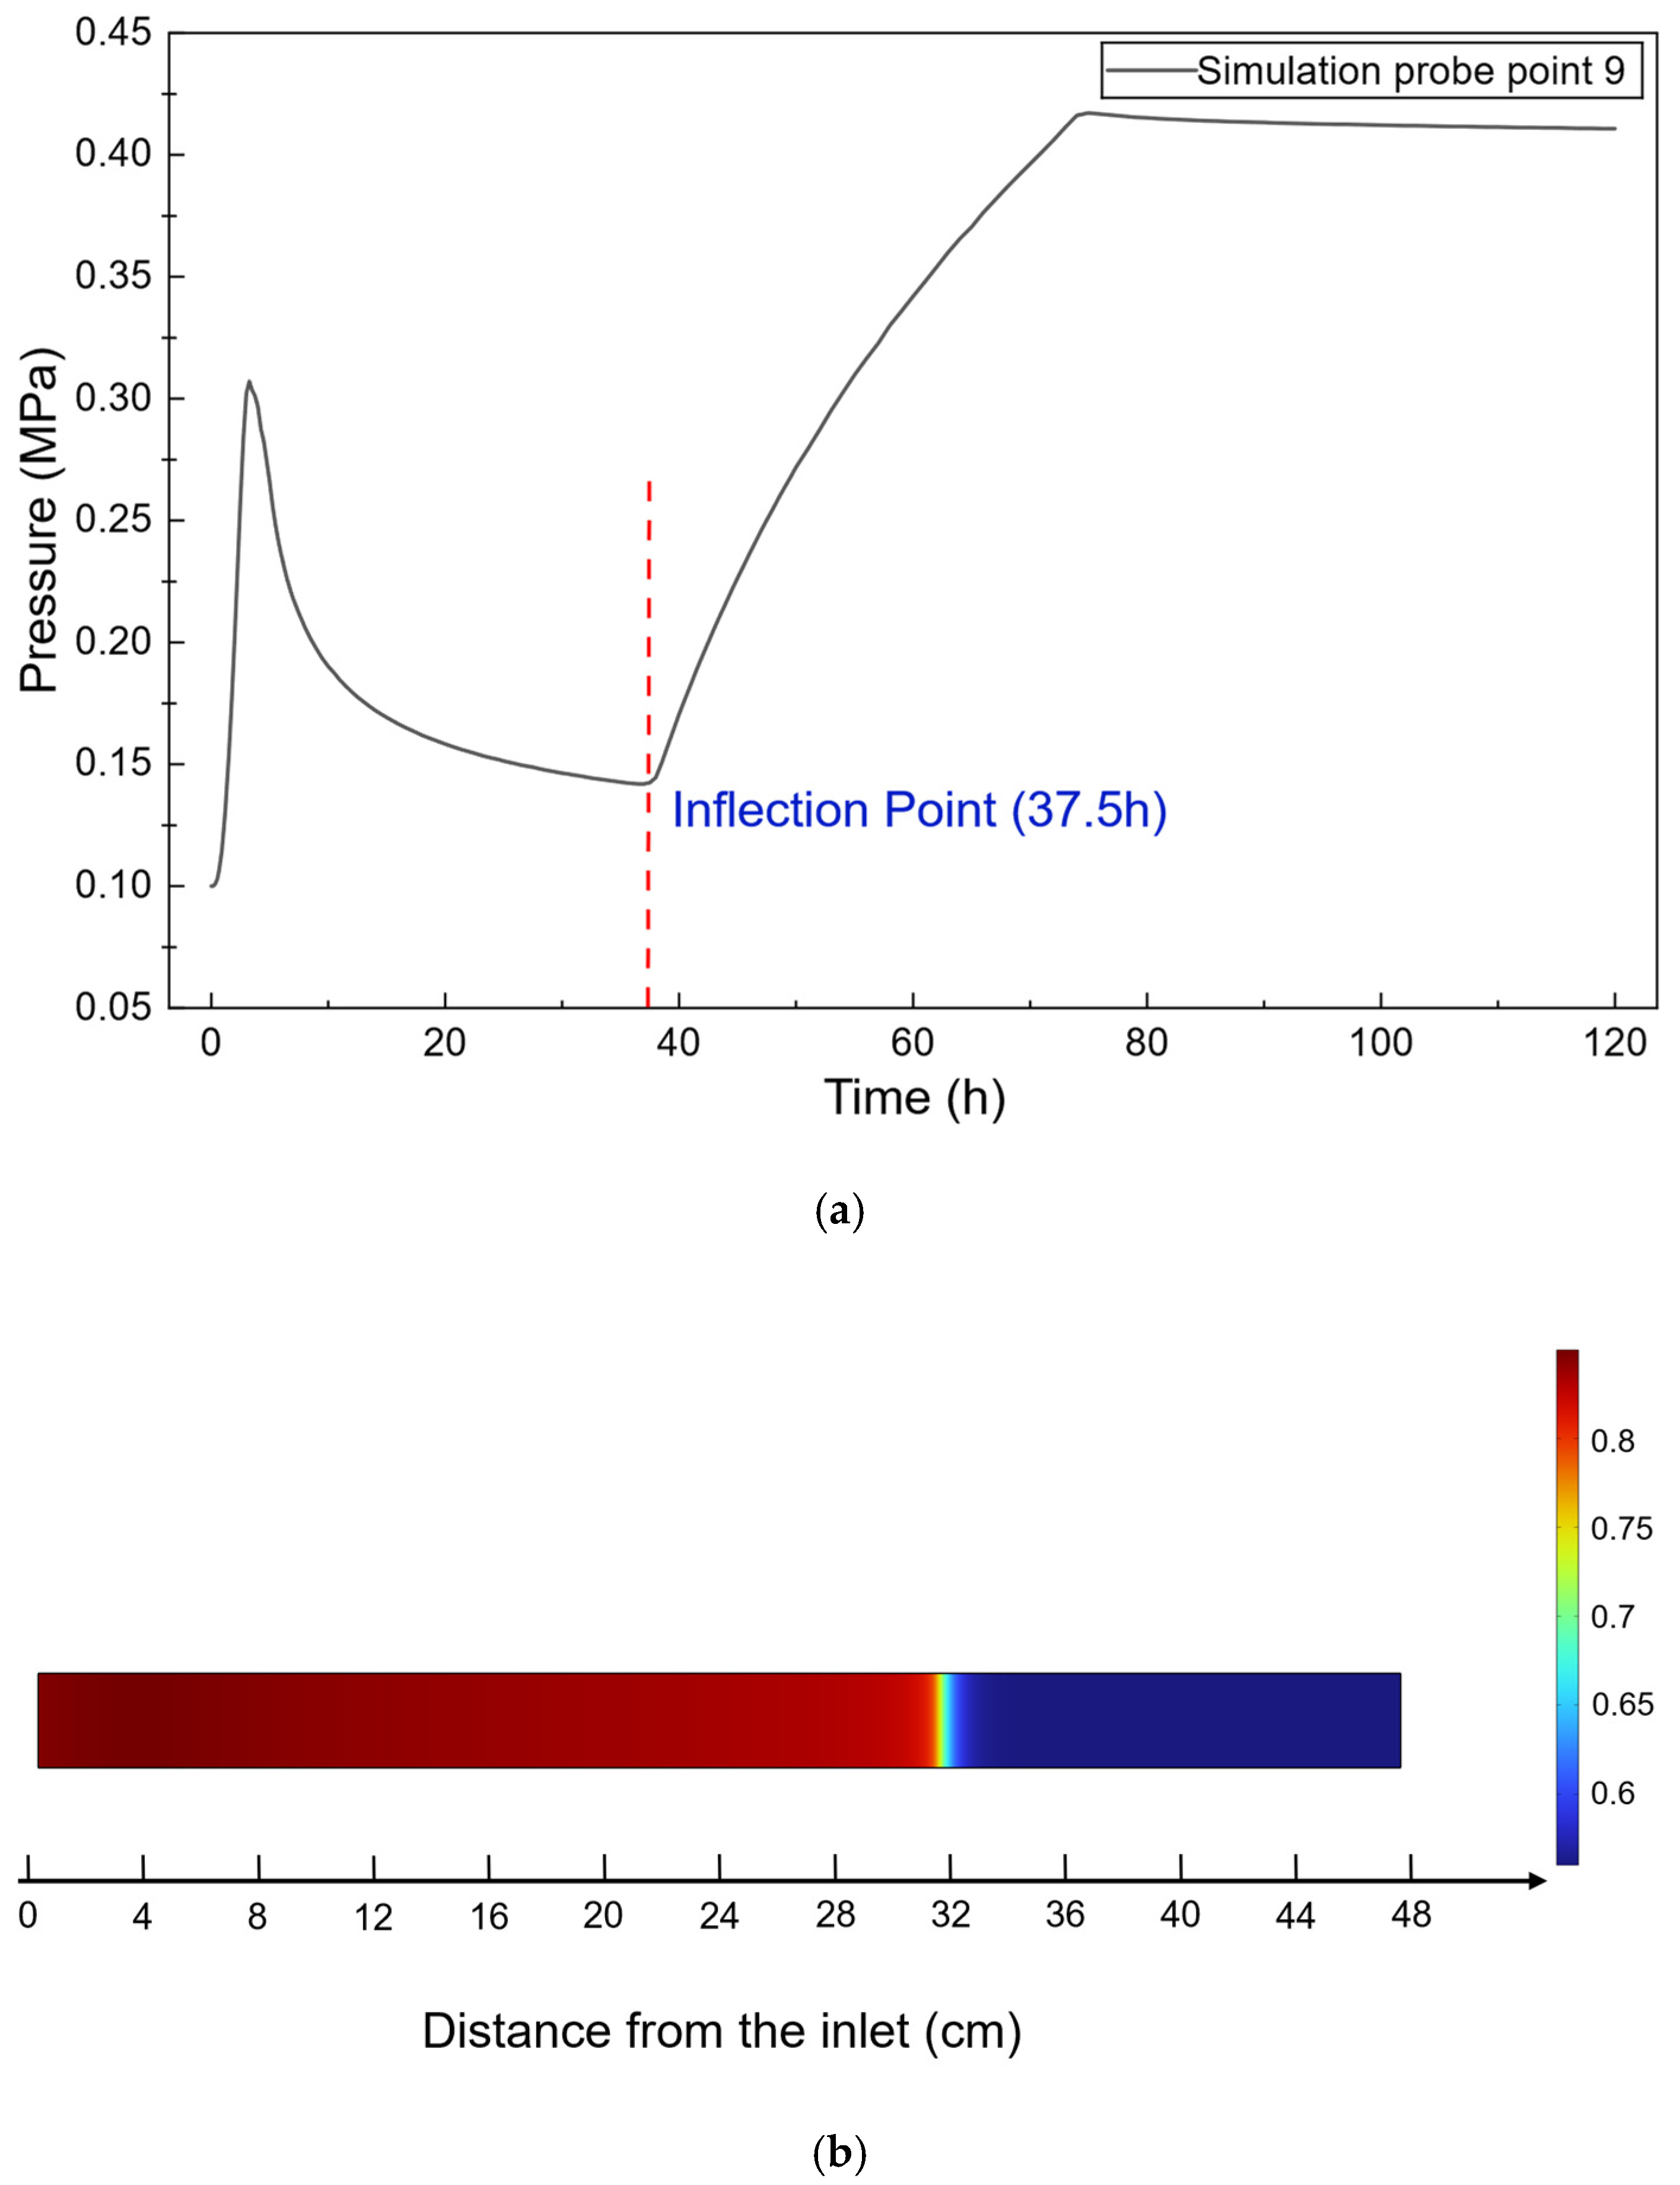
To further investigate the relationship between the pressure inflection points and the advancement of the water-flooding front, three representative simulation probe points, namely Points 3, 6, and 9, were selected for detailed analysis. Their pressure responses and the corresponding water saturation fields are presented in Figure 10, Figure 11 and Figure 12, respectively. The three monitoring points are located at different positions along the core and therefore provide a representative description of the spatial evolution of pressure responses as the water-flooding front advances from the upstream to the downstream region.
Figure 10.
Pressure response at Simulation Probe Point 3 and the corresponding water saturation field at the pressure inflection point: (a) Pressure evolution at Simulation Probe Point 3; (b) Corresponding water saturation field at 7 h.
Figure 11.
Pressure response at Simulation Probe Point 6 and the corresponding water saturation field at the pressure inflection point: (a) Pressure evolution at Simulation Probe Point 6; (b) Corresponding water saturation field at 18.5 h.
Figure 12.
Pressure response at Simulation Probe Point 9 and the corresponding water saturation field at the pressure inflection point: (a) Pressure evolution at Simulation Probe Point 9; (b) Corresponding water saturation field at 37.5 h.
As shown in Figure 10, the pressure at Point 3 exhibits distinct stage-wise characteristics over time. At the time corresponding to the inflection point in the pressure curve, the water saturation field indicates that the water-phase front has advanced to the vicinity of Point 3. At this stage, the water saturation in the vicinity of Point 3 begins to increase significantly, indicating that the water phase has started to affect the local two-phase flow state. As the water phase continues to advance downstream, the pressure response at Point 3 changes further. Therefore, the simulation results at Point 3 indicate a relatively good temporal correspondence between the inflection point in the pressure curve and the significant change in local water saturation.
Figure 11 further presents the pressure response at Point 6 and the corresponding water saturation field at the time of the pressure inflection point. Compared with Point 3, Point 6 is located farther downstream; consequently, the pressure inflection point occurs at a later time. When the pressure curve reaches its inflection point, the water-saturation front has advanced further downstream and reached the vicinity of Point 6. This result indicates that, as the water-flooding front continuously advances, the location of the transition in the pressure response also gradually moves downstream along the longitudinal direction of the core.
Figure 12 presents the pressure variation at Point 9 and the corresponding water saturation field at the time of the pressure inflection point. Because Point 9 is located farther from the injection end, the occurrence of its pressure inflection point is further delayed. At the corresponding time, the water saturation field shows that the water-phase front has advanced to the vicinity of Point 9. Comparison of Points 3, 6, and 9 shows that, as the monitoring location moves from upstream to downstream, the pressure inflection points occur sequentially. Meanwhile, the water-saturation front advances in the same direction, demonstrating a clear spatiotemporal correspondence between the two.
The above results indicate that pressure variation and water-saturation evolution are not independent of each other. During water flooding, when the water phase enters a region initially dominated by oil flow, the local water saturation changes. This change subsequently alters the relative permeabilities of the oil and water phases and the overall flow capacity, thereby affecting the local pressure gradient and pressure propagation. When the water-saturation front advances to the vicinity of a monitoring point, the local flow state undergoes a significant adjustment. Correspondingly, the pressure response gradually changes from a decreasing trend to an increasing trend, resulting in an inflection point in the pressure curve.
Therefore, based on the pressure curves and water saturation fields presented in Figure 9, Figure 10, Figure 11 and Figure 12, the occurrence of the pressure inflection point can be considered to have a relatively good temporal and spatial correspondence with the advancement of the water-saturation front to the vicinity of the corresponding monitoring location. his result provides numerical support for the use of pressure-curve inflection points as an indirect indicator of the advancement of the water-flooding front in the experiments.
It should be noted that some discrepancies remain between the numerical and experimental results in terms of the arrival time of the water-flooding front and the absolute pressure values. These discrepancies may be associated with the pronounced spatial heterogeneity of the actual tight sandstone long core. The actual core contains complex pore structures, local variations in permeability, and potential microfractures and preferential flow channels. In contrast, the numerical model requires a certain degree of homogenization of the core and uses macroscopic permeability, porosity, and two-phase flow parameters to provide an equivalent representation of the actual porous medium. In addition, local capillary effects, wettability, interfacial effects, and spatial variations in two-phase flow parameters during the experiments are difficult to fully characterize using a limited set of macroscopic parameters. Therefore, discrepancies between the simulated and experimental results in terms of specific pressure values and the arrival time of the water-flooding front are expected. For these reasons, the objective of this study is not to achieve complete agreement between the numerical and experimental results in terms of absolute pressure values and the arrival time of the water-flooding front. Instead, the focus is placed on pressure propagation, water-saturation evolution, and the relative variation patterns between them. Further investigation is required to clarify the underlying microscopic physical mechanisms.
5. Conclusions
This study investigated the pressure propagation and production characteristics during waterflooding in a tight sandstone long core through a combination of experimental and numerical approaches. The pressure responses at multiple locations along the core were analyzed together with the production behavior, and numerical simulation was used to further interpret the observed pressure evolution. The main conclusions are as follows:
(1) The productivity index exhibited a two-stage evolution, characterized by a rapid decline during the early stage followed by gradual stabilization at the later stage. This behavior indicates that the flow capacity of the tight sandstone core changed significantly during waterflooding and gradually approached a relatively stable state as the displacement progressed.
(2) The pressure responses at different locations exhibited distinct spatial and temporal characteristics. The pressure at the selected measurement points generally showed an evolution from an initial increase to a subsequent decrease and then a later increase. The pressure inflection characteristics appeared progressively along the displacement direction.
(3) The pressure inflection characteristics were closely associated with the propagation of the waterflooding front. The numerical simulation reproduced the overall pressure-evolution trend observed experimentally and showed that the pressure inflection occurred when the water-saturation field changed substantially near the corresponding monitoring location. This provides numerical evidence that pressure inflection can be used as an indirect indicator of waterflood-front propagation in tight sandstone cores.
Overall, the experimental and numerical results demonstrate that the pressure field provides important information on the dynamic propagation of waterflooding in tight sandstone. The results provide a potential approach for pressure-based monitoring of waterflooding in tight sandstone reservoirs. Multipoint pressure responses can provide indirect information on the propagation of waterflooding along the reservoir, particularly where direct measurements of in-situ water saturation are difficult. The identified pressure inflection characteristics may therefore complement conventional production and pressure data for evaluating the dynamic response of tight sandstone reservoirs during water injection. Although the present results are obtained from a laboratory-scale long-core system, they provide a basis for developing pressure-based monitoring and interpretation methods for field waterflooding operations.
Several limitations should also be acknowledged. The experiments mainly provide macroscopic pressure and production data and cannot directly resolve the evolution of oil–water interfaces or dispersed-phase structures at the pore scale. The stepwise increase in injection pressure changes the pressure gradient and flow conditions during the experiment, which increases the complexity of directly comparing different pressure stages. Estimating the waterflood front from cumulative production is a macroscopic approximation and cannot fully capture the effects of heterogeneity and nonlinear two-phase flow within tight sandstone. Future studies should combine pore-scale experimental techniques, such as micro-CT imaging and microfluidic visualization, with macroscopic experiments and numerical simulations to directly investigate the possible evolution of fluid interfaces and flow resistance during pressure propagation.
Author Contributions
Conceptualization, W.C. and X.L.; Methodology, X.L. and S.X.; Validation, G.L. and S.T.; Formal analysis, G.W. and J.S.; Investigation, S.T. and Z.L.; Writing—original draft, W.C.; Writing—review & editing, W.C., X.L. and S.X.; Visualization, W.C. and G.L.; Supervision, S.X.; Project administration, X.L.; Funding acquisition, X.L.; funding acquisition, X.L. All authors have read and agreed to the published version of the manuscript.
Funding
This research was funded by Fundamental Research on Multiphase Flow Mechanisms and Applications in Mature Oil and Gas Fields, grant number 2025DJ103. The APC was funded by the Research Institute of Petroleum Exploration and Development (RIPED).
Institutional Review Board Statement
Not applicable.
Informed Consent Statement
Not applicable.
Data Availability Statement
The raw data supporting the conclusions of this article will be made available by the authors on request.
Conflicts of Interest
Authors Weimin Chen, Xuewei Liu, Shengchun Xiong, Guozhong Liu, Guo Wang, Shu Tang, Jiale Shi and Zhengyong Luo were employed by Research Institute of Petroleum Exploration and Development, PetroChina. The authors declare that this study received funding from the Research Institute of Petroleum Exploration and Development. The funder was not involved in the study design, collection, analysis, interpretation of data, the writing of this article or the decision to submit it for publication.
Abbreviations
The following abbreviations are used in this manuscript:
| Core length | |
| Core width | |
| Porosity | |
| Absolute permeability | |
| Water density | |
| Water viscosity | |
| Water compressibility | |
| Oil density | |
| Oil viscosity | |
| Oil compressibility | |
| Water saturation | |
| Oil saturation | |
| Connate water saturation | |
| Residual oil saturation | |
| Relative permeability of the water phase | |
| Relative permeability of the oil phase | |
| Endpoint relative permeability of the water phase | |
| Endpoint relative permeability of the oil phase | |
| Corey exponent of the water phase | |
| Corey exponent of the oil phase |
References
- Jia, C.; Jiang, L.; Zhao, W. Tight Oil and Gas in Whole Petroleum System: Accumulation Mechanism, Enrichment Regularity, and Resource Prospect. Acta Pet. Sin. 2025, 46, 1–16,47. [Google Scholar] [CrossRef]
- Du, J.; Liu, H.; Ma, D.; Fu, J.; Wang, Y.; Zhou, T. Discussion on Effective Development Techniques for Continental Tight Oil in China. Pet. Explor. Dev. 2014, 41, 217–224. [Google Scholar] [CrossRef] [Scilit]
- Liu, Y.; Wang, F.; Wang, Y.; Li, B.; Yang, G.; Zhi, J.; Sun, S.; Wang, X.; Deng, Q.; Xu, H. The Mechanism of Hydraulic Fracturing Assisted Oil Displacement to Enhance Oil Recovery in Low and Medium Permeability Reservoirs. Pet. Explor. Dev. 2022, 49, 752–759. [Google Scholar] [CrossRef]
- Chen, Y.; Wei, J.; Hadavimoghaddam, F.; Zhou, X.; Ostadhassan, M.; Zhao, X.; Gayubov, A.; Li, J.; Wang, A.; Yang, Y.; et al. Experimental Study of Oil Recovery Mechanisms during Imbibition in Tight Sandstone with Different Fluid Displacing Agents under Ambient and Reservoir Pressure. J. Pet. Sci. Eng. 2023, 220, 111181. [Google Scholar] [CrossRef] [Scilit]
- Nelson, P.H. Pore-Throat Sizes in Sandstones, Tight Sandstones, and Shales. AAPG Bull. 2009, 93, 329–340. [Google Scholar] [CrossRef] [Scilit]
- Zhao, H.; Ning, Z.; Wang, Q.; Zhang, R.; Zhao, T.; Niu, T.; Zeng, Y. Petrophysical Characterization of Tight Oil Reservoirs Using Pressure-Controlled Porosimetry Combined with Rate-Controlled Porosimetry. Fuel 2015, 154, 233–242. [Google Scholar] [CrossRef] [Scilit]
- Zou, J.; Zhou, F.; Dong, M.; Zhang, H.; Han, X.; Wang, H. Change Law of Two-Phase Threshold Pressure Gradient in Tight-Low Permeability Reservoir. Sci. Technol. Eng. 2020, 20, 11562–11567. [Google Scholar] [CrossRef]
- Yang, Z.; Liu, X.; Li, H.; Lei, Q.; Luo, Y.; Wang, X. Analysis on the Influencing Factors of Imbibition and the Effect Evaluation of Imbibition in Tight Reservoirs. Pet. Explor. Dev. 2019, 46, 779–785. [Google Scholar] [CrossRef] [Scilit]
- Wang, F.; Zeng, F.; Zhao, J. A Mathematical Model of Displacement and Imbibition of Low-Permeability/Tight Reservoirs and Its Application. Acta Pet. Sin. 2020, 41, 1396–1405. [Google Scholar] [CrossRef]
- Li, Y.; Luo, H.; Li, H.; Liu, X.; Tan, Y.; Chen, S.; Cai, J. A Brief Review of Dynamic Capillarity Effect and Its Characteristics in Low Permeability and Tight Reservoirs. J. Pet. Sci. Eng. 2020, 189, 106959. [Google Scholar] [CrossRef] [Scilit]
- Tian, W.; Li, A.; Ren, X.; Josephine, Y. The Threshold Pressure Gradient Effect in the Tight Sandstone Gas Reservoirs with High Water Saturation. Fuel 2018, 226, 221–229. [Google Scholar] [CrossRef] [Scilit]
- Hao, F.; Cheng, L.S.; Hassan, O.; Hou, J.; Liu, C.Z.; Feng, J.D. Threshold Pressure Gradient in Ultra-Low Permeability Reservoirs. Pet. Sci. Technol. 2008, 26, 1024–1035. [Google Scholar] [CrossRef] [Scilit]
- Ye, W.; Wang, X.; Cao, C.; Yu, W. A Fractal Model for Threshold Pressure Gradient of Tight Oil Reservoirs. J. Pet. Sci. Eng. 2019, 179, 427–431. [Google Scholar] [CrossRef] [Scilit]
- Dong, M.; Yue, X.; Shi, X.; Ling, S.; Zhang, B.; Li, X. Effect of Dynamic Pseudo Threshold Pressure Gradient on Well Production Performance in Low-Permeability and Tight Oil Reservoirs. J. Pet. Sci. Eng. 2019, 173, 69–76. [Google Scholar] [CrossRef] [Scilit]
- Singh, K.; Jung, M.; Brinkmann, M.; Seemann, R. Capillary-Dominated Fluid Displacement in Porous Media. Annu. Rev. Fluid Mech. 2019, 51, 429–449. [Google Scholar] [CrossRef] [Scilit]
- Amiri, H.A.; Hamouda, A. Pore-Scale Modeling of Non-Isothermal Two Phase Flow in 2D Porous Media: Influences of Viscosity, Capillarity, Wettability and Heterogeneity. Int. J. Multiph. Flow 2014, 61, 14–27. [Google Scholar] [CrossRef] [Scilit]
- Cai, J.; Qin, X.; Xia, X.; Jiao, X.; Chen, H.; Wang, H.; Xia, Y. Numerical Modeling of Multiphase Flow in Porous Media Considering Micro- and Nanoscale Effects: A Comprehensive Review. Gas Sci. Eng. 2024, 131, 205441. [Google Scholar] [CrossRef] [Scilit]
- Jia, Z.; Cheng, L.; Zhou, J.; Cao, R.; Pu, B.; Jia, P.; Chen, M. Upscaling Simulation Method of Fluid Flow for Fracturing-Shut in-Flowback-Production Process in Tight Oil Reservoirs: Hysteresis Effects of Capillary Pressure and Relative Permeability. Geoenergy Sci. Eng. 2023, 226, 211792. [Google Scholar] [CrossRef] [Scilit]
- Mattax, C.C.; Kyte, J. Imbibition Oil Recovery from Fractured, Water-Drive Reservoir. Soc. Pet. Eng. J. 1962, 2, 177–184. [Google Scholar] [CrossRef] [Scilit]
- Guo, J.; Li, M.; Chen, C.; Tao, L.; Liu, Z.; Zhou, D. Experimental Investigation of Spontaneous Imbibition in Tight Sandstone Reservoirs. J. Pet. Sci. Eng. 2020, 193, 107395. [Google Scholar] [CrossRef] [Scilit]
- Ding, M.-C.; Xue, X.-F.; Wang, Y.-F.; Zhang, C.-H.; Qiu, S.-Z. Mobilization of Tight Oil by Spontaneous Imbibition of Surfactants. Pet. Sci. 2024, 21, 4176–4188. [Google Scholar] [CrossRef] [Scilit]
- Wu, D.; Lu, X.; Liu, Q.; Gao, J. Pressure Distribution in Flooding of Low Permeability Reservoirs. Mech. Eng. 2012, 34, 27–31,51. [Google Scholar] [CrossRef]
- Cheng, L.; Wang, D.; Cao, R.; Xia, R. The Influence of Hydraulic Fractures on Oil Recovery by Water Flooding Processes in Tight Oil Reservoirs: An Experimental and Numerical Approach. J. Pet. Sci. Eng. 2020, 185, 106572. [Google Scholar] [CrossRef] [Scilit]
- Zhou, X.; Wang, Y.; Zhang, L.; Zhang, K.; Jiang, Q.; Pu, H.; Wang, L.; Yuan, Q. Evaluation of Enhanced Oil Recovery Potential Using Gas/Water Flooding in a Tight Oil Reservoir. Fuel 2020, 272, 117706. [Google Scholar] [CrossRef] [Scilit]

Disclaimer/Publisher’s Note: The statements, opinions and data contained in all publications are solely those of the individual author(s) and contributor(s) and not of MDPI and/or the editor(s). MDPI and/or the editor(s) disclaim responsibility for any injury to people or property resulting from any ideas, methods, instructions or products referred to in the content. |
© 2026 by the authors. Licensee MDPI, Basel, Switzerland. This article is an open access article distributed under the terms and conditions of the Creative Commons Attribution (CC BY) license.