


Abstract
Automated quantity checking directly from two-dimensional bridge drawings remains challenging because the required information is distributed across structural views, detail drawings, and tables, while recognition errors may propagate into deterministic engineering calculations. This study proposes a knowledge-driven intelligent agent for automated quantity checking of concrete bridge structures. A task-specific dataset containing 1362 drawing images is constructed with region-level and parameter-level annotations. A two-stage YOLO method first locates functional regions and then detects parameter-related objects within cropped structural views. The agent coordinates detection, OCR, and table-parsing tools, associates recognized values with parameter types, spatial locations, and bridge components, and organizes them into a unified representation for deterministic rule execution. Human-in-the-loop verification is introduced before calculation to control error propagation. Compared with single-stage detection, the two-stage method increases mAP@0.5 from 0.769 to 0.908, mAP@0.5:0.95 from 0.471 to 0.656, and Recall from 0.664 to 0.792. After verification by bridge design professionals, parameter accuracy increases from 82.77% to 100%, and the overall mean concrete volume error decreases from 23.94% to 2.98%. The framework also produces lower concrete volume errors than three prompt-based large-model baselines across all six evaluated structural types. The methodological novelty lies in integrating region-to-parameter drawing perception, agent-orchestrated heterogeneous information organization, parameter-level human verification, and deterministic engineering rules into a controlled workflow for concrete quantity checking and reinforcement information consistency checking.
1. Introduction
Accurate quantity information underpins material planning, cost estimation, procurement, construction scheduling, and project cost control. In concrete bridge projects, the required information is commonly distributed across general arrangement drawings, cross-sectional and longitudinal views, reinforcement details, and quantity or bar schedules. Quantity takeoff calculates material quantities from the available design information, whereas quantity checking compares the calculated quantities with drawing-based or engineer-provided reference values to identify deviations. When two-dimensional drawings are used as the primary information source, engineers must manually locate parameters, establish their associations with bridge components, and perform repeated calculations, making the process time-consuming and dependent on drawing completeness and engineering experience [1]. Improving the automation and reliability of this process is therefore an important part of digital engineering design review [2].
Automated compliance checking provides a methodological foundation for computer-assisted engineering review by comparing design information with computable requirements derived from regulations, specifications, or predefined engineering rules [3,4]. Early systems relied mainly on manually encoded deterministic rules, while BIM and the Industry Foundation Classes standard enabled geometric, attribute, and spatial information to be represented in structured forms [5,6]. Subsequent studies used natural language processing, domain-specific tagging, ruleset expansion, and formal grammars to transform regulatory provisions into machine-readable rules [7,8,9,10]. Ontology- and knowledge-based approaches further supported semantic alignment between regulations and BIM information, multiscale code representation, and the integration of rule interpretation with checking execution [11,12,13].
Large language models have recently been introduced to automate regulatory interpretation and checking-workflow generation. Prompt-based methods can transform building-code clauses into structured regulatory information with limited manually annotated data [14], while the CODE-ACCORD corpus provides annotated regulatory entities and relations for data-driven rule generation [15]. LLM-based frameworks have also been connected with BIM environments for regulatory interpretation, design-information retrieval, and compliance checking [16,17]. To improve execution reliability, predefined atomic functions have been matched and composed instead of relying on unconstrained code generation [18]. ACC methods have subsequently been demonstrated in fire-safety checking [19], railway design [20], planning and building-code verification [21], graph-learning-based design review [22], and knowledge-graph-based regulatory checking [23]. These applications mainly evaluate explicit geometric, attribute, spatial, or regulatory conditions using structured design information.
In parallel, BIM-based quantity takeoff has progressed from defining modeling requirements for automatic quantity extraction [24] and extracting geometry and attributes from open-BIM models [25] to linking BIM objects with construction methods and quantity-related semantics [26]. Methods have also been developed to correct excess or missing quantities caused by incompletely modeled compound elements [27], incorporate standard methods of measurement and semantic auditing [28], and integrate quantity calculation with parameter-precision checking [29]. A recent review indicates that BIM-based quantity takeoff increasingly combines semantic enrichment, model-quality assessment, measurement rules, and result verification [1]. These methods generally assume that component geometry, attributes, and semantic relationships are available in a structured model. Direct extraction is appropriate when complete and rule-compatible model data are available. However, in archived or externally provided projects, native CAD or BIM models may be unavailable because of project confidentiality, data ownership, or delivery restrictions, whereas CAD-exported PDF drawings may remain accessible as formal project documents. The proposed workflow operates on drawing images converted from these PDF files and therefore does not require direct access to software-specific native design data. Differences in drawing conventions and layouts across design organizations may nevertheless affect recognition performance and require further validation.
For two-dimensional engineering drawings, previous studies have demonstrated the feasibility of detecting structural components for three-dimensional reconstruction [30], segmenting graphical components according to their connectivity and geometric relationships [31], recognizing specific objects and annotations [32], and detecting textual information in architectural floor plans [33]. However, these studies generally focus on particular element categories or individual recognition tasks. Limited attention has been paid to the comprehensive localization of heterogeneous parameter-related objects across complete bridge drawings, where multiple structural views, detail drawings, tables, design notes, and densely distributed dimension annotations coexist. Because complete drawings are typically high-resolution and parameter-related objects occupy only small local regions, directly resizing an entire drawing to meet model-input requirements may obscure dimension annotations and other local details, while unrelated drawing regions may introduce additional interference. A task-specific dataset that supports both functional-region localization and fine-grained parameter detection is therefore required for drawing-based quantity checking.
Accordingly, three related methodological gaps remain. First, existing drawing-recognition methods do not provide a hierarchical perception mechanism for locating relevant functional regions in complete bridge drawings and subsequently detecting fine-grained parameter-related objects within those regions. Second, independently detected objects, recognized numerical values, spatial locations, and component information cannot be used directly by quantity calculation rules without parameter association, normalization, and structured organization. Third, errors in object detection, numerical recognition, or parameter association may propagate directly through deterministic engineering rules and produce substantial quantity deviations. The resulting scientific and practical problem is how to comprehensively extract heterogeneous parameter information from complex two-dimensional bridge drawings, organize it into reliable and rule-compatible structured parameters, and control the propagation of recognition errors before deterministic quantity calculation.
To address these gaps, this study undertakes three related research tasks. First, a task-specific bridge drawing dataset is constructed using Stage-I functional-region annotations and Stage-II parameter-level annotations, and a two-stage YOLO-based detection method is developed. The first stage locates relevant regions in the complete drawing, while the second stage detects fine-grained parameter-related objects within cropped structural views, thereby preserving local details and reducing interference from unrelated drawing content. Second, a knowledge-driven intelligent agent is developed to coordinate region detection, parameter detection, OCR, and table parsing; associate recognized values with parameter types, spatial locations, and bridge components; and organize the heterogeneous outputs into a unified, rule-compatible representation for deterministic calculation. Third, a human-in-the-loop parameter verification mechanism is introduced at the interface between parameter organization and rule execution to prevent erroneous or missing parameters from being transferred directly to quantity results. Together, these tasks establish an integrated workflow for concrete quantity checking and reinforcement information consistency checking directly from two-dimensional bridge drawings.
2. Equipment and Methods
2.1. Overall Framework
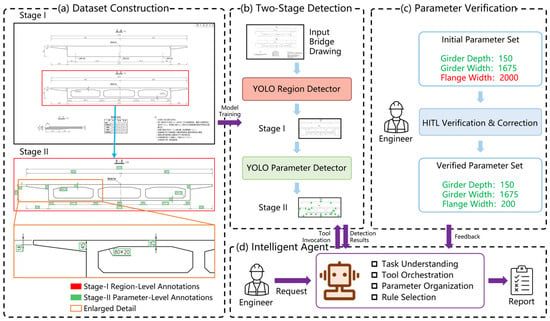
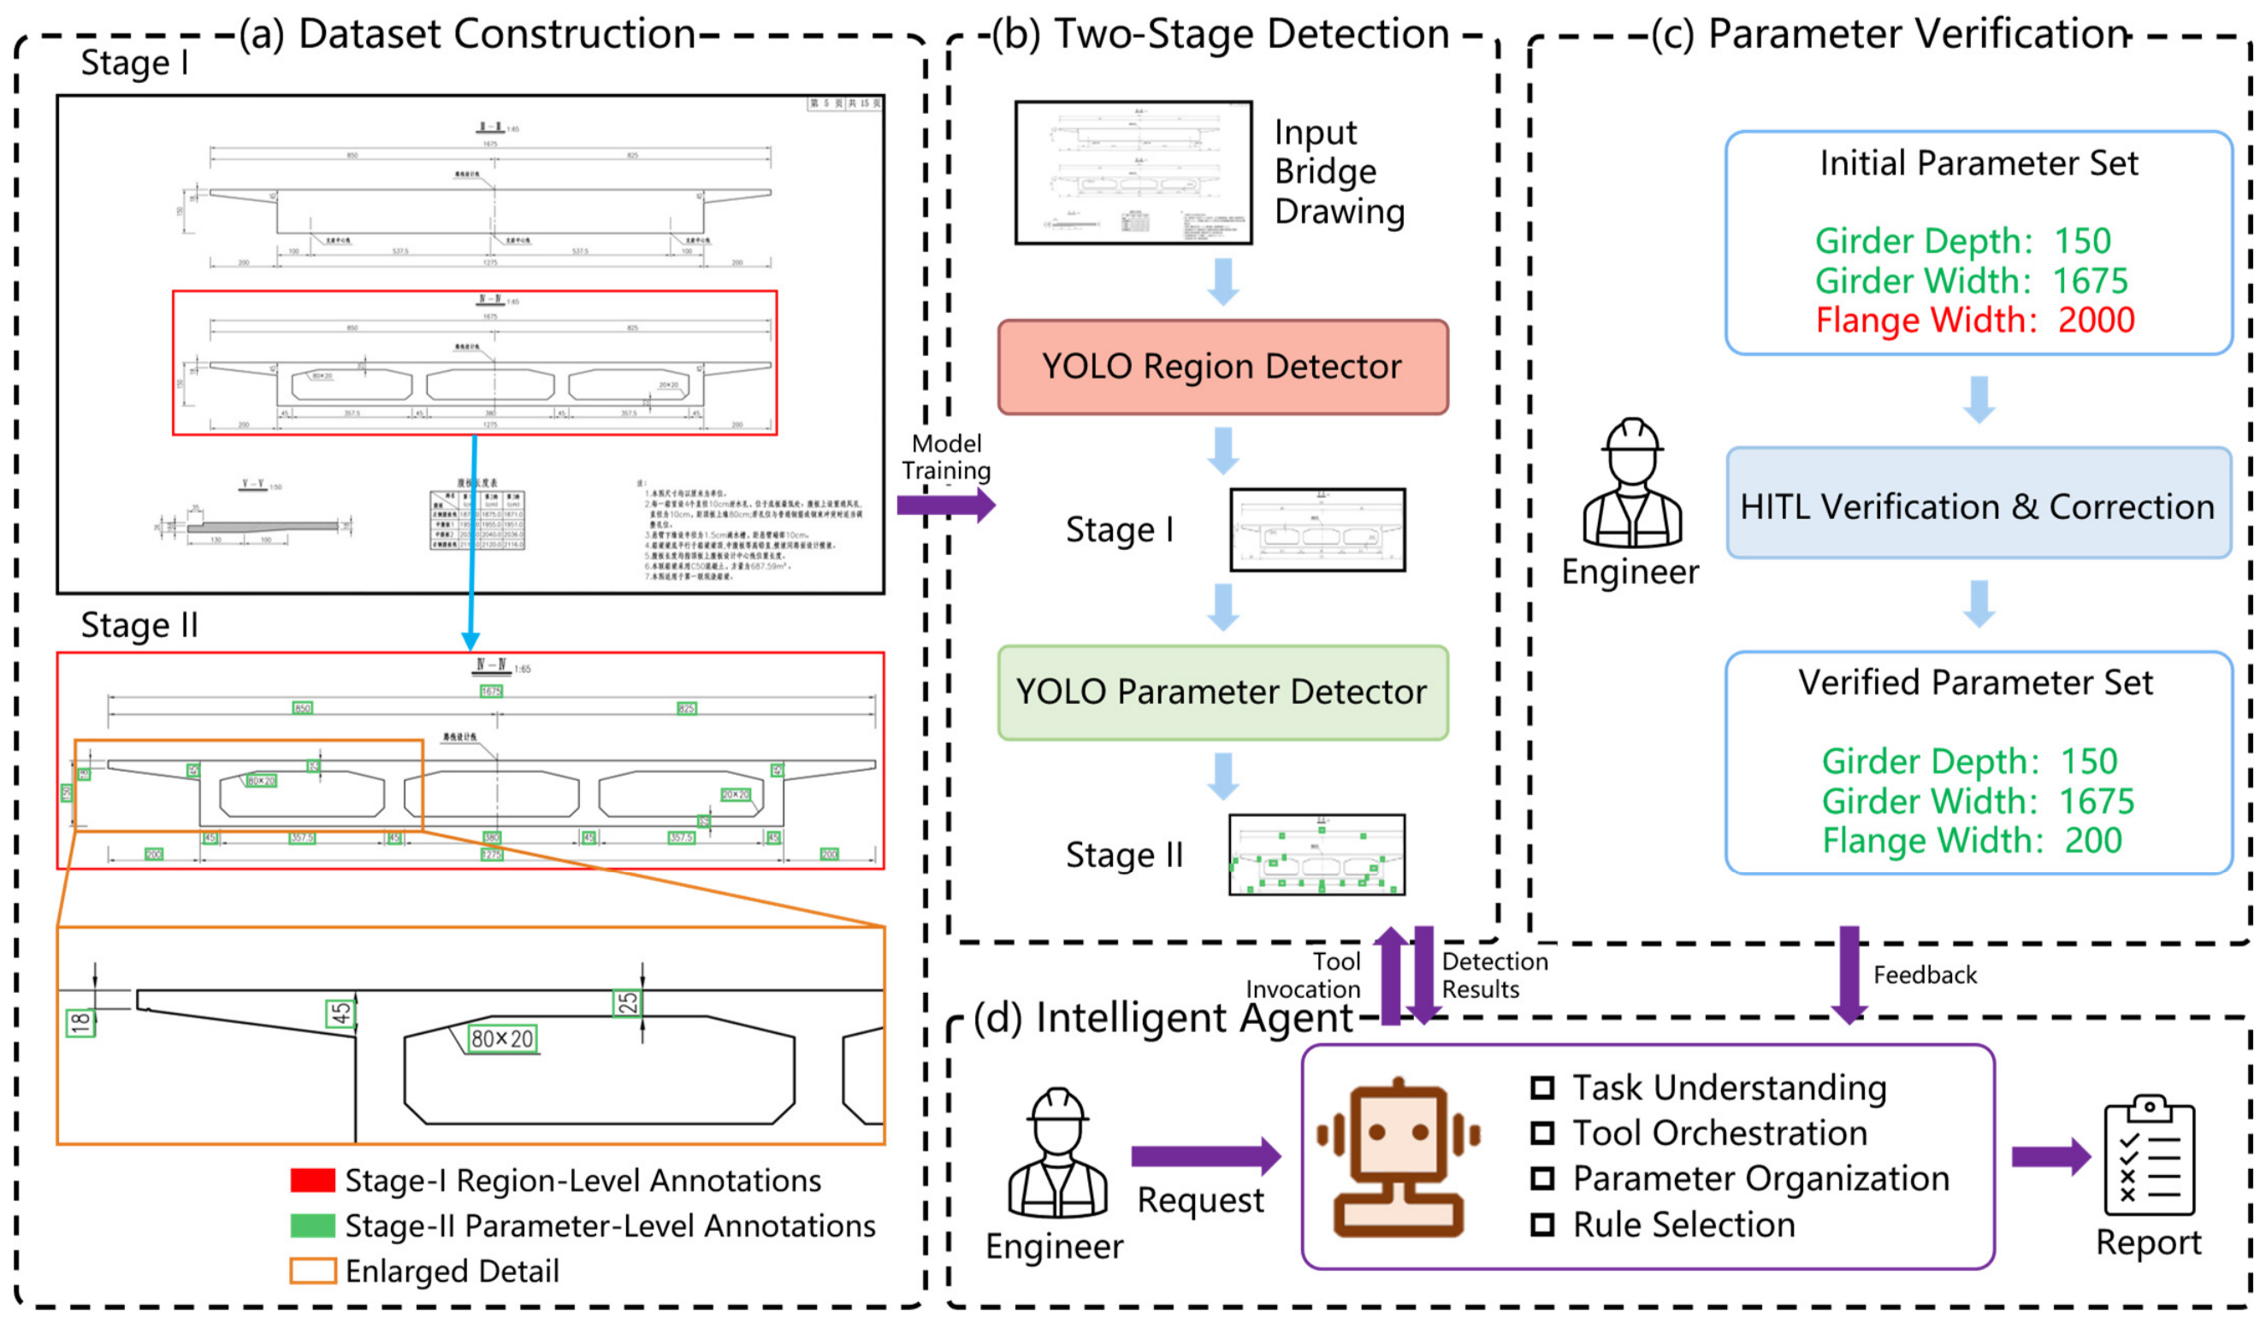
Figure 1 illustrates the overall framework of the proposed knowledge-driven intelligent agent for automated quantity checking of concrete bridge structures. The framework consists of an offline preparation stage and an online quantity-checking stage. The offline stage focuses on bridge drawing dataset construction and two-stage detector training, whereas the online stage integrates drawing detection, engineering parameter organization, human-in-the-loop verification, rule selection, and quantity-checking result generation.
Figure 1.
Overall architecture of the proposed framework for automated quantity checking using a knowledge-driven intelligent agent. (a) Bridge drawing dataset construction with Stage-I region-level annotations and Stage-II parameter-level annotations, and an enlarged detail of representative annotations; (b) two-stage detection using a YOLO region detector and a YOLO parameter detector; (c) parameter verification through human-in-the-loop verification and correction; and (d) the knowledge-driven intelligent agent for quantity checking, including task understanding, tool orchestration, parameter organization, and rule selection.
As shown in Figure 1a, the bridge drawing dataset is constructed using a two-stage annotation scheme. Stage-I region-level annotations are used to identify drawing regions that contain information relevant to subsequent processing, while Stage-II parameter-level annotations focus on parameter-related objects within the selected regions. An enlarged detail of a representative structural region is provided to clearly show the parameter-level annotations that are difficult to distinguish in the complete drawing. The two annotation sets are used to train the YOLO region detector and the YOLO parameter detector, respectively. During inference, as illustrated in Figure 1b, the region detector first locates candidate regions from the input bridge drawing. The parameter detector then identifies the types and locations of parameter-related objects within the detected regions. At this stage, the detector outputs parameter categories and spatial locations rather than final numerical parameter values, thereby providing semantic and spatial cues for subsequent information recognition.
Because errors may occur during object detection, numerical recognition, and parameter association, the initial parameter set is submitted to the parameter verification module shown in Figure 1c. An engineer inspects the extracted parameters and their corresponding locations in the original drawing, corrects erroneous values, and supplements missing information when necessary. The resulting verified parameter set is then fed back to the intelligent agent.
Based on the verified parameters, the agent updates the structured parameter representation and selects the corresponding engineering rules according to the quantity checking request. The quantity checking tool is then invoked to execute the selected deterministic rule script, perform quantity takeoff, and generate the checking results. In this manner, the proposed framework integrates automated drawing recognition, human-supervised parameter verification, and deterministic engineering calculation into a unified quantity-checking workflow.
2.2. Bridge Drawing Dataset for Quantity Takeoff
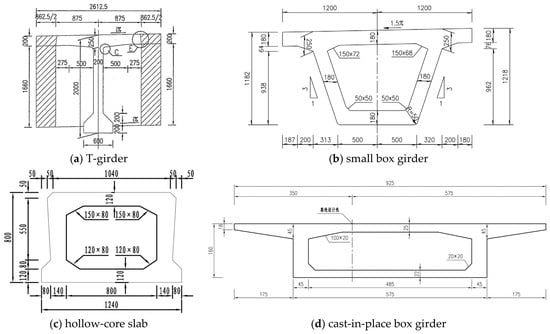
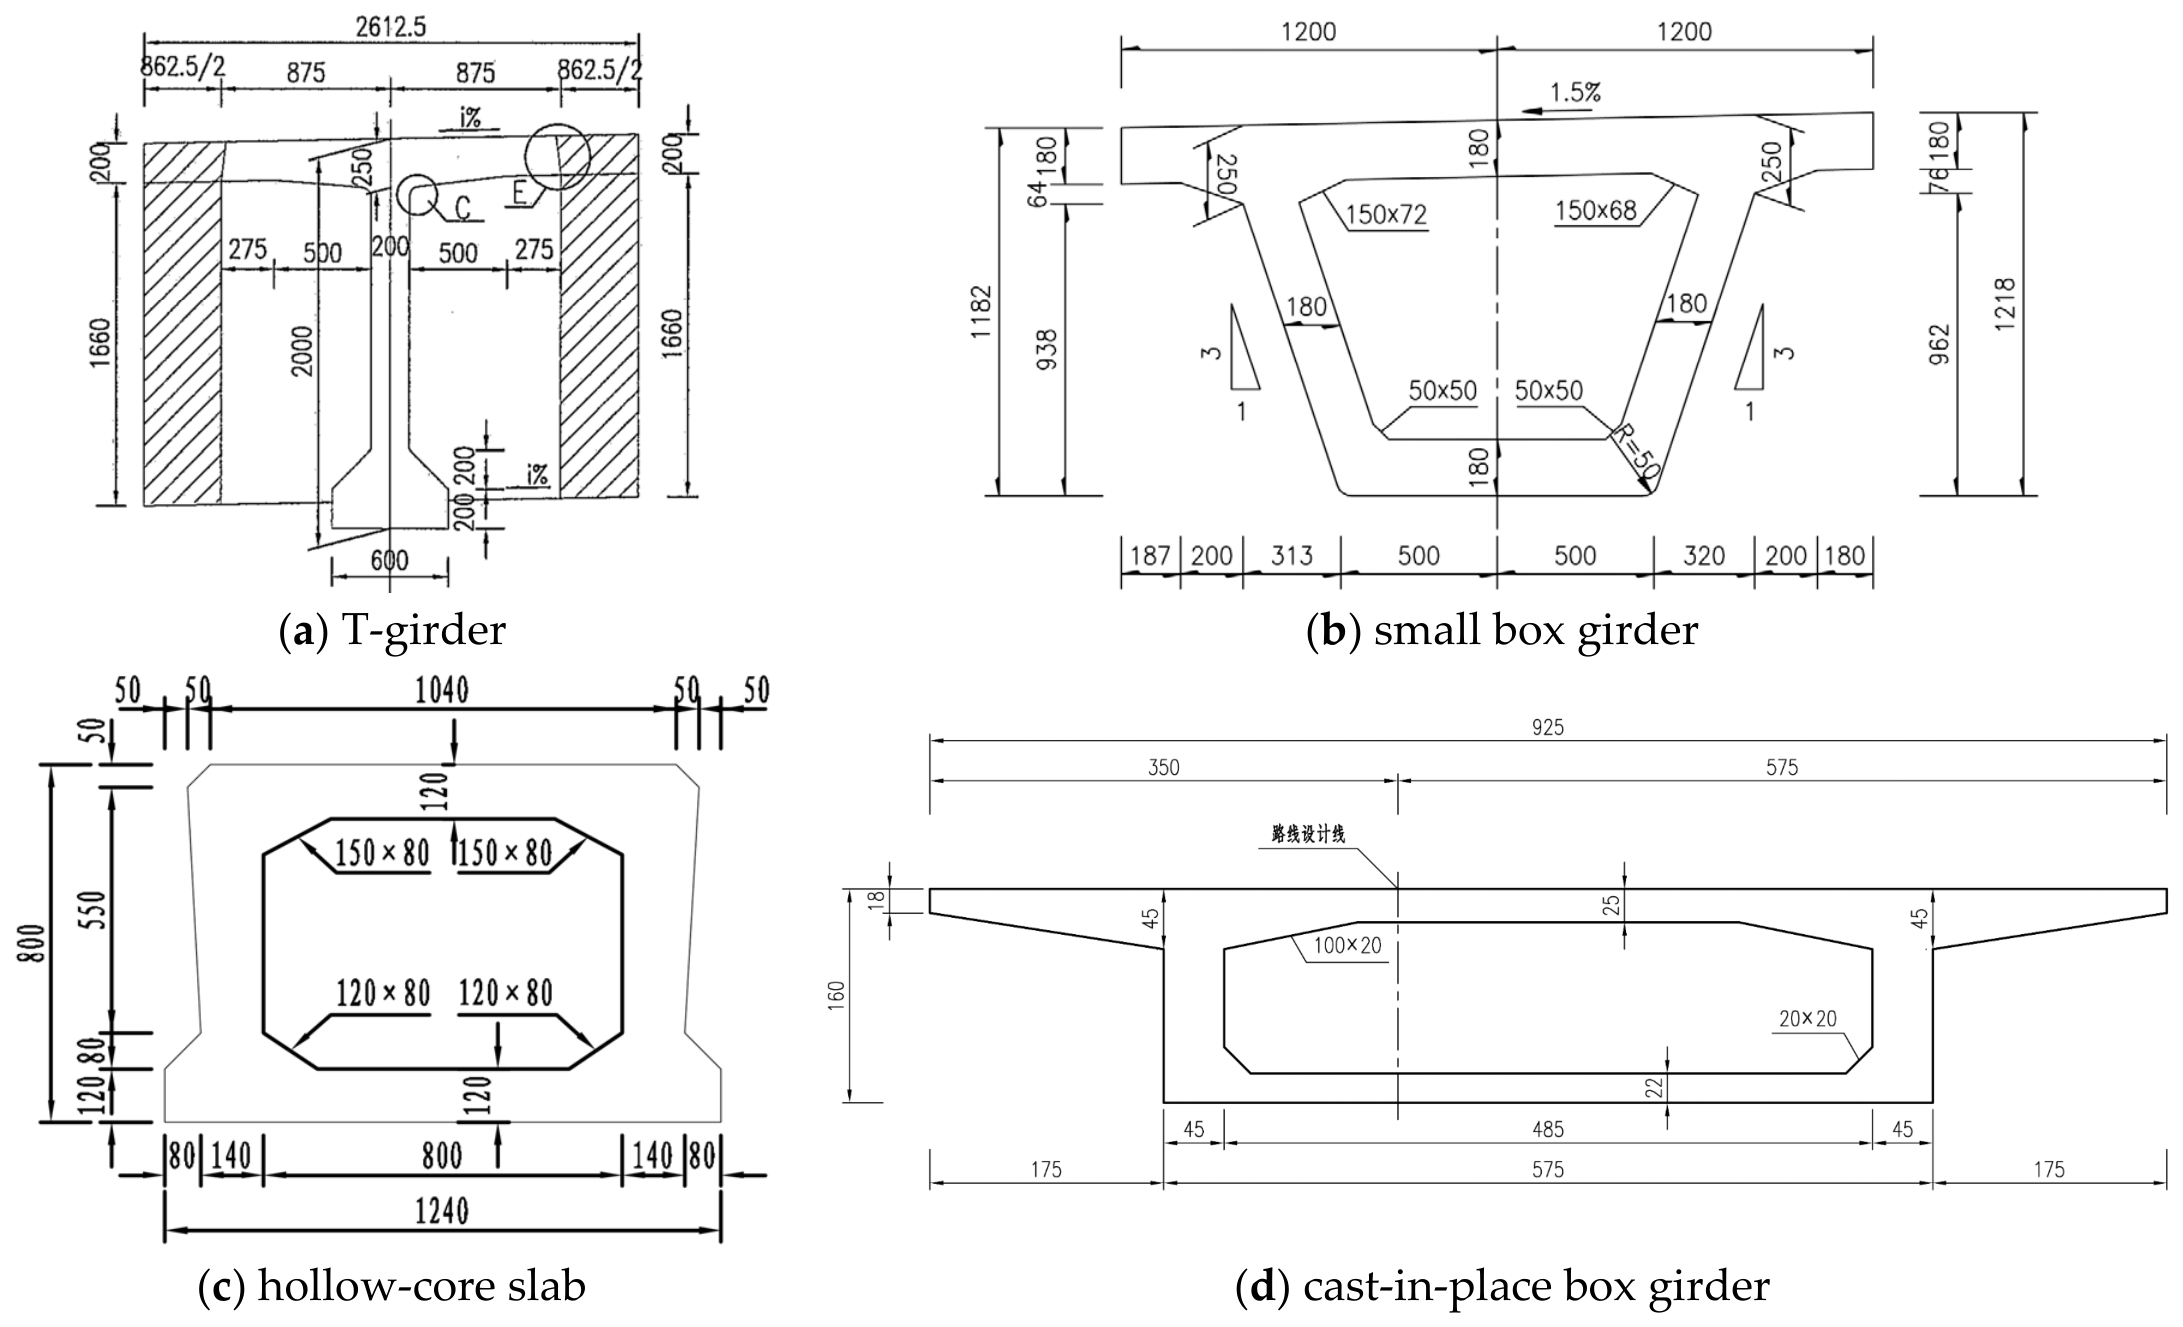
A bridge drawing dataset containing 1362 drawing images was constructed to support automated quantity takeoff and checking. The source bridge design drawings were originally exported directly from CAD software as PDF files rather than generated by scanning physical paper drawings. As the native CAD files were unavailable, the PDF drawings were converted into raster images and manually annotated following a two-stage annotation scheme. All drawings were provided by a single design organization and were collected from six engineering projects, each involving multiple bridges. From these projects, drawings containing the information required for quantity takeoff and checking were selected for dataset construction. Although the drawings followed the general drafting conventions of the same organization, the six projects covered multiple bridges and structural forms and exhibited variations in structural dimensions, local detailing, and drawing layouts. The dataset covers both bridge superstructures and substructures. The substructure drawings mainly include piers and abutments, while the superstructure drawings focus on main girders with representative cross-sectional forms, including T-girders, small box girders, hollow-core slabs, and cast-in-place box girders, as illustrated in Figure 2.
Figure 2.
Representative cross-sectional forms of the main girders included in the bridge drawing dataset: (a) T-girder; (b) small box girder; (c) hollow-core slab; and (d) cast-in-place box girder. The non-English annotations in the source drawings are original engineering labels retained from the bridge design drawings and are not required for interpreting the representative cross-sectional forms.
Unlike general-purpose engineering drawing datasets, the annotation categories in the proposed dataset were defined according to the information required by the subsequent quantity calculation rules. Stage-I annotations identify functional regions, such as structural views, tables, and annotation regions, whereas Stage-II annotations focus on parameter-related objects within the detected structural views. These annotations are designed to locate geometric dimensions, component information, and reinforcement-related information required for concrete quantity takeoff and reinforcement information consistency checking. Therefore, the dataset provides a task-specific data foundation for connecting bridge drawing detection with parameterized quantity calculation and automated quantity checking.
2.3. Two-Stage YOLO-Based Detection
Bridge structural drawings are generally high-resolution images with complex layouts. A single drawing may contain structural views, tables, design notes, title blocks, and other types of information. Dimension-related objects required for quantity takeoff usually occupy only a small portion of the entire drawing and are often densely distributed within structural views. When a complete drawing is resized to meet the input requirements of a detection model, local details may be lost, while irrelevant drawing regions may introduce additional interference. Therefore, a two-stage YOLO-based detection method is adopted to decompose whole-drawing region detection and local parameter detection into two successive stages.
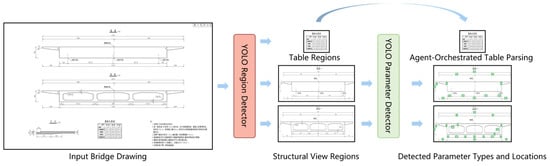
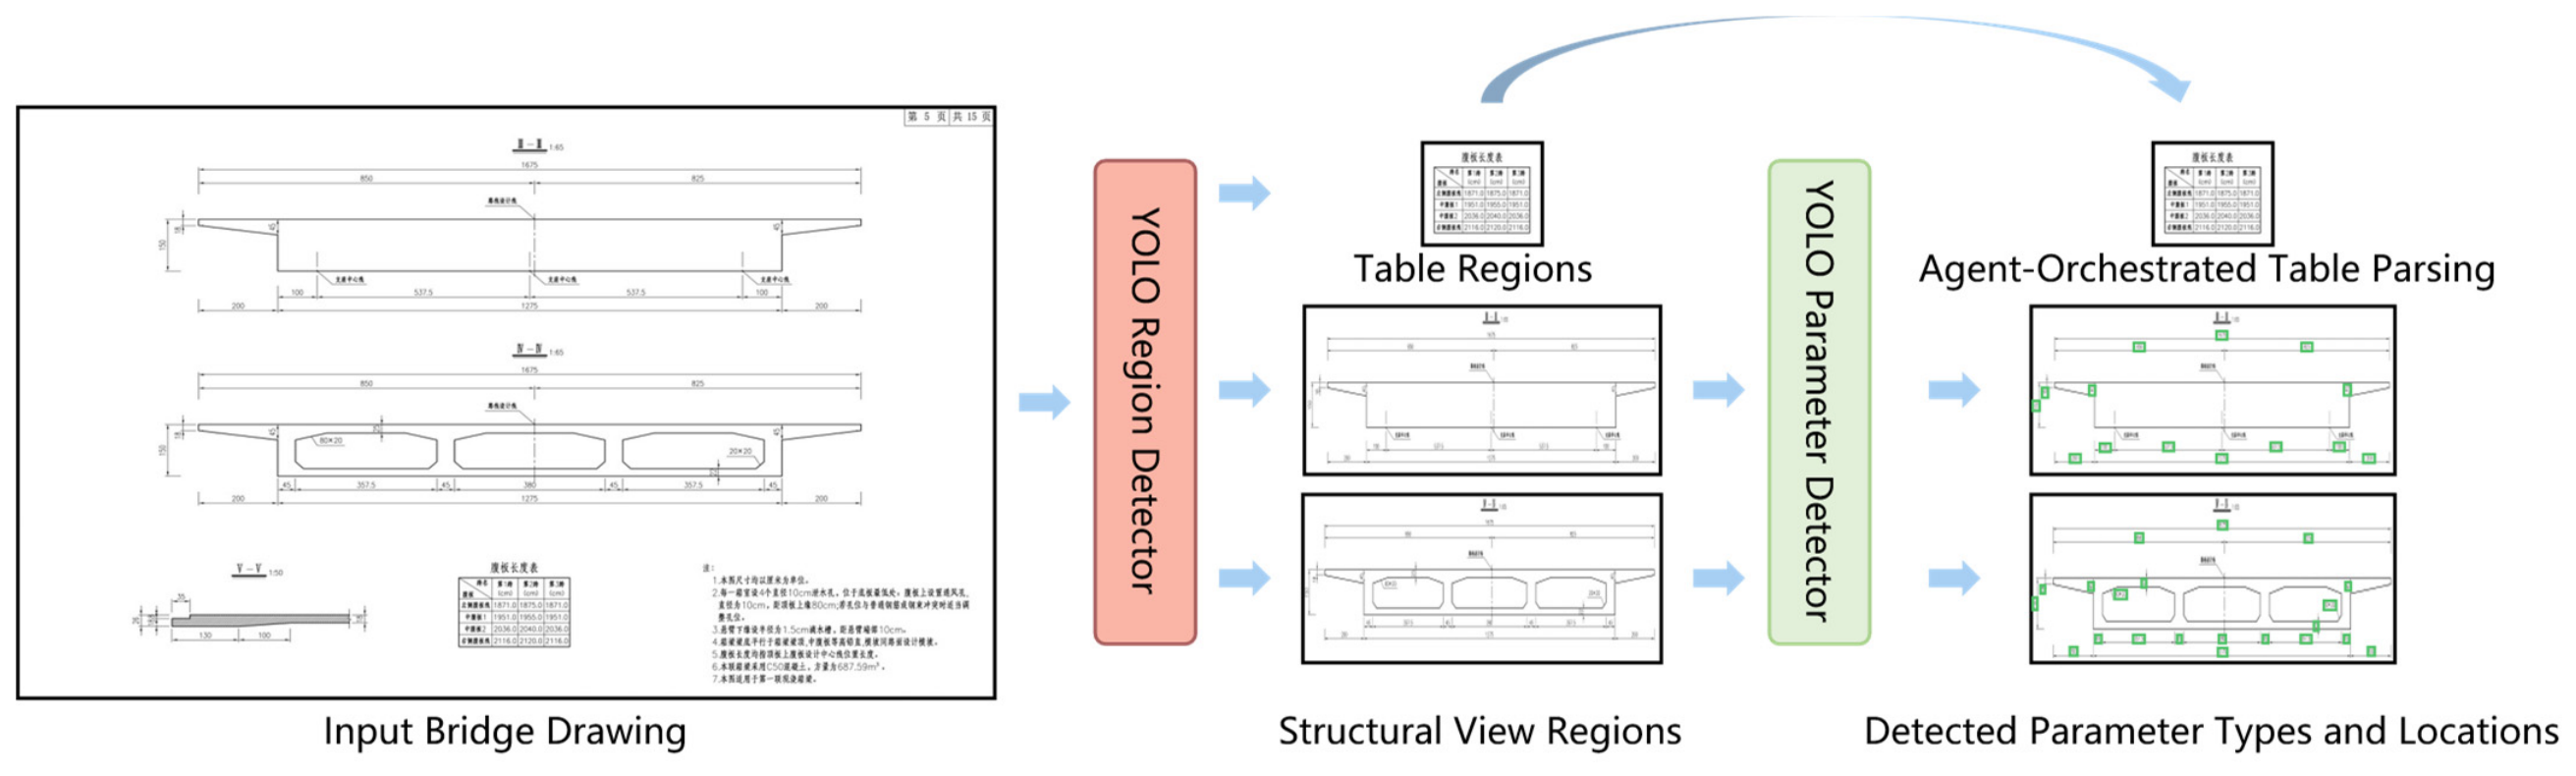
As illustrated in Figure 3, the first stage employs a YOLO region detector to identify functional regions from the input bridge drawing, including table regions and structural view regions. Each detected region is cropped from the original drawing according to its bounding-box coordinates and routed to the corresponding downstream process. Table regions bypass the second-stage detector and are directly processed through agent-orchestrated table parsing. Structural view regions, in contrast, are passed to the YOLO parameter detector for further analysis.
Figure 3.
Workflow of the proposed two-stage YOLO-based detection method. The YOLO region detector identifies table and structural view regions from the input bridge drawing. Table regions are routed to agent-orchestrated table parsing, whereas structural view regions are further processed by the YOLO parameter detector to obtain parameter types and locations, which are indicated by the green boxes.
In the second stage, the YOLO parameter detector localizes parameter-related objects within the cropped structural view regions. For each detected object, the detector provides its parameter type, bounding-box coordinates, and detection confidence. The examples shown in Figure 3 illustrate the detected parameter types and their corresponding locations within the cropped structural view regions. It should be noted that the detector outputs parameter types and locations rather than final numerical values. The detected bounding boxes therefore define the local image regions from which the corresponding parameter values can subsequently be extracted.
2.4. Knowledge-Driven Intelligent Agent for Quantity Checking
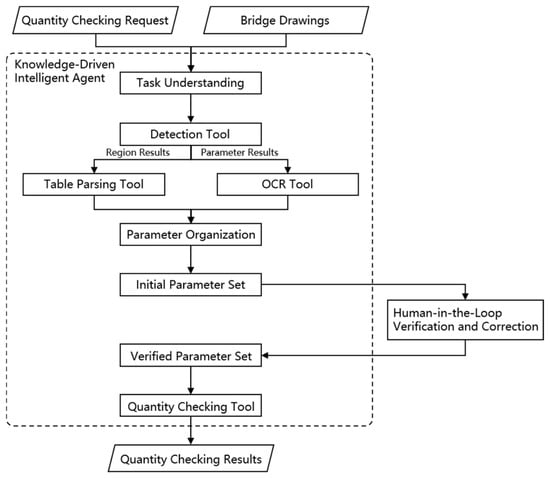
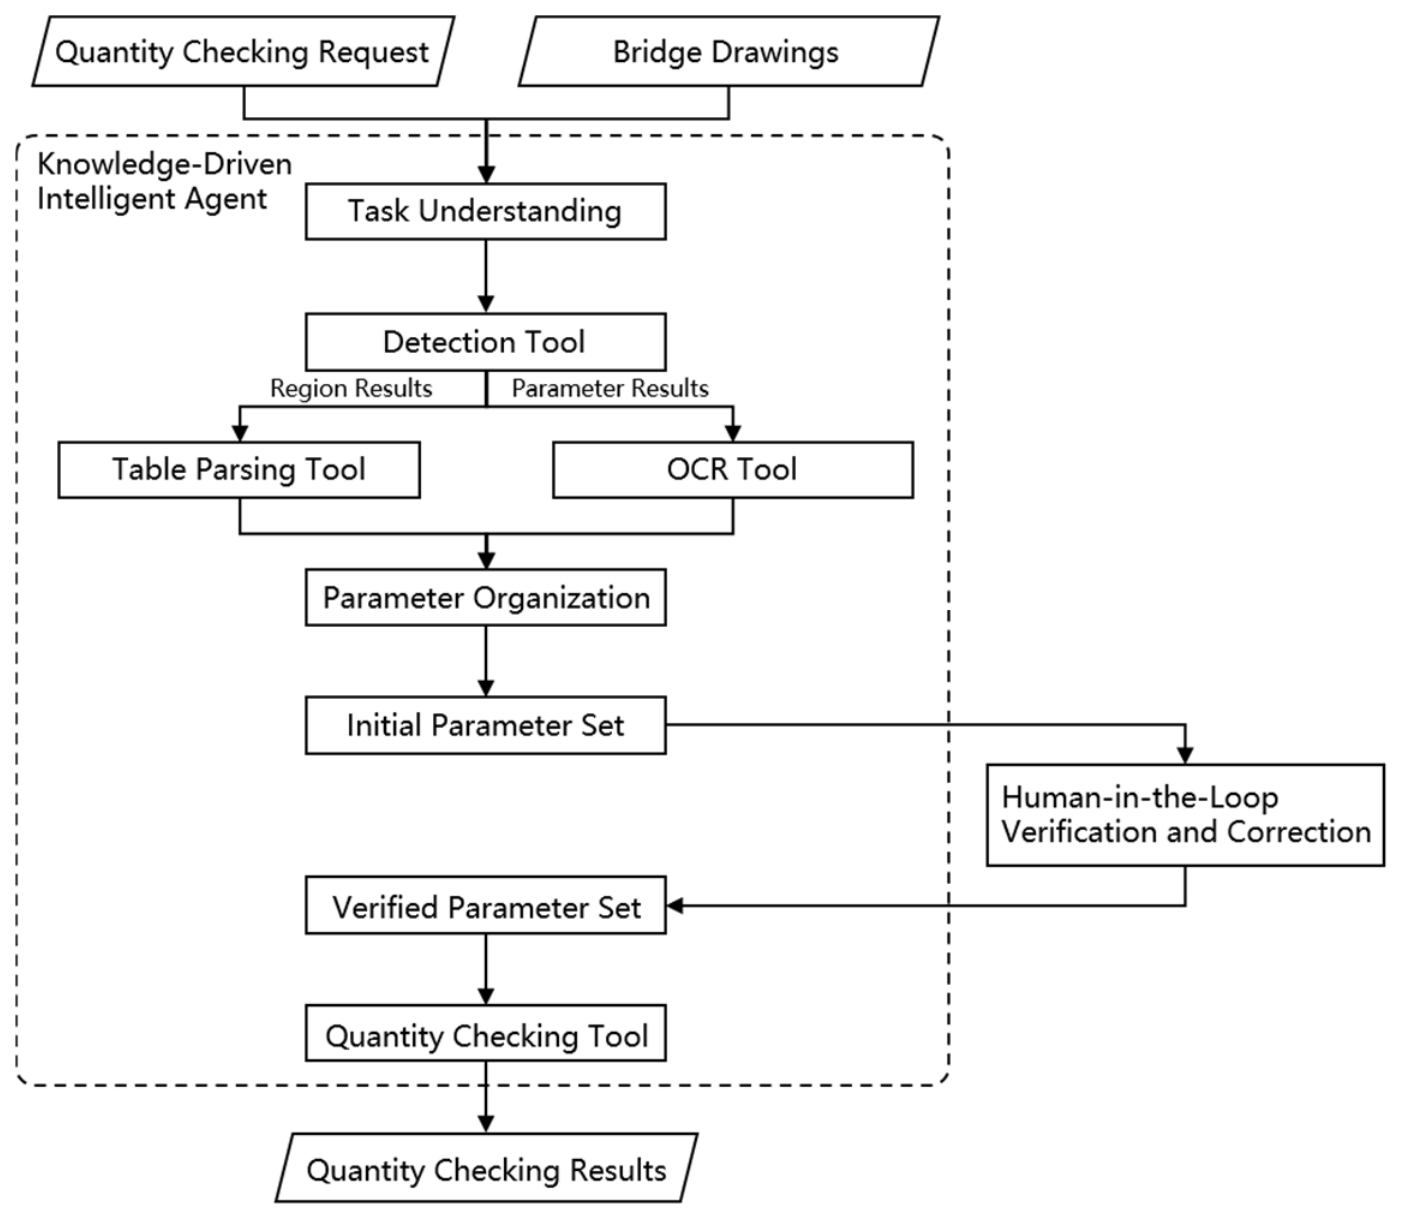
As shown in Figure 4, the knowledge-driven intelligent agent serves as the central controller of the online quantity checking process. It receives the bridge drawings and the quantity checking request as inputs, interprets the checking objective, and determines the information and tools required for the current task. Rather than directly performing drawing detection and numerical calculation, the agent coordinates specialized tools and organizes their outputs to complete the quantity checking workflow.
Figure 4.
Workflow of the knowledge-driven intelligent agent for quantity checking.
After task understanding, the agent invokes the detection tool, which implements the two-stage YOLO-based detection method described in Section 2.3. Based on the region results obtained in the first stage, the agent invokes the table parsing tool to process the detected table regions. The table parsing tool is implemented using a predefined prompt that guides the agent in interpreting the table content and converting it into a normalized structured representation. Based on the parameter results obtained in the second stage, the agent invokes the OCR tool to recognize numerical and textual information within the corresponding local image regions.
The outputs of the table parsing and OCR tools are subsequently integrated through parameter organization. The agent associates the recognized values with their corresponding parameter types, drawing locations, and bridge components, while normalizing field names and measurement units when necessary. Information extracted from structural views and tables is then organized into a unified initial parameter set. This initial parameter set is submitted to the human-in-the-loop verification and correction module described in Section 2.5, and the resulting verified parameter set is returned to the agent for subsequent quantity checking.
Based on the quantity checking request and the verified parameter set, the agent invokes the corresponding predefined rule script within the quantity checking tool. The rule scripts are developed for different bridge components, cross-sectional forms, and quantity categories. For concrete quantity takeoff, the required geometric parameters are used to calculate cross-sectional areas, which are combined with the corresponding component lengths to obtain concrete volumes. For reinforcement information consistency checking, parameters such as bar mark, diameter, single-bar length, and number of bars are organized into structured tuples and compared with the corresponding entries in the bar schedule. The calculated concrete quantities are compared with the reference quantities extracted from the drawings or provided by engineers, while inconsistent reinforcement entries are identified through the comparison between reinforcement details and bar schedules. The resulting deviations, inconsistencies, and checking conclusions are returned as the quantity checking results.
2.5. Human-in-the-Loop Parameter Verification and Correction
Although the proposed detection, OCR, and table parsing tools can automatically extract information from bridge drawings, errors may still occur because of dense dimension annotations, complex drawing layouts, image quality variations, and ambiguous parameter associations. Since quantity takeoff relies directly on the extracted engineering parameters, an incorrect or missing value may propagate through the deterministic calculation process and lead to inaccurate quantity checking results. Therefore, a human-in-the-loop parameter verification and correction mechanism is introduced before quantity calculation to prevent recognition errors from being directly transferred to the final results.
As illustrated in Figure 4, the initial parameter set generated by the agent is presented to an engineer together with the corresponding parameter types, values, and locations in the original drawings. The engineer verifies whether each parameter is correctly recognized and associated with the appropriate bridge component. Erroneous values can be corrected, missing parameters can be supplemented, and unnecessary or duplicated information can be removed when required. The engineer makes these decisions based on professional experience and direct comparison with the original drawings. The verification modifies only the extracted parameter set for the current drawing set and does not alter the predefined quantity-checking rules. The verified information is subsequently organized into a verified parameter set and returned to the knowledge-driven intelligent agent.
The verified parameter set is then used by the quantity checking tool to execute the corresponding predefined rule scripts. When a parameter is modified, the structured parameter representation and the subsequent quantity calculation are updated accordingly. This mechanism retains the efficiency of automated information extraction while introducing engineering supervision at the critical parameter level. It therefore reduces the propagation of recognition errors and improves the reliability of the quantity checking process.
2.6. Implementation Environment and Training Configuration
All experiments were conducted on a computing server running Ubuntu 22.04.4 LTS. The server was equipped with two Intel(R) Xeon(R) Gold 6230R processors, providing 52 physical cores and 104 threads, and 256 GB of RAM. Two NVIDIA RTX A6000 GPUs, each with 48 GB of memory, were used in the reported experiments. CUDA 13.0 was used as the GPU computing environment.
The YOLO region detector and the YOLO parameter detector were implemented using the YOLO26l architecture [34] with Ultralytics v8.3.252 and PyTorch 2.5.1 under Python 3.11.13. Both detectors were initialized with pretrained weights and fine-tuned using the default training configuration provided by Ultralytics for YOLO26l. The region-level and parameter-level bounding-box annotations were created using LabelImg.
The knowledge-driven intelligent agent was implemented using Qwen3.6-27B [35] and deployed locally using vLLM 0.20.1 under Python 3.11.14 and PyTorch 2.11.0. DeepSeek-OCR-2 [36] was employed to recognize numerical and textual information within the detected parameter regions. All detection, recognition, parameter organization, and quantity-checking modules were executed locally.
3. Experimental Results
3.1. Experimental Data and Settings
The bridge drawing dataset described in Section 2.2 contains 1362 drawing images. For the evaluation of the two-stage detection method, the images were randomly divided at the individual-image level into a training set and a test set at a ratio of 85:15, resulting in 1158 training images and 204 test images. The training set was used to train the drawing detection models, whereas the test set was reserved for evaluating detection performance. The quantity-checking experiments used a separate case-selection procedure. Eligible drawing sets containing the information required for the corresponding quantity-checking task were first grouped according to structural type. To ensure a meaningful within-type comparison, cases within each group had comparable cross-sectional configurations, and three drawing sets were then randomly selected from each group. Despite this within-type comparability, the selected cases retained variations in structural dimensions, local detailing, and project-specific drawing layouts.
The hardware and software environments and the implementation settings of the detection, OCR, and intelligent-agent modules are described in Section 2.6.
In addition to the end-to-end quantity checking experiments, the OCR tool and the table parsing tool were evaluated separately. The OCR tool was evaluated using 500 cropped parameter images, with each target numerical value treated as an independent evaluation item. The table parsing tool was evaluated using 50 tables. Each data entry within a table was evaluated independently rather than treating the entire table as a single evaluation unit. Therefore, an incorrectly extracted entry did not invalidate the other correctly extracted entries in the same table.
The detection performance was evaluated using Recall, mAP@0.5, and mAP@0.5:0.95. Numerical recognition accuracy was calculated as
where and denote the numbers of correctly recognized and total numerical values, respectively. Table parsing accuracy was calculated at the data-entry level as
where and denote the numbers of correctly extracted and total table entries, respectively. For concrete quantity checking, the cross-sectional area error and concrete volume error were calculated as
where and denote the calculated cross-sectional area and concrete volume, respectively, and and denote the corresponding reference values. The human-in-the-loop parameter verification and correction mechanism was evaluated by comparing parameter accuracy and quantity relative error before and after verification. Parameter accuracy was defined as
where and denote the numbers of correct and total evaluated parameters, respectively.
3.2. Evaluation of Two-Stage YOLO-Based Detection
To evaluate the effectiveness of the two-stage YOLO-based detection method, it was compared with a single-stage detection method. The single-stage method directly detected parameter-related objects from the complete bridge drawing, whereas the proposed method first located structural view regions and then performed parameter detection within the cropped regions. For a fair comparison, both methods were implemented using the same YOLO26 [34] configuration and trained and evaluated using the same dataset split. Both methods were evaluated on the same test set using mAP@0.5, mAP@0.5:0.95, and Recall.
As shown in Table 1, the proposed two-stage method outperformed the single-stage method across all evaluation metrics. The mAP@0.5 increased from 0.769 to 0.908, while the mAP@0.5:0.95 increased from 0.471 to 0.656. Recall also improved from 0.664 to 0.792. These results correspond to improvements of 13.9, 18.5, and 12.8 percentage points, respectively. In particular, the increase in Recall indicates that the two-stage method reduced missed detections of parameter-related objects.
Table 1.
Quantitative comparison between the single-stage and two-stage YOLO-based detection methods.
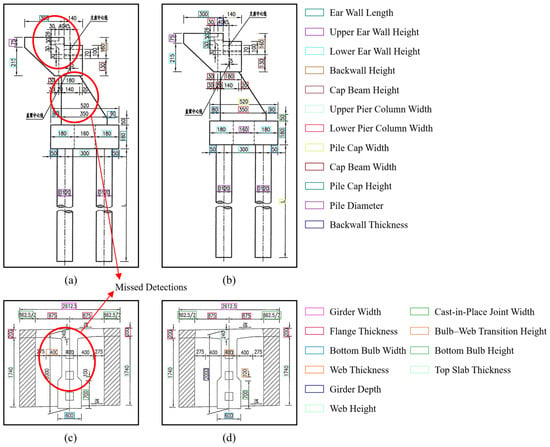
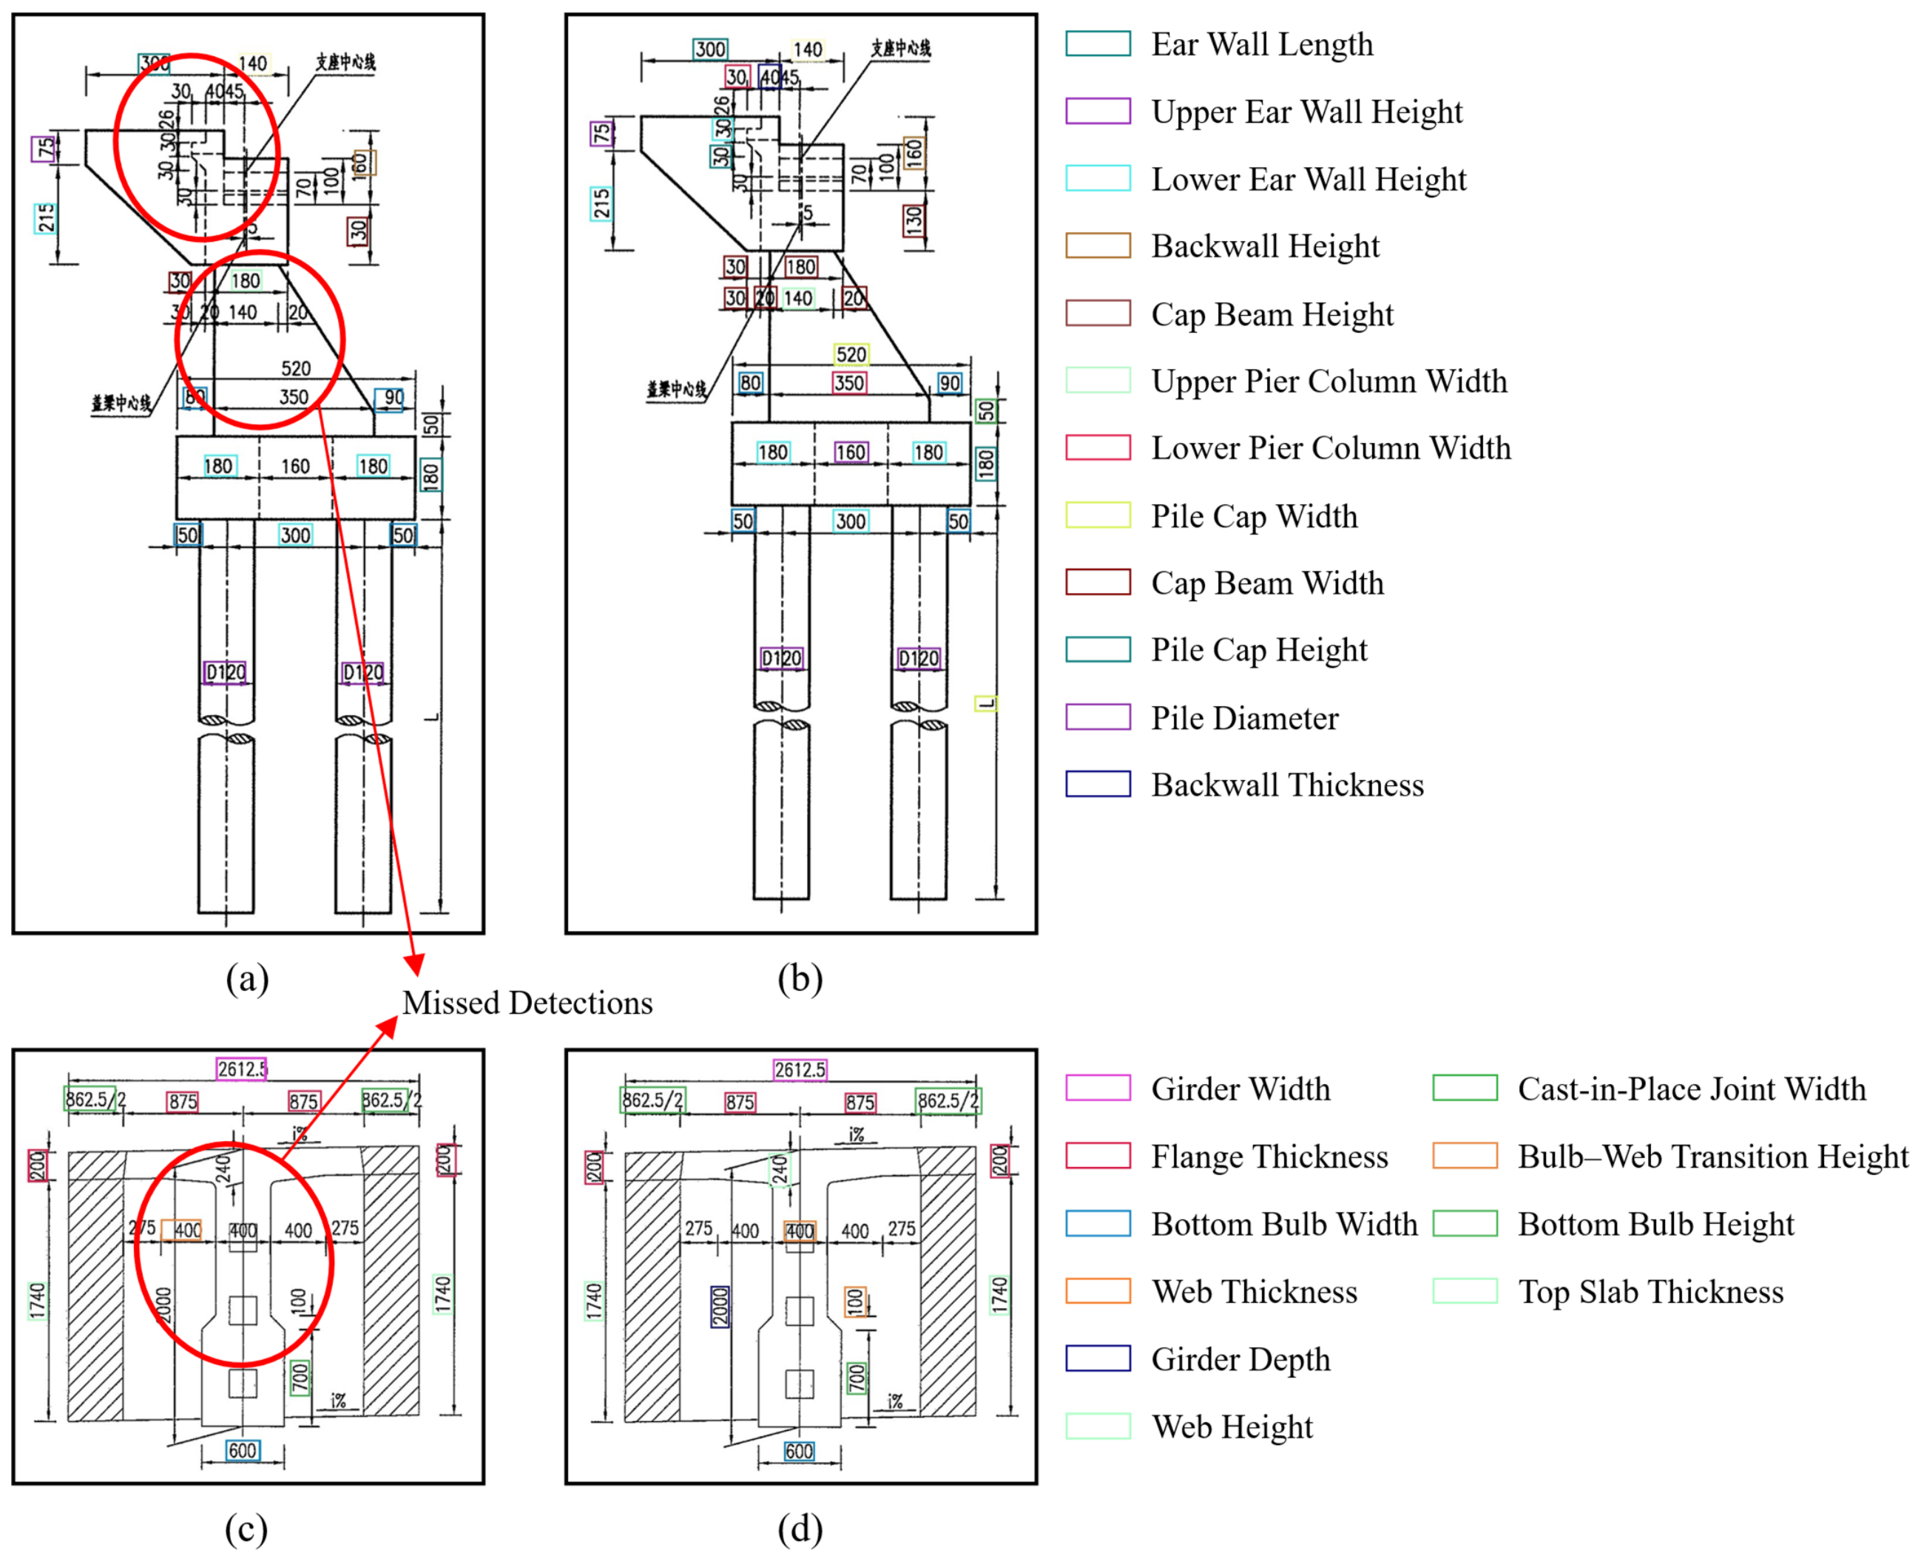
Figure 5 presents qualitative comparisons on representative bridge drawings. Because the parameter categories vary across structural forms and drawing views, the corresponding legends identify the main categories appearing in the selected examples. Figure 5a,c show the results of single-stage detection, where the red circles and arrows mark representative missed detections, and the detected parameter information is incomplete. In contrast, the two-stage results shown in Figure 5b,d provide more complete coverage of dimension annotations and more accurately locate parameter-related objects. This improvement is mainly attributed to the use of cropped structural view regions, which preserves local drawing details and reduces interference from unrelated regions in the complete drawing.
Figure 5.
Qualitative comparison between single-stage and two-stage YOLO-based detection methods. (a,c) Single-stage detection results; (b,d) two-stage YOLO-based detection results. The colored bounding boxes denote the main parameter categories listed in the corresponding legends, while the red circles and arrows in (a,c) indicate missed detections. The non-English annotations originate from the original bridge design drawings and do not affect the interpretation of the detection results.
3.3. Quantity Checking Experiments
To evaluate the information extraction and quantity checking performance of the proposed framework, the OCR and table parsing tools were first tested independently. As shown in Table 2, the OCR tool achieved an accuracy of 84.0% on 500 cropped parameter images, while the table parsing tool achieved an entry-level accuracy of 94.2% on 50 tables. These results indicate that both tools can provide effective information inputs for subsequent parameter organization, with the table parsing tool achieving a higher extraction accuracy.
Table 2.
Accuracy of the numerical recognition and table parsing tools.
Based on the extracted and organized parameters, concrete quantity checking was conducted for six representative structural types, with three sets of drawings tested for each type. Table 3 reports the mean relative errors between the quantities calculated by the proposed framework and the corresponding reference values. Specifically, the cross-sectional area error represents the deviation between the system-calculated cross-sectional area and its reference value, while the concrete volume error represents the deviation between the calculated concrete volume and the corresponding reference quantity. These errors quantify the accuracy of the automated quantity takeoff process rather than the correctness of the original drawings.
Table 3.
Relative errors in concrete quantity checking for different structural types.
For the four superstructure types, the mean cross-sectional area errors ranged from 0.05% to 2.32%. The hollow-core slab achieved the lowest area error of 0.05%, followed by the cast-in-place box girder at 0.15%, whereas the small box girder showed the highest area error of 2.32%. The mean concrete volume errors ranged from 1.21% to 5.84%. Among the tested types, the hollow-core slab produced the lowest volume error of 1.21%, while the small box girder produced the highest error of 5.84%. For the substructures, only the concrete volume error was evaluated because the quantities of piers and abutments were not calculated using a single representative cross section. The mean volume errors were 1.62% for piers and 1.86% for abutments. The calculated quantities and their relative deviations provide quantitative information for quantity checking, while the acceptability of the resulting errors can be further assessed by engineers according to project requirements and allowable tolerances.
3.4. Evaluation of Human-in-the-Loop Parameter Verification and Correction
To quantify the manual effort required by the HITL verification process, the same 18 drawing sets, corresponding initial parameter sets, and quantity calculation rules were evaluated under three conditions: before HITL verification, after verification by bridge design professionals, and after verification by trained students. Two bridge design professionals and two students independently inspected and corrected the same initial parameter sets. Before the experiment, the students, who had no prior experience in bridge quantity takeoff, received approximately 3 h of standardized instruction covering the quantity calculation procedures, key parameters, and verification priorities. The instruction time was excluded from the recorded verification time. The time required to inspect and correct each drawing set was recorded, and the professional and student results were averaged across the two participants in each group.
As summarized in Table 4, 2619 of the 3164 automatically extracted parameters were correct before HITL verification, corresponding to a parameter accuracy of 82.77% and a mean concrete volume error of 23.94%. The bridge design professionals corrected or supplemented all 545 erroneous or missing parameters and confirmed all 3164 parameters as correct. Their mean verification time was 175 s per drawing set, and the resulting mean concrete volume error was 2.98%. The trained students identified an average of 492 of the 545 erroneous or missing parameters and successfully resolved an average of 466 parameters. In some cases, an erroneous parameter was identified but assigned an incorrect replacement value. Consequently, an average of 3085 parameters were correct after student verification, corresponding to a parameter accuracy of 97.50%. The students required an average of 238 s per drawing set, and their resulting mean concrete volume error was 5.78%. This comparison indicates that domain experience contributes to both verification accuracy and efficiency, although trained students can also substantially reduce parameter and quantity errors relative to the results before HITL verification.
Table 4.
Comparison of parameter accuracy, verification time, and concrete volume error under different verification conditions.
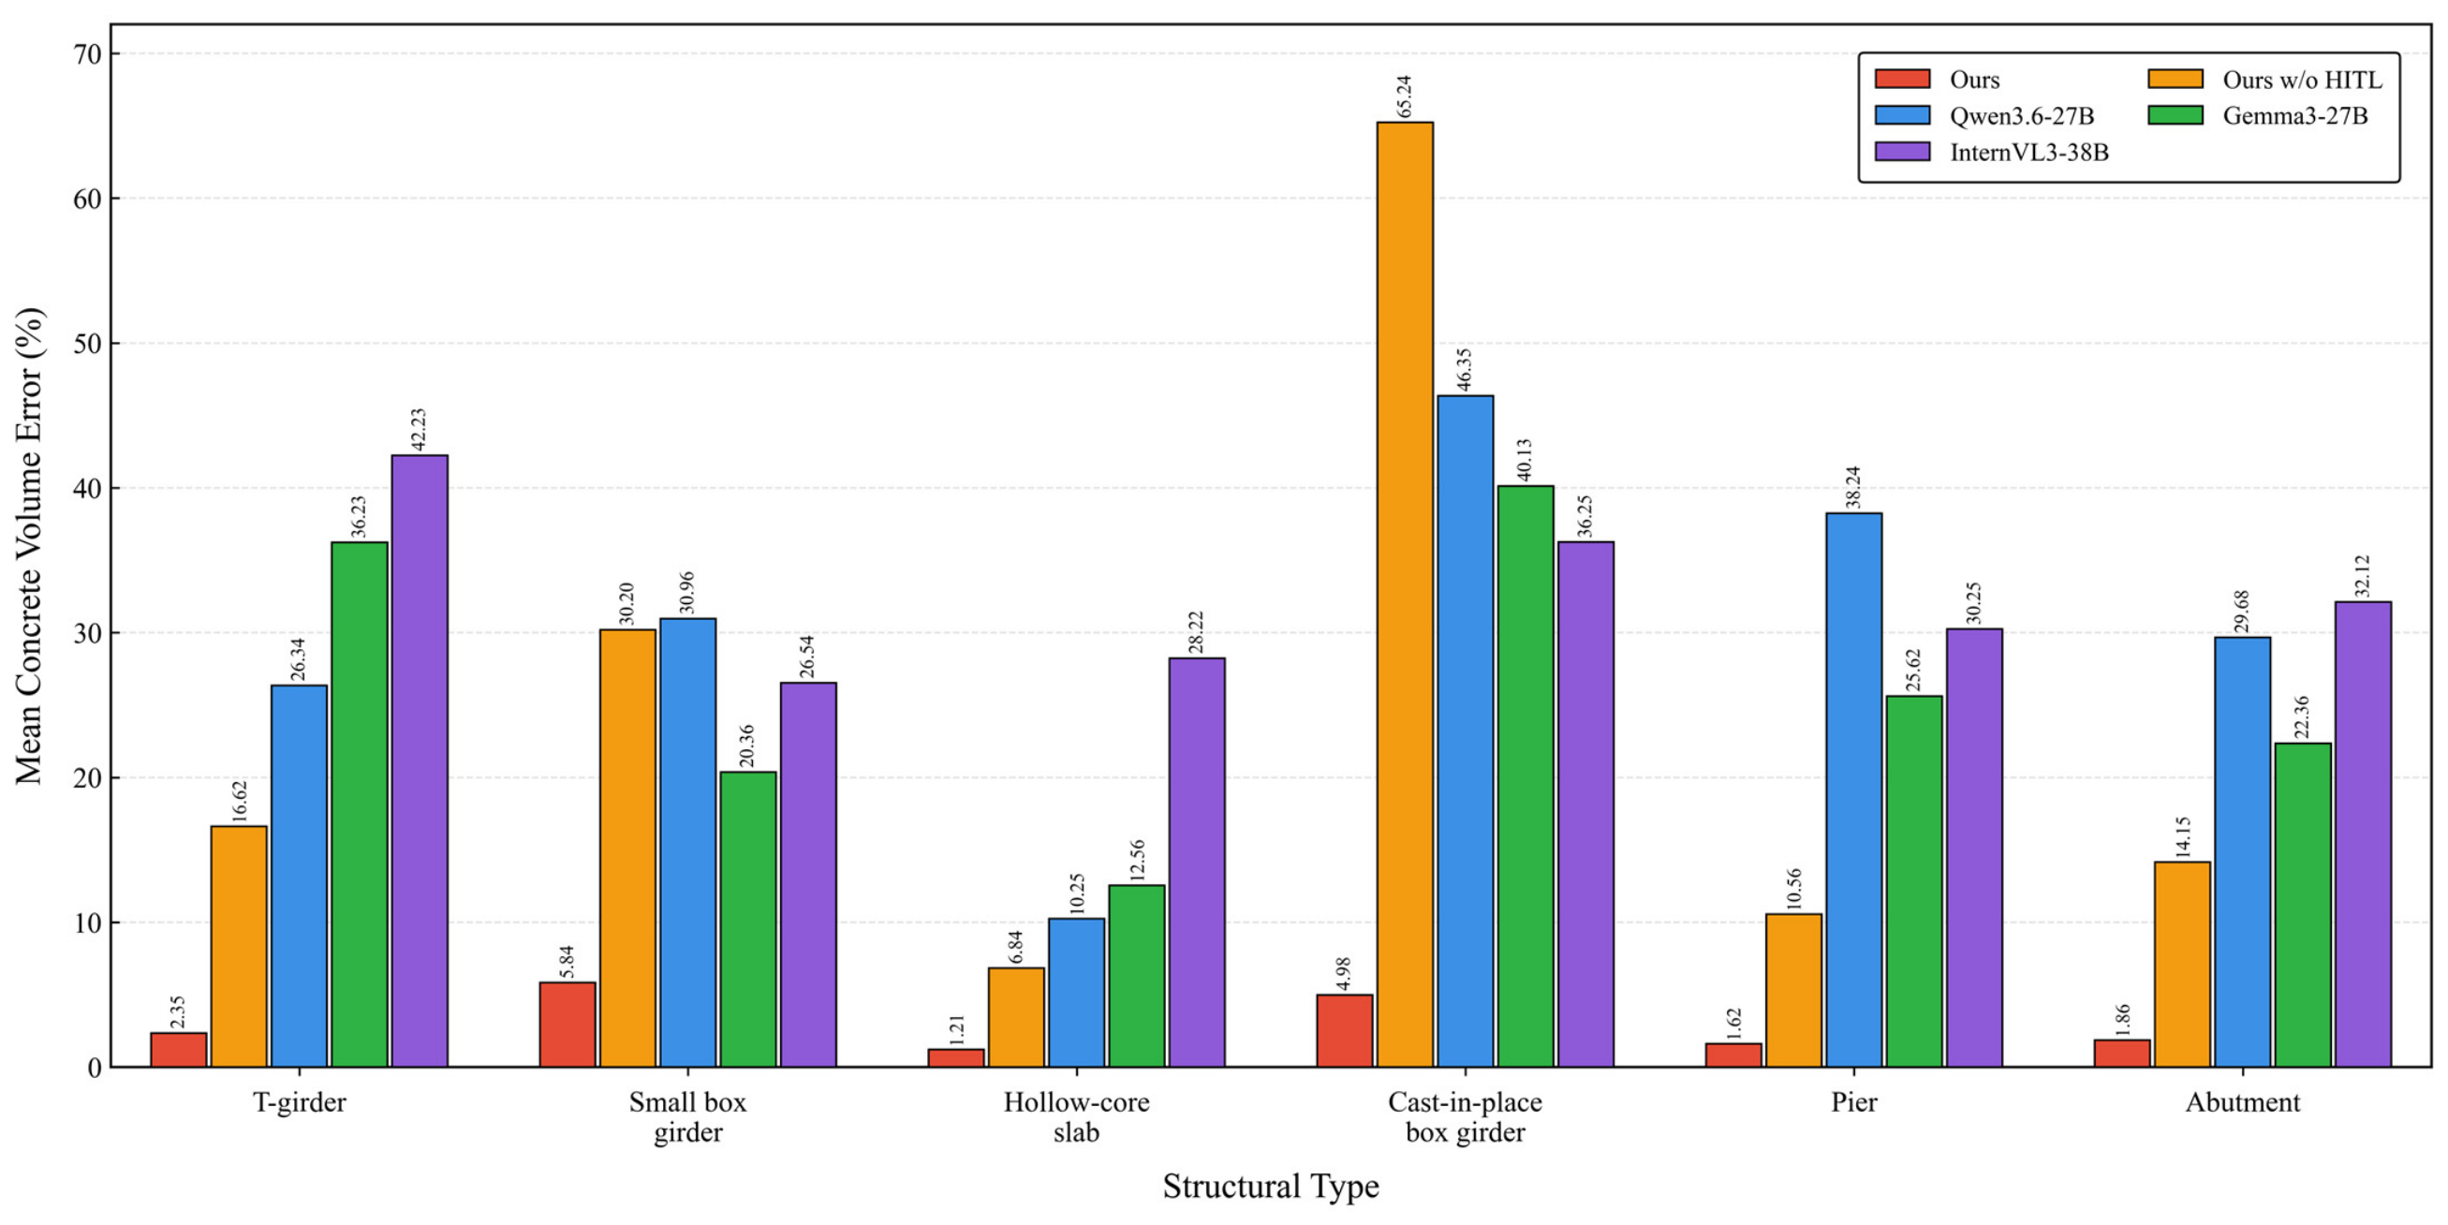
Table 5 further compares the mean concrete volume errors before HITL verification and after verification by bridge design professionals for the six investigated structural types. For the superstructures, the error decreased from 16.62% to 2.35% for the T-girder, from 30.20% to 5.84% for the small box girder, from 6.84% to 1.21% for the hollow-core slab, and from 65.24% to 4.98% for the cast-in-place box girder. For the substructures, the errors decreased from 10.56% to 1.62% for the pier and from 14.15% to 1.86% for the abutment. The results obtained after verification by the bridge design professionals correspond to the final concrete quantity checking results reported in Table 3.
Table 5.
Comparison of concrete volume errors before HITL verification and after verification by bridge design professionals.
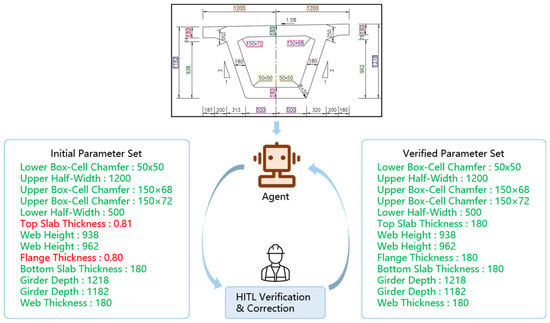
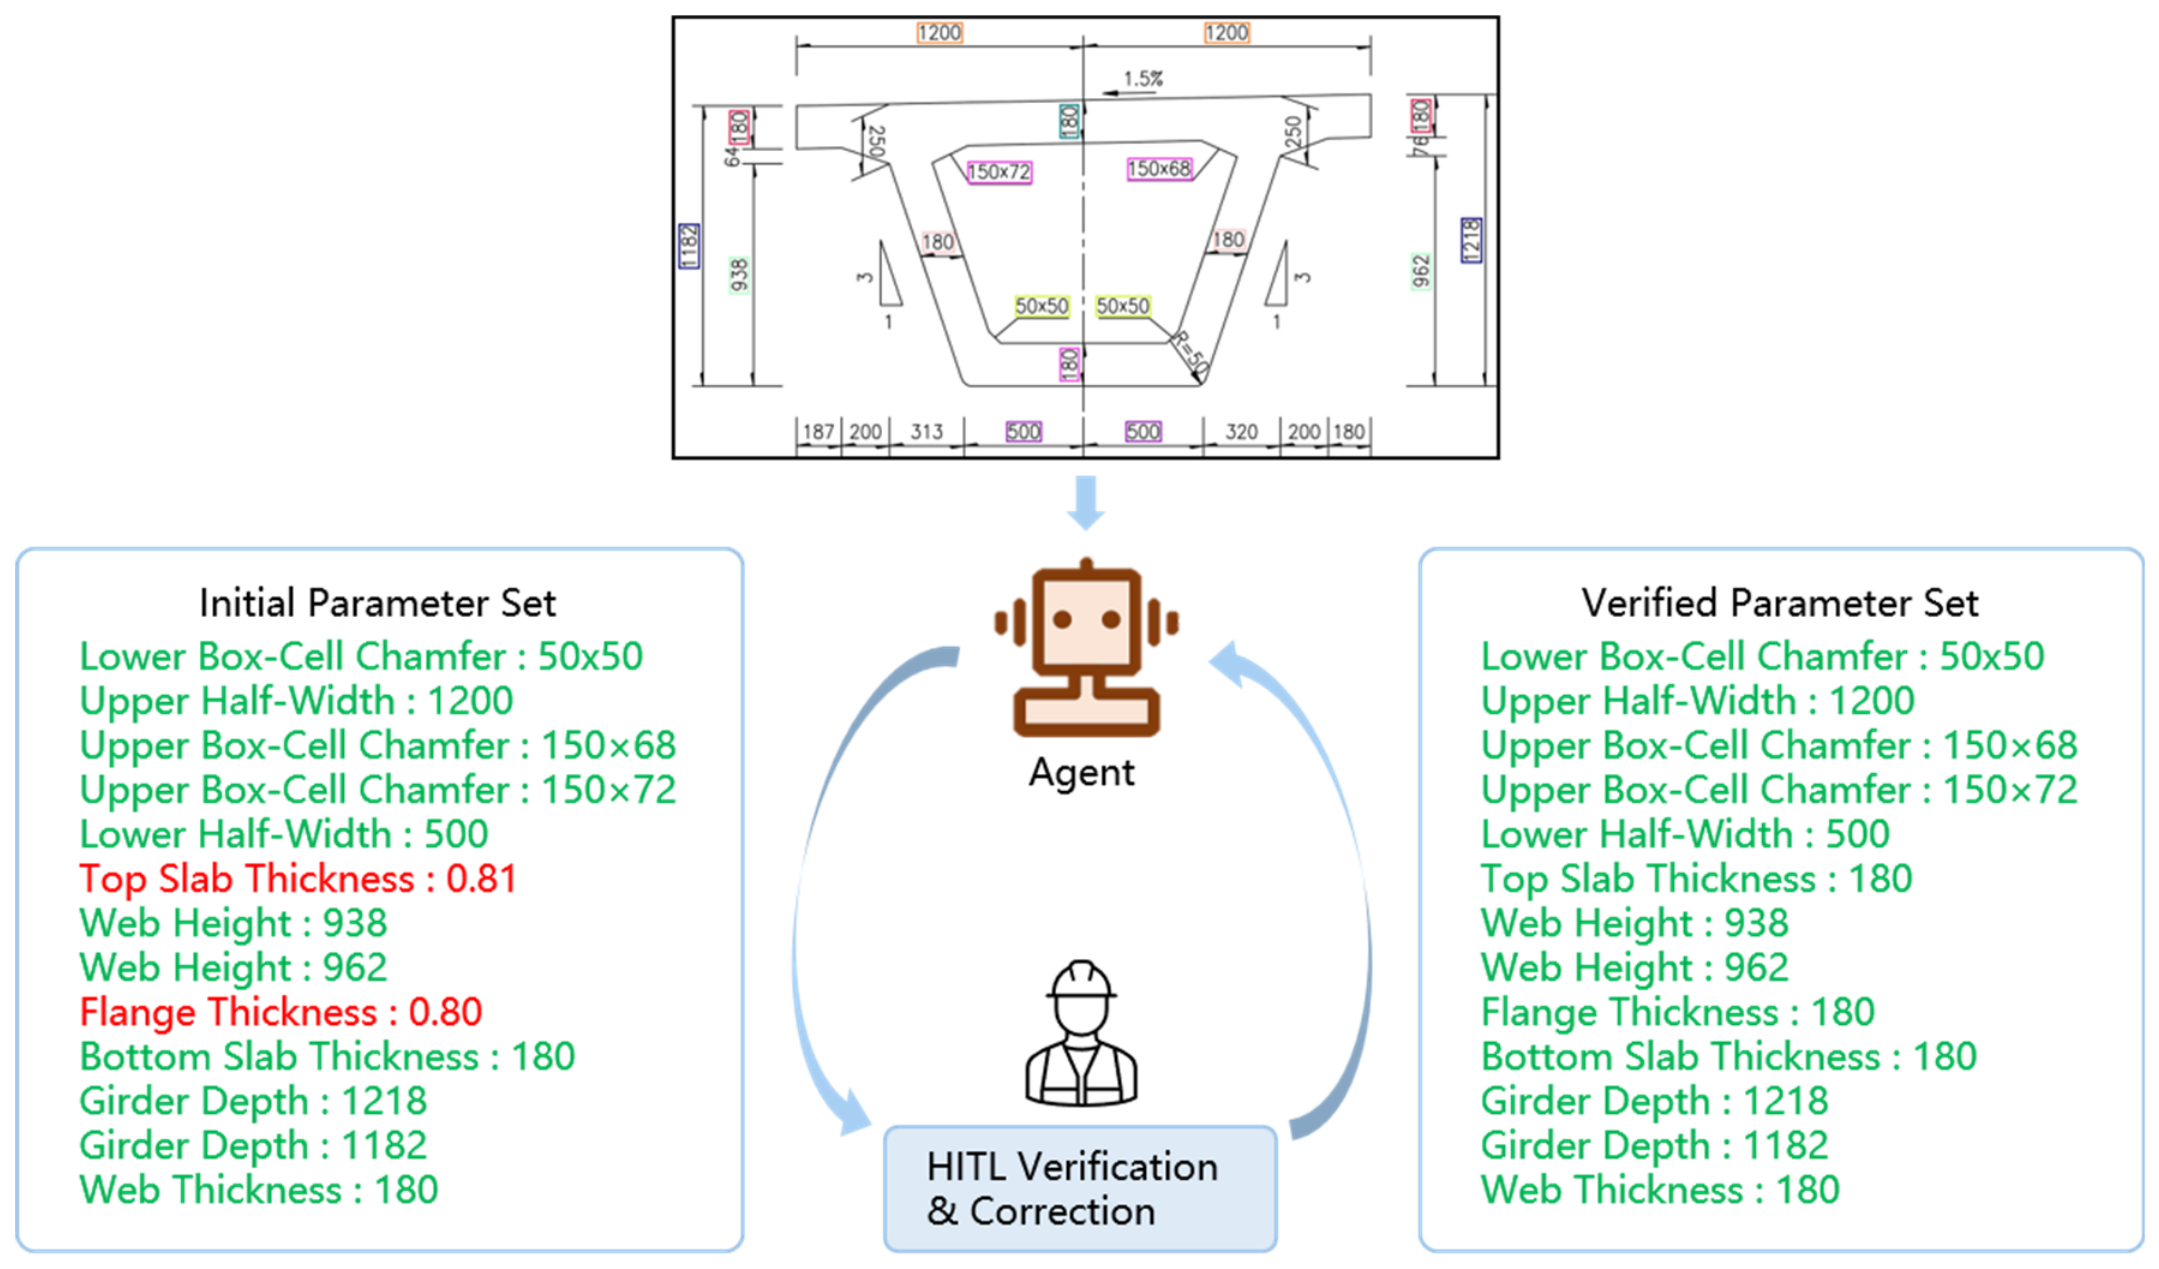
Figure 6 presents a representative example of the parameter verification process. In the initial parameter set, the top slab thickness and flange thickness were incorrectly recognized as 0.81 and 0.80, respectively. By inspecting the corresponding dimension annotations in the original drawing, the engineer corrected both values to 180. The corrected information was then incorporated into the verified parameter set and used to update the subsequent quantity calculation. This example illustrates how the HITL mechanism prevents incorrectly recognized parameters from being directly propagated to the final quantity checking results.
Figure 6.
Representative example of parameter verification and correction through the human-in-the-loop mechanism. Green text indicates correct parameter values, whereas red text indicates incorrect parameter values requiring correction.
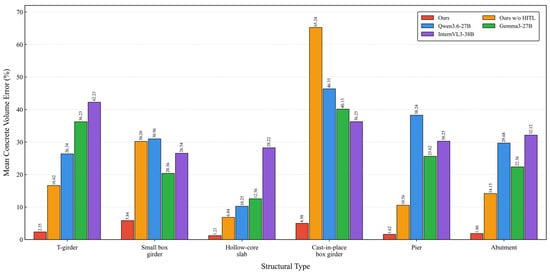
To further distinguish the contributions of the structured quantity checking workflow and HITL verification, the proposed framework, denoted as Ours in Figure 7, was compared with three large-model baselines, including Qwen3.6-27B [35], Gemma3-27B [37], and InternVL3-38B [38]. The baseline models directly interpreted the same bridge drawings and generated step-by-step quantity calculations through prompt-based reasoning, without using the dedicated information extraction tools, parameter organization, deterministic calculation scripts, or HITL verification incorporated in the proposed framework. The automatic quantity results produced by the proposed workflow without HITL verification, denoted as Ours w/o HITL, were also included in the comparison.
Figure 7.
Grouped comparison of mean concrete volume errors (%) for the proposed framework, its variant without HITL verification, and three prompt-based large-model baselines across six structural types.
As shown in Figure 7, Ours achieved substantially lower concrete volume errors than all three large-model baselines across the six investigated structural types. The errors of Ours ranged from 1.21% to 5.84%, whereas those of Qwen3.6-27B, Gemma3-27B, and InternVL3-38B ranged from 10.25% to 46.35%, 12.56% to 40.13%, and 26.54% to 42.23%, respectively. Even without HITL verification, the proposed workflow produced lower errors than the prompt-based baselines in most of the comparisons, although relatively large errors remained for the small box girder and cast-in-place box girder.
Inspection of the generated calculation steps further showed that a relatively small final error did not necessarily indicate a correct quantity calculation process. The baseline models occasionally misread dimensions in densely annotated regions, omitted relevant values, or used inappropriate intermediate calculations. Consequently, some apparently close final quantities may have resulted from the cancelation of multiple errors rather than reliable drawing interpretation and correct engineering calculation. In contrast, the proposed framework explicitly extracts and organizes the required parameters and executes predefined deterministic rules, thereby providing a more controllable and reliable calculation process.
Overall, the results demonstrate that the structured, tool-assisted workflow provides more accurate and reliable quantity results than direct prompt-based large-model reasoning. HITL verification and correction further improve parameter accuracy, reduce the propagation of recognition errors, and enhance the reliability of the final quantity checking results.
4. Engineering Case Study and Discussion
4.1. End-to-End Quantity Checking Case Study
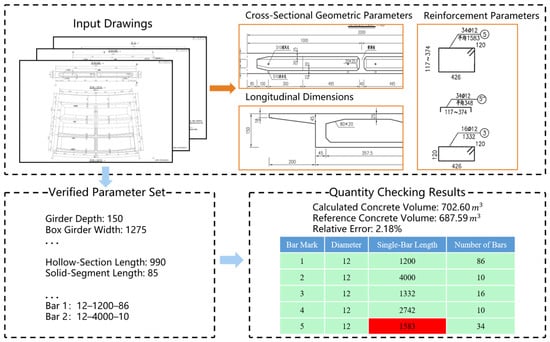
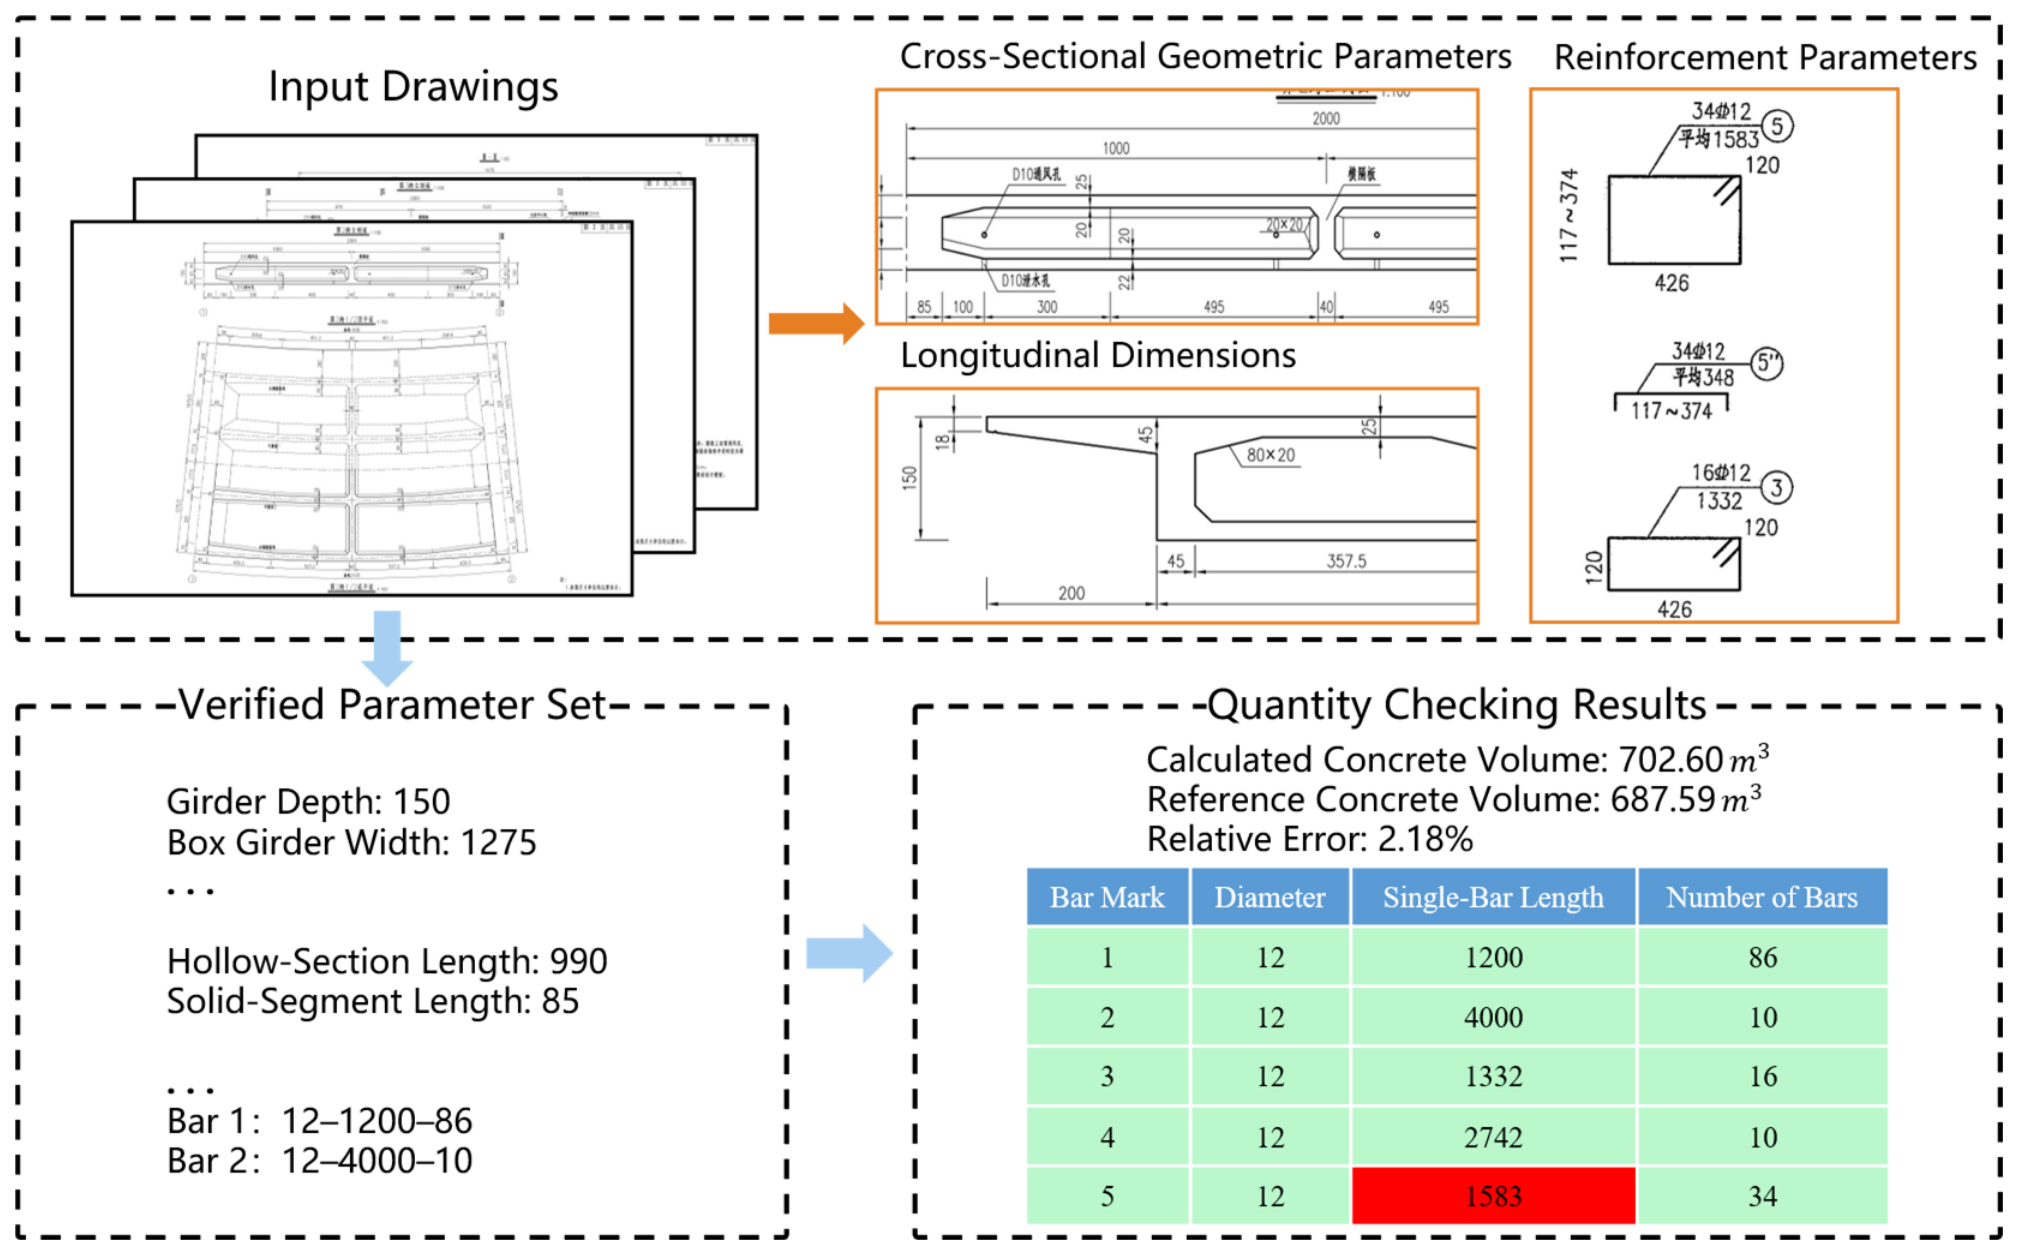
To demonstrate the complete workflow of the proposed framework, one set of superstructure drawings for a cast-in-place box girder was selected as a representative engineering case. The input request was to perform quantity checking for the cast-in-place box girder, including concrete quantity takeoff and reinforcement information consistency checking. The knowledge-driven intelligent agent coordinated the drawing detection, OCR, and table parsing tools, organized the extracted information, and generated an initial parameter set. After human-in-the-loop verification and correction, the verified parameters were used for subsequent quantity takeoff and checking. As illustrated in Figure 8, the entire process connects the input drawings, the verified parameter set, and the final quantity checking results. To improve readability, Figure 8 provides enlarged views of the drawing regions associated with cross-sectional geometric parameters, longitudinal dimensions, and reinforcement parameters, while displaying only representative entries in the verified parameter set.
Figure 8.
End-to-end quantity checking process for a representative cast-in-place box girder case. Orange boxes and the orange arrow highlight representative parameter regions in the input drawings, while black dashed boxes delineate the main stages of the workflow and blue arrows indicate the information flow between stages. Green cells indicate correct values, whereas red cells indicate incorrect values.
The verified parameter set used in this case consisted of three types of information. The first type comprised cross-sectional geometric parameters, including the girder depth, box girder width, flange width and thickness, void dimensions, and chamfer dimensions. These parameters were used to calculate the concrete cross-sectional areas. The second type comprised longitudinal dimensions, such as the hollow-section length and the lengths corresponding to different cross-sectional segments. The third type comprised reinforcement parameters, which were organized using the bar mark, diameter, single-bar length, and number of bars. The three types of parameters provided the structured inputs required by the corresponding concrete and reinforcement checking rules.
For concrete quantity takeoff, the cross-sectional area of each segment was calculated from the verified geometric parameters. The outer section was decomposed into the box-girder body and the cantilever flanges, while the internal void was deducted for hollow segments. Accordingly, the concrete cross-sectional area of the i-th segment can be expressed as
where , , and denote the areas of the box-girder body, cantilever flanges, and internal void, respectively. For a solid segment, was set to zero. When chamfers were present at the corners of the void, the corresponding chamfer areas were excluded from the deducted void area because these regions remained part of the concrete section.
The concrete volume was then calculated by multiplying the cross-sectional area of each segment by its corresponding longitudinal length and summing the volumes of all segments:
where and denote the cross-sectional area and longitudinal length of the i-th segment, respectively, and n denotes the total number of segments. In the representative case, the calculated concrete volume was 702.60 , while the corresponding reference volume was 687.59 , resulting in a relative error of 2.18%. The calculated concrete volume and the resulting relative error were returned as the concrete quantity checking results for further engineering assessment.
For reinforcement checking, the reinforcement information was extracted separately from the reinforcement detail drawings and the corresponding bar schedule. Each reinforcement item was represented using a structured tuple consisting of the bar mark, diameter, single-bar length, and number of bars. The items extracted from the two sources were matched according to their bar marks, after which the remaining fields were compared individually. As shown in Figure 8, inconsistent entries identified through the comparison between reinforcement details and the corresponding bar schedule were automatically highlighted in the checking results, enabling the engineer to locate the inconsistent information directly.
4.2. Discussion of Quantity Error Sources
The results in Table 3 show that the relative errors varied across structural types and between cross-sectional area and concrete volume. These differences were mainly related to the completeness of the geometric information provided in the drawings, the complexity of the structural geometry, and the correspondence between the cross-sectional parameters and longitudinal dimensions. Since the evaluated parameters were verified before calculation, the remaining deviations were mainly associated with geometric simplifications in the predefined rules, local details not fully represented in the parameter schema, and the correspondence between cross-sectional representations and longitudinal segments, rather than with the arithmetic operations themselves.
For the superstructures, the cross-sectional area errors were generally small when the section geometry was regular, and the required dimensions were clearly provided. Larger deviations could occur when local geometric details were shown only in separate detail views or were not fully represented in the primary cross-sectional drawing. Minor features, such as chamfers, local thickening, variations in flange or web dimensions, and other detailed configurations, usually accounted for only a small proportion of the total section but could still produce measurable differences in the calculated area. The concrete volume error was affected not only by the accuracy of the cross-sectional area but also by the correspondence between each section and its applicable longitudinal length. The cross section of a girder does not necessarily remain unchanged along the entire longitudinal direction. End segments, solid and hollow regions, transition zones, local thickening, and variable-depth portions may require different cross-sectional parameters and corresponding segment lengths. Therefore, even when the error of an individual representative section was small, an inaccurate longitudinal segmentation or an incorrect association between a section and its corresponding length could increase the final concrete volume error. This explains why the volume errors reported in Table 3 were not always directly proportional to the corresponding cross-sectional area errors.
For the substructures, major concrete components, such as pile foundations, pier columns, and the main abutment bodies, generally had relatively regular geometries and accounted for most of the total concrete volume. Their quantities could therefore be calculated with comparatively small deviations. In contrast, local components of the abutment, such as the backwall, ear walls, and other small-volume details, had more irregular geometries and depended more strongly on detailed dimensional information. Because the reference quantities of these components were relatively small, even a limited absolute difference could result in a comparatively large component-level relative error. However, their contributions to the total concrete quantity were limited, and the overall volume errors of the pier and abutment cases therefore remained small.
Overall, the quantity errors mainly originated from the incomplete representation of local details, the complexity of cross-sectional geometry, and the mapping between variable sections and their corresponding longitudinal lengths. The results indicate that reliable quantity checking depends not only on recognizing individual dimensions but also on correctly integrating information from multiple drawing views and organizing it into section-specific and segment-specific parameters.
4.3. Role of Human-in-the-Loop Verification in Improving Reliability
The results in Section 3.4 demonstrate the necessity of introducing human-in-the-loop verification before quantity calculation. Although most parameters could be extracted automatically, the initial parameter accuracy was 82.77%, indicating that a portion of the structured inputs still contained recognition errors, missing values, or incorrect parameter associations. Because the subsequent quantity takeoff was performed using deterministic calculation rules, these input errors would not be corrected automatically during the calculation process. Instead, they could be directly propagated to the cross-sectional area and concrete volume results.
The influence of a parameter error depends not only on its numerical deviation but also on its role in the quantity calculation. Errors in key dimensions, such as the girder depth, flange thickness, web thickness, void dimensions, or longitudinal segment length, may affect a relatively large portion of the calculated section or structural segment. Consequently, a single incorrectly recognized key parameter can produce a considerable quantity deviation. This effect is reflected in Table 5, where the concrete volume error of the cast-in-place box girder decreased from 65.24% before verification to 4.98% after verification. The result indicates that correcting influential parameters can substantially improve the final quantity result.
The HITL mechanism does not replace automated information extraction or deterministic quantity calculation. Instead, it introduces engineering supervision at the critical interface between parameter organization and rule execution. Most drawing information is still processed automatically, while engineers verify the organized parameters, particularly those that are uncertain, missing, or influential in the quantity calculation. This arrangement reduces the risk of large quantity errors caused by incorrect inputs and provides a more reliable basis for engineering quantity checking.
4.4. Applicability and Limitations
The proposed framework is applicable to quantity checking tasks in which the required engineering parameters can be extracted from bridge drawings and organized into predefined rule-compatible representations. In the present study, the framework was evaluated on common concrete bridge components, including T-girders, small box girders, hollow-core slabs, cast-in-place box girders, piers, and abutments. It supports concrete quantity takeoff based on geometric and longitudinal parameters, as well as reinforcement information consistency checking through the comparison of reinforcement details and bar schedules. The parameterized rule structure also allows the same workflow to be applied to different structural forms within the currently supported categories.
Nevertheless, the accuracy of the framework remains dependent on the quality and completeness of the input drawings. Dense dimension annotations, overlaps between numerical values and structural lines, low-resolution images, and incomplete local detail views may affect object detection, OCR recognition, and parameter association. In particular, specialized reinforcement symbols, irregular annotation formats, and closely distributed reinforcement information remain challenging for automatic recognition. Although the HITL mechanism can correct these errors before rule execution, poor-quality drawings may increase the amount of manual verification required.
The current quantity calculation rules were developed for the structural types and drawing representations considered in this study. When the framework is applied to new bridge types, special cross-sectional forms, or uncommon local configurations, additional parameter definitions, annotated data, and corresponding calculation rules may be required. Similarly, substantial variations in table layouts or drawing conventions may require adjustment of the table parsing prompts and parameter normalization procedures. Although the current dataset covers six projects and multiple structural forms, all drawings were provided by a single design organization; therefore, further validation using drawings from additional organizations is needed to assess the generalizability of the framework across different drafting conventions.
Based on these limitations, future work will focus on expanding the dataset to include a wider range of projects and drawing sources, improving the recognition of specialized symbols and complex local details, and extending the rule library to additional bridge components and structural forms. Further efforts will also be devoted to reducing the manual verification workload, thereby improving the efficiency of practical deployment while maintaining engineering reliability.
5. Conclusions
This study addresses the methodological problem of converting fragmented information from two-dimensional bridge drawings into reliable inputs for deterministic quantity checking. The methodological novelty lies in combining region-to-parameter drawing perception, agent-orchestrated organization of heterogeneous information, parameter-level human verification, and deterministic engineering rules within a unified and controllable workflow. The principal conclusions are as follows.
1. The task-specific dataset and two-stage YOLO-based detection method provide a region-to-parameter perception mechanism for complex bridge drawings. The dataset contains 1362 drawing images with Stage-I region-level and Stage-II parameter-level annotations. Compared with single-stage detection from complete drawings, the two-stage method increases mAP@0.5 from 0.769 to 0.908, mAP@0.5:0.95 from 0.471 to 0.656, and Recall from 0.664 to 0.792. Separating functional-region localization from parameter detection within cropped structural views reduces interference from unrelated drawing content and preserves local parameter details.
2. The knowledge-driven intelligent agent establishes a structured interface between heterogeneous drawing information and deterministic quantity rules. By coordinating detection, OCR, and table-parsing tools, the agent associates recognized values with parameter types, spatial locations, and bridge components and organizes them into a unified, rule-compatible representation. The OCR and table-parsing tools achieve accuracies of 84.0% and 94.2%, respectively. Across the six evaluated structural types, the final mean concrete volume errors range from 1.21% to 5.84% and are lower than those produced by all three prompt-based large-model baselines. The framework also supports reinforcement information consistency checking based on the organized drawing information.
3. Human-in-the-loop verification provides an error-control mechanism between probabilistic information extraction and deterministic engineering calculation. Verification by bridge design professionals increases parameter accuracy from 82.77% to 100% and reduces the overall mean concrete volume error from 23.94% to 2.98%, with an average verification time of 175 s per drawing set. After approximately 3 h of instruction, the trained students achieve a parameter accuracy of 97.50% and a mean concrete volume error of 5.78%, requiring an average of 238 s per drawing set. These results indicate that domain experience improves verification accuracy and efficiency, while trained users can also substantially reduce errors in automatically generated parameter sets after limited instruction.
The current dataset comprises drawing images from six projects provided by one design organization. The applicability of the framework therefore remains dependent on drawing quality, drawing conventions, supported structural types, and the coverage of the predefined rule library. Future work will validate the framework using drawings from additional organizations and authoring environments, improve the recognition of specialized symbols and complex local details, extend the rule library to additional bridge components and structural forms, and reduce the required manual verification effort.
Author Contributions
Y.L.: Conceptualization, Data curation, Investigation, Methodology, Resources, Validation, Writing—review & editing; B.T.: Conceptualization, Data curation, Formal analysis, Investigation, Methodology, Software, Validation, Visualization, Writing—original draft; Q.L.: Data curation, Validation, Visualization, Writing—review & editing; Y.Z.: Data curation, Methodology, Investigation, Validation, Writing—review & editing; B.L.: Data curation, Validation, Visualization, Writing—review & editing; J.Y.: Data curation, Resources, Validation, Writing—review & editing; X.G.: Data curation, Resources, Validation, Writing—review & editing; W.Q.: Conceptualization, Funding acquisition, Methodology, Project administration, Resources, Supervision, Writing—review & editing; W.C.: Conceptualization, Methodology, Writing—review & editing. All authors have read and agreed to the published version of the manuscript.
Funding
This work was supported by the National Natural Science Foundation of China No. 52408171.
Institutional Review Board Statement
Not applicable.
Informed Consent Statement
Not applicable.
Data Availability Statement
The raw data supporting the conclusions of this article will be made available by the authors on request.
Conflicts of Interest
Authors Yi Li, Qing Liu, Yingce Zhao, Bo Liu, Jiang Yu and Xunkun Gong were employed by the company CCCC Highway Consultants Co., Ltd. The remaining authors declare that the research was conducted in the absence of any commercial or financial relationships that could be construed as a potential conflict of interest.
References
- Alathamneh, S.; Collins, W.; Azhar, S. BIM-based quantity takeoff: Current state and future opportunities. Autom. Constr. 2024, 165, 105549. [Google Scholar] [CrossRef] [Scilit]
- Lee, J.H.; Ji, S.Y.; Ostwald, M.J. Automated compliance checking across the building lifecycle: Systematic and semantic review integrating PRISMA and deep search. Autom. Constr. 2026, 185, 106859. [Google Scholar] [CrossRef] [Scilit]
- Amor, R.; Dimyadi, J. The promise of automated compliance checking. Dev. Built Environ. 2021, 5, 100039. [Google Scholar] [CrossRef] [Scilit]
- Eastman, C.; Lee, J.-M.; Jeong, Y.-S.; Lee, J.-K. Automatic rule-based checking of building designs. Autom. Constr. 2009, 18, 1011–1033. [Google Scholar] [CrossRef] [Scilit]
- Solihin, W.; Eastman, C. Classification of rules for automated BIM rule checking development. Autom. Constr. 2015, 53, 69–82. [Google Scholar] [CrossRef] [Scilit]
- Beach, T.H.; Hippolyte, J.-L.; Rezgui, Y. Towards the adoption of automated regulatory compliance checking in the built environment. Autom. Constr. 2020, 118, 103285. [Google Scholar] [CrossRef] [Scilit]
- Zhang, J.; El-Gohary, N.M. Semantic NLP-based information extraction from construction regulatory documents for automated compliance checking. J. Comput. Civ. Eng. 2016, 30, 04015014. [Google Scholar] [CrossRef] [Scilit]
- Xue, X.; Zhang, J. Part-of-speech tagging of building codes empowered by deep learning and transformational rules. Adv. Eng. Inform. 2021, 47, 101235. [Google Scholar] [CrossRef] [Scilit]
- Xue, X.; Zhang, J. Regulatory information transformation ruleset expansion to support automated building code compliance checking. Autom. Constr. 2022, 138, 104230. [Google Scholar] [CrossRef] [Scilit]
- Zhou, Y.-C.; Zheng, Z.; Lin, J.-R.; Lu, X.-Z. Integrating NLP and context-free grammar for complex rule interpretation towards automated compliance checking. Comput. Ind. 2022, 142, 103746. [Google Scholar] [CrossRef] [Scilit]
- Zhou, P.; El-Gohary, N. Semantic information alignment of BIMs to computer-interpretable regulations using ontologies and deep learning. Adv. Eng. Inform. 2021, 48, 101239. [Google Scholar] [CrossRef] [Scilit]
- Jiang, L.; Shi, J.; Pan, Z.; Wang, C.; Mulatibieke, N. A multiscale modelling approach to support knowledge representation of building codes. Buildings 2022, 12, 1638. [Google Scholar] [CrossRef] [Scilit]
- Zheng, Z.; Zhou, Y.-C.; Lu, X.-Z.; Lin, J.-R. Knowledge-informed semantic alignment and rule interpretation for automated compliance checking. Autom. Constr. 2022, 142, 104524. [Google Scholar] [CrossRef] [Scilit]
- Yang, F.; Zhang, J. Prompt-based automation of building code information transformation for compliance checking. Autom. Constr. 2024, 168, 105817. [Google Scholar] [CrossRef] [Scilit]
- Hettiarachchi, H.; Dridi, A.; Gaber, M.M.; Parsafard, P.; Bocaneala, N.; Breitenfelder, K.; Costa, G.; Hedblom, M.; Juganaru-Mathieu, M.; Mecharnia, T.; et al. CODE-ACCORD: A corpus of building regulatory data for rule generation towards automatic compliance checking. Sci. Data 2025, 12, 170. [Google Scholar] [CrossRef] [Scilit] [PubMed]
- Madireddy, S.; Gao, L.; Din, Z.U.; Kim, K.; Senouci, A.; Han, Z.; Zhang, Y. Large language model-driven code compliance checking in building information modeling. Electronics 2025, 14, 2146. [Google Scholar] [CrossRef] [Scilit]
- Iversen, O.; Huang, L. Leveraging large language models for BIM-based automated compliance checking. Autom. Constr. 2026, 182, 106707. [Google Scholar] [CrossRef] [Scilit]
- Zheng, Z.; Han, J.; Chen, K.-Y.; Cao, X.-Y.; Lu, X.-Z.; Lin, J.-R. Translating regulatory clauses into executable codes for building design checking via large language model-driven function matching and composing. Eng. Appl. Artif. Intell. 2026, 163, 112823. [Google Scholar] [CrossRef] [Scilit]
- Kincelova, K.; Boton, C.; Blanchet, P.; Dagenais, C. Fire safety in tall timber building: A BIM-based automated code-checking approach. Buildings 2020, 10, 121. [Google Scholar] [CrossRef] [Scilit]
- Häußler, M.; Esser, S.; Borrmann, A. Code compliance checking of railway designs by integrating BIM, BPMN and DMN. Autom. Constr. 2021, 121, 103427. [Google Scholar] [CrossRef] [Scilit]
- Villaschi, F.S.; Carvalho, J.P.; Bragança, L. BIM-based method for the verification of building code compliance. Appl. Syst. Innov. 2022, 5, 64. [Google Scholar] [CrossRef] [Scilit]
- Bloch, T.; Borrmann, A.; Pauwels, P. Graph-based learning for automated code checking—Exploring the application of graph neural networks for design review. Adv. Eng. Inform. 2023, 58, 102137. [Google Scholar] [CrossRef] [Scilit]
- Peng, J.; Liu, X. Automated code compliance checking research based on BIM and knowledge graph. Sci. Rep. 2023, 13, 7065. [Google Scholar] [CrossRef] [Scilit] [PubMed]
- Monteiro, A.; Poças Martins, J. A survey on modeling guidelines for quantity takeoff-oriented BIM-based design. Autom. Constr. 2013, 35, 238–253. [Google Scholar] [CrossRef] [Scilit]
- Choi, J.; Kim, H.; Kim, I. Open BIM-based quantity take-off system for schematic estimation of building frame in early design stage. J. Comput. Des. Eng. 2015, 2, 16–25. [Google Scholar] [CrossRef] [Scilit]
- Liu, H.; Lu, M.; Al-Hussein, M. Ontology-based semantic approach for construction-oriented quantity take-off from BIM models in the light-frame building industry. Adv. Eng. Inform. 2016, 30, 190–207. [Google Scholar] [CrossRef] [Scilit]
- Khosakitchalert, C.; Yabuki, N.; Fukuda, T. Improving the accuracy of BIM-based quantity takeoff for compound elements. Autom. Constr. 2019, 106, 102891. [Google Scholar] [CrossRef] [Scilit]
- Liu, H.; Cheng, J.C.P.; Gan, V.J.L.; Zhou, S. A knowledge model-based BIM framework for automatic code-compliant quantity take-off. Autom. Constr. 2022, 133, 104024. [Google Scholar] [CrossRef] [Scilit]
- Valinejadshoubi, M.; Moselhi, O.; Iordanova, I.; Valdivieso, F.; Bagchi, A. Automated system for high-accuracy quantity takeoff using BIM. Autom. Constr. 2024, 157, 105155. [Google Scholar] [CrossRef] [Scilit]
- Zhao, Y.; Deng, X.; Lai, H. A deep learning-based method to detect components from scanned structural drawings for reconstructing 3D models. Appl. Sci. 2020, 10, 2066. [Google Scholar] [CrossRef] [Scilit]
- Zhang, W.; Joseph, J.; Yin, Y.; Xie, L.; Furuhata, T.; Yamakawa, S.; Shimada, K.; Kara, L.B. Component segmentation of engineering drawings using graph convolutional networks. Comput. Ind. 2023, 147, 103885. [Google Scholar] [CrossRef] [Scilit]
- Lin, Y.-H.; Ting, Y.-H.; Huang, Y.-C.; Cheng, K.-L.; Jong, W.-R. Integration of deep learning for automatic recognition of 2D engineering drawings. Machines 2023, 11, 802. [Google Scholar] [CrossRef] [Scilit]
- Schönfelder, P.; Stebel, F.; Andreou, N.; König, M. Deep learning-based text detection and recognition on architectural floor plans. Autom. Constr. 2024, 157, 105156. [Google Scholar] [CrossRef] [Scilit]
- Sapkota, R.; Cheppally, R.H.; Sharda, A.; Karkee, M. YOLO26: Key architectural enhancements and performance benchmarking for real-time object detection. arXiv 2025, arXiv:2509.25164. [Google Scholar] [CrossRef] [Scilit]
- Yang, A.; Li, A.; Yang, B.; Zhang, B.; Hui, B.; Zheng, B.; Yu, B.; Gao, C.; Huang, C.; Lv, C.; et al. Qwen3 technical report. arXiv 2025, arXiv:2505.09388. [Google Scholar] [CrossRef] [Scilit]
- Wei, H.; Sun, Y.; Li, Y. DeepSeek-OCR 2: Visual causal flow. arXiv 2026, arXiv:2601.20552. [Google Scholar] [CrossRef] [Scilit]
- Gemma Team. Gemma 3 technical report. arXiv 2025, arXiv:2503.19786. [Google Scholar] [CrossRef] [Scilit]
- Zhu, J.; Wang, W.; Chen, Z.; Liu, Z.; Ye, S.; Gu, L.; Tian, H.; Duan, Y.; Su, W.; Shao, J.; et al. InternVL3: Exploring advanced training and test-time recipes for open-source multimodal models. arXiv 2025, arXiv:2504.10479. [Google Scholar] [CrossRef] [Scilit]

Disclaimer/Publisher’s Note: The statements, opinions and data contained in all publications are solely those of the individual author(s) and contributor(s) and not of MDPI and/or the editor(s). MDPI and/or the editor(s) disclaim responsibility for any injury to people or property resulting from any ideas, methods, instructions or products referred to in the content. |
© 2026 by the authors. Licensee MDPI, Basel, Switzerland. This article is an open access article distributed under the terms and conditions of the Creative Commons Attribution (CC BY) license.