


Featured Application
The proposed methodology provides a practical framework for personalized athlete monitoring by combining HRV analysis, multivariate statistics, and physiological profiling. It allows for the identification and longitudinal tracking of individual autonomic response patterns. This can support personalized training prescription, fatigue monitoring, and recovery assessment. The framework can be the basis for future integration with wearable sensor platforms and AI-based sports analytics systems for real-time physiological monitoring and decision support.
Abstract
Heart rate variability (HRV) is a noninvasive marker of cardiac autonomic regulation, suitable for use in monitoring training adaptation and recovery in athletes. Group-level analyses may mask significant interindividual variability in responses to the same training stimulus if changes are divergent. This study investigated whether competitive wrestlers exposed to a standardized training protocol exhibit different multivariate patterns of cardiac autonomic response. Their evolution during a four-month training period was also investigated. Holter recordings were obtained before and immediately after training, with assessments performed at five measurement points. Temporal, frequency, nonlinear, and fractal parameters of HRV were analyzed. Individual percent changes before and after training were assessed using inferential and correlation analysis, principal component analysis (PCA), and hierarchical clustering. Two distinct physiological response profiles were identified. The predominant profile (Profile A, n = 55) is characterized by increased heart rate and decreases in RMSSD, SDNN, SampEn, and other vagally mediated HRV indices. A smaller subgroup (Profile B, n = 10) shows the opposite response pattern with preserved or increased variability. The profiles are differentiated by changes in RMSSD, SDNN, and LF/HF. The first two principal components explain 80.53% of the total variance, providing a low-dimensional representation of the multivariate response structure. Hierarchical clustering and cluster quality measures indicate separation of the two response patterns in the current cohort, and as such these analyses do not represent an independent validation of cluster stability. Longitudinal assessment shows that contrasting profile-specific directions of response remain distinguishable during the four-month training period. The magnitude of several acute HRV responses is observed to change over time. Wrestlers exposed to comparable training conditions may exhibit different cardiac autonomic responses. These findings support further investigation of longitudinal multivariate HRV profiling for characterizing interindividual cardiac autonomic responses in athletes. Its potential application to individualized athlete monitoring requires further validation against recovery, fatigue, training load, and performance outcomes.
1. Introduction
Regular physical training induces cardiovascular, metabolic, and autonomic adaptations that are essential for athletic performance. In competitive sport, however, successful adaptation depends on maintaining an appropriate balance between training stimulus and recovery. Repeated workloads exceeding an athlete’s adaptive capacity may contribute to accumulated fatigue, impaired recovery, non-functional overreaching, and reduced performance. Athlete monitoring should consider external workload together with individual internal physiological responses, recovery status, and longitudinal changes [1,2].
Heart rate variability (HRV) is a widely used non-invasive marker of cardiac autonomic regulation and has become increasingly relevant for monitoring training adaptation, fatigue, and recovery. HRV can be characterized using time-domain indices such as SDNN, RMSSD, and pNN50; frequency-domain measures including LF, HF, and LF/HF; Poincaré indices such as SD1 and SD2; and nonlinear and fractal measures describing signal complexity and temporal organization [3]. These domains provide complementary information [3,4] about cardiac rhythm dynamics and autonomic regulation, although the physiological interpretation of individual indices, particularly LF/HF, requires caution. A multidomain HRV assessment may therefore provide a more comprehensive representation of exercise-induced autonomic changes than heart rate or individual HRV parameters considered in isolation.
HRV monitoring is particularly valuable because training adaptation is characterized by considerable inter-individual variability. Plews et al. [5] emphasized that HRV responses in highly trained athletes should be interpreted individually, as both increases and decreases in vagally mediated indices may reflect different forms of training adaptation depending on the athlete and the training context. Bellenger et al. [6], in a systematic review and meta-analysis, similarly demonstrated that autonomic HR-derived indices can provide useful information regarding changes in athletic training status but should be interpreted together with the broader physiological and training context. The practical value of individualized HRV monitoring has also been demonstrated experimentally; Vesterinen et al. [7] reported that daily HRV-guided training allowed the timing of higher-intensity sessions to be individualized and was associated with favorable endurance adaptations. These findings indicate that HRV should be interpreted relative to an athlete’s individual baseline, training history, and longitudinal response rather than exclusively through group-average changes. Accordingly, the following research hypothesis can be formulated: athletes exposed to comparable training conditions would exhibit heterogeneous, distinguishable multivariate patterns of cardiac autonomic response, rather than a uniform response at the group level.
Acute intensive exercise is generally associated with increased heart rate and transient suppression of vagally mediated HRV, followed by progressive parasympathetic reactivation during recovery. The magnitude and duration of this response vary according to exercise characteristics, training status, and measurement conditions [8,9,10]. This variability highlights the importance of standardized recording conditions and individualized interpretation of post-exercise HRV responses.
These considerations are particularly relevant in wrestling, where high-intensity efforts and short recovery intervals impose substantial physiological demands. Previous studies in wrestlers have demonstrated the relevance of HRV for assessing non-functional overreaching, differences in post-exercise autonomic recovery associated with training status, and autonomic responses to rapid weight loss combined with high-intensity exercise [11,12,13].
Recent studies have also provided important evidence regarding both acute and longitudinal HRV responses in Greco-Roman wrestlers. Demirkıran et al. [14] examined 13 elite male wrestlers exposed to high-intensity interval and prolonged endurance training and reported marked reductions in SDNN and RMSSD during exercise, followed by partial autonomic recovery, demonstrating the sensitivity of HRV to different wrestling-conditioning sessions. In a longitudinal investigation, Demirkıran et al. [15] followed elite Greco-Roman wrestlers after 14 weeks of training cessation and during an eight-week retraining and competition period, demonstrating dynamic changes in HRV and physiological status across different phases of the training cycle. Together, these studies indicate that autonomic regulation in wrestlers is influenced by acute training, training status, weight-management practices, recovery, and longer-term changes in training exposure [11,12,13,14,15].
Most previous wrestling studies have focused predominantly on group-average changes, associations with training status, or selected conventional HRV indices. Such analyses may adequately characterize the predominant response while concealing athletes who exhibit little change or even responses in the opposite direction. Importantly, an atypical HRV response should not automatically be interpreted as either beneficial or adverse, because it may reflect differences in baseline autonomic status, previous workload, recovery kinetics, training history, or individual responsiveness [5,6,11,12]. Consequently, statistically significant group-level changes do not necessarily describe the physiological behavior of every athlete, and athletes exposed to comparable training stimuli may exhibit distinct response patterns that remain hidden by conventional averaging.
Multivariate analysis provides an appropriate framework for investigating this heterogeneity. Principal component analysis (PCA) can reduce correlated time-, frequency-, nonlinear-, and fractal-domain HRV measures to a smaller number of components representing dominant patterns of physiological variation, while unsupervised clustering can identify athletes exhibiting similar multidimensional responses without imposing predefined physiological labels. This is particularly relevant for HRV because several indices [3,16] are strongly interrelated, whereas entropy and fractal measures provide complementary information regarding the organization and complexity of RR-interval dynamics.
Recent studies in endurance, strength, and conditioning have demonstrated significant interindividual variability and recommend interpreting HRV in relation to individual baseline values, repeated measurements, and additional recovery measures [17,18]. Similar heterogeneity in HRV responses has been reported in other sports, limiting the interpretation of isolated measurements [19]. Longitudinal studies suggest that changes in HRV may accompany variations in training preparation and may not always correlate with competitive performance [20]. Individualized models integrating HRV with training, sleep, diet, and subjective recovery have demonstrated athlete-specific patterns in daily recovery [21]. HRV should be interpreted in the broader physiological and training context, rather than as an isolated diagnostic marker [22]. Longitudinal assessment of HRV should be evaluated in relation to adaptation to training and recovery [23] and integrated with recovery and performance measures [24].
These works support the multidimensional monitoring of athletes. Combining vagally mediated HRV with resting heart rate and subjective well-being may provide a more informative assessment than relying on a single physiological index [25]. Current approaches favor frameworks that integrate physiological, sport-specific, and contextual information [26,27], including measures of sleep and overnight recovery related to training load and adaptation to performance [28]. This provides further rationale for investigating coordinated multivariate HRV responses and their longitudinal evolution.
Despite the increasing use of HRV to monitor wrestlers, several specific gaps remain. Previous studies have primarily examined group-level changes in individual HRV indices or the relationships between HRV, training status, exercise type, and recovery. Limited attention has been paid to whether wrestlers exposed to comparable training conditions exhibit different multivariate patterns of acute autonomic response. It remains unclear whether these individual response patterns are transient characteristics of a single training session or remain distinguishable across multiple assessments over a longer training period. The combined use of exercise-induced relative changes in HRV, multivariate dimensionality reduction, uncontrolled physiological profiling, and multiple longitudinal assessments has not been systematically investigated in competitive wrestlers (as far as can be determined from the literature review).
The primary aim of this study was to determine whether competitive wrestlers exposed to comparable training conditions exhibit distinguishable multivariate patterns of acute cardiac autonomic response rather than a uniform group response. As an exploratory secondary analysis, the descriptive evolution of these response patterns was examined across five repeated assessments performed during a four-month training period. PCA and hierarchical clustering were used as complementary multivariate methods for identifying and characterizing these response patterns.
2. Materials and Methods
2.1. Study Design and Participants
A paired pre–post observational design was used to evaluate the acute autonomic response of competitive wrestlers to a standardized training session. The final sample included 65 wrestlers, each of whom underwent two Holter (TLC9803, Contec Medical Systems Co., Ltd., Qinhuangdao, China) measurements: one before the beginning of the training session and one immediately after its completion. Thus, the real dataset comprised 130 recordings and 65 paired observations in one day. Such recordings were made a total of 5 times within 4 months. The mean age of the participants was 20.4 (2.6 sd), body mass: 79.4 ± 6.2 kg, and height: 179.3 ± 6.1 cm.
All participants completed the same training protocol under comparable conditions. Athletes were instructed to avoid additional strenuous exercise before the measurements and to maintain their usual hydration and nutritional routines. Two types of recordings were performed: one 10 min Holter recording immediately before training (Rest) and one 10 min Holter recording immediately after training (Exercise). A three-channel wearable Holter device was used. Recordings were performed in the gym with the participants in a sitting position, and they had not previously performed any other training activities. Participants were asked to avoid exercise for 12 h and caffeine, alcohol, and stimulants for 8 h before each experimental session. Recordings were obtained under standardized body-position and environmental conditions to reduce the influence of posture, breathing, temperature, and measurement timing on HRV.
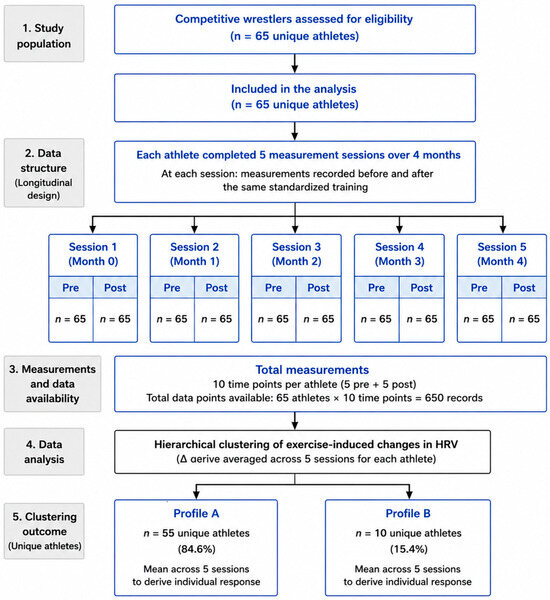
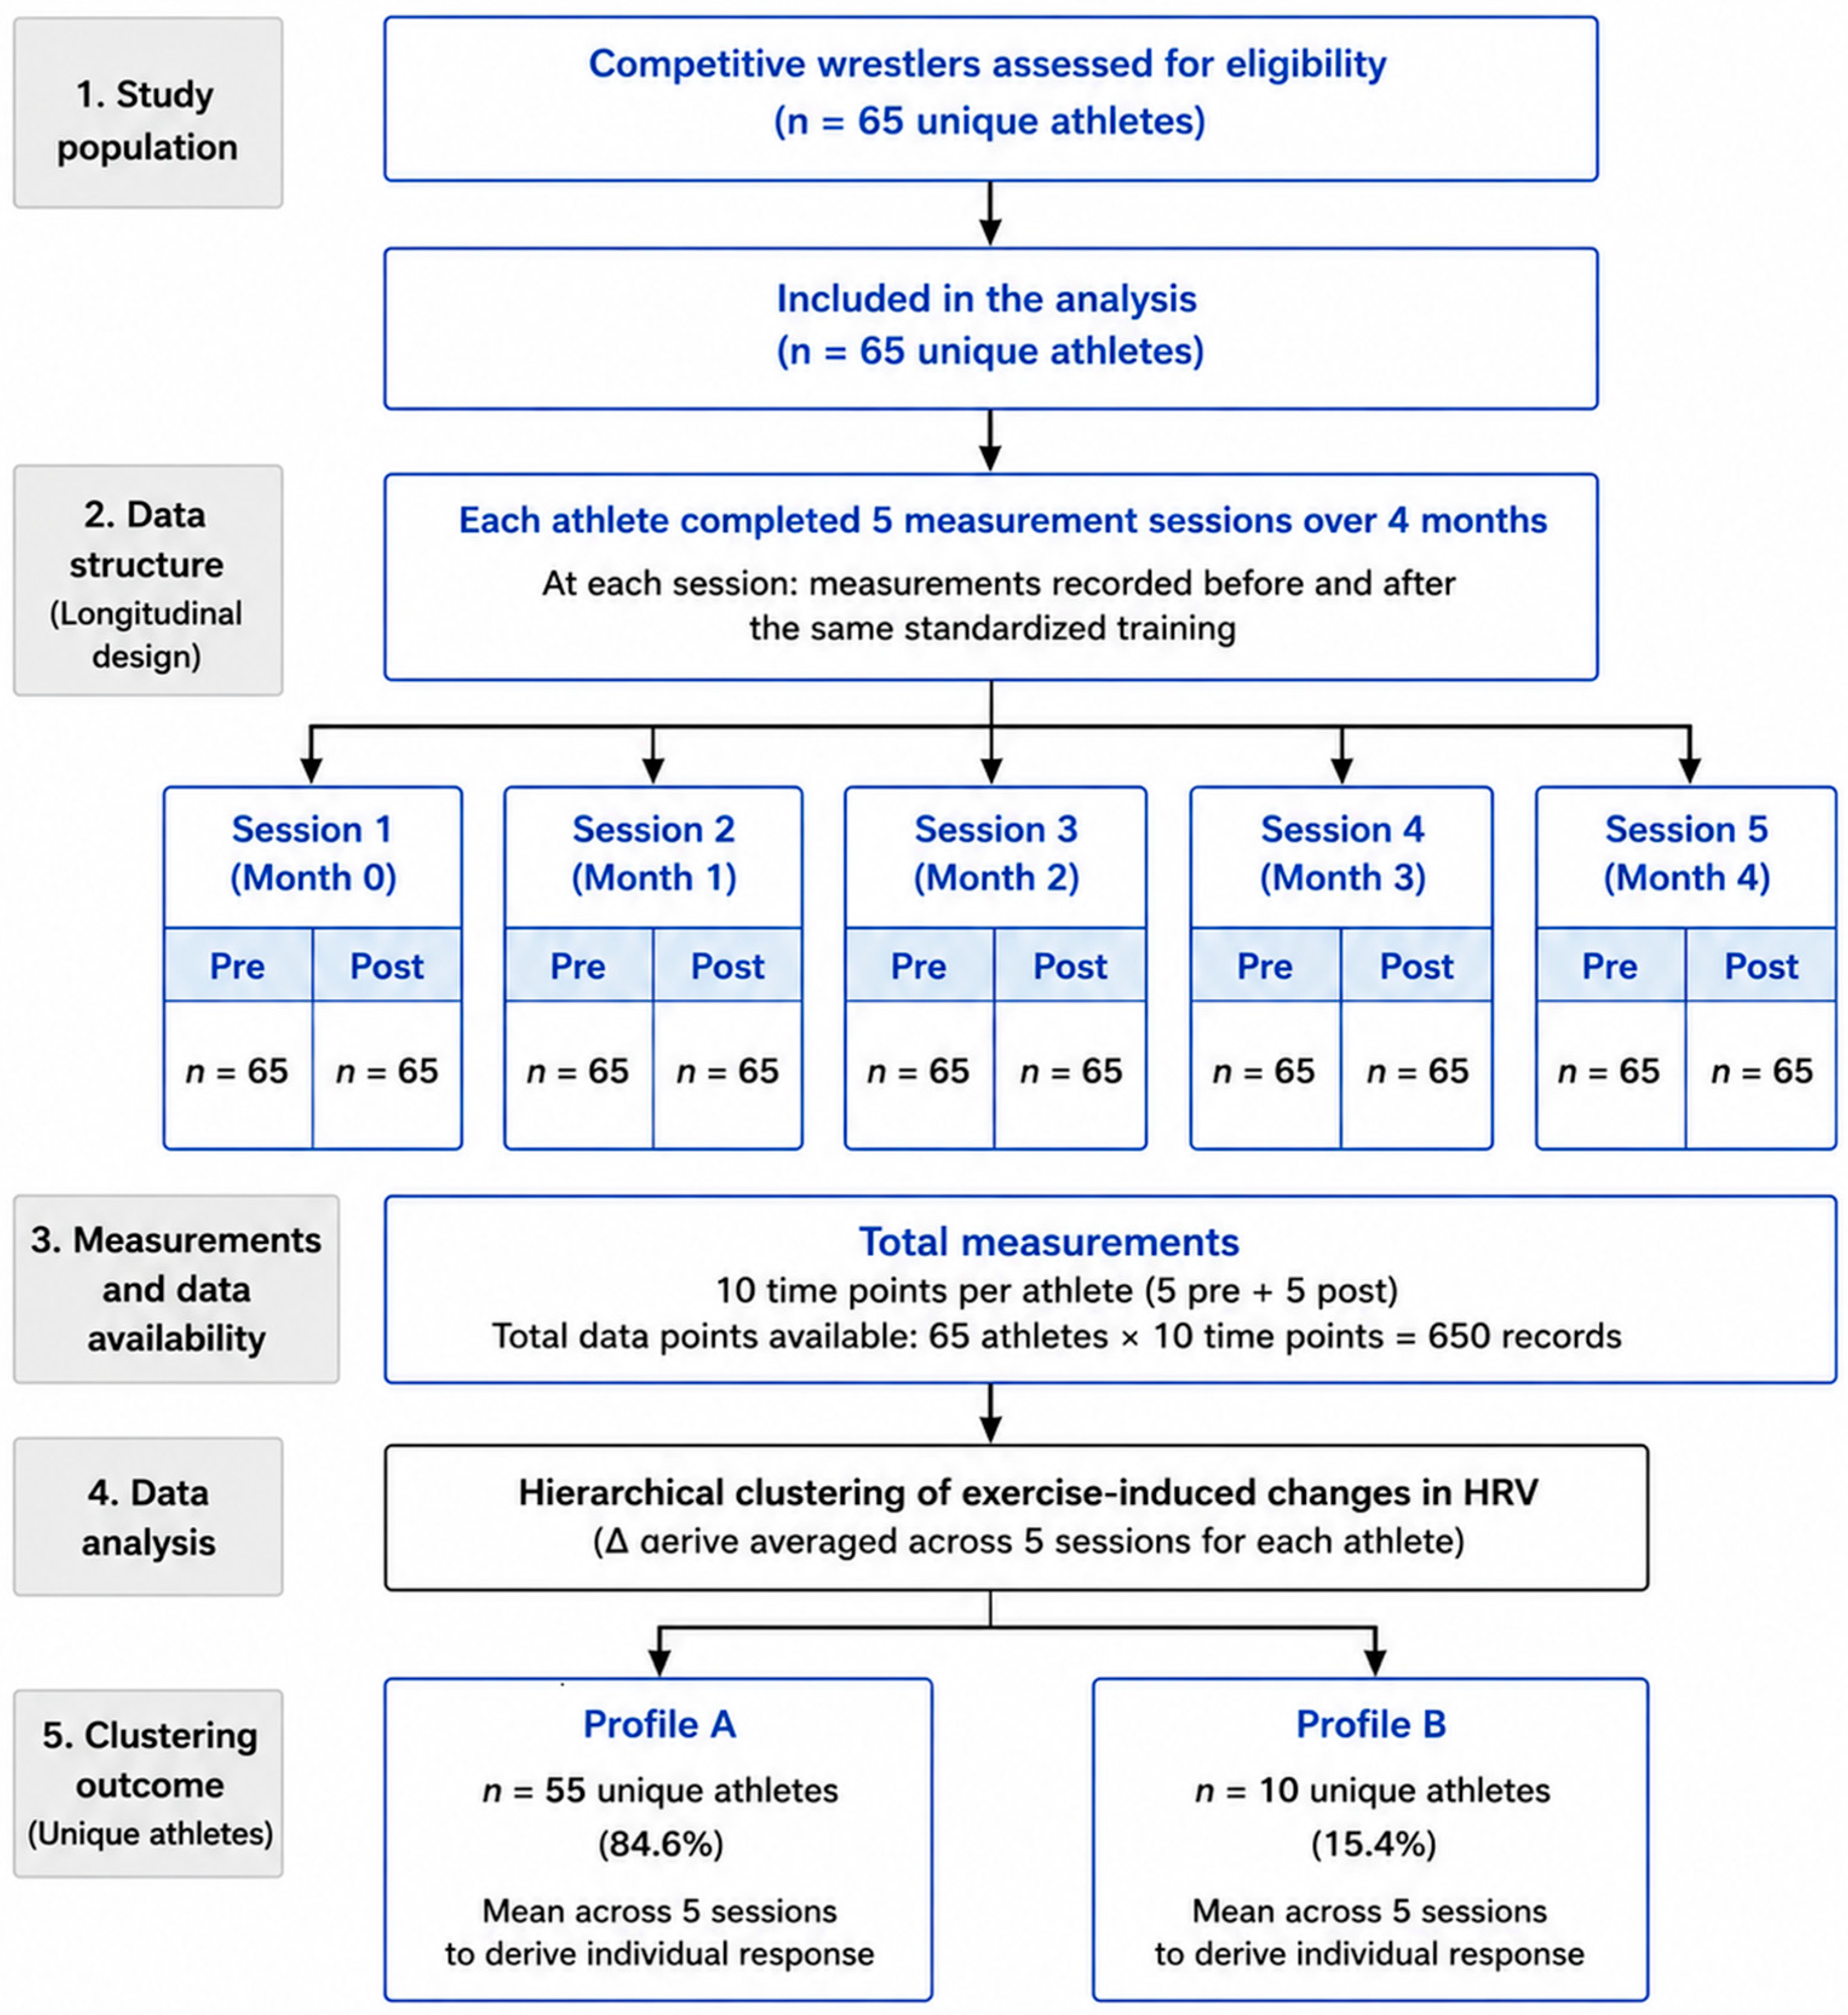
The study population, longitudinal measurement design, data availability at each time point, and distribution of unique athletes between the identified response profiles are summarized in Figure 1.
Figure 1.
Study population and longitudinal data structure across the four-month observation period.
The study included 65 unique wrestlers. At each of the five assessment points, each participant contributed one Pre and one Post recording (130 recordings per assessment point; 650 recordings in total).
2.2. Training Protocol
All wrestlers completed a standardized training session that developed the physical, technical, and tactical skills required for competitive wrestling. All athletes completed the same general training structure under the supervision of qualified wrestling coaches.
Each session began with a standardized 10–15 min warm-up that included light jogging, jumping rope, dynamic stretching, and mobility exercises targeting the shoulders, hips, knees, and ankles. The goal of this phase was to progressively increase cardiovascular activity, muscle temperature, and joint mobility prior to the main load.
The general conditioning phase (approximately 45–60 min) combined sustained moderate-intensity exercise with high-intensity interval activities. The moderate-intensity components included running, bodyweight exercises, coordination exercises, and resistance exercises. These exercises were alternated with high-intensity circuit blocks. The interval components included short sprints with changes in direction, hurdles, squat jumps, push-ups, medicine ball exercises, rope exercises, and explosive partner wrestling drills. Short recovery intervals of approximately 30 s were included between the high-intensity bouts to replicate the intermittent nature of competitive wrestling.
The warm-up phase was followed by approximately 60 min of wrestling-specific training on the mat. This component included repeated execution of wrestling techniques, holds, throws, takedowns, counterattacks, and partner training. The intensity of the exercises varied between moderate and high levels depending on the specific task, allowing the session to replicate the alternating periods of intense effort and partial recovery typical of wrestling competitions.
A subsequent technical and tactical component (approximately 30 min) focused on the precision and execution of techniques, tactical combinations, counterattacks, and competition-specific scenarios. This was followed by 20 min of controlled sparring and simulated competitive matches, during which the athletes applied the practiced technical and tactical elements under progressively increasing physiological and competitive demands.
Each session ended with approximately 10 min of cool-down and recovery, including low-intensity activity, static stretching, controlled breathing, and relaxation exercises.
The protocol was designed to provide the training stimulus necessary for competitive wrestlers to prepare, while maintaining comparable training conditions for all participants. The physiological profiles analyzed in the present study were not predefined according to the type of training; all wrestlers were subjected to the same general training protocol and response profiles were subsequently identified from their individual multivariate HRV responses to the training.
2.3. Measurement Parameters
Heart rate variability was characterized using a multidomain set of parameters describing complementary aspects of cardiac autonomic regulation and RR-interval dynamics. Selected measures included heart rate and conventional time- and frequency-domain indices of HRV, along with Poincaré plots, entropy-based, and fractal measures.
Heart rate (HR) was expressed in beats per minute (bpm) and represented the average heart rate during the analyzed recording period.
Time-domain analysis included the standard deviation of normal RR intervals (SDNN), the root mean square difference in consecutive RR intervals (RMSSD), and the percentage of consecutive normal RR intervals differing by more than 50 ms (pNN50). SDNN (ms) represents the total variability of normal RR intervals during the analyzed period and reflects the combined influence of multiple mechanisms contributing to heart rate modulation. RMSSD (ms) quantifies short-term beat-to-beat variability and is primarily associated with parasympathetic (vagal) cardiac modulation. pNN50 (%) provides another measure of short-term variability by quantifying the proportion of consecutive normal RR intervals that differ by more than 50 ms and is also primarily associated with vagally mediated modulation. Thus, RMSSD and pNN50 are used to assess acute autonomic responses and parasympathetic reactivation after exercise.
Frequency domain analysis includes low-frequency power (LF), high-frequency power (HF), and the LF/HF ratio. LF (ms2) represents spectral power in the low-frequency range, conventionally defined as 0.04–0.15 Hz. LF is influenced by several regulatory mechanisms and should not be interpreted as a direct or exclusive measure of sympathetic activity. HF (ms2) represents power in the high-frequency range (0.15–0.40 Hz) and is closely related to respiratory vagal modulation of heart rate. The LF/HF ratio describes the relative distribution of spectral power between the LF and HF components and is an index of the relative spectral organization of HRV.
Nonlinear analysis includes the Poincaré plot indices SD1 and SD2. The Poincaré plot represents each RR interval as a function of the previous interval and provides a geometric description of the beat-to-beat dynamics. SD1 (ms) quantifies the dispersion of points perpendicular to the identity line and represents short-term variability. It is closely related to RMSSD and reflects primarily rapid vagally mediated changes in heart rate. SD2 (ms) represents the dispersion along the identity line and describes long-term variability in the analyzed RR sequence. Simultaneous estimation of SD1 and SD2 provides information on both the short-term and long-term components of RR-interval dynamics.
The sample entropy (SampEn) was used to quantify the irregularity and complexity of the RR-interval series. SampEn estimates the probability that similar patterns in a time series will remain similar as their length increases. Lower values indicate a more regular and predictable signal, while higher values indicate greater irregularity and complexity. SampEn complements conventional HRV indices by characterizing changes in the organization of the heart rhythm that cannot be fully described by the magnitude of variability alone.
The fractal properties of the RR-interval series were assessed using detrended fluctuation analysis (DFA). DFA α1 characterizes short-term fractal correlations, while DFA α2 describes long-term correlation properties. The values of the scaling exponent provide information about the temporal organization and self-similarity of heart rate fluctuations. DFA α1 is an important estimate because changes in the short-term correlation structure can accompany changes in autonomic regulation and exercise intensity. The DFA parameters describe the structural organization of the RR fluctuations, not just their absolute magnitude.
The Hurst exponent (H) was calculated as a measure of long-term dependence and persistence in the RR-interval time series. Values around 0.5 indicate behavior approaching an uncorrelated process, values above 0.5 indicate persistent temporal correlations, and values below 0.5 indicate anti-persistent behavior. The Hurst index represents a characterization of the long-term temporal organization of cardiac dynamics.
The final set of physiological features (Table 1) included 13 parameters: HR, SDNN, RMSSD, pNN50, LF, HF, LF/HF, SD1, SD2, SampEn, DFA α1, DFA α2, and the Hurst exponent. Conventional time-domain and frequency-domain indices quantified the magnitude and spectral distribution of HRV, while Poincaré measures, entropy, and fractal measures characterized complementary aspects of short-term variability, complexity, and temporal organization. The combined feature set was subsequently used to assess changes before and after exercise and to identify multivariate profiles of physiological response.
Table 1.
HRV Parameters and Physiological Interpretation.
2.4. ECG Acquisition and RR-Interval Extraction
R peaks were detected from the ECG signals, and consecutive normal-to-normal (NN) intervals were extracted and converted to milliseconds for subsequent HRV analysis. Signal quality was assessed for each recording based on the total number of detected intervals, effective recording duration, presence of invalid or non-numeric values, and the number and percentage of intervals requiring correction. Recordings with insufficient valid NN intervals or excessive artifacts were excluded from further analysis. Following quality control and artifact correction, only physiologically valid NN intervals were retained for calculation of the time-, frequency-, nonlinear-, and fractal-domain HRV parameters.
2.5. RR-Interval Preprocessing and Quality Control
A preprocessing procedure was applied to all recordings to reduce the influence of ectopic beats, missed or falsely detected R peaks, and motion-related artifacts. RR intervals shorter than 0.25 s or longer than 2.50 s were classified as physiologically implausible. For each RR interval, the median value within an 11-beat moving window centered on the corresponding interval was calculated. An RR interval was classified as an artifact when its relative deviation from the local median exceeded 20%, according to:
where denotes the examined RR interval and represents the median of the corresponding local window. The 20% threshold was selected as a practical criterion to identify abrupt local deviations while preserving physiological beat-to-beat variability. Intervals identified as artifacts were corrected by linear interpolation between the nearest valid neighboring intervals.
The proportion of corrected intervals was calculated separately for each record. Records in which more than 5% of the RR intervals required correction were flagged for further quality review, allowing signal quality assessment without unnecessary loss of potentially valid records.
2.6. Calculation of Individual Exercise-Induced Changes
To account for inter-individual differences in baseline HRV, the acute response to training was additionally quantified as the relative percentage change between the pre- and post-training measurements:
where and denote the value of the respective parameter before and immediately after training. Positive values indicate an increase after training, whereas negative values indicate a reduction. Relative changes were calculated individually for the analyzed HRV parameters and were used to characterize the magnitude and direction of the acute exercise-induced response. For multivariate physiological profiling, a reduced feature set was selected following the initial statistical assessment of the exercise-induced parameter changes. The selection was based on physiological complementarity across different aspects of the cardiac autonomic response and on limiting redundancy among strongly interrelated HRV indices. ΔHR, ΔRMSSD, ΔSDNN, ΔLF/HF, and ΔSampEn were retained, representing the overall cardiovascular response, short-term vagally mediated variability, overall HRV, relative spectral distribution, and nonlinear complexity. These variables were subsequently used as input for principal component analysis (PCA) and subsequent hierarchical clustering. The feature selection was therefore not based solely on statistical significance, but also on physiological complementarity and the reduction in redundancy among correlated HRV measures.
2.7. Descriptive and Inferential Statistical Analysis
Descriptive statistics were calculated separately for pre- and post-exercise measurements. Data were expressed as mean ± standard deviation (SD) or median and interquartile range (IQR), as appropriate. Normality of distributions and paired differences before and after exercise were assessed using the Shapiro–Wilk test. Most HRV parameters were found not to meet the assumption of normality, so pre- and post-exercise comparisons were primarily performed using the two-tailed Wilcoxon signed-rank test. Variables with normally distributed paired differences (SampEn and Hurst exponent) were analyzed using Student’s t-test for paired differences. Statistical significance was set at p < 0.05. For Wilcoxon comparisons, the effect size was calculated as:
where Z is the standardized Wilcoxon statistic and N is the number of non-zero paired differences. For paired t-tests, Cohen’s was calculated as
where and denote the mean and standard deviation of the paired differences.
Associations between exercise-induced relative changes were assessed using Spearman’s rank correlation coefficient (ρ). The correlation analysis included ΔHR, ΔRMSSD, ΔSDNN, ΔLF/HF, ΔSampEn, and ΔDFA α1. Spearman correlation was selected because of the limited sample size and non-normal distribution of several variables. Statistical significance was defined as p < 0.05, with significant correlations indicated in the correlation matrix as * p < 0.05, ** p < 0.01, and *** p < 0.001. SD1 was excluded from the correlation matrix because of its deterministic mathematical relationship with RMSSD, which produces an expected near-perfect correlation and therefore provides little independent information in this analysis.
2.8. Principal Component Analysis
Principal component analysis (PCA) was applied to characterize the multivariate organization of individual autonomic responses and reduce the dimensionality of the exercise-induced percentage-change data. The analysis included five variables: ΔHR, ΔRMSSD, ΔSDNN, ΔLF/HF, and ΔsampEn, selected to represent different aspects of the cardiovascular and autonomic response while limiting redundancy among strongly related HRV indices. Each wrestler contributed one individual vector containing the five exercise-induced percentage changes; therefore, the individual wrestler (n = 65), rather than the individual Holter recording, represented the unit of analysis.
Before PCA, all variables were standardized using Z-score normalization:
where represents the value of variable j for athlete i; and denote its mean and standard deviation of variable j, respectively. Standardization was applied because the selected variables differed substantially in their numerical ranges and variability, ensuring that no individual parameter disproportionately influenced the PCA solution because of its scale. PCA was subsequently performed on the standardized variables.
Principal components were ordered according to the proportion of total variance explained. The first two principal components were retained for visualization and interpretation of the multivariate response structure. Individual participant scores in the PC1–PC2 space were used to visualize the organization and separation of autonomic response patterns, whereas component loadings were examined to determine the relative contribution of the original HRV variables to each principal component. PCA was used to characterize and visualize the multivariate response structure and was not itself used to assign athletes to physiological response profiles.
Hierarchical agglomerative clustering was performed using the same standardized five-variable feature set used for PCA. Euclidean distance was used to quantify dissimilarity between individual response vectors, and Ward’s linkage criterion was applied to minimize the increase in within-cluster variance at each successive merging step. The resulting hierarchical structure was visualized using a dendrogram. The final two-cluster solution was selected based on the dendrogram structure and the physiological interpretability of the resulting response patterns. The clusters were subsequently characterized according to their mean exercise-induced changes and designated Profile A and Profile B. PCA was used as a complementary visualization of the multivariate structure and was not used to generate the cluster labels.
Cluster quality was evaluated using the silhouette coefficient, which quantifies the cohesion of observations within their assigned cluster relative to their separation from the alternative cluster. The silhouette coefficient was calculated for the final two-cluster solution to assess the degree of separation and internal consistency of the identified physiological response profiles.
Prior to PCA, sampling adequacy and factorability of the correlation matrix were evaluated using the Kaiser–Meyer–Olkin (KMO) measure and Bartlett’s test of sphericity.
The first two principal components were retained for visualization and interpretation of the multivariate response structure. Component loadings were examined to identify the HRV variables contributing most strongly to the observed variation and separation between individual responses. Component retention was assessed using eigenvalues, visual inspection of the scree, and parallel analysis based on 10,000 random data sets of equal size. The first two principal components can be retained for two-dimensional visualization and descriptive representation of the multivariate response structure if they together account for a significant portion of the total variance.
PCA and hierarchical clustering were performed using the individual Pre–Post changes obtained at the initial measurement session only (n = 65 independent wrestlers); repeated measurements from the subsequent four assessment points were not pooled in these analyses. The profile assignments obtained from this initial analysis were retained as baseline labels for the subsequent longitudinal analyses; athletes were not independently reclassified at each of the four subsequent assessment points.
The stability of the selected two-cluster solution was additionally assessed using 1000 bootstrap resamples. For each resample, the five response variables were re-standardized and Ward hierarchical clustering with k = 2 was repeated. Cluster stability was quantified using the Jaccard similarity between the original and bootstrap-derived clusters, with the best-matching bootstrap cluster identified for each original profile.
Potential multivariate outliers were assessed using squared Mahalanobis distance, with the χ2 critical value for five degrees of freedom at α = 0.05 (χ2 = 11.07) used as the threshold. In addition, a leave-one-out sensitivity analysis was performed by sequentially excluding each participant and repeating the PCA to assess the influence of individual observations on the component structure.
2.9. Identification of Physiological Response Profiles
Physiological response profiles were identified by hierarchical clustering (based on exercise-induced changes in HRV). Clustering was performed using standardized percent change variables (ΔHR, ΔRMSSD, ΔSDNN, ΔLF/HF, and ΔSampEn) corresponding to the feature set used in PCA. The score plot from this method was used to visualize the cluster assignments obtained from hierarchical clustering, while cluster validity was evaluated separately using the Silhouette, Davies–Bouldin, and Calinski–Harabasz indices. The separation and stability of the clusters were assessed using the silhouette coefficient, the Davis-Bullen index, and the Kalinsky-Harabash index. The cumulative explained variance of the first two principal components (PC1 and PC2) was used to assess the preservation of the dominant multivariate structure.
Long-term adaptation to training was assessed by comparing HRV measurements obtained at baseline with recordings collected after the four-month training period. Changes in selected parameters in the time, frequency, nonlinear, and fractal domains were assessed separately for the identified physiological response profiles. Longitudinal analysis was used to determine whether initial profile-specific autonomic response patterns were maintained or changed during the training period.
All statistical and multivariate analyses were performed in Python 3.13 using standard scientific computing libraries, including NumPy, pandas, SciPy, scikit-learn, Matplotlib 3.10.0, and Seaborn 0.13.2.
The study was approved by the Ethics Committee of the Institute of Robotics-BAS. In accordance with the requirements of the Declaration of Helsinki, participants were informed about the aims of the study and signed an informed consent to participate.
3. Results
3.1. Acute Pre–Post Training Changes in HRV
The acute response to the training session was characterized by an overall decrease in heart rate variability, accompanied by an increase in heart rate. The most pronounced changes were observed (Table 2) in indices reflecting short-term beat-to-beat variability. RMSSD, pNN50 and SD1 decreased significantly after exercise (all p < 0.01), while SDNN and SD2 also showed significant decreases, indicating a consistent decline in both short-term and overall HRV. Heart rate increased from pre- to post-exercise measurements, consistent with the cardiovascular response to the exercise. Frequency-domain parameters also changed after exercise, with a decrease in the absolute power of LF and HF. LF/HF increased descriptively, but this change did not reach statistical significance (IBM SPSS Statistics, 24.0).
Table 2.
Comparison of pre- and post-training HRV parameters in wrestlers (n = 65).
Nonlinear and fractal indices showed a more heterogeneous response. SampEn decreased significantly after exercise, due to a change in the complexity of the RR-interval dynamics. The changes in DFA α1, DFA α2 and the Hurst exponent were relatively small and did not reach statistical significance. The results at the group level showed a predominant decrease in HRV parameters after training; the magnitude and, for several parameters, the direction of change varied significantly between individual wrestlers. This interindividual variability motivated the subsequent analysis of individual percentage changes and the identification of different physiological response profiles.
Significant Pre–Post changes (with IBM SPSS Statistics, 24.0) were observed in HR (p = 0.003, r = 0.37), SDNN (p = 0.049, r = 0.33), RMSSD (p = 0.006, r = 0.34), pNN50 (p < 0.001, r = 0.43), LF (p = 0.006, r = 0.35), HF (p < 0.001, r = 0.48), SD1 (p = 0.006, r = 0.34), SD2 (p = 0.031, r = 0.16), and SampEn (p < 0.001, Cohen’s d = −0.61). LF/HF, DFA α1, DFA α2, and H did not show statistically significant Pre–Post changes (p > 0.05).
The non-significant changes in LF/HF and the fractal indices were accompanied by relatively small effect sizes and may reflect substantial interindividual variability. Limited statistical power to detect small effects should also be considered when interpreting these findings.
The raw baseline Holter files containing the athlete data can be viewed in the Supplementary Materials.
3.2. Individual Variability in Exercise-Induced Responses
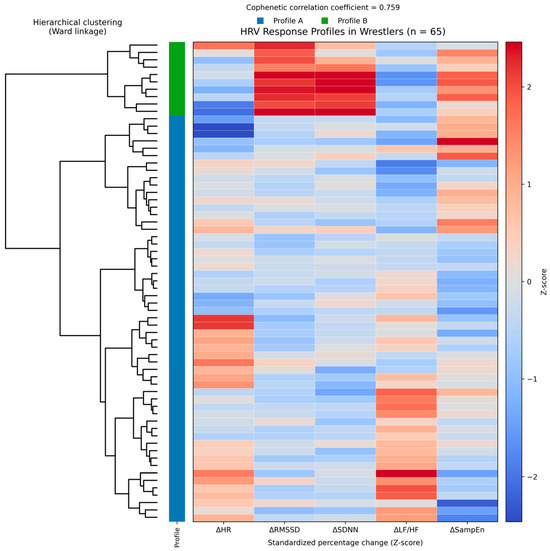
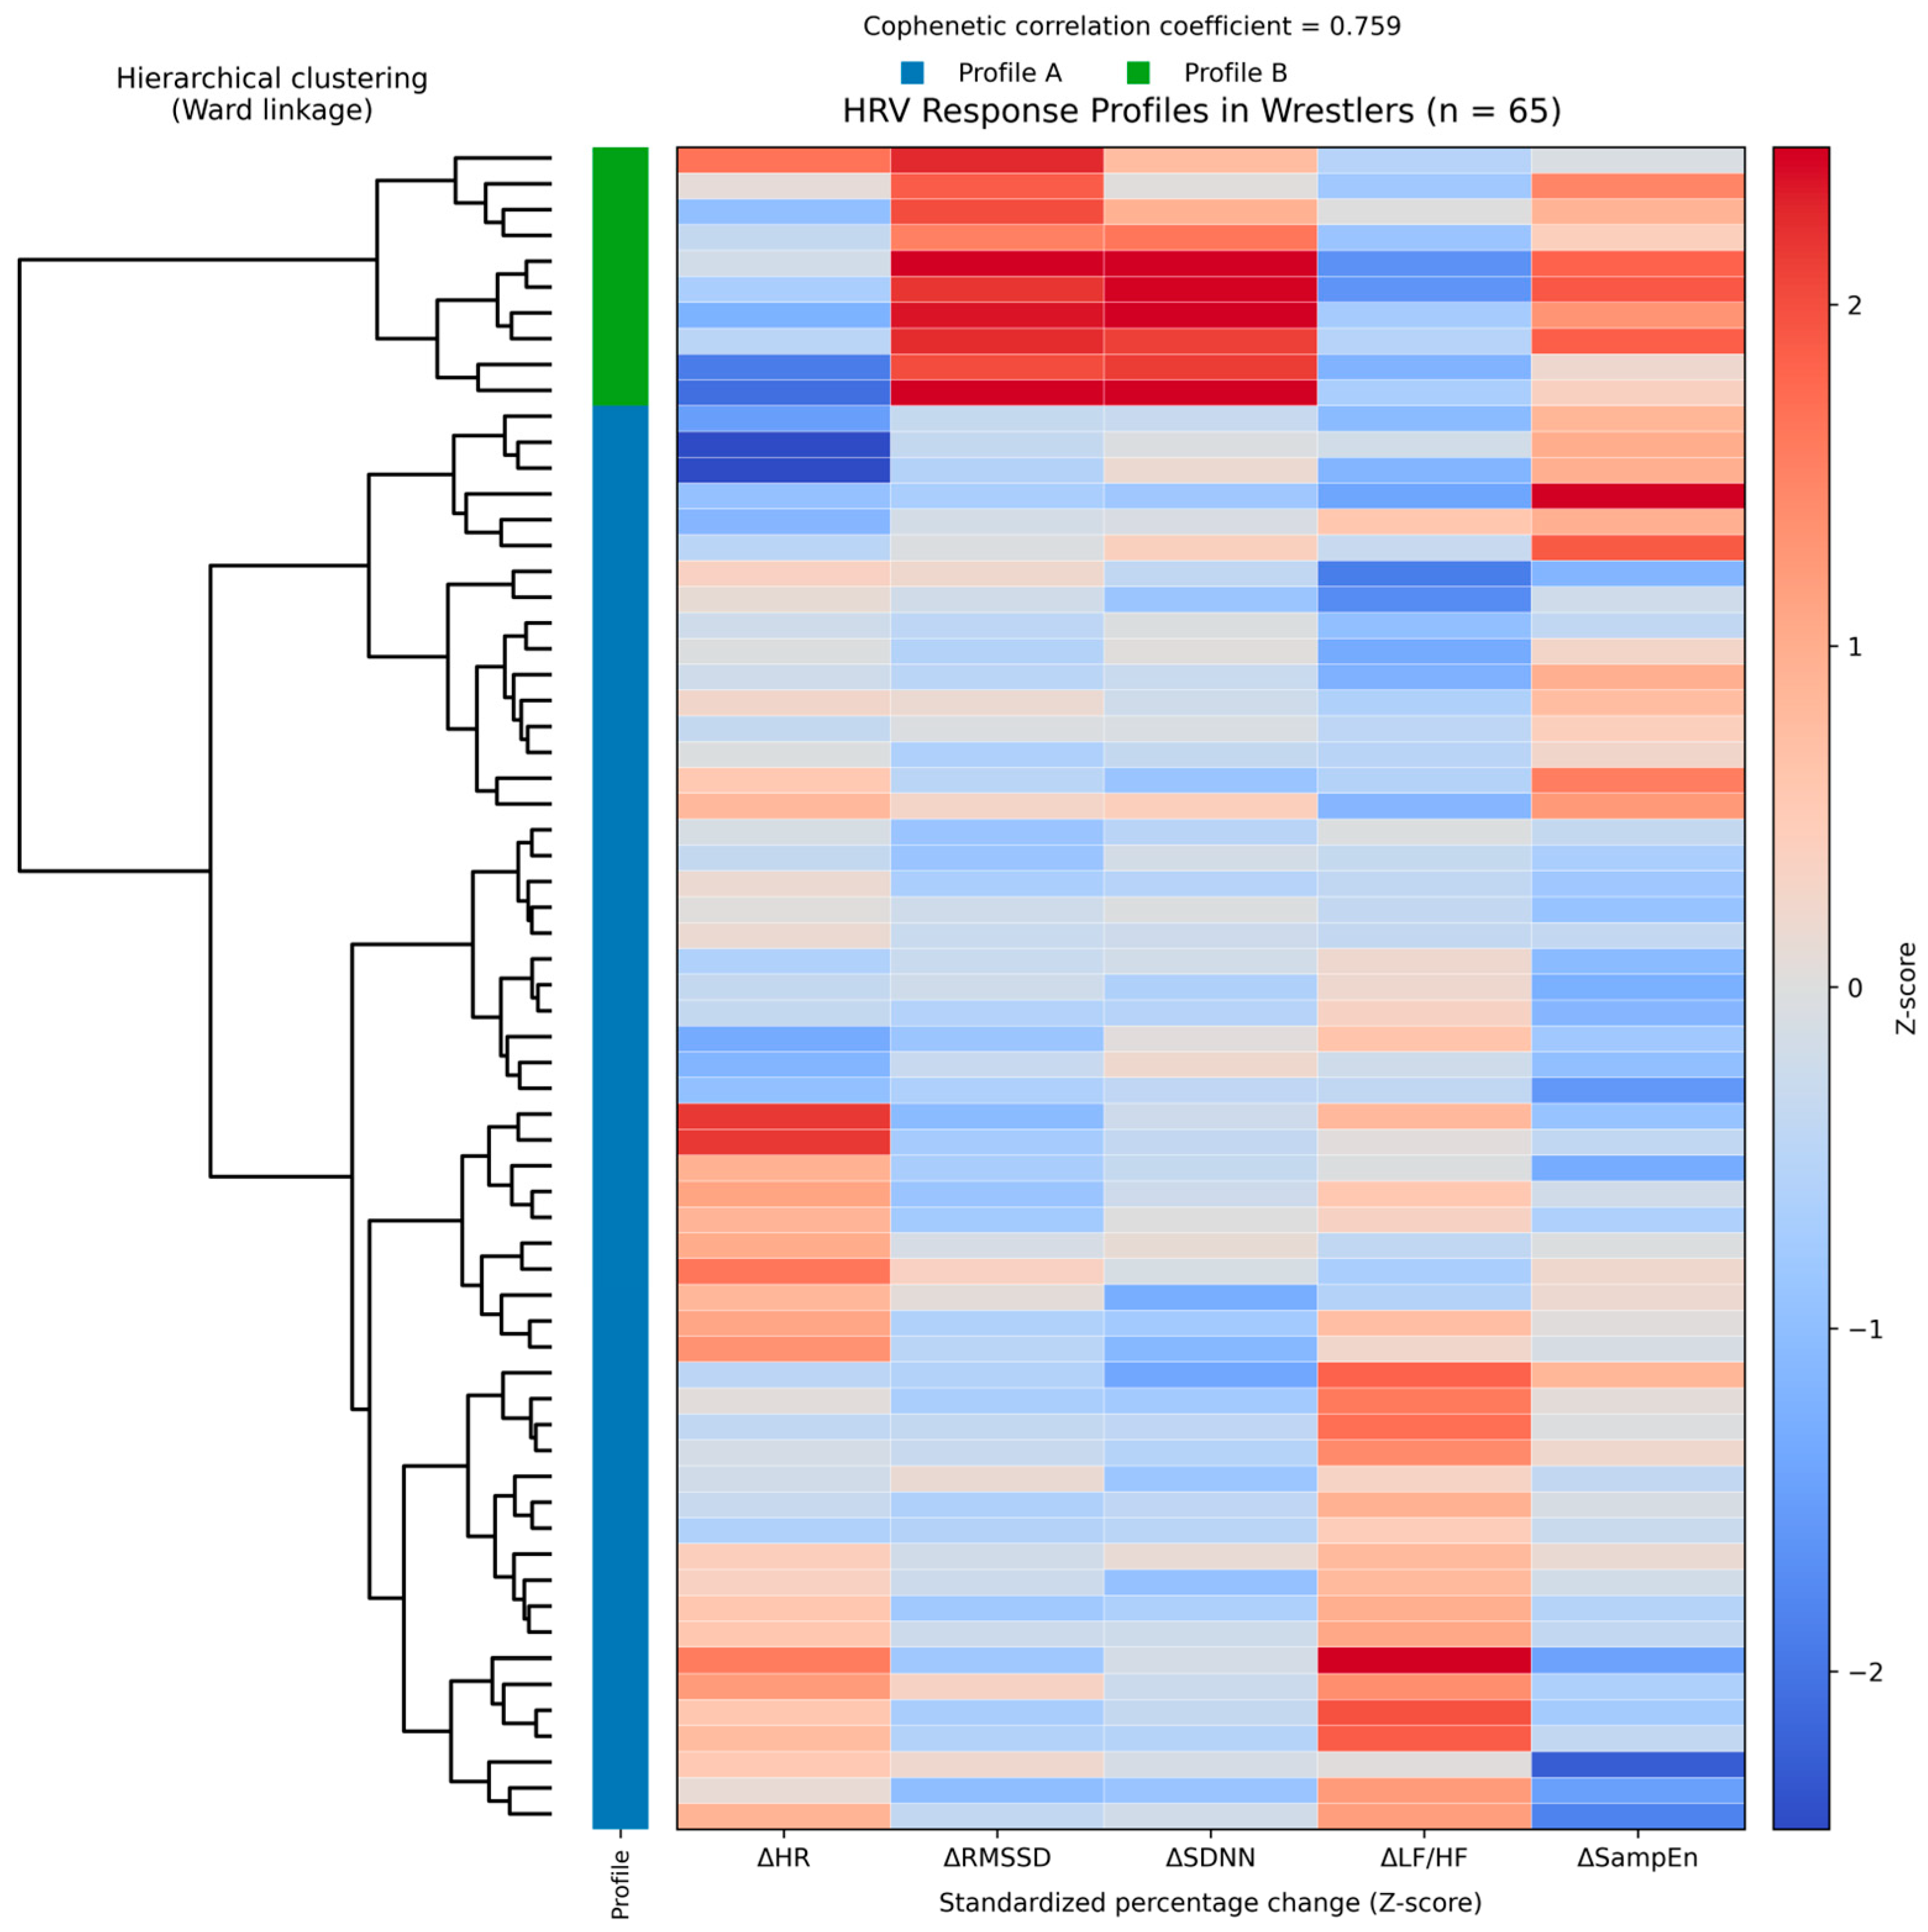
A hierarchically clustered heatmap (with Python 3.13) of standardized percent changes in selected HRV parameters for all 65 wrestler observations is shown in Figure 2. The rows are arranged using Ward’s hierarchical clustering with Euclidean distance. The side annotation bars indicate the physiological response profile (Profile A or Profile B). The cogenetic correlation coefficient is 0.759, indicating adequate preservation of pairwise difference structure by the hierarchical representation.
Figure 2.
Hierarchically clustered heatmap of standardized percentage changes in selected HRV parameters for 65 wrestlers. The side annotation indicates the previously identified physiological response profiles (Profile A and Profile B).
3.3. Correlation Analysis of Exercise-Induced HRV Changes
Table 3 summarizes the statistically significant relationships between percentage changes in selected HRV parameters induced by the wrestlers’ training. Coordinated changes were observed among the main autonomic indices. ΔRMSSD was positively correlated with ΔSDNN (ρ = 0.764, p = 0.002) and showed a strong negative relationship with ΔLF/HF (ρ = −0.830, p < 0.001). The increase in HR was associated with a decrease in RMSSD (ρ = −0.676, p = 0.011) and SDNN (ρ = −0.632, p = 0.021). ΔHR was positively associated with ΔLF/HF (ρ = 0.560, p = 0.046).
Table 3.
Significant Spearman correlations between the percentage changes in selected HRV parameters.
Relationships were also observed across the different domains of HRV. ΔLF/HF correlated positively with ΔDFA α1 (ρ = 0.786, p = 0.001) and negatively with ΔSampEn (ρ = −0.659, p = 0.014). ΔRMSSD correlated positively with ΔSampEn (ρ = 0.654, p = 0.015). The correlations indicate that the post-exercise response involves coordinated changes in the time domain, frequency domain, nonlinear, and fractal HRV characteristics.
3.4. PCA and Identification of Physiological Response Profiles
The five-variable dataset showed acceptable suitability for PCA, with an overall Kaiser–Meyer–Olkin measure of 0.646. Bartlett’s test of sphericity was significant (χ2(10) = 317.30, p < 0.001), indicating sufficient intercorrelation among the variables to support PCA.
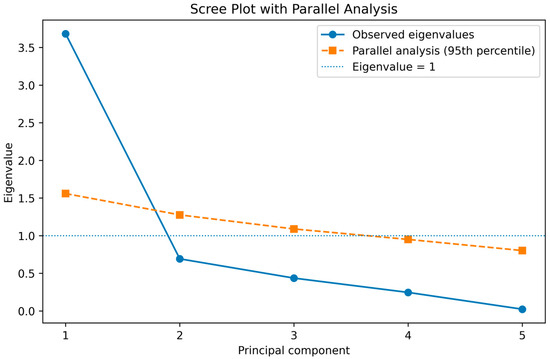
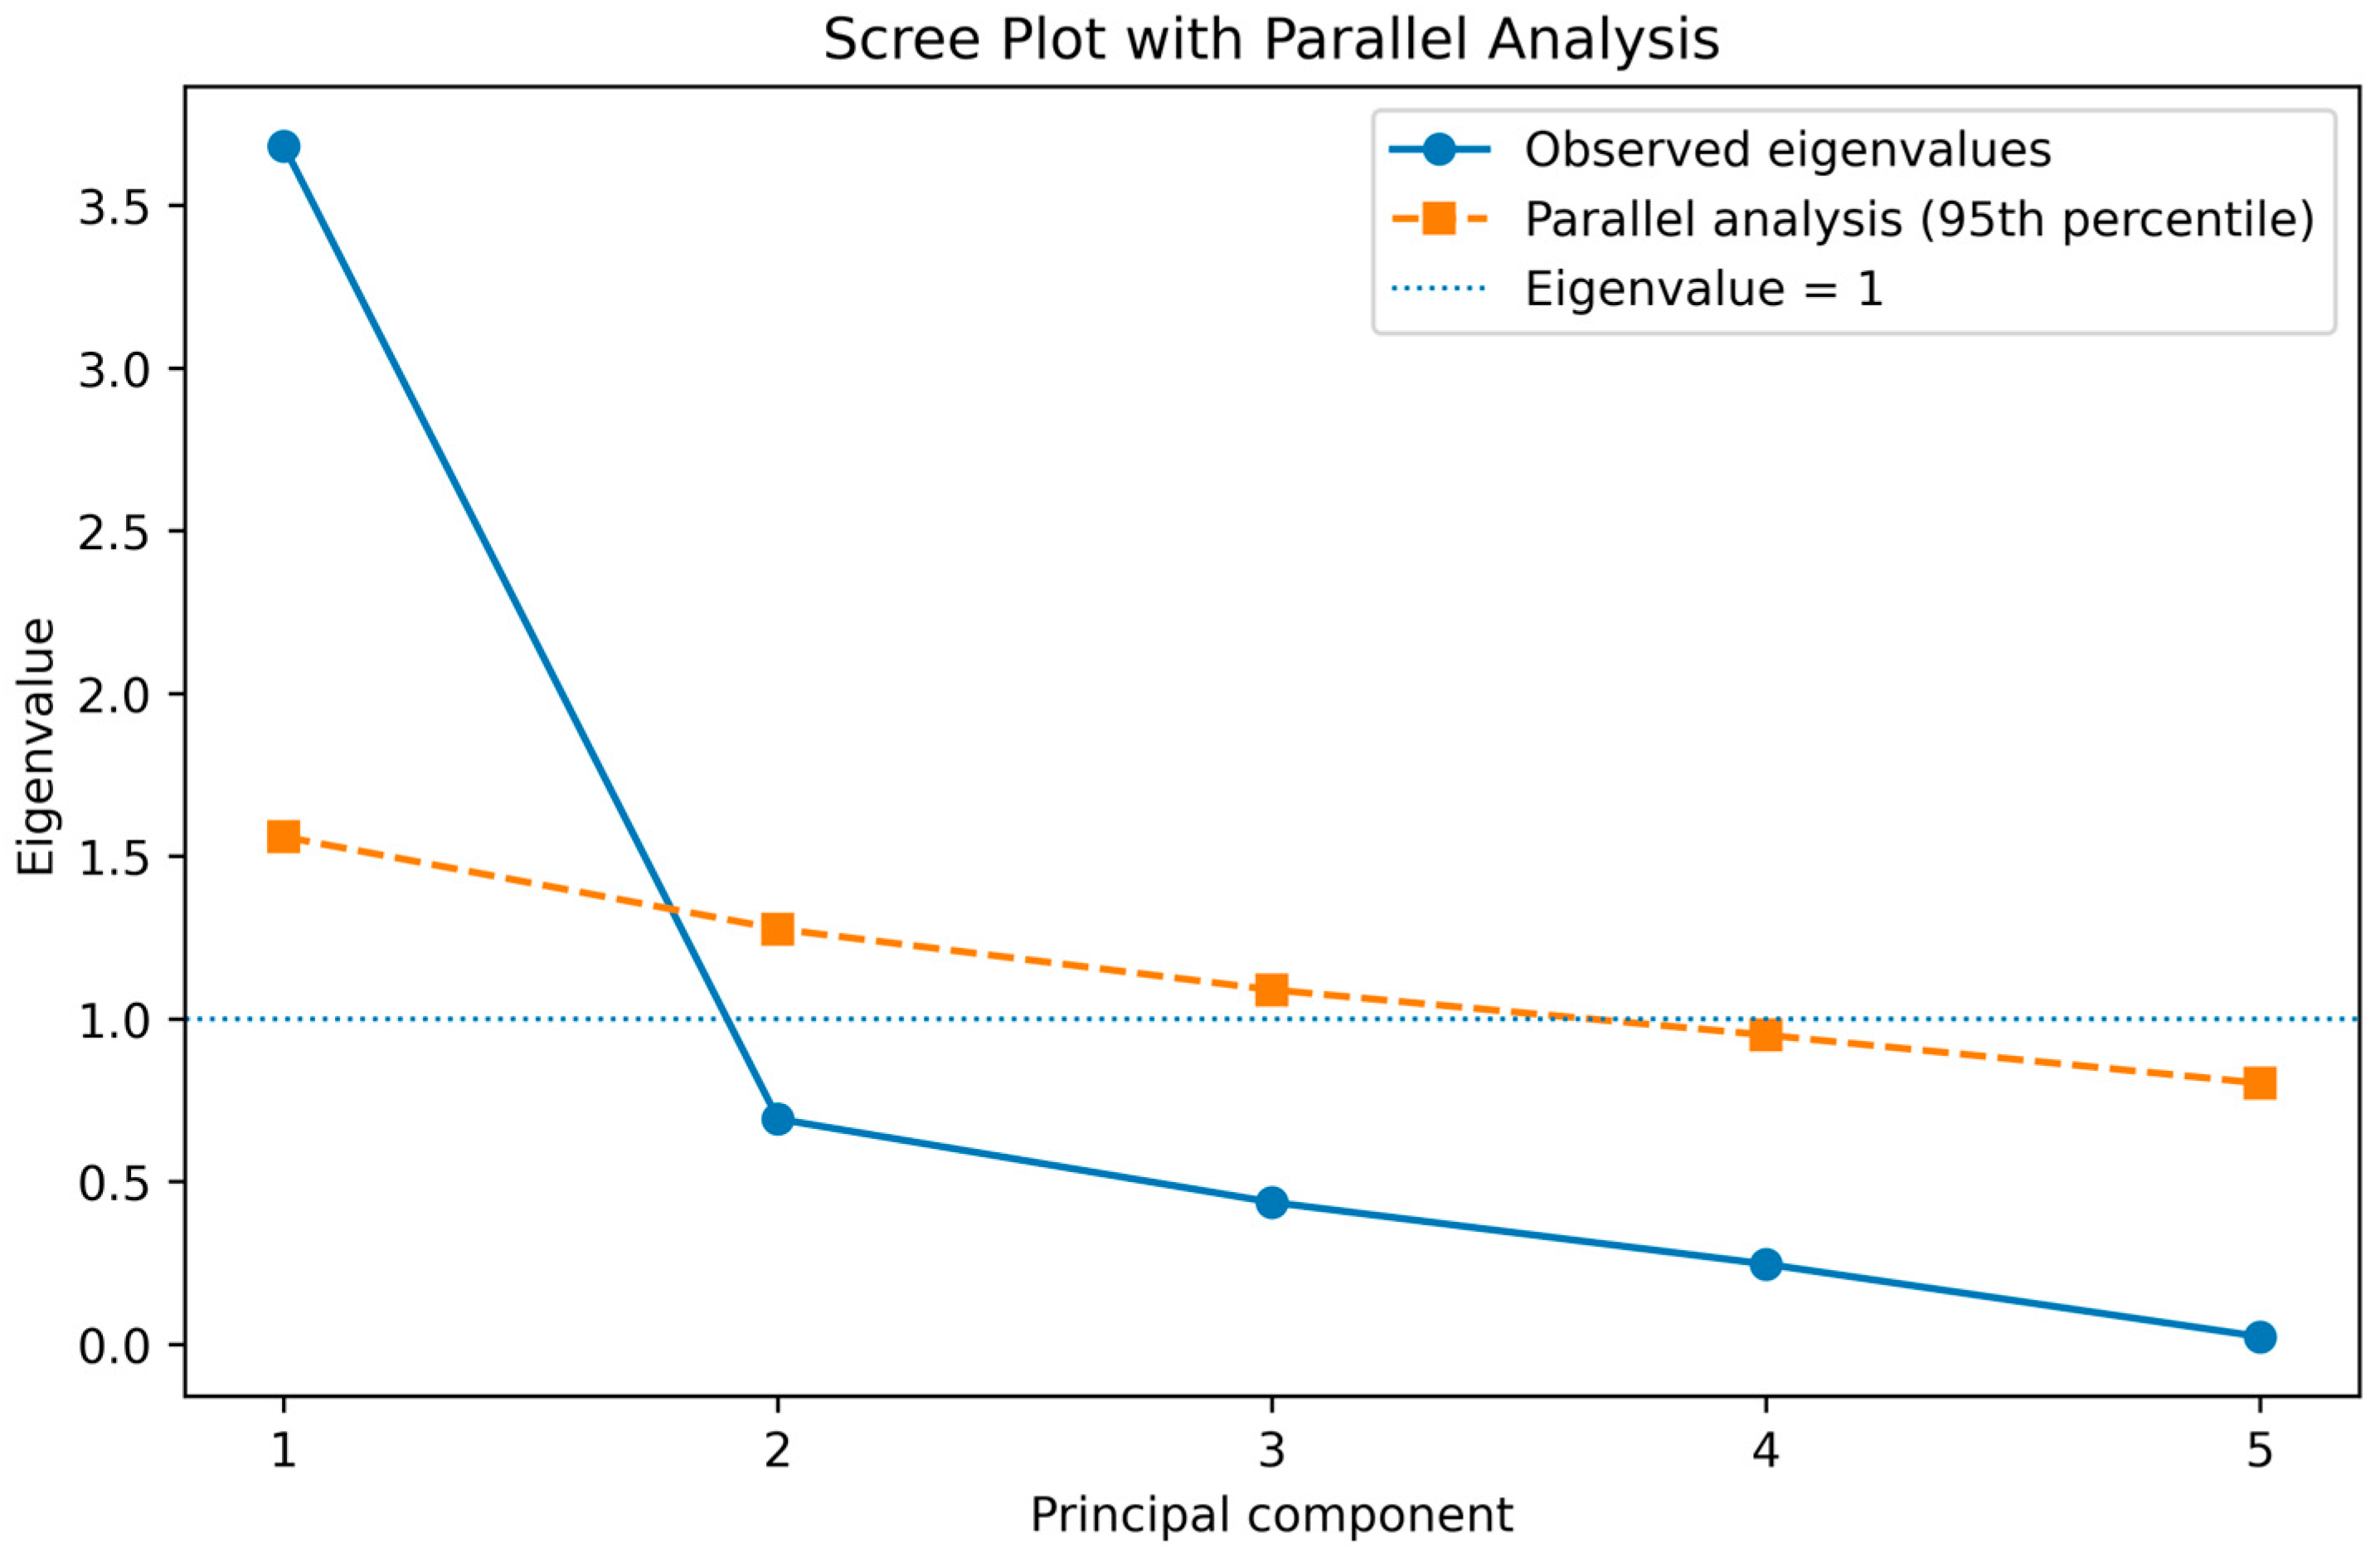
PC1 and PC2 had eigenvalues of 3.256 and 0.771 and explained 65.11% and 15.42% of the total variance, respectively. Parallel analysis supported PC1 as the dominant component, whereas PC2 did not exceed the corresponding random-data threshold and was retained primarily for two-dimensional descriptive visualization of the multivariate response structure.
The scree plot and parallel analysis were used to further evaluate the dimensional structure of the five-variable dataset. As shown in Figure 3, PC1 clearly exceeded the parallel-analysis threshold, whereas PC2 was retained primarily to provide a two-dimensional representation of the multivariate response structure.
Figure 3.
Scree plot with parallel analysis.
Parallel analysis was additionally performed to evaluate the dimensional structure of the dataset. The analysis supported PC1 as the dominant component, whereas PC2 did not exceed the corresponding random-data threshold and was retained for two-dimensional representation of the multivariate structure.
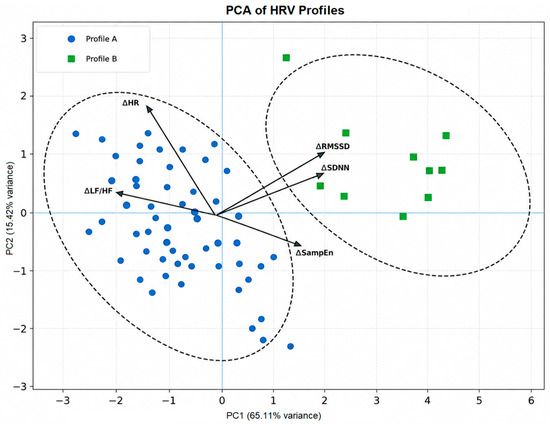
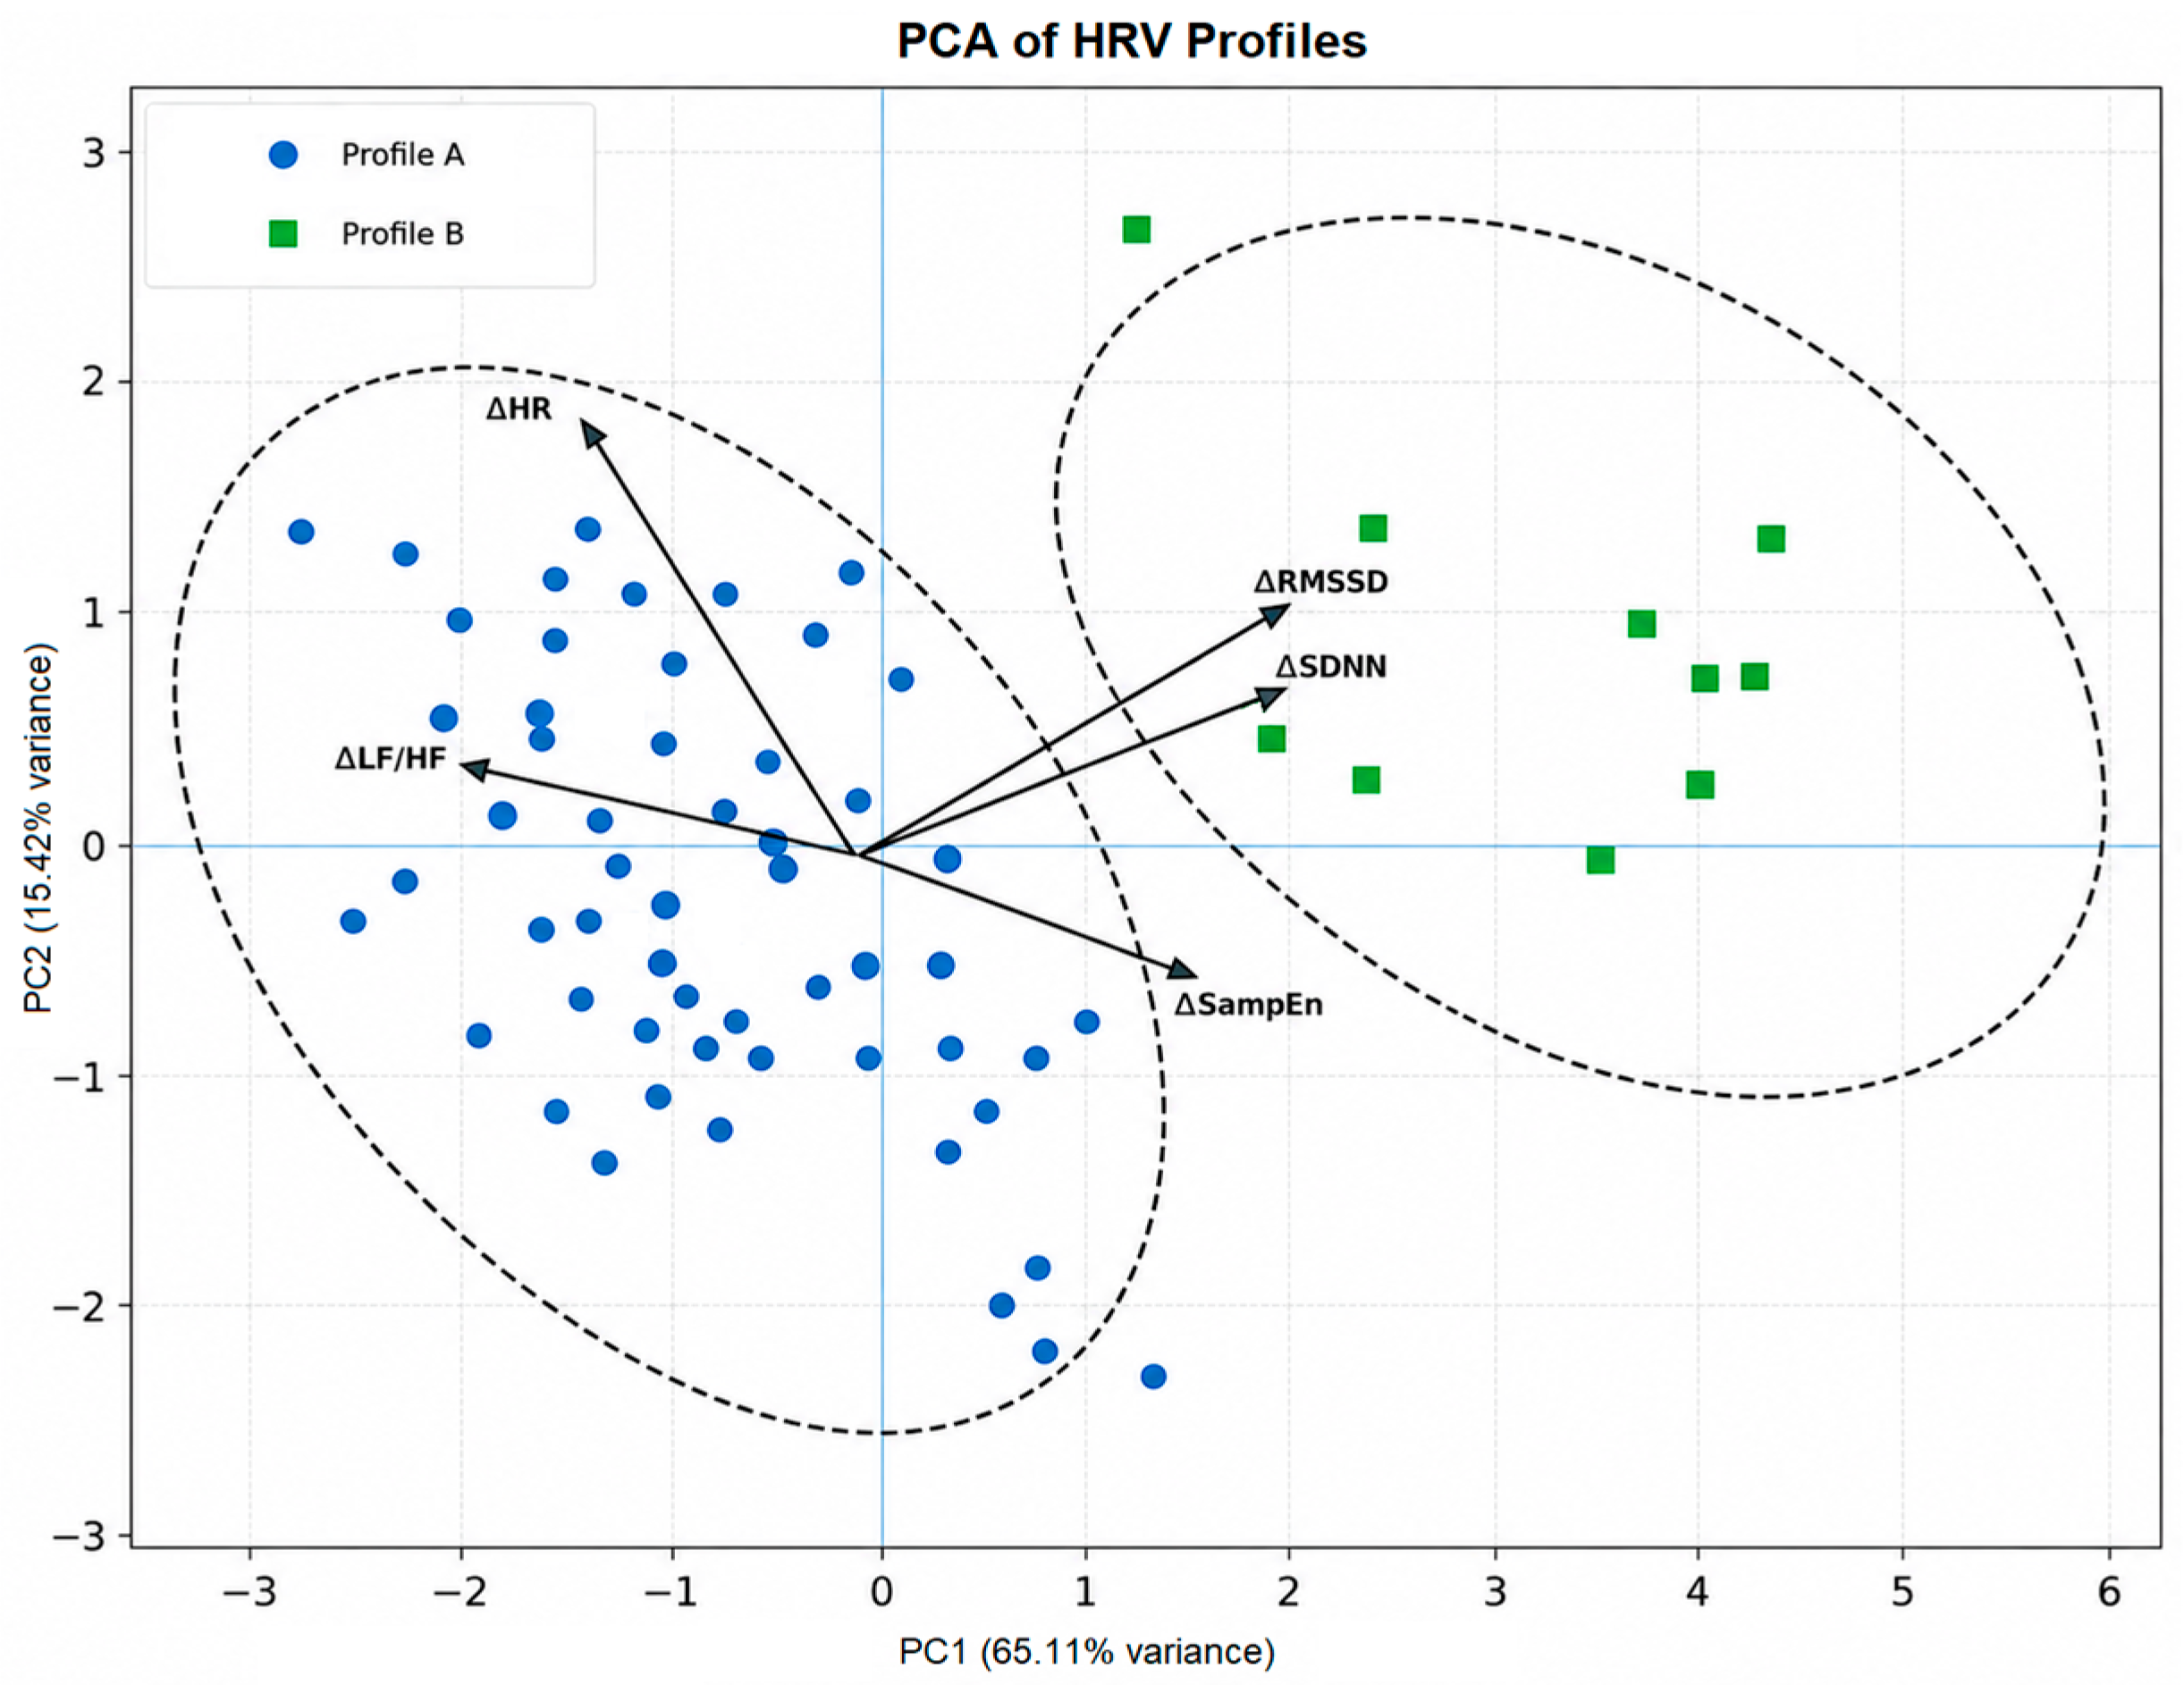
Figure 4 presents the PCA distribution of the identified physiological response profiles. The first principal component (PC1) explains 65.11% of the total variance. The second (PC2) accounts for 15.42%, bringing the total explained variance to 80.53%. The two profiles occupy different regions of the PCA space, indicating significant differences in their HRV responses. The PCA loadings indicate that ΔRMSSD and ΔSDNN contribute strongly to the observed separation.
Figure 4.
PCA of exercise-induced HRV response profiles in wrestlers.
The PCA score plot provides a two-dimensional visualization of the profile distributions obtained by hierarchical clustering. The observed spatial separation of profiles A and B should therefore not be interpreted as an independent validation of the clustering solution.
Table 4 presents the complete loading matrix for PC1 and PC2. The loading pattern indicates that PC1 is predominantly associated with coordinated changes in vagally mediated and overall HRV, whereas PC2 captures a secondary dimension mainly related to nonlinear complexity and complementary autonomic response patterns. PC1 was primarily characterized by strong positive loadings of ΔRMSSD, ΔSDNN, and ΔSampEn and negative loadings of ΔHR and ΔLF/HF, representing a coordinated pattern of exercise-induced autonomic and HRV change. PC2 was mainly associated with ΔSampEn, ΔSDNN, ΔLF/HF, and ΔHR, reflecting a secondary dimension of variability in the multivariate response.
Table 4.
PCA loading matrix for the first two principal components.
Table 5 compares the percentage changes in selected HRV parameters between the two different physiological response profiles. Values are presented as mean ± SD. Statistical comparisons were performed using the Mann–Whitney U test. Effect size is reported as Cliff’s δ. Athletes from both profiles performed the same exercise in both type and duration, but showed different patterns of cardiac autonomic response. Profile A is characterized by an increase in HR (+17.02%), accompanied by a decrease in RMSSD (−41.34%), SDNN (−27.47%), and SampEn (−24.95%), along with an increase in LF/HF (+131.60%). Profile B shows a decrease in HR (−7.34%), a significant increase in RMSSD (+190.55%), SDNN (+121.38%), and SampEn (+32.96%), and a decrease in LF/HF (−64.78%).
Table 5.
Comparison of the identified physiological response profiles.
The largest differences between the profiles were observed for ΔRMSSD, ΔSDNN, and ΔLF/HF, and were statistically significant (p ≤ 0.05), with a separation of these observed values between the two profiles. ΔHR and ΔSampEn also showed large effect sizes (δ = 0.002 and <0.001 and reached statistical significance (p = 0.002 and p < 0.001). The results indicate that the two profiles differ primarily in contrast to changes in short-term and total HRV and in the relative LF/HF spectral distribution.
Values are presented as mean ± SD. Between-profile differences were assessed using the Mann–Whitney U test, with Cliff’s δ reported as an effect-size measure. The 95% confidence intervals for Cliff’s δ were estimated using percentile bootstrap resampling with 10,000 resamples.
Because the same variables were used to define the clusters, the between-profile comparisons presented in Table 5 should be interpreted as exploratory characterization of the identified response patterns rather than as independent confirmatory tests of cluster validity. Given the unequal profile sizes (n = 55 vs. n = 10), the between-profile comparisons should be interpreted cautiously, particularly with respect to the detection of small-to-moderate effects.
Quantitative evaluation (Table 6) shows a possible separation of the two physiological response profiles in the studied dataset (n = 65). The first two principal components explain 80.53% of the total variance (most of which is captured in a two-dimensional representation). The silhouette coefficient of 0.74 indicates a good separation of the clusters. The low Davies–Bouldin index (0.42) and the Calinski–Harabasz index (46.3) support a good compactness within the profile and the possibility of separating the two profiles.
Table 6.
Statistical indicators for the principal components and cluster analysis.
Ward’s hierarchical clustering was applied to the standardized set of five variables for 65 wrestlers, the cluster sizes were determined (Table 7), and the alternative solutions of (k = 2, 3 and 4) were evaluated.
Table 7.
Comparison of Alternative Hierarchical Clustering Solutions.
Among the evaluated solutions, k = 2 showed the highest silhouette coefficient and the lowest Davies–Bouldin index, whereas k = 4 yielded the highest Calinski–Harabasz index. Considering the overall internal validity metrics together with parsimony and physiological interpretability, the two-cluster solution was retained.
Bootstrap analysis with 1000 resamples further supported the internal stability of the two-cluster solution. The mean Jaccard similarity was 0.958 for Profile A and 0.874 for Profile B, with median values of 1.000 for both profiles. Jaccard similarity ≥0.75 was observed in 90.8% and 82.0% of bootstrap resamples for Profiles A and B, respectively.
Potential multivariate outliers were additionally examined using squared Mahalanobis distance. No observation exceeded the predefined χ2(5) threshold of 11.07 (α = 0.05), indicating that no statistically defined multivariate outliers were detected. Leave-one-out sensitivity analysis further showed that the PCA solution was robust to the sequential exclusion of individual participants. The PC1 loading structure remained highly stable across all iterations (loading correlations with the full-data solution, r = 0.994–1.000), whereas PC2 showed somewhat greater sensitivity (r = 0.867–1.000). These values indicate that the dominant multivariate structure was not driven by a single participant.
3.5. Longitudinal Changes After Four Months of Training
To assess the longitudinal development of the identified physiological response profiles, HRV parameters obtained at the beginning of the study (Table 8) were compared with those obtained after four months of training (Table 9). The analysis was performed separately for Profile A and Profile B, according to the classification of the profiles. The observed differences in cardiac autonomic response were assessed to determine whether they were maintained at the end of the study period. Changes in the time domain, frequency domain, nonlinear and fractal HRV indices were examined to characterize the direction and magnitude of long-term autonomic adaptation.
Table 8.
Baseline Pre–Post Training Responses of HRV Parameters According to Physiological Response Profile.
Table 9.
Pre–Post Training Responses of HRV Parameters by Physiological Response Profile after Four Months of Training.
Comparison of profile-specific responses at baseline and after four months of training showed that the two different patterns of cardiac autonomic response were largely maintained at the end of the study period. It was observed that the magnitude of the acute changes induced by exercise was reduced. In Profile A, the post-exercise reductions in RMSSD, SDNN and pNN50 were attenuated from −41.3%, −27.5% and −68.6% at baseline to −30.0%, −20.0% and −50.0% after four months. The increase in HR after training decreased from +21.5% to +15.0%. Profile B maintained the opposite response pattern, but the initially pronounced increases in RMSSD (+190.6%) and SDNN (+121.4%) were reduced to +40.0% and +20.0%, respectively; a similar attenuation was observed for SampEn (+33.0% to +15.4%). The persistence of opposite directions of response between profiles, together with the reduced magnitude of several changes in HRV after four months, suggests that the initially established interindividual heterogeneity remained at the end of the period. Cardiac autonomic response became less pronounced at the end of the training season.
To assess the longitudinal evolution of the acute autonomic response, the relative changes before and after training (Δ%) were examined at five measurement points during the four-month training period. Each value in Table 10 represents the training-induced change within the corresponding measurement session (and not the change from the previous time point). This longitudinal assessment was intended as an exploratory descriptive analysis; therefore, no formal repeated-measures model was applied to test time, profile, or time × profile interaction effects. The observed longitudinal trends showed contrasting profile-specific response patterns across the four-month training period, with differences between some HRV parameters gradually decreasing. These findings should be interpreted as exploratory trends rather than statistically confirmed persistence or convergence of the two profiles. These trends are observed in RMSSD and SDNN and can be a basis for testing whether the identified autonomic response profiles are maintained or progressively converge during even longer-term adaptation to training. These findings should be interpreted as exploratory trends rather than statistically confirmed persistence or convergence of the two profiles.
Table 10.
Longitudinal Changes in HRV Parameters across the Four-Month Training Period.
The longitudinal analysis further showed that the direction of the acute autonomic response remained constant in each profile across all five measurement points. In profile A, ΔRMSSD remained negative throughout the observation period, but decreased in magnitude from −41.3% at measurement 1 to −31.4% at measurement 5. ΔSDNN changed from −27.5% to −21.1% and ΔSampEn from −25.6% to −15.8%. Profile B consistently showed positive changes in these indices, with their magnitude decreasing: ΔRMSSD decreased from +190.6% to +43.4%, ΔSDNN from +121.4% to +24.2% and ΔSampEn from +33.9% to +15.4%. Descriptively, these trajectories showed opposite directions of response across the five assessments, accompanied by a decrease in the magnitude of the between-profile differences for several parameters.
A similar preservation of the opposite directions of response was observed for HR, with ΔHR remaining positive in profile A (+21.5% to +15.2%) and negative in profile B (−13.2% to −5.3%). LF/HF did not show comparable convergence. Profile A maintained a positive response that increased slightly from +17.4% to +20.7%. Profile B remained negative (−14.3% to −9.9%). It can be assumed that the longitudinal evolution is parameter-specific and does not represent a uniform attenuation of the autonomic response.
4. Discussion
The present study revealed significant interindividual heterogeneity in the cardiac autonomic response of competitive wrestlers following the same standardized training protocol. The external training structure was comparable across participants; the resulting internal physiological load may have differed between individuals. The observed HRV heterogeneity should be interpreted as variability in autonomic responses under comparable training conditions rather than responses to an identical physiological stimulus. At the group level, exercise induced increased heart rate (HR) and decreased vagally mediated HRV. However, multivariate analysis identified two distinct physiological response profiles. Profile A, representing the predominant response pattern, was characterized by increased heart rate and decreased RMSSD, SDNN, and SampEn, along with an increase in LF/HF. Profile B showed the opposite response, with increases in RMSSD, SDNN, and SampEn and decreased LF/HF. The differences between profiles were most pronounced for ΔRMSSD, ΔSDNN, and ΔLF/HF, rather than variation in a single HRV parameter. The response observed in Profile A is consistent with an acute autonomic response to intense exercise reported by previous studies. Several different physiological and methodological factors are possible to explain the contrasting response observed in Profile B. Differences in baseline training status, previous recent training load, recovery state, or transient supercompensatory responses could influence the acute autonomic response. Normal diurnal biological variability in HRV may also contribute to these apparently reversed changes before and after exercise. Given the small size of Profile B, these alternative explanations cannot be definitively stated in the present study and need to be investigated using repeated standardized measurements and additional indicators of recovery and training load.
Marasingha-Arachchige et al. [8] reported significant reductions in RMSSD and SDNN after training and increases in LF/HF after acute resistance training, demonstrating that volume, intensity, number of sets, and recovery intervals influence the magnitude of the HRV response. Laborde et al. [9] identified RMSSD as a sensitive indicator of parasympathetic reactivation after training and showed that recovery characteristics can alter its trajectory after training. Thus, the reductions in RMSSD and SDNN observed in Profile A are physiologically consistent with a transient vagal withdrawal after training. These group-level trends alone do not explain the contrasting response observed in Profile B, which is one of the main observations of the present study.
Profile B demonstrates that there is a divergent HRV response across wrestlers under identical training conditions. Plews et al. [5] emphasize that both increases and decreases in vagally mediated HRV are associated with different training states in highly trained athletes, making individual and longitudinal interpretation essential. In the present study, wrestlers in Profile B showed significant increases in RMSSD and SDNN, in contrast to the decreases observed in the majority of participants. These responses indicate that athletes exposed to the same external training stimulus can exhibit significantly different internal autonomic responses. This is important because conventional group-level analysis would largely obscure this minority response pattern.
Tian et al. [11], for example, investigated individualized HRV thresholds for early identification of functional and non-functional overload in 34 elite female athletes during training sessions preceding major competitions. Their work demonstrates the importance of individualized HRV monitoring, with the aim of establishing warning thresholds associated with overload. The authors did not address the issue of separating into separate multivariate profiles of autonomic response to the same load.
Henríquez Olguín et al. [12] investigated the recovery of cardiac autonomy after training in wrestlers according to training status, assessing differences between groups defined in advance. In the present study, there was no allocation of athletes to response categories prior to analysis. The two profiles emerged as a result of the multivariate structure of exercise-induced changes in HRV. Our results suggest that significant autonomic heterogeneity may exist even in athletes participating in the same sport and undergoing the same standardized training protocol. Variations in autonomic regulation after training may not be adequately represented by comparisons between predefined groups on some trait alone.
Yıldırım et al. [13] investigated the effects of acute high-intensity exercise following rapid weight loss in elite wrestlers, thereby highlighting an additional factor capable of altering cardiac autonomic responses. Demirkiran et al. [14] directly compared high-intensity interval and long-term endurance training in 13 elite male Greco-Roman wrestlers using a within-subjects repeated-measures design.
Previous research in the field of wrestling has focused primarily on mean changes in HRV, predefined differences in training status, thresholds being exceeded, rapid weight loss, different exercise protocols, or changes associated with different phases of training [11,12,13,14,15]. While the present study specifically investigated whether a standardized training stimulus reveals latent heterogeneity in multivariate cardiac autonomic response, the opposing directions of change observed particularly for RMSSD, SDNN, and LF/HF suggest that group averages may mask physiologically relevant individual response patterns.
A multidimensional interpretation is consistent with the broader understanding that HRV reflects complex cardiovascular autonomic regulation [3,4,10]. Its application here to differentiate acute individual response patterns represents a different analytical perspective.
The four-month follow-up further extends the cross-sectional profile analysis. Profile A retains the same general direction of response, although the acute decreases in RMSSD and SDNN are attenuated after four months, the increase in HR being similarly attenuated. Profile B also retains the opposite direction of response, while the initially pronounced increases in RMSSD and SDNN are attenuated at the end of the study. The two profiles therefore converge slightly towards an overall response after four months. However, their contrasting directions are largely maintained, while the magnitude of the few acute changes becomes less pronounced. Because the four-month follow-up was exploratory and was not evaluated using a formal repeated-measures model, the observed longitudinal trajectories should not be interpreted as evidence of statistically confirmed profile stability or time × profile effects.
The two response profiles identified in the present study should be regarded as exploratory data-driven patterns rather than established physiological phenotypes. Their relationships with fatigue, recovery, training adaptation, injury risk, and athletic performance require further prospective and systematic investigation.
This result differs conceptually from the longitudinal approach of Demirkiran et al. [15]. Their study followed 20 elite male Greco-Roman wrestlers after 14 weeks of training rest and eight weeks of overtraining, demonstrating a progressive improvement in HRV during the overtraining phase, followed by a deterioration during the competition phase. Significant time effects were reported for indices such as SDNN, RMSSD, LF, and LF/HF. Their results suggest that autonomic regulation changes dynamically with the training phase. The present study extends this perspective by answering a different longitudinal question: whether the initially identified individual response profiles remain recognizable after prolonged systematic training. The persistence of opposite response directions after four months suggests that interindividual response characteristics may remain detectable despite training-related changes in the magnitude of the acute response. While previous longitudinal studies have primarily described time-dependent group-level HRV changes across training phases, the novelty of the present study lies in the individual-level multivariate profiling of coordinated Pre–Post HRV responses and in examining whether these response patterns remain distinguishable over time.
Athletes completing the same training session therefore do not respond equivalently to identical training conditions. This supports previous recommendations that athlete monitoring should integrate external load, internal load, recovery status, and longitudinal individual responses [1]. For wrestling training, the current profile-based approach could complement standard workload monitoring by identifying athletes whose cardiac autonomic response deviates significantly from the prevailing group pattern. In a practical application, a coach or practitioner could obtain standardized HRV measurements before and after training at repeated points during a training cycle and compare each athlete’s multivariate response pattern to their previous individual responses. Once reproducible classification criteria are established, changes in the profile determination or deviation from the athlete’s usual response pattern could be used to more closely assess the recovery and training load of each individual athlete. However, current post hoc clustering does not yet provide such a validated classification rule and profile-based training decisions. At this stage, the identified profiles should be regarded as exploratory multivariate response patterns rather than established physiological phenotypes or validated indicators of recovery, performance, fatigue, overload, or training adaptation.
The study also has several limitations that affect the interpretation of these findings. The main physiological dataset included only 65 wrestlers, of whom 10 were from Profile B. The prevalence and prognostic significance of this response pattern remain to be analyzed for the broader population of wrestlers. HRV is influenced by breathing, hydration, sleep, psychological state, circadian factors, body position, previous exercise, and other contextual variables [3,5,10], some of which could contribute to the observed interindividual variability. Another limitation is that the two profiles are primarily determined by the physiological response to training effort. No differences in subsequent performance or recovery were examined. Future studies should validate the profile structure in larger independent cohorts, examining whether athletes remain within the same profile across repeated sessions. It would be useful to examine the response of different profiles to competitive performance, perceived recovery, varying training loads, and fatigue. Such analyses would determine whether the response profiles identified here represent stable individual autonomic characteristics, transient, condition-dependent states, or practically meaningful indicators of training adaptation.
Some individual percentage changes, particularly in RMSSD and LF/HF, were relatively large, which may increase their influence on variance-based multivariate analyses. However, the additional outlier assessment and leave-one-out sensitivity analysis indicated that the dominant PCA structure was not driven by a single influential observation.
The longitudinal analysis tracked the evolution of the initially defined profiles, but did not independently reclassify athletes at each subsequent measurement point using fixed PCA loadings or a predefined classification rule. The preservation of profile-specific response directions should not be interpreted as evidence of individual stability of profile membership across repeated sessions. Future studies should evaluate this classification across measurement points.
5. Conclusions
This study investigated cardiac autonomic responses after training in competitive wrestlers using a comprehensive HRV-based approach. All the athletes studied participated in the same training sessions during the study period, but interindividual variability was observed. At the group level, training induced increased heart rate and decreased several vagal HRV indices, such as RMSSD and SDNN, which provide a good indication of the predominant training response. The multivariate analysis identified two distinct physiological response profiles. Profile A is characterized by a suppression of HRV after training, while Profile B shows the opposite pattern, with preserved or increased vagal HRV parameters. The profiles were differentiated primarily by contrasting changes in RMSSD, SDNN, and LF/HF, while PCA, hierarchical clustering, correlation analysis, and cluster quality measures supported the multivariate structure observed within the present cohort. The contrasting directions of the profile-specific responses remain after four months of training, but the magnitude of some HRV changes is attenuated. It can be concluded that the analysis of group averages may mask physiologically relevant interindividual differences in cardiac autonomic responses under comparable training conditions.
The results support further investigation of individualized and longitudinal HRV assessment in athletes. The proposed profile-based approach may provide a basis for future studies examining whether multivariate HRV profiling can complement conventional athlete-monitoring approaches. Given the limited sample size, especially the small number of athletes in Profile B, the identified profiles require validation in larger independent cohorts before broader physiological or practical conclusions can be drawn. Because fatigue, recovery status, training load, and sport-specific performance were not directly evaluated as outcomes in the present study, the identified profiles should not yet be interpreted as indicators for individualized training prescription or routine athlete monitoring. If the identified response profiles are confirmed in independent cohorts and demonstrate reproducibility across repeated training sessions, they could potentially contribute to individualized training load prescription. This could provide additional information about the athlete’s autonomic response to a given external load. Such an application requires prospective validation with respect to recovery, fatigue, training load, and performance outcomes before training decisions based on the profile can be recommended.
The separation of Profiles A and B in the PCA score plot should be interpreted as a visualization of the clustering solution rather than as independent validation, because PCA and hierarchical clustering were based on the same five standardized response variables. Therefore, independent validation in a larger external cohort is required to confirm the reproducibility of the identified profiles.
Future studies will be aimed at examining larger cohorts in repeated training sessions and different sports. Their relationships with fatigue, recovery and competition performance can be investigated. The use of wearable sensor devices and intelligent computing methods for continuous individualized monitoring will be explored. Future studies should address the assessment of profile stability by examining the consistency of classification within athletes across repeated standardized training sessions and determining whether individual athletes are consistently assigned to the same response profile over time.
Supplementary Materials
The following supporting information can be downloaded at: https://www.mdpi.com/article/10.3390/app16189166/s1.
Funding
This study was supported by the Bulgarian National Science Fund (scientific project “Research on AI-based methods for modeling, analyzing and forecasting bio-medical time series by applying a digital twin concept”), Grant Number KП-06-H97/12, 10 December 2025.
Institutional Review Board Statement
The study was conducted in accordance with the Declaration of Helsinki, and approved by the Ethics Committee of Institute of Robotics—BAS (protocol approval code: 9/11.02.2025).
Informed Consent Statement
Informed consent was obtained from all subjects involved in the study.
Data Availability Statement
Data is available upon request.
Conflicts of Interest
The author declares no conflicts of interest.
Abbreviations
The following abbreviations are used in this manuscript:
| HRV | Heart Rate Variability |
| ECG | Electrocardiogram/Electrocardiography |
| HR | Heart Rate |
| RR | R–R Interval |
| SDNN | Standard Deviation of Normal-to-Normal Intervals |
| RMSSD | Root Mean Square of Successive Differences |
| pNN50 | Percentage of Successive NN Intervals Differing by More Than 50 ms |
| LF | Low-Frequency Power |
| HF | High-Frequency Power |
| LF/HF | Low-to-High Frequency Power Ratio |
| SD1 | Short-Term Poincaré Plot Standard Deviation |
| SD2 | Long-Term Poincaré Plot Standard Deviation |
| SampEn | Sample Entropy |
| DFA | Detrended Fluctuation Analysis |
| DFA α1 | Short-Term Scaling Exponent |
| DFA α2 | Long-Term Scaling Exponent |
| PCA | Principal Component Analysis |
| PC1 | First Principal Component |
| PC2 | Second Principal Component |
| IQR | Interquartile Range |
| SD | Standard Deviation |
References
- Bourdon, P.C.; Cardinale, M.; Murray, A.; Gastin, P.; Kellmann, M.; Varley, M.C.; Gabbett, T.J.; Coutts, A.J.; Burgess, D.J.; Gregson, W.; et al. Monitoring Athlete Training Loads: Consensus Statement. Int. J. Sports Physiol. Perform. 2017, 12, S2-161–S2-170. [Google Scholar] [CrossRef] [Scilit] [PubMed]
- Kellmann, M.; Bertollo, M.; Bosquet, L.; Brink, M.; Coutts, A.J.; Duffield, R.; Erlacher, D.; Halson, S.L.; Hecksteden, A.; Heidari, J.; et al. Recovery and Performance in Sport: Consensus Statement. Int. J. Sports Physiol. Perform. 2018, 13, 240–245. [Google Scholar] [CrossRef] [Scilit] [PubMed]
- Shaffer, F.; Ginsberg, J.P. An Overview of Heart Rate Variability Metrics and Norms. Front. Public Health 2017, 5, 258. [Google Scholar] [CrossRef] [Scilit] [PubMed]
- Voss, A.; Schulz, S.; Schroeder, R.; Baumert, M.; Caminal, P. Methods Derived from Nonlinear Dynamics for Analysing Heart Rate Variability. Philos. Trans. R. Soc. A Math. Phys. Eng. Sci. 2009, 367, 277–296. [Google Scholar] [CrossRef] [Scilit] [PubMed]
- Plews, D.J.; Laursen, P.B.; Stanley, J.; Kilding, A.E.; Buchheit, M. Training Adaptation and Heart Rate Variability in Elite Endurance Athletes: Opening the Door to Effective Monitoring. Sports Med. 2013, 43, 773–781. [Google Scholar] [CrossRef] [Scilit] [PubMed]
- Bellenger, C.R.; Fuller, J.T.; Thomson, R.L.; Davison, K.; Robertson, E.Y.; Buckley, J.D. Monitoring Athletic Training Status through Autonomic Heart Rate Regulation: A Systematic Review and Meta-Analysis. Sports Med. 2016, 46, 1461–1486. [Google Scholar] [CrossRef] [Scilit] [PubMed]
- Vesterinen, V.; Nummela, A.; Heikura, I.; Laine, T.; Hynynen, E.; Botella, J.; Häkkinen, K. Individual Endurance Training Prescription with Heart Rate Variability. Med. Sci. Sports Exerc. 2016, 48, 1347–1354. [Google Scholar] [CrossRef] [Scilit] [PubMed]
- Marasingha-Arachchige, S.U.; Rubio-Arias, J.Á.; Alcaraz, P.E.; Chung, L.H. Factors That Affect Heart Rate Variability Following Acute Resistance Exercise: A Systematic Review and Meta-Analysis. J. Sport Health Sci. 2022, 11, 376–392. [Google Scholar] [CrossRef] [Scilit] [PubMed]
- Laborde, S.; Wanders, J.; Mosley, E.; Javelle, F. Influence of Physical Post-Exercise Recovery Techniques on Vagally-Mediated Heart Rate Variability: A Systematic Review and Meta-Analysis. Clin. Physiol. Funct. Imaging 2024, 44, 14–35. [Google Scholar] [CrossRef] [Scilit] [PubMed]
- Gronwald, T.; Schaffarczyk, M.; Hoos, O. Orthostatic testing for heart rate and heart rate var-iability monitoring in exercise science and practice. Eur. J. Appl. Physiol. 2024, 124, 3495–3510. [Google Scholar] [CrossRef] [Scilit] [PubMed]
- Tian, Y.; He, Z.-H.; Zhao, J.-X.; Tao, D.-L.; Xu, K.-Y.; Earnest, C.P.; McNaughton, L.R. Heart Rate Variability Threshold Values for Early-Warning Nonfunctional Overreaching in Elite Female Wrestlers. J. Strength Cond. Res. 2013, 27, 1511–1519. [Google Scholar] [CrossRef] [Scilit] [PubMed]
- Henríquez Olguín, C.; Báez San Martín, E.; von Oetinger, A.; Cañas Jamett, R.; Ramírez Campillo, R. Autonomic Control of Heart Rate after Exercise in Trained Wrestlers. Biol. Sport 2013, 30, 111–115. [Google Scholar] [CrossRef] [Scilit] [PubMed]
- Yıldırım, Y.; Arabacı, R.; Rodoplu, C.; Güngör, A.K.; Yáñez-Sepúlveda, R.; Cortés-Roco, G.; López-Gil, J.F.; Martínez-Rodríguez, A. Effects of Acute High-Intensity Exercise on Heart Rate Variability Following Rapid Weight Loss in Elite Wrestlers. Sci. Rep. 2026, 16, 7631. [Google Scholar] [CrossRef] [Scilit] [PubMed]
- Demirkıran, B.; Melekoğlu, T.; Żurek, G. Investigating the Acute Effect of Different Training Protocols on Heart Rate Variability. Sports 2026, 14, 299. [Google Scholar] [CrossRef] [Scilit] [PubMed]
- Demirkıran, B.; Işın, A.; Sungur, Y.; Melekoğlu, T. The Impact of 8-Week Re-Training Following a 14-Week Period of Training Cessation on Greco-Roman Wrestlers. PLoS ONE 2025, 20, e0326731. [Google Scholar] [CrossRef] [Scilit] [PubMed]
- Manresa-Rocamora, A.; Flatt, A.A.; Casanova-Lizón, A.; Ballester-Ferrer, J.A.; Sarabia, J.M.; Moya-Ramón, M. Heart Rate Variability-Guided Training for Enhancing Cardiac-Vagal Modulation, Aerobic Fitness, and Endurance Performance: A Methodological Systematic Review with Meta-Analysis. Int. J. Environ. Res. Public Health 2021, 18, 10299. [Google Scholar] [CrossRef] [Scilit] [PubMed]
- Lundstrom, C.J.; Foreman, N.A.; Biltz, G. Practices and Applications of Heart Rate Variability Monitoring in Endurance Athletes. Int. J. Sports Med. 2023, 44, 9–19. [Google Scholar] [CrossRef] [Scilit] [PubMed]
- Addleman, J.S.; Lackey, N.S.; DeBlauw, J.A.; Hajduczok, A.G. Heart Rate Variability Applications in Strength and Conditioning: A Narrative Review. J. Funct. Morphol. Kinesiol. 2024, 9, 93. [Google Scholar] [CrossRef] [Scilit] [PubMed]
- Mirto, M.; Filipas, L.; Altini, M.; Codella, R.; Meloni, A. Heart Rate Variability in Professional and Semiprofessional Soccer: A Scoping Review. Scand. J. Med. Sci. Sports 2024, 34, e14673. [Google Scholar] [CrossRef] [Scilit] [PubMed]
- DeBlauw, J.A.; Stein, J.A.; Blackman, C.; Haas, M.; Makle, S.; Echevarria, I.; Edmonds, R.; Ives, S.J. Heart rate variability of elite female rowers in preparation for and during the national selection regattas: A pilot study on the relation to on water performance. Front. Sports Act. Living 2023, 5, 1245788. [Google Scholar] [CrossRef] [Scilit] [PubMed]
- Rothschild, J.A.; Stewart, T.; Kilding, A.E.; Plews, D.J. Predicting daily recovery during long-term endurance training using machine learning analysis. Eur. J. Appl. Physiol. 2024, 124, 3279–3290. [Google Scholar] [CrossRef] [Scilit] [PubMed]
- Lipka, A.; Luthardt, C.; Tognaccioli, T.; Cairo, B.; Abreu, R.M. Heart rate variability and overtraining in soccer players: A systematic review. Physiol. Rep. 2025, 13, e70357. [Google Scholar] [CrossRef] [Scilit] [PubMed]
- Esco, M.R.; Fields, A.D.; Mohammadnabi, M.A.; Kliszczewicz, B.M. Monitoring Training Adaptation and Recovery Status in Athletes Using Heart Rate Variability via Mobile Devices: A Narrative Review. Sensors 2026, 26, 3. [Google Scholar] [CrossRef] [Scilit] [PubMed]
- Alecu, S.; Onea, G.A. Heart Rate Variability and Perceived Recovery as Predictors of Performance in Athletes Competing in Sprint Events. Sensors 2026, 26, 1877. [Google Scholar] [CrossRef] [Scilit] [PubMed]
- Alfonso, C.; Clarke, D.C.; Capdevila, L. Individual training prescribed by heart rate variability, heart rate and well-being scores in experienced cyclists. Sci. Rep. 2025, 15, 34023. [Google Scholar] [CrossRef] [Scilit] [PubMed]
- Bourdillon, N.; Millet, G.P. Taking heart rate variability to the next level in sports: Towards a multi-signal integration. Front. Sports Act. Living 2026, 8, 1720495. [Google Scholar] [CrossRef] [Scilit] [PubMed]
- Rebelo, A.; Bishop, C.; Thorpe, R.T.; Turner, A.N.; Gabbett, T.J. Monitoring Training Effects in Athletes: A Multidimensional Framework for Decision-Making. Sports Med. 2026, 56, 1603–1624. [Google Scholar] [CrossRef] [Scilit] [PubMed]
- Nuuttila, O.-P.; Schäfer Olstad, D.; Martinmäki, K.; Uusitalo, A.; Kyröläinen, H. Monitoring Sleep and Nightly Recovery with Wrist-Worn Wearables: Links to Training Load and Performance Adaptations. Sensors 2025, 25, 533. [Google Scholar] [CrossRef] [Scilit] [PubMed]

Disclaimer/Publisher’s Note: The statements, opinions and data contained in all publications are solely those of the individual author(s) and contributor(s) and not of MDPI and/or the editor(s). MDPI and/or the editor(s) disclaim responsibility for any injury to people or property resulting from any ideas, methods, instructions or products referred to in the content. |
© 2026 by the author. Licensee MDPI, Basel, Switzerland. This article is an open access article distributed under the terms and conditions of the Creative Commons Attribution (CC BY) license.