


Abstract
Hospital pathology laboratories represent challenging healthcare environments for Indoor Air Quality (IAQ) management due to the coexistence of hazardous chemical emissions, transient pollutant peaks, and stringent ventilation requirements. This study proposes an integrated data-driven framework for IAQ assessment and predictive ventilation management based on a high-resolution monitoring campaign conducted over 17 calendar days in a pathology grossing room (V = 113.90 m3) and an adjacent chemical storage room (V = 56.03 m3). The monitoring system generated 4356 synchronized 1-min observations, of which 4232 complete multivariate records were retained after data-quality screening. The proposed methodology combines three complementary analytical layers: (i) predictive modelling of pollution episodes using supervised machine learning architectures; (ii) multivariate anomaly detection to identify atypical environmental states; and (iii) temporal dependency analysis based on Granger causality and Bayesian networks to investigate predictive relationships between occupancy-related indicators, ventilation behaviour, and pollutant evolution. This integrated framework enables the transition from descriptive IAQ assessment toward predictive environmental management in healthcare facilities. Baseline statistical diagnostics demonstrated the limited capability of conventional linear approaches, with an Ordinary Least Squares (OLS) model explaining only 7.4% of TVOC variability (R2 = 0.074). Ventilation assessment identified an approximately 38% deficit relative to the selected ASHRAE 170 ventilation requirement in the monitored grossing room. Among the evaluated predictive models, Random Forest achieved the highest test-set performance (R2 = 0.78; MAE = 10.5 ppb), enabling short-term forecasting of TVOC evolution. Isolation Forest identified 212 atypical environmental states, corresponding to 5.01% of the valid analytical observations, with substantially higher TVOC concentrations than under normal operating conditions. The proposed framework establishes a transferable methodology for predictive IAQ assessment and ventilation management in chemically intensive healthcare facilities, providing decision-support information for risk-informed HVAC operation within existing regulatory and ventilation requirements.
1. Introduction
Healthcare facilities constitute particularly demanding indoor environments from the perspective of Indoor Air Quality (IAQ) management because they simultaneously accommodate vulnerable patients, healthcare personnel, visitors, and a wide variety of medical activities. Unlike conventional commercial or residential buildings, hospitals operate continuously and contain spaces with markedly different environmental requirements, including operating theatres, intensive care units, isolation rooms, pharmacies, diagnostic facilities, and laboratories.
1.1. Literature Review
Adequate ventilation is a fundamental determinant of indoor environmental quality in healthcare facilities. Previous studies have associated insufficient ventilation with adverse health outcomes, reduced perceived air quality, and increased risk of airborne contaminant transmission. Sundell et al. concluded that inadequate ventilation is consistently associated with adverse health outcomes and increased prevalence of respiratory symptoms, emphasizing the importance of maintaining adequate air exchange rates in occupied environments [1]. Similarly, Seppänen et al. identified significant relationships between ventilation rates, perceived air quality, and occupant performance, demonstrating that environmental conditions directly affect human wellbeing and productivity [2]. Li et al. highlighted the role of ventilation in mitigating airborne disease transmission and identified airflow management as a critical component of infection control strategies in healthcare facilities [3]. Consequently, IAQ management in healthcare buildings has evolved from a comfort-related issue into a multidisciplinary engineering challenge involving ventilation design, environmental monitoring, occupational hygiene, and healthcare risk management.
Numerous monitoring campaigns conducted in healthcare facilities have revealed substantial spatial and temporal variability in indoor pollutant concentrations. Investigations performed in hospitals worldwide have consistently reported the presence of particulate matter, carbon dioxide, volatile organic compounds (VOCs), biological contaminants, and environmental stressors whose concentrations vary according to occupancy, clinical activities, cleaning procedures, ventilation effectiveness, and outdoor environmental conditions [4,5,6,7,8]. Several authors observed that PM2.5 and PM10 concentrations may exceed recommended limits in highly occupied areas, while VOC concentrations often exhibit strong dependence on operational activities rather than occupant density alone [4,5,6,7]. These observations demonstrate that hospital IAQ results from the interaction of multiple pollutant sources whose behavior cannot be adequately represented through isolated measurements or steady-state assumptions.
Despite the growing availability of monitoring data, most hospital IAQ studies remain fundamentally descriptive. Existing investigations primarily focus on pollutant characterization, compliance assessment, and comparison against regulatory thresholds [4,5,6,7,8,9,10]. While these approaches provide valuable information regarding environmental performance, they offer limited capability for anticipating pollution episodes or supporting proactive ventilation management. Several authors have highlighted that short-duration pollution events may represent a significant fraction of total occupational exposure despite having limited influence on long-term average concentrations [9,10]. Consequently, environmental management strategies based exclusively on threshold exceedance analysis may underestimate the complexity of pollutant dynamics in healthcare facilities. More importantly, threshold-based monitoring remains fundamentally reactive: an operational response is triggered only after an undesirable environmental state has already occurred. For chemically intensive environments, this limitation provides a clear motivation for predictive approaches capable of forecasting pollutant evolution before concentration thresholds are exceeded.
Among healthcare facilities, pathology laboratories represent one of the most challenging environments for IAQ management because airborne contamination is strongly influenced by chemical emissions generated during routine laboratory procedures. Grossing rooms, in particular, are characterized by the manipulation of preserved biological specimens and the use of reagents such as formaldehyde, xylene, alcohols, and staining products. Dugheri et al. identified pathology and anatomy laboratories as occupational environments with persistent exposure to airborne chemical contaminants despite the implementation of local extraction systems and general ventilation measures [11]. Similarly, Soonklang et al. reported that occupational exposure to formaldehyde may generate carcinogenic risks exceeding recommended thresholds under certain operational conditions [12]. These findings demonstrate that pollutant dynamics in pathology laboratories are governed not only by occupancy but also by highly localized and intermittent emission sources.
Formaldehyde remains one of the most widely used tissue fixatives in pathology practice due to its effectiveness in preserving biological structures. However, it has also been classified as a human carcinogen and is associated with respiratory irritation, mucosal damage, sensitization, and long-term health risks [11,12,13,14]. Several investigations have demonstrated that formaldehyde rarely appears as an isolated contaminant and typically coexists with complex VOC mixtures originating from solvents, disinfectants, cleaning products, and laboratory reagents [13,14,15]. Consequently, pathology laboratories should be regarded as chemically dynamic environments in which pollutant concentrations may be governed by intermittent source activity, chemical storage and handling, local exhaust operation, and contaminant persistence. Under these conditions, CO2 can remain a useful occupancy-related indicator but cannot be assumed to represent chemical exposure.
Ventilation systems constitute the primary engineering control strategy for reducing airborne contaminant concentrations in pathology laboratories. Healthcare standards such as ASHRAE Standard 170 establish minimum requirements regarding ventilation rates, pressure differentials, filtration systems, and airflow direction to ensure adequate contaminant control [16]. However, several studies have demonstrated that compliance with nominal air-change rates alone does not necessarily guarantee effective contaminant removal [17,18,19,20,21,22]. Airflow organization, thermal stratification, contaminant source location, and local extraction effectiveness may significantly influence pollutant transport and occupant exposure. Ventilation performance should be evaluated through design parameters, but also through its actual ability to remove contaminants from occupied zones. Local exhaust ventilation must therefore be considered jointly with general room ventilation and pressure control when evaluating contaminant removal.
Computational Fluid Dynamics (CFD) studies have considerably improved the understanding of contaminant transport mechanisms in healthcare facilities. Yam et al. demonstrated that different diffuser arrangements may generate substantially different contaminant distributions despite operating at identical ventilation rates [19]. Zhou et al. investigated contaminant accumulation in thermally stratified environments and observed the formation of pollutant lock-up regions that reduce ventilation effectiveness [21]. Similarly, Inthavong et al. reported that local airflow structures around occupants significantly influence inhalation exposure mechanisms [22]. These studies indicate that contaminant transport in healthcare environments is governed by complex interactions among airflow patterns, thermal effects, occupancy, and source characteristics.
The rapid development of low-cost sensors, wireless communication technologies, cloud computing infrastructures, and Internet of Things (IoT) platforms has transformed environmental monitoring practices during the last decade [23,24,25,26,27]. Continuous monitoring systems now enable the acquisition of high-resolution environmental datasets capable of capturing transient pollutant episodes and complex temporal dynamics that remain undetected in conventional inspection-based approaches. Several authors have emphasized that sensor networks constitute a key enabling technology for intelligent building operation, providing the data infrastructure required for advanced environmental analytics and evidence-based decision-making [23,24,25,26,27].
The availability of high-frequency environmental datasets has also promoted the application of machine-learning methods to IAQ prediction. Random Forest, Gradient Boosting, artificial neural networks, and recurrent architectures have been used to model nonlinear relationships between environmental variables and to forecast pollutant concentrations. Compared with conventional linear approaches, these models can accommodate interactions, temporal persistence, and asymmetric concentration distributions. However, most published IAQ forecasting studies have focused on offices, classrooms, residential environments, or occupancy-related pollutants [28]. Amasyali and El-Gohary similarly reported a rapid expansion of machine learning applications in building energy analysis and operational optimization [29]. These methodologies have demonstrated the capability to capture complex non-linear relationships that are difficult to represent through conventional statistical approaches.
Recent research has increasingly focused on hybrid and ensemble machine learning frameworks capable of combining the strengths of multiple predictive algorithms. Salem et al. proposed a hybrid ensemble architecture integrating ANN, Random Forest, XGBoost, Radial Basis Function Networks, Autoencoders, and Decision Trees to improve long-term energy forecasting and decarbonization assessment in buildings [30]. Similarly, ensemble-based methodologies have been successfully applied to hospitality buildings, residential buildings, and smart energy systems, achieving superior predictive performance compared with standalone machine learning models [31,32,33]. These findings suggest that hybrid architectures provide a promising pathway for improving prediction robustness in complex building datasets characterized by multiple interacting variables.
Beyond short-term forecasting applications, machine learning has increasingly been employed to support strategic energy planning and long-term sustainability assessments. Recent investigations have demonstrated that hybrid AI-LSTM frameworks can successfully predict future energy demand trajectories and associated CO2 emissions under different operational scenarios [30,31,32,33,34]. Comparative analyses between conventional buildings and nearly Zero Energy Buildings (nZEBs) revealed substantial differences in long-term energy sensitivity and decarbonization potential, highlighting the value of predictive analytics for supporting evidence-based decision-making [30]. Although these approaches have primarily been applied to energy systems, they illustrate the potential of advanced data-driven methodologies for managing complex environmental processes.
Machine-learning applications to IAQ have increasingly addressed occupancy estimation, CO2 forecasting, particulate-matter prediction, and demand-controlled ventilation. However, most studies have been conducted in offices, classrooms, residential buildings, or other environments in which occupancy represents a major determinant of pollutant generation. Chemically intensive pathology laboratories present a different prediction problem because TVOC concentrations may be driven by intermittent reagent use, localized emissions, storage, ventilation operation, and pollutant persistence. Therefore, predictive relationships developed primarily from occupancy-driven environments cannot be assumed to transfer directly to pathology laboratories [35,36,37,38].
As environmental monitoring systems generate increasingly large and complex datasets, identifying abnormal operating conditions has emerged as a critical challenge for building management. Conventional alarm-based approaches typically rely on predefined thresholds established for individual variables. However, environmental disturbances frequently arise from the simultaneous interaction of multiple factors whose combined behavior may remain undetected when variables are analysed independently. To overcome these limitations, researchers have increasingly adopted anomaly detection methodologies capable of identifying atypical patterns in multidimensional datasets. Several studies have demonstrated that unsupervised learning algorithms such as Isolation Forest, clustering techniques, Principal Component Analysis (PCA), Autoencoders, and deep learning architectures can successfully detect abnormal operational states in HVAC systems, energy networks, and smart buildings [39,40,41,42,43]. Unlike threshold-based methods, these approaches evaluate the joint behaviour of environmental variables, allowing the identification of unusual conditions that may not correspond to exceedances of any individual parameter. Such capabilities are particularly relevant for pathology laboratories, where pollutant episodes often result from complex interactions among ventilation conditions, operational activities, and localized chemical emissions.
Several authors have emphasized that environmental risk cannot always be adequately characterized using concentration thresholds alone. In complex indoor environments, potentially hazardous conditions may emerge from transient combinations of temperature, humidity, ventilation performance, occupancy, and pollutant concentrations even when individual variables remain within acceptable ranges [40,41,42,43,44]. Recent applications of Isolation Forest and multivariate anomaly detection techniques have demonstrated the capability to identify environmental disturbances, sensor faults, operational anomalies, and ventilation deficiencies that remain invisible to traditional monitoring approaches [41,42,43]. This shift from univariate compliance assessment towards multivariate environmental diagnosis represents an important evolution in building analytics because it enables the detection of abnormal states before they develop into critical operational conditions. Despite these advances, applications of anomaly detection to healthcare laboratories remain scarce, particularly in environments characterized by intermittent chemical emissions and rapidly changing pollutant dynamics.
Environmental systems are inherently dynamic, and pollutant concentrations often depend not only on current operating conditions but also on previous environmental states. Consequently, understanding temporal relationships among environmental variables is essential for interpreting pollutant evolution and supporting proactive management strategies. Granger causality provides a statistical framework for testing whether past information from one time series improves prediction of another time series beyond the information contained in its own history. Importantly, statistical Granger causality indicates temporal predictive precedence and should not, by itself, be interpreted as evidence of physical or mechanistic causation [44]. Subsequently, Sims expanded these concepts through multivariate autoregressive frameworks capable of analysing complex interactions among multiple variables simultaneously [45]. More recently, causal analytics have been applied to environmental monitoring, energy systems, and building operation to investigate predictive dependencies that extend beyond conventional correlation analysis [46,47,48]. Unlike standard statistical associations, temporal causality approaches provide information regarding the directionality of predictive relationships, thereby contributing to a more comprehensive understanding of environmental dynamics.
In healthcare environments, pollutant concentrations are influenced by multiple interacting factors including occupancy patterns, ventilation behavior, outdoor conditions, and operational activities. While several studies have reported statistical correlations among these variables, relatively few investigations have explored their temporal interactions using causal inference methodologies [46,47,48,49]. This limitation is particularly evident in pathology laboratories, where pollutant emissions frequently originate from short-duration laboratory procedures rather than from continuous occupancy-related processes. Consequently, understanding whether occupancy indicators precede pollutant accumulation, whether ventilation responses effectively mitigate concentration peaks, or whether environmental variables interact through delayed mechanisms remains an open research question. Temporal causality analysis offers a promising framework for addressing these challenges by identifying directional predictive dependencies and characterizing delayed relationships among environmental variables.
The increasing availability of environmental monitoring data, combined with advances in machine learning and building analytics, has accelerated the transition from reactive building operation towards predictive management strategies. Traditional ventilation systems are typically designed to maintain fixed operating conditions based on conservative assumptions regarding occupancy and contaminant generation. While this approach ensures regulatory compliance, it may result in suboptimal performance under highly dynamic environmental conditions. Recent developments in predictive control, intelligent HVAC operation, and demand-controlled ventilation have demonstrated the potential of data-driven methodologies to anticipate environmental changes and optimize system responses [50,51,52,53]. Nevertheless, most existing implementations rely primarily on occupancy-related indicators such as CO2 concentrations, limiting their applicability in environments where pollutant generation is dominated by chemical emissions rather than human presence. Pathology laboratories therefore constitute an ideal testbed for evaluating predictive ventilation methodologies capable of integrating pollutant forecasting, environmental diagnosis, and operational decision support. Any predictive control layer considered for such spaces should operate in addition to, and not in substitution for, mandatory minimum ventilation, containment, and pressure-control requirements.
The convergence of Building Management Systems (BMS), Internet of Things (IoT) infrastructures, advanced sensing technologies, and artificial intelligence is driving the transition towards Smart Healthcare Buildings capable of continuously adapting their operation to changing environmental conditions. Within this context, Digital Twin frameworks have emerged as a promising approach for integrating real-time monitoring, predictive analytics, and operational decision support into a unified cyber-physical environment. Recent studies have demonstrated that Digital Twins can enhance HVAC management, optimize energy consumption, improve fault detection capabilities, and support predictive maintenance strategies through the continuous synchronization of physical and virtual building assets [53,54,55]. The integration of environmental sensing and predictive analytics also provides a potential basis for future BMS and Digital Twin applications. However, predictive IAQ implementation in chemically intensive healthcare spaces remains limited [26,27,52].
The literature therefore reveals three relevant limitations. First, most pathology-laboratory IAQ investigations remain primarily descriptive or exposure-oriented rather than predictive. Second, IAQ forecasting studies have largely focused on occupancy-driven environments rather than spaces characterized by intermittent chemical emissions. Third, predictive modelling, multivariate anomaly detection, ventilation assessment, and temporal dependency analysis are generally investigated independently. To the authors’ knowledge, their combined application to high-resolution monitoring data from a hospital pathology laboratory has not previously been systematically evaluated.
1.2. Contributions
To address these limitations, this study develops an integrated data-driven framework for IAQ assessment and predictive ventilation management in hospital pathology laboratories. The framework combines: (i) supervised machine-learning models for short-term TVOC forecasting; (ii) multivariate anomaly-detection methods for identifying atypical environmental states; and (iii) temporal dependency analysis based on Granger causality and Bayesian networks. The methodology is evaluated using high-temporal-resolution measurements obtained from a pathology grossing room and an adjacent chemical storage room. The principal contribution lies in integrating forecasting, diagnosis, ventilation assessment, and temporal interpretation within a common framework specifically applied to a chemically intensive healthcare environment.
2. Materials and Methods
2.1. Environmental Setting and Regulatory Framework
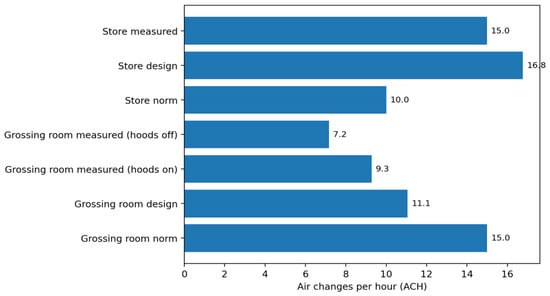
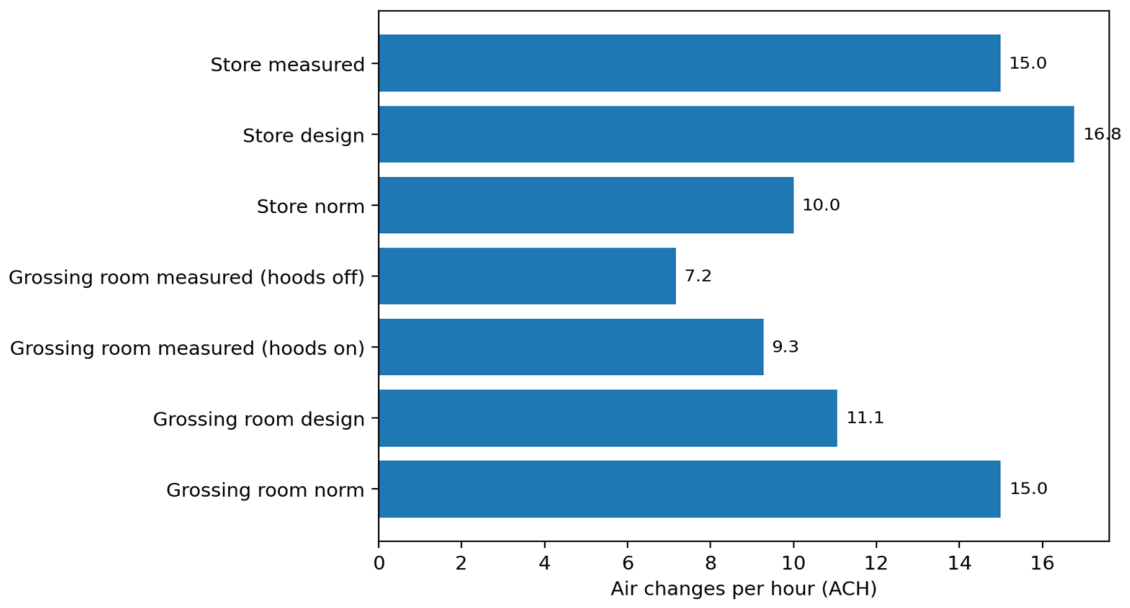
The experimental campaign was conducted in the pathology department of a tertiary healthcare facility. Two adjacent functional areas were monitored: (i) a pathology grossing room (V = 113.90 m3), where tissue examination and reagent-handling activities were routinely performed and which constituted the primary chemical-emission source zone; and (ii) an adjacent chemical storage room (V = 56.03 m3), used for reagent storage and considered as a secondary area for comparative environmental analysis. The two monitored areas presented different ventilation and operational conditions. In the pathology grossing room, general mechanical ventilation operated in combination with local exhaust ventilation (LEV) associated with the grossing activities. The measured airflow rate was approximately 817 m3·h−1 with the local exhaust hoods inactive and increased to 1057 m3·h−1 when the hoods were operating, corresponding to 7.2 and 9.3 ACH, respectively. The measured pressure differential in this room was approximately −2 Pa. In the adjacent chemical storage room, the measured ventilation airflow was approximately 840 m3·h−1, corresponding to 15.0 ACH, while the pressure differential remained close to 0 Pa under the monitored conditions. Windows in the storage room were frequently opened during the monitoring campaign, which should be considered when interpreting its pressure conditions. Accordingly, the two rooms were treated as distinct ventilation and pollutant-source environments in the subsequent analysis.
Grossing rooms are classified as high-risk hospital spaces due to the routine use of chemical agents such as formaldehyde and xylene and therefore require stringent ventilation control strategies. According to ASHRAE Standard 170, these environments should operate under dedicated ventilation conditions with restricted recirculation, a minimum ventilation rate of 15 ACH, and negative pressurization relative to adjacent spaces to reduce contaminant migration. Accordingly, the ventilation performance of the two rooms was evaluated separately because they represent different ventilation regimes and pollutant-source conditions, while the connecting doorway provides a potential pathway for inter-room contaminant transfer when open.
2.2. Multi-Sensor Data Architecture
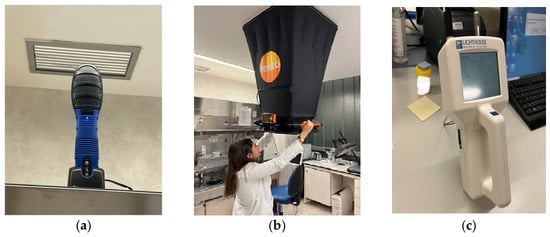
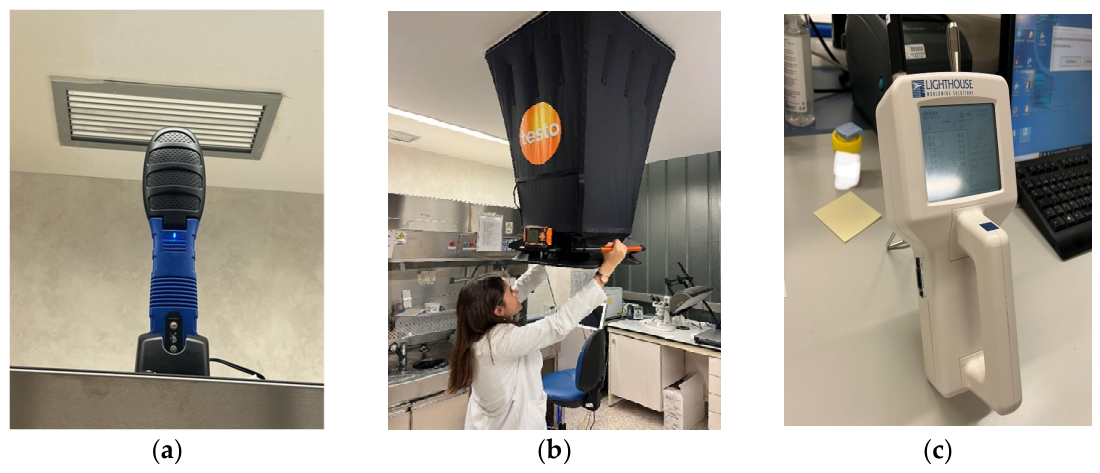
A high-resolution environmental monitoring network was deployed over a 17-calendar-day campaign to capture short-term fluctuations in Indoor Air Quality (IAQ) and ventilation behaviour. Data acquisition was performed during the laboratory monitoring and operational periods rather than as uninterrupted 24-h recording throughout the entire campaign (Figure 1). All environmental and operational data streams were recorded or synchronized at a common temporal resolution of 1 min. Across the 17-day campaign, the monitored acquisition periods yielded 4356 synchronized observations. Following the data-quality screening procedure described in Section 2.4, 4232 complete multivariate observations were retained for the subsequent analytical stages. The monitoring framework comprised three groups of variables. The first group included indoor air-quality parameters: total volatile organic compounds (TVOC), formaldehyde (HCHO), carbon monoxide (CO), carbon dioxide (CO2), ozone (O3), and nitrogen dioxide (NO2). The second group comprised the hygrothermal variables indoor air temperature and relative humidity. The third group included ventilation and operational parameters, namely airflow rate, pressure differential between monitored spaces, and the operating status of the local exhaust ventilation (LEV) systems. Ventilation and operational variables were obtained from direct measurements and from the facility supervisory control system, as applicable. All measurement streams were subsequently synchronized to the common 1-min temporal resolution used in the analytical dataset.
Figure 1.
Equipment of IAQ, ventilation and pollution of particles in the Hospital. (a) environmental/IAQ monitoring device; (b) airflow measurement equipment used for ventilation characterization; and (c) particle/environmental monitoring instrument.
Environmental sensors were positioned within the representative occupied zone of each monitored space and away from direct contact with the pollutant source or ventilation terminal, unless the measurement specifically concerned airflow or extraction performance. Sensor locations were maintained unchanged throughout the monitoring campaign to preserve spatial consistency. Airflow measurements were performed at the corresponding ventilation terminals, while pressure measurements characterized the pressure relationship between the monitored spaces.
Environmental measurements were temporally synchronized with available operational records, including documented reagent-handling periods and LEV activation sequences. Operational timestamps were matched to the nearest 1-min environmental record.
2.3. Ventilation Deficit Analysis
Ventilation performance was evaluated by comparing the measured operating conditions with the design requirements and regulatory recommendations applicable to hospital pathology facilities. The assessment considered airflow rates, Air Changes per Hour (ACH), and pressure differentials for both monitored zones.
Air exchange rates were calculated according to:
where represents the volumetric airflow rate (m3·h−1) and V is the room volume (m3).
The evaluation framework was benchmarked against ASHRAE Standard 170 criteria, considering minimum ventilation rates and pressure control requirements for pathology grossing rooms. Table 1 summarizes the reference conditions and measured operating parameters used in the analysis.
Table 1.
Ventilation performance characterization of study zones.
The grossing room operated below the regulatory target ventilation rate, reaching a maximum of 9.3 ACH under full hood operation. Relative to the ASHRAE requirement of 15 ACH, this represents a ventilation deficit of approximately 38%. Likewise, the measured pressure differential (−2 Pa) remained below the target negative pressurization level (−10 Pa), suggesting reduced containment capability and potential contaminant migration.
2.4. Data Preprocessing and Feature Engineering
The raw environmental dataset underwent a preprocessing workflow prior to predictive modelling and anomaly detection to ensure temporal consistency and improve feature representativeness. The preprocessing stage included synchronization of all environmental and operational variables at a unified sampling interval of 1 min, matching pollutant concentrations, hygrothermal variables, ventilation states, and operational laboratory events.
Missing observations and sensor inconsistencies were evaluated before analysis. Records containing missing values in any of the variables required for the multivariate analysis, incomplete temporal synchronization, duplicated timestamps, or invalid sensor readings were excluded prior to model development. No synthetic values were introduced for observations lacking complete multivariate information. From the initial 4356 synchronized records, 124 observations did not satisfy the completeness and consistency criteria, resulting in a final analytical dataset of 4232 valid observations. Environmental streams were temporally aligned with operational records, including local exhaust ventilation (LEV) activation periods and reagent-handling activities. This synchronization enabled the reconstruction of dynamic cause–effect relationships between ventilation behavior and pollutant evolution.
Given the transient nature of VOC emissions in pathology environments, feature engineering was implemented to capture temporal persistence, delayed responses, and short-term escalation phenomena. Four complementary feature families were generated:
- Rolling statistical descriptors: moving mean, standard deviation, minimum, maximum, and local trend slope calculated over temporal windows of 5, 15, and 30 min to represent local pollutant accumulation dynamics.
- Lagged variables: delayed states (t − 1, t − 2, t − 5 and t − 10) were incorporated for each environmental parameter to account for chemical residence effects and delayed ventilation response.
- Temporal derivatives: first-order variations (ΔTVOC, ΔCO, ΔCO2, ΔT and ΔRH) were computed to identify abrupt environmental transitions and early pollution escalation processes.
- Cyclical temporal encodings: sinusoidal and cosine transformations of hour-of-day and day-of-week variables were included to represent periodic operational behavior associated with laboratory activity.
Interaction terms between environmental variables (e.g., T × RH and CO × CO2) were additionally generated to capture coupled effects not observable through univariate descriptors. The resulting feature space was subsequently used as input for predictive modelling and anomaly detection analyses.
2.5. Environmental Data Integration Framework
The analytical workflow was built upon a multi-source environmental integration architecture combining monitored variables, ventilation parameters, and operational information from the pathology laboratory. This approach enabled the contextualization of pollutant behavior beyond isolated sensor measurements.
The integration framework incorporated three complementary information layers:
- Environmental layer: continuous monitoring of pollutant concentrations (TVOC, HCHO, CO, CO2, O3 and NO2) together with hygrothermal conditions (temperature and relative humidity).
- Ventilation layer: engineering parameters describing airflow distribution and containment performance, including room volumes, measured airflow rates, calculated ACH values, and pressure differential measurements.
- Operational layer: synchronization with laboratory activity records and HVAC supervisory signals, including reagent handling periods, local exhaust ventilation (LEV) activation sequences, and ventilation operating states obtained from the SCADA infrastructure.
This integration strategy enabled the correlation of transient pollutant events with ventilation conditions and operational activities, supporting subsequent predictive modelling, anomaly detection, and causality analyses.
2.6. Predictive Modelling Framework
To characterize and anticipate pollution dynamics in the pathology laboratory, a predictive modelling framework based on supervised machine learning was developed. The objective was to forecast future pollutant evolution and identify early indicators of Indoor Air Quality (IAQ) degradation under transient operating conditions.
The predictive architecture was formulated as a regression problem, where future Total Volatile Organic Compound (TVOC) concentrations constituted the target variable. The modelling strategy incorporated both instantaneous environmental measurements and engineered temporal descriptors to capture delayed pollutant responses and chemical persistence effects.
Three machine learning families were comparatively evaluated:
- Random Forest (RF): selected due to its ability to capture nonlinear interactions, robustness against outliers, and capacity to estimate feature importance.
- Gradient Boosting models: considered because of their suitability for high-dimensional tabular datasets and their capacity to model asymmetric pollutant distributions.
- Long Short-Term Memory (LSTM) networks: incorporated to exploit temporal dependencies and sequential pollutant accumulation behavior.
Conventional statistical baselines were additionally included for benchmarking purposes, namely Ordinary Least Squares (OLS), persistence prediction, and moving-average estimators. These baseline approaches were used to quantify the added value introduced by nonlinear learning methods.
The predictive feature space incorporated the engineered descriptors described in Section 2.4, including rolling statistics, lagged variables, temporal derivatives, interaction terms, and cyclical encodings. Table 2 summarizes the implemented feature families and their functional role within the modelling workflow.
Table 2.
Application of Predictive Models.
Model performance was assessed using regression metrics including coefficient of determination (R2), Mean Absolute Error (MAE), and Root Mean Square Error (RMSE). Temporal validation was adopted to preserve chronological consistency and avoid information leakage between training and evaluation periods. Feature scaling parameters, when required for the LSTM model, were estimated exclusively from the training subset and subsequently applied unchanged to the validation and testing subsets.
To enhance predictive power, the feature space was expanded (Table 2) including rolling windows, lagged values, and cyclical time encodings.
2.7. Multivariate Anomaly Detection Framework
Given the multivariate and transient nature of pollutant dynamics in pathology laboratories, anomaly detection techniques were incorporated to identify atypical environmental states that may remain undetected using conventional threshold approaches.
Unlike univariate monitoring strategies based on fixed limits, the proposed methodology evaluates the joint behaviour of environmental variables, ventilation conditions, and operational signals to identify deviations from normal operating states.
The anomaly detection workflow incorporated three methodological families:
- Isolation Forest (IF): selected as the primary algorithm due to its scalability and capacity to isolate anomalous observations without assuming Gaussian distributions.
- Local Outlier Factor (LOF): included to evaluate local-density deviations and contextual anomalies.
- Variational Autoencoder (VAE): considered to capture nonlinear latent representations and reconstruction-based anomaly scores.
For comparison purposes, a conventional Z-score approach was included as a univariate reference baseline.
The anomaly detection process generated an anomaly score for each observation, allowing the classification of environmental states into normal and atypical operating conditions. The methodology enabled the identification of pollutant episodes associated with ventilation malfunctions, abnormal chemical emissions, or operational deviations.
Table 3 summarizes the anomaly detection methods and their implementation characteristics.
Table 3.
Method Multivariate Anomaly Detection.
2.8. Temporal Predictive Dependency Analysis
To complement predictive and anomaly analyses, temporal dependency methods were applied to investigate whether past environmental states contained statistically significant information for predicting subsequent TVOC evolution. Granger causality tests were applied to determine whether historical information from environmental variables improves the prediction of future TVOC concentrations beyond the information contained in the pollutant series itself.
The causality analysis was performed using lagged environmental streams including temperature, relative humidity, and CO2 concentration. Statistical significance was evaluated through F-tests under different lag configurations.
In parallel, Structural Bayesian Networks were developed to characterize conditional dependencies among environmental variables and support explanatory analysis of pollutant behavior.
The integration of causality analysis with predictive modelling and anomaly detection enabled the transition from descriptive IAQ assessment toward explainable environmental analytics.
3. Results and Discussion
3.1. Ventilation Performance and Baseline Environmental Assessment
The baseline environmental assessment revealed substantial differences between the monitored areas regarding ventilation effectiveness and pollutant control. The grossing room emerged as the critical zone due to its intensive chemical activity and reduced ventilation performance relative to regulatory targets.
Figure 2 compares the measured Air Changes per Hour (ACH) with the design requirements established for the monitored areas. Despite operating under full exhaust hood activation, the grossing room reached a maximum ventilation rate of 9.3 ACH, remaining below the 15 ACH requirement established by ASHRAE Standard 170. Relative to the design target, this represents an approximate ventilation deficit of 38%.
Figure 2.
Comparison between measured and regulatory ACH values in monitored zones.
In addition to reduced airflow performance, pressure control conditions also deviated from the recommended containment requirements. The measured pressure differential reached −2 Pa, remaining below the target negative pressurization level of −10 Pa required for pathology laboratories. This reduction in containment performance may increase the probability of contaminant migration during high-emission events.
By contrast, the chemical storage room reached approximately 15 ACH, exceeding the selected 10 ACH reference value. However, the measured pressure differential remained close to 0 Pa under the monitored conditions.
3.2. Environmental Compliance and Temporal Behavior of Pollutants
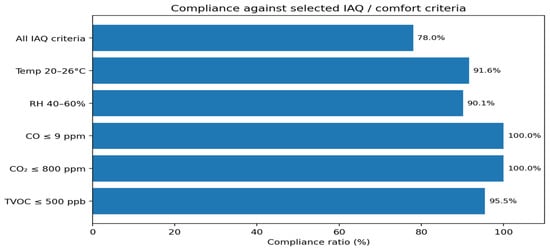
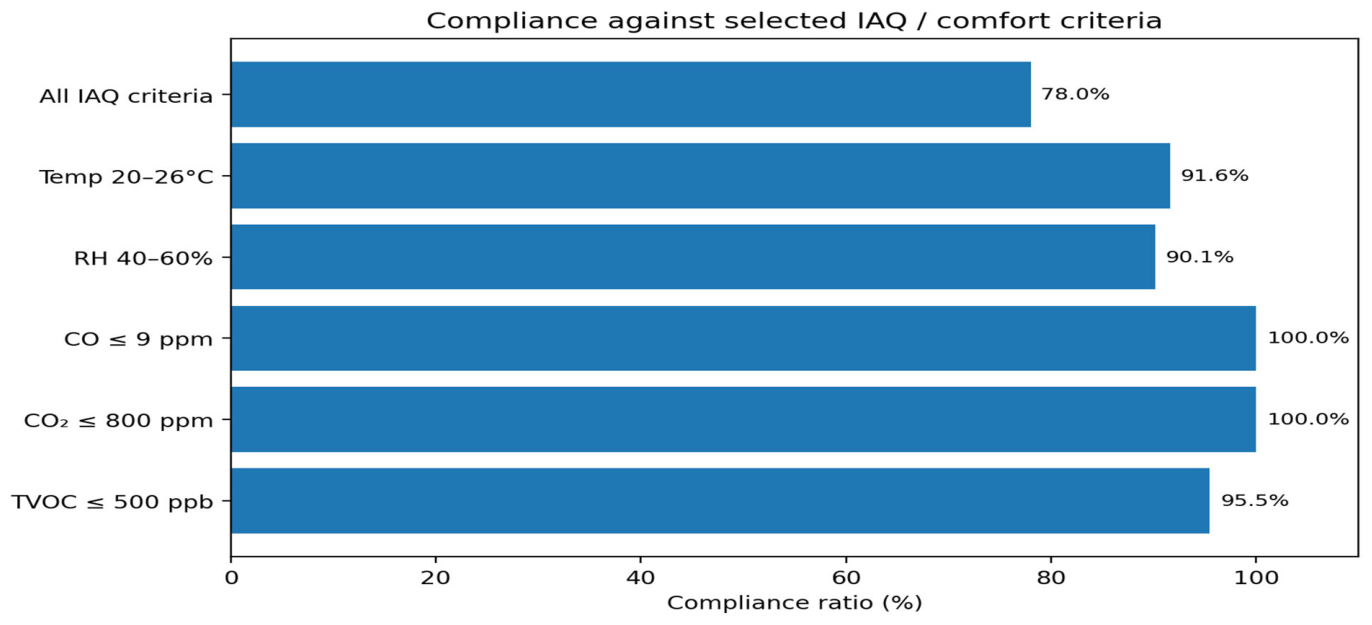
Initial compliance assessment demonstrated different behaviors between occupancy-related pollutants and chemically driven contaminants. CO2 and CO concentrations remained below the selected reference limits throughout the analysed periods. This indicates that these conventional occupancy-related indicators did not signal substantial IAQ deterioration, despite the ventilation deficit subsequently identified from airflow measurements.
However, deviations were identified for TVOC, temperature, and relative humidity, which represented the main drivers of environmental non-compliance (Figure 3). These results indicate that the observed IAQ deviations were not adequately represented by occupancy-related indicators alone and were consistent with the presence of additional chemically driven pollutant sources.
Figure 3.
Compliance ratios for IAQ and thermal comfort indicators.
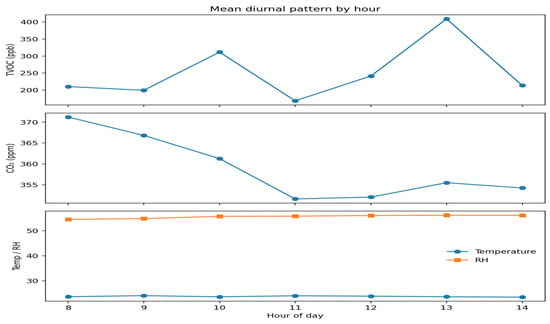
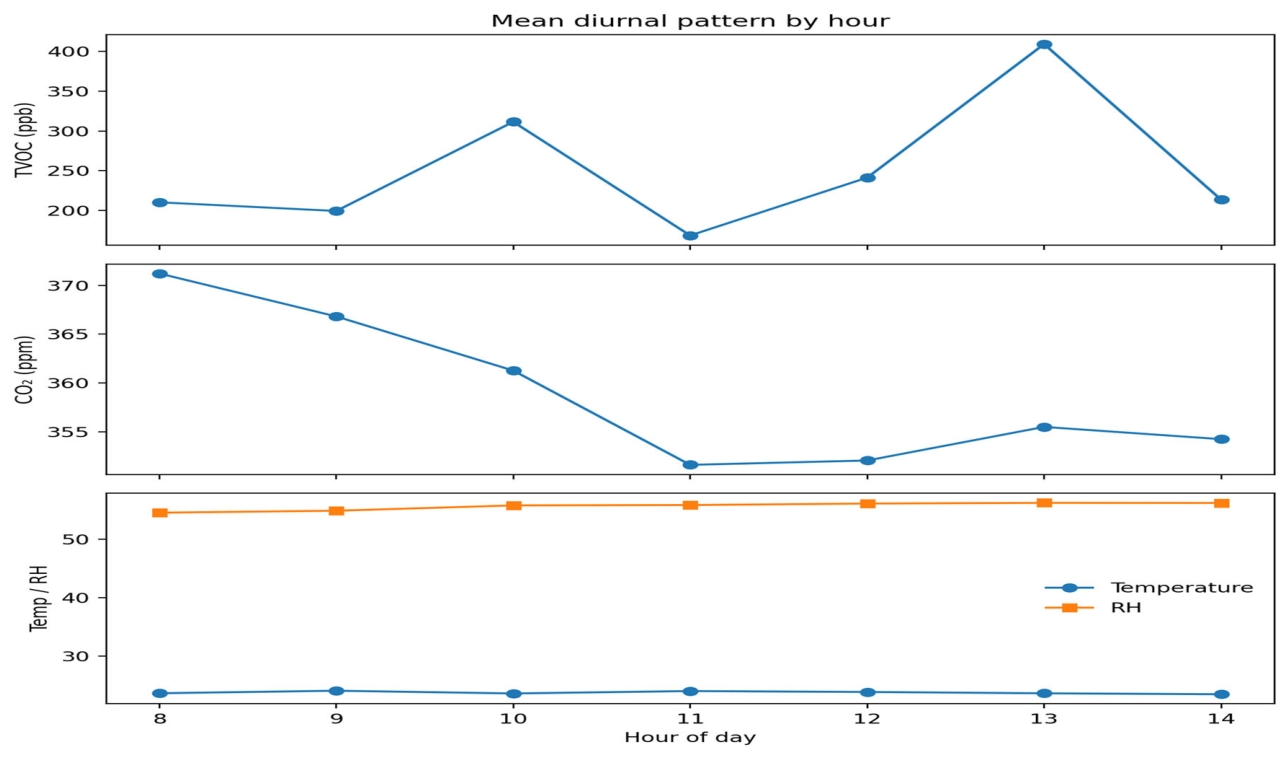
The temporal evolution of TVOC concentrations (Figure 4) exhibited higher concentrations during midday and early afternoon operational periods. Although this timing is consistent with increased laboratory activity, the available data do not permit individual concentration peaks to be unambiguously assigned to specific reagent-handling operations.
Figure 4.
Mean diurnal evolution of TVOC concentration.
3.3. Diagnostic Statistical Assessment and Motivation for Nonlinear Analytics
To evaluate the suitability of conventional analytical approaches, a baseline statistical diagnosis was performed prior to advanced modelling (Figure 5).
Figure 5.
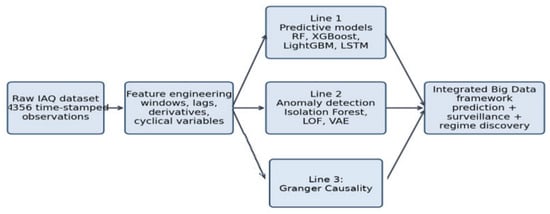
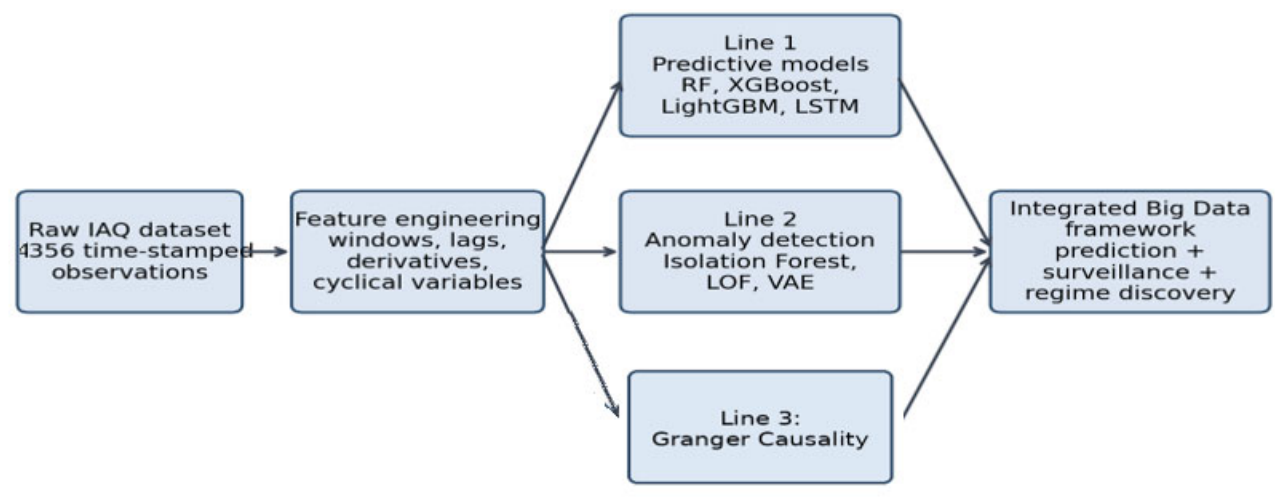
Conceptual Big Data framework.
The Ordinary Least Squares (OLS) model showed limited explanatory capability, accounting for only 7.4% of TVOC variability (R2 = 0.074). Residual diagnostics revealed pronounced deviations from Gaussian assumptions, with extreme skewness (14.95) and kurtosis (298.4), yielding a Jarque–Bera statistic of 16,002,883.
These results indicate that pollutant evolution in pathology laboratories cannot be adequately represented through simple linear relationships and instead exhibit highly asymmetric and transient behavior.
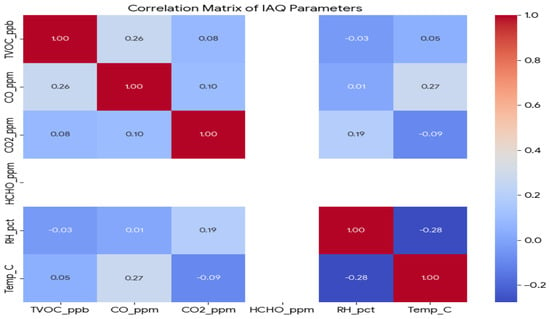
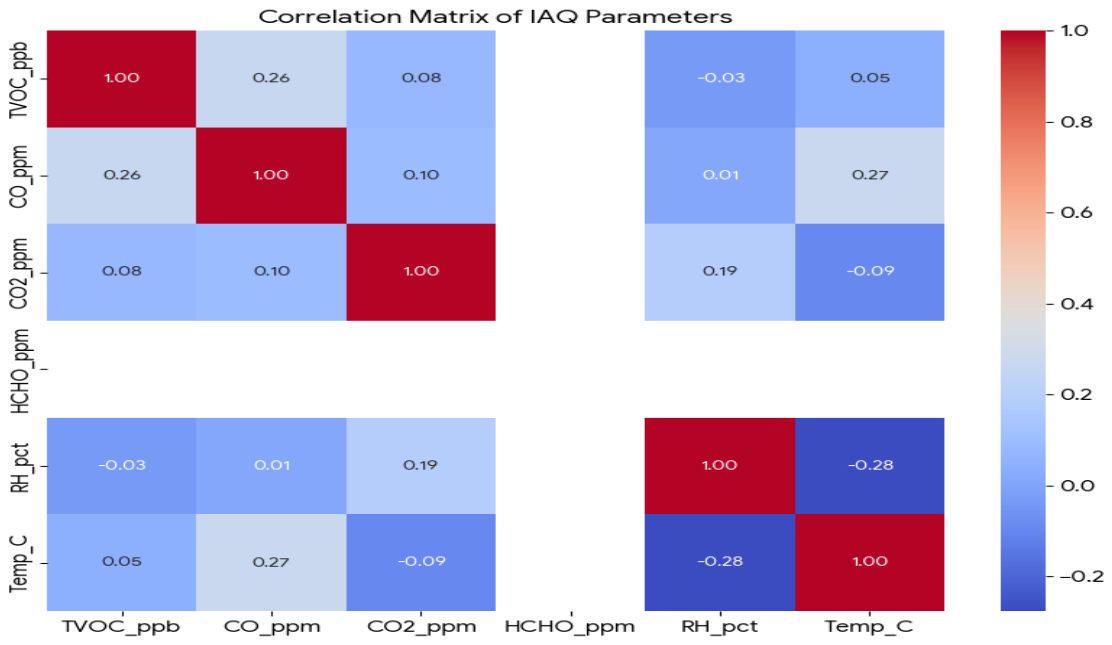
Correlation analysis further supported this interpretation. Pairwise relationships among environmental variables remained generally weak, with moderate associations observed only between CO and temperature (r = 0.28) and between TVOC and CO (r = 0.26). The Pearson correlation matrix shown in Figure 6 confirms that no strong instantaneous linear association dominated TVOC variability.
Figure 6.
Pearson correlation matrix of monitored environmental variables.
3.4. Predictive Modelling Results for Pollution Episode Forecasting
3.4.1. Characterization of Pollution Episodes
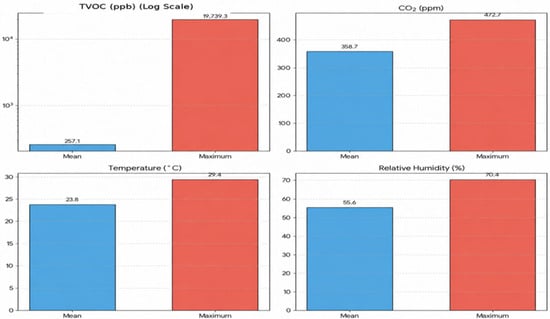
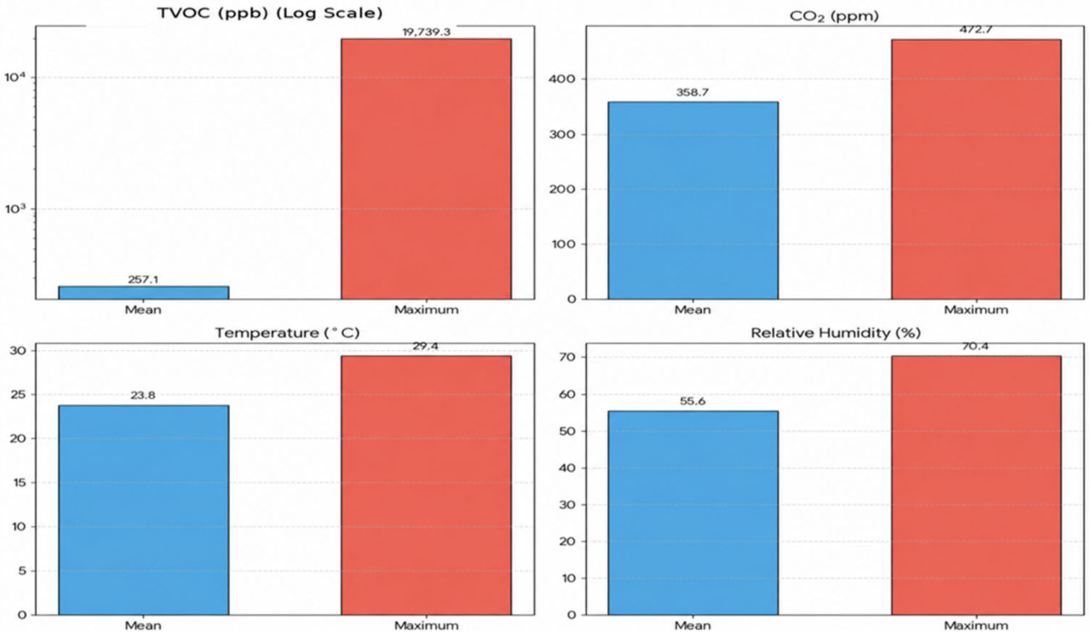
The environmental monitoring campaign revealed that pollutant dynamics in the pathology laboratory were dominated by High-Intensity Short-Duration (HISD) events, particularly for Total Volatile Organic Compounds (TVOC). The descriptive statistics showed strong variability, with a mean TVOC concentration of 257.1 ppb and a standard deviation of 684.9 ppb, indicating that conventional averages do not adequately represent exposure dynamics (Figure 7).
Figure 7.
Statistical characterization of pollutant variability and extreme events.
A total of 195 pollution episodes exceeding 500 ppb TVOC were identified, representing approximately 4.61% of the monitoring period. Extreme events reached peak concentrations of 19,739 ppb, illustrating the occurrence of transient high-concentration events within the monitored laboratory environment.
3.4.2. Characterization of the Predictive Performance of Machine Learning Models
The predictive framework evaluated different modelling families to capture nonlinear pollutant behaviour and temporal dependencies within the environmental dataset.
Among the analyzed architectures, Random Forest achieved the highest predictive performance, reaching R2 = 0.78 and MAE = 10.5 ppb, substantially outperforming the linear baseline model (OLS: R2 = 0.074).
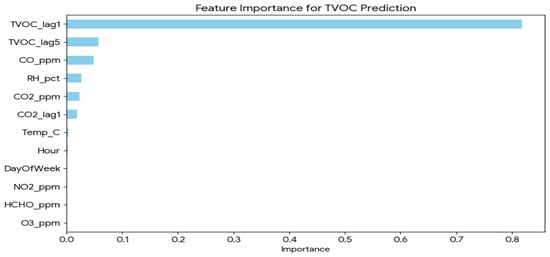
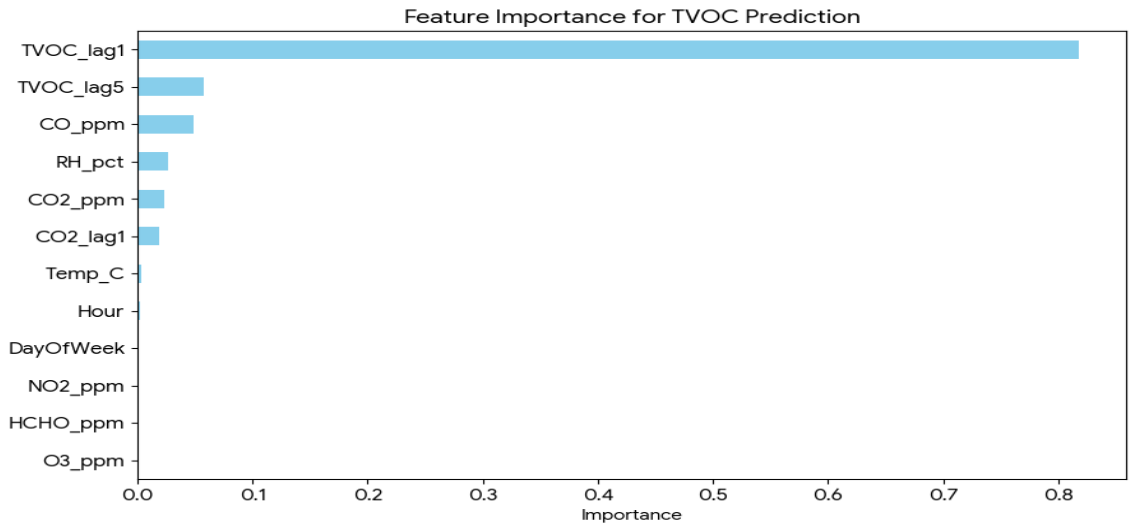
Feature importance analysis revealed that predictive performance was primarily driven by temporal descriptors, particularly lagged variables and rolling statistics, indicating that pollutant evolution depends strongly on short-term accumulation effects and operational persistence.
The most influential predictors included previous TVOC states, temporal derivatives, and activity-related indicators associated with laboratory operation.
Random Forest feature importance indicated that prediction relied predominantly on recent TVOC states, lagged descriptors, rolling statistics, and temporal derivatives (Figure 8). This result is consistent with strong short-term persistence in the TVOC time series but should not be interpreted as direct identification of the physical dispersion mechanisms governing the room.
Figure 8.
Relative feature importance obtained from the Random Forest model.
Figure 8 reports the model-specific feature importance obtained from the Random Forest architecture. Equivalent native feature-importance measures were not directly compared across Gradient Boosting and LSTM because their internal representations are methodologically different; therefore, the figure is used specifically to interpret the selected Random Forest model.
3.4.3. Temporal Validation of Predictive Performance
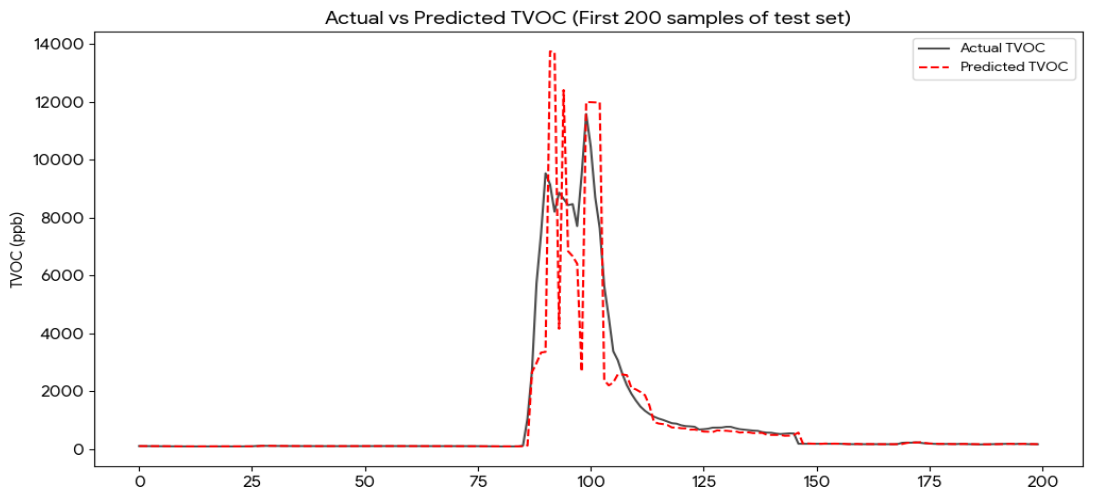
Temporal validation of the selected Random Forest model showed agreement between measured and predicted TVOC concentrations over the independent test period (Figure 9). The model successfully captured the onset and evolution of pollution episodes, although slight underestimation was observed for the most extreme concentration peaks. Despite this limitation, predictive performance remained robust across the monitoring period.
Figure 9.
Measured and Random-Forest-predicted TVOC concentrations over the independent temporal test period.
For the evaluated 15/30 min forecasting horizon, these results indicate the potential for an anticipatory control signal prior to some high-TVOC events. Such predictive activation would need to operate while maintaining the minimum ventilation and pressure-control requirements applicable to the space.
3.5. Multivariate Anomaly Detection Results
3.5.1. Identification of Atypical Environmental States
The Isolation Forest model, selected as the primary anomaly-detection algorithm following the comparative analysis described in the section above, was applied to identify environmental states deviating from normal operating conditions in the pathology laboratory.
Isolation Forest identified 212 anomalous observations, corresponding to 5.01% of the 4232 valid analytical records. During these events, mean TVOC concentration increased to 1639.3 ppb, approximately 6.4 times higher than the global dataset mean (257 ppb), confirming that anomaly periods were associated with substantial chemical load increments.
The detected anomalies were characterized not only by elevated pollutant concentrations but also by atypical combinations of environmental variables, ventilation conditions, and operational states.
Table 4 summarizes the quantitative characteristics of anomalous and normal operating periods.
Table 4.
Quantitative characterization of anomalous environmental states.
3.5.2. Multivariate Environmental Relationships and Phase-Space Analysis
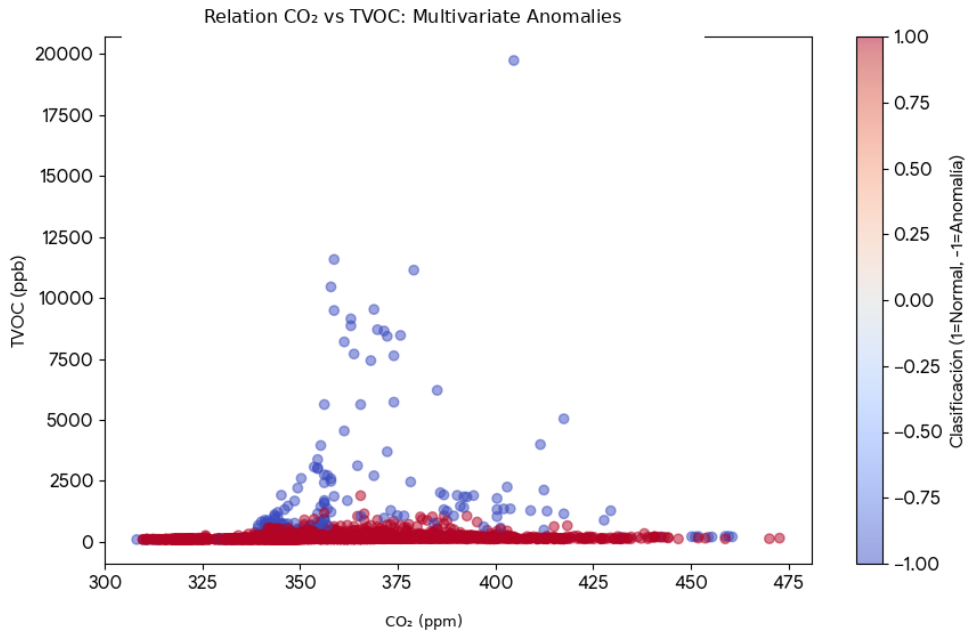
To investigate the environmental structure of detected anomalies, the relationship between occupancy indicators and chemical load was analyzed using the CO2–TVOC phase space (Figure 10).
Figure 10.
CO2, TVOC phase-space representation and detected anomalies.
The results revealed a dense cluster of normal operating conditions concentrated within the expected CO2 range, whereas anomalous observations appeared as isolated regions characterized by elevated TVOC concentrations and atypical environmental combinations.
A relevant pattern was the occurrence of observations combining elevated TVOC concentrations with comparatively low CO2 levels. These states indicate that elevated chemical-pollutant concentrations were not consistently accompanied by elevated values of the CO2-based occupancy proxy. Potential explanations include residual emissions, intermittent chemical handling, pollutant persistence, or ventilation conditions; however, the available operational records do not permit a unique causal mechanism to be assigned to each event. These observations may be associated with residual emissions, ventilation inefficiencies, or chemical persistence phenomena.
This behavior indicates that conventional occupancy indicators alone are insufficient to characterize pollutant risk in chemically intensive hospital environments.
3.5.3. Anomaly Score Distribution and Risk Characterization
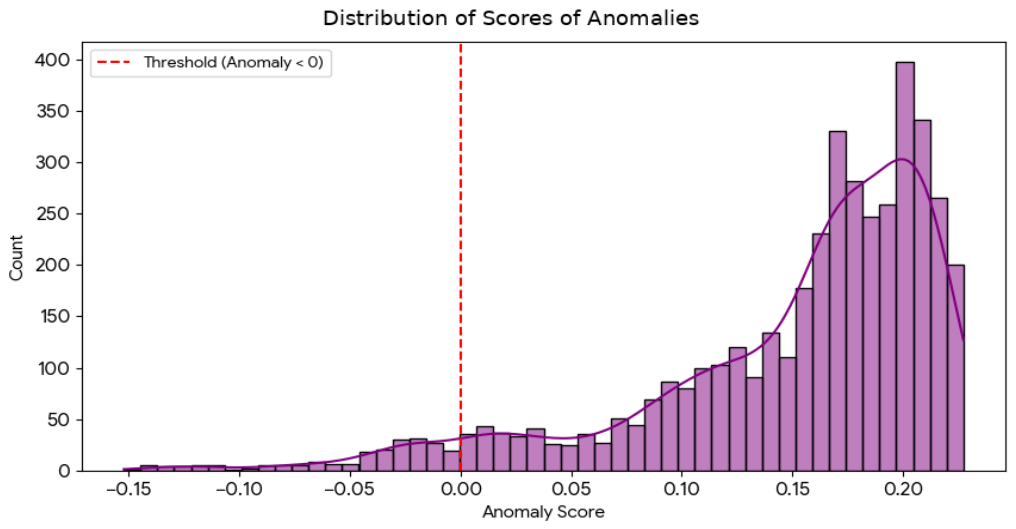
The Isolation Forest model assigned a continuous anomaly score to each observation, providing a quantitative measure of multivariate statistical atypicality.
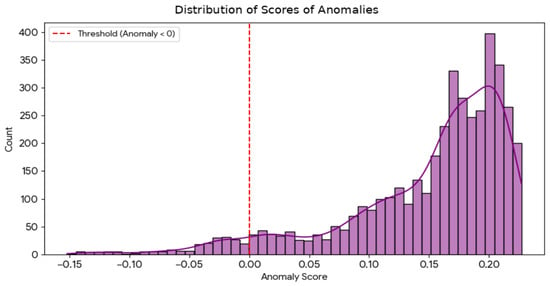
Figure 11 shows the distribution of anomaly scores. Most observations remained within the normal operating region, whereas anomalous states formed a distinct lower-tail distribution located below the decision threshold.
Figure 11.
Distribution of anomaly scores for environmental state classification.
The score distribution provides a clear operational separation between observations classified by the model as normal and anomalous. Because independent ground-truth anomaly labels were unavailable, this separation should be interpreted as statistical rather than as a direct measure of environmental hazard The most critical scores corresponded to events where multiple variables simultaneously deviated from normal conditions, including abrupt pollutant escalation and ventilation imbalance.
3.5.4. Temporal Distribution of Detected Anomalies
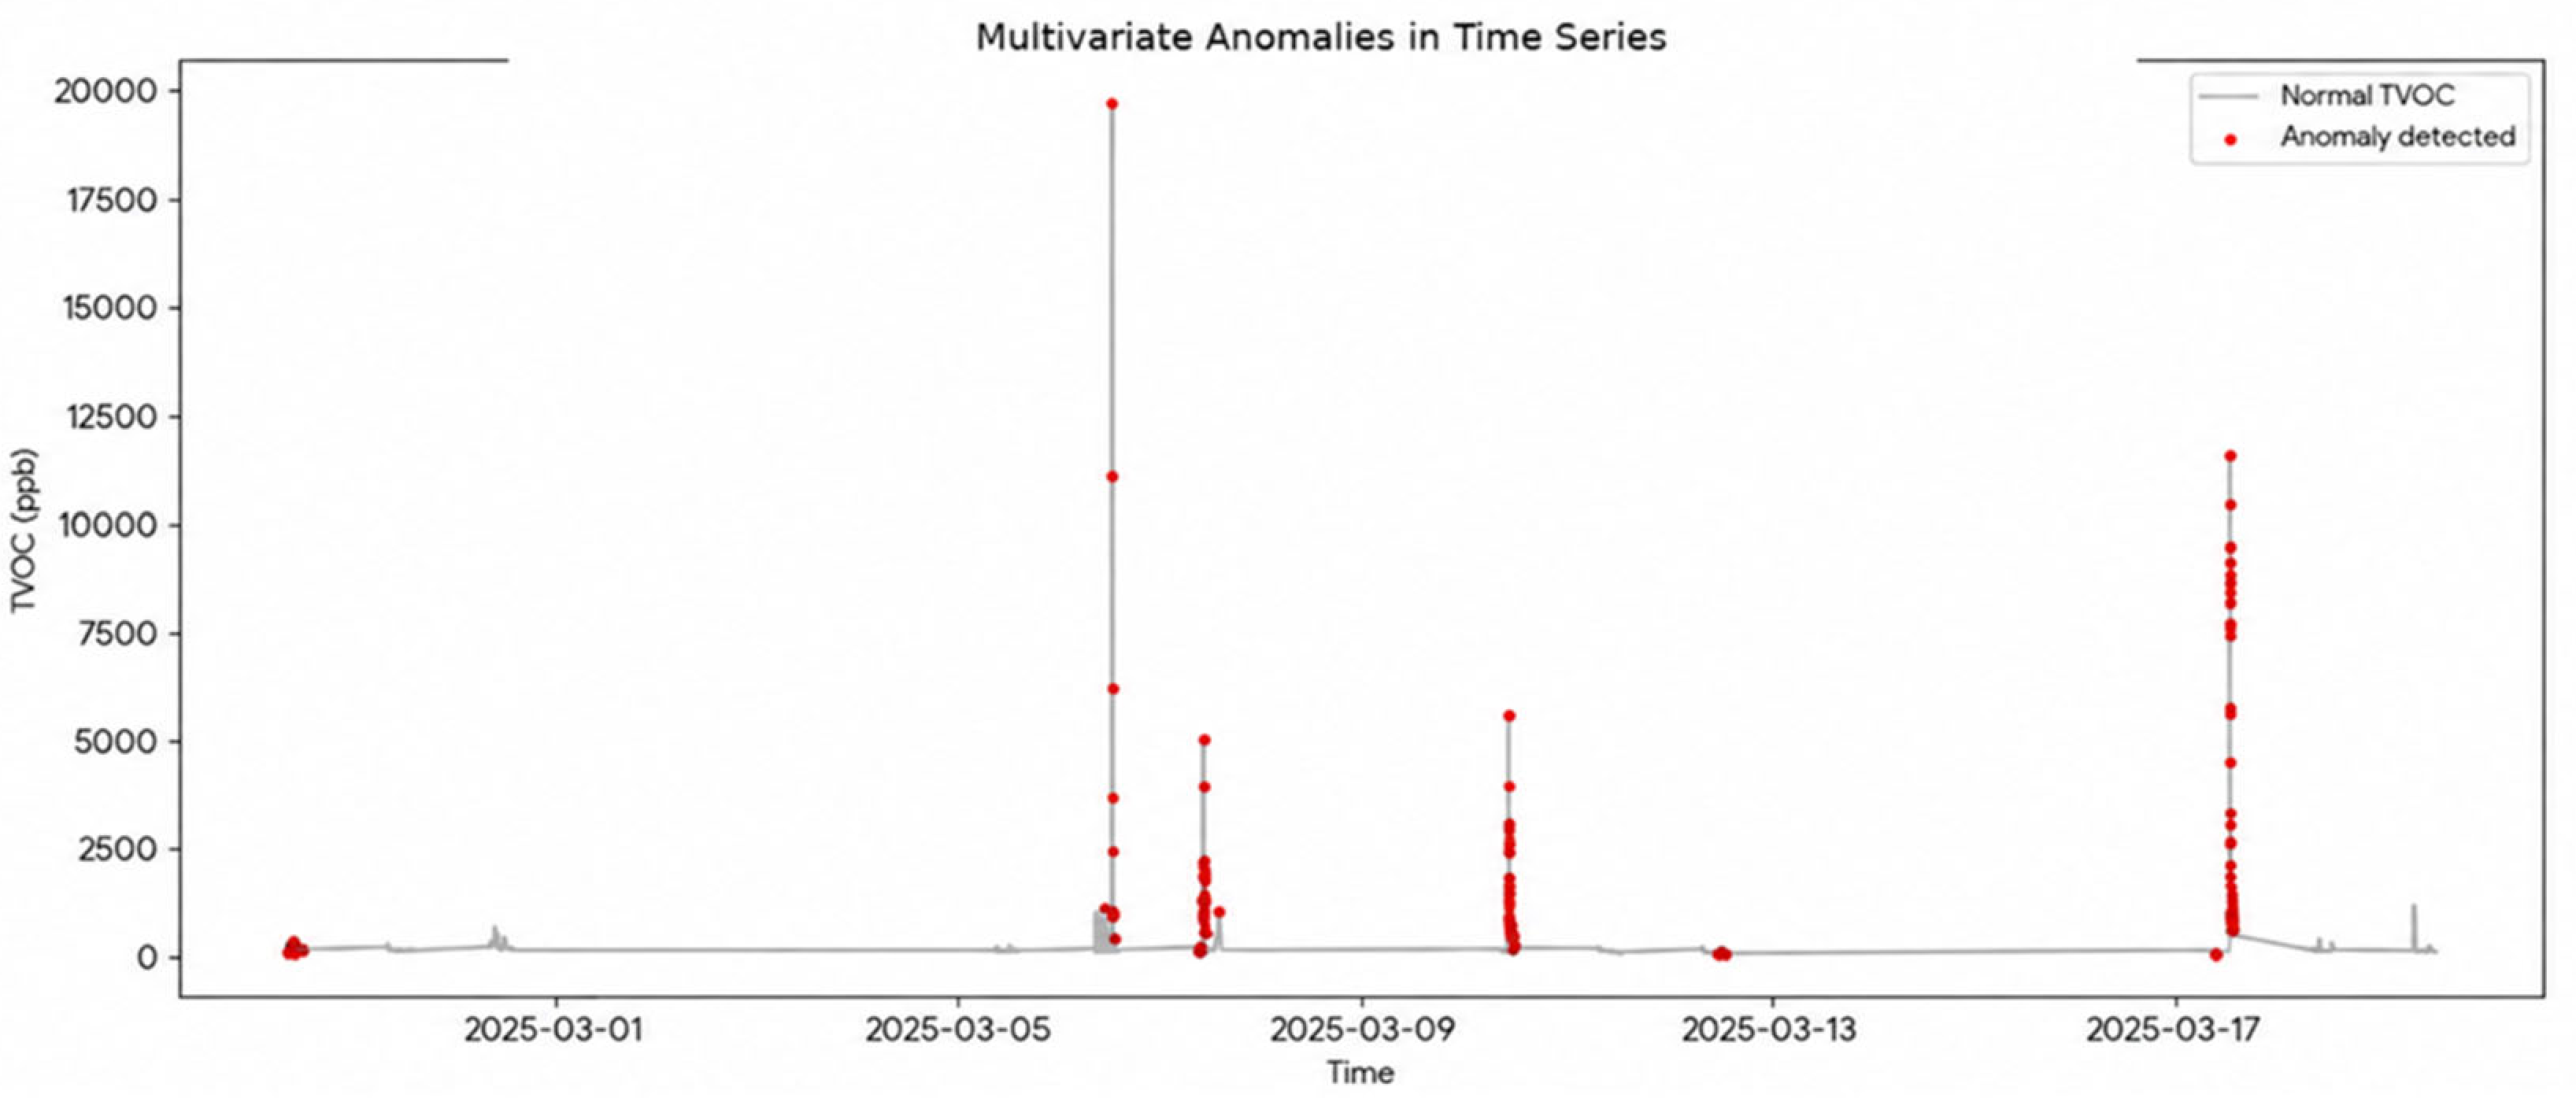
This behavior indicates that pollutant episodes exhibit temporal persistence, supporting the hypothesis of chemical residence effects and delayed dissipation dynamics previously identified in the predictive analysis.
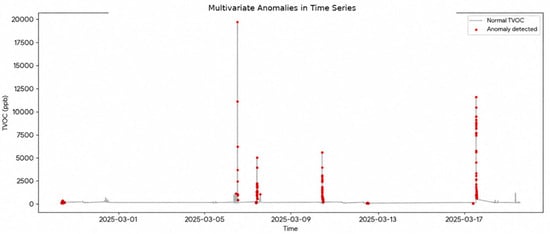
Some detected anomalies occurred during rapid TVOC escalation periods, including observations preceding subsequent threshold exceedances. This temporal pattern suggests that multivariate anomaly scores may provide complementary early-warning information, although the Isolation Forest model itself was not formulated as a forecasting algorithm. Consequently, the methodology provides an additional diagnostic layer capable of identifying atypical environmental transitions prior to critical exposure conditions (Figure 12).
Figure 12.
Temporal distribution of detected multivariate anomalies.
3.6. Temporal Causality Analysis
3.6.1. Granger Causality Assessment
To complement predictive and diagnostic analyses, temporal predictive dependency methods were applied to investigate directional relationships between occupancy indicators, environmental conditions, and pollutant evolution.
Unlike correlation analysis, which only quantifies statistical association, Granger causality does not establish physical causation. In the present study, the methodology was applied to assess whether environmental and occupancy indicators contributed to explaining subsequent TVOC dynamics.
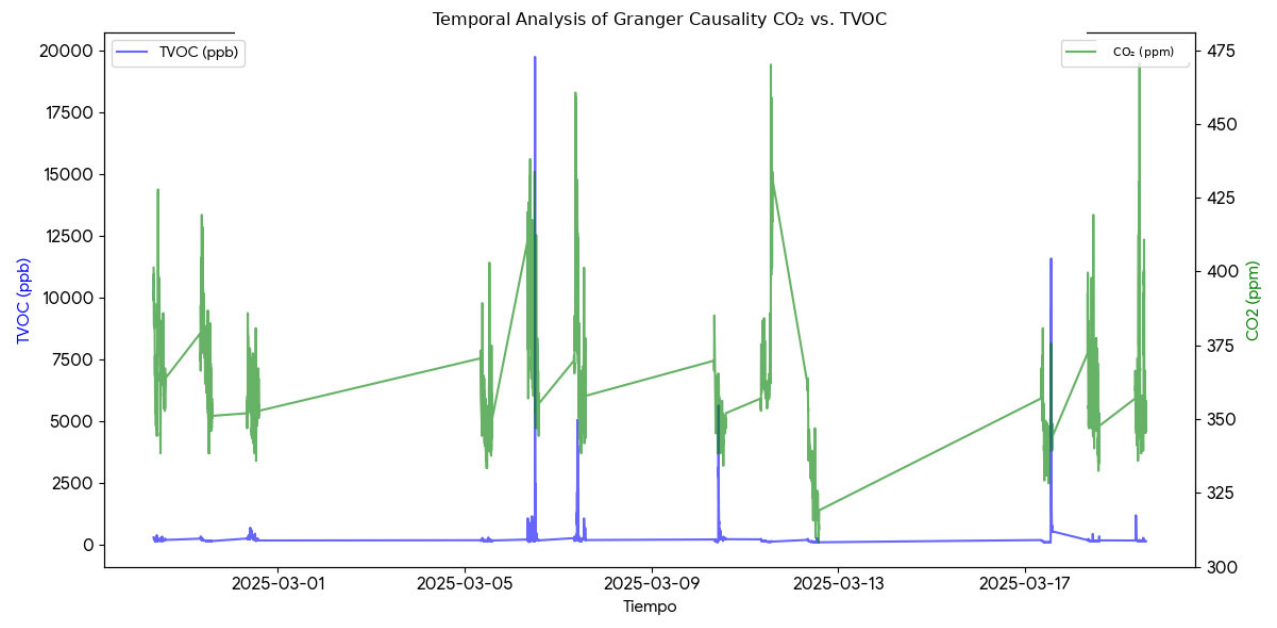
Statistically significant Granger-predictive dependencies were identified between CO2 and subsequent TVOC evolution for lag orders between 2 and 5 observations (p < 0.01). Given the 1-min sampling interval, these lag orders correspond to approximately 2–5 min. The result indicates that historical CO2 measurements contained additional predictive information regarding subsequent TVOC values over this short time scale. It does not, however, demonstrate that occupancy itself physically caused TVOC generation laboratory activity contributes These findings indicate that occupancy-related activity precedes part of the chemical load evolution, supporting the existence of delayed pollutant generation mechanisms associated with laboratory operation.
3.6.2. Interpretation of Occupancy–Pollutant Interaction
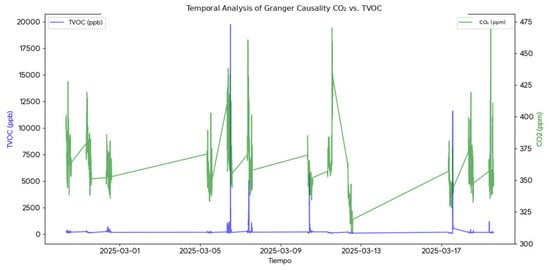
Figure 13 shows the temporal relationship between occupancy indicators and pollutant evolution. The temporal comparison between the CO2 occupancy proxy and TVOC indicates that changes in CO2 may precede part of the subsequent TVOC variability. Together with the Granger results, this suggests a short-term predictive relationship between occupancy-related activity and chemical-pollutant evolution. However, the analysis does not establish a direct mechanistic causal pathway, and TVOC dynamics are also affected by source characteristics, pollutant persistence, mixing, and ventilation operation.
Figure 13.
Relationship between CO2 concentration and TVOC evolution.
The observed lags are compatible with delayed processes such as emission, mixing, extraction, and dilution, although these mechanisms cannot be distinguished individually from the present measurements.
These results reinforce previous observations obtained from anomaly detection analyses, where pollutant episodes frequently appeared grouped in temporally persistent clusters.
3.6.3. Bayesian Dependency Structure
To complement temporal analysis, Bayesian dependency networks were employed to characterize conditional relationships among environmental variables.
The Bayesian representation enabled the identification of interaction pathways linking occupancy indicators, hygrothermal conditions, and pollutant evolution.
This explanatory layer complements predictive and anomaly detection models by providing an interpretable representation of environmental interactions and supporting evidence-based HVAC decision strategies.
The integration of predictive modelling, anomaly detection, and causality analysis therefore establishes a multi-layer environmental assessment framework capable of addressing forecasting, diagnosis, and interpretation simultaneously.
3.7. Discussion
The proposed analytical framework integrates predictive modelling, anomaly detection, and temporal causality analysis within a unified environmental assessment architecture. Although each methodological layer addresses different aspects of IAQ behavior, their combined implementation provides complementary information for ventilation management and occupational risk control.
Predictive modelling (Line 1) demonstrated the highest capability for anticipatory management by forecasting pollutant evolution before threshold exceedance. The Random Forest architecture achieved the strongest performance (R2 = 0.78), enabling short-term anticipation of pollution episodes and supporting proactive ventilation strategies.
The comparative evaluation showed that RF outperformed Gradient Boosting and LSTM under the same chronological test conditions. The result is relevant because the dataset is characterized by a limited sample size, strong asymmetry, and short-duration peaks, conditions under which tree-based ensemble models can provide advantages over more data-demanding sequential neural architectures.
In contrast, anomaly detection (Line 2) provided a diagnostic layer focused on identifying atypical environmental states. Unlike predictive approaches, anomaly detection does not estimate future pollutant levels but identifies deviations from expected operating behaviour, including hidden emissions and multivariate ventilation disturbances.
Temporal causality analysis (Line 3) contributed a temporal-interpretation layer by identifying predictive dependencies between occupancy indicators and pollutant evolution. This capability complements predictive and diagnostic approaches by supporting interpretation of environmental interactions.
Table 5 summarizes the comparative role of each methodological family.
Table 5.
Comparative assessment of analytical methodologies for IAQ management.
The obtained results indicate that conventional ventilation control strategies based exclusively on occupancy indicators may be insufficient for chemically intensive healthcare environments.
The weak association identified between occupancy indicators and pollutant dynamics, together with the existence of high TVOC events under low occupancy conditions, demonstrates that chemical exposure cannot be fully characterized using CO2 monitoring alone. In pathology laboratories, such predictive control should be interpreted as an additional supervisory layer for local extraction or ventilation response and not as a mechanism for reducing mandatory minimum ventilation or containment requirements.
The predictive capability of the proposed framework enables the transition from reactive control toward predictive ventilation operation. Instead of increasing airflow only after threshold exceedance, HVAC systems may respond according to expected environmental evolution. Likewise, anomaly detection provides an additional diagnostic layer capable of identifying abnormal environmental states before extreme exposure conditions occur. This capability may improve both occupational safety and operational resilience. Table 6 shows the comparison between conventional statistical approaches and machine learning methods focused on IAQ management.
Table 6.
Comparison between conventional statistical approaches and machine learning methods for IAQ management.
Direct numerical comparison among IAQ forecasting studies requires caution because reported performance depends on pollutant type, sampling interval, prediction horizon, dataset size, and environmental dynamics. Published models developed for more stable residential or office environments may achieve higher coefficients of determination, whereas the present dataset contains highly skewed TVOC concentrations and short-duration peaks reaching 19,739 ppb. Therefore, the contribution of the present study should not be interpreted solely in terms of maximum predictive accuracy, but in the application of a combined predictive–diagnostic framework to a chemically intensive pathology environment. The cross-zone comparison further showed that ventilation and pollutant behaviour differed between the grossing and storage rooms. The grossing room combined active chemical manipulation with a measured ventilation rate below the selected reference requirement. These differences support treating the two spaces as distinct environmental regimes rather than assuming uniform pathology-department IAQ conditions.
4. Conclusions
This study proposed and validated an integrated environmental analytics framework for Indoor Air Quality (IAQ) assessment and ventilation evaluation in hospital pathology laboratories. The methodology combined predictive modelling, multivariate anomaly detection, and temporal causality analysis to characterize pollutant dynamics in chemically intensive healthcare environments. The experimental assessment identified significant differences between occupancy-related indicators and chemically driven pollutants. While CO2 concentrations remained within acceptable limits, transient TVOC episodes reached peak values up to 19,739 ppb, demonstrating that chemical exposure in pathology laboratories is primarily governed by operational emissions rather than occupancy alone.
Ventilation assessment revealed that the monitored grossing room operated below the regulatory target established by ASHRAE Standard 170, reaching a maximum ventilation rate of 9.3 ACH compared with the required 15 ACH. The measured pressure differential (−2 Pa) also remained below the recommended containment level (−10 Pa), indicating reduced ventilation performance under monitored conditions. The predictive modelling framework demonstrated strong capability for anticipating pollution events. Among the evaluated architectures, Random Forest achieved the highest performance (R2 = 0.78; MAE = 10.5 ppb), enabling short-term prediction of pollutant evolution and supporting predictive ventilation strategies.
Isolation Forest identified 212 atypical observations, corresponding to 5.01% of the valid analytical dataset (N = 4232 confirmed), with substantially elevated TVOC levels relative to normal observations. Granger analysis identified statistically significant predictive dependencies between CO2 and subsequent TVOC evolution at lags of approximately 2–5 min. These results indicate temporal predictive precedence rather than physical causation. The proposed framework supports the transition from reactive IAQ assessment toward predictive environmental management by integrating forecasting, diagnosis, and explanatory analysis within a unified methodology. The approach provides a transferable basis for predictive HVAC control, Demand-Controlled Ventilation (DCV), and risk-informed environmental management in chemically intensive healthcare facilities. The findings should nevertheless be interpreted within the limits of a single-site, short-term monitoring campaign and require external validation before generalization to other pathology departments. Future developments should extend the methodology toward multi-hospital datasets, real-time Building Management System integration, and digital-twin-based ventilation control strategies.
Author Contributions
Conceptualization, A.R.-H., J.F.S.J.-A. and Y.A.; Data curation, A.R.-H., J.F.S.J.-A. and Y.A.; Formal analysis, A.R.-H., A.M.E.E. and J.M.R.-H.; Funding acquisition, J.F.S.J.-A. and F.J.R.-M.; Investigation, A.R.-H., J.F.S.J.-A., Y.A., A.M.E.E. and J.M.R.-H.; Methodology, A.R.-H., J.F.S.J.-A. and Y.A.; Project administration, J.F.S.J.-A., Y.A. and F.J.R.-M.; Resources, A.R.-H., J.F.S.J.-A. and Y.A.; Software, A.R.-H., J.F.S.J.-A., Y.A. and J.M.R.-H.; Supervision, J.F.S.J.-A., Y.A., F.J.R.-M. and J.M.R.-H.; Validation, A.R.-H., J.F.S.J.-A. and Y.A.; Visualization, A.R.-H., J.F.S.J.-A., Y.A. and A.M.E.E.; Writing—original draft, A.R.-H.; Writing—review and editing, A.R.-H. All authors have read and agreed to the published version of the manuscript.
Funding
This research received no external funding.
Institutional Review Board Statement
Not applicable.
Informed Consent Statement
Not applicable.
Data Availability Statement
The data that support the findings of this study are available from the corresponding author upon reasonable request.
Acknowledgments
We would like to acknowledge the support received from “LIFE23-CET-Re-Energize” European Project by University of Málaga, Spain, RED-“TRAPECIO” IberAmerican Project by CYTED (Ibero-American Program of Science and Technology for Development); and ITAP Research Institute at University of Valladolid.
Conflicts of Interest
The authors declare no conflicts of interest.
Abbreviations
The following abbreviations are used in this manuscript:
| ACH | Air Changes per Hour |
| ASHRAE | American Society of Heating, Refrigerating and Air-Conditioning Engineers |
| BMS | Building Management System |
| DCV | Demand-Controlled Ventilation |
| HVAC | Heating, Ventilation, and Air Conditioning |
| LOF | Local Outlier Factor |
| LSTM | Long Short-Term Memory |
| MAE | Mean Absolute Error |
| ML | Machine Learning |
| NDIR | Non-Dispersive Infrared |
| NTP | Network Time Protocol |
| OLS | Ordinary Least Squares |
| SCADA | Supervisory Control and Data Acquisition |
| SHAP | SHapley Additive exPlanations |
| VAE | Variational Autoencoder |
| VAR | Vector Autoregression |
References
- Sundell, J. On the history of indoor air quality and health. Indoor Air 2004, 14, 51–58. [Google Scholar] [CrossRef] [Scilit] [PubMed]
- Seppänen, O.A.; Fisk, W.J. Summary of human responses to ventilation. Indoor Air 2004, 14, 102–118. [Google Scholar] [CrossRef] [Scilit] [PubMed]
- Li, Y.; Leung, G.M.; Tang, J.W.; Yang, X.; Chao, C.Y.H.; Lin, J.Z.; Lu, J.W.; Nielsen, P.V.; Niu, J.; Qian, H.; et al. Role of ventilation in airborne transmission of infectious agents in the built environment—A multidisciplinary systematic review. Indoor Air 2007, 17, 2–18. [Google Scholar] [CrossRef] [Scilit] [PubMed]
- Alqarni, Z.; Rezgui, Y.; Petri, I.; Ghoroghi, A. Viral infection transmission and indoor air quality: A systematic review. Sci. Total Environ. 2024, 923, 171308. [Google Scholar] [CrossRef] [Scilit] [PubMed]
- Chamseddine, A.; Alameddine, I.; Hatzopoulou, M.; El-Fadel, M. Seasonal variation of air quality in hospitals with indoor–outdoor correlations. Build. Environ. 2019, 148, 689–700. [Google Scholar] [CrossRef] [Scilit]
- Zhou, Y.; Yang, G. Real-time monitoring of pollutants in occupied indoor environments: A pilot study of a hospital in China. J. Build. Eng. 2022, 59, 105105. [Google Scholar] [CrossRef] [Scilit]
- Zaman, S.U.; Yesmin, M.; Pavel, M.R.S.; Jeba, F.; Salam, A. Indoor air quality indicators and toxicity potential at the hospitals’ environment in Dhaka, Bangladesh. Environ. Sci. Pollut. Res. 2021, 28, 37727–37740. [Google Scholar] [CrossRef] [Scilit] [PubMed]
- Seng, K.T.; Shen, L.C.; Ling, N.S.; Chin, S.P.; Xin, T.J.; En, T.K.; Jama, A.A.; Hariri, A.; Nasir, N.F. Comparative Study on the Indoor Air Quality in Critical Areas of Hospitals in Malaysia. Nat. Environ. Pollut. Technol. 2023, 22, 921–927. [Google Scholar] [CrossRef] [Scilit]
- Elkilani, A.; Bouhamra, W. Estimation of optimum requirements for indoor air quality and energy consumption in some residences in Kuwait. Environ. Int. 2001, 27, 443–447. [Google Scholar] [CrossRef] [Scilit] [PubMed]
- Batterman, S. Review and extension of CO2-based methods to determine ventilation rates with application to school classrooms. Int. J. Environ. Res. Public Health 2017, 14, 145. [Google Scholar] [CrossRef] [Scilit] [PubMed]
- Dugheri, S.; Massi, D.; Mucci, N.; Berti, N.; Cappelli, G.; Arcangeli, G. Formalin safety in anatomic pathology workflow and integrated air monitoring systems for the formaldehyde occupational exposure assessment. Int. J. Occup. Med. Environ. Health 2021, 34, 319–338. [Google Scholar] [CrossRef] [Scilit] [PubMed]
- Soonklang, P.; Ketsakorn, A.; Homkham, N.; Chaikittiporn, C.; Norkaew, S. Comparison of real-time instrument use and absorbent tube method for measuring formaldehyde in working environments: A health risk assessment for gross anatomy staff. Toxicol. Rep. 2025, 14, 101913. [Google Scholar] [CrossRef] [Scilit] [PubMed]
- Lakestani, S. Volatile organic compounds and cancer risk assessment in an intensive care unit. Int. J. Biometeorol. 2024, 68, 1731–1739. [Google Scholar] [CrossRef] [Scilit] [PubMed]
- Singer, B.C.; Revzan, K.L.; Hotchi, T.; Hodgson, A.T.; Brown, N.J. Sorption of organic gases in a furnished room. Atmos. Environ. 2004, 38, 2483–2494. [Google Scholar] [CrossRef] [Scilit]
- Riveron, T.P.; Wilde, M.J.; Ibrahim, W.; Carr, L.; Monks, P.S.; Greening, N.J.; Gaillard, E.A.; Brightling, C.E.; Siddiqui, S.; Hansell, A.L.; et al. Characterisation of volatile organic compounds in hospital indoor air and exposure health risk determination. Build. Environ. 2023, 242, 110513. [Google Scholar] [CrossRef] [Scilit]
- ASHRAE Standard 170-2017; Ventilation of Health Care Facilities. ASHRAE: Peachtree Corners, GA, USA, 2017.
- Yuen, P.L.; Yam, R.; Yung, R.; Choy, K.L. Fast-track ventilation strategy to cater for pandemic patient isolation surges. J. Hosp. Infect. 2012, 81, 246–250. [Google Scholar] [CrossRef] [Scilit] [PubMed]
- Martínez-Espinosa, E.; Vicente, W.; Salinas-Vázquez, M.; Ramírez-Cruz, J. Numerical study of the effect of flow patterns on contaminant removal in a hospital ward with symmetrical and asymmetrical inlet port arrangements. Sci. Total Environ. 2025, 979, 179439. [Google Scholar] [CrossRef] [Scilit] [PubMed]
- Yam, R.; Yuen, P.L.; Yung, R.; Choy, T. Rethinking hospital general ward ventilation design using computational fluid dynamics. J. Hosp. Infect. 2011, 77, 31–36. [Google Scholar] [CrossRef] [Scilit] [PubMed]
- Barbosa, B.P.P.; Brum, N.d.C.L. Validation and assessment of the CFD-0 module of CONTAM software for airborne contaminant transport simulation in laboratory and hospital applications. Build. Environ. 2018, 142, 139–152. [Google Scholar] [CrossRef] [Scilit]
- Zhou, Q.; Qian, H.; Ren, H.; Li, Y.; Nielsen, P.V. The lock-up phenomenon of exhaled flow in a stable thermally-stratified indoor environment. Build. Environ. 2017, 116, 246–256. [Google Scholar] [CrossRef] [Scilit]
- Inthavong, K.; Ge, Q.J.; Li, X.D.; Tu, J.Y. Detailed predictions of particle aspiration affected by respiratory inhalation and airflow. Atmos. Environ. 2012, 62, 107–117. [Google Scholar] [CrossRef] [Scilit]
- Dai, X.; Shang, W.; Liu, J.; Xue, M.; Wang, C. Achieving better indoor air quality with IoT systems for future buildings: Opportunities and challenges. Sci. Total Environ. 2023, 895, 164858. [Google Scholar] [CrossRef] [Scilit] [PubMed]
- Baqer, N.S.; Mohammed, H.A.; Albahri, A.S.; Zaidan, A.A.; Al-qaysi, Z.T.; Albahri, O.S. Development of the Internet of Things sensory technology for ensuring proper indoor air quality in hospital facilities: Taxonomy analysis, challenges, motivations, open issues and recommended solution. Meas. J. Int. Meas. Confed. 2022, 192, 110920. [Google Scholar] [CrossRef] [Scilit]
- Amangeldy, B.; Imankulov, T.; Tasmurzayev, N.; Imanbek, B.; Dikhanbayeva, G.; Nurakhov, Y. IoT-Based Unsupervised Learning for Characterizing Laboratory Operational States to Improve Safety and Sustainability. Sustainability 2025, 17, 8340. [Google Scholar] [CrossRef] [Scilit]
- Saini, J.; Dutta, M.; Marques, G. Indoor air quality monitoring systems based on internet of things: A systematic review. Int. J. Environ. Res. Public Health 2020, 17, 4942. [Google Scholar] [CrossRef] [Scilit] [PubMed]
- Miller, C.; Kathirgamanathan, A.; Picchetti, B.; Arjunan, P.; Park, J.Y.; Nagy, Z.; Raftery, P.; Hobson, B.W.; Shi, Z.; Meggers, F. The Building Data Genome Project 2, energy meter data from the ASHRAE Great Energy Predictor III competition. Sci. Data 2020, 7, 368. [Google Scholar] [CrossRef] [Scilit] [PubMed]
- Wei, Y.; Zhang, X.; Shi, Y.; Xia, L.; Pan, S.; Wu, J.; Han, M.; Zhao, X. A review of data-driven approaches for prediction and classification of building energy consumption. Renew. Sustain. Energy Rev. 2018, 82, 1027–1047. [Google Scholar] [CrossRef] [Scilit]
- Amasyali, K.; El-Gohary, N.M. A review of data-driven building energy consumption prediction studies. Renew. Sustain. Energy Rev. 2018, 81, 1192–1205. [Google Scholar] [CrossRef] [Scilit]
- Salem, K.M.; Rey-Martínez, F.J.; Elgharib, A.O.; Rey-Hernández, J.M. Decarbonizing the Built Environment: An AI-powered Framework for Predictive Energy Planning. Earth Syst. Environ. 2026, 10, 9767–9790. [Google Scholar] [CrossRef] [Scilit]
- Balbis-Morejón, M.; Cabello-Justafré, O.; Cabello-Eras, J.J.; Hernández, J.M.R.; Rey-Martínez, F.J.; Elgharib, A.O.; Salem, K.M. High-Accuracy Energy Forecasting for Sustainable Hospitality: A Hybrid Ensemble Machine Learning Approach to 50-Year Retrofit Analysis in Sub-Tropical Hotels. Sustainability 2026, 18, 2307. [Google Scholar] [CrossRef] [Scilit]
- Salem, K.M.; Rey-Martínez, F.J.; Elgharib, A.O.; Rey-Hernández, J.M. Energy Demand Forecasting Scenarios for Buildings Using Six AI Models. Appl. Sci. 2025, 15, 8238. [Google Scholar] [CrossRef] [Scilit]
- Salem, K.M.; Rey-Hernández, J.M.; Elgharib, A.O.; Rey-Martínez, F.J. Optimizing Energy Forecasting Using ANN and RF Models for HVAC and Heating Predictions. Appl. Sci. 2025, 15, 6806. [Google Scholar] [CrossRef] [Scilit]
- Salem, K.M.; Elgharib, A.O.; Rey-Hernández, J.M.; Rey-Martínez, F.J. A Generalizable Hybrid AI-LSTM Model for Energy Consumption and Decarbonization Forecasting. Sustainability 2025, 17, 10882. [Google Scholar] [CrossRef] [Scilit]
- Candanedo, L.M.; Feldheim, V. Accurate occupancy detection of an office room from light. temperature, humidity and CO2 measurements using statistical learning models. Energy Build. 2016, 112, 28–39. [Google Scholar] [CrossRef] [Scilit]
- Agarwal, N.; Meena, C.S.; Raj, B.P.; Saini, L.; Kumar, A.; Gopalakrishnan, N.; Kumar, A.; Balam, N.B.; Alam, T.; Kapoor, N.R.; et al. Indoor air quality improvement in COVID-19 pandemic: Review. Sustain. Cities Soc. 2021, 70, 102942. [Google Scholar] [CrossRef] [Scilit] [PubMed]
- Kusiak, A.; Li, M.; Tang, F. Modeling and optimization of HVAC energy consumption. Appl. Energy 2010, 87, 3092–3102. [Google Scholar] [CrossRef] [Scilit]
- Fan, C.; Xiao, F.; Wang, S. Development of prediction models for next-day building energy consumption and peak power demand using data mining techniques. Appl. Energy 2014, 127, 1–10. [Google Scholar] [CrossRef] [Scilit]
- Liu, F.T.; Ting, K.M.; Zhou, Z.H. Isolation forest. In Proceedings of the 2008 Eighth IEEE International Conference on Data Mining, Pisa, Italy, 15–19 December 2008; pp. 413–422. [Google Scholar] [CrossRef] [Scilit]
- Lee, J.; Lee, Y.C.; Kim, J.T. Fault detection based on one-class deep learning for manufacturing applications limited to an imbalanced database. J. Manuf. Syst. 2020, 57, 357–366. [Google Scholar] [CrossRef] [Scilit]
- Abdollah, M.A.F.; Scoccia, R.; Aprile, M. Transformer encoder based self-supervised learning for HVAC fault detection with unlabeled data. Build. Environ. 2024, 258, 111568. [Google Scholar] [CrossRef] [Scilit]
- Fan, C.; Lei, Y.; Sun, Y.; Mo, L. Novel transformer-based self-supervised learning methods for improved HVAC fault diagnosis performance with limited labeled data. Energy 2023, 278, 127972. [Google Scholar] [CrossRef] [Scilit]
- Yan, K.; Huang, J.; Shen, W.; Ji, Z. Unsupervised learning for fault detection and diagnosis of air handling units. Energy Build. 2020, 210, 109689. [Google Scholar] [CrossRef] [Scilit]
- Barandier, P.; Mendes, M.; Cardoso, A.J.M. Comparative analysis of four classification algorithms for fault detection of heat pumps. Energy Build. 2024, 316, 114342. [Google Scholar] [CrossRef] [Scilit]
- Granger, C.W.J. Investigating Causal Relations by Econometric Models and Cross-Spectral Methods. Econometrica 1969, 37, 424–438. [Google Scholar] [CrossRef] [Scilit]
- Sims, C.A. Accessibility support: If you experience accessibility issues with this file, report them here Macroeconomics and Reality. Econom. J. Econom. Soc. 1980, 48, 1–48. [Google Scholar]
- Li, L.; Han, B.; Li, G.; Leong, T.; Zhang, Y.; Liu, W.; Zhu, L.; Xu, W. Identifying causal effects from data for the clinical ventilation process modeling. In Proceedings of the2008 International Conference on BioMedical Engineering and Informatics, Sanya, China, 27–30 May 2008; pp. 517–521. [Google Scholar] [CrossRef] [Scilit]
- Salem, K.M.; Rey-Hernández, J.M.; Rey-Martínez, F.J.; Elgharib, A.O. Assessing the accuracy of AI approaches for CO2 emission predictions in buildings. J. Clean. Prod. 2025, 513, 145692. [Google Scholar] [CrossRef] [Scilit]
- Rey-Hernández, A.; José-Alonso, J.S.; Picallo-Perez, A.; Rey-Martínez, F.J.; Elgharib, A.O.; Rey-Hernández, J.M.; Salem, K.M. A Predictive Approach for Energy Efficiency and Emission Reduction in University Campuses. Appl. Sci. 2025, 15, 9419. [Google Scholar] [CrossRef] [Scilit]
- Prívara, S.; Cigler, J.; Váňa, Z.; Oldewurtel, F.; Sagerschnig, C.; Žáčeková, E. Building modeling as a crucial part for building predictive control. Energy Build. 2013, 56, 8–22. [Google Scholar] [CrossRef] [Scilit]
- Afram, A.; Janabi-Sharifi, F. Theory and applications of HVAC control systems—A review of model predictive control (MPC). Build. Environ. 2014, 72, 343–355. [Google Scholar] [CrossRef] [Scilit]
- Lu, S.; Zhou, S.; Ding, Y.; Kim, M.K.; Yang, B.; Tian, Z.; Liu, J. Exploring the comprehensive integration of artificial intelligence in optimizing HVAC system operations: A review and future outlook. Results Eng. 2025, 25, 103765. [Google Scholar] [CrossRef] [Scilit]
- Doukas, H.; Patlitzianas, K.D.; Iatropoulos, K.; Psarras, J. Intelligent building energy management system using rule sets. Build. Environ. 2007, 42, 3562–3569. [Google Scholar] [CrossRef] [Scilit]
- Rasheed, A.; San, O.; Kvamsdal, T. Digital twin: Values, challenges and enablers from a modeling perspective. IEEE Access 2020, 8, 21980–22012. [Google Scholar] [CrossRef] [Scilit]
- Himeur, Y.; Elnour, M.; Fadli, F.; Meskin, N.; Petri, I.; Rezgui, Y.; Bensaali, F.; Amira, A. AI-big data analytics for building automation and management systems: A survey. actual challenges and future perspectives. Artif. Intell. Rev. 2023, 56, 4929–5021. [Google Scholar] [CrossRef] [Scilit] [PubMed]

Disclaimer/Publisher’s Note: The statements, opinions and data contained in all publications are solely those of the individual author(s) and contributor(s) and not of MDPI and/or the editor(s). MDPI and/or the editor(s) disclaim responsibility for any injury to people or property resulting from any ideas, methods, instructions or products referred to in the content. |
© 2026 by the authors. Licensee MDPI, Basel, Switzerland. This article is an open access article distributed under the terms and conditions of the Creative Commons Attribution (CC BY) license.