


Abstract
In this work, Ni/C/N nanocomposites were synthesized from wheat straw and sugar beet pulp by two-stage direct pyrolysis using nickel chloride and urea as activating agents. It was demonstrated that nitrogen doping of the precursor, achieved using urea as the nitrogen source, induces ferromagnetic behavior in the carbon material. Upon additional activation with nickel chloride, the magnetic behavior of the C/Ni/N composites is governed by both Ni nanoparticles with an average size of approximately 100 nm and the magnetism of the nitrogen-doped carbon matrix. Wheat-straw-derived composites exhibited predominantly microporous structures with larger BET surface areas, whereas sugar-beet-pulp-derived samples contained a higher proportion of mesopores. Although the latter possessed lower specific surface areas, they demonstrated superior adsorption capacities toward Congo Red owing to improved accessibility of adsorption sites for large dye molecules. The adsorption process was best described by the Langmuir model, while the Dubinin–Radushkevich model suggested strong specific physicochemical interactions between dye molecules and the adsorbent surface. The results demonstrate that the adsorption efficiency of biomass-derived Ni/C/N nanocomposites is governed not only by the total surface area but also by pore architecture and surface chemistry.
1. Introduction
Access to clean freshwater has become increasingly limited in many countries in recent decades. Rapid industrial and agricultural development, together with population growth, has increased pressure on freshwater resources and contributed to their deterioration. As a result, the growing demand for freshwater has led to an increasing global shortage of potable water. Considering that freshwater accounts for only approximately 3% of the Earth’s total water resources, the development of efficient water purification technologies has become an issue of paramount importance [1,2]. Wastewater represents the most heavily contaminated type of water and is generally classified into municipal, agricultural, and industrial wastewater [3]. Natural water bodies possess a certain self-purification capacity, enabling the natural removal of some contaminants. However, excessive discharge of untreated wastewater and the high concentrations of persistent pollutants exceed the self-purification capacity of aquatic ecosystems, as demonstrated by studies conducted in different regions of the world [4,5,6]. Therefore, the implementation of integrated wastewater treatment technologies is essential, although challenging because of the wide variety of contaminants, the number of which continues to increase. Such integrated treatment approaches should combine the advantages of physical, chemical, and biological methods for contaminant removal, as each of these methods possesses its own strengths and limitations [7,8,9,10].
In wastewater treatment systems, adsorption is widely employed because it provides high purification efficiency at a relatively low cost [11,12]. Numerous studies have demonstrated that modified adsorbents derived from natural precursors and carbon composites impregnated with nanomaterials have considerable potential for removing a broad spectrum of contaminants from wastewater [12,13,14,15]. However, powdered carbon adsorbents suffer from a significant drawback that limits their practical application in many cases, as they are extremely difficult to separate from the treated aqueous medium because the average density of porous carbon materials is comparable to that of water. Consequently, additional separation steps, such as filtration or centrifugation, are required, which increase both the overall treatment cost and processing time. One promising approach to overcoming this limitation is the synthesis of magnetically responsive carbon nanocomposites. Such composites combine the beneficial properties of carbon materials with those of nanoparticles incorporated into the carbon framework. The carbon matrix offers a high specific surface area and substantial pore volume, whereas the magnetic nanoparticles impart magnetic properties to the synthesized nanocomposite. This combination allows the adsorbent to be efficiently recovered from the treated aqueous medium by magnetic separation.
Numerous studies [16,17,18] have shown that iron oxide nanoparticles are environmentally benign, inexpensive, and readily available components for the preparation of such composites, making them promising materials for various applications. However, in the absence of protective coatings, these nanoparticles may undergo oxidation or dissolution when exposed to acidic aqueous media, thereby limiting their practical applicability [19]. Consequently, considerable efforts have been devoted to developing alternative routes for producing magnetic particles in carbon composites. One such approach involves the incorporation of nickel nanoparticles. Nickel nanoparticles are most commonly employed in carbon composites as catalysts for various processes [20,21]. Nevertheless, the presence of a highly porous carbon component also makes these composites attractive adsorbents for removing contaminants efficiently from aqueous solutions [22]. Another strategy for enhancing both porosity and specific magnetization is the incorporation of nitrogen atoms into the composite structure. In our earlier work [23], we showed that adding urea in addition to nickel chloride promotes more efficient incorporation of nickel into the carbon structure. Hydrolysis lignin was used as the carbon precursor in that study. The magnetic behavior of the resulting C/Ni/N composite was associated with superparamagnetic Ni nanoparticles smaller than 30 nm, together with the magnetic contribution of the carbon matrix. Importantly, this nanocomposite exhibited no residual magnetization. In contrast, when the C/Ni composite was synthesized without nitrogen doping, the Ni nanoparticles were larger than 30 nm on average, resulting in the emergence of magnetic hysteresis. However, the proposed synthesis approach and the conclusions drawn from it require further validation using other organic precursors. In addition, the previous study [23] did not investigate the practical application of the synthesized carbon materials. Specifically, the influence of this synthesis approach on the adsorption efficiency toward contaminants in aqueous solutions was not established.
Accordingly, this study focused on synthesizing C/Ni/N carbon composites from different biomass precursors and investigating their structural characteristics, porous architecture, magnetic behavior, and adsorption performance.
2. Materials and Methods
2.1. Sample Synthesis
Agricultural wastes, namely wheat straw and sugar beet pulp, were used as carbon precursors. The nanocomposites were synthesized following the procedure previously reported for the preparation of magnetically responsive nanocomposites in [23]. The first stage for both types of biomass consisted of a pre-pyrolysis step. Pelletized wheat straw or dried sugar beet pulp was loaded into a furnace crucible and pre-pyrolyzed at 400 °C for 90 min. In the second stage, each resulting carbonizate was mixed separately with NiCl2·6H2O and urea at a mass ratio of 0.75:1:0.5. Next, distilled water was introduced, and the mixtures were heated under continuous stirring until complete dissolution of NiCl2·6H2O and urea. The resulting mixtures were dried, transferred again into furnace crucibles, heated to 800 °C at 10 °C min−1, and held at this temperature for 60 min. The synthesis was carried out under an argon atmosphere. The synthesized nanocomposites were subsequently washed with hot distilled water and subsequently dried at 100–110 °C in a drying oven. Hereafter, the C/Ni/N nanocomposites synthesized from wheat straw and sugar beet pulp are designated as CW3 and CB3, respectively.
Following the procedure described in [23], additional composites were synthesized using nickel chloride or urea separately as the activating agent. The preparation of these samples likewise involved a two-stage process. Initially, wheat straw and sugar beet pulp were pre-pyrolyzed at 400 °C for 90 min. The resulting pre-pyrolyzed materials were then separately mixed with NiCl2·6H2O at a mass ratio of 0.75:1, after which sufficient distilled water was introduced to dissolve the salt. The obtained mixtures were dried, transferred into furnace crucibles, and pyrolyzed under argon at 800 °C for 60 min. The resulting samples are hereafter denoted as CW2 for the wheat-straw-derived composite and CB2 for the sugar-beet-pulp-derived composite.
To synthesize nitrogen-doped carbon materials, the pre-pyrolyzed wheat straw and sugar beet pulp were combined with urea at a mass ratio of 1.5:1, followed by the addition of distilled water to dissolve the urea. The impregnated materials were then dried and pyrolyzed under argon at 800 °C for 60 min. The obtained carbon materials are hereafter designated as CW1 for the wheat-straw-derived sample and CB1 for the sugar-beet-pulp-derived sample.
2.2. Experimental Methods
XRD measurements of the synthesized carbon composites were performed using a DRON-3 diffractometer (NGO ‘Burevestnik’, Saint Petersburg, Russia). Monochromatized Cu Kα radiation (λ = 0.1542 nm) served as the X-ray source. The diffraction patterns were recorded continuously at a rate of 2° min−1 across a 2θ interval of 5–110°.
Elemental composition was determined by energy-dispersive X-ray spectroscopy (EDX) using an analyzer integrated into a Phenom ProX scanning electron microscope (Thermo Fisher Scientific, Waltham, MA, USA).
The pore structure of the composites was characterized using nitrogen adsorption/desorption measurements at 77 K using a Quantachrome NOVAtouch LX2 porosimeter (Anton Paar QuantaTec Inc., Boynton Beach, FL, USA). Prior to the measurements, all samples were subjected to vacuum degassing at 473 K for 16 h.
The magnetic characteristics of the synthesized nanocomposites were investigated with a vibrating sample magnetometer, whose design, operating principle, and specifications have been described in [24]. Prior to measurements, the instrument was calibrated by the comparison method with dense nonporous nickel (specific magnetization of 54.8 emu g−1) as the reference material. Hysteresis loops were recorded at room temperature in magnetic fields ranging from −3000 to +3000 Oe. The specific saturation magnetization of the synthesized carbon materials was determined at a magnetic field strength of 10,000 Oe.
The point of zero charge (pHPZC) of the synthesized composites was evaluated following the procedure reported in [25]. Measurements were performed using 0.05 M NaCl aqueous solutions whose initial pH values ranged from 2.5 to 10. Initial pH values were adjusted with 0.1 M NaOH and 0.1 M HCl solutions. The composite samples were equilibrated for 24 h in the solutions of different initial pHi, after which the final pHf was recorded. The pHPZC value was determined from the intersection of the curve representing pHf − pHi = f (pHi) with the x-axis.
The adsorption performance of the synthesized carbon materials was assessed using Congo Red (CR) aqueous solutions to construct the adsorption isotherms. To determine the equilibrium adsorption capacity, approximately 20 mg of each sample was weighed and transferred into glass test tubes, after which 10 mL of the CR model solution at a predetermined initial concentration was added. The adsorption isotherm experiments were performed in parallel using three samples of each material. Initial CR concentrations were varied between 100 and 300 mg L−1. The pH of all aqueous solutions was 6. The experiments were conducted at a temperature of 20 °C. The test tubes were tightly sealed and placed on the platform of a laboratory shaker WU-4 (PREMED, Łódź, Poland). The suspensions were shaken for 12 h at a frequency of 120 oscillations min−1 and subsequently left undisturbed for a further 12 h to establish equilibrium. After this equilibration period, the liquid phase was separated from the solid particles by centrifugation of an aliquot of the suspension. The dye concentration was determined spectrophotometrically according to the procedure described in [7,26]. Measurements were performed using an SF-46 single-beam spectrophotometer (ASMA-PRYLAD, Svitlovodsk, Ukraine) equipped with an integrated microprocessor control system. All measurements were performed using glass cuvettes with a 10 mm optical path length. To ensure the accuracy of the determination, blank measurements of changes in the CR concentration in the investigated solutions were performed in parallel with the solutions containing the adsorbent.
3. Results and Discussion
3.1. X-Ray Diffraction and EDX Analysis of the Synthesized Carbon Materials
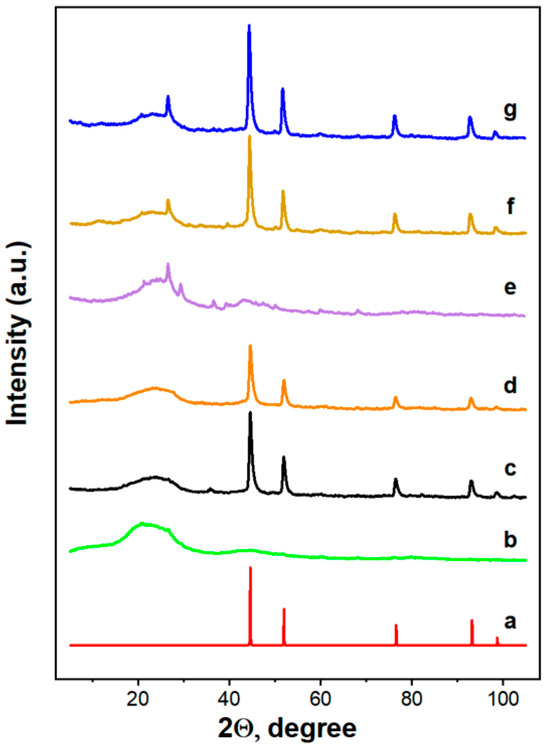
Figure 1 presents the X-ray diffraction patterns obtained for the synthesized composites, while the pattern of pure nickel is included in Figure 1(a) for reference.
Figure 1.
Diffraction profiles recorded for (a) pure nickel and the synthesized carbon nanocomposites, (b) CW1, (c) CW2, (d) CW3, (e) CB1, (f) CB2, and (g) CB3.
The CW1 sample consists predominantly of an amorphous carbon phase (Figure 1(b)). The position of the main diffraction maximum (2θ ≈ 22.3°) corresponds to an interlayer spacing of d ≈ 0.400 nm between graphene layers. This indicates a disordered arrangement of the graphene layers, since the interlayer spacing in crystalline graphite is approximately d ≈ 0.335 nm. A weak shoulder is observed on the low-angle side of the main maximum. Its maximum is located at 2θ ≈ 11.0°, corresponding to an interplanar spacing of d1 ≈ 2d ≈ 0.800 nm. The presence of the shoulder at this position may indicate that the carbon phase develops a clustered structure. Similar shoulders are characteristic of amorphous alloys of the Al–TM–REM system, with TM referring to transition metals and REM referring to rare-earth elements, in which clusters with predominant Al–REM atomic interactions are formed [27]. A similar diffraction profile was previously reported by us in [28] and was interpreted as evidence for the formation of an intermediate-range order in addition to the short-range atomic order. This intermediate-range order arises from correlations in the arrangement of carbon atoms over distances considerably exceeding the characteristic interatomic spacing. For the maximum observed at 2θ ≈ 11.0° (Figure 1(b)), the characteristic cluster size is estimated to be L ≈ 0.8 nm. Therefore, if the main maximum results from X-ray scattering within individual carbon clusters, the shoulder preceding the main maximum can be attributed to intercluster scattering [28]. In addition, several weak broad peaks can be distinguished in the diffraction pattern shown in Figure 1(b), the most intense of which is located at 2θ ≈ 44.4°. These amorphous contributions may originate from impurity elements naturally occurring in the plant-derived precursor alongside the predominant carbon phase.
The diffraction pattern of the CW2 sample (Figure 1(c)) exhibits a broad diffuse maximum centered at 2θ ≈ 23.7°, corresponding to scattering from the amorphous carbon phase. The observed maximum is associated with an average interlayer spacing of d ≈ 0.375 nm between graphene layers. The sharp diffraction peaks are assigned to the polycrystalline Ni phase. The average size of the coherent scattering regions, estimated from the full width at half maximum (FWHM) of the diffraction peaks, is approximately L ≈ 65 nm. The lattice parameter of the Ni phase is a = 0.35258 ± 0.000031 nm.
Similarly, the diffraction pattern of the CW3 composite (Figure 1(d)) also exhibits a series of diffraction peaks corresponding to the polycrystalline Ni phase, with an average crystallite size of approximately L ≈ 90 nm. The Ni phase has a lattice parameter of a = 0.35275 ± 0.000037 nm. The diffuse maximum observed at 2θ ≈ 23.7° can be assigned to the amorphous carbon phase, with an average interlayer spacing between graphene layers of approximately d ≈ 0.375 nm.
In the case of CB1 (Figure 1(e)), the recorded diffraction profile contains a larger number of phases than that of CW1. In addition to the amorphous carbon phase, several diffraction peaks corresponding to SiO2 were identified, together with additional phases that possibly originated from impurities initially contained in the sugar beet pulp. The amorphous carbon phase gives rise to a diffuse maximum at 2θ ≈ 23.2° corresponding to an average interlayer spacing between graphene layers of approximately d ≈ 0.380 nm.
The XRD profile obtained for CB2, obtained by pyrolysis in the presence of NiCl2 as the activating agent, reveals SiO2 and polycrystalline Ni phases alongside the amorphous carbon phase (Figure 1(f)). The diffuse maximum at 2θ ≈ 23.3° corresponds to an average interlayer spacing of d ≈ 0.380 nm in graphite-like clusters. The polycrystalline Ni phase is characterized by a lattice parameter of a = 0.3528 ± 0.0002 nm, while the average crystallite size is L ≈ 100 nm.
Similarly to the CB2 sample, the diffraction pattern of CB3 also reveals the formation of SiO2 and polycrystalline Ni phases together with the amorphous carbon phase (Figure 1(g)). The main diffuse maximum is located at 2θ ≈ 23.3°, corresponding to an average interlayer spacing of d ≈ 0.380 nm in graphite-like clusters. The polycrystalline Ni phase is characterized by the same lattice parameter (a = 0.3528 ± 0.0002 nm) and an average crystallite size (L ≈ 100 nm).
The major-element composition of the synthesized samples was assessed by EDX analysis. Table 1 lists average concentrations of elements with contents exceeding 1 wt.%. The data show that the addition of urea resulted in an increased nitrogen content in both series of samples. An interesting observation is that both biomass precursors already contained a certain amount of nitrogen in their structure. This is evident from the EDX analysis of samples CW2 and CB2, which were synthesized without the addition of urea. Another notable feature of these samples, compared with those reported in [23], is the higher nickel content in the composites synthesized without urea. It is likely that when nitrogen is already present in the precursor, urea and nickel chloride no longer exhibit a synergistic effect on nickel incorporation into the composite structure. No nitrogen was detected by EDX analysis in the hydrolysis lignin used as the precursor for composite synthesis in [23]. Consequently, the addition of urea in that case promoted more efficient incorporation of nickel into the synthesized composites. Furthermore, silicon and calcium were detected in the sugar-beet-pulp-derived composites, confirming the X-ray diffraction results presented in Figure 1(e)–(g).
Table 1.
Elemental composition of the synthesized nanocomposites.
3.2. Porous Structure and Textural Properties of the Synthesized Nanocomposites
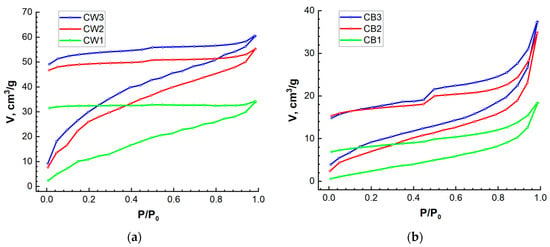
Figure 2 shows the nitrogen adsorption/desorption behavior of the synthesized nanocomposites, measured to characterize their porous structure. Based on the IUPAC classification, CW1, CW2, and CW3 display features of both Type I and Type IV isotherms, whereas the profiles obtained for CB1, CB2, and CB3 correspond to Type IV isotherms [29]. In addition, all synthesized nanocomposites exhibit a divergence between the adsorption and desorption branches that becomes more pronounced in the low-pressure region. This phenomenon is referred to as low-pressure hysteresis. Such behavior of the isotherms in porous materials of different origins may arise from various causes. However, in carbon materials, this hysteresis is attributed to kinetic limitations on the diffusion of nitrogen molecules within narrow slit-shaped pores or pores with an ink-bottle geometry [29,30]. A hysteresis loop of the H4 type is also observed at relative pressures above P/P0 > 0.4, in accordance with the IUPAC classification [29]. This hysteresis is more pronounced for samples CB2 and CB3, synthesized from sugar beet pulp in the presence of nickel chloride as the activating agent (Figure 2b). H4 hysteresis loops are characteristic of nitrogen adsorption/desorption on activated carbons and other adsorbents containing narrow slit-shaped pores [31]. Therefore, the carbon component of the synthesized nanocomposites derived from both biomass precursors most likely contains a significant proportion of slit-shaped pores.
Figure 2.
Nitrogen adsorption/desorption profiles recorded for the nanocomposites: (a) CW1, CW2, CW3; (b) CB1, CB2, CB3.
The Quantachrome TouchWin software (version 1.12) was employed for quantitative analysis of the different pore types with respect to the porous structure of the synthesized nanocomposites. The multipoint BET procedure was applied to calculate the total specific surface area. Mesopore parameters were calculated by the BJH method, whereas micropores were analyzed using the MP method [31]. The calculated textural parameters are summarized in Table 2.
Table 2.
Textural parameters of the synthesized nanocomposites.
As can be seen from Table 2, the nanocomposites synthesized from wheat straw are predominantly microporous materials. The BET method provides a good correlation coefficient for all synthesized samples. However, the presence of a considerable amount of micropores makes this method suitable only for estimating the total surface area. Moreover, for samples CW2 and CW3, the sum of the specific surface areas of the micropores and mesopores does not coincide with the total value obtained from BET analysis. Calculation of mesopore parameters by the BJH approach relies on the Kelvin equation and is applicable only to pores larger than approximately 4–5 nm. The average pore diameters determined for nanocomposites CW2 and CW3 are, however, well below this threshold (Table 2). Under these conditions, the Kelvin equation loses its physical significance because the properties of nitrogen in narrow slit-shaped pores differ from those of the bulk liquid. This is responsible for the low values obtained for the mesopore parameters of samples CW2 and CW3.
According to the data presented in Table 2, the nanocomposites synthesized from sugar beet pulp are predominantly mesoporous materials with a very small fraction of micropores. The shape of the adsorption/desorption isotherms in Figure 2 also suggests that the mesopore parameters calculated for CB2 and CB3 may be underestimated. In both cases, the desorption branch drops sharply at approximately P/P0 ≈ 0.45. Because the mesopore surface area and pore volume were derived from this branch, the BJH calculation produces an artificial maximum in the pore-size distribution at this relative pressure. This most likely leads to a distortion of the calculated mesoporous structure parameters of nanocomposites CB2 and CB3.
An important conclusion that can be drawn from the data presented in Table 2 is that the addition of both activating agents during synthesis increases the overall porosity of the resulting materials. Thus, both urea and nickel chloride promote the development of the porous structure. It should also be noted that the addition of the activating agents promotes the development of both micropores and mesopores.
3.3. Magnetic Properties of the Synthesized Nanocomposites
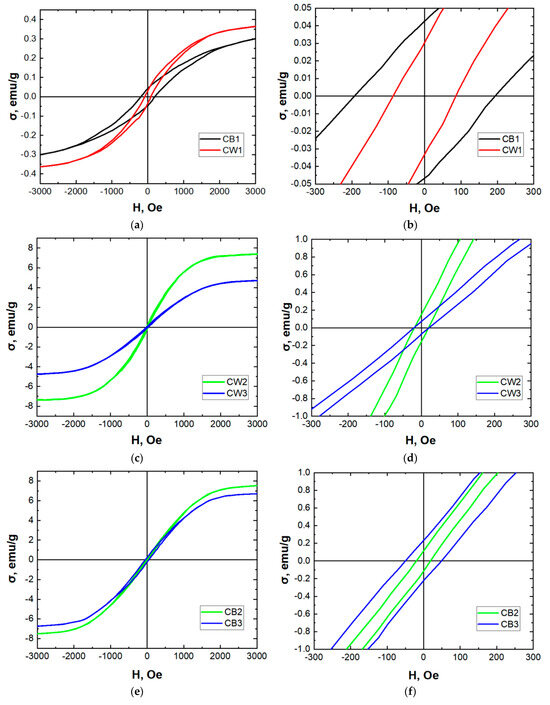
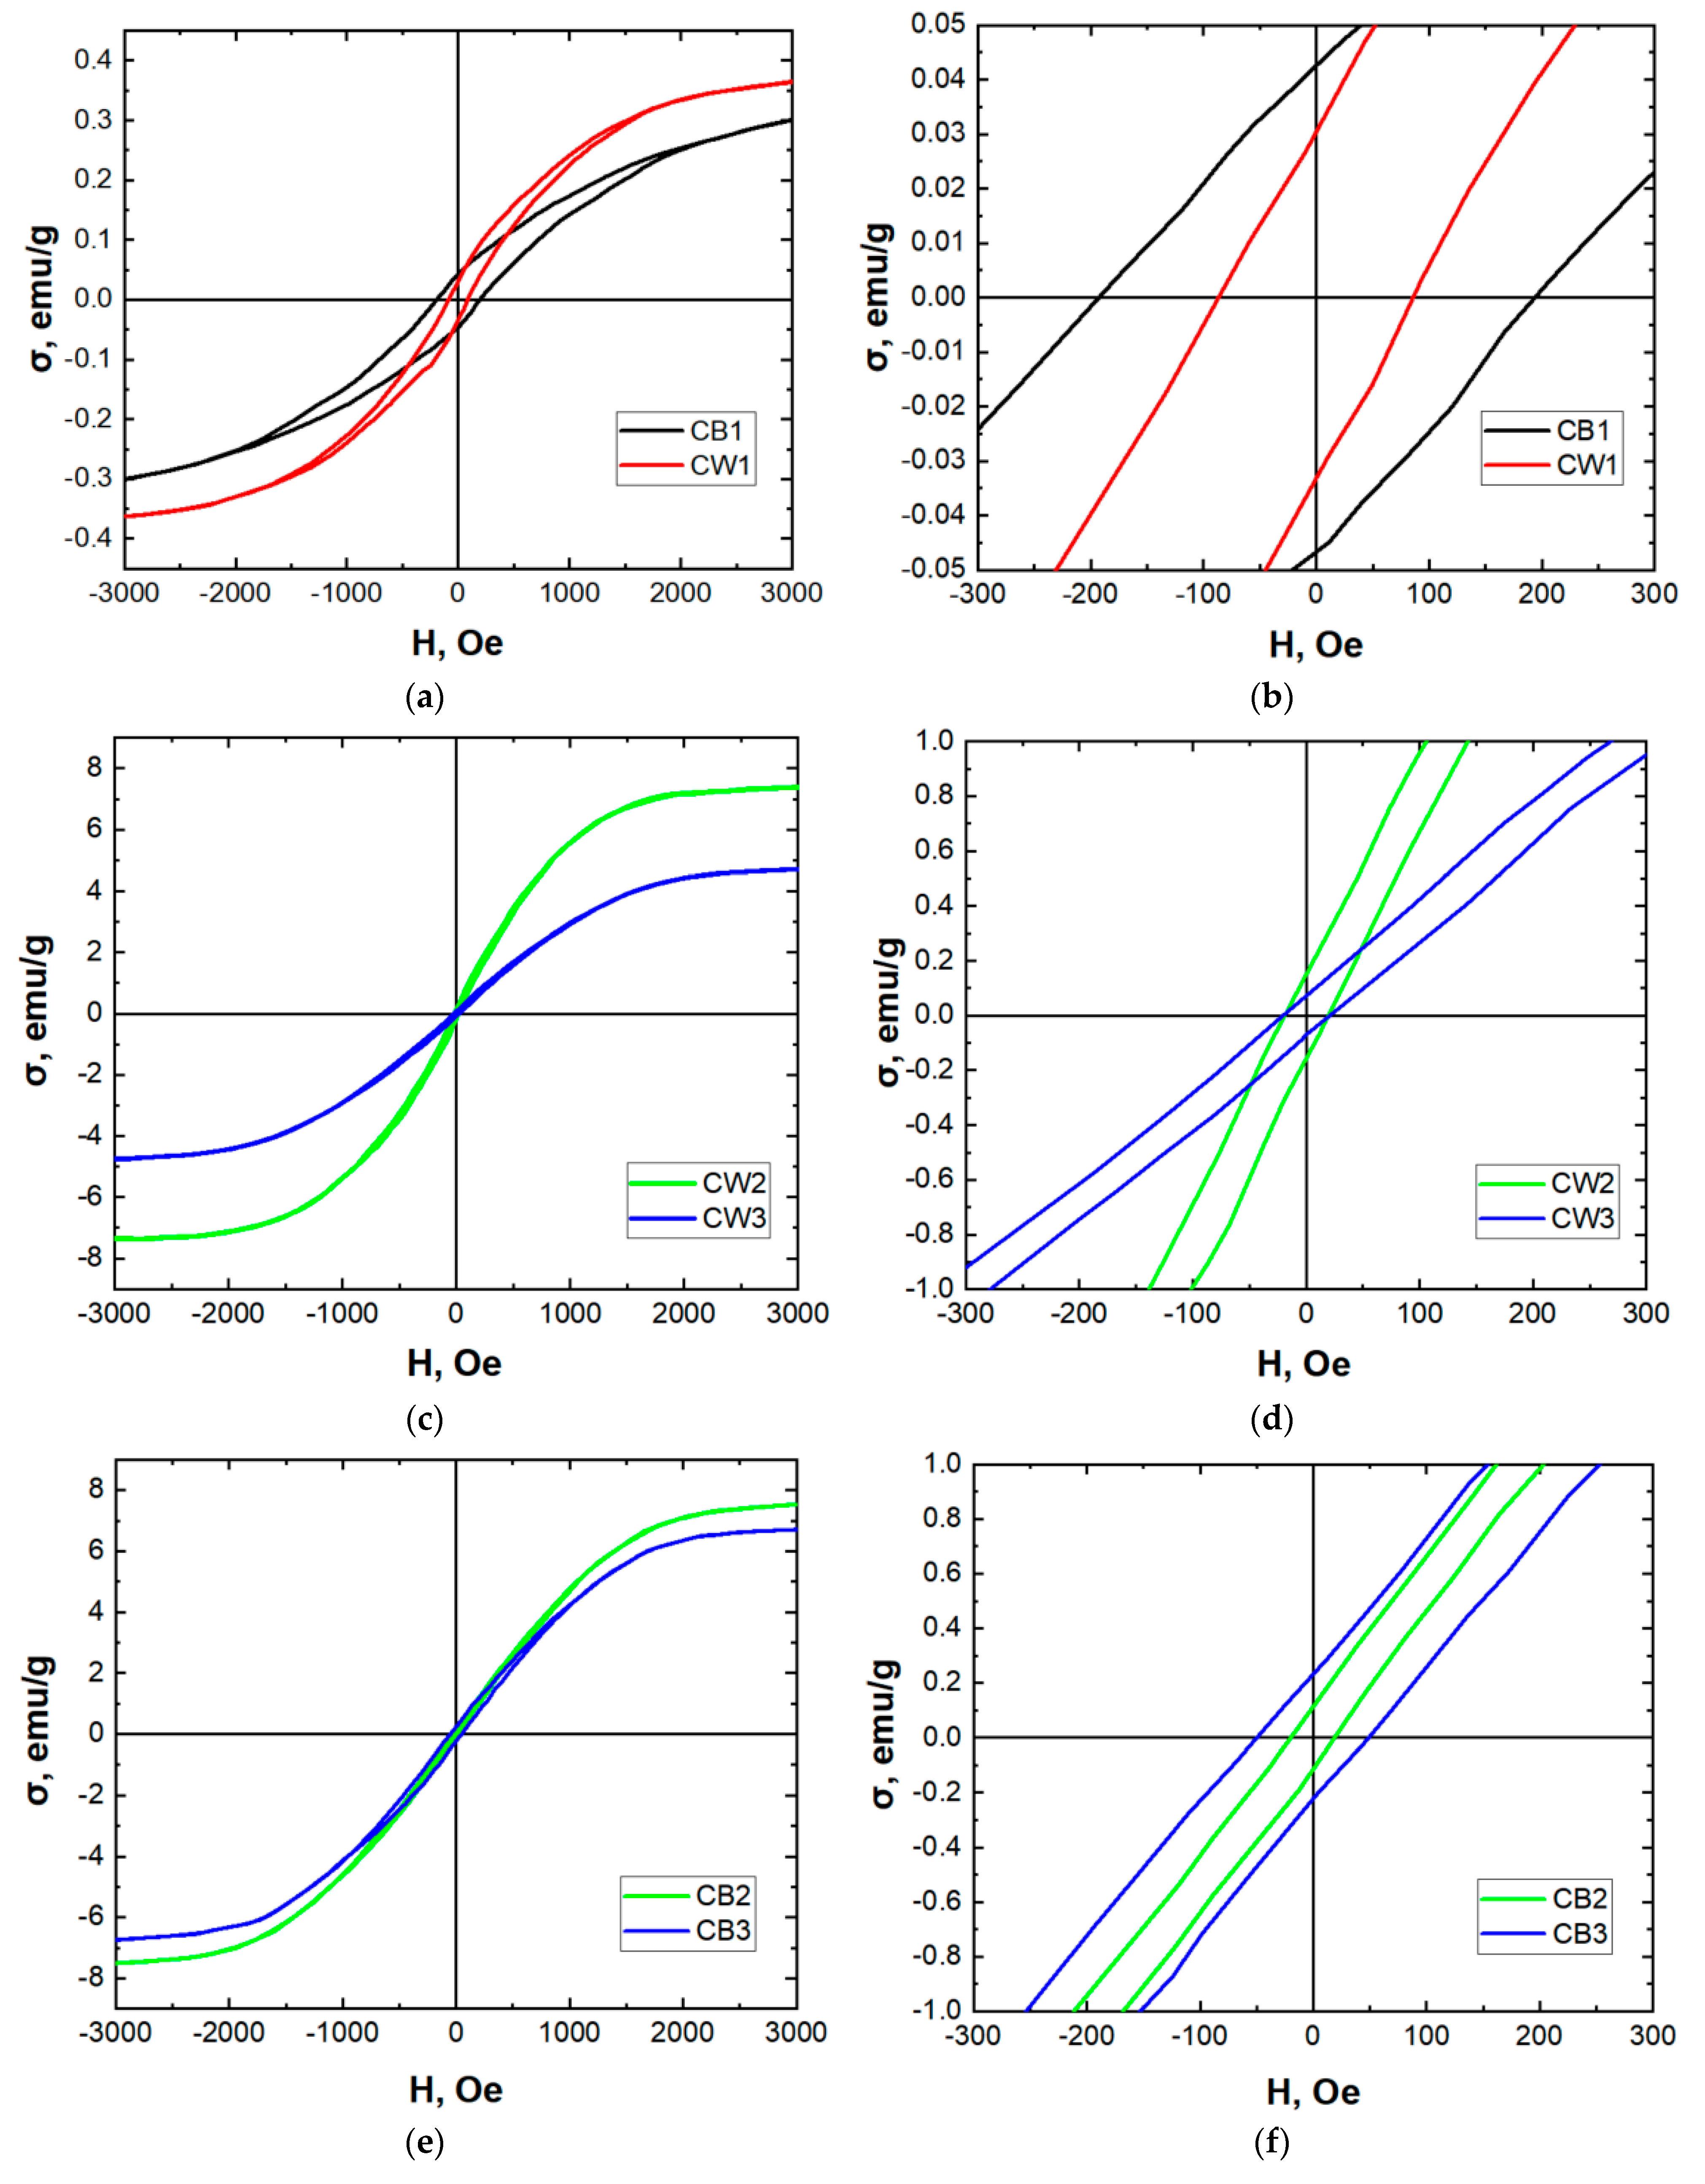
Figure 3 presents the magnetic hysteresis loops of the synthesized samples. The corresponding values of specific saturation magnetization (σs), remanent magnetization (σr), coercivity (HC), and Ni mass fraction were determined (Table 3).
Figure 3.
Magnetic hysteresis of the nanocomposites: (a,b) CW1, CB1; (c,d) CW2, CW3; (e,f) CB2, CB3.
Table 3.
Magnetic properties of the synthesized nanocomposites.
The XRD results shown in Figure 1 indicate that the magnetic properties of nanocomposites CW2, CW3, CB2, and CB3 are governed by the presence of polycrystalline nickel. In contrast, the mechanism responsible for the magnetic behavior of the carbon structures CW1 and CB1 (Figure 3a,b), which do not contain metal atoms, is fundamentally different and is apparently associated with the presence of nitrogen at concentrations of 8.6 wt.% and 6.93 wt.%, respectively (Table 1).
In an earlier study [32], ferromagnetism was investigated in pyrolyzed polyacrylonitrile. The authors hypothesized that the magnetism originated from islands of a ferromagnetic graphitic phase embedded in a nonmagnetic carbon matrix. Nitrogen doping has become an effective approach for imparting magnetic properties to carbon-based materials by modifying their electronic structure and inducing spin polarization [33,34]. Carbon and nitrogen have similar atomic sizes, and nitrogen has five valence electrons. Therefore, substitutional doping of graphene can occur through the formation of strong covalent bonds with carbon atoms while preserving the planar structure. This process can generate unpaired spins and substantially modify the physical properties of graphene [35]. It has been shown [36] that ferromagnetism in nitrogen-doped carbon materials emerges when the nitrogen concentration exceeds a critical threshold and depends on both the concentration and structural configuration of nitrogen within graphene clusters.
For ferromagnetic carbon structures synthesized from nitrogen-containing precursors, the presence of a disordered amorphous structure has also been found to play an important role. The spontaneous magnetization increases with increasing amorphous phase content [37]. Variation in the defect concentration within the carbon structure provides another means of controlling its magnetization [38]. Structural defects, together with the nitrogen present in the precursor, induce ferromagnetic behavior in biocarbon materials synthesized by direct pyrolysis [39]. XRD analysis of CW1 and CB1 (Figure 1) revealed an increased interlayer spacing between graphene layers within graphitic clusters compared with polycrystalline graphite. Therefore, the disordered arrangement of graphene layers and the increased interlayer spacing are indicative of a higher concentration of structural defects in the carbon framework. The combination of structural defects and nitrogen-doped graphene clusters is the most probable reason for the emergence of ferromagnetic behavior in samples CW1 and CB1 synthesized without the addition of ferromagnetic elements. The similar nitrogen contents of CW1 and CB1 may account for the nearly identical specific saturation magnetization values measured for these composites. The almost twofold higher coercivity of composite CB1 compared with CW1 may be attributed to impurity elements, such as silicon, present in CB1.
The average nickel particle size was estimated from the reported room-temperature relationship between coercivity and nanoparticle size [40] and was found to be approximately 110 nm for CW2, CW3, and CB2 and approximately 100 nm for CB3. These particles are apparently multidomain because their estimated diameters exceed the critical single-domain diameter of 85 nm for Ni nanoparticles at 300 K [41]. For CB2 and CB3, the particle-size estimates are consistent with the values obtained from X-ray diffraction. However, for samples CW2 and CW3, the X-ray coherence lengths of nickel are smaller. This may be attributed to the influence of the substantial fraction of micropores within the porous structure of these samples on X-ray scattering (Table 2).
3.4. Surface Charge Characteristics of the Synthesized Nanocomposites
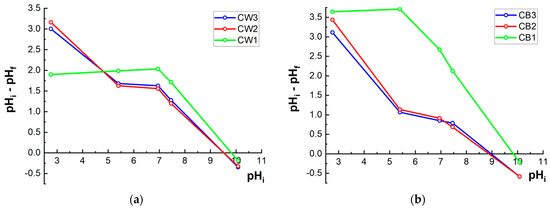
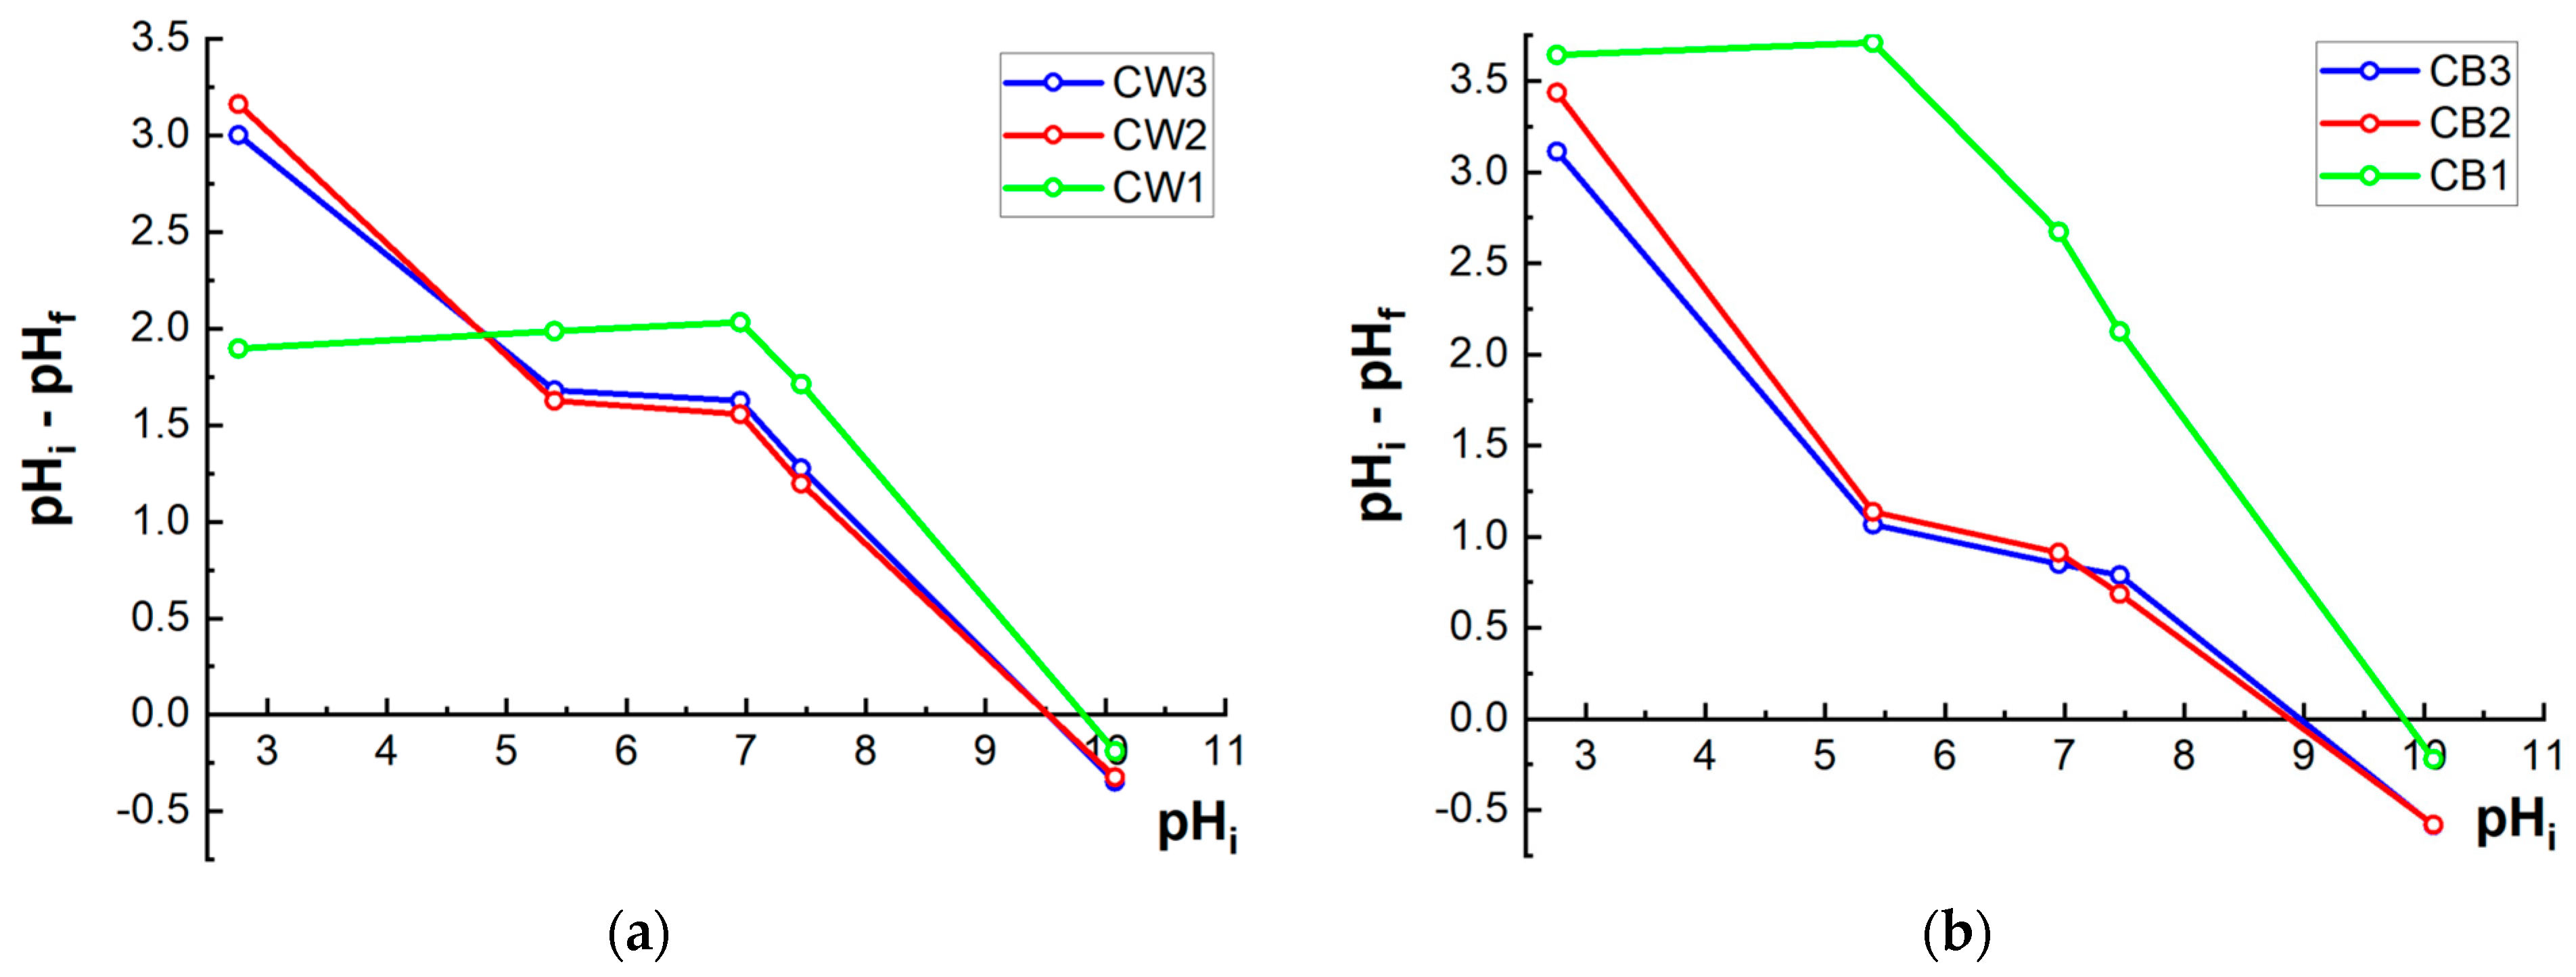
The point of zero charge (pHpzc) is one of the key parameters influencing the adsorption performance of a porous material. This parameter characterizes the surface charge state of the adsorbent in contact with an aqueous solution at a specified pH. Figure 4 presents the average change in solution pH as a function of the initial pH for all synthesized composites.
Figure 4.
Determination of the point of zero charge of the synthesized nanocomposites: (a) CW1, CW2, CW3; (b) CB1, CB2, CB3.
The following pHpzc values were determined from Figure 4 for each nanocomposite:
- pHpzc (CW1) = 9.82 ± 0.05;
- pHpzc (CW2) = 9.52 ± 0.05;
- pHpzc (CW3) = 9.52 ± 0.05;
- pHpzc (CB1) = 9.83 ± 0.05;
- pHpzc (CB2) = 8.87 ± 0.05;
- pHpzc (CB3) = 8.95 ± 0.05.
As can be seen from these values, the addition of the nickel chloride activator results in a slight shift in the pHpzc values toward lower pH. Nevertheless, all pHpzc values remain considerably higher than the pH of the CR solution used in this study (pH = 6). Because of its sulfonate (–SO3−) groups, CR predominantly occurs in aqueous media in an anionic form. At pH values below the pHpzc of the adsorbent (pH < pHpzc), the surface acquires a positive charge, which promotes electrostatic attraction of the negatively charged CR species and consequently favors their adsorption [42]. Therefore, based on the pHpzc values obtained, all synthesized nanocomposites are expected to effectively adsorb negatively charged CR ions.
3.5. Adsorption Isotherm Analysis of Congo Red Removal by the Synthesized Nanocomposites
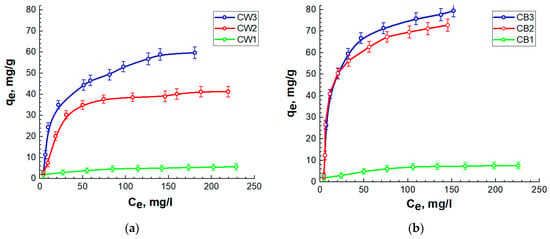
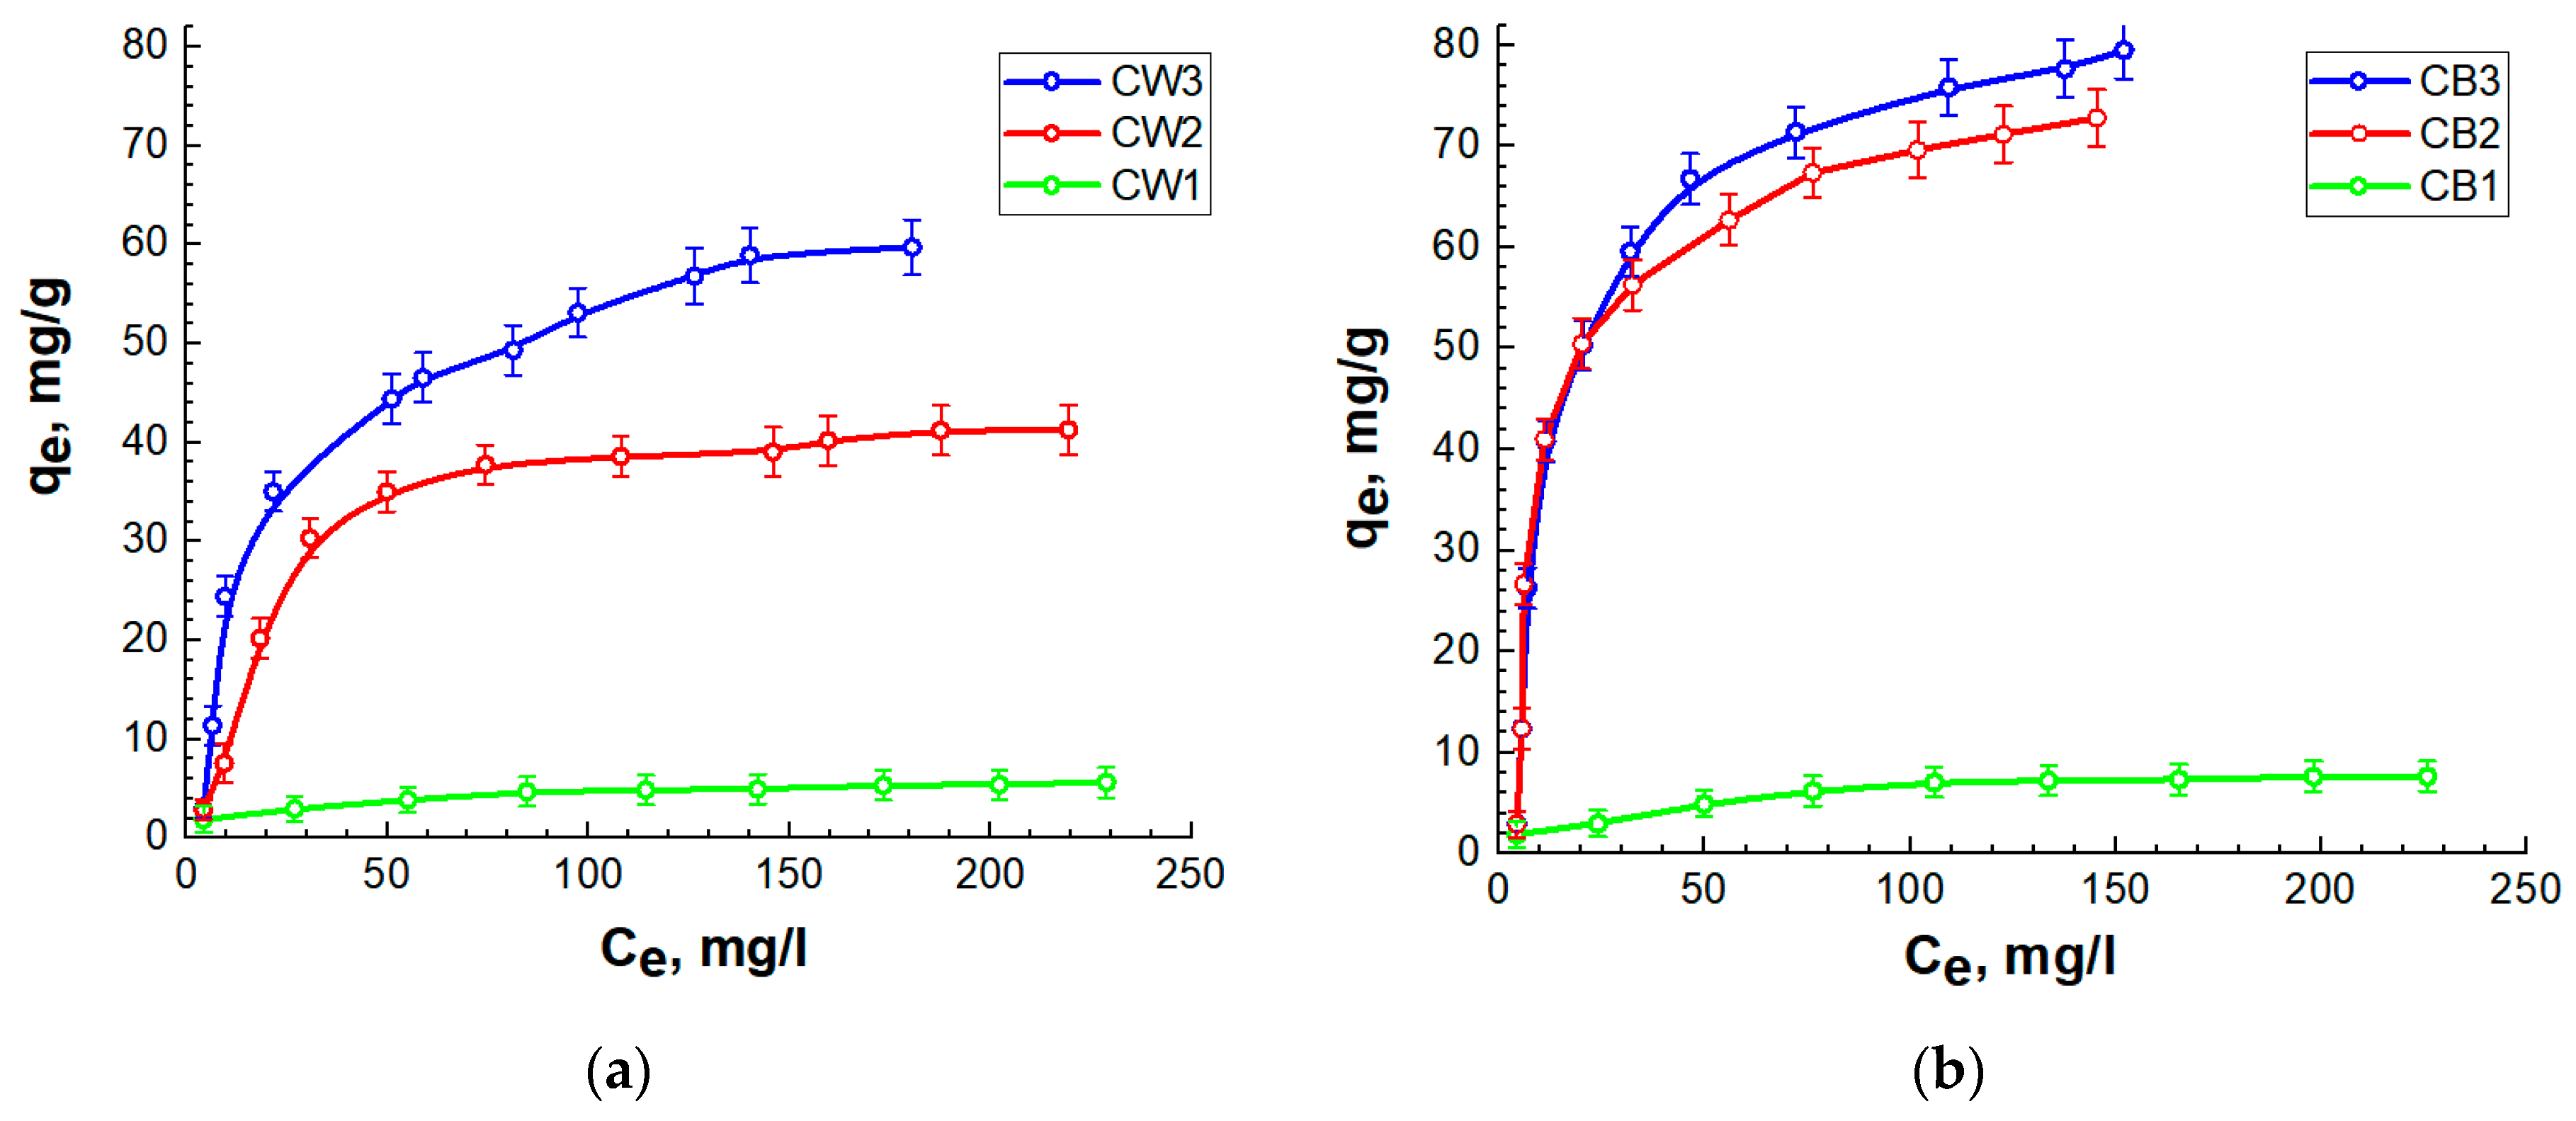
The equilibrium adsorption capacity, qe, was determined from the decrease in dye concentration resulting from contact between the solution and the synthesized carbon materials, using the initial (C0) and the equilibrium (Ce) concentrations. The adsorption capacities obtained at equilibrium were used to construct the isotherms () shown in Figure 5.
Figure 5.
Congo Red adsorption isotherms of the synthesized nanocomposites: (a) CW1, CW2, CW3; (b) CB1, CB2, CB3.
The isotherms obtained for CR adsorption exhibit the characteristic features of the L-type classification [43]. Such isotherms are commonly analyzed using two-parameter adsorption models. The experimental data were therefore fitted using the Langmuir, Freundlich, and Dubinin–Radushkevich (D–R) models.
The Langmuir model is the classical model for L-type isotherms and describes monolayer adsorption on a homogeneous adsorbent surface. The nonlinear form of the Langmuir equation is expressed as
where qm represents the maximum adsorption capacity, whereas KL denotes the Langmuir constant.
Using the Langmuir constant, the dimensionless separation factor (RL), also referred to as the equilibrium parameter, can be determined from the following equation [44]:
where C0 denotes the initial concentration of the dye.
The separation factor RL is used to characterize the adsorption behavior: values above unity indicate unfavorable adsorption, RL = 1 corresponds to linear adsorption, values between 0 and 1 indicate favorable adsorption, whereas RL = 0 denotes an irreversible process. The minimum dye concentration was used to calculate this parameter.
The Freundlich equation is commonly used to represent adsorption occurring on energetically heterogeneous surfaces. Unlike the Langmuir model, it does not assume that all adsorption sites possess identical adsorption energies. Consequently, adsorption preferentially occurs at the sites with the highest adsorption energy.
For the Freundlich model, the nonlinear equation can be written as follows:
where KF represents the Freundlich constant, whereas n characterizes the heterogeneity of the adsorbent surface.
Information on the energy characteristics of adsorption can be obtained by applying the Dubinin–Radushkevich model to the experimental isotherms. An important advantage of this model is that it does not require the adsorbent surface to be homogeneous. The nonlinear D–R equation and its associated parameters are expressed as
where qs denotes the D–R isotherm constant related to the adsorption capacity, while KDR is related to the mean free energy of adsorption. R and T represent the universal gas constant and absolute temperature, respectively. The Polanyi potential ε describes the isothermal work required to transfer one mole of dye from the bulk solution to the adsorbent surface, and E denotes the mean adsorption energy.
The mean adsorption energy (E) provides information about the nature of the interactions occurring between the adsorbate and active sites on the adsorbent surface. According to the commonly used criteria, E < 8 kJ mol−1 is associated with physisorption, values of 8 < E < 16 kJ mol−1 indicate adsorption dominated by ion exchange, and E > 16 kJ mol−1 is characteristic of chemisorption [45].
Table 4 compiles the adsorption parameters obtained by fitting the CR adsorption isotherms shown in Figure 5.
Table 4.
Parameters of the adsorption isotherm models for Congo Red adsorption by the synthesized nanocomposites.
The data in Table 4 indicate that the Langmuir model provides an almost perfect description of the adsorption isotherms for samples CW1, CW2, and CW3. This indicates the presence of adsorption sites with nearly identical adsorption energies and the absence of interactions between already adsorbed molecules. The progressive increase in qm from CW1 through CW2 to CW3 is consistent with the corresponding development of porosity in these samples (Table 2). The Langmuir constant provides an indication of the interaction affinity between the adsorbent surface and the adsorbate. Among these samples, CW2 exhibits the highest affinity, suggesting that this nanocomposite possesses more active adsorption sites than CW1 and CW3. The values of RL are lower than 1 for all carbon materials synthesized from wheat straw, indicating favorable adsorption.
For samples CW1 and CW3, the experimental isotherms are adequately represented by the Freundlich model. However, the correlation coefficient (R2) is lower for sample CW2. This sample also exhibits the lowest value of the parameter 1/n (0.144), indicating the highest degree of energetic heterogeneity of its adsorption surface. At the same time, all samples (CW1, CW2, and CW3) have 1/n < 0.5, confirming that adsorption is favorable.
Similarly to the previous model, the D–R model shows good agreement with the adsorption isotherms of samples CW1 and CW3 but provides a poorer fit for sample CW2. The value of qs is higher than the qm value obtained from the Langmuir isotherm. This behavior is typical because the D–R model estimates the theoretical adsorption capacity of the microporous space. However, not all adsorption sites participate in the adsorption of CR molecules because of steric constraints associated with such large molecules. As noted above, the mean adsorption energy is the highest for sample CW2. Nevertheless, the adsorption energies of samples CW1, CW2, and CW3 all fall within a relatively narrow range. The D–R model is particularly informative for microporous carbon materials. However, because CR molecules are relatively large, their adsorption is expected to occur predominantly in the mesoporous space accessible within the synthesized nanocomposites. Therefore, the obtained adsorption energy values should be regarded only as indicative estimates of the strength of adsorbate–adsorbent interactions rather than as definitive evidence of a specific adsorption mechanism. Several interactions may contribute to the observed adsorption, such as π–π coupling between the aromatic moieties of CR and graphitic domains, electrostatic forces, and hydrogen bonding.
Similar adsorption behavior is observed for the sugar-beet-pulp-derived samples CB1, CB2, and CB3. Sample CB3 exhibits the highest adsorption capacity, and its experimental isotherm is described almost perfectly by the Langmuir model. As in the case of sample CW2, sample CB2 has the highest Langmuir constant, indicating the greatest affinity of the adsorbent surface toward CR molecules. This is consistent with the lowest value of the 1/n parameter obtained from the Freundlich model for this sample. For all CB1, CB2, and CB3 samples, the values of 1/n are lower than 0.5, indicating favorable adsorption. The favorable nature of the adsorption process is also confirmed by the RL values, all of which are below 1.
The D–R model also provides a satisfactory description of the experimental data, although its correlation coefficients are lower than those of the Langmuir model. Sample CB2 exhibits the highest mean adsorption energy, reaching 16.2 kJ mol−1. This value lies at the boundary between physisorption and chemisorption. However, the D–R model alone does not allow the unequivocal conclusion that chemisorption occurs. It is likely that the strongest interactions between CR molecules and the oxygen-containing and/or nitrogen-containing functional groups on the surface occur in sample CB2.
A comparison of the CW and CB sample series reveals several interesting features. Samples CB2 and CB3 exhibit nearly 1.5-fold higher maximum adsorption capacities (qm) than samples CW2 and CW3. Both the Langmuir constant and the adsorption energy derived from the D–R model also increase, indicating a greater affinity of the adsorbent surface toward CR molecules. For both series, however, the Langmuir equation gives the best representation of the experimental isotherms. Thus, the higher adsorption capacity appears to result primarily from a greater number of accessible active sites rather than from a change in the underlying adsorption mechanism. Although the CW samples derived from wheat straw possess substantially higher specific surface areas than the CB samples (Table 2), most of this surface area is associated with micropores. In contrast, the mesopore content of samples CB2 and CB3 is nearly three times higher than that of CW2 and CW3. Given that the length of a CR molecule is approximately 2.6 nm [46], it is expected to be adsorbed primarily within mesopores. This difference in pore structure likely explains the higher adsorption capacities of CB2 and CB3 compared with CW2 and CW3.
Table 5 compares the Congo Red adsorption performance of the materials prepared in this study with values reported for other magnetic carbon composites and nickel-containing adsorbents.
Table 5.
Comparison of Congo Red adsorption performance of magnetic and nickel-containing adsorbents.
As shown in Table 5, the synthesized nanocomposites exhibit adsorption capacities comparable to those reported for other magnetic carbon composites and nickel-containing adsorbents under broadly comparable experimental conditions. This is particularly evident when compared with the Congo Red adsorption capacity reported for nickel ferrite nanofibers [49].
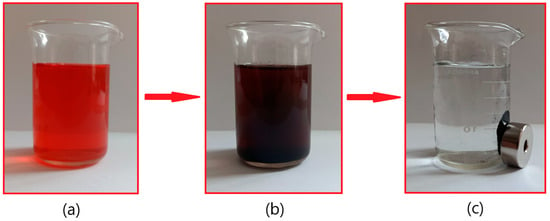
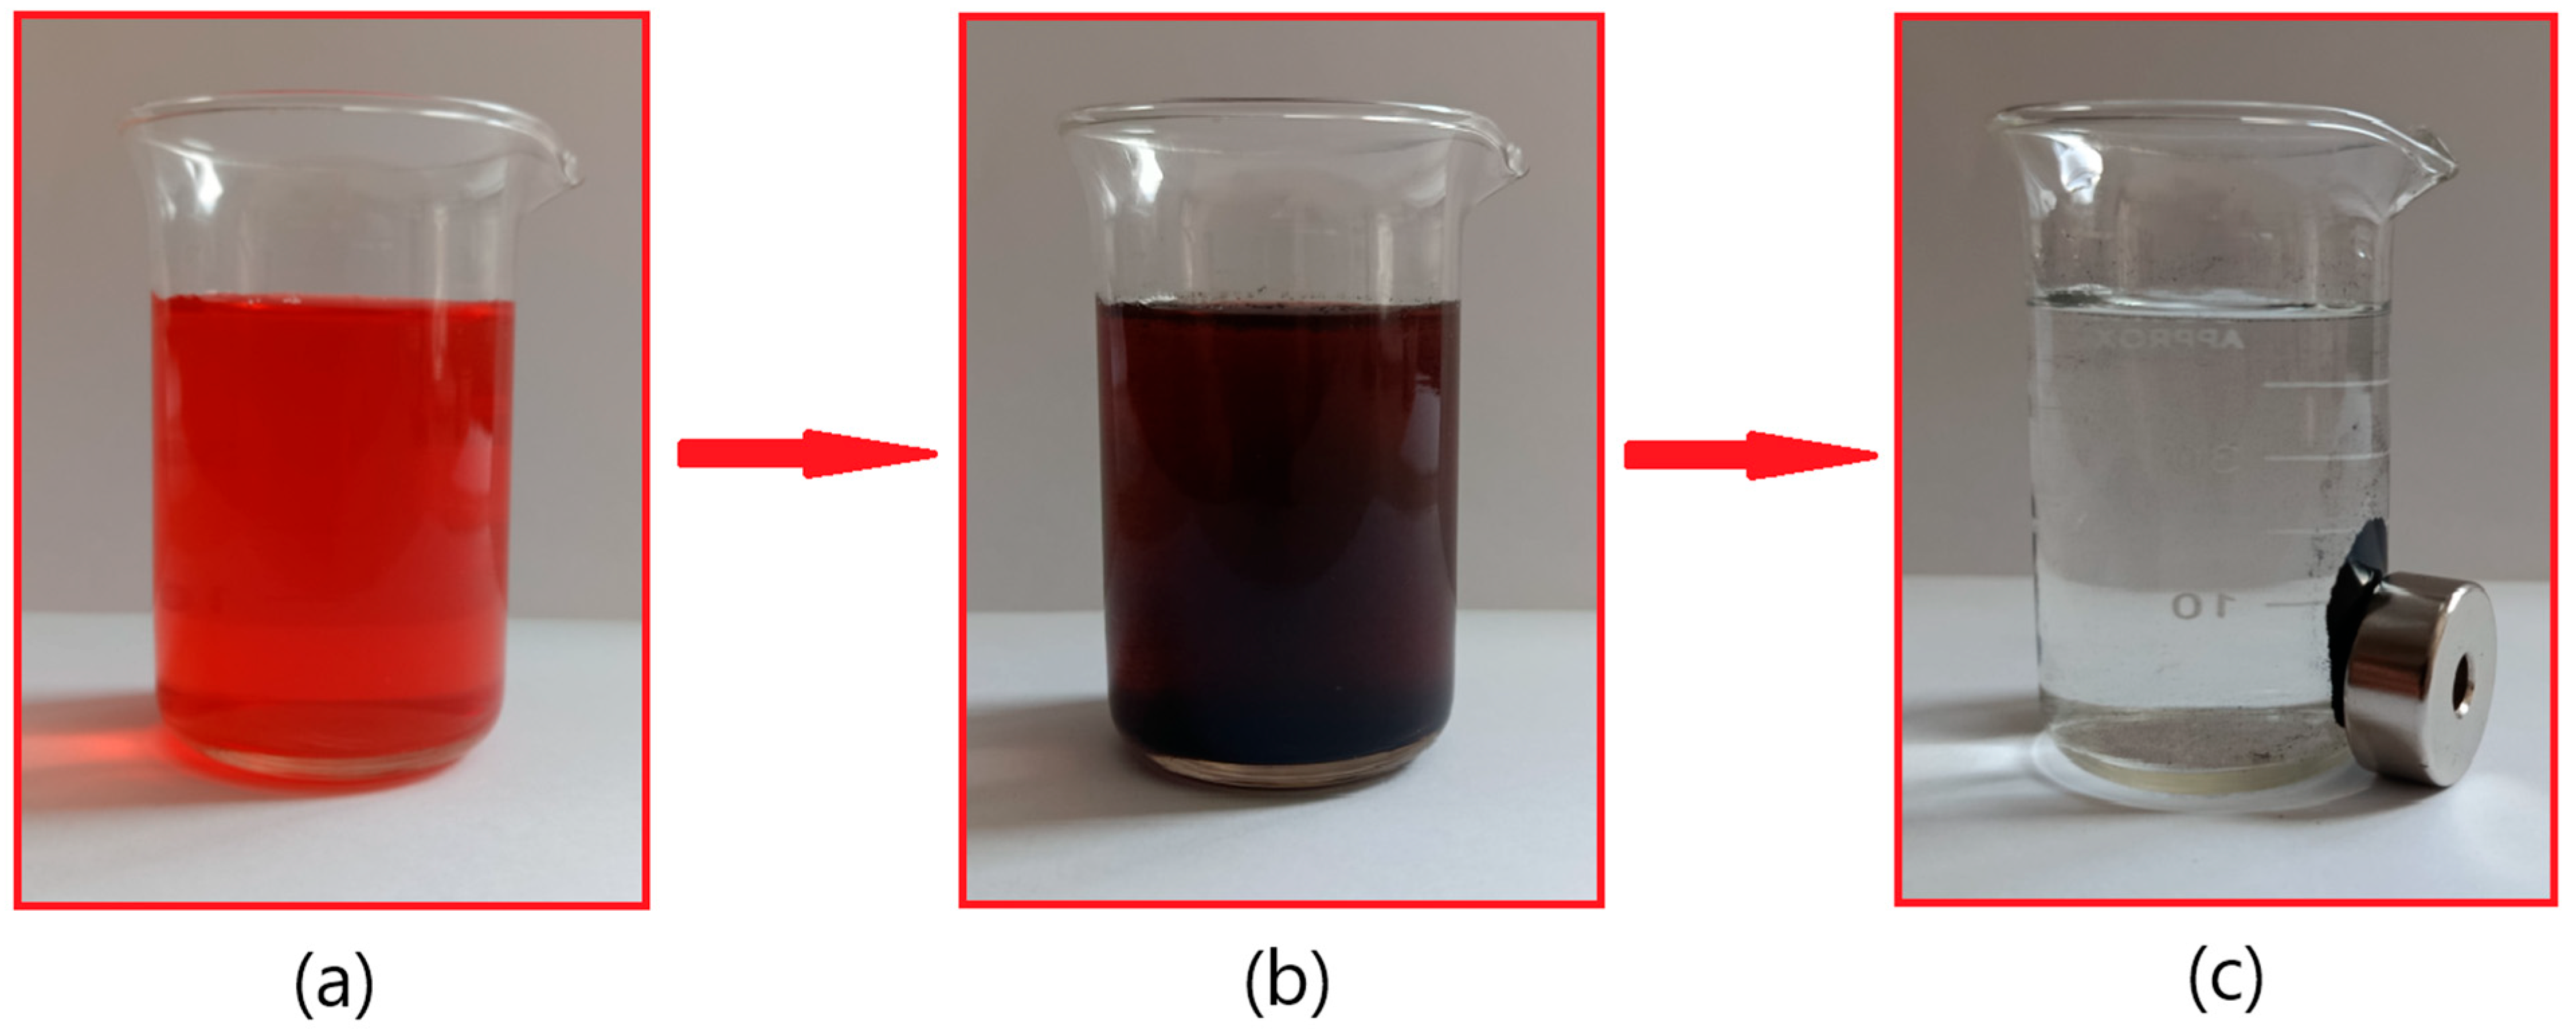
The practical potential of the synthesized magnetic carbon nanocomposites for Congo Red removal from aqueous solution is illustrated in Figure 6. Initially, the aqueous CR solution exhibited an intense red color characteristic of the dye (Figure 6a). After addition of the CB3 magnetic carbon adsorbent and mechanical mixing, the solution became visibly turbid because of the dispersion of the composite particles throughout the solution (Figure 6b). After completion of the adsorption process, an external permanent neodymium magnet was placed next to the vessel. Under gentle mixing, the magnetic adsorbent rapidly migrated toward and accumulated near the bottom or sidewall of the vessel, resulting in the separation of nearly all visible solid particles from the treated aqueous phase (Figure 6c). The resulting aqueous phase appeared visually clear, while the adsorbent was retained by the magnetic field. This simple magnetic separation demonstrates the potential practical advantage of biomass-derived magnetic carbon adsorbents over conventional powdered carbon materials, for which solid–liquid separation after treatment may require filtration, prolonged sedimentation, or centrifugation.
Figure 6.
Sequential adsorption and magnetic separation of CR from aqueous solution using the synthesized magnetic carbon nanocomposite: (a) initial dye solution, (b) aqueous suspension after contact with the magnetic adsorbent, and (c) magnetic separation of the dye-loaded composite from the treated aqueous phase.
Potential Ni leaching should be carefully considered when assessing the suitability of these magnetic adsorbents for wastewater treatment applications. Adsorption capacity and potential reusability alone are insufficient to establish the environmental safety of Ni-containing adsorbents, because the chemical stability of the magnetic phase and the possible release of Ni ions into the treated water must also be considered. Previous studies indicate that Ni leaching strongly depends on the structural organization and chemical composition of the magnetic phase. Stijepović et al. demonstrated that a ZnFe2O4 shell surrounding a NiFe2O4 core substantially reduces Ni release when the material is exposed to ultrapure water and saline solution, indicating that appropriate structural design can effectively control Ni release from nickel ferrite [51]. In contrast, Leichtweis et al. reported measurable Ni release from NiFe2O4/biochar during a 28 h flow-through experiment, with Ni detected already at the initial stage of adsorption. Their results also showed that contact time and the chemical environment can substantially affect the stability of Ni-containing magnetic materials [52]. Study [53] reported that the presence of a carbon phase can contribute to Ni stabilization and minimize its leaching into the aqueous phase. These findings indicate that potential Ni release should not be overlooked when considering the practical application of such adsorbents, particularly under continuous-flow or chemically aggressive operating conditions. In the present study, Ni leaching was not experimentally evaluated; therefore, no quantitative conclusions regarding the stability of Ni in the synthesized materials under the applied adsorption conditions can be drawn. Direct monitoring of Ni concentrations in the aqueous phase as a function of pH, contact time, ionic strength, and repeated adsorption–desorption cycles should therefore be included in future studies.
4. Conclusions
Porous Ni/C/N nanocomposites were successfully synthesized from wheat straw and sugar beet pulp using a two-stage direct pyrolysis process with NiCl2 and urea as activating agents. The proposed synthesis approach simultaneously promoted pore development, nitrogen incorporation, and the formation of ferromagnetic nickel nanoparticles embedded within the carbon matrix.
Structural characterization demonstrated that the precursor strongly influenced the pore architecture. Wheat-straw-derived materials exhibited predominantly microporous structures with higher specific surface areas, whereas sugar-beet-pulp-derived samples contained a larger fraction of mesopores. Nitrogen incorporation and structural defects also induced intrinsic ferromagnetism in metal-free carbon matrices, while nickel-containing samples exhibited enhanced magnetic properties due to the presence of metallic Ni nanoparticles.
Adsorption studies revealed that the Langmuir equation provided the closest fit to all Congo Red isotherms, suggesting that the adsorption occurs predominantly as a monolayer on active sites with similar adsorption energies. The enhanced adsorption performance of sugar-beet-pulp-derived composites, despite their lower BET surface area, highlights the decisive role of mesoporosity and pore accessibility for large dye molecules rather than the total surface area alone.
Overall, these results establish clear relationships among the biomass precursor, porous structure, magnetic behavior, and adsorption performance. The developed magnetic Ni/C/N nanocomposites combine efficient dye removal with facile magnetic separation for wastewater treatment.
Author Contributions
Conceptualization, I.B. and M.M.; methodology, I.B., D.C. and A.B.; software, V.P. and N.N.; formal analysis, I.B., M.M. and D.C.; investigation, A.B., V.P. and N.N.; data curation, I.B., A.B. and V.P.; writing—original draft preparation N.N. and V.P.; writing—review and editing, I.B., D.C. and M.M.; visualization, I.B. and N.N.; supervision, I.B.; funding acquisition, M.M. and D.C. All authors have read and agreed to the published version of the manuscript.
Funding
This research received no external funding.
Institutional Review Board Statement
Not applicable.
Informed Consent Statement
Not applicable.
Data Availability Statement
The original contributions presented in this study are included in the article. Further inquiries can be directed to the corresponding author.
Conflicts of Interest
The authors declare no conflicts of interest.
References
- Oki, T.; Kanae, S. Global Hydrological Cycles and World Water Resources. Science 2006, 313, 1068–1072. [Google Scholar] [CrossRef] [Scilit] [PubMed]
- Sangamnere, R.; Misra, T.; Bherwani, H.; Kapley, A.; Kumar, R. A Critical Review of Conventional and Emerging Wastewater Treatment Technologies. Sustain. Water Resour. Manag. 2023, 9, 58. [Google Scholar] [CrossRef] [Scilit]
- Samer, M. Biological and Chemical Wastewater Treatment Processes. In Wastewater Treatment Engineering; Samer, M., Ed.; InTech: London, UK, 2015. [Google Scholar]
- Pratiwi, D.; Sumiarsa, D.; Oktavia, D.; Sunardi, S. Water Quality Influences Self-Purification in the Cihawuk and Majalaya Segments Upstream of the Citarum River, West Java, Indonesia. Water 2023, 15, 2998. [Google Scholar] [CrossRef] [Scilit]
- Bui, L.T.; Tran, D.L.T.H.; Nguyen, D.P. Role of Self-Cleaning Factors in River Water Environmental Capacity Assessment: A Case of Sai Gon Basin, Vietnam. Case Stud. Chem. Environ. Eng. 2024, 9, 100689. [Google Scholar] [CrossRef] [Scilit]
- Hnativ, R.; Cherniuk, V.; Khirivskyi, P.; Kachmar, N.; Lopotych, N.; Hnativ, I. Processes of Natural Self-Cleaning of Small Watercourses with Increasing Anthropogenic Load in the Dniester River Basin. J. Ecol. Eng. 2023, 24, 12–18. [Google Scholar] [CrossRef] [Scilit] [PubMed]
- Bordun, I.; Vasylinych, T.; Malovanyy, M.; Sakalova, H.; Liubchak, L.; Luchyt, L. Study of Adsorption of Differently Charged Dyes by Carbon Adsorbents. Desalin. Water Treat. 2023, 288, 151–158. [Google Scholar] [CrossRef] [Scilit]
- Kato, S.; Kansha, Y. Comprehensive Review of Industrial Wastewater Treatment Techniques. Environ. Sci. Pollut. Res. 2024, 31, 51064–51097. [Google Scholar] [CrossRef] [Scilit] [PubMed]
- Sabadash, V.; Nowik-Zając, A.; Konovalov, O. Use of microwave radiation for effective purification of wastewater from organic compounds. Environ. Probl. 2024, 9, 96–100. [Google Scholar] [CrossRef] [Scilit]
- Worku, A.K.; Ayele, D.W.; Teshager, M.A.; Omar, M.; Yerkrang, P.P.; Elgaddafi, R.; Alemu, M.A. Recent Advances in Wastewater Treatment Technologies: Innovations and New Insights. Energy Rev. 2025, 4, 100164. [Google Scholar] [CrossRef] [Scilit]
- Younas, F.; Mustafa, A.; Farooqi, Z.U.R.; Wang, X.; Younas, S.; Mohy-Ud-Din, W.; Ashir Hameed, M.; Mohsin Abrar, M.; Maitlo, A.A.; Noreen, S.; et al. Current and Emerging Adsorbent Technologies for Wastewater Treatment: Trends, Limitations, and Environmental Implications. Water 2021, 13, 215. [Google Scholar] [CrossRef] [Scilit]
- Tee, G.T.; Gok, X.Y.; Yong, W.F. Adsorption of Pollutants in Wastewater via Biosorbents, Nanoparticles and Magnetic Biosorbents: A Review. Environ. Res. 2022, 212, 113248. [Google Scholar] [CrossRef] [Scilit] [PubMed]
- Paluch, D.; Bazan-Wozniak, A.; Pietrzak, R. The Effect of Activator Type on Physicochemical and Sorption Properties of Nanostructured Carbon Adsorbents Obtained from Fennel Seed by Chemical Activation. Appl. Nanosci. 2023, 13, 7231–7246. [Google Scholar] [CrossRef] [Scilit]
- Nahurskyi, N.; Malovanyy, M.; Bordun, I.; Szymczykiewicz, E. Magnetically Sensitive Carbon-Based Nanocomposites for the Removal of Dyes and Heavy Metals from Wastewater: A Review. Chem. Chem. Technol. 2024, 18, 170–186. [Google Scholar] [CrossRef] [Scilit]
- Yang, Z.; Wan, X.; Chen, Y.; Chen, X.; Wang, Z.; Zhang, C.; Kumar, V.; Varrone, C.; Xiao, X.; Yu, P.; et al. A Review of Lignin-Based Adsorbent Materials: Synthesis and Applications in the Remediation of Heavy Metal/ Antibiotic-Containing Wastewater. J. Environ. Chem. Eng. 2025, 13, 119080. [Google Scholar] [CrossRef] [Scilit]
- Shokrollahi, H. A Review of the Magnetic Properties, Synthesis Methods and Applications of Maghemite. J. Magn. Magn. Mater. 2017, 426, 74–81. [Google Scholar] [CrossRef] [Scilit]
- Kord Mostafapour, F.; Miri, A.; Khatibi, A.; Balarak, D.; Kyzas, G.Z. Survey of Fe3O4 Magnetic Nanoparticles Modified with Sodium Dodecyl Sulfate for Removal P-Cresol and Pyrocatechol from Aqueous Solutions. Biointerface Res. Appl. Chem. 2023, 13, 554. [Google Scholar] [CrossRef] [Scilit]
- Bordun, I.; Szymczykiewicz, E. Synthesis and Electrochemical Properties of Fe3O4/C Nanocomposites for Symmetric Supercapacitors. Appl. Sci. 2024, 14, 677. [Google Scholar] [CrossRef] [Scilit]
- Niculescu, A.-G.; Mihaiescu, B.; Mihaiescu, D.; Hadibarata, T.; Grumezescu, A. An Updated Overview of Magnetic Composites for Water Decontamination. Polymers 2024, 16, 709. [Google Scholar] [CrossRef] [Scilit] [PubMed]
- Ádám, A.A.; Szabados, M.; Varga, G.; Papp, Á.; Musza, K.; Kónya, Z.; Kukovecz, Á.; Sipos, P.; Pálinkó, I. Ultrasound-Assisted Hydrazine Reduction Method for the Preparation of Nickel Nanoparticles, Physicochemical Characterization and Catalytic Application in Suzuki-Miyaura Cross-Coupling Reaction. Nanomaterials 2020, 10, 632. [Google Scholar] [CrossRef] [Scilit] [PubMed]
- Liu, X.; Zhuang, H. Recent Progresses in Photocatalytic Hydrogen Production: Design and Construction of Ni-based Cocatalysts. Int. J. Energy Res. 2021, 45, 1480–1495. [Google Scholar] [CrossRef] [Scilit]
- Lv, B.; Xu, J.; Kang, H.; Liang, P.; Wang, W.; Tao, F. Adsorption Behavior of Magnetic Carbon-Supported Metal Nickel for the Efficient Dye Removal from Water. Int. J. Environ. Res. Public. Health 2022, 19, 1682. [Google Scholar] [CrossRef] [Scilit] [PubMed]
- Bordun, I.; Calus, D.; Szymczykiewicz, E.; Malovanyy, M.; Nahurskyi, N.; Borysiuk, A.; Kulyk, Y. C/Ni/N Nanocomposites Based on Hydrolysis Lignin: Synthesis, Study of Structural and Magnetic Properties. Nanomaterials 2024, 14, 1886. [Google Scholar] [CrossRef] [Scilit] [PubMed]
- Duryagina, Z.A.; Holyaka, R.L.; Borysyuk, A.K. The Automated Wide-Range Magnetometer for the Magnetic Phase Analysis of Alloys: Development and Application. Usp. Fiz. Met. 2013, 14, 33–66. [Google Scholar] [CrossRef] [Scilit]
- Hidayat, E.; Yonemura, S.; Mitoma, Y.; Harada, H. Methylene Blue Removal by Chitosan Cross-Linked Zeolite from Aqueous Solution and Other Ion Effects: Isotherm, Kinetic, and Desorption Studies. Adsorpt. Sci. Technol. 2022, 2022, 1853758. [Google Scholar] [CrossRef] [Scilit]
- Akande, J.A.; Adeogun, A.I.; Uzosike, A.S. Removal of Congo Red Dye from Simulated Wastewater Using Activated Carbon Derived from Corn Cobs; Kinetics and Equilibrium Studies. Glob. J. Pure Appl. Chem. Res. 2023, 11, 1–19. [Google Scholar] [CrossRef] [Scilit]
- Shved, O.; Mudry, S.; Zhak, O.; Shcherba, I. X–Ray Diffraction Studies of Al–Ni–Zr Ternary Alloy. Ann. Univ. Paedagog. Cracoviensis Stud. Tech. 2017, 18, 324–327. Available online: https://rep.up.krakow.pl/xmlui/handle/11716/13011 (accessed on 6 September 2026). [CrossRef] [Scilit]
- Bordun, I.; Pidluzhna, A.; Ivashchyshyn, F.; Borysiuk, A.; Całus, D.; Chwastek, K. Structural and Magnetic Properties of Ni/C Composites Synthesized from Beet Pulp and Corn Stems. Magnetochemistry 2021, 7, 31. [Google Scholar] [CrossRef] [Scilit]
- Thommes, M.; Kaneko, K.; Neimark, A.V.; Olivier, J.P.; Rodriguez-Reinoso, F.; Rouquerol, J.; Sing, K.S.W. Physisorption of Gases, with Special Reference to the Evaluation of Surface Area and Pore Size Distribution (IUPAC Technical Report). Pure Appl. Chem. 2015, 87, 1051–1069. [Google Scholar] [CrossRef] [Scilit]
- Silvestre-Albero, A.M.; Juárez-Galán, J.M.; Silvestre-Albero, J.; Rodríguez-Reinoso, F. Low-Pressure Hysteresis in Adsorption: An Artifact? J. Phys. Chem. C 2012, 116, 16652–16655. [Google Scholar] [CrossRef] [Scilit]
- Rouquérol, F.; Rouquerol, J.; Sing, K.S.W.; Llewellyn, P.L.; Maurin, G. Adsorption by Powders and Porous Solids: Principles, Methodology and Applications, 2nd ed.; Elsevier/AP: Amsterdam, The Netherlands, 2014. [Google Scholar]
- Setnescu, R.; Jipa, S.; Setnescu, T.; Kappel, W.; Kobayashi, S.; Osawa, Z. IR and X-Ray Characterization of the Ferromagnetic Phase of Pyrolysed Polyacrylonitrile. Carbon 1999, 37, 1–6. [Google Scholar] [CrossRef] [Scilit]
- Miao, Q.; Wang, L.; Liu, Z.; Wei, B.; Xu, F.; Fei, W. Magnetic Properties of N-Doped Graphene with High Curie Temperature. Sci. Rep. 2016, 6, 21832. [Google Scholar] [CrossRef] [Scilit] [PubMed]
- Chakraborty, M.; Jensen, G.; Ingram, D.C.; Stinaff, E.; Jadwisienczak, W.M. Magnetic Properties of Nitrogen-Doped Graphene Induced by Dopant Configurations. Nanomaterials 2025, 15, 1694. [Google Scholar] [CrossRef] [Scilit] [PubMed]
- Di, M.; Fu, L.; Zhou, Y.; Pan, H.; Xu, Y.; Du, Y.; Tang, N. Comprehensive Mechanism of Ferromagnetism Enhancement in Nitrogen-Doped Graphene. New J. Phys. 2021, 23, 103003. [Google Scholar] [CrossRef] [Scilit]
- Zhao, M.; Yao, J.; Wu, J.; Liu, H.; Chen, Y.; Tan, W.; Du, H. Ferromagnetic Behavior in Nitrogen-Doped Graphene: Insights into the Underlying Mechanisms. Phys. Lett. A 2025, 557, 130844. [Google Scholar] [CrossRef] [Scilit]
- Ushijima, H.; Murata, K.; Ueda, H.; Kawaguchi, K. Preparation of Amorphouslike Carbons by Pyrolysis of Organic Compounds and Their Magnetic Properties. Mol. Cryst. Liq. Cryst. Sci. Technol. Sect. Mol. Cryst. Liq. Cryst. 1993, 233, 351–360. [Google Scholar] [CrossRef] [Scilit]
- Zhang, Y.; Talapatra, S.; Kar, S.; Vajtai, R.; Nayak, S.K.; Ajayan, P.M. First-Principles Study of Defect-Induced Magnetism in Carbon. Phys. Rev. Lett. 2007, 99, 107201. [Google Scholar] [CrossRef] [Scilit] [PubMed]
- Szymczykiewicz, E.; Bordun, I.; Maksymych, V.; Klapchuk, M.; Kohut, Z.; Borysiuk, A.; Kulyk, Y.; Ivashchyshyn, F. Charge Storage and Magnetic Properties Nitrogen-Containing Nanoporous Bio-Carbon. Energies 2024, 17, 903. [Google Scholar] [CrossRef] [Scilit]
- He, X.; Zhong, W.; Au, C.-T.; Du, Y. Size Dependence of the Magnetic Properties of Ni Nanoparticles Prepared by Thermal Decomposition Method. Nanoscale Res. Lett. 2013, 8, 446. [Google Scholar] [CrossRef] [Scilit] [PubMed]
- Krishnan, K.M.; Pakhomov, A.B.; Bao, Y.; Blomqvist, P.; Chun, Y.; Gonzales, M.; Griffin, K.; Ji, X.; Roberts, B.K. Nanomagnetism and Spin Electronics: Materials, Microstructure and Novel Properties. J. Mater. Sci. 2006, 41, 793–815. [Google Scholar] [CrossRef] [Scilit]
- Ahmad Aftab, R.; Zaidi, S.; Aslam Parwaz Khan, A.; Arish Usman, M.; Khan, A.Y.; Tariq Saeed Chani, M.; Asiri, A.M. Removal of Congo Red from Water by Adsorption onto Activated Carbon Derived from Waste Black Cardamom Peels and Machine Learning Modeling. Alex. Eng. J. 2023, 71, 355–369. [Google Scholar] [CrossRef] [Scilit]
- Giles, C.H.; MacEwan, T.H.; Nakhwa, S.N.; Smith, D. 786. Studies in Adsorption. Part XI. A System of Classification of Solution Adsorption Isotherms, and Its Use in Diagnosis of Adsorption Mechanisms and in Measurement of Specific Surface Areas of Solids. J. Chem. Soc. Resumed 1960, 163, 3973–3993. [Google Scholar] [CrossRef] [Scilit]
- Yao, Y.; Xu, F.; Chen, M.; Xu, Z.; Zhu, Z. Adsorption Behavior of Methylene Blue on Carbon Nanotubes. Bioresour. Technol. 2010, 101, 3040–3046. [Google Scholar] [CrossRef] [Scilit] [PubMed]
- Staroń, P.; Chwastowski, J. Yeast-Based Magnetic Biocomposite for Efficient Sorption of Organic Pollutants. Appl. Sci. 2024, 14, 655. [Google Scholar] [CrossRef] [Scilit]
- Dapson, R.W. Amyloid from a Histochemical Perspective. A Review of the Structure, Properties and Types of Amyloid, and a Proposed Staining Mechanism for Congo Red Staining. Biotech. Histochem. 2018, 93, 543–556. [Google Scholar] [CrossRef] [Scilit] [PubMed]
- Chen, H.; Wageh, S.; Al-Ghamdi, A.A.; Wang, H.; Yu, J.; Jiang, C. Hierarchical C/NiO-ZnO Nanocomposite Fibers with Enhanced Adsorption Capacity for Congo Red. J. Colloid Interface Sci. 2019, 537, 736–745. [Google Scholar] [CrossRef] [Scilit] [PubMed]
- Zhang, X.; Yang, X.; Xie, F.; Chen, X.; Zhang, Y.; Zhang, Q. Magnetic Biochar Prepared with Rosa Roxburghii Residue as Adsorbents for Congo Red Removal. Materials 2025, 18, 1306. [Google Scholar] [CrossRef] [Scilit] [PubMed]
- Firmino, H.; Nascimento, E.; Costa, K.; Arzuza, L.; Araujo, R.; Sousa, B.; Neves, G.; Morales, M.; Menezes, R. High-Efficiency Adsorption Removal of Congo Red Dye from Water Using Magnetic NiFe2O4 Nanofibers: An Efficient Adsorbent. Materials 2025, 18, 754. [Google Scholar] [CrossRef] [Scilit] [PubMed]
- Zhu, H.-Y.; Fu, Y.-Q.; Jiang, R.; Jiang, J.-H.; Xiao, L.; Zeng, G.-M.; Zhao, S.-L.; Wang, Y. Adsorption Removal of Congo Red onto Magnetic Cellulose/Fe3O4/Activated Carbon Composite: Equilibrium, Kinetic and Thermodynamic Studies. Chem. Eng. J. 2011, 173, 494–502. [Google Scholar] [CrossRef] [Scilit]
- Stijepović, I.; Milanović, M.; Novaković, M. Cubic Structured Core/Shell NiFe2O4@ZnFe2O4 Nanocomposite: Structural, Morphological and Magnetic Properties. Ceram. Int. 2024, 50, 31326–31334. [Google Scholar] [CrossRef] [Scilit]
- Leichtweis, J.; Carissimi, E.; Hagemann, U.; Ulbricht, M.; Fischer, L. NiFe2O4/Biochar Decorated Porous Polymer Membranes for the Flow-through Photo-Fenton Degradation of Tetracycline. Chem. Eng. J. 2023, 477, 147203. [Google Scholar] [CrossRef] [Scilit]
- Yang, Q.; Cui, P.; Liu, C.; Fang, G.; Huang, M.; Wang, Q.; Zhou, Y.; Hou, H.; Wang, Y. In Situ Stabilization of the Adsorbed Co2+ and Ni2+ in Rice Straw Biochar Based on LDH and Its Reutilization in the Activation of Peroxymonosulfate. J. Hazard. Mater. 2021, 416, 126215. [Google Scholar] [CrossRef] [Scilit] [PubMed]

Disclaimer/Publisher’s Note: The statements, opinions and data contained in all publications are solely those of the individual author(s) and contributor(s) and not of MDPI and/or the editor(s). MDPI and/or the editor(s) disclaim responsibility for any injury to people or property resulting from any ideas, methods, instructions or products referred to in the content. |
© 2026 by the authors. Licensee MDPI, Basel, Switzerland. This article is an open access article distributed under the terms and conditions of the Creative Commons Attribution (CC BY) license.