


Abstract
Precast concrete frame joints in coastal atmospheric environments are susceptible to mechanical performance degradation caused by chloride-induced corrosion, yet joint-scale numerical studies incorporating multi-indicator time-dependent mechanical responses remain limited. This paper presents a coupled framework that integrates chloride diffusion, corrosion, and finite-element analysis for a typical precast beam–column joint to evaluate the relative changes in seismic performance indicators across service ages of 0, 15, 30, 40, and 50 years. The numerical model was baseline-validated against uncorroded and corroded test specimens under cyclic loading. Time-dependent models accounting for chloride diffusion, rebar corrosion, and material strength degradation were implemented. The elastic modulus reduction was restricted to the damaged covering concrete rather than the intact internal concrete. The simulation results show that mechanical degradation is limited in the early service stage, whereas hysteretic pinching and deformation-related deterioration become more pronounced with increasing service age. By 50 a, the peak load-bearing capacity has decreased by 13.68%, whereas the ultimate displacement and ductility coefficients have declined by 15.10% and 37.40%, respectively. These results should be interpreted as case-specific predictions under the adopted cover thickness, chloride exposure condition, and material parameters rather than as universal deterioration thresholds. The findings indicate that service-life evaluations of precast joints in coastal atmospheric environments should not rely solely on strength indicators but should also incorporate stiffness, ductility, and energy dissipation capacity.
1. Introduction
Precast concrete structures have been widely applied in coastal buildings and infrastructure due to their high construction efficiency, good quality-control conditions, and minimal on-site wet operations. However, compared to monolithic cast-in-place structures, precast structures often form more complex material heterogeneous zones and force transmission paths at joints, postcast strips, and the interfaces between new and old concrete, making them more susceptible to the combined effects of chloride ion corrosion and durability deterioration in coastal atmospheric environments [1]. For these types of structures, discussing corrosion degradation solely from the perspective of general reinforced concrete components while ignoring the structural characteristics and mechanical features of the joint connection zones often makes it difficult to accurately grasp the evolution of seismic performance during their service life. Therefore, as key parts of precast frames where force transmission modes are concentrated and interface damage tends to aggregation, the evolution of joint performance during the service life possesses independent analytical value.
Existing studies have shown that the interface between new and old concrete is typically a weak link for chloride ion transport and durability degradation. Xia et al. [2] pointed out, through microscopic observation and numerical analysis, that the interface region between new and old concrete has higher porosity and more complex moisture transport channels, meaning chloride ions not only diffuse deeper along the interface more easily but also invade both sides of the interface simultaneously. Additionally, because the surface of precast components has already hardened, cast-in-place concrete is disturbed by the wall effect during pouring and cannot be packed tightly; furthermore, moisture in the new concrete tends to migrate toward the dry old concrete, leading to a local increase in the water–cement ratio at the interface and the formation of a porous, loose microstructure, which makes the chloride diffusion rate at the interface significantly higher than that in monolithic cast-in-place concrete [3,4]. Further research has also indicated that under the action of chloride corrosion, damage evolution in the interface zone of new and old concrete is significantly faster than in the matrices on either side, making it a critical weak region for the durability degradation of precast structures [5]. Therefore, the transport and damage evolution in the interface zone is not only a durability issue but also a prerequisite for the subsequent analysis of joint seismic performance degradation.
At the level of joints and their connection zones, existing research has begun to focus on the impact of corrosion on the seismic performance of precast beam–column joints. Yang et al. [6] conducted cyclic loading tests on SCOPE beam–column joints with varying key slot lengths and corrosion levels, and discovered that reinforcement corrosion significantly weakens the energy dissipation capacity and may induce fragile failures in the interfaces and lap zones; Yang et al. [7] further combined experimentation with numerical simulation to analyze the hysteretic performance degradation of precast prestressed concrete frame beam–column joints under specified corrosion rates. Simultaneously, experiments by Moka and Chidambaram [8] demonstrated that shear keys, reinforcement connection sleeves, and the treatment of new-to-old concrete interfaces in wet-connected joints significantly influence crack distribution, stiffness retention, and energy dissipation performance; while Wang et al. [9] pointed out that, in chloride environments, the bond strength between concrete can undergo substantial attenuation as the service age increases. The aforementioned studies suggest that the degradation of precast joints in corrosive environments stems not only from the decline in material strength but also from changes in the force transmission mechanism driven by the synergy of interfaces, sleeves, and connection details. However, it is also evident that the current research is largely based on specified corrosion levels or discrete operating conditions, with limited discussion on the continuous degradation patterns of joints as the service age progresses.
At present, existing research is primarily distributed across two levels: one category focuses on experimental or discrete numerical cases under specific corrosion rates to reveal the mechanical performance of different connection types; the other discusses service-life performance, fragility, and reliability at the frame level in chloride environments [10]. In contrast, for typical precast concrete frame joints in coastal atmospheric environments, there is still a lack of joint-scale service-life analysis that couples chloride diffusion, reinforcement corrosion development, time-dependent material degradation, and hysteretic performance evolution under low-cycle reversed loading. In other words, existing research has not sufficiently clarified how the mechanical performance of typical coastal precast frame joints evolves with service age, which seismic performance indicators exhibit larger relative degradation, and at which service stages deterioration becomes more evident under a given exposure scenario.
Compared with existing experimental studies focused on discrete corrosion rates or lifetime assessments at the frame level, this paper constructs a joint-scale numerical analysis framework that couples chloride diffusion, reinforcement corrosion, degradation of concrete mechanical properties, and hysteretic response. Specifically, this study aims to: (a) evaluate the time-dependent mechanical response of a typical coastal precast joint across 50 years of service life; (b) compare the relative degradation of strength, stiffness, ductility, and energy dissipation indicators caused by corrosion accumulation; and (c) highlight that relying solely on the peak load-bearing capacity may underestimate the risk of seismic performance deterioration in later service stages.
This study aims to develop a coupled chloride diffusion, corrosion, and finite-element framework for predicting the time-dependent seismic performance degradation of precast concrete beam–column joints in coastal atmospheric environments.
2. Numerical Models for Chloride Corrosion in Coastal Atmospheric Environments
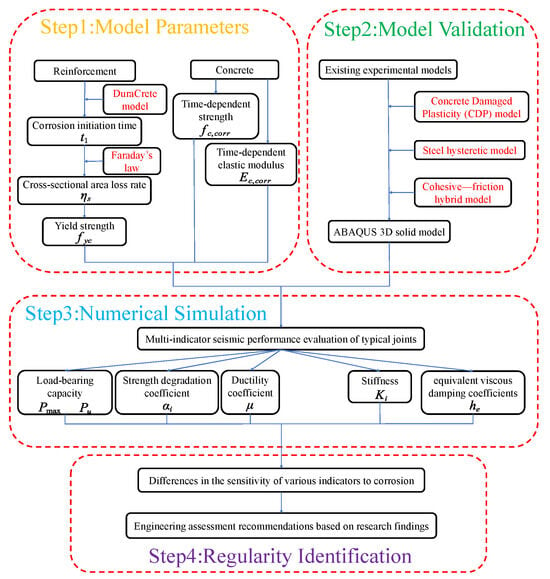
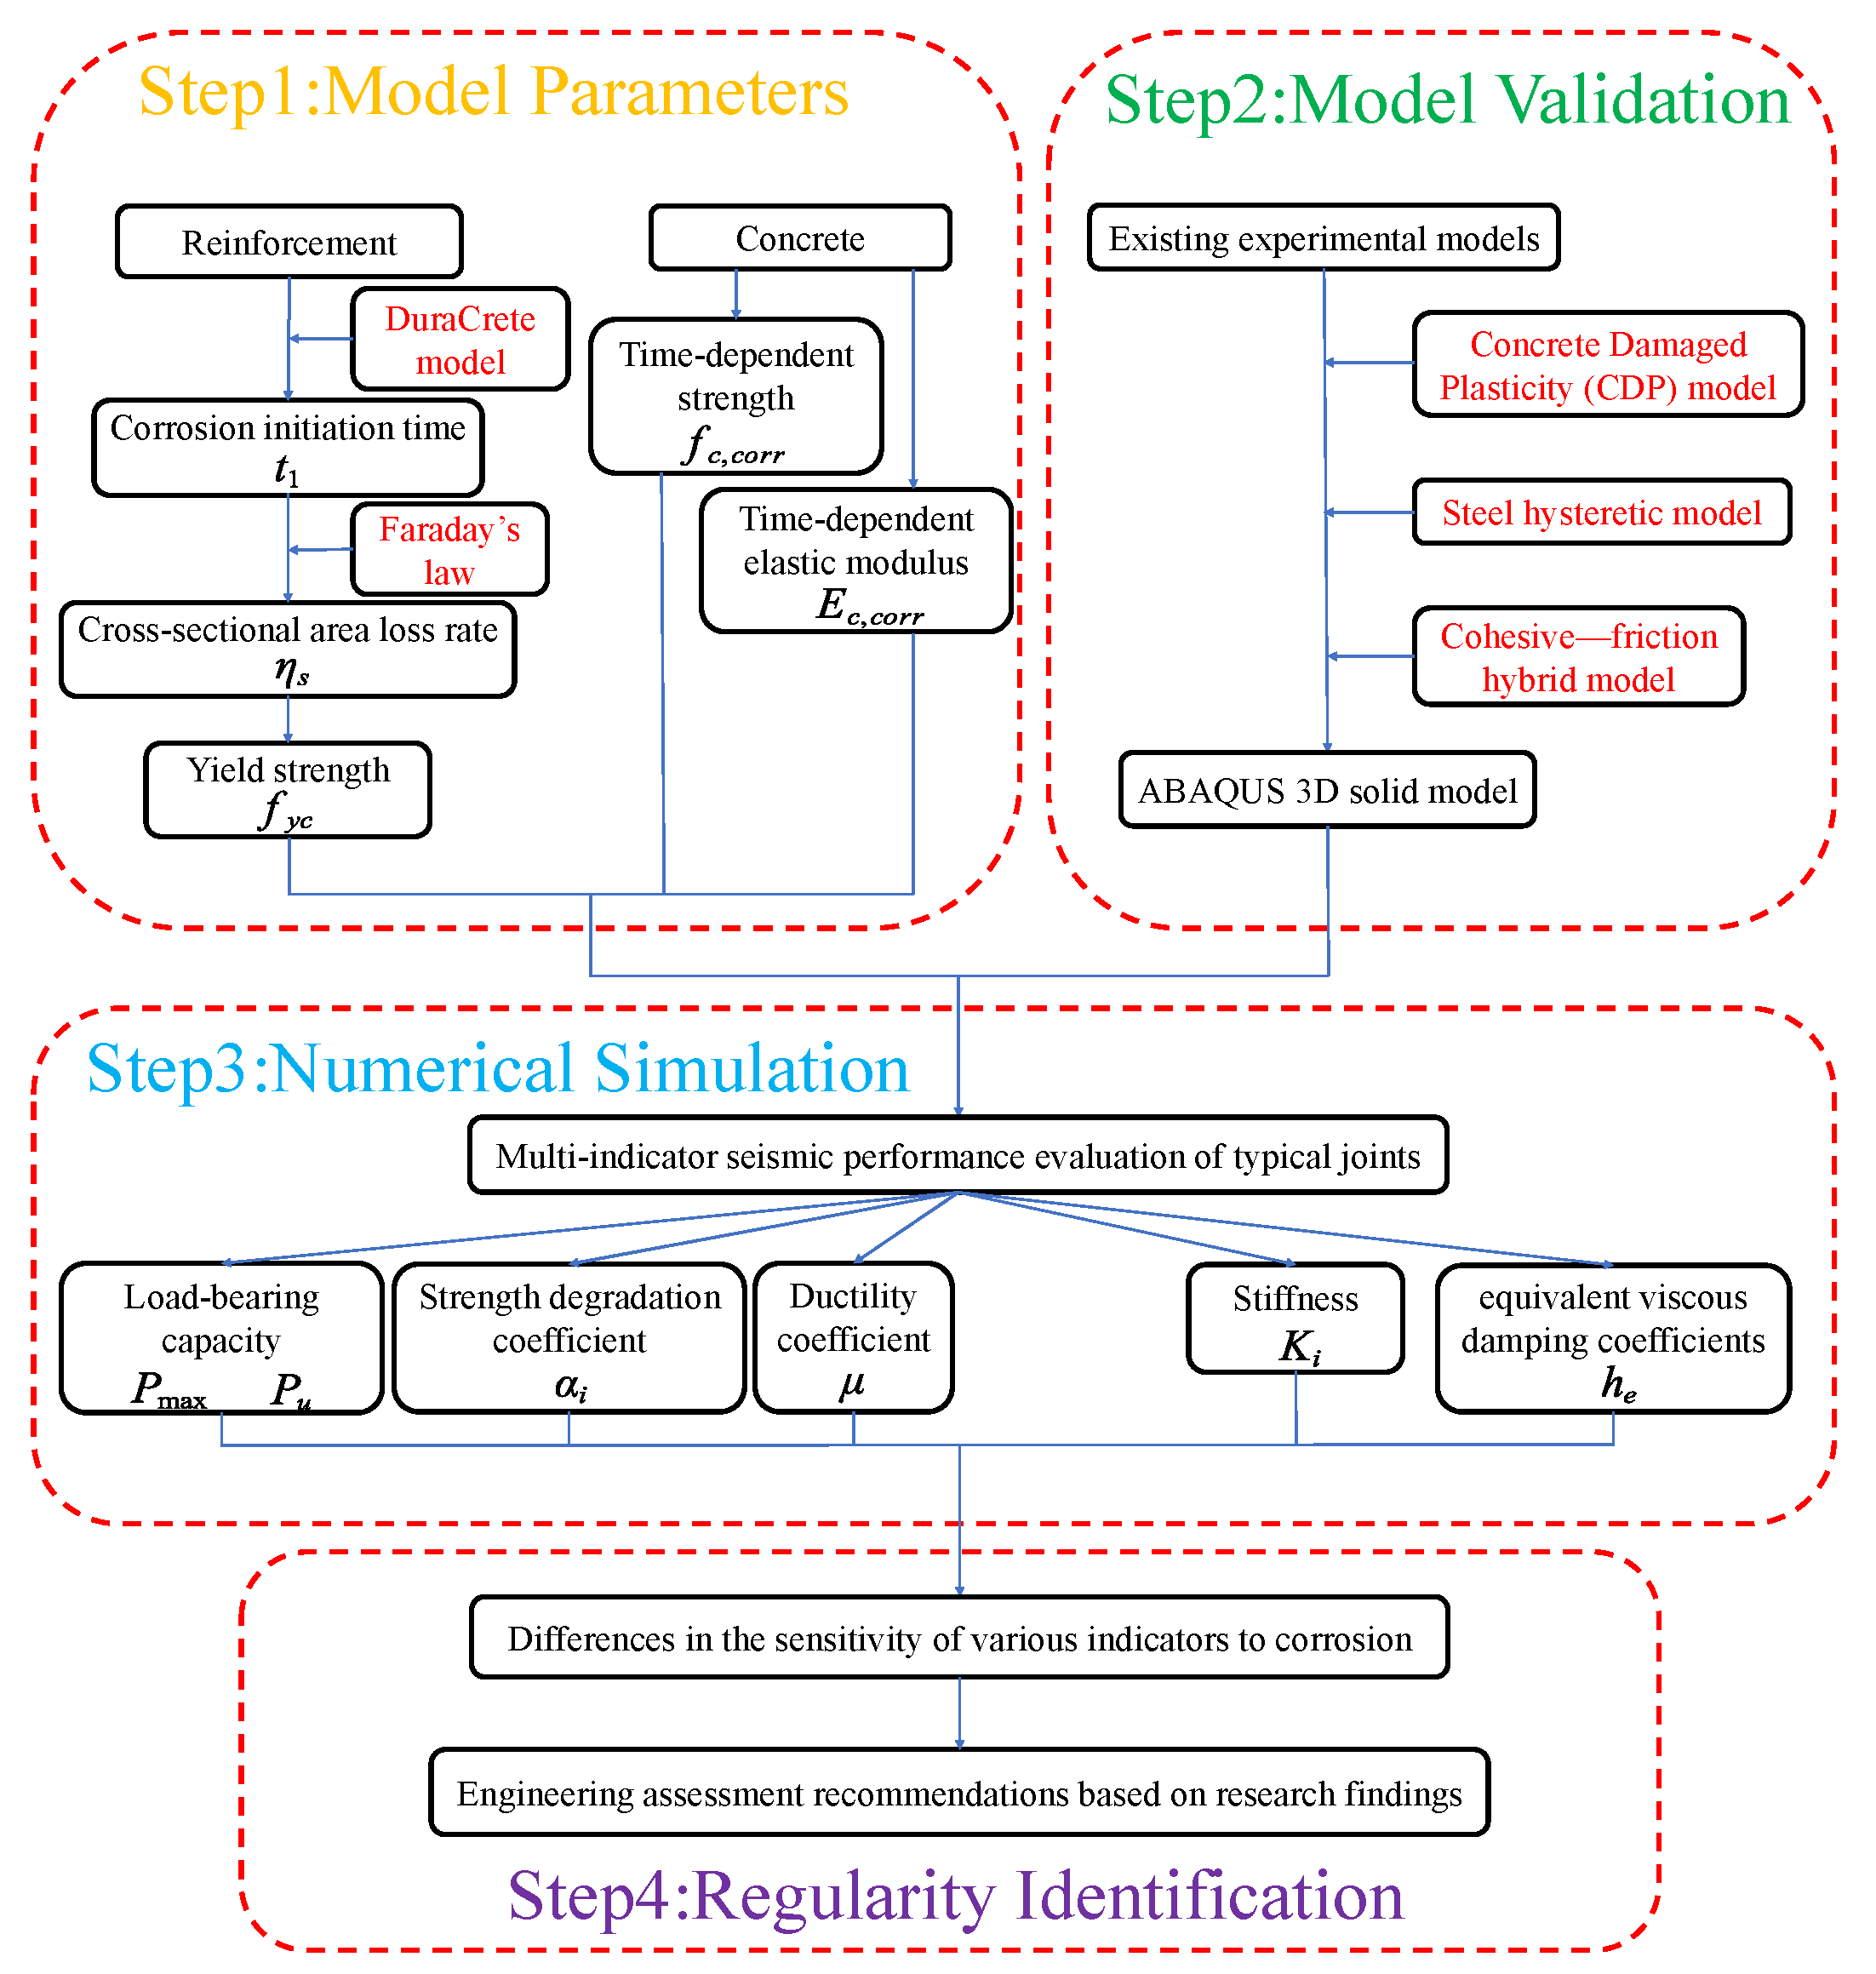
To more intuitively demonstrate the overall research logic of this study—from the modeling of chloride ion corrosion and material degradation under coastal atmospheric conditions to the finite-element analysis of joints and the extraction of seismic performance indicators—the comprehensive analytical framework is presented in Figure 1. Based on this framework, models for chloride ion diffusion, the development of reinforcement corrosion, and the time-dependent degradation of steel and concrete material parameters will be established; subsequently, the seismic performance of typical precast frame joints at different service ages will be analyzed.
Figure 1.
Overall analytical framework.
2.1. Diffusion of Chloride Ions and Occurrence of Corrosion
The process of chloride-induced corrosion in concrete structures is generally divided into three stages [11]: the stage where chloride ions diffuse through the concrete cover to the reinforcement surface until the initiation of corrosion; the stage starting from the onset of reinforcement corrosion to the initial cracking of the concrete cover; and the post-cracking stage of the concrete cover.
To determine the corrosion initiation time of reinforcement in chloride environments, DuraCrete [12] has proposed the following empirical model based on extensive measured data:
In the formula, is the thickness of the concrete cover; is the empirical chloride diffusion coefficient, which is determined by Equation (2) in the absence of measured data [13]; is the critical chloride ion concentration for reinforcement corrosion, taken as 2.10 kg/m3 in this study [13]; is the chloride concentration on the concrete surface, with values shown in Table 1 [13], and 2.57 kg/m3 is adopted here; and denotes the inverse error function.
Table 1.
Chloride concentration on the concrete surface.
In the formula, is the water–cement ratio of the concrete; and is the annual average environmental temperature, taken as 24.4 °C in this study.
As chloride ions continue to diffuse, the electrical resistivity of the concrete decreases; once the chloride concentration reaches the critical threshold, the alkaline passive film on the reinforcement surface is destroyed, and an electrochemical reaction occurs between the iron and oxygen dissolved in the water, generating a corrosion current. Once corrosion initiates, the corrosion current density becomes the critical factor influencing the corrosion propagation stage [14]. Through research on the corrosion rate of reinforcement in chloride-contaminated concrete and considering the influence of the local environment, Luo et al. [15] proposed a calculation model for the corrosion current of reinforcement in infiltrative chloride environments as follows:
In the formula, is the local environment coefficient, generally taken as 4.0–4.5 in hot and humid southern regions, and 4.5 is used in this study; is the temperature of the reinforcement surface, which can be taken as the environmental temperature; represents the chloride concentration at the reinforcement surface at the onset of corrosion, typically determined by researchers using the one-dimensional Fick’s second law [16], as shown in Equation (4); and denotes the electrical resistivity of the concrete, which is calculated according to Equation (5) [15].
In the formula, represents the chloride concentration at depth from the concrete surface at time ; is a coefficient taken as 5.6 for concrete strength grades C20–C30 and 11.1 for C40–C50; is the average chloride concentration within the concrete cover at the onset of reinforcement corrosion; and is the environmental relative humidity, taken as 85% based on meteorological survey data.
It should be noted that both Equations (1) and (4) are based on the empirical assumption of one-dimensional chloride transport, used to estimate the corrosion initiation time and the evolution of chloride concentration in the direction of the concrete cover. This approach does not explicitly distinguish two-dimensional or three-dimensional preferential transport channels at the new-to-old concrete interface, construction joints, or cracks; therefore, the corrosion age parameters obtained in this study should be understood as equivalent inputs under given environmental and cover conditions rather than point-by-point predictions of the actual internal chloride field of the joint.
According to Faraday’s law, the corrosion current density can be converted into the corrosion rate of the reinforcement [17]. To facilitate coupling with the finite-element analysis of the joint, the corrosion current density is converted into an equivalent average corrosion rate during the service stage, and it is further assumed that the reinforcement undergoes uniform circumferential corrosion. This assumption is suitable for comparing the relative changes in material parameters under different service age conditions, but it cannot reflect the localized pitting common in chloride environments or the full process of corrosion current fluctuations over time. Based on this theory, the model for the change in diameter of reinforcement undergoing uniform corrosion over time is given by [18]:
In subsequent calculations, the cross-sectional loss of the reinforcement is taken as zero when the service time is less than the corrosion initiation time; once the service time exceeds the initiation time, the corrosion depth is accumulated based on the corrosion propagation duration rather than the total service life.
2.2. Time-Dependent Mechanical Property Models of Corroded Reinforcement
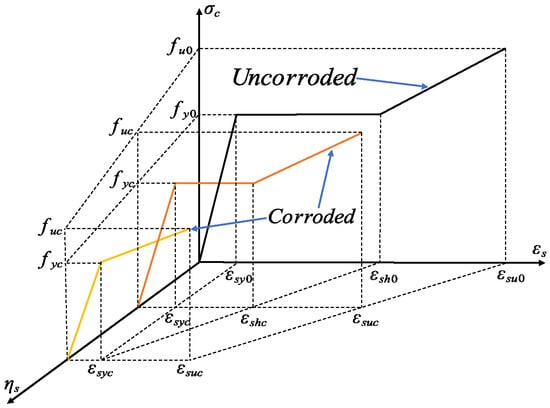
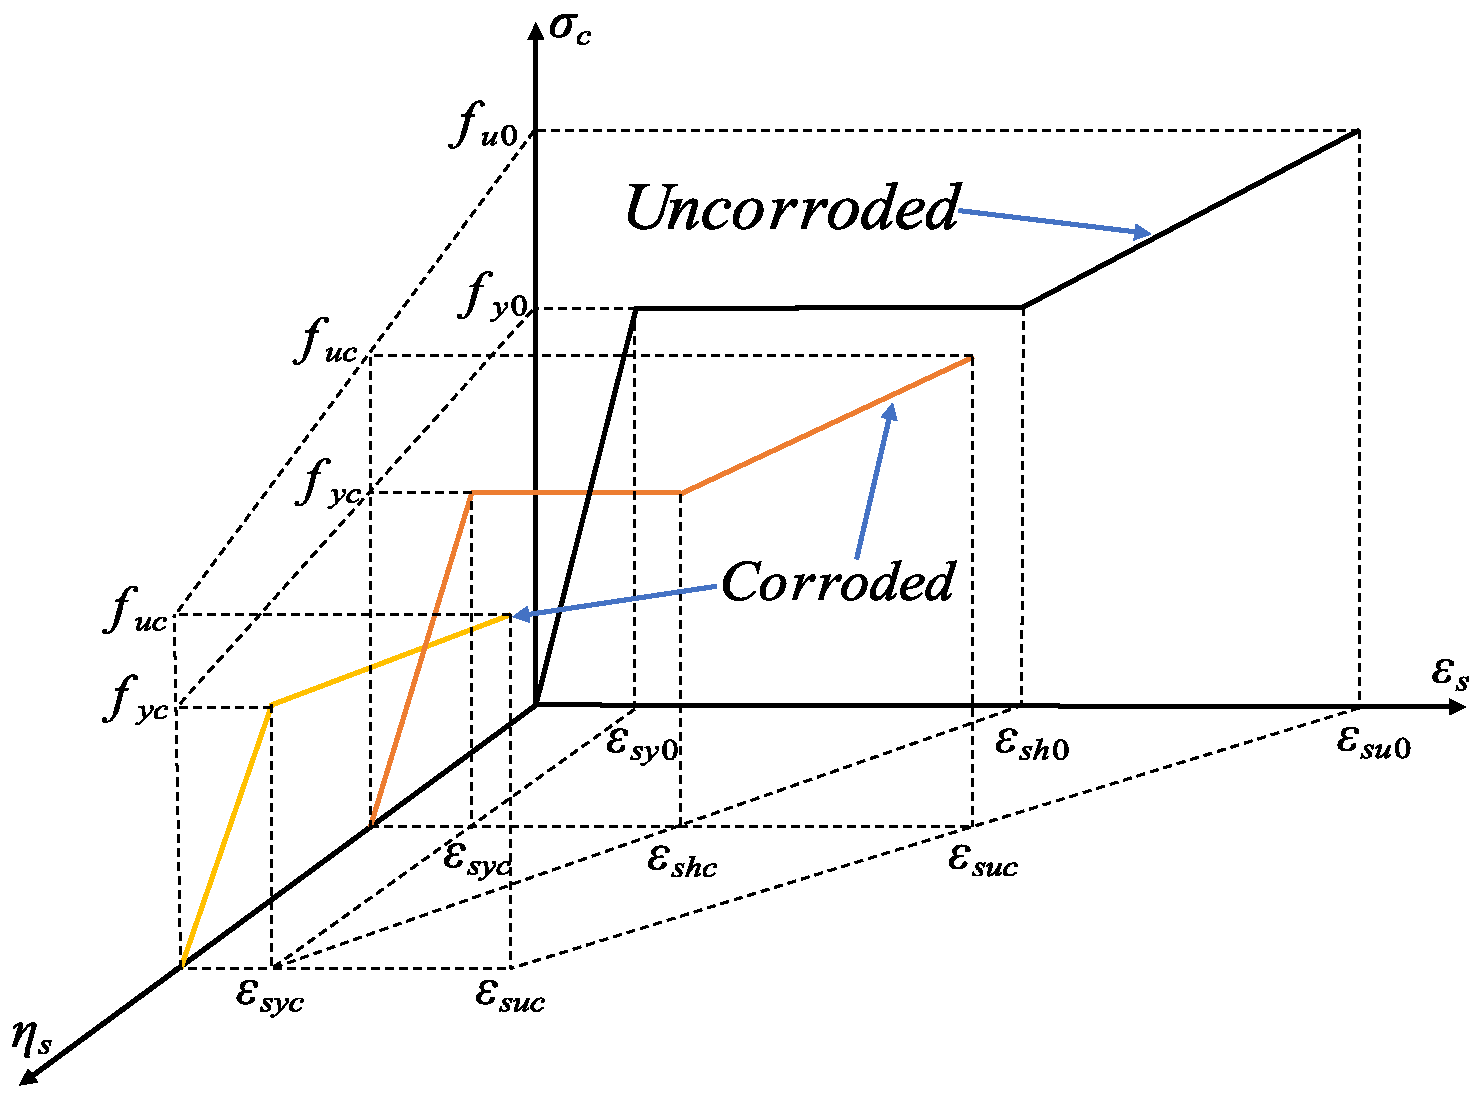
Numerous tensile tests on corroded reinforcement have demonstrated that with increasing corrosion levels, the yield strength, ultimate strength, and ultimate strain of the steel bars all decrease, while the yield plateau shortens or even disappears [19]. Therefore, investigating the stress–strain relationship of reinforcement under corrosion is of both theoretical and practical significance. Based on tensile test results, Zhang et al. [20] proposed a stress–strain relationship model for corroded reinforcement, as shown in Figure 2.
Figure 2.
Stress–strain relationship of corroded reinforcement.
The mathematical expression of this model is as follows:
In the formula, and are the stress and strain of the corroded reinforcement, respectively; and are the yield strength and ultimate strength of the corroded reinforcement, respectively; and are the hardening strain and ultimate strain of the corroded reinforcement, respectively; and and are the elastic modulus and hardening modulus of the corroded reinforcement, respectively.
According to this relationship model, as corrosion develops, both the yield strength and ultimate strength of the reinforcement degrade in an approximately linear manner, as shown in the following equations:
In the formulas, and represent the nominal yield strength and nominal ultimate strength of the corroded reinforcement, respectively, and their mathematical expressions are:
In the formulas, and denote the influence coefficients of the reinforcement cross-sectional corrosion rate on the relative values of the nominal yield strength and nominal ultimate strength, respectively [21], which are taken as 1.093 and 1.119 in this paper; and is the mass loss rate of the corroded reinforcement. Since this study assumes uniform corrosion along the diameter of the reinforcement cross-section, the mass loss rate based on uniform cross-sectional corrosion is expressed as:
In their actual research, Zhang et al. [20] assumed that the elastic modulus of corroded reinforcement remained identical to that of uncorroded reinforcement. Based on these findings and to simplify the analysis, this study will not consider changes in the elastic modulus of reinforcement caused by corrosion.
2.3. Time-Dependent Models for Concrete Strength and Elastic Modulus
Reinforcement corrosion caused by chloride ion corrosion generates corrosion products around the bars, which fill the gaps between the concrete and the reinforcement. As corrosion products increase, the concrete gradually expands and the internal porosity continuously enlarges, allowing chloride ions to penetrate the concrete more easily and exacerbate reinforcement corrosion; meanwhile, corrosion expansion generates tensile stresses within the concrete, ultimately leading to the cracking and spalling of the concrete cover [22]. Therefore, although chloride ions do not directly undergo destructive chemical reactions with the primary hydration products in concrete, their indirect hazards still need to be considered.
Considering that the expansion’s compressive stress, generated by reinforcement corrosion, leads to longitudinal cracking of the covering concrete, this study adopts an equivalent method based on Coronelli and Gambarova [23], where the residual compressive strength of damaged concrete cover can be reduced according to the following relationship:
In the formula, denotes the initial compressive strength of the concrete cover; and is the reduction coefficient of the concrete cover, which can be expressed as:
In the formula, is the softening coefficient, taken as 0.1; is the peak compressive strain of the concrete; and is the average lateral tensile strain generated by corrosion, which can be expressed as:
In the formula, is the number of side-by-side reinforcement bars in the compression zone; is the initial width of the section; and is the total crack width caused by the corrosion of a single reinforcement bar, which can be expressed by the following formula [24]:
In the formula, is the volume ratio of corrosion products to the original reinforcement, commonly taken as 2.0; and is the equivalent corrosion depth, which can be calculated by the following formula [25]:
In summary, the time-dependent model of the elastic modulus for concrete material under chloride ion corrosion can be expressed as:
Theoretically, although concrete material does not directly react chemically with chloride ions, its integrity will still be gradually destroyed due to the intensified expansion of internal reinforcement corrosion, indirectly leading to a continuous decrease in its elastic modulus. However, in the absence of relevant experimental data in the present study, the reduction in the elastic modulus is evaluated using the formula relating the concrete elastic modulus to its strength specified in the code for design of concrete structures [26], as follows:
where denotes the measured cube compressive strength of concrete, which can be substituted into the aforementioned strength reduction formula, as expressed below:
It should be noted that the aforementioned reductions in concrete strength and elastic modulus do not account for the internal concrete confined by stirrups. As stirrup corrosion progresses, both its effective cross-sectional area and mechanical properties decline, thereby weakening the confinement effect and subsequently degrading the overall mechanical properties of the internal concrete.
The expansion of corroded reinforcement generates outward radial tensile stresses that crack and loosen the weaker outer cover of concrete. In contrast, the internal concrete remains confined by both the longitudinal reinforcement and stirrups; theoretically, it is free from expansion cracking and instead subjected to a slight passive confinement state. Given that its microstructural skeleton suffers negligible damage, the elastic modulus of the internal concrete can be reasonably assumed to remain at its initial value.
On this basis, the compressive strength of the confined internal concrete is evaluated by incorporating the effective reinforcement ratio and yield strength of the corroded stirrups. According to the Kent–Scott–Park model [27], the time-dependent compressive strength of the confined concrete is explicitly governed by the coefficient , which is formulated as follows:
where represents the ratio of stirrups; and represents the yield strength of stirrups. Similar to the degradation coefficient mentioned earlier, also changes significantly with the aggravation of chloride corrosion. Therefore, the time-dependent formula for the compressive strength of the confined internal concrete can be expressed as:
where and denote the ratio and yield strength of stirrups after chloride-induced corrosion, respectively.
Based on the aforementioned time-dependent models of reinforcement corrosion and concrete material parameters in a coastal atmospheric environment, this study further introduces relevant degradation parameters into the finite-element model of typical precast frame joints to analyze the evolution laws of the mechanical performance of joints under low-cycle reversed loading during their service life.
3. Establishment and Validation of the Joint Finite-Element Model
3.1. Validation of the Finite-Element Modeling Method
Regarding the mechanical performance analysis of precast frame joints in chloride environments, experimental methods can intuitively reflect the mechanical characteristics and failure processes of components under cyclic loading; however, corrosion evolution tests in long-term service environments involve long cycles and high costs, and it is difficult to systematically cover different service-age scenarios within a single study. Therefore, this study utilizes ABAQUS to establish a finite-element model of a typical precast beam–column joint and validates the rationality of the model based on experimental results, serving as the numerical foundation for subsequent life-cycle analysis.
To verify the validity of the model, the results from the cyclic loading test of the precast frame beam–column joint PBCJ-2, conducted by Liu et al. [28] at the Beijing University of Technology, were selected for comparative simulation. In the model, the precast concrete, cast-in-place concrete, grout sleeves, and internal grout were modeled using C3D8R solid elements, while the longitudinal reinforcement and stirrups of the beams and columns were modeled using T3D2 truss elements, with the reinforcement embedded to account for its collaborative interaction with the concrete. Boundary conditions were set according to the stress state of the original experiment. It should be noted that because the precise loading history of the original experiment was difficult to obtain in full, the loading method consistent with the experimental description was adopted in the finite-element analysis, though some approximations exist in the displacement amplitudes at each level. Consequently, the focus of this section’s validation was to examine the model’s capability to reproduce the hysteretic response, skeleton curve evolution, and primary failure characteristics of the joint, instead of the point-by-point fitting of individual experimental data. Furthermore, to validate the applicability of the finite-element model under chloride attack, the severely corroded specimen P-0.3-17.14, selected from the seismic performance tests on corroded precast concrete beam–column joints conducted by Zhao et al. [29] at Dalian University of Technology, was utilized for comparison. The experimental hysteretic curve of the joint was compared with that simulated using ABAQUS. The boundary conditions and loading protocols were set in strict accordance with the original experimental setup, which are omitted here for brevity.
3.1.1. Concrete Constitutive Model
In the finite-element model established in this study, both the concrete and the internal grout utilize the concrete damaged plasticity model (CDP model), which is a widely recognized and utilized constitutive model in finite-element analysis [30]; it effectively characterizes the processes of concrete cracking, crushing, and damage accumulation under cyclic loading, making it suitable for the joint hysteretic analysis in this paper. The CDP plastic parameters used in ABAQUS were set as follows: dilatancy angle (), eccentricity (), bipolar stress ratio (), second stress invariant ratio (), and viscosity parameter (). The specific numerical values are given in Table 2.
Table 2.
Parameters of the concrete damaged plasticity (CDP) model.
The concrete stress–strain curve used in this study adopts the uniaxial stress–strain relationship specified in the code for design of concrete structures [26]. Simultaneously, based on the concrete stress–strain relationship provided by the code, the concept of a damage factor is introduced; this study employs the Sidiroff energy equivalence principle [31] to calculate the damage factor as follows:
In the formula, is the true stress; is the initial elastic modulus; and is the true strain. The stress and strain values input into the ABAQUS finite-element software must all be true values.
3.1.2. Steel Reinforcement Constitutive Model
For simulating reinforcement trusses in concrete structures, currently used reinforcement constitutive models are mostly bi-linear or tri-linear models; although such models are simple to calculate, under complex loading states, the models assume the structural stiffness remains consistent with the initial elastic stiffness regardless of the magnitude of plastic deformation experienced when the load is reversed or reloaded, which is physically unrealistic. Furthermore, for the hysteretic analysis of reinforced concrete structures, it is necessary to consider the results of their collaborative interactions under complex loading conditions, which are influenced by the shear deformation occurring after concrete cracking and the bond–slip between reinforcement and concrete. Therefore, how to describe the real physical phenomena occurring in components under complex loading in finite-element analysis is one of the main difficulties in numerical simulation.
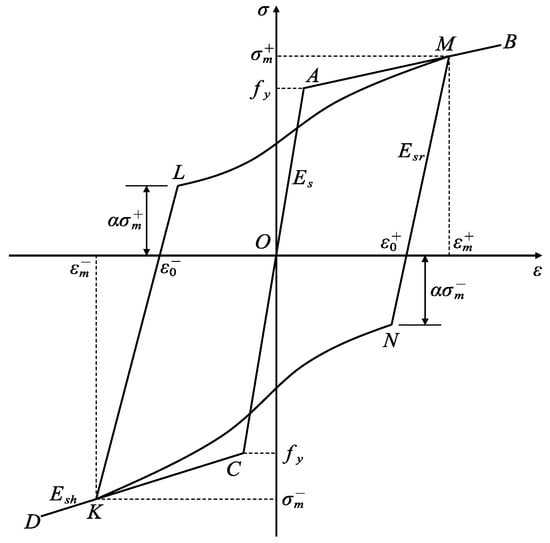
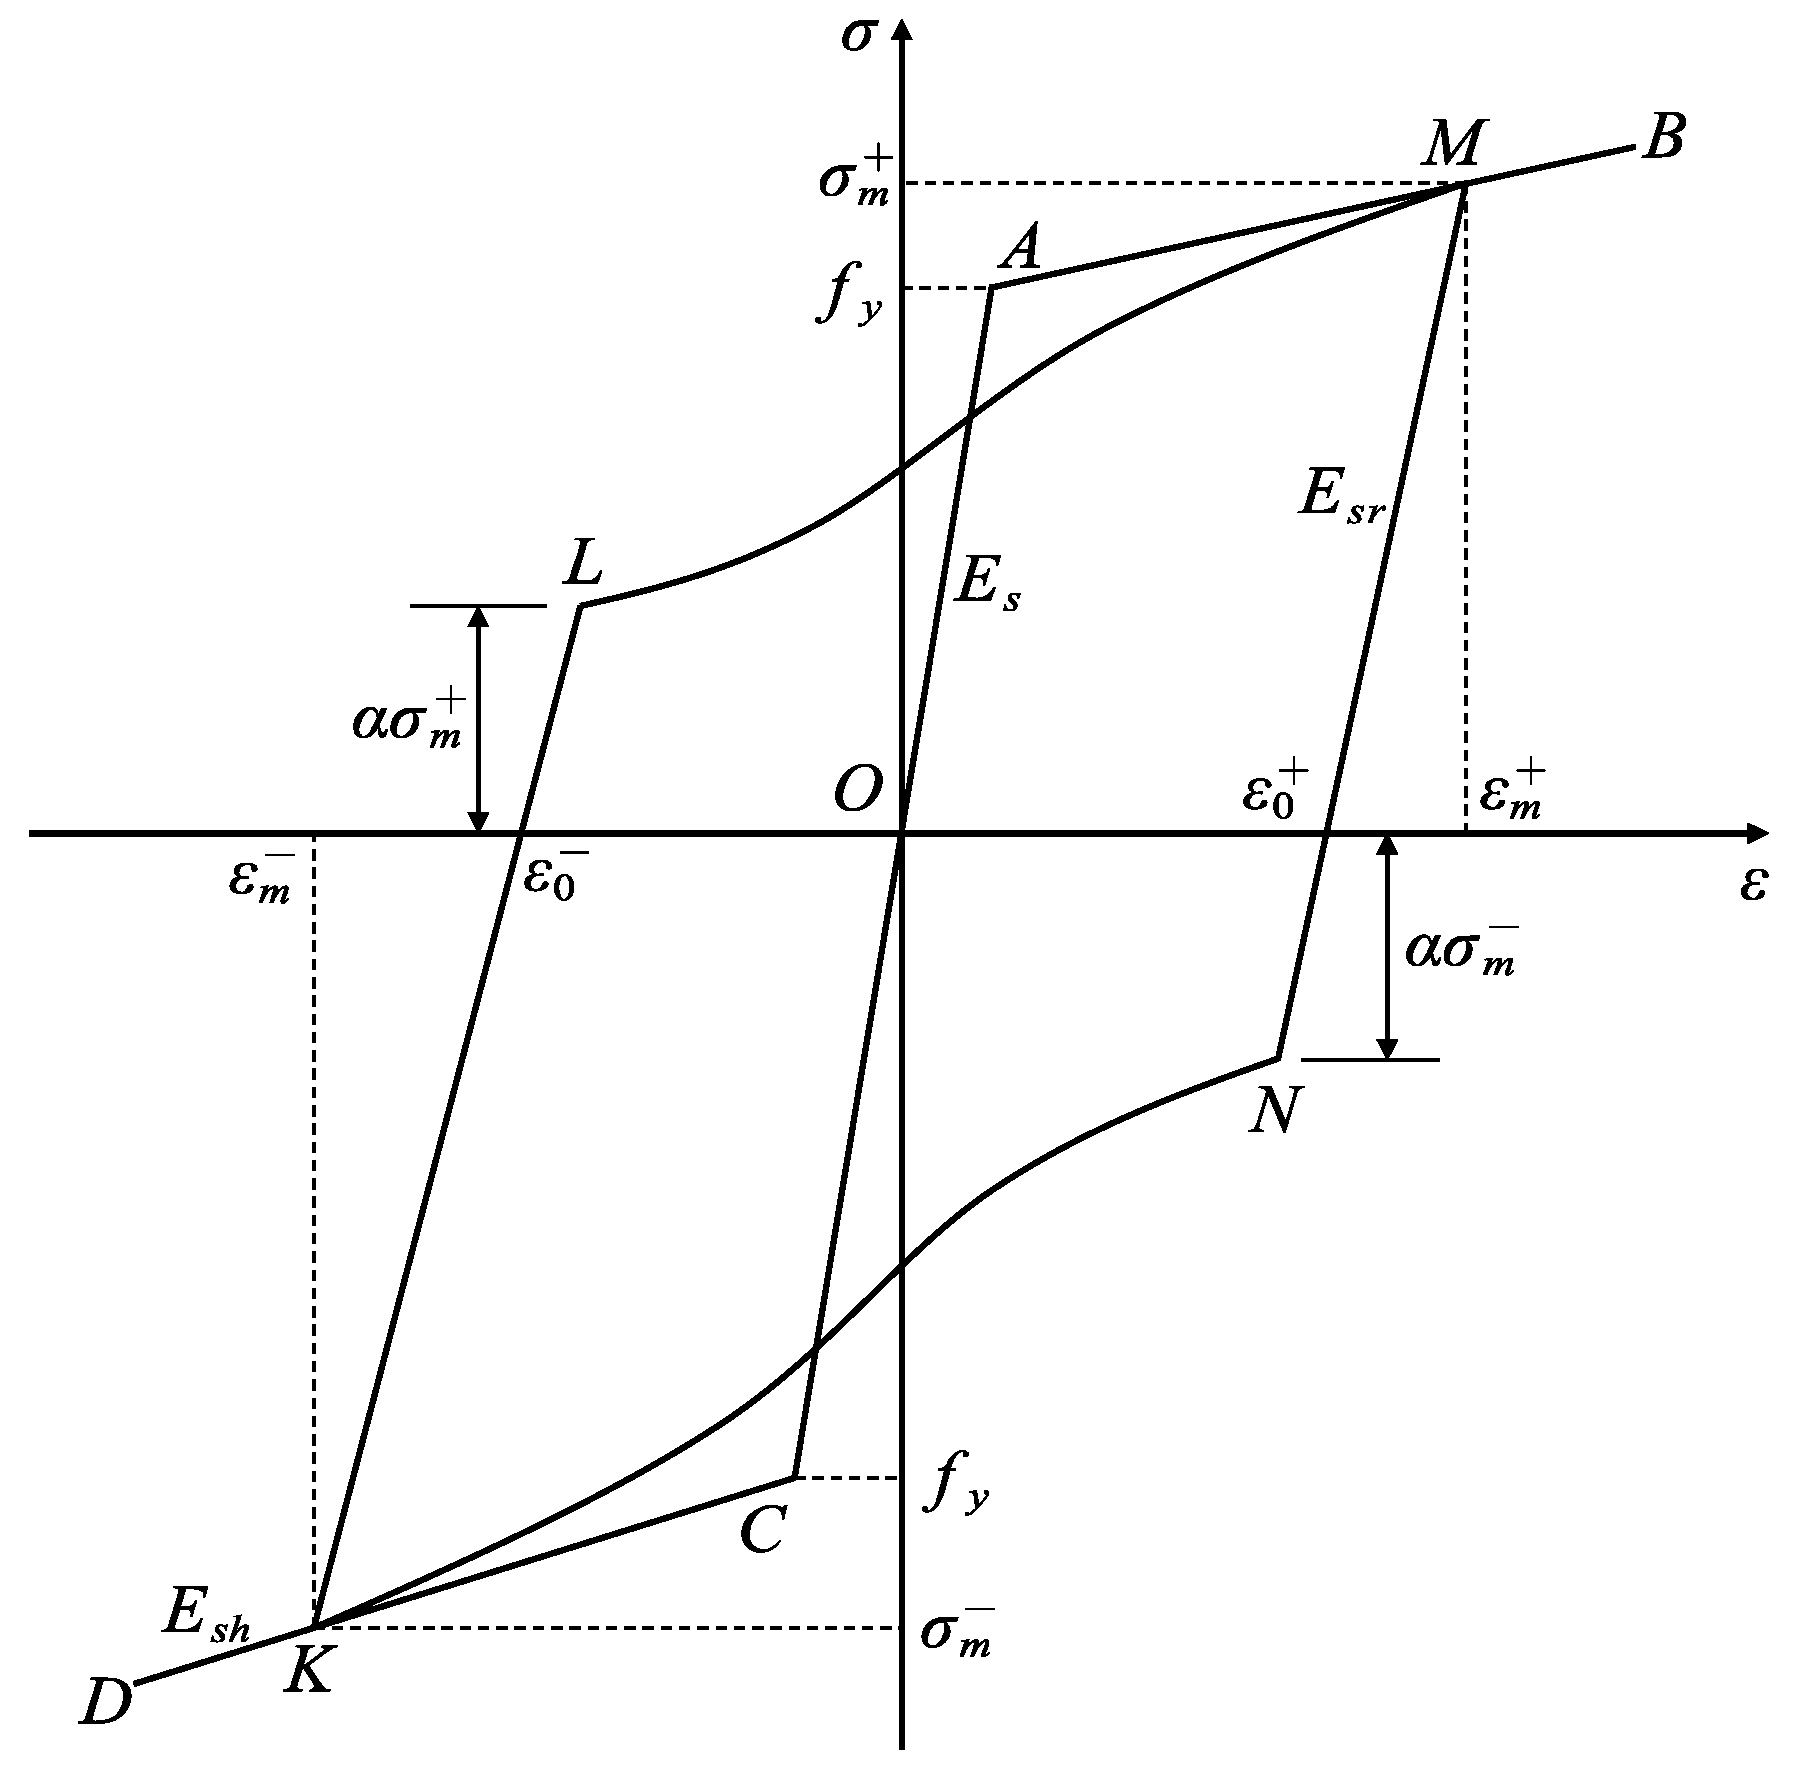
Based on the above considerations, this study selects the reinforcement subroutine compiled by Professor Fang [32] to simulate the hysteretic constitutive behavior of the stressed reinforcement. The proposed reinforcement hysteretic constitutive model is shown in Figure 3, in which this model equivalently realizes the bond–slip relationship between reinforcement and concrete by continuously weakening the reinforcement strength; therefore, on the reloading path, stiffness must exhibit the characteristic of being initially weak and then becoming stronger during the loading process, and thus, this path can be represented using a cubic curve. The following determination method for this curve is denotes the tangents of the curve at the connecting lines at point as , while at , this is denoted as , meaning the definitive conditions for this curve are the coordinates and slopes of points and ; thus, the cubic curve is monotonically increasing within the interval , and it does not increase the difficulty of solving the model due to the cubic function. Therefore, this model is more suitable for the problems of joint hysteretic performance degradation and collaborative mechanical weakening that are of concern in this paper.
Figure 3.
Hysteretic constitutive model of steel reinforcement.
Since the mechanical behavior of grouted sleeves is similar to that of reinforcement, their constitutive relationship should be describable using a similar model; however, judging from existing experiments and engineering practice, the deformation of sleeves during the loading process is generally small and usually does not belong to the primary factors leading to structural failure. Therefore, in simulating the grout sleeves, this study selects a standard bi-linear constitutive model.
3.1.3. Definition of Contact Between Components
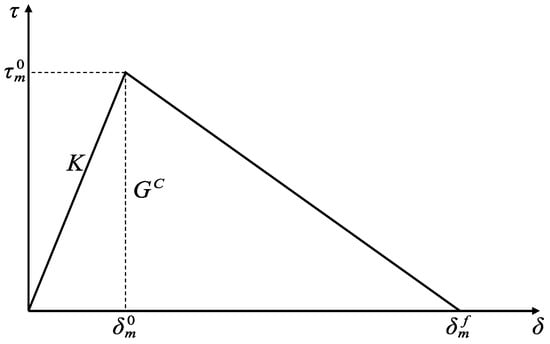
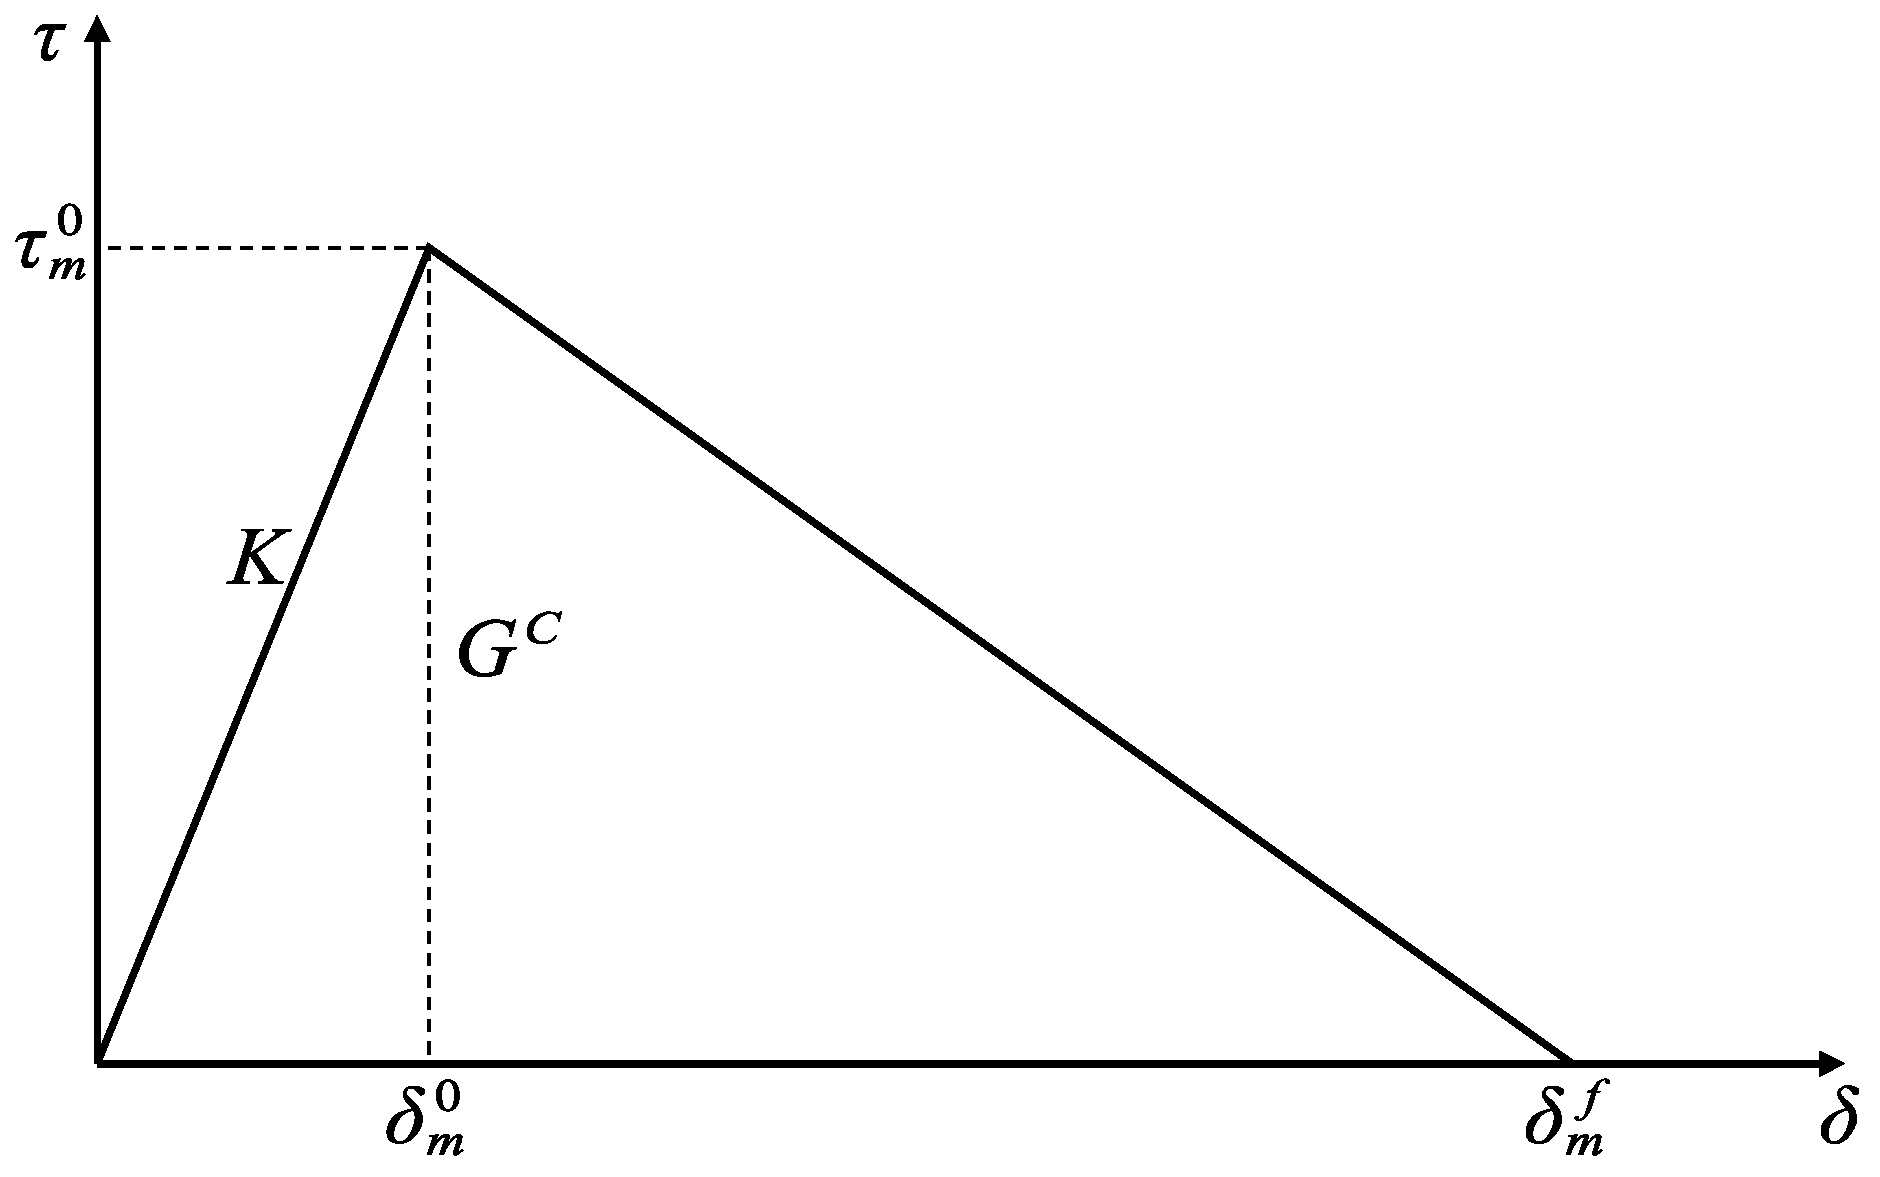
The force transmission behavior at the interface between new and old concrete in precast concrete structures is complex; therefore, the treatment of this interface directly relates to whether the force transmission paths and subsequent degradation responses of the joint can be reasonably reproduced. Based on this, the present study considers that both a cohesive zone model and a Coulomb friction model can be simultaneously defined for the contact interfaces in ABAQUS [33]. Based on the cohesive–friction hybrid model, the bonding performance of the interface between precast components and cast-in-place concrete is simulated by setting the contact behaviors; specifically, by defining the contact stress–displacement constitutive relationships in both the tangential and normal directions of the interface. When the cohesive zone model is in the elastic stage, the friction model remains inactive, and the interface shear stress originates solely from the cohesive model; as the cohesive model begins to undergo damage, its contribution to the interface shear stress decreases with the evolution of damage, at which point the friction model activates to generate shear stress [34]. According to the definitions in the ABAQUS Analysis User’s Manual [33], the cohesive zone model can be represented as shown in Figure 4, as when the stresses in the tangential and normal directions of the contact surface reach the peak stress and the relative interface displacement reaches , damage occurs at the bonding interface, and the stiffness in the corresponding direction begins to degrade; represents the relative displacement at complete failure of the contact interface, and the enclosed area represents the energy required for interface failure. In addition, for the cohesive zone model with uncoupled behaviors in each direction, both the normal elastic stiffnesses and tangential elastic stiffnesses and need to be defined. Zhou [34] demonstrated through calculations that the results tend to stabilize when the normal elastic stiffness is set to , while both tangential stiffnesses can be defined as zero when not strictly necessary.
Figure 4.
Cohesive zone model.
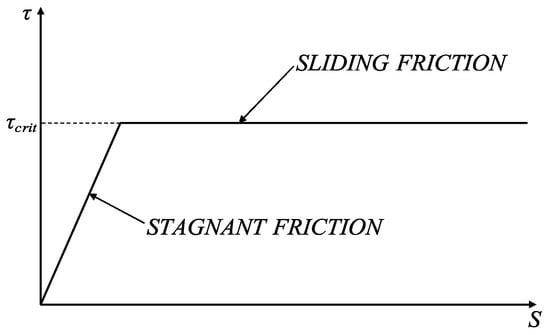
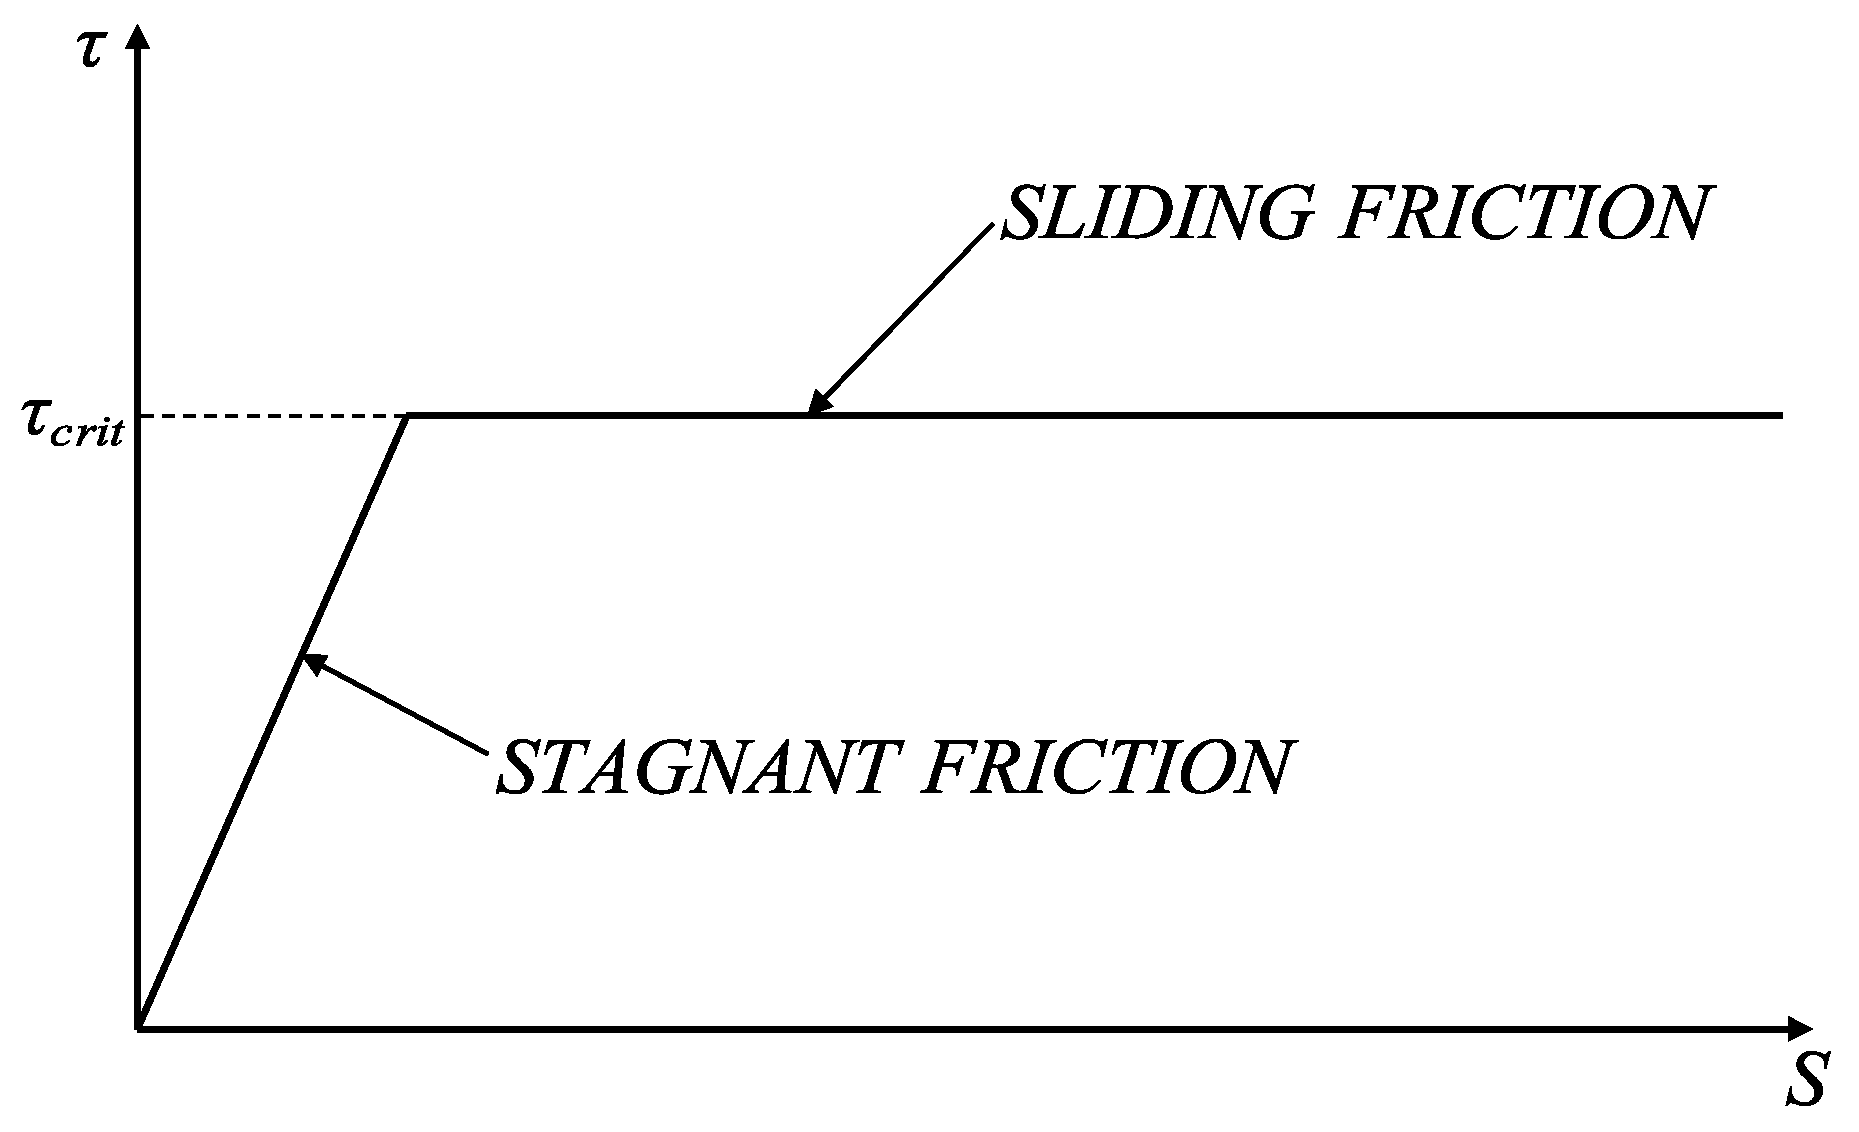
Similarly, according to the manual [33], the Coulomb friction model can be represented as shown in Figure 5, where is the critical stress, the value of which is determined by , with representing the friction coefficient and representing the normal compressive stress at the interface; when is less than , the interface is in a sticking friction state, and when otherwise, it is in a sliding friction state. In ABAQUS, the tangential behavior of the model contact interface is generally defined using a penalty function, assuming that the interface can undergo finite elastic displacement in the bonded state; the normal behavior is generally defined as a hard contact, meaning the interface can fully transmit compressive stress.
Figure 5.
Coulomb friction model.
Since the material properties of the internal grout and concrete are similar, and the slip space of the grout sleeves embedded within the components after the formation of the overall structure is small, the longitudinal reinforcement can be embedded within the grout in ABAQUS; the same method is used to simulate the relationship between the grout sleeves and the concrete components, while the relationship between the grout sleeves and the internal grout is simulated using a tie constraint.
For the analysis of the bond strength at the new-to-old concrete interface, this study refers to the bond strength models proposed by Liu [35] from Dalian University of Technology and Wang [36] from Southwest Jiaotong University, as detailed below.
(1) Normal bond strength model of the interface [35]:
where represents the normal bond strength of the new-to-old concrete interface, which is denoted as in the subsequent sections of this paper; is the mean cubic compressive strength of the existing and newly cast concrete; and denotes the interface roughness of the concrete joint, which is taken as 6 mm herein.
(2) Tangential bond strength model of the interface [36]:
where is the shear bond strength of the new-to-old concrete interface, which is denoted as and in the subsequent sections of this paper; is the influence coefficient of the bonding agent type applied on the interface, which is taken as one herein; is the influence coefficient of the dowel action on shear resistance, ; is the shear capacity coefficient of the dowel action, which is taken as 0.2 herein; is the friction coefficient of the interface, which is taken as 0.8 herein; is the reinforcement ratio of the post-installed rebar at the interface; and is the yield strength of the post-installed rebar at the interface.
3.1.4. Comparative Analysis of Hysteretic Characteristics
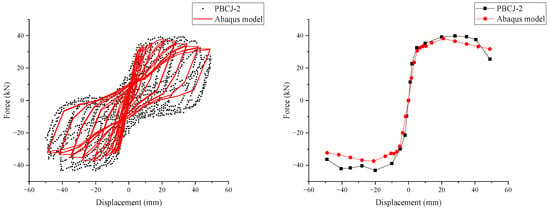
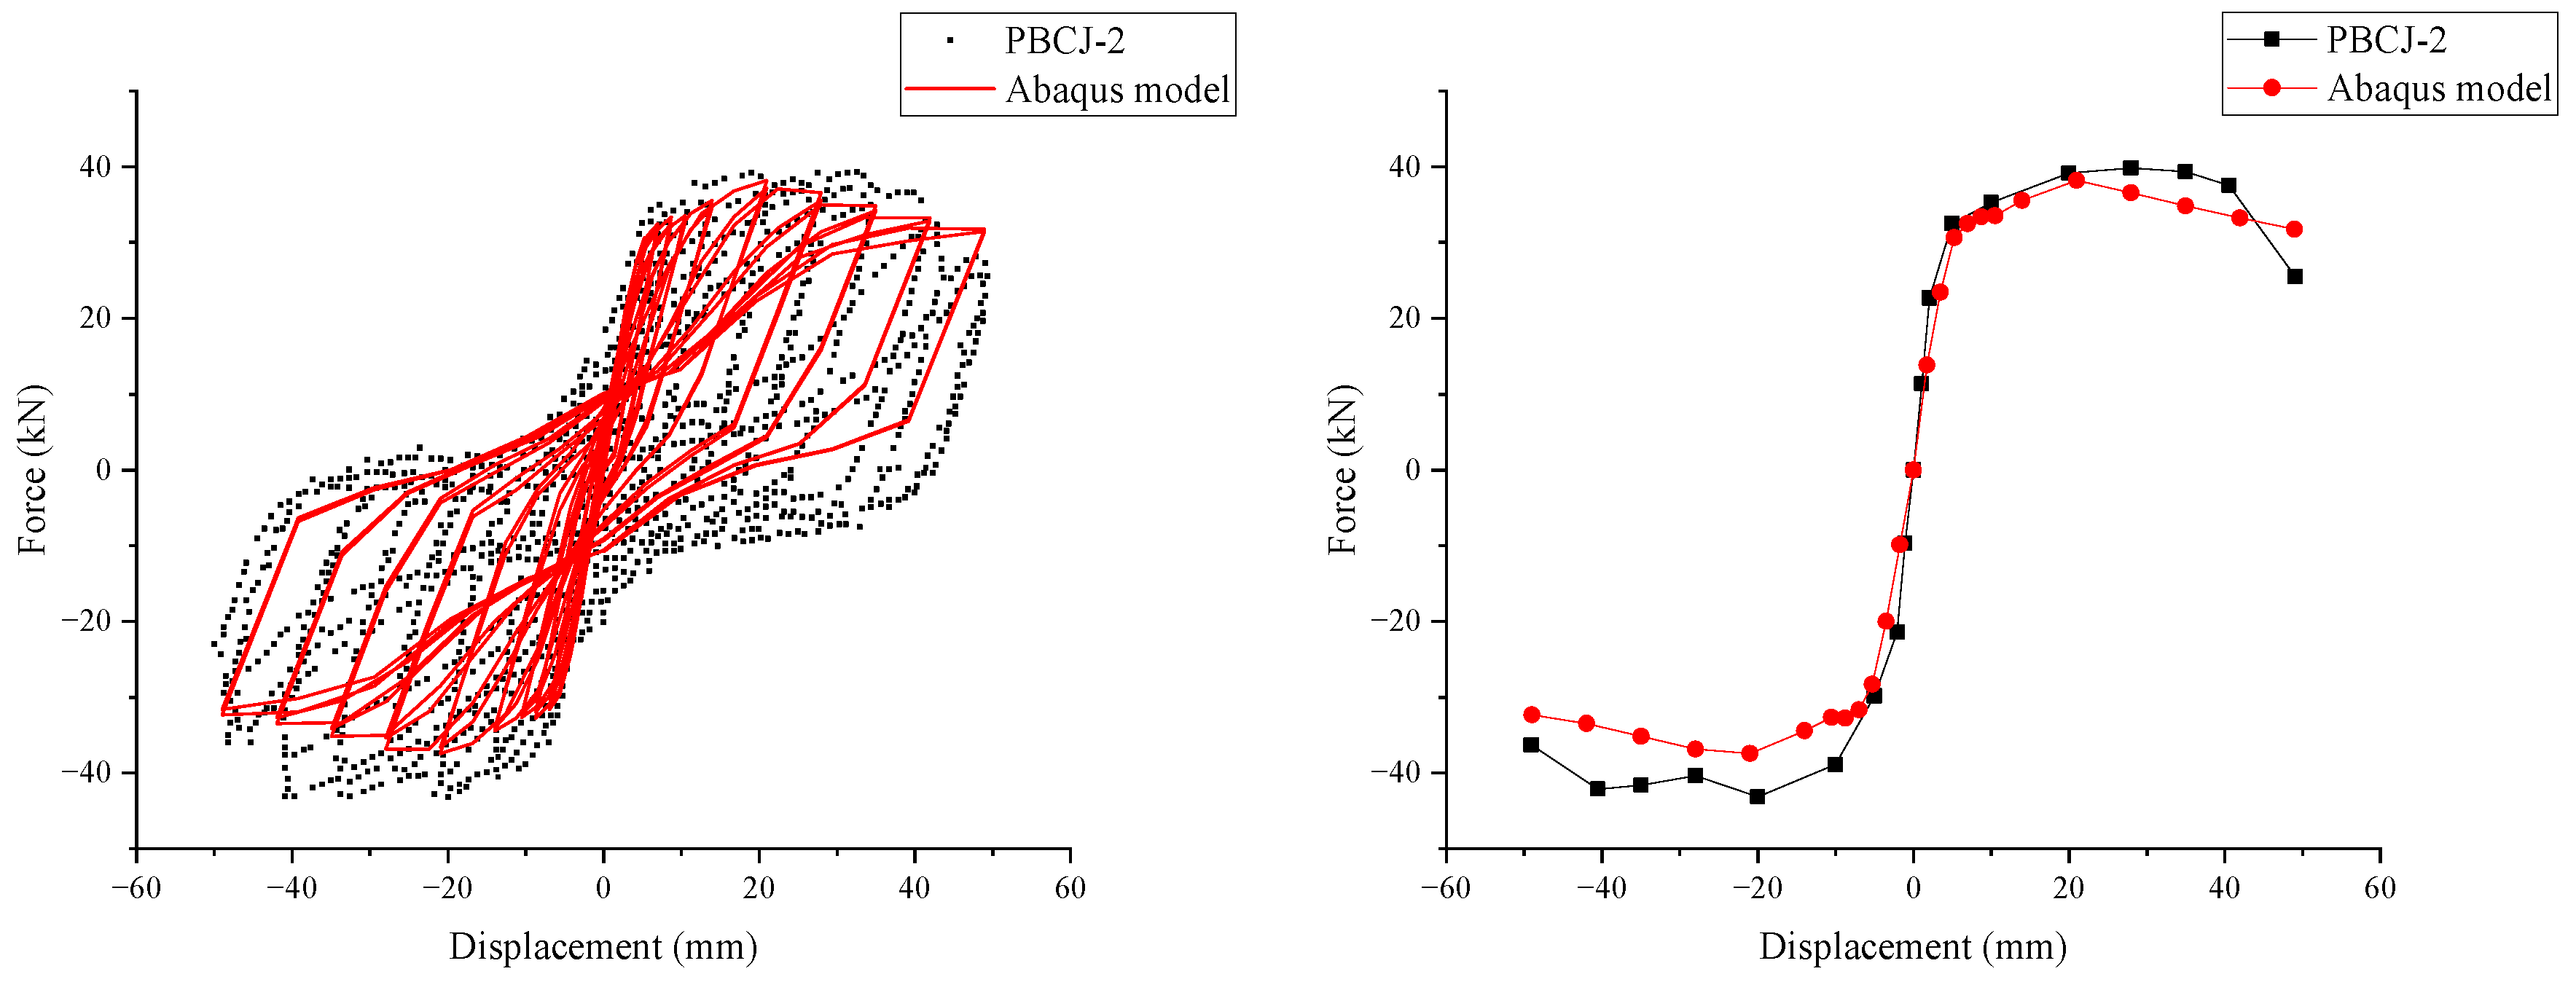
Because the original test record does not provide all the loading details and complete cycle-by-cycle numerical data, the quantitative comparison focuses on the main load-bearing and deformation indicators extracted from the skeleton curves. Compared with the conventional precast joint test model presented by Liu et al. [28], as depicted in Figure 6, the numerical simulation curves exhibit more pronounced pinching characteristics compared to the experimental curves; it can be observed that the average error of the beam-end reaction force is relatively small in the positive direction, whereas it is relatively larger in the negative direction.
Figure 6.
Comparison of hysteretic and skeleton curves (uncorroded).
In the table, represents the peak load sustained by the joint; is the corresponding displacement at the peak load; is the corresponding displacement at the ultimate load, which corresponds to the displacement when the bearing capacity drops to 85% of the peak capacity; is the yield displacement of the joint, which is obtained by the equivalent energy method; and represents the initial stiffness, expressed as the ratio of the yield load to the yield displacement.
As shown in Table 3, the positive peak load predicted by the finite-element model differs from the test result by 4.16%, and the positive ultimate displacement differs by 6.02%, indicating that the model can reasonably capture the load-bearing level and deformation capacity of PBCJ-2. Relatively larger deviations are observed in the positive peak displacement and in the negative peak load. These deviations are mainly related to the simplification of local failure mechanisms in the model, including concrete cover spalling, bond–slip between reinforcement and concrete, and local stiffness deterioration at the precast-to-cast concrete interface. In addition, the exact displacement history and repeated-cycle degradation process of the original test could not be fully reproduced, which also contributes to the difference in the negative loading direction and at large displacement levels.
Table 3.
Comparison of specific mechanical parameters (uncorroded).
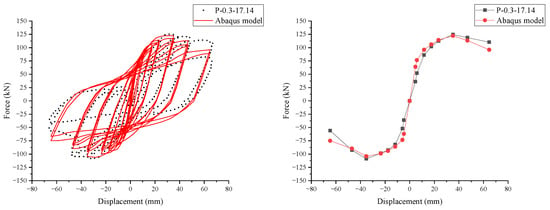
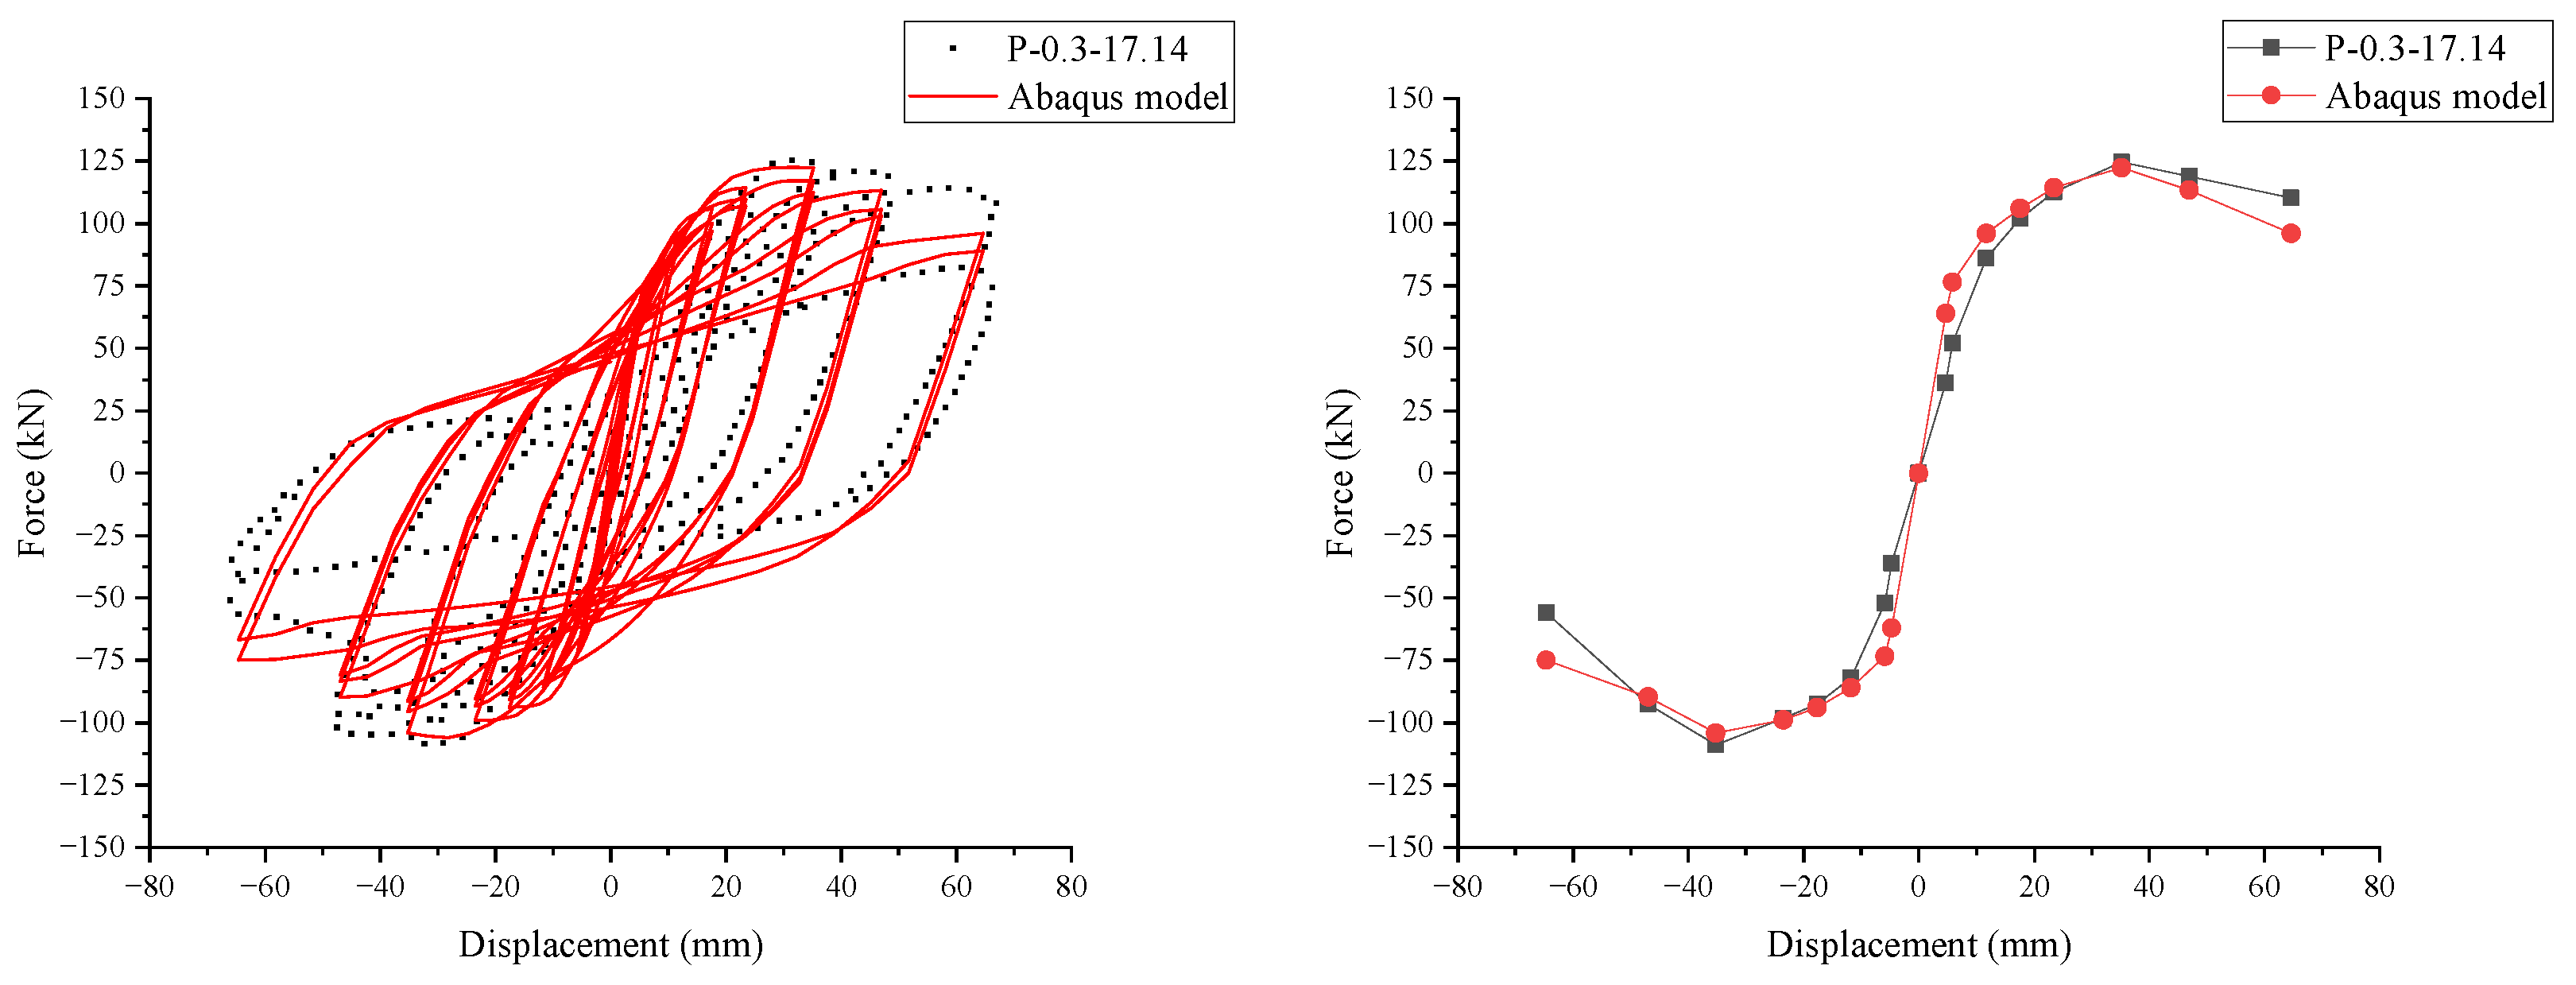
Compared with the severely corroded precast joint test model from Zhao et al. [29], as shown in Figure 7, the numerical results exhibit better agreement with the experimental data. This improved agreement is mainly attributed to the clearer details on boundary conditions and loading protocols provided in their study. Likewise, under corrosive conditions, the simulated results are basically in agreement with the experimental findings, confirming the reliability of the present numerical model.
Figure 7.
Comparison of hysteretic and skeleton curves (corroded).
As shown in Table 4, for the severely corroded precast joint test model P-0.3-17.14, the peak load errors in the positive and negative directions are 2.44% and 2.71%, respectively, suggesting that the model can still reproduce the load-bearing capacity after corrosion-induced deterioration. The remaining differences in yield displacement, ultimate displacement, and stiffness are associated with the potential uncertainty of damage distribution during the loading process. In actual corroded joints, local cracking, interface degradation, and bond deterioration may develop differently along the reinforcement and the sleeve region. These local phenomena are represented in the finite-element model through equivalent material degradation and interface parameters, which inevitably introduces certain deviations in deformation-related indicators.
Table 4.
Comparison of specific mechanical parameters (corroded).
The comparison between the uncorroded and corroded validation specimens indicates that the model has a better accuracy in predicting the peak load level than in reproducing all displacement-related indices. This is acceptable for the purpose of the present study because the subsequent service-life analysis mainly focuses on the relative degradation trend of seismic performance indicators under a consistent modeling framework.
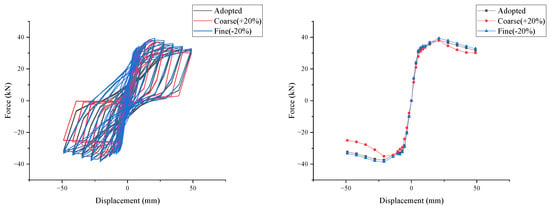
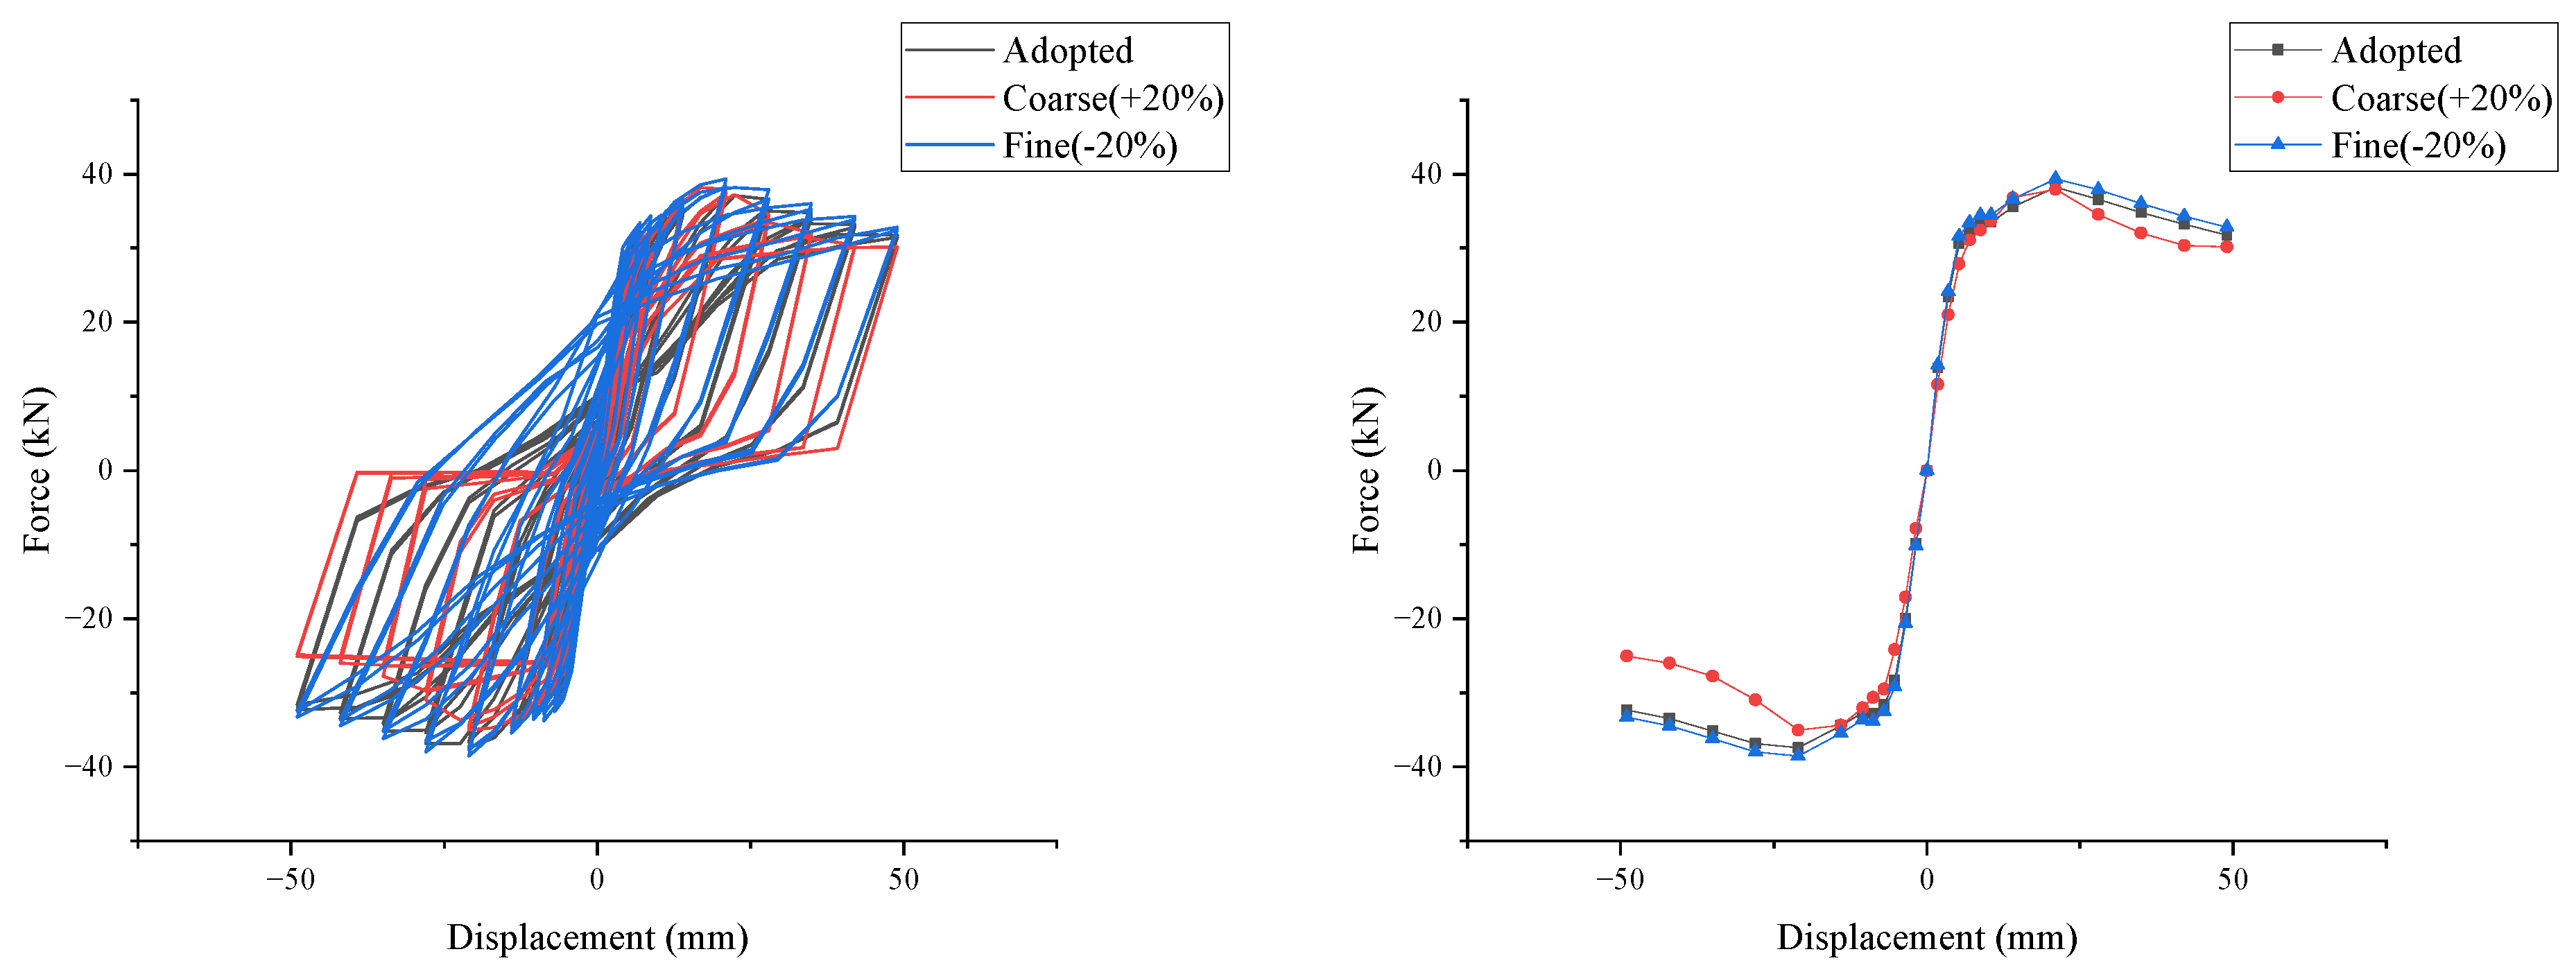
In addition, because the new-to-old concrete interface and the grouted sleeve region are damage-prone zones where stress concentrations are likely to develop, improper mesh discretization may lead to significant discrepancies in the numerical results; moreover, the concrete damaged plasticity (CDP) model adopted in this study is also sensitive to the mesh size. Therefore, taking the experimental specimen PBCJ-2 as an example, three different mesh size combinations were employed to discretize the model, as summarized in Table 5. The resulting three hysteretic and skeleton curves obtained from the analysis are compared in Figure 8, and the comparison of the corresponding mechanical parameters is presented in Table 6.
Table 5.
Mesh details for each component in the numerical model.
Figure 8.
Comparison of the three hysteretic and skeleton curves.
Table 6.
Comparison of specific mechanical parameters (different mesh size).
The mesh comparison in Table 6 further explains the influence of discretization on the validation results. When the characteristic mesh size is increased by 20%, the peak load remains close to that of the adopted mesh, but larger differences appear in peak displacement, ultimate displacement, and stiffness. This indicates that an overly coarse mesh cannot adequately capture the localized damage evolution in the joint core, sleeve region, and new-to-old concrete interface. In contrast, when the mesh size is reduced by 20%, the differences in peak load, peak displacement, ultimate displacement, and stiffness are small, especially in the main skeleton curve indicators. This demonstrates that the adopted mesh is sufficiently refined for the present modeling strategy.
Considering the mesh sensitivity of the CDP model and the cohesive–friction interface formulation, for structural components with different functions and levels of importance, the mesh size should be differentiated accordingly. The adopted mesh was therefore selected by balancing validation accuracy, numerical stability, and computational efficiency. The same refinement principle was subsequently used in the case-study joint model.
The above demonstrates that the model established in this study can effectively reproduce the hysteretic response, skeleton development laws, and load-bearing capacity degradation trends of the selected typical precast joint, serving as an analytical foundation for subsequent identification of relative degradation laws and indicator-specific changes across different service ages.
It should be pointed out that some deviations still exist between the numerical and experimental results during the large displacement stage, primarily due to two reasons: first, complex damage phenomena during the testing process, such as concrete cover spalling, localized reinforcement buckling, and bond–slip, possess strong randomness, whereas the finite-element model has undergone necessary simplifications of these localized failure mechanisms; and second, due to the aforementioned inability to fully obtain the original experimental loading history, certain differences exist between the numerical analysis and the measured conditions in the setting of displacement amplitudes at each level. Therefore, the significance of the model validation in this study should be understood as indicative of the model’s capability to reasonably reproduce the hysteretic behavior, skeleton development laws, and load-bearing capacity degradation trends of typical precast joints under cyclic loading, serving as a basis for subsequent comparative analysis at different service ages; however, its applicability remains limited to general typical joint structural forms and cannot be equated to a universal prediction of the mechanical characteristics of all precast joints.
Based on the aforementioned validation results, this study further incorporates the reinforcement corrosion and concrete material degradation caused by chloride ion ingress into the validated model in the form of time-dependent parameters to analyze the relative degradation laws of joints at different service ages. In other words, the subsequent results are more suitable for revealing the relative degradation characteristics of joint mechanical performance evolution with age, rather than being simply understood as direct predictions of the absolute performance of any arbitrary joint in actual engineering.
3.2. Establishment of the Finite-Element Model
To ensure both engineering representativeness and computational operability, the analysis case was defined according to the general service conditions of residential buildings in coastal cities and the data requirements of the calculation models in Section 2. With the coastal atmospheric environment of Haikou City, Hainan Province, an area approximately 500 m from the coastline was selected for the representative exposure scenario. The concrete cover thickness was set to 40 mm, the design service life to 50 a, and the axial compression ratio at the column top to 0.2. These parameters are not intended to cover all coastal precast building scenarios; instead, they define a representative joint life-cycle analysis case for examining the relative degradation trends of joint performance under chloride-induced corrosion.
3.2.1. Design of Joint Model Parameters
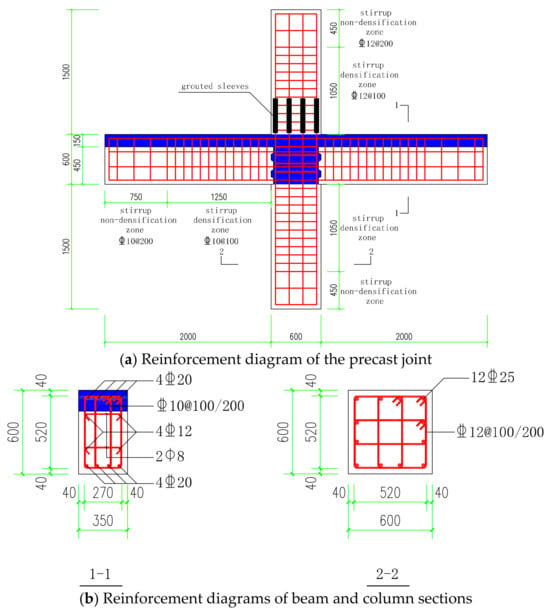
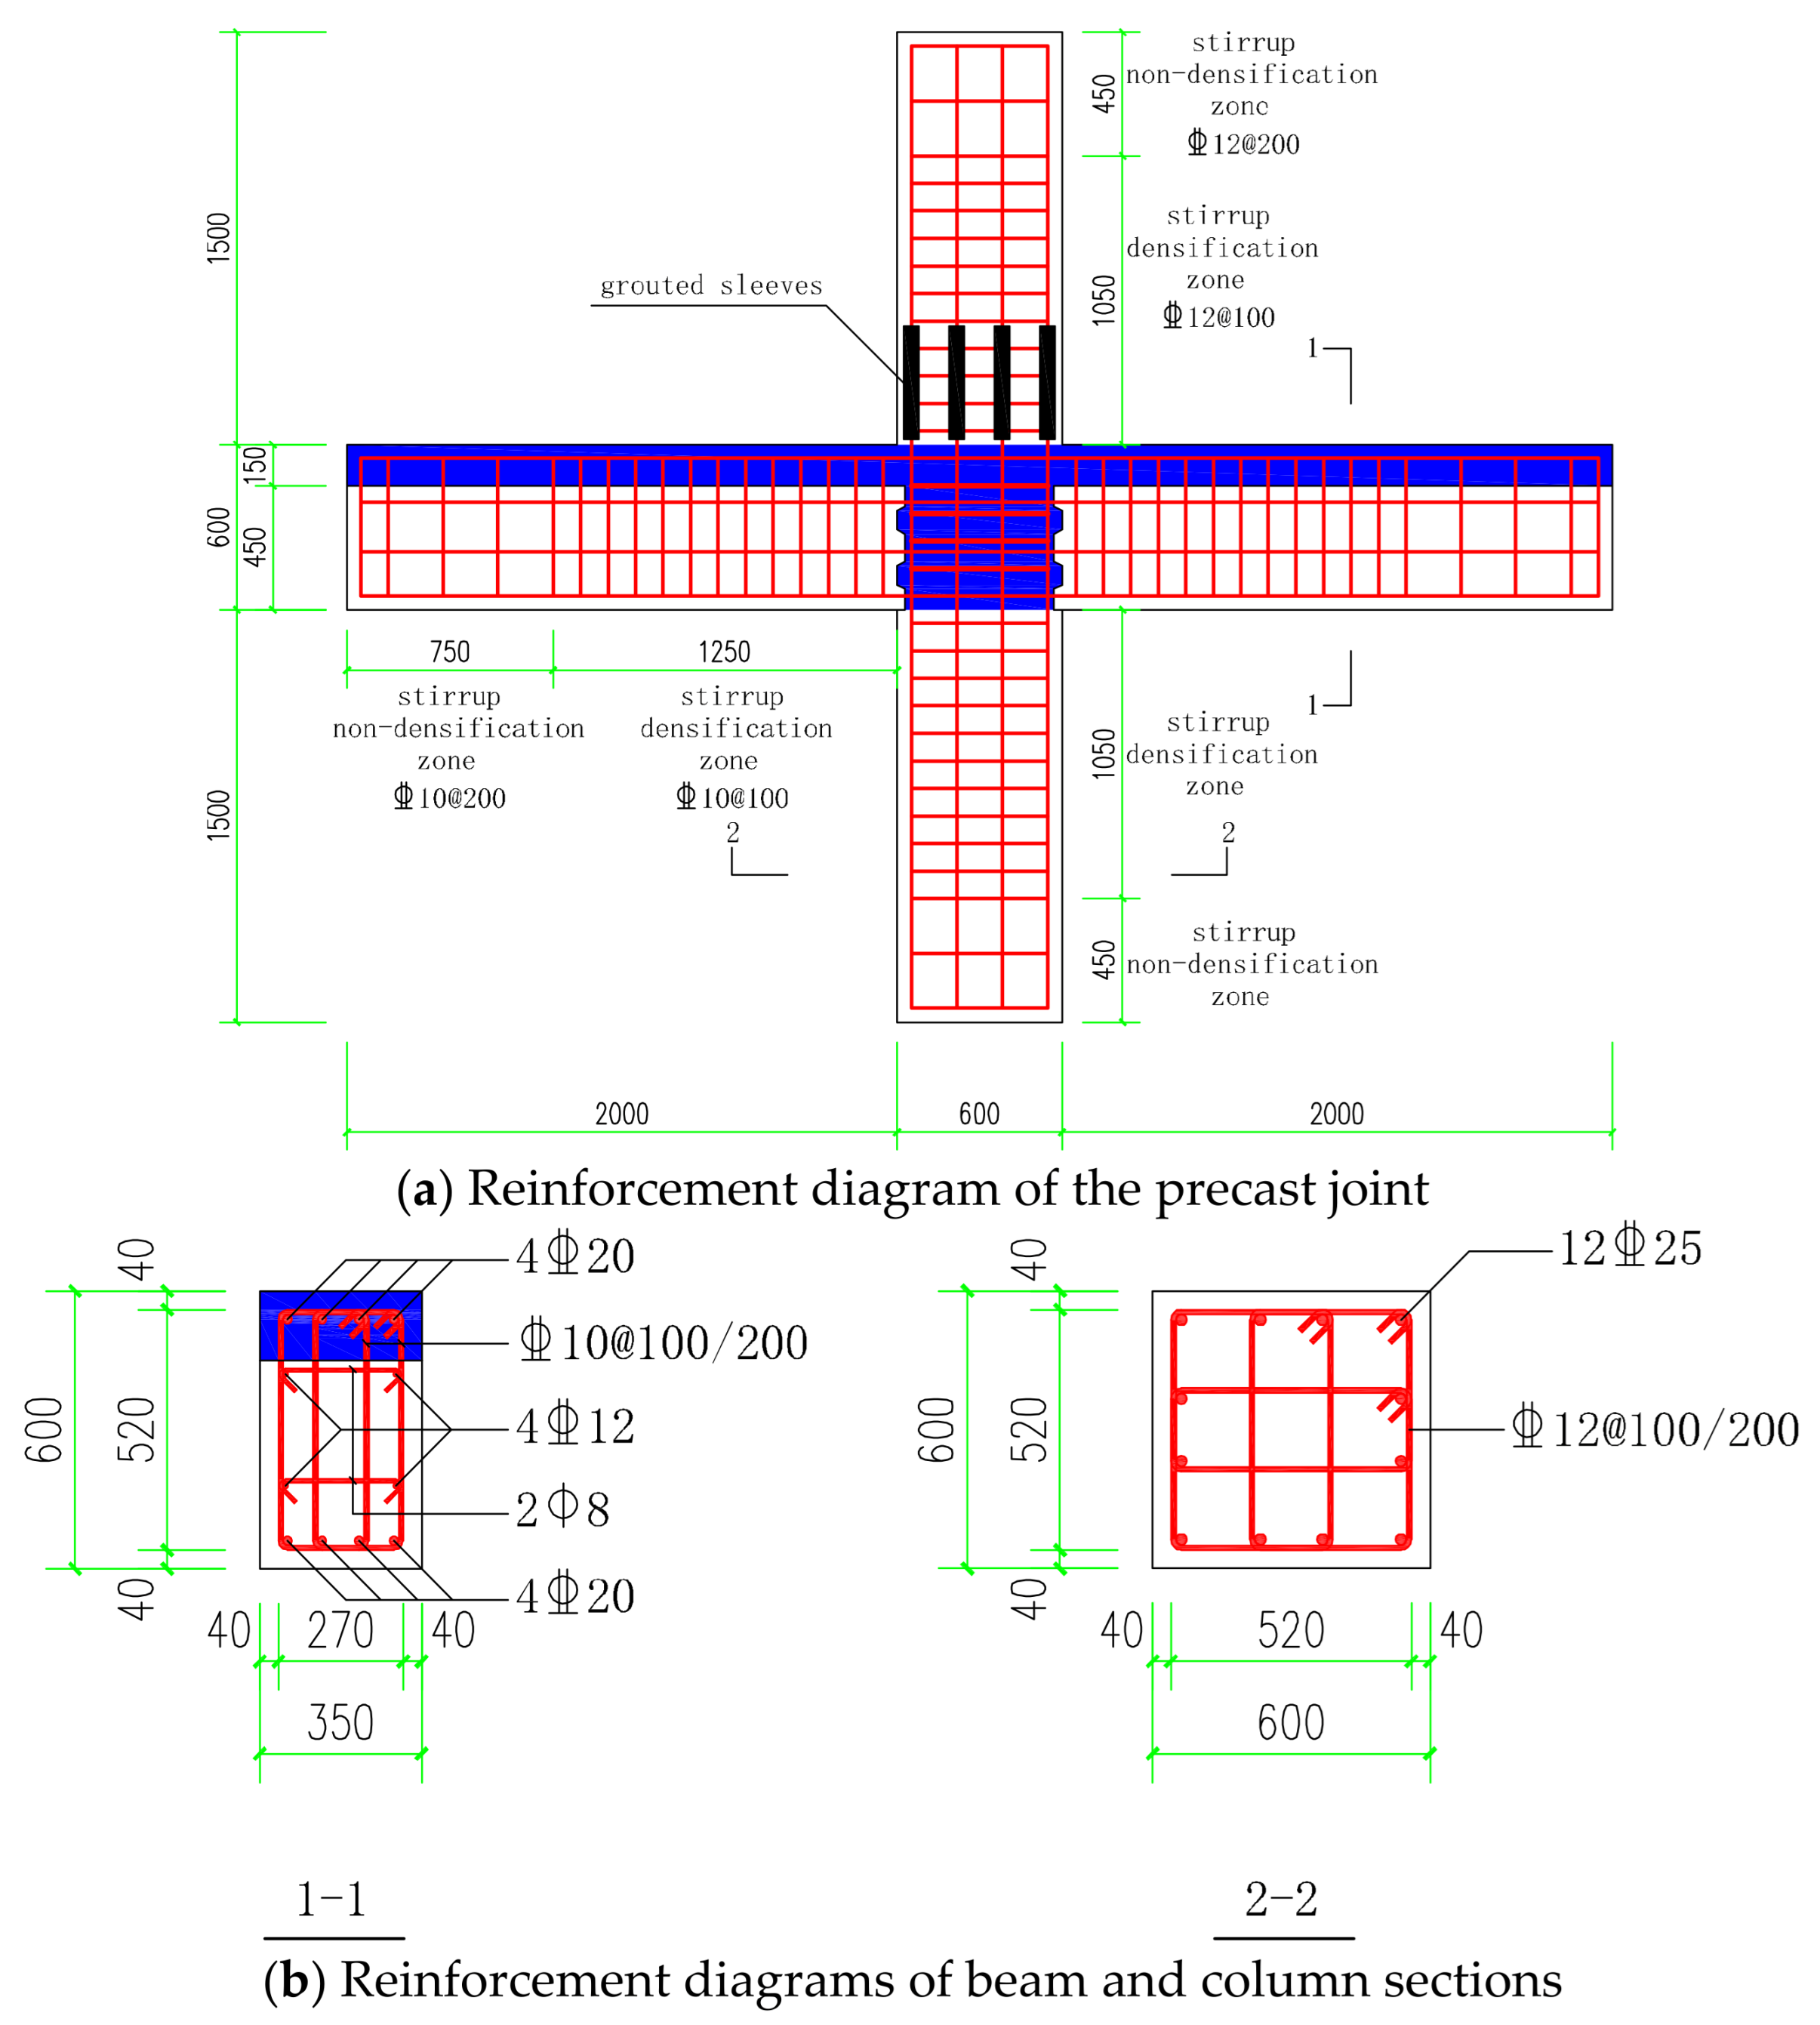
In the typical precast frame joint designed in this study, C40 concrete is used for both beams and columns. The material for the grouted sleeves is No. 45 steel. Except for the tie bars within the beams, which used HPB300 grade reinforcement, all other structural reinforcement utilized HRB400 grade reinforcement. The average values of the initial yield strength of the reinforcement and the axial compressive strength of the concrete reference those from the literature [37,38]. It should be noted that, for both HRB400 longitudinal reinforcement and C40 concrete, the measured mechanical properties from the literature rather than the standard characteristic values are adopted in the numerical calculations. Under initial conditions, the measured yield strength of the HRB400 reinforcement is taken as 459 MPa, according to [37], while the measured cubic compressive strength of the C40 concrete is set to 45.5 MPa based on [38]. The specific dimensions and reinforcement details of the precast frame joint are shown in Figure 9.
Figure 9.
Dimensions and reinforcement diagrams of the typical joint.
According to the calculation models established in Section 2, the corrosion rates of the reinforcement materials within the service life are presented in Table 7, and the time-dependent mechanical parameters of the concrete and reinforcement materials are detailed in Table 7, Table 8, Table 9 and Table 10. Since the user subroutine for the reinforcement hysteretic model adopted in this study does not require the ultimate strength of the steel bar, only the time-varying parameters for the yield strength are listed here. Considering that the tie bars in the beams serve as structural reinforcement and do not participate in major load-bearing calculations, and their positions are deep within the concrete core zone and are less directly exposed to chloride-induced corrosion effects, the time-dependent evolution of their mechanical properties is neglected in this study.
Table 7.
Average corrosion rate of reinforcement.
Table 8.
Age-dependent mechanical parameters of the concrete cover.
Table 9.
Age-dependent mechanical parameters of the internal concrete.
Table 10.
Age-dependent mechanical parameters of reinforcement.
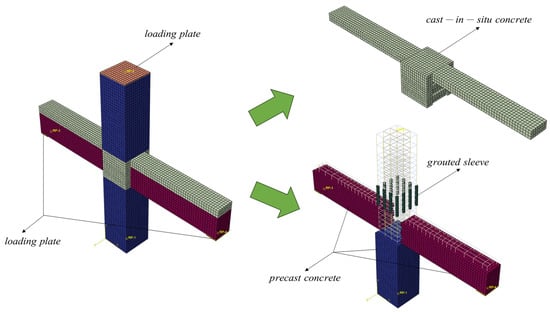
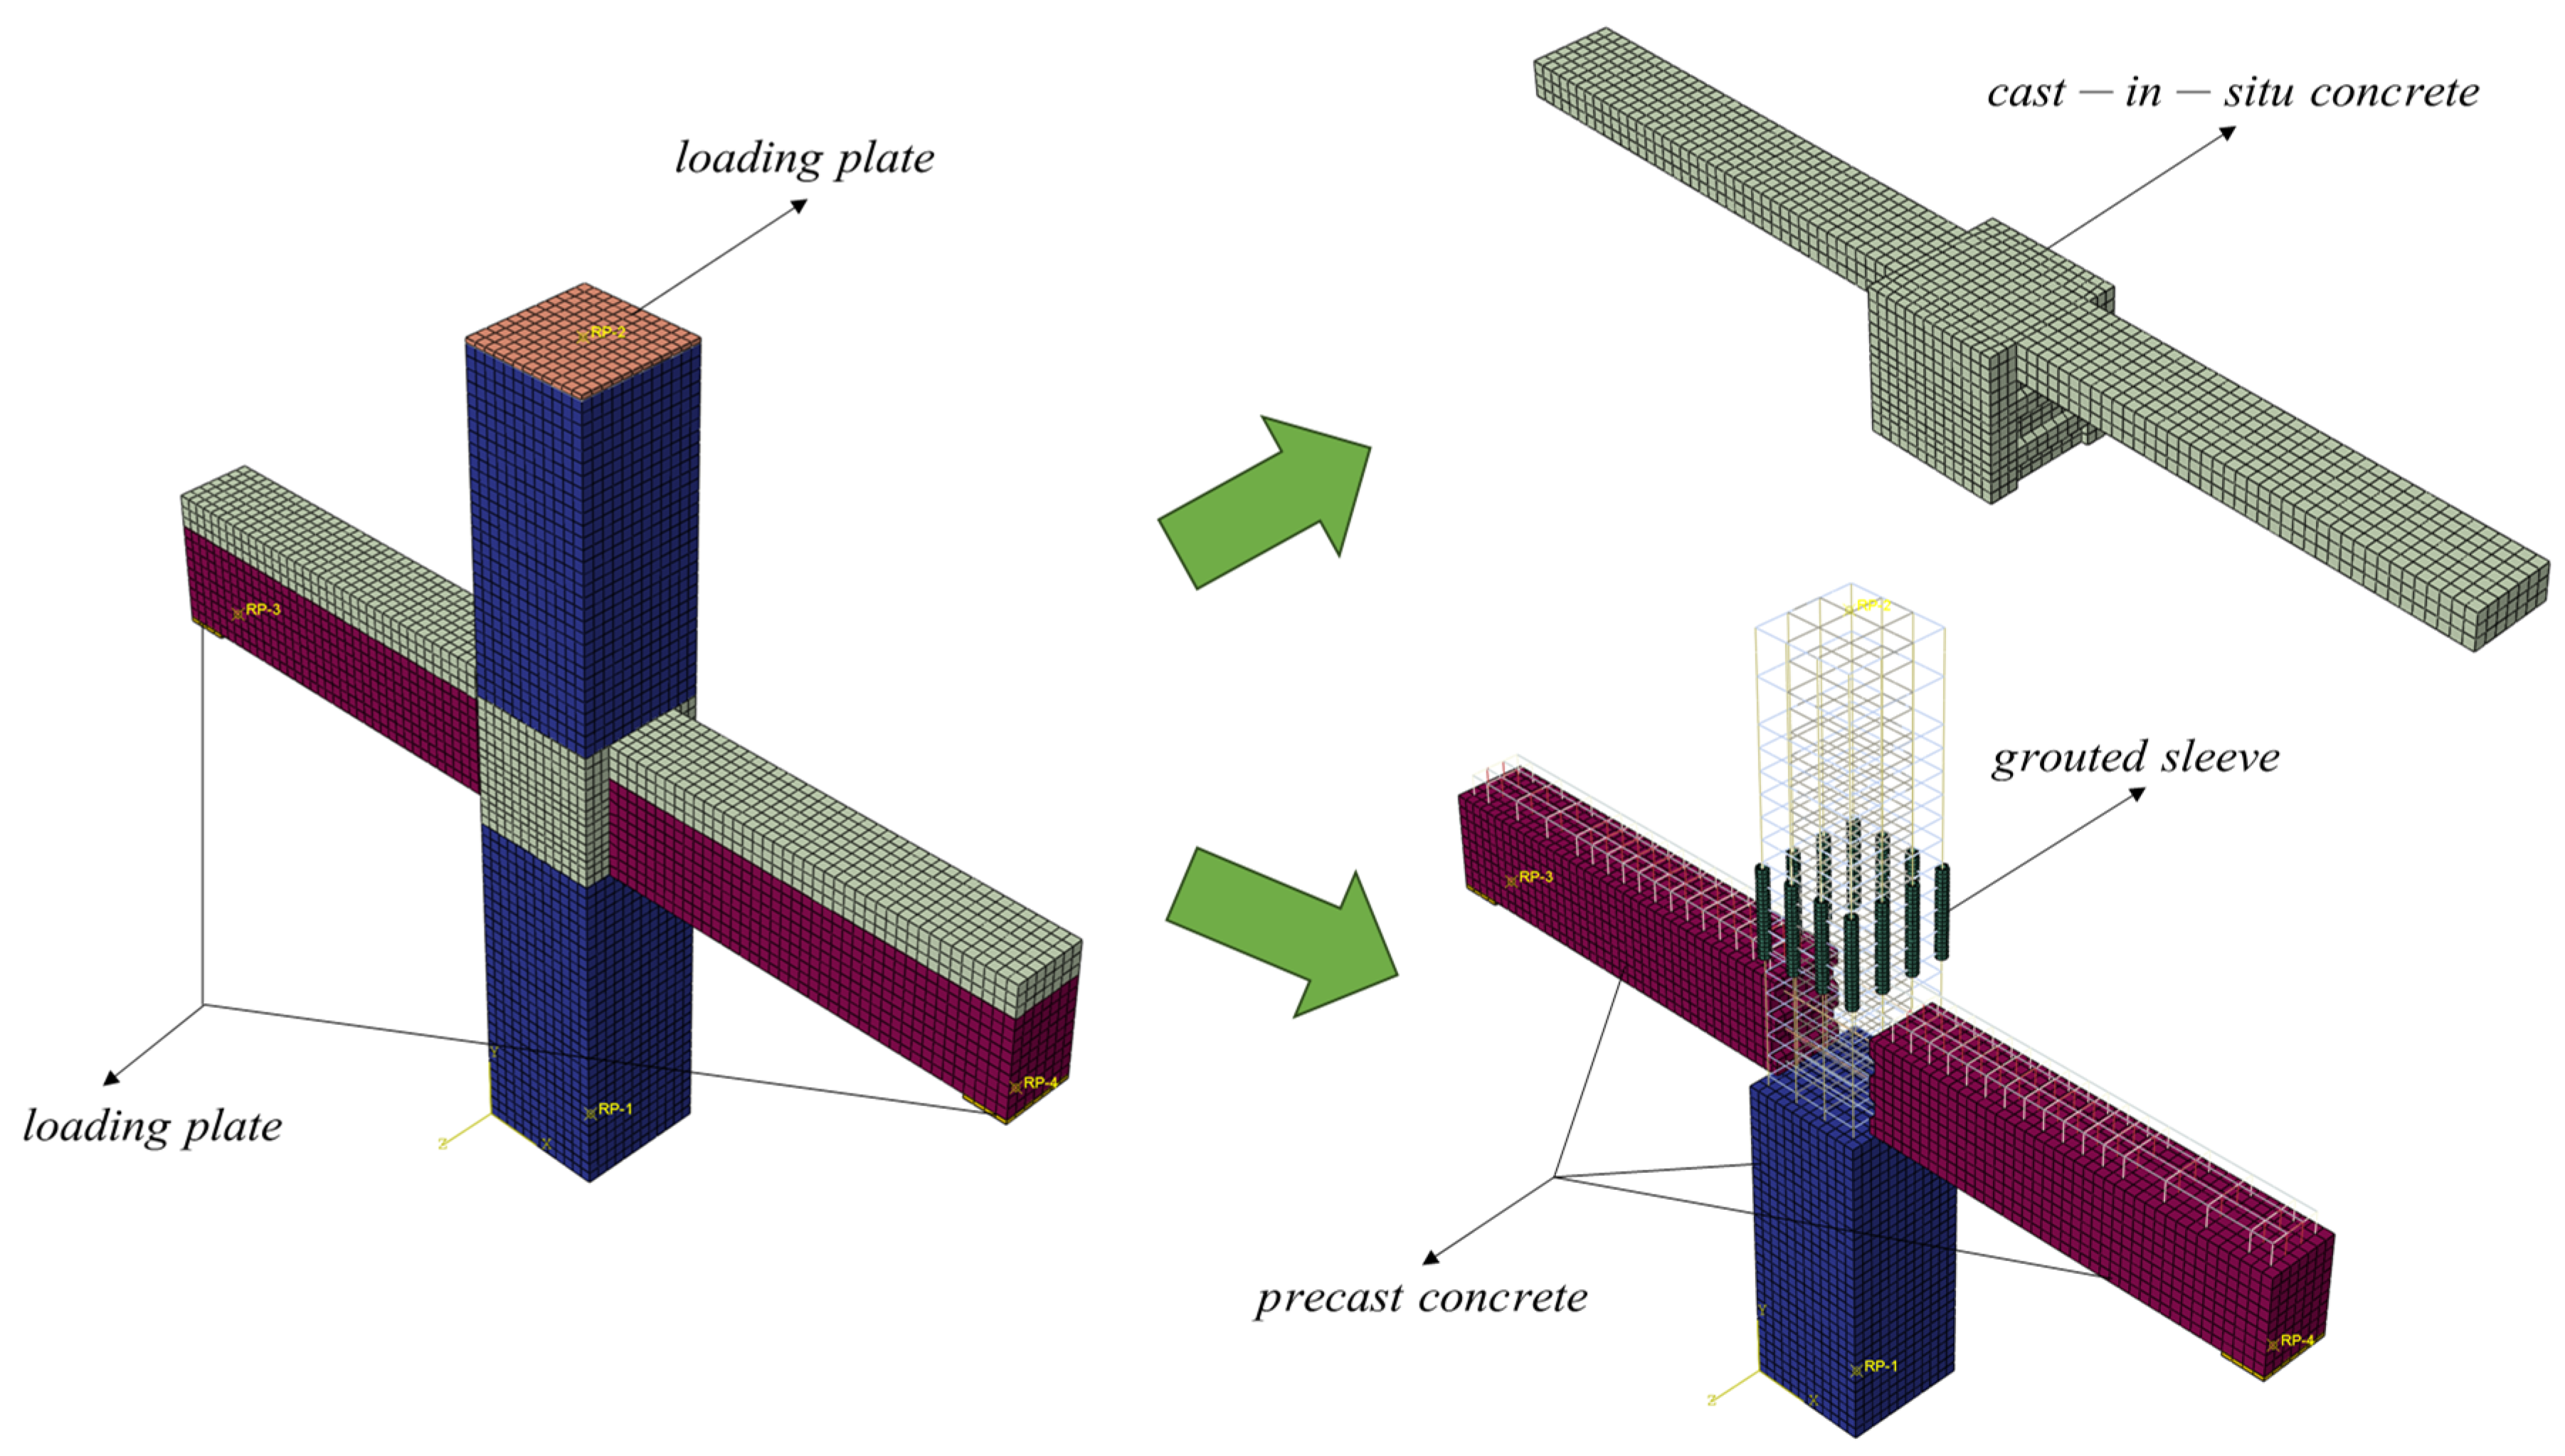
The precast frame joint model established in this study using ABAQUS finite-element software is shown in Figure 10.
Figure 10.
Three-dimensional solid model diagram of the typical joint.
To better align with actual experimental conditions, three-dimensional modeling is used to arrange the loading steel plates on the top of the column and at both ends of the beam. The dimensions of the beam-end loading plates are 350 mm × 200 mm × 20 mm, and the column-top loading plate is 600 mm × 600 mm × 20 mm. To ensure that the steel plates do not undergo significant plastic deformation during loading, which would affect the final simulation results, the loading steel plates are defined as rigid bodies. A tie constraint is used between the loading steel plates and the concrete components to ensure full load transmission between the two. Since defining a rigid body requires setting an RP reference point on the loading plate and coupling it with the whole, the boundary conditions are applied to this reference point. The setting of boundary conditions is identical to that of the finite-element validation model in Section 3.1. Additionally, the loading protocol is applied to the reference points of the beam-end loading steel plates, enabling uniform transmission of load and displacement.
The mesh details for each component in the numerical model are summarized in Table 11.
Table 11.
Mesh details for each component in the numerical model.
In addition, the interfacial parameters of the newly cast and existing concrete interface at different ages are detailed in Table 12, Table 13, Table 14, Table 15 and Table 16. Here, the composite interface refers to the contact surface between the precast beam and the cast-in-place beam; the keyway surface denotes the joint surface at the beam-end shear key; and the column-end face represents the interface between the column end and the cast-in-place beam.
Table 12.
Interface parameters of the concrete joint at 0 a.
Table 13.
Interface parameters of the concrete joint at 15 a.
Table 14.
Interface parameters of the concrete joint at 30 a.
Table 15.
Interface parameters of the concrete joint at 40 a.
Table 16.
Interface parameters of the concrete joint at 50 a.
3.2.2. Loading Protocol Design
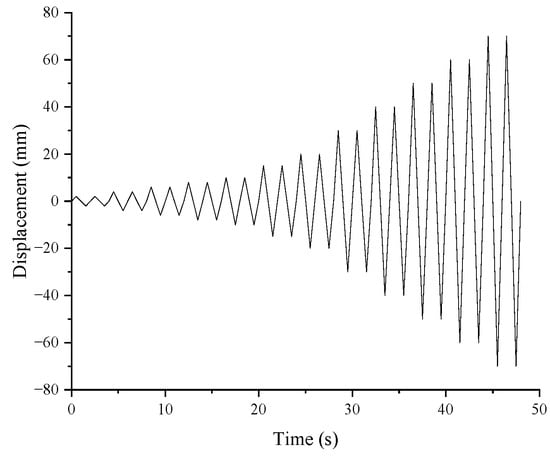
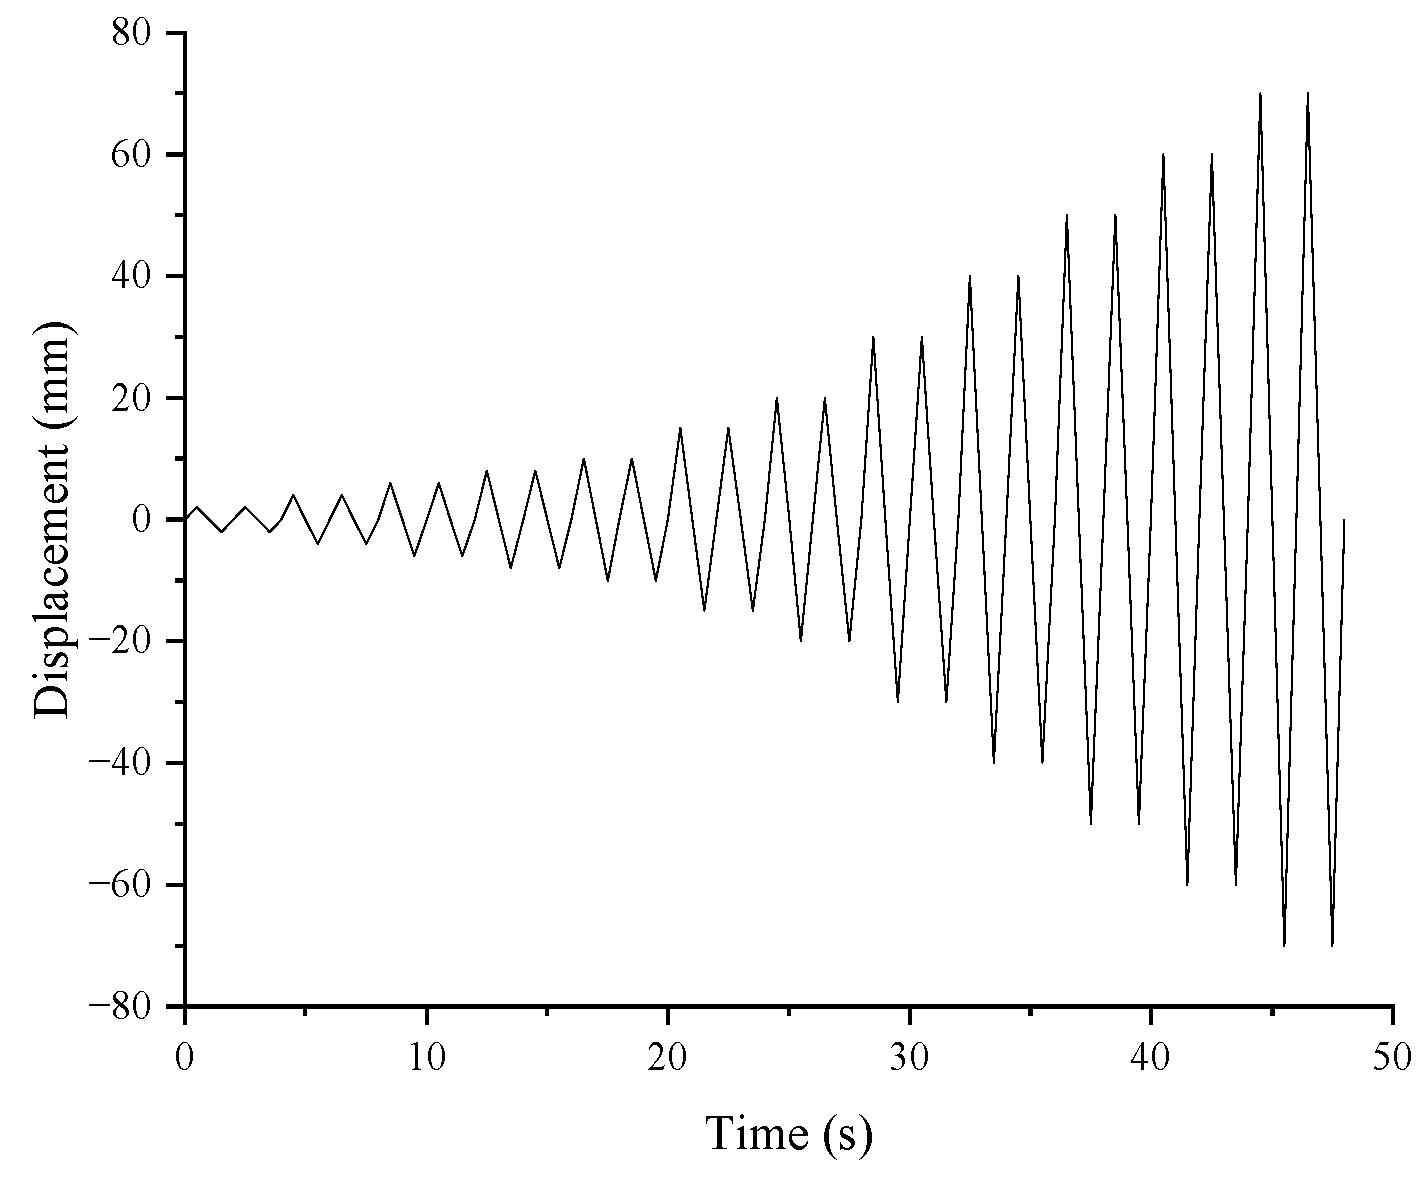
In this study, low-cycle reversed loading simulations of the precast frame joints were conducted using a beam-end displacement angle loading method. To ensure uniform stress distribution at the column top, a constant vertical load corresponding to a design axial compression ratio of 0.2 was applied to the reference point at the column-top loading steel plate. The cyclic loading protocol was applied through displacement angle control under a quasi-static analysis procedure. Loading was applied sequentially at displacement angles of 0.1%, 0.2%, 0.3%, 0.4%, 0.5%, 0.75%, 1.0%, 1.5%, 2.0%, 2.5%, 3.0%, and 3.5%, with two cycles performed at each loading level. The loading protocol curve is illustrated in Figure 11.
Figure 11.
Loading protocol curve.
3.3. Evolution and Discussion of Joint Mechanical Performance
This comparison focuses on the influence of service age on the hysteretic characteristics, load-bearing capacity, stiffness, and energy dissipation capacity under the same joint configuration and loading protocol. Therefore, after completing the joint model validation, the chloride diffusion, reinforcement corrosion, and time-dependent concrete material degradation models established in Section 2 were incorporated into the finite-element analysis to compare the seismic performance of the typical precast frame joint at the selected service ages.
3.3.1. Evolution of Joint Load-Bearing Capacity and Ductility
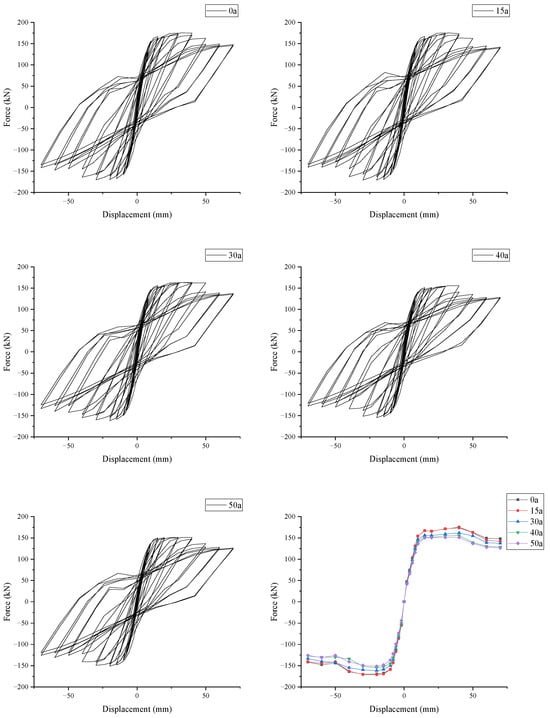
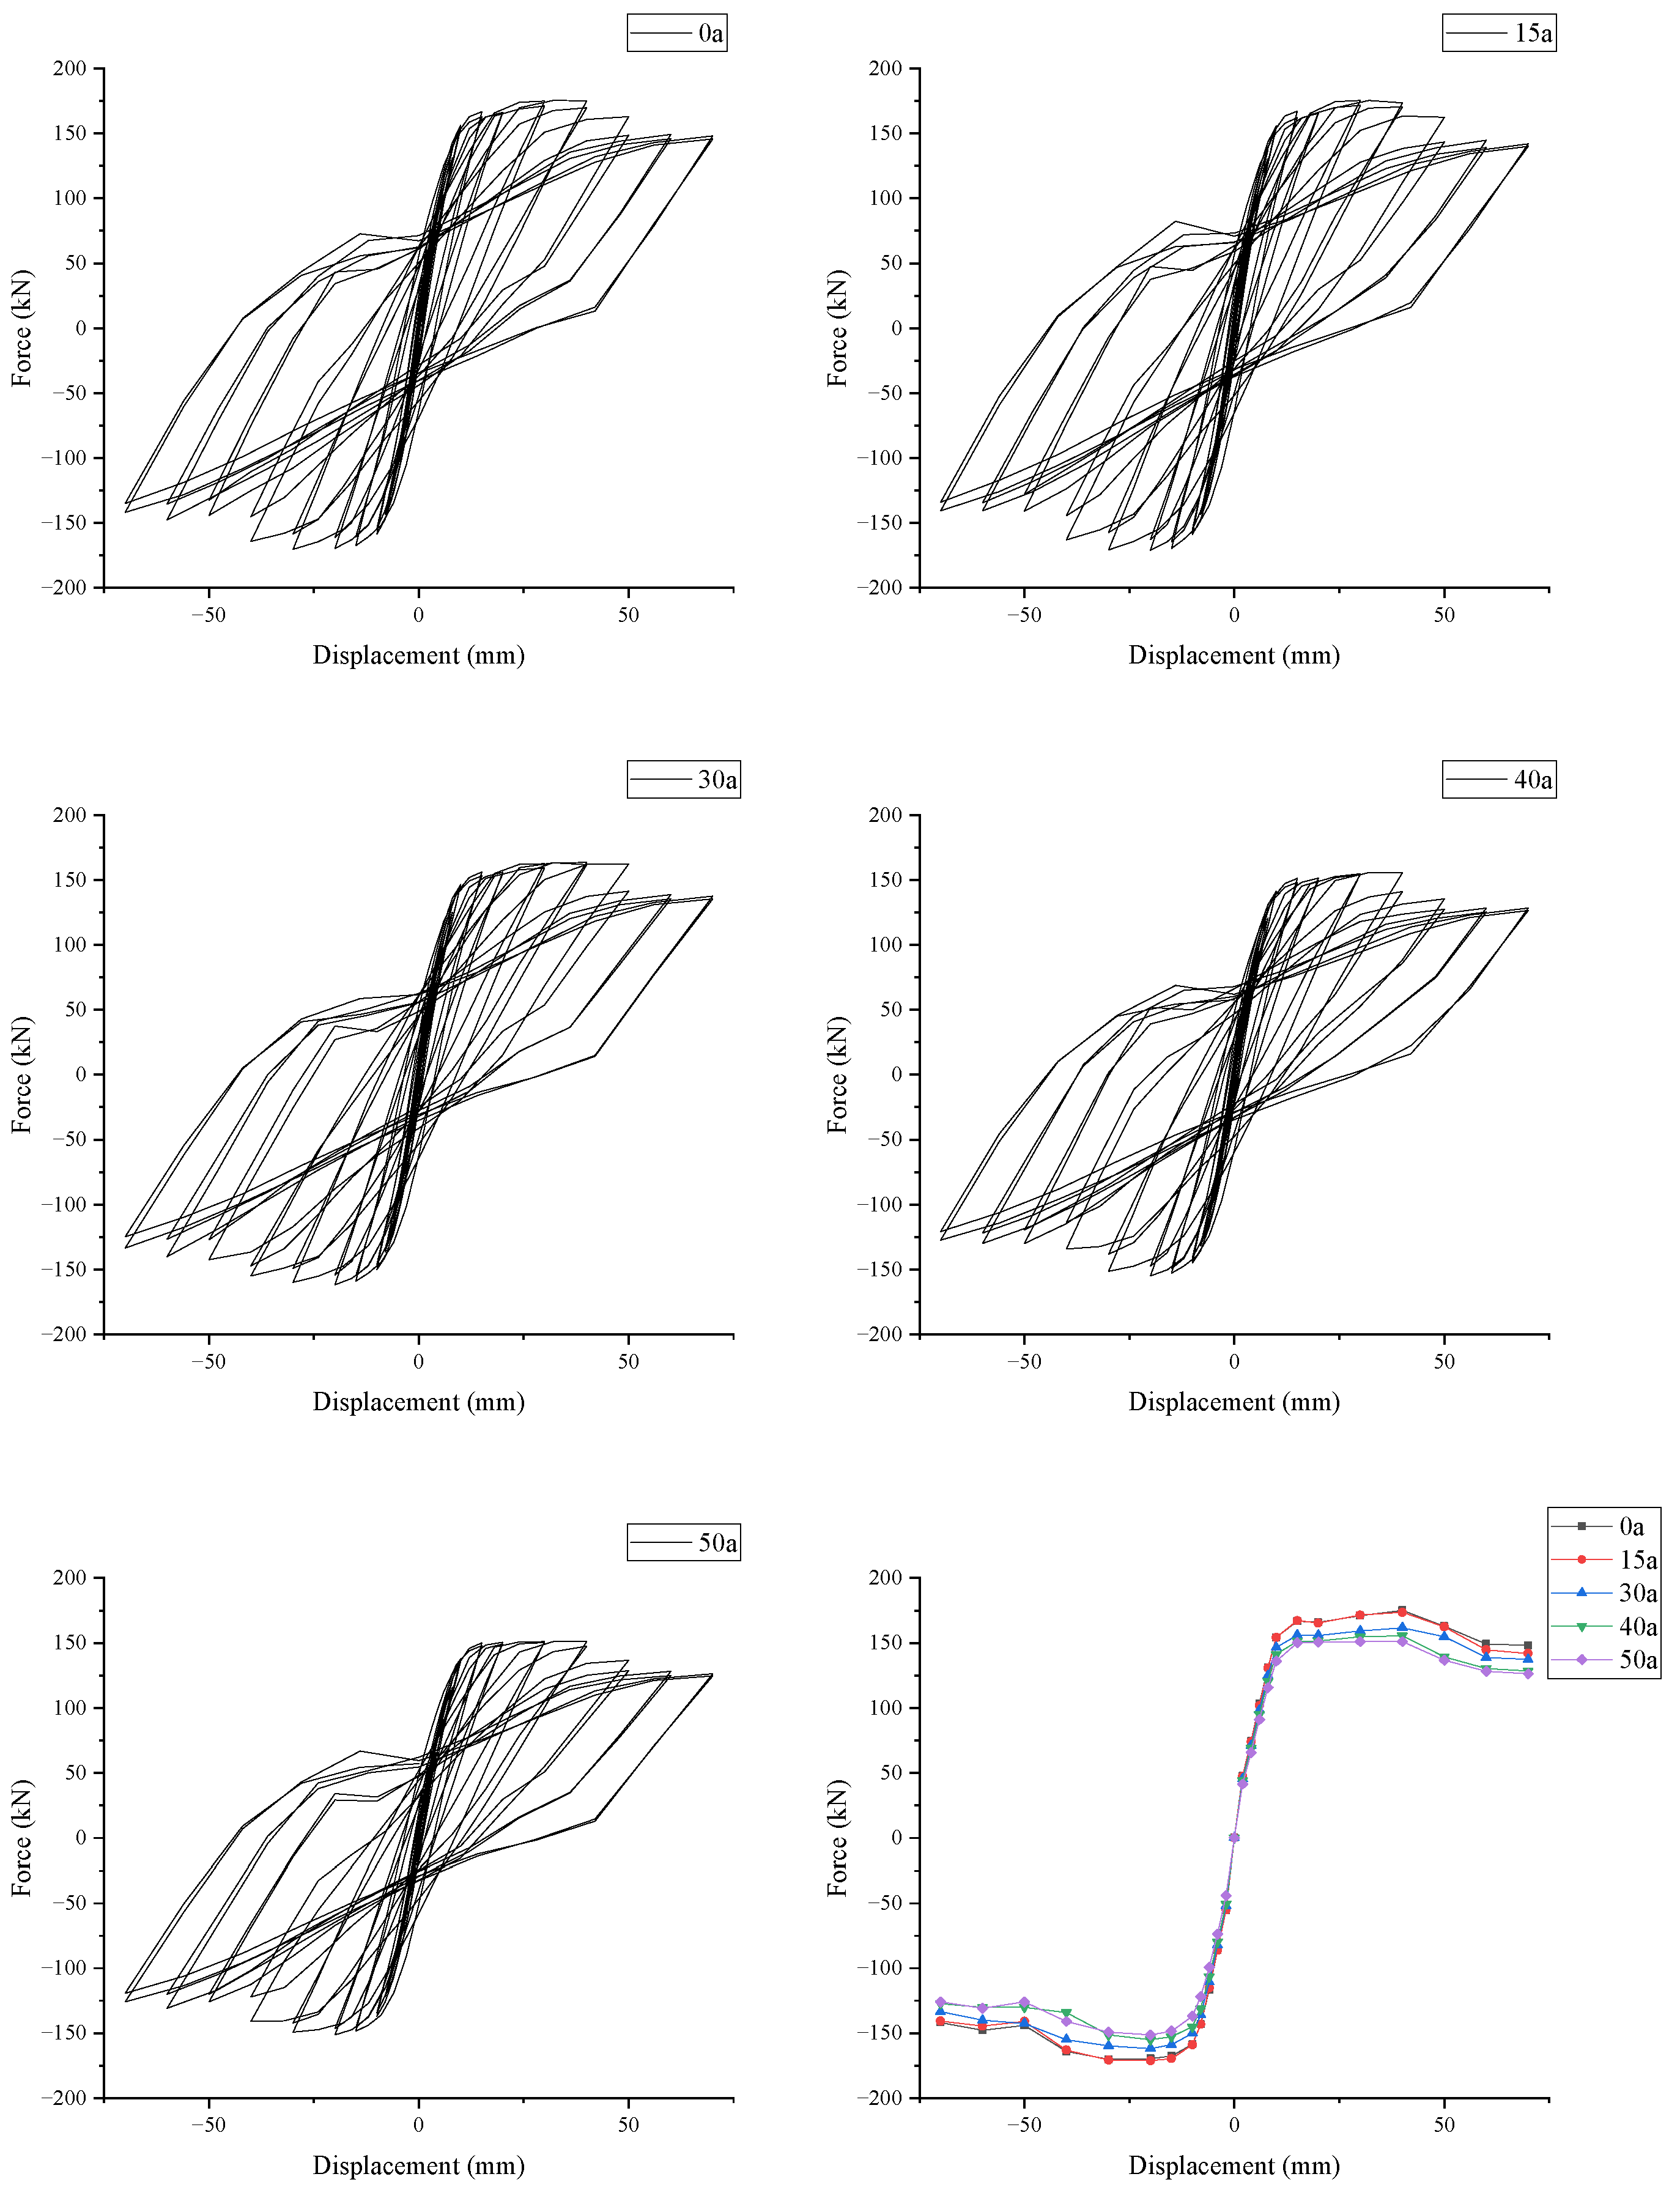
Based on the joints at the different ages established above, the comparison diagrams of the hysteretic and skeleton curves for the precast frame joints are extracted, as shown in Figure 12.
Figure 12.
Hysteretic and skeleton curves of the joint at different ages.
According to the hysteretic and skeleton curves of the joint at different ages, it is evident that the joints at each age exhibit distinct linear elastic characteristics before yielding, indicating that under the parameter settings of this study, the increase in service age does not alter the fundamental working mechanism of the joint during the initial loading stage. However, as the joints enter the post-yielding stage, the service-age effect gradually becomes apparent, where with the increase in displacement amplitude, the loading and unloading stiffnesses continuously decrease, the residual deformation increases, and the pinching phenomenon in the hysteretic curves of the joints with higher ages becomes more pronounced, indicating that corrosion accumulation has a more direct weakening effect on the mechanical coordination capacity of the joint during the non-linear stage. Based on the above analysis, the service-age effect is primarily reflected in the degradation during the non-linear stage rather than the reconstruction of the initial elastic response.
To further quantify the impact of service age on load-bearing and deformation capacities, the R-Park method [39] was employed in this study to determine the joint yield point, with the displacement corresponding to 85% of the peak load defined as the ultimate displacement; the results are presented in Table 17. From the data in the table, it can be observed that, compared to the initial state, both the peak load-bearing capacity and the ultimate load-bearing capacity of the joint decrease by only approximately 0.89% at 15 a, indicating that the load-bearing capacity of the joint has not undergone significant attenuation during the early stage of corrosion. For the later service-age cases of 30 a, 40 a, and 50 a, the peak load-bearing capacities decrease by 7.36%, 11.11%, and 13.68%, respectively, while the corresponding ultimate load-bearing capacities decrease by 7.37%, 11.11%, and 13.67%. These results indicate a progressively increasing deterioration tendency within the analyzed service-age sequence, but they should not be interpreted as identifying an exact transition point because only five discrete service ages are considered in this study. Simultaneously, the yield displacement of the joint increases with service age, reflecting the gradual reduction in stiffness and deformation-control capacity caused by chloride-induced corrosion.
Table 17.
Ductility indicators of the joint at different ages.
In the table, represents the peak load sustained by the joint; is the corresponding displacement at the peak load; is the ultimate load of the joint, defined as ; is the corresponding displacement at the ultimate load; is the yield displacement of the joint; and is the ductility coefficient of the joint, defined as .
Table 18 summarizes the variations in key seismic performance indicators of the joint with service age, showing that different seismic performance indicators exhibit different relative degradation levels under the adopted exposure scenario. It can be observed that the peak and ultimate load-bearing capacities show only limited changes at 15 a, whereas the yield displacement has already begun to increase. At the later service ages included in the calculation sequence, the degradation tendencies of load-bearing capacity, ductility, and deformation capacity become more evident. The reduction in the ductility coefficient is larger than that of the peak load-bearing capacity, indicating that deformation-related indicators reflect corrosion-induced seismic performance deterioration more prominently than strength indicators in the analyzed case.
Table 18.
Summary of relative changes in key indicators.
The reasons for the aforementioned phenomena are as follows. In the initial stage of corrosion, the corrosion products on the reinforcement surface exert a certain filling effect on local pores and interfacial gaps, and the concrete material strength has not undergone significant deterioration; thus, the overall load-bearing level of the joint remains relatively stable. However, as corrosion progresses further, the reduction in reinforcement cross-sections, the cracking and spalling of the cover, and the degradation of interfacial bonding begin to collectively dominate the mechanical behavior of the joint, leading to larger flexible deformations and more pronounced slip effects even at lower load levels, with the yield point gradually shifting backward and ductility continuously declining. From an engineering perspective, this implies that, when evaluating the seismic performance of offshore precast joints during their service life, safety reserves should not be judged solely based on peak load-bearing capacity; instead, emphasis should be placed on the attenuation of ductility and deformation capacity, as the latter two are more likely to first expose the adverse effects of corrosion accumulation.
3.3.2. Strength and Stiffness Degradation of the Joint
This study employs the strength degradation coefficient to characterize the deterioration of the joint’s load-bearing capacity and utilizes secant stiffness to reflect the attenuation of the joint’s deformation control capability under cyclic loading, namely the stiffness degradation.
The expression for the strength degradation coefficient is shown in Equation (26):
where represents the strength degradation coefficient of the joint under the -th loading level; and denotes the maximum load under the -th loading level.
The expression for secant stiffness is shown in Equation (27):
where represents the secant stiffness of the joint under the -th loading level; and denote the maximum loads in the positive and negative directions under the -th loading level, respectively; and and are the maximum displacements corresponding to and .
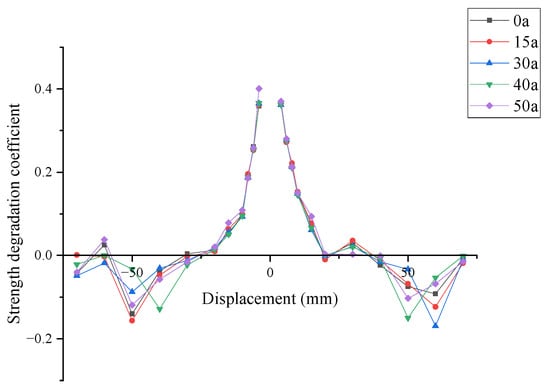
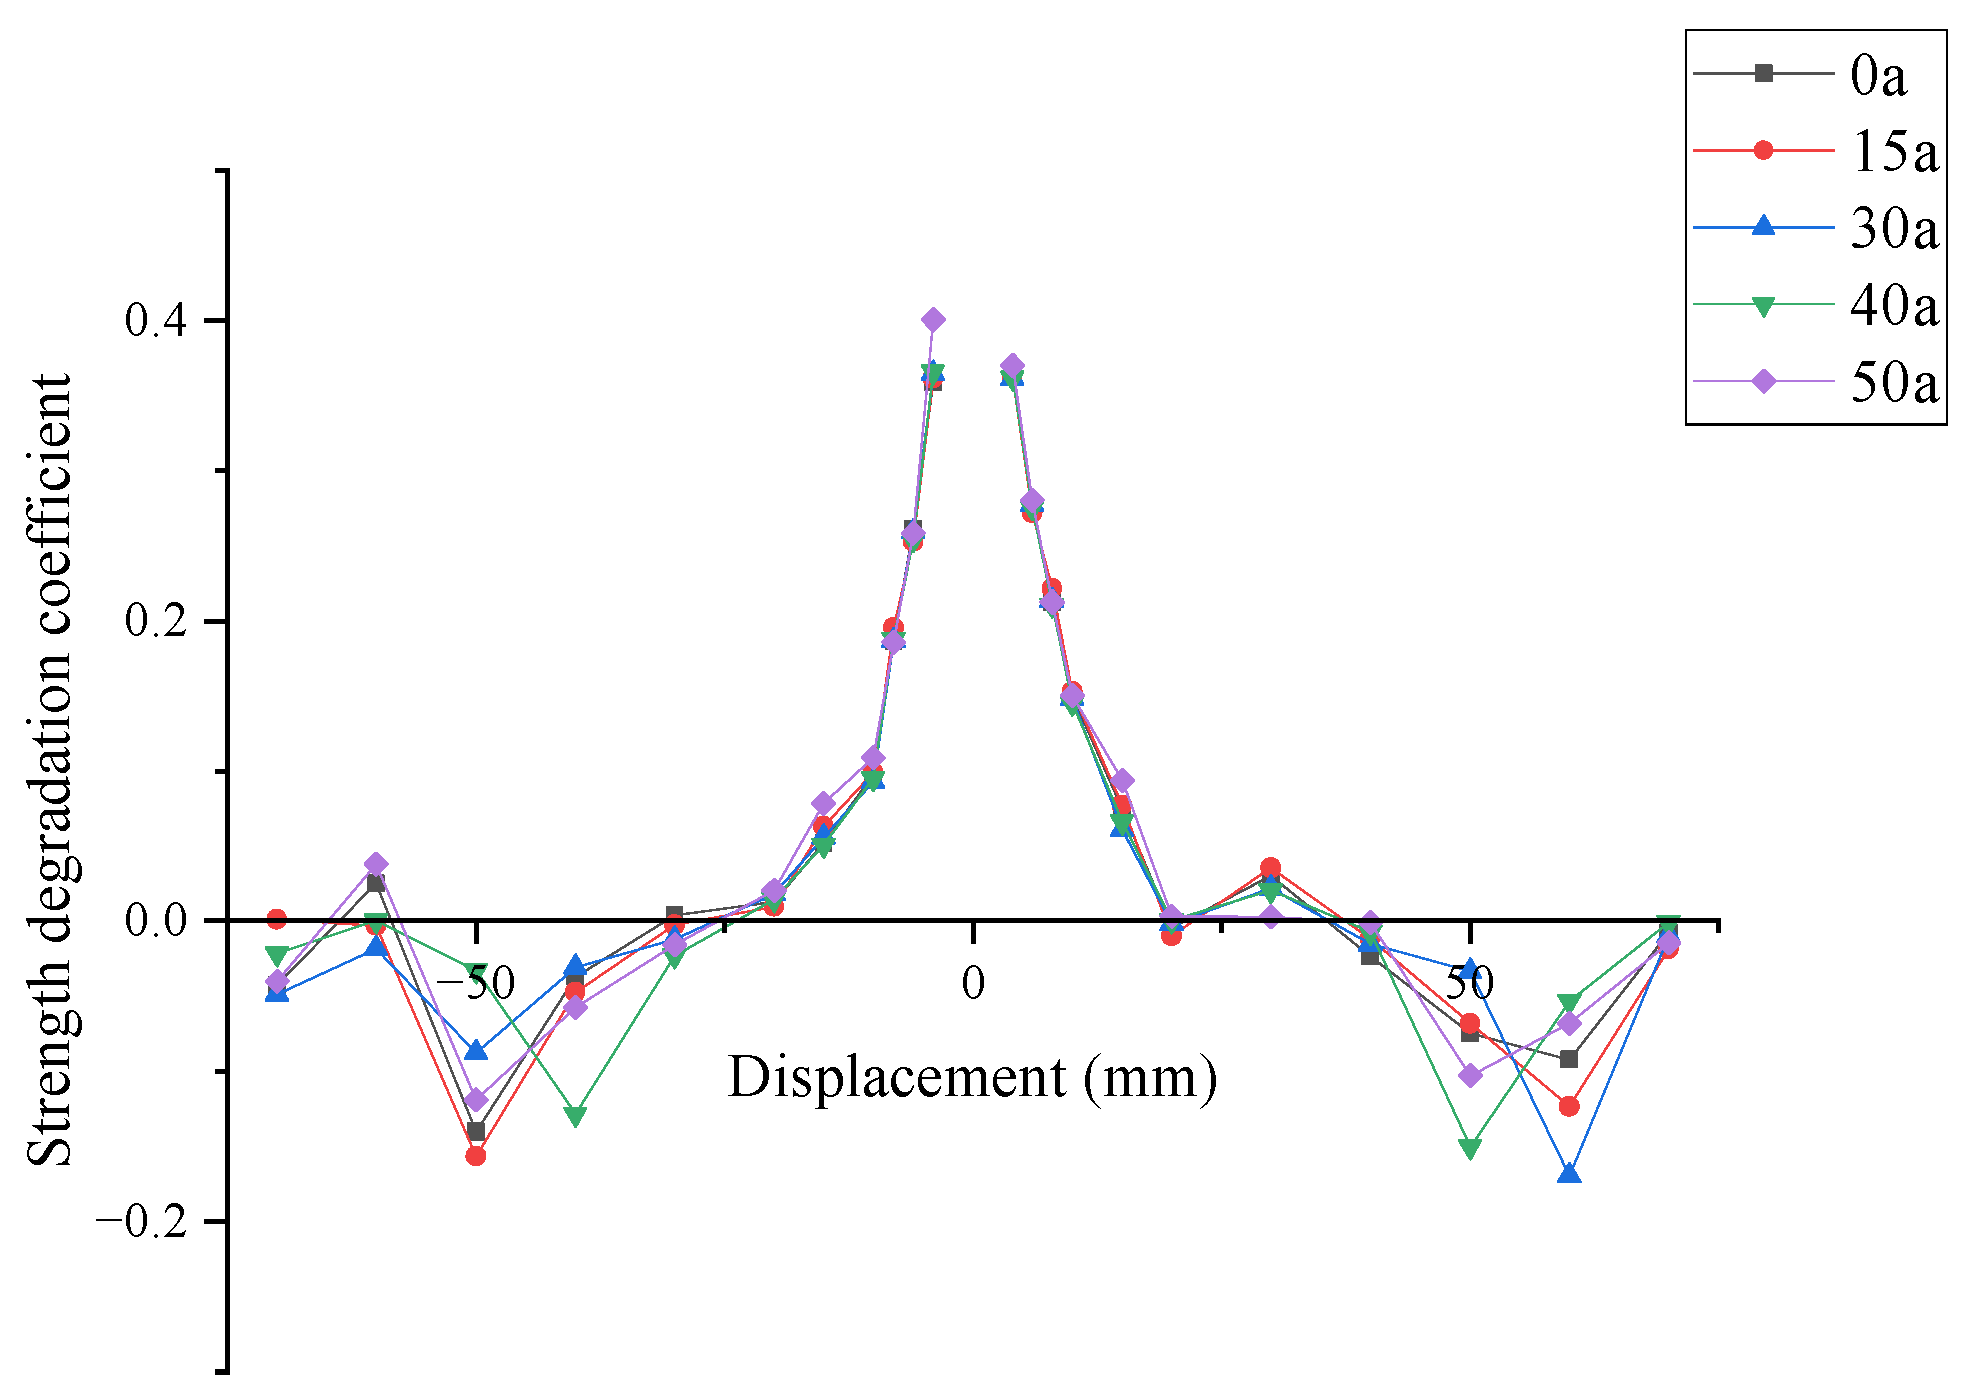
As observed from the strength degradation coefficient curves in Figure 13, the overall morphology of the curves for the joints at different ages is relatively similar, all exhibiting a trend of an initial rapid decline followed by localized fluctuations in the large displacement stage as the displacement amplitude increases. This indicates that within the age range established in this study, the damage caused by chloride corrosion does not alter the fundamental failure mode of the joint, but primarily manifests the service-age effect by weakening its load-bearing reserves at the same loading stage. Particularly, when the beam-end displacement amplitude approaches 30 mm, the strength degradation factors of the joints at all ages transition from positive to negative values, indicating that the joints reach their peak load-bearing state near this loading level.
Figure 13.
Strength degradation coefficient curves of the joint.
Furthermore, Figure 13 also shows that when the displacement amplitude further increases to approximately 60 mm, some curves exhibit a brief recovery. However, this phenomenon should not be interpreted as a restoration of the joint’s seismic performance; a more plausible explanation is that in the post-peak stage, the crushing and spalling of the concrete cover have become significant, and the internal force transmission mechanism of the joint gradually shifts from combined concrete-reinforcement resistance to a state dominated by reinforcement hardening and localized internal force redistribution. Consequently, phased fluctuations are manifested in the macroscopic load–displacement relationship. This phenomenon essentially remains part of the post-peak failure process, indicating a transition in the source of the joint’s resistance at high displacement levels rather than a genuine improvement in structural performance.
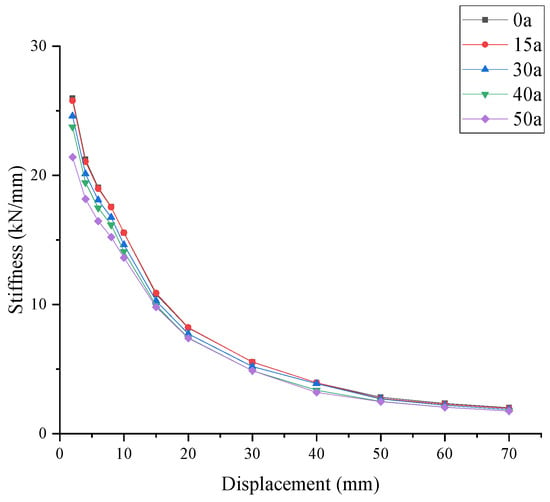
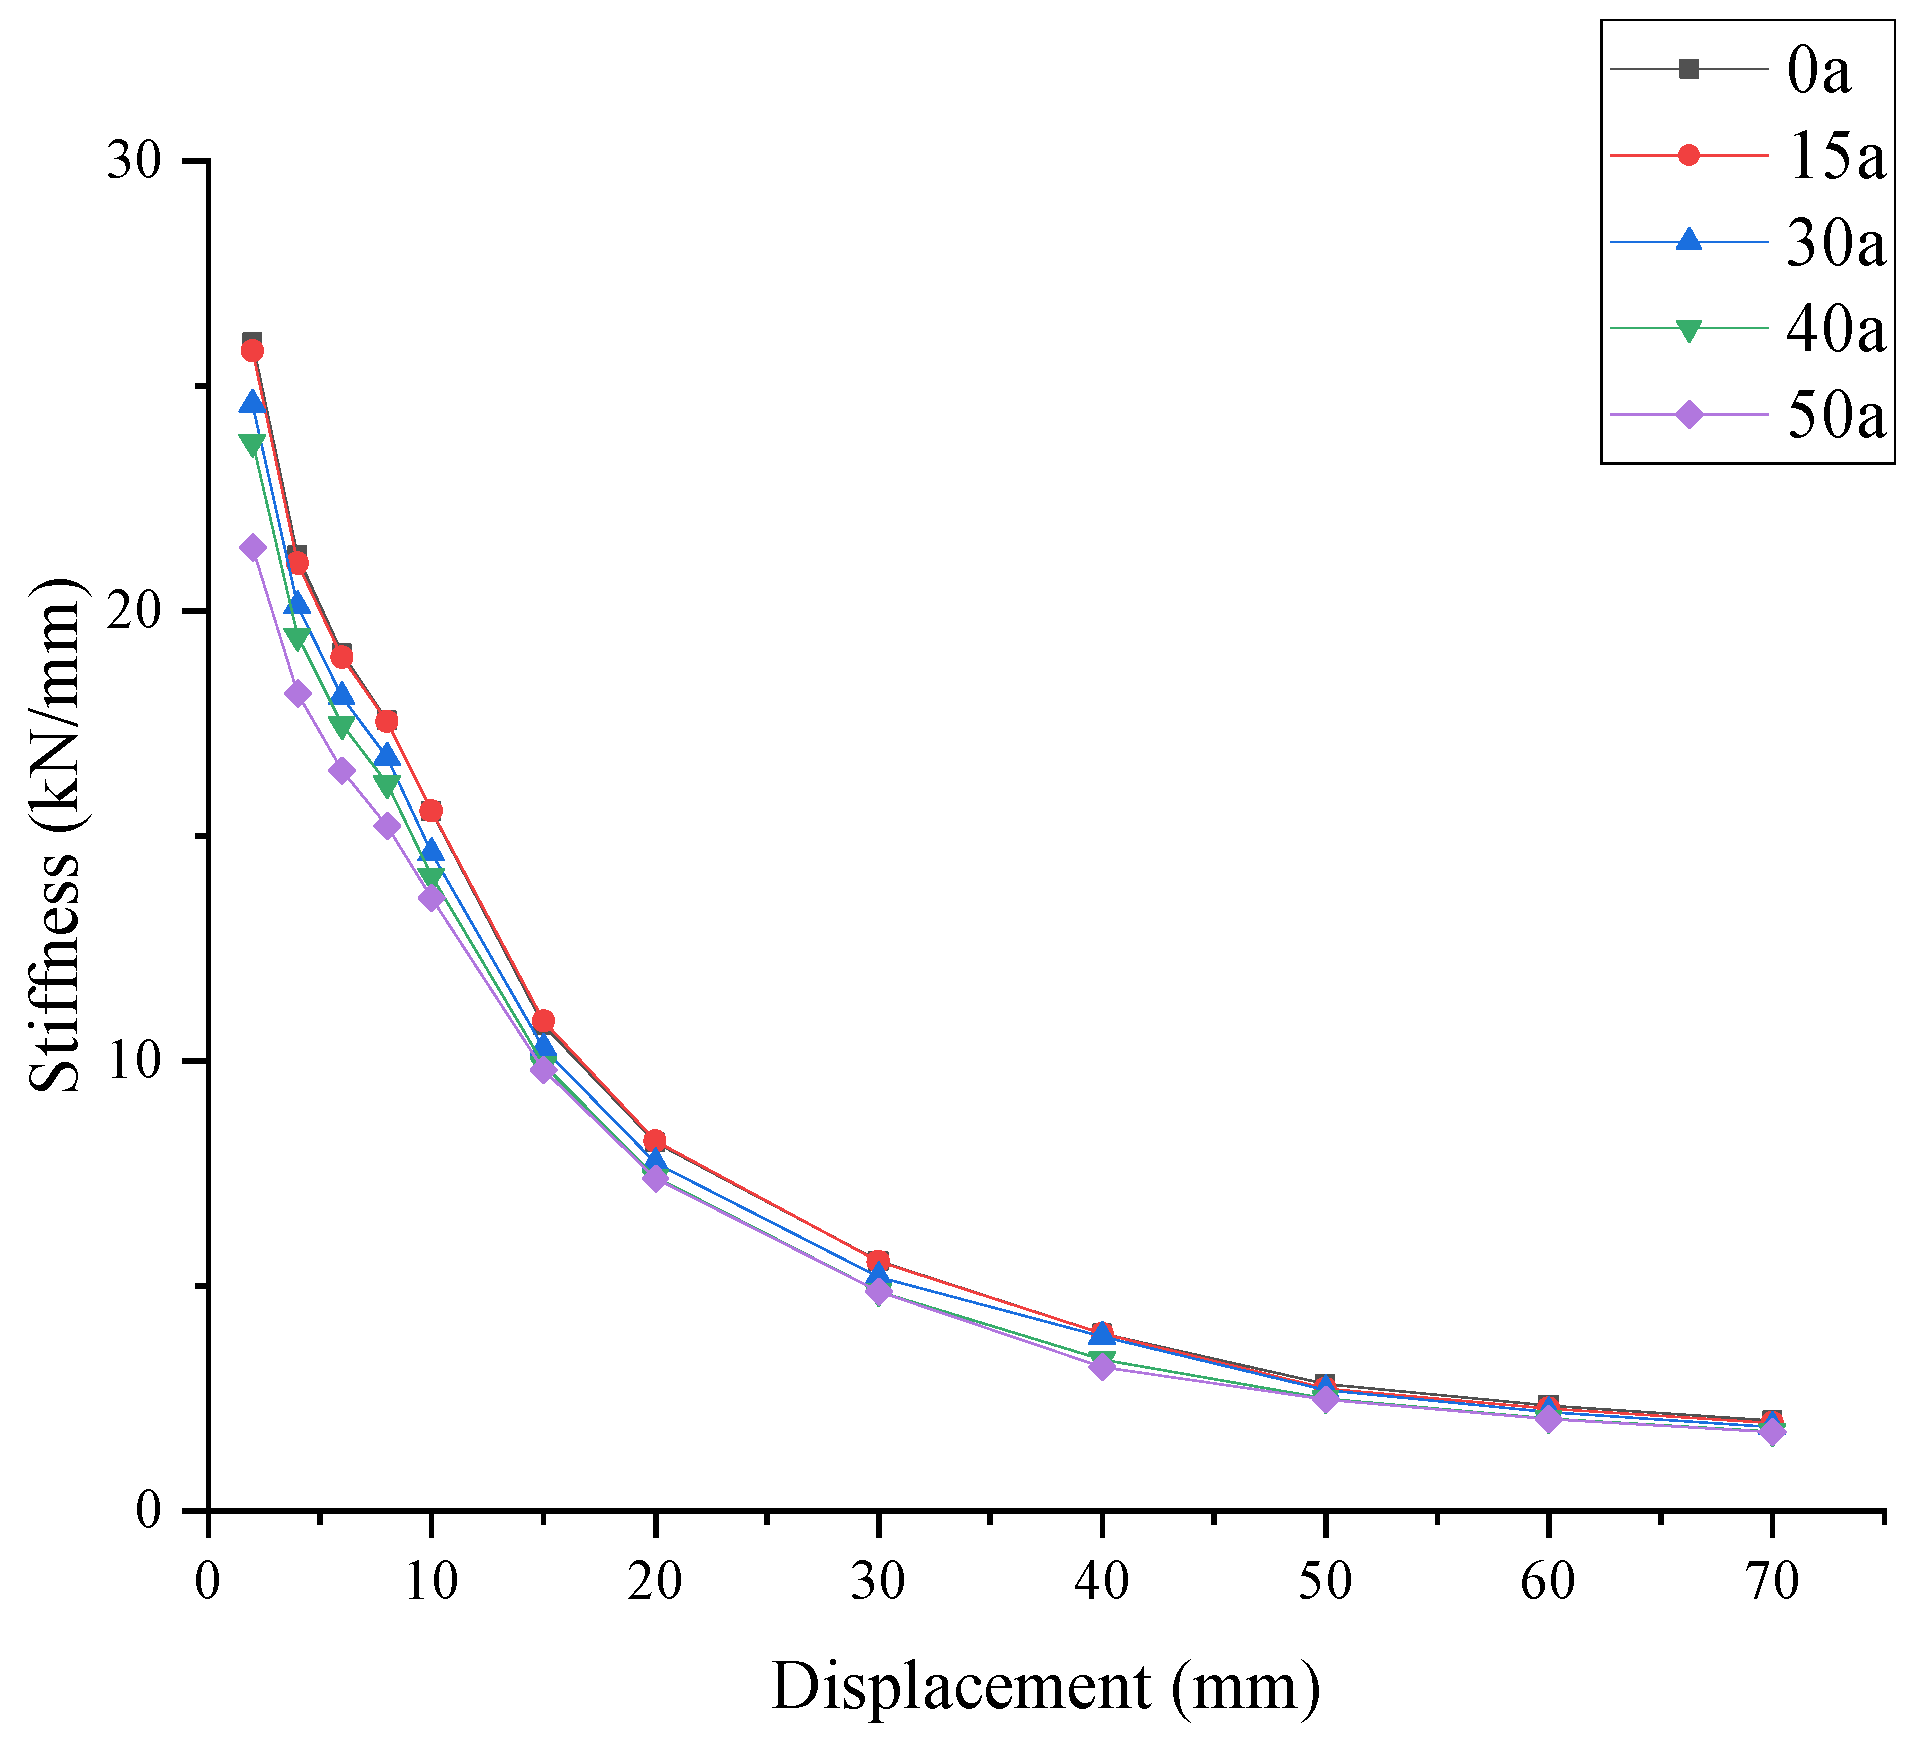
From the stiffness degradation curves in Figure 14, it is evident that the joints at all ages possess high initial stiffness during the early loading stages; as the displacement amplitude increases, the concrete cover progressively cracks, and the joint stiffness declines rapidly. After yielding, the rate of stiffness degradation slows down and gradually stabilizes after the peak stage. The variation patterns of the curves for joints at different ages are generally consistent, but the stiffness levels of joints with higher ages are lower overall, with the disparity becoming more pronounced particularly in the post-yielding stage. Notably, the stiffness of the joint at 15 a shows almost no significant attenuation compared to the initial state, which corroborates the previously mentioned result of minimal changes in the load-bearing capacity. The reason lies in the fact that, in the early stages of corrosion development, the concrete strength remains at a relatively high level, and the reinforcement corrosion products partially fill the voids between the steel bars and the surrounding concrete, enhancing localized mechanical interlocking and thereby maintaining the overall joint stiffness at a level similar to the initial state.
Figure 14.
Stiffness degradation curves of the joint.
With increasing service age, the localized filling effect is gradually offset by cover spalling, interface bond deterioration, and rebar section loss, leading to a more evident decline in stiffness in the later service-age cases. The reduction in stiffness also implies a simultaneous decrease in lateral resistance, crack control capability, and deformation control capacity under seismic actions. Under the specific material and chloride exposure parameters adopted in this case study, the results indicate a progressively increasing stiffness deterioration tendency within the analyzed service-age sequence. Because the present numerical investigation considers only five discrete ages, this trend should not be interpreted as a definitive transition threshold.
3.3.3. Evolution of Energy Dissipation Capacity of the Joint
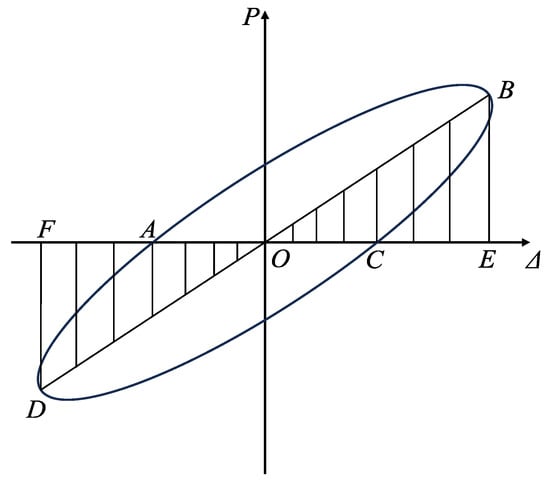
According to the relevant provisions on hysteretic energy dissipation evaluation in the specification for seismic test of buildings [40], this study utilizes the equivalent viscous damping coefficient to characterize the energy dissipation capacity of precast frame joints under cyclic loading. This indicator, together with load-bearing capacity, stiffness, and ductility, constitutes a multi-indicator evaluation framework for the seismic performance of joints during their service life. Its specific definition is shown in Equation (27).
In the formula, represents the energy dissipation coefficient, defined as the ratio of the total energy of a single hysteretic loop of the specimen under beam-end loading to its elastic performance, as shown in the following equation:
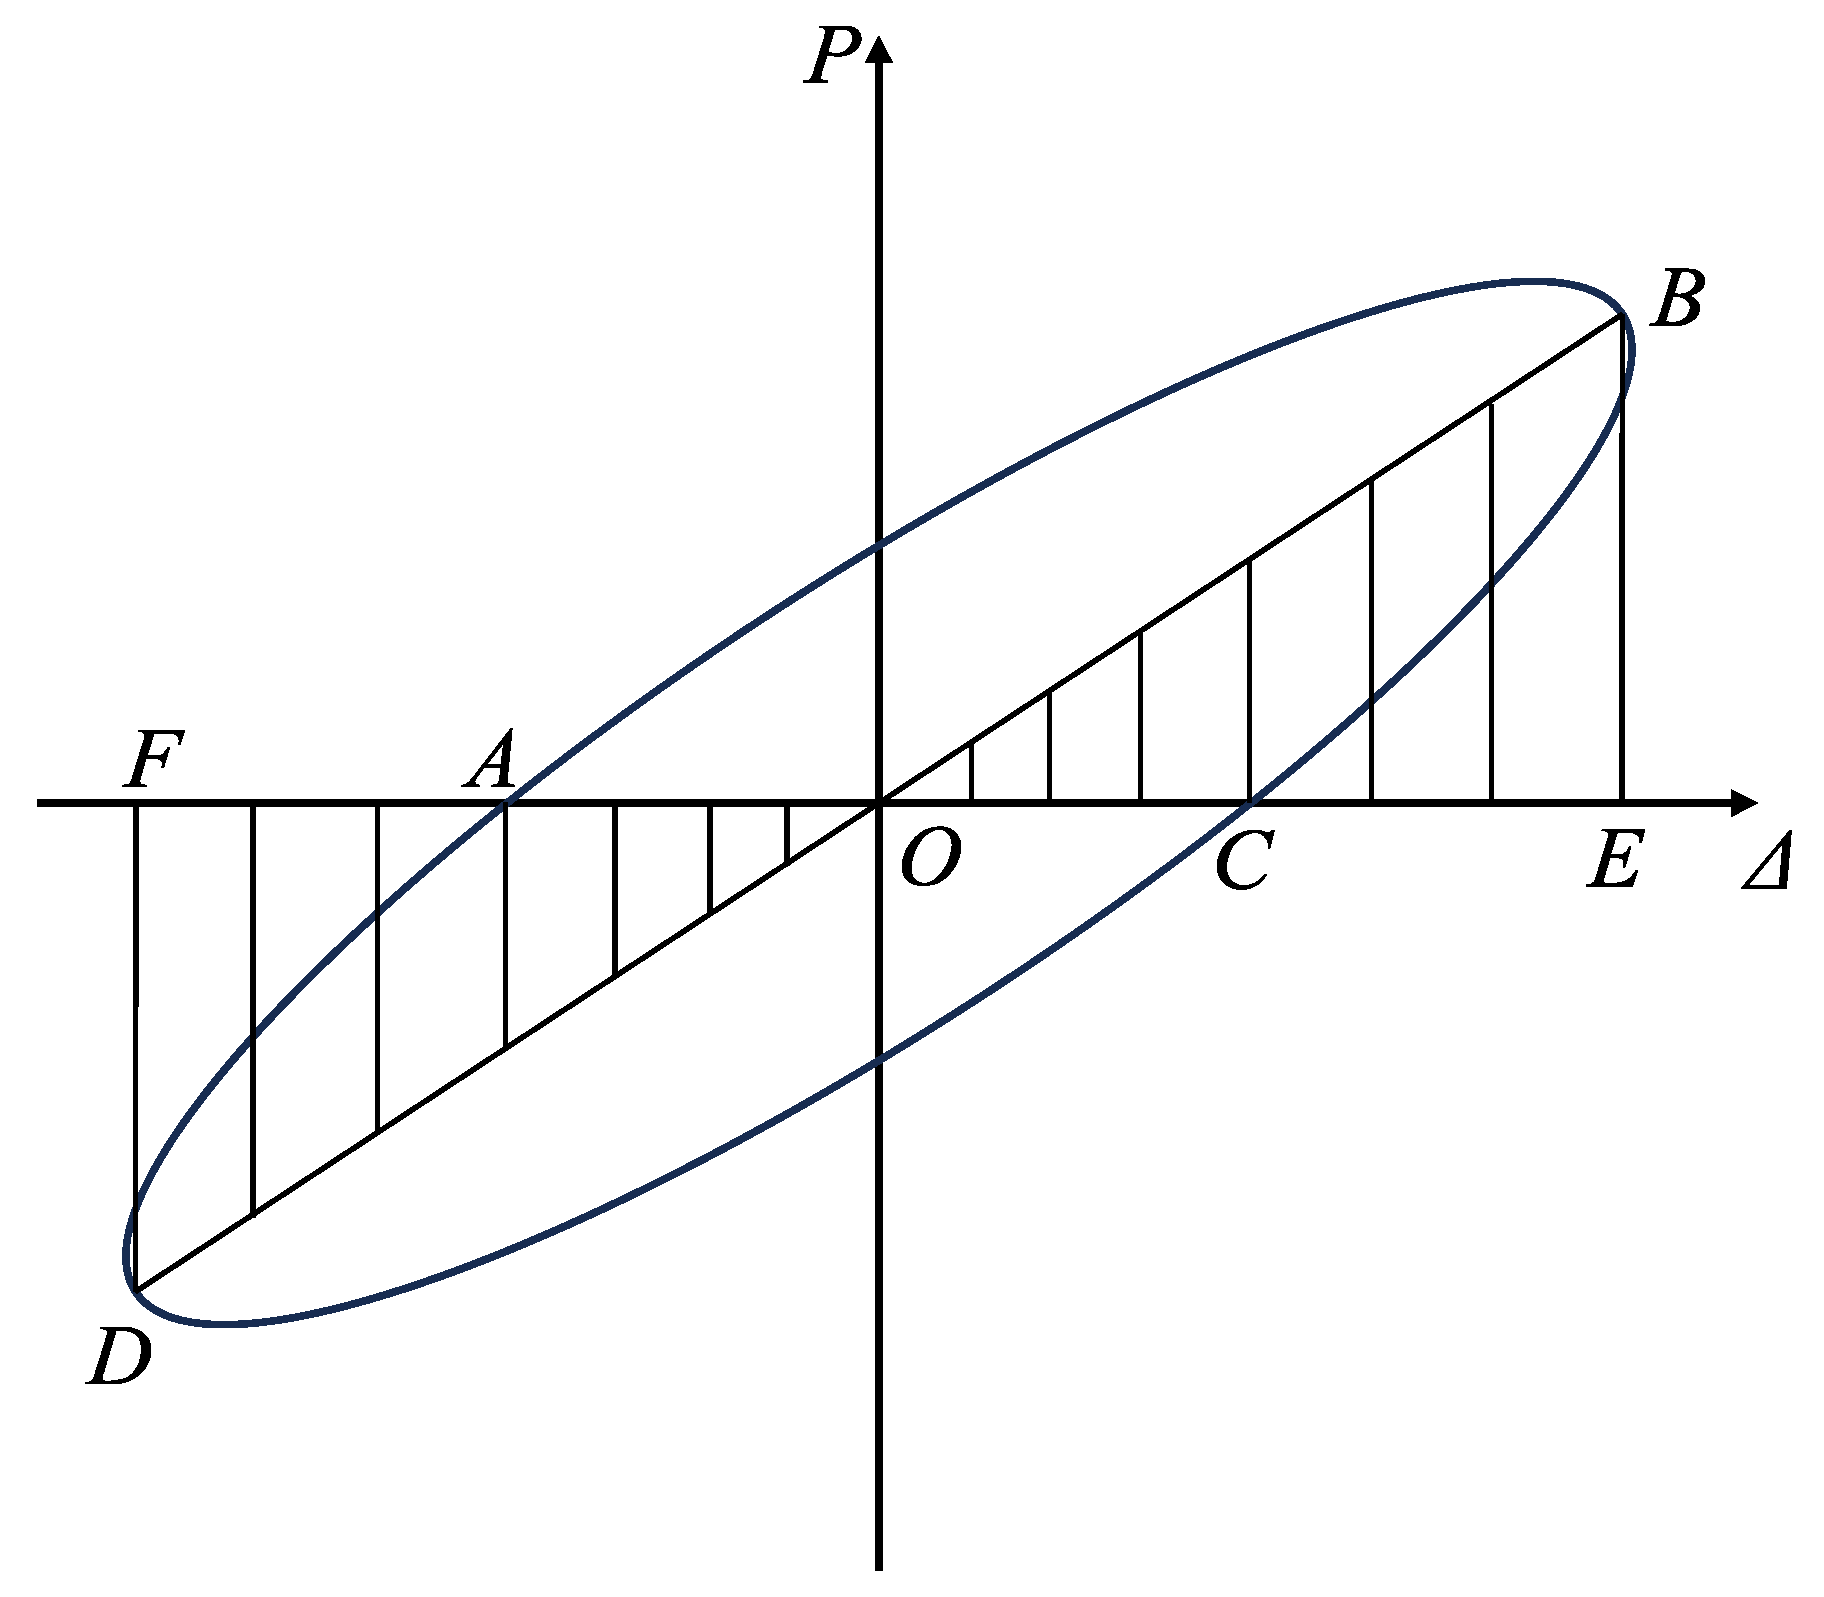
In this formula, denotes the full area of the specimen under one hysteretic loop; and represents the elastic performance of the specimen. The specific mathematical definition is illustrated in Figure 15.
Figure 15.
Schematic diagram for the equivalent viscous damping coefficient.
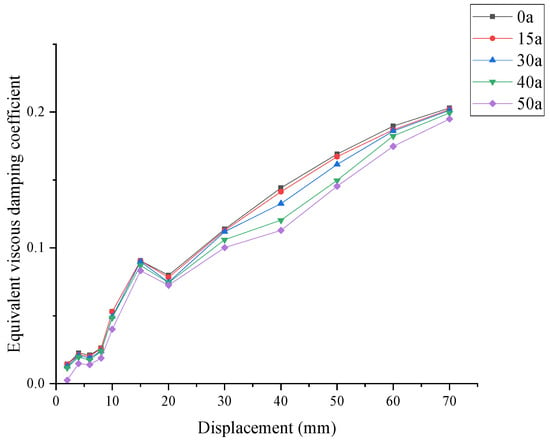
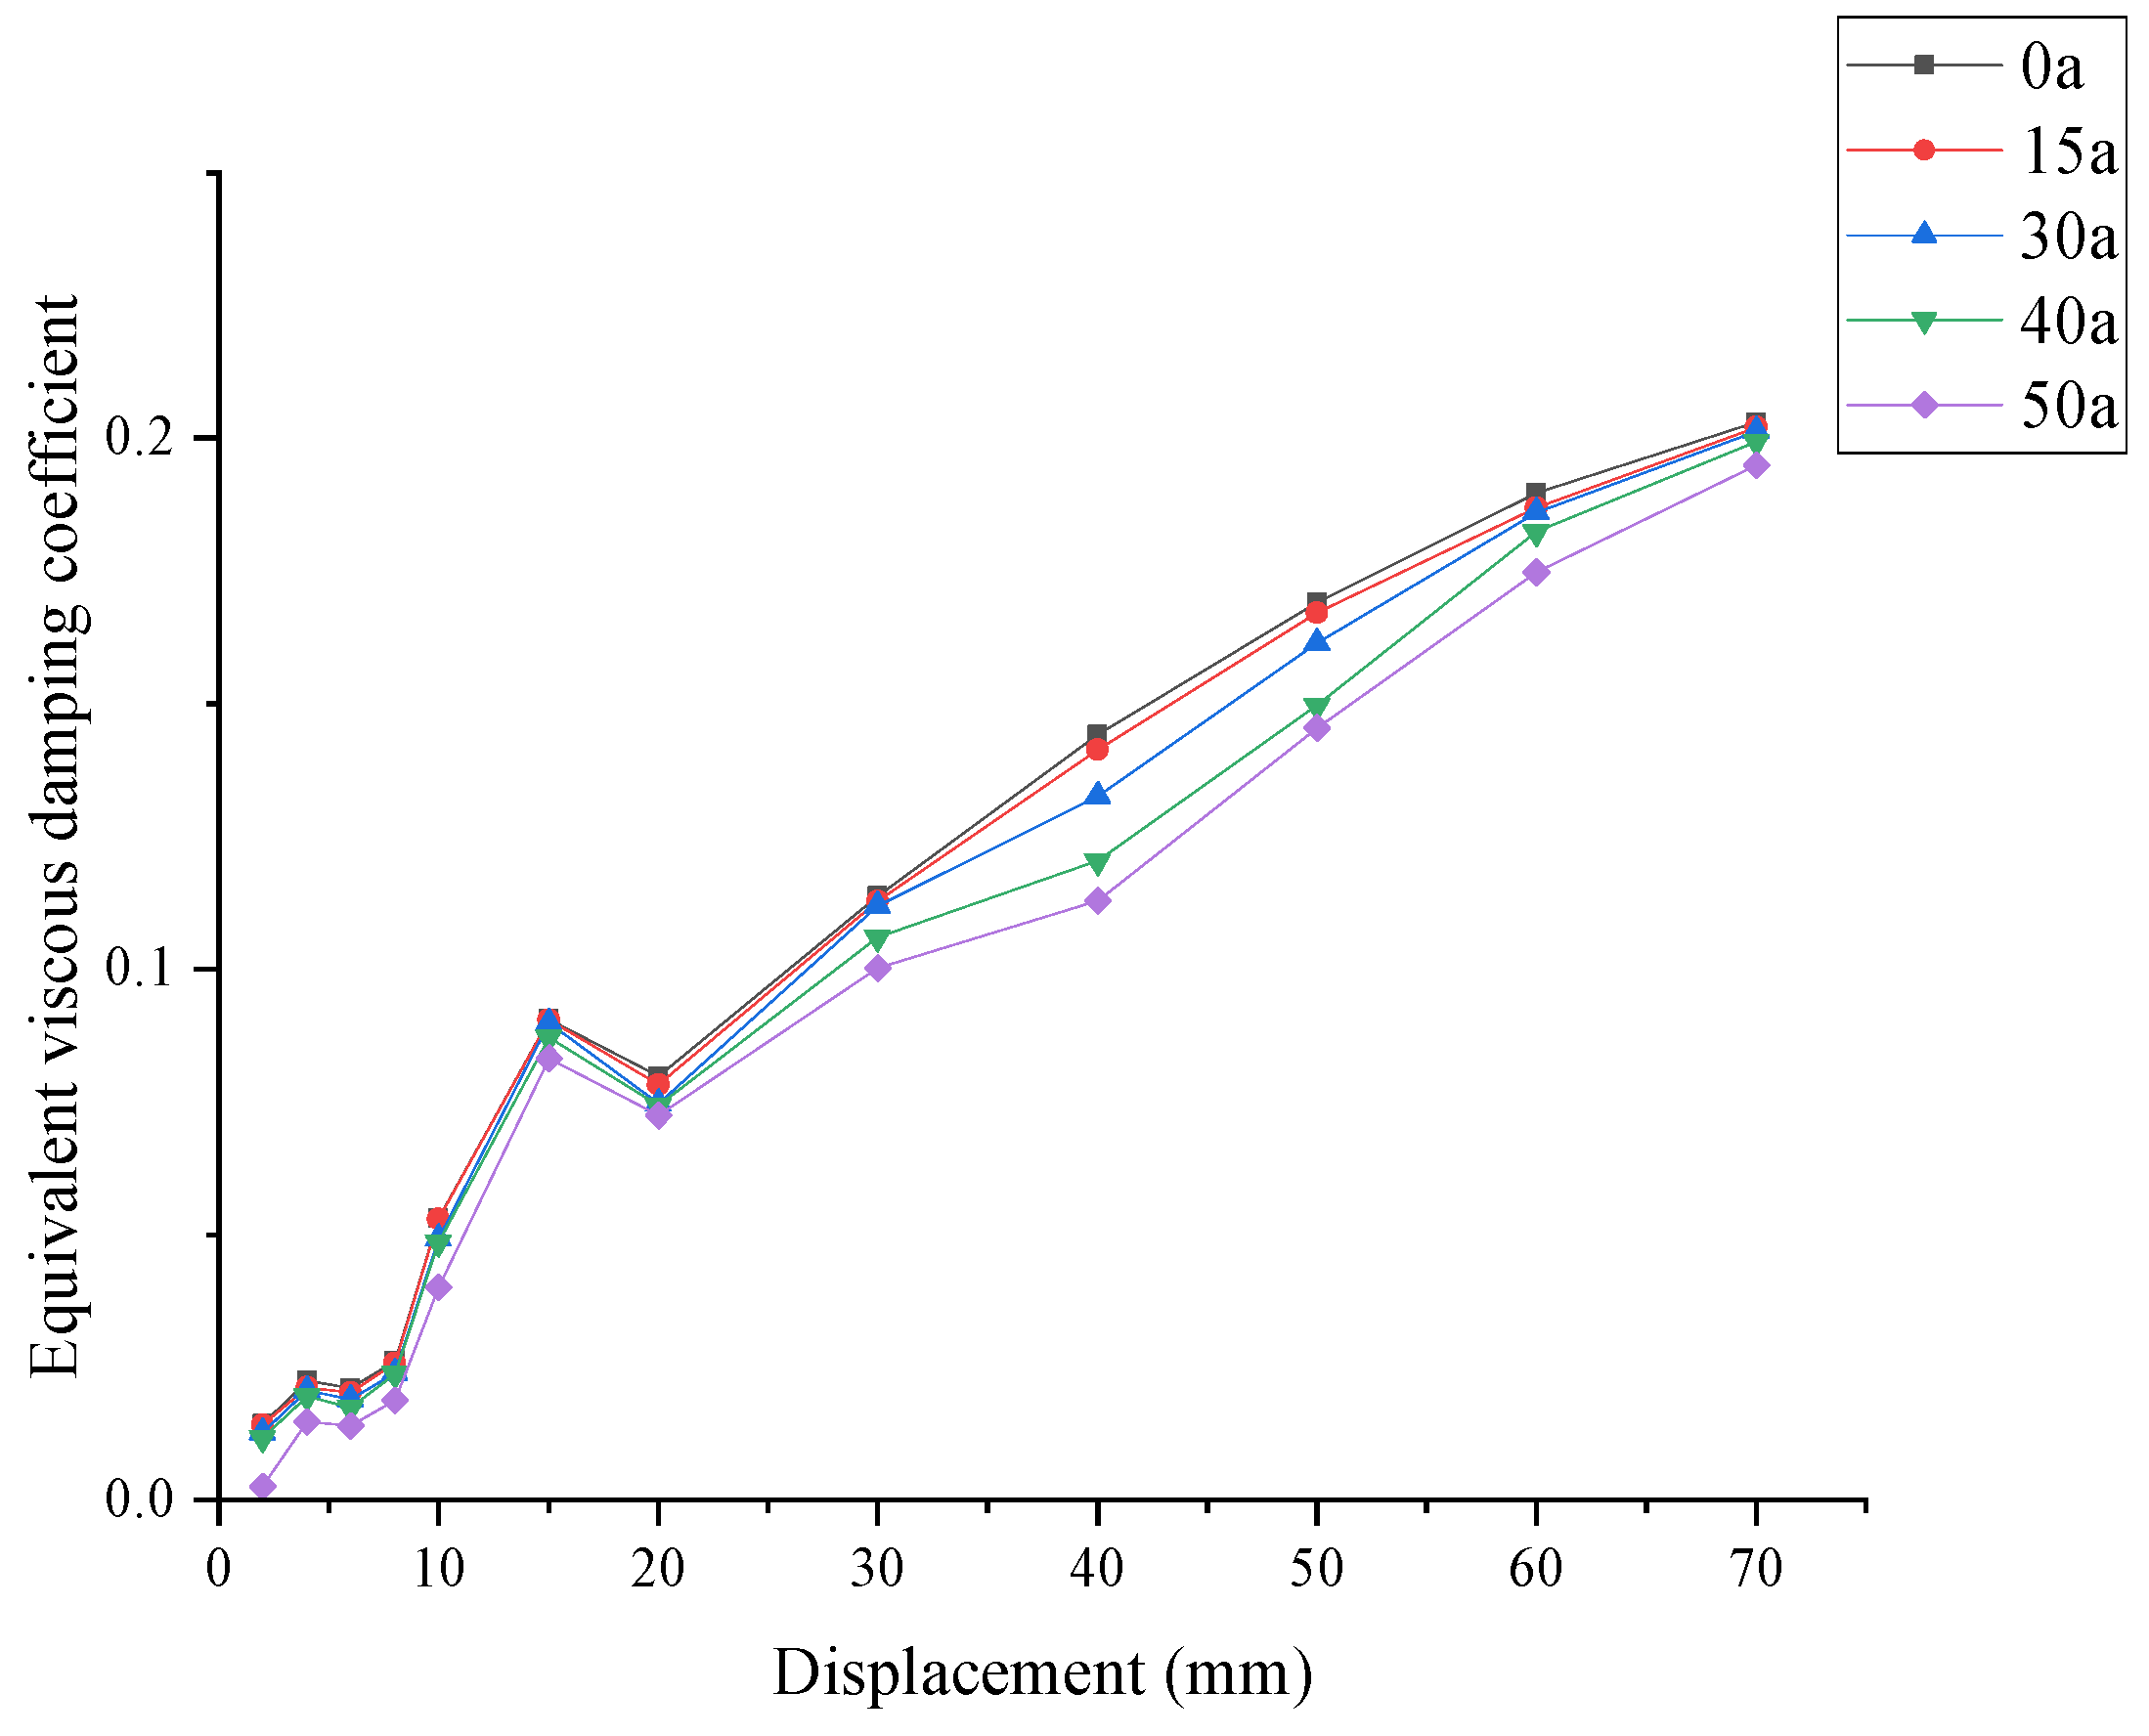
Analyzing Figure 16, it is noteworthy that within the displacement range from 15 mm to 20 mm, the equivalent viscous damping coefficients of the joints at all ages exhibit a certain degree of decline. Correlating this with the skeleton and hysteretic curves, this stage corresponds to the process where the main cracks in the joint core zone have basically penetrated, and the growth of load-bearing capacity slows down with slight fluctuations. However, this phenomenon does not imply the disappearance of the joint’s energy dissipation mechanism; although the displacement continues to increase, the expansion of the hysteretic loop area is restricted by the pinching effect and localized slip. This leads to a phased decrease in the numerical value of the equivalent viscous damping coefficient, reflecting the weakening of internal mechanical coordination as the joint transitions from a stable elastoplastic development stage to a more pronounced damage evolution stage.
Figure 16.
Comparison of the joint’s equivalent viscous damping coefficients.
Regarding the influence of service age, as the service time increases, the equivalent viscous damping coefficient of the joint at the same displacement loading level decreases overall. This indicates that time-dependent material degradation, interfacial damage accumulation, and the weakening of the collaborative working capacity between reinforcement and concrete collectively lead to the decline in the joint’s energy dissipation capacity. Further analysis combined with the results in Table 8 reveals that by 50 a, the peak load-bearing capacity of the joint decreases by approximately 13.68%, while the ductility coefficient drops by approximately 37.40%. This indicates that ductility and energy-dissipation-related indicators exhibit larger relative reductions than load-bearing capacity in the analyzed case. In the late service stage, the joint may still retain a certain load-bearing reserve, but its capacity to dissipate energy through plastic deformation under repeated seismic actions has already been significantly weakened.
As shown by the results, the joint gradually transitions from the elastic stage to the elastoplastic stage during the loading process, with the hysteretic loop area increasing accordingly; from the overall trend, the energy dissipation capacity of the component is continuously enhanced. Furthermore, the variation patterns of the joints at different ages are basically consistent, indicating that the increase in service age does not alter the fundamental process of energy dissipation evolution of the joint, although it significantly affects the energy dissipation level at the same loading stage.
This result possesses significant engineering implications. From the perspective of evaluation methods, for precast frame joints in coastal atmospheric environments, relying solely on load-bearing capacity as the core indicator may underestimate the degree of performance degradation in the late service stages. In contrast, incorporating stiffness, ductility, and energy dissipation capacity into the service-life assessment can better reflect the actual working state of the joint under seismic actions, and is more conducive to identifying potential risk joints whose strength remains acceptable but whose actual seismic performance has significantly declined.
3.3.4. Degradation Mechanism and Engineering Implications
Synthesizing the above analysis, we found that the performance degradation of typical precast frame joints in coastal atmospheric environments was not the result of a single material strength decline. Instead, it is a progressive process driven by the development of reinforcement corrosion induced by chloride ion ingress, the accumulation of damage at the new-to-old concrete interface, and the weakening of the joint’s mechanical coordination. Its fundamental mechanism can be summarized as follows. Following the continuous ingress of chloride ions along the concrete cover and the new-to-old concrete interface, the reinforcement gradually undergoes corrosion and generates rust expansion effects. In the initial stage of corrosion, the corrosion products exert a certain filling effect on local pores; thus, the changes in the load-bearing capacity and stiffness of the joint are not yet significant; however, with the accumulation of corrosion, concrete cover cracking and spalling, reinforcement cross-sectional reduction, and enhanced bond–slip begin to dominate, leading to an intensified pinching effect in the hysteretic curves of the joint and a marked decline in stiffness, ductility, and energy dissipation capacity.
From the perspective of relative indicator degradation, the peak load-bearing capacity decreases by approximately 13.68% at a service life of 50 a, while the ductility coefficient drops by approximately 37.40%. This indicates that, compared with strength indicators, ductility and energy-dissipation-related indicators reflect the adverse effects of corrosion accumulation on the seismic performance of the joint more prominently in the analyzed case. Therefore, in the service-life management of offshore precast structures, relying solely on load-bearing capacity evaluation may underestimate the risk of seismic performance deterioration in the later stages of the joint’s life.
The aforementioned results indicate that for precast frame joints, which serve as critical force–transmission components within the overall frame structure in coastal atmospheric environments, the assessment of seismic performance during the service life should shift from focusing solely on strength indicators to a collaborative evaluation of strength, stiffness, ductility, and energy dissipation capacity.
3.4. Scope of Application and Research Limitations
To ensure scientific rigor, several limitations of the present numerical framework must be explicitly noted.
1. Diffusion Model Approximations: Chloride ingress was estimated using a 1D Fickian diffusion model with constant parameters. In real-world structures, the diffusion coefficient decays over time due to ongoing hydration, and the precast-to-cast interface acts as a 2D/3D preferential transport pathway. Furthermore, the coupling effect of service loads (microcracking under cyclic stress) accelerating chloride penetration was not simulated.
2. Material and Interface Subroutines: The rebar hysteretic subroutine represents bond–slip degradation through equivalent strength weakening, while the baseline model was validated against an uncorroded test joint and a corroded test joint. Direct experimental cross-validation on long-term corroded full-scale joints remains desirable once such experimental data become available.
3. Parametric Specificity: The quantitative trends apply strictly to the specified case study parameters. Variations in water-to-binder ratios, mineral admixtures, or environmental sub-zones will shift the corrosion time points.
Therefore, this work should be interpreted as a case-specific numerical framework exploration under the adopted exposure and modeling assumptions rather than as a deterministic field-life prediction or a comprehensive parametric sensitivity analysis.
4. Conclusions
This paper established a coupled chloride diffusion, corrosion, and finite-element framework to investigate the time-dependent seismic performance degradation and relative indicator variations in a typical precast concrete frame joint under a representative coastal atmospheric environment. The input data of the proposed framework include the joint geometry, reinforcement arrangement, material properties, concrete cover depth, chloride exposure parameters, diffusion-related parameters, and service age. The prediction sequence consists of chloride ingress analysis, corrosion initiation and propagation assessment, corrosion-induced degradation of material and interface properties, finite-element cyclic loading simulation, and evaluation of seismic performance indicators.
Based on the numerical results and adopted parametric conditions, the following conclusions are drawn:
1. The baseline ABAQUS solid model can reasonably reproduce the hysteretic response and skeleton curves of both the uncorroded and corroded validation joints. By applying elastic modulus reduction only to the damaged covering concrete, the framework maintains a clearer distinction between the degraded outer layer and the intact internal concrete.
2. The seismic performance indicators exhibit different relative degradation levels under chloride corrosion accumulation. While the peak load-bearing capacity decreases by only 0.89% at 15 a and 13.68% at 50 a, the ductility coefficient drops by 5.28% at 15 a and 37.40% at 50 a. In the analyzed case, ductility and energy-dissipation-related indicators show larger relative reductions than strength parameters.
3. Under the baseline exposure and geometric conditions of this study, the deterioration tendency becomes more evident in the later service-age cases within the analyzed sequence. This observation is case-specific and should not be interpreted as identifying a universal degradation threshold or a definitive transition age, because the quantitative degradation level may vary with concrete cover depth, chloride exposure condition, material parameters, corrosion morphology, and the selected service-age interval.
4. Service-life durability assessments for precast frame connections in marine atmospheric environments should shift from single-indicator strength-based evaluation to a multi-indicator framework that jointly considers strength, stiffness retention, deformation ductility, and hysteretic energy dissipation.
Author Contributions
Writing—original draft preparation, Software, Data curation, Formal analysis, and Investigation, S.W.; Conceptualization, Methodology, Writing—review and editing, and Supervision, G.Q.; Conceptualization, Funding acquisition, Project administration, Supervision, and Writing—review and editing, Q.W.; Validation, Formal analysis, and Visualization, Z.Z. All authors have read and agreed to the published version of the manuscript.
Funding
This work was funded by the Natural Science Foundation of Hainan Province (Grant Nos. 525RC705, 525MS044, and 526MS0078) and the National Natural Science Foundation of China (Grant No. 52008061).
Institutional Review Board Statement
Not applicable.
Informed Consent Statement
Not applicable.
Data Availability Statement
The data presented in this study are available upon request from the authors.
Conflicts of Interest
The authors declare no conflicts of interest.
References
- Zhang, H.F.; Zhang, W.P.; Gu, X.L.; Jin, X.Y.; Jin, N.G. Chloride penetration in concrete under coastal atmospheric environment—Analysis of the influencing factors. Struct. Infrastruct. Eng. 2016, 12, 1428–1438. [Google Scholar] [CrossRef] [Scilit]
- Xia, J.; Chen, K.Y.; Hu, S.T.; Chen, J.J.; Wu, R.J.; Jin, W.L. Experimental and numerical study on the microstructure and chloride ion transport behavior of concrete-to-concrete interface. Constr. Build. Mater. 2023, 367, 130317. [Google Scholar] [CrossRef] [Scilit]
- Zhao, J.; Li, F.M. Chloride Transport in Interfacial Zone of New-Old Concrete Joints of Precast Prestressed Concrete Bridges under Fatigue Load. J. Mater. Civ. Eng. 2022, 34, 04022263. [Google Scholar] [CrossRef] [Scilit]
- Liu, J.; Chen, X.; Rong, H.; Yu, A.P.; Ming, Y.; Li, K. Effect of Interface Transition Zone and Coarse Aggregate on Microscopic Diffusion Behavior of Chloride Ion. Materials 2022, 15, 4171. [Google Scholar] [CrossRef] [Scilit] [PubMed]
- Zhang, J.; Li, J.; Yun, H.; Long, J.Z.; Zhu, Q.X.; Guan, Z.G. Durability of new-to-old concrete interface under coupling action of freeze-thaw cycle and chloride salt corrosion. Structures 2024, 70, 107867. [Google Scholar] [CrossRef] [Scilit]
- Yang, J.; Guo, T.; Chai, S.; Li, A.Q. Cyclic tests on beam-column joints of SCOPE syste-m with different key slot lengths and corrosion levels. Eng. Struct. 2019, 201, 109406. [Google Scholar] [CrossRef] [Scilit]
- Yang, J.; Guo, T.; Chai, S. Experimental and numerical investigation on seismic behaviours of beam-column joints of precast prestressed concrete frame under given corrosion levels. Structures 2020, 27, 1209–1221. [Google Scholar] [CrossRef] [Scilit]
- Moka, V.T.K.; Chidambaram, R.S. Cyclic behaviour of precast beam-column connections with shear key and hybrid rebar coupler: An experimental study. Structures 2024, 61, 106084. [Google Scholar] [CrossRef] [Scilit]
- Wang, Q.L.; Zhang, Q.; Li, J.; Li, W.J.; Huang, J.; Zhao, H.T. Experimental study on bond properties between corroded grout sleeves and concrete in a chloride environment. Structures 2025, 81, 110227. [Google Scholar] [CrossRef] [Scilit]
- Yang, J.; Yuan, Z.; Liu, J.; Yu, S.Q. Study on Lifetime Performance Evaluation of a Precast Prestressed Concrete Frame in Chloride Environments. Materials 2023, 16, 6666. [Google Scholar] [CrossRef] [Scilit] [PubMed]
- Liu, Y.P.; Weyers, R.E. Modeling the time-to-corrosion cracking in chloride contaminated reinforced concrete structures. ACI Mater. J. 1998, 95, 675–681. [Google Scholar] [CrossRef] [Scilit] [PubMed]
- Crete, D. General guidelines for durability design and redesign (Report number BE95–1347/R17). In Probabilistic Performance-Based Durability Design of Concrete Structures; The European Union—Brite EuRam III; European Commission: Brussels, Belgium, 2000. [Google Scholar]
- GB/T 51355-2019; Standard for Durability Assessment of Existing Concrete Structures. China Architecture & Building Press: Beijing, China, 2019. (In Chinese)
- Cui, F.K.; Zhang, H.; Ghosn, M.; Xu, Y. Seismic fragility analysis of deteriorating RC bridge substructures subject to coastal chloride-induced corrosion. Eng. Struct. 2018, 155, 61–72. [Google Scholar] [CrossRef] [Scilit]
- Luo, D.M.; Niu, D.T. Durability evaluation of concrete structures based on reinforcement corrosion. Ind. Constr. 2022, 52, 1−8+70. (In Chinese) [Google Scholar] [CrossRef]
- Tuutti, K. Corrosion of Steel in Concrete; Swedish Cement and Concrete Research Institute: Stockholm, Sweden, 1982; p. 159. [Google Scholar]
- Val, D.V.; Stewart, M.G.; Melchers, R.E. Effect of reinforcement corrosion on reliability of highway bridges. Eng. Struct. 1998, 20, 1010–1019. [Google Scholar] [CrossRef] [Scilit]
- Wang, L.C.; Song, G.T. Study on the resistance degradation model of reinforced concrete structures under chloride corrosion conditions. China Offshore Platf. 2006, 5, 34–38+43. (In Chinese) [Google Scholar] [CrossRef]
- Haris, N.; Gadve, S. Mechanical properties of reinforcing steel bars corroded at different levels. ACI Mater. J. 2021, 118, 109–120. [Google Scholar] [CrossRef] [Scilit]
- Zhang, W.P.; Shang, D.; Gu, X. Stochastic model of constitutive relationship for corroded steel bars. J. Build. Mater. 2014, 17, 920–926. (In Chinese) [Google Scholar] [CrossRef]
- Zhang, W.P.; Shang, D.; Gu, X. Stress-strain relationship of corroded steel bars. J. Tongji Univ. 2006, 34, 586–592. (In Chinese) [Google Scholar] [CrossRef]
- Chen, J.; Zhang, W.; Tang, Z.; Huang, Q. Experimental and numerical investigation of chloride-induced reinforcement corrosion and mortar cover cracking. Cem. Concr. Compos. 2020, 111, 103620. [Google Scholar] [CrossRef] [Scilit]
- Coronelli, D.; Gambarova, P. Structural assessment of corroded reinforced concrete beams: Modeling guidelines. J. Struct. Eng. 2004, 130, 1214–1224. [Google Scholar] [CrossRef] [Scilit]
- Molina, F.; Alonso, C.; Andrade, C. Cover cracking as a function of rebar corrosion: Part 2—Numerical model. Mater. Struct. 1993, 26, 532–548. [Google Scholar] [CrossRef] [Scilit]
- Afsar Dizaj, E.; Kashani, M. Nonlinear structural performance and seismic fragility of corroded reinforced concrete structures: Modelling guidelines. Eur. J. Environ. Civ. Eng. 2022, 14, 714–729. [Google Scholar] [CrossRef] [Scilit]
- GB 50010-2010; Code for Design of Concrete Structures. China Architecture & Building Press: Beijing, China, 2015. (In Chinese)
- Scott, B.D.; Park, R.; Priestley, M. Stress–strain behavior of concrete confined by overlapping hoops at low and high strain rates. Acids J. Proc. 1982, 79, 13–27. [Google Scholar] [CrossRef] [Scilit] [PubMed]
- Liu, H.T.; Yan, Q.S.; Du, X.L. Study of seismic performance of reinforced concrete frame beam-column joints connected with grouted sleeves. J. Build. Struct. 2017, 38, 54–61. (In Chinese) [Google Scholar] [CrossRef]
- Zhao, Y.H.; Zhang, X.; Shi, G.; Zhuang, X.H.; Sun, J.L.; Jiang, F.X. Seismic behavior of corroded precast concrete beam-column joints with wet-type connections. Eng. Struct. 2026, 346, 121583. [Google Scholar] [CrossRef] [Scilit]
- Park, T.; Ahmed, B.; Voyiadjis, Z.G. A review of continuum damage and plasticity in concrete: Part I—Theoretical framework. Int. J. Damage Mech. 2022, 31, 901–954. [Google Scholar] [CrossRef] [Scilit]
- Sidoroff, F. Description of anisotropic damage application to elasticity. In Physical Non-Linearities in Structural Analysis; Springer: Berlin/Heidelberg, Germany, 1981; pp. 237–244. [Google Scholar] [CrossRef] [Scilit]
- Fang, Z.H.; Zhen, Y.; Li, X.P. Steel hysteretic model of reinforced concrete structures. Eng. J. Wuhan Univ. 2018, 51, 613–619. (In Chinese) [Google Scholar] [CrossRef]
- Dassault Systèmes Simulia Corp. ABAQUS Analysis User’s Manual; Dassault Systèmes Simulia Corp: Providence, RI, USA, 2011. [Google Scholar]
- Zhou, J. Study on the Application Technology of Shear Walls with Precast Concrete Hollow Moulds. Ph.D. Thesis, Tsinghua University, Beijing, China, 2015. (In Chinese) [Google Scholar]
- Liu, J. Study on the Mechanics Performance of Adherence of Young on Old Concrete. Ph.D. Thesis, Dalian University of Technology, Dalian, China, 2000. (In Chinese) [Google Scholar]
- Wang, Z.L. Study on Bond Theory and Test of New and Old Concrete and Its Application in Bridge Strengthening Engineering. Ph.D. Thesis, Southwest Jiaotong University, Chengdu, China, 2006. (In Chinese) [Google Scholar] [CrossRef]
- Li, J.Y. Study on the Time-Dependent Degradation Law of Seismic Performance of Typical Precast Frame Joints and Dynamic Earthquake Damage Prediction of Structures During Service Life. Master’s Thesis, Nanjing University of Science and Technology, Nanjing, China, 2019. (In Chinese) [Google Scholar] [CrossRef]
- Wu, J.H. Research on Seismic Performance of a New Precast High-Strength ECC Beam-Column Joint. Master’s Thesis, Shandong Jianzhu University, Jinan, China, 2024. (In Chinese) [Google Scholar] [CrossRef]
- Park, R. Evaluation of ductility of structures and structural assemblages from laboratory testing. Bull. N. Z. Soc. Earthq. Eng. 1989, 22, 155–166. [Google Scholar] [CrossRef] [Scilit]
- JGJ 101-2015; Specification for Seismic Test of Buildings. China Architecture & Building Press: Beijing, China, 2015. (In Chinese)

Disclaimer/Publisher’s Note: The statements, opinions and data contained in all publications are solely those of the individual author(s) and contributor(s) and not of MDPI and/or the editor(s). MDPI and/or the editor(s) disclaim responsibility for any injury to people or property resulting from any ideas, methods, instructions or products referred to in the content. |
© 2026 by the authors. Licensee MDPI, Basel, Switzerland. This article is an open access article distributed under the terms and conditions of the Creative Commons Attribution (CC BY) license.