


Abstract
The integration of sensing systems, Artificial Intelligence (AI), and data analytics technologies is enabling the development of digital twins for monitoring and managing complex built environments. University campuses represent suitable scenarios for the deployment and evaluation of these technologies due to their diversity of facilities, heterogeneous operational systems, and dynamic usage patterns. This paper presents the design and deployment of a campus-scale operational digital twin developed for the University of Alicante Smart Campus. The proposed environment integrates multiple data sources including indoor environmental sensors, electricity and water consumption monitoring systems, photovoltaic generation data, irrigation networks, and WiFi connectivity information used as a proxy for occupancy estimation. Through a continuously updated and spatially synchronized digital representation of the campus, the platform supports environmental comfort monitoring, occupancy analysis, environmental quality assessment, anomaly detection, alert generation, and AI-enabled analytical services. A distinguishing characteristic of the proposed approach is its long-term real-world deployment. The system currently manages several years of historical data comprising hundreds of millions of time-series measurements collected from distributed monitoring systems across the campus. The results demonstrate the feasibility of maintaining a campus-scale digital twin operating as an institutional monitoring and decision-support environment.
1. Introduction
The increasing demand for sustainable and resilient built environments is driving the adoption of digital technologies capable of monitoring and managing complex operational scenarios in real time. Among these technologies, Building Information Modeling (BIM) and digital twins have emerged as key approaches for representing and operating physical assets throughout their lifecycle [1]. While BIM models provide detailed static representations of buildings and facilities, digital twins extend this concept by incorporating real-time data streams that support continuous monitoring, analysis, and decision-making processes [2,3].
Recent advances in the Internet of Things (IoT), sensing technologies, Artificial Intelligence (AI), and data analytics have accelerated the development of digital twins for buildings and urban environments [2,4]. By integrating heterogeneous data sources such as environmental sensors, energy meters, water consumption systems, and occupancy information, digital twins provide a continuously updated representation of the physical environment that supports more efficient monitoring, predictive analytics, and sustainability-oriented management processes.
Recent standardization efforts are also contributing to the consolidation of Digital Twin technologies within the built environment domain. In particular, UNE-CEN/TR 18077:2024 [5] highlights the role of digital twins as dynamic representations capable of supporting monitoring, lifecycle management, sustainability assessment, and operational decision-making processes. These developments reflect the transition from static digital models toward continuously synchronized digital environments connected to real-world assets and operational data.
Although simulation, prediction, and optimization are frequently associated with digital twins, the recent literature recognizes that digital twin implementations may present different levels of maturity depending on their operational objectives. In this work, Kunna is conceived as an operational digital twin, whose primary objective is to maintain a continuously synchronized digital representation of the university campus by integrating heterogeneous operational data, spatial information, and analytical services. This operational perspective provides the foundation for monitoring, supervision, and decision-making, while more advanced capabilities such as predictive simulation and what-if analysis constitute future stages in the platform evolution [1,5].
University campuses are particularly suitable environments for the deployment and evaluation of these technologies. Due to their scale and complexity, campuses share many characteristics with small urban environments [6], including multiple buildings, distributed monitoring systems, diverse occupancy patterns, and heterogeneous operational datasets. For this reason, university campuses are increasingly considered living laboratories for smart environment research, where digital technologies can be deployed and evaluated under real operational conditions [6].
In this context, the University of Alicante Smart Campus platform (Kunna) has been developed as a campus-scale operational digital twin environment capable of integrating distributed sensing systems and providing a spatially synchronized digital representation of the university environment. Kunna collects and manages multiple categories of operational data, including WiFi connectivity information, electricity consumption, water usage, irrigation systems, photovoltaic energy generation, and indoor environmental quality indicators such as CO2 concentration, temperature, humidity, and volatile organic compounds.
These data streams are collected from distributed monitoring devices deployed across the campus and stored within a centralized environment that currently manages large volumes of historical operational data. Kunna provides advanced data exploration capabilities through configurable dashboards and analytical views that allow users to analyze information across temporal and spatial dimensions. These capabilities include time-series analysis, comparative charts, heat maps representing spatial distributions of variables, and cross-analysis between independent datasets.
Complementing these analytical tools, Kunna incorporates a campus-scale digital twin that provides a continuously updated three-dimensional representation of the university environment and enables the geospatial integration of buildings, sensing systems, and operational measurements. Through the synchronization between physical campus spaces and the digital twin environment, operational data can be explored within its corresponding spatial context.
Kunna also supports operational supervision processes through analytical reports and automated alerting mechanisms that help identify abnormal conditions such as unexpected water consumption patterns or unusual environmental measurements. These capabilities contribute to improving resource efficiency and supporting sustainability-oriented campus management strategies.
Despite the growing interest in digital twin technologies for the built environment, many existing proposals remain conceptual or limited to small-scale experimental deployments. In contrast, the system presented in this paper has been progressively consolidated within a real operational campus environment, integrating multiple monitoring systems and managing large volumes of heterogeneous operational data collected over several years.
The main contributions of this paper are summarized as follows:
- Design and deployment of a campus-scale digital twin platform capable of integrating heterogeneous operational datasets within a real university environment;
- Integration of multiple monitoring systems, including energy consumption, water usage, irrigation systems, WiFi-based occupancy estimation, and indoor environmental quality measurements;
- Spatial integration of operational data through a 3D digital twin environment, enabling intuitive geospatial exploration of buildings, sensors, and monitored variables;
- Operational deployment and institutional integration of the platform within the University of Alicante Smart Campus initiative;
- Demonstration of analytical capabilities including occupancy analysis, environmental quality assessment, anomaly detection, and automated alert generation.
The remainder of the paper is organized as follows. Section 2 reviews related work on digital twins and smart monitoring platforms. Section 3 describes the sensing systems and operational datasets integrated into the University of Alicante Smart Campus. Section 4 presents the architecture of the proposed digital twin platform. Section 5 describes the data exploration and analytical capabilities of the system. Section 6 presents the operational deployment and institutional integration of the platform. Section 7 illustrates representative monitoring use cases enabled by Kunna. Finally, Section 8 discusses the implications and limitations of the proposed approach and Section 9 concludes the paper.
2. Related Work
The concept of Digital Twin has gained significant attention in recent years as a mechanism for connecting physical assets with their digital counterparts through the continuous integration of operational data [7,8]. Within the Architecture, Engineering, Construction, and Facility Management (AEC-FM) domain, digital twins are commonly regarded as an evolution of traditional Building Information Modeling (BIM) approaches, extending static geometric and semantic building representations through the incorporation of real-time information obtained from sensing systems and connected infrastructures [2,3]. This evolution has enabled the transition from descriptive digital models toward dynamic environments capable of supporting monitoring, analysis, and decision-making processes throughout the lifecycle of built assets [8].
Recent research has explored the integration of BIM, Internet of Things (IoT) technologies, Artificial Intelligence (AI), and advanced data analytics to support the operation and management of buildings and infrastructure systems [8,9]. These approaches have demonstrated the potential of digital twins for applications such as energy management, environmental monitoring, predictive maintenance, structural health assessment, and facility management [10,11]. By maintaining a continuously updated representation of the physical asset, digital twins facilitate the analysis of operational conditions and support data-driven management strategies [9,11].
A considerable portion of the literature has focused on the development of digital twins for individual buildings or specific infrastructure systems. Existing studies have proposed digital twin frameworks for intelligent building operation [9], built asset management and maintenance supervision [12], structural monitoring [10], air-conditioning systems [13], air quality management [14], irrigation network management [15], and other domain-specific applications. These works demonstrate the feasibility of combining BIM models, sensing infrastructures, and analytical services within a unified digital environment. However, most implementations remain limited to individual assets, specific facilities, or narrowly defined operational domains, leaving open challenges related to large-scale integration, interoperability, and multi-domain monitoring.
In parallel with the evolution of digital twin technologies, university campuses have emerged as important environments for the deployment of smart monitoring systems [6]. Due to their diversity of buildings, infrastructures, users, and operational processes, campuses share many characteristics with small urban environments and have become representative testbeds for evaluating sensing technologies and data-driven management approaches [6]. Smart campus initiatives typically integrate environmental monitoring systems, energy metering infrastructures, water consumption sensors, occupancy estimation mechanisms, and communication networks in order to support sustainability goals and operational efficiency [16].
Several smart campus platforms have been proposed to facilitate the acquisition, storage, visualization, and analysis of data collected from heterogeneous monitoring systems [17,18,19]. These solutions commonly provide dashboards and analytical interfaces that allow users to monitor campus conditions and evaluate resource consumption patterns [18,19]. While these platforms offer valuable monitoring capabilities, many of them primarily focus on data collection and visualization functionalities and provide limited integration between operational information and the spatial representation of the physical environment [20].
More recently, researchers have explored the application of digital twin concepts to university campuses [20,21,22]. These initiatives seek to combine operational data, geospatial information, and three-dimensional representations in order to create digital environments capable of supporting campus management activities [21,22]. Existing campus digital twins have demonstrated benefits in areas such as energy supervision, occupancy analysis, environmental comfort assessment, asset management, and sustainability evaluation [20,23,24]. Nevertheless, many current proposals remain focused on specific buildings, isolated operational domains, or proof-of-concept deployments with limited temporal coverage [21,24].
Another limitation frequently observed in the literature concerns the long-term operational deployment of digital twins. While numerous studies validate their approaches using short-term datasets or experimental scenarios, fewer works report the continuous operation of campus-scale digital twins managing large historical repositories and supporting institutional monitoring activities over extended periods [20,21,25]. Similarly, the integration of heterogeneous sensing domains, including environmental monitoring, energy consumption, water management, renewable generation, occupancy estimation, and infrastructure supervision, within a single operational environment remains relatively uncommon [21,23,25].
In contrast to previous approaches, the platform presented in this paper has been developed as an operational campus-scale digital twin, emphasizing the continuous synchronization between physical infrastructures and their digital representation while progressively incorporating analytical services within a real institutional environment. The development of Kunna builds on previous work on smart university modelling and IoT-based analytical services for campus infrastructures, including AI-enabled environmental assessment and energy anomaly detection [26,27,28]. Kunna combines historical data management, analytical visualization, geospatial exploration, alert generation mechanisms, and institutional monitoring workflows while maintaining a continuously synchronized digital representation of the University of Alicante campus. The platform supports the integration of environmental monitoring, resource consumption analysis, occupancy estimation, renewable energy supervision, and infrastructure management capabilities within a common digital twin framework.
Table 1 summarizes representative studies identified in the literature and compares their scope with the capabilities provided by Kunna. The comparison highlights that, while previous works have successfully demonstrated digital twin concepts for buildings, specific infrastructures, or individual campus services, fewer solutions provide a unified operational environment integrating multiple sensing domains, long-term historical datasets, spatial visualization, and real-world institutional deployment at campus scale.
Table 1.
Comparison between representative smart campus digital twin platforms and the proposed system.
Overall, the reviewed literature shows a clear evolution from smart campus monitoring platforms toward campus digital twin environments. Existing works have demonstrated the value of IoT-based sensing, visualization dashboards, BIM or GIS integration, and domain-specific analytical services for improving building and campus management. However, most approaches remain focused on specific buildings, individual operational domains, prototype deployments, or limited case studies. In this context, Kunna differs from previous proposals by providing an operational campus-scale digital twin that integrates heterogeneous sensing domains, geospatial and three-dimensional visualization, analytical services, alert generation mechanisms, and institutional monitoring workflows within a unified environment. This positioning defines the contribution of the present work and motivates the architecture and deployment described in the following sections.
3. Smart Campus Environment and Sensing Systems
The University of Alicante campus represents a complex operational environment composed of multiple buildings, heterogeneous facilities, and diverse patterns of occupancy and resource usage. This complexity has motivated the progressive deployment of distributed sensing and monitoring systems aimed at supporting smart campus services and operational digital twin development. These systems monitor environmental conditions, facility usage, and resource consumption across several buildings and outdoor areas, generating continuous streams of operational data collected within the smart campus environment.
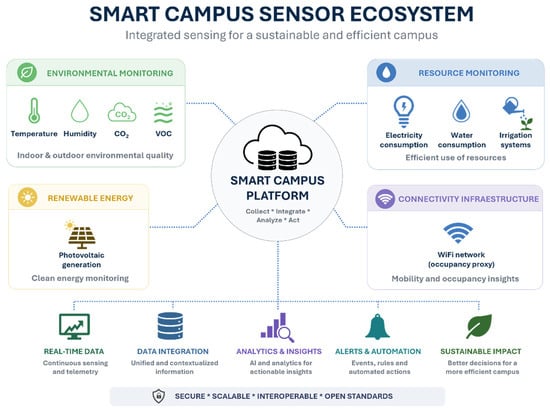
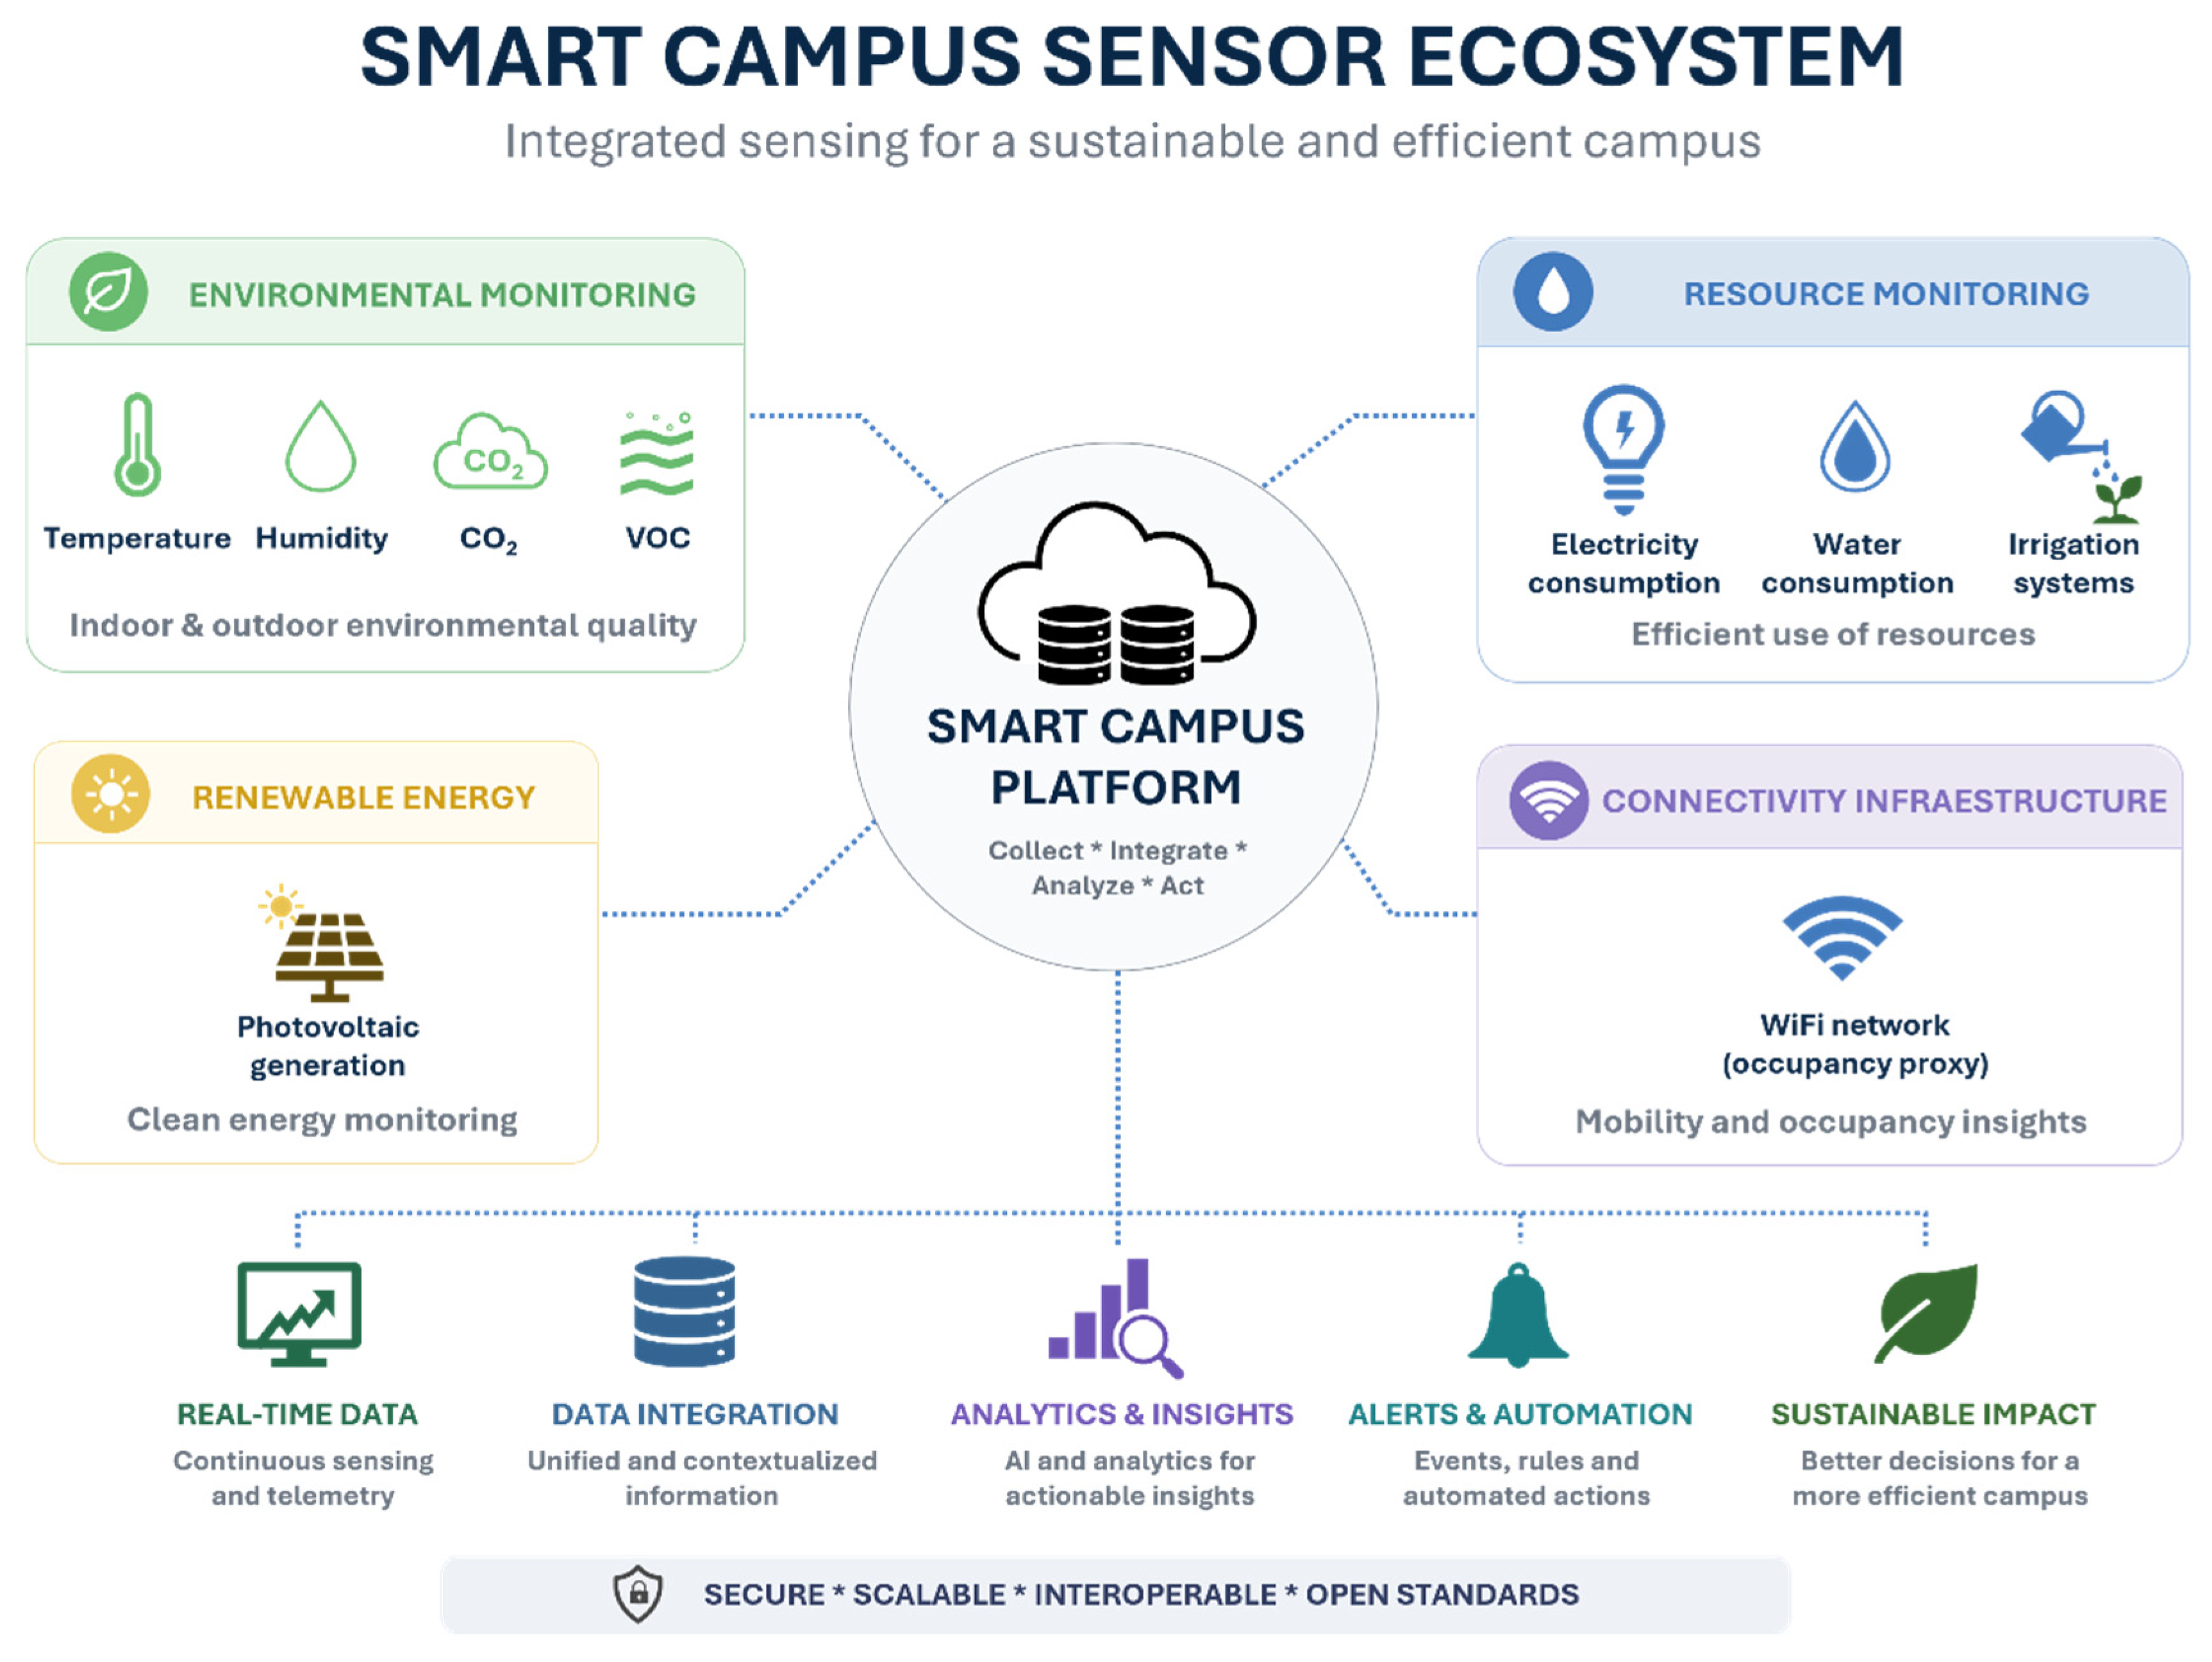
Figure 1 provides an overview of the main monitoring systems integrated into the smart campus platform. These systems include indoor environmental sensors, resource consumption monitoring mechanisms, renewable energy production systems, and connectivity data sources derived from the campus WiFi network.
Figure 1.
Overview of the main data collections available in the Kunna Smart Campus platform.
Table 2 summarizes the main sensing systems and datasets currently integrated into the smart campus platform. The table includes the different monitored systems, the variables collected from each sensing source, and their primary application domains within the campus environment. These sensing systems constitute the main operational data sources currently integrated into the smart campus environment.
Table 2.
Sensing systems and datasets integrated into the smart campus platform.
Beyond the diversity of sensing domains, the operational relevance of the platform is also reflected in the scale of its deployment. Table 3 summarizes the main deployment indicators of the current Kunna implementation, illustrating the spatial coverage, historical data volume, and long-term operational maturity of the platform within the University of Alicante campus.
Table 3.
Overview of the operational deployment of the Kunna platform.
Indoor environmental monitoring is performed through sensors deployed in several classrooms and indoor spaces across the campus. These sensors measure variables such as temperature, relative humidity, CO2 concentration, and volatile organic compounds (VOCs), which allow continuous monitoring of indoor environmental conditions within campus buildings. The sensors operate continuously and periodically transmit measurements to the central data environment.
Resource consumption monitoring is also integrated into the platform. Electricity consumption data are collected from building energy meters and provide operational measurements associated with campus buildings. Similarly, water consumption is monitored through sensors installed in the potable water distribution network and irrigation systems. These sensors generate continuous measurements associated with water usage in buildings and outdoor areas.
The campus also incorporates renewable energy systems such as photovoltaic generation installations, whose production data are integrated into the monitoring environment. These systems continuously generate operational measurements related to photovoltaic energy production.
In addition to these monitoring systems, the campus WiFi network provides information about connectivity patterns across buildings. Aggregated WiFi connectivity data can be used as a proxy for estimating occupancy levels in different areas of the campus.
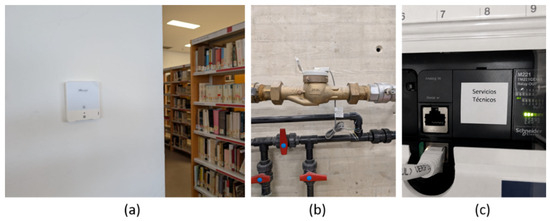
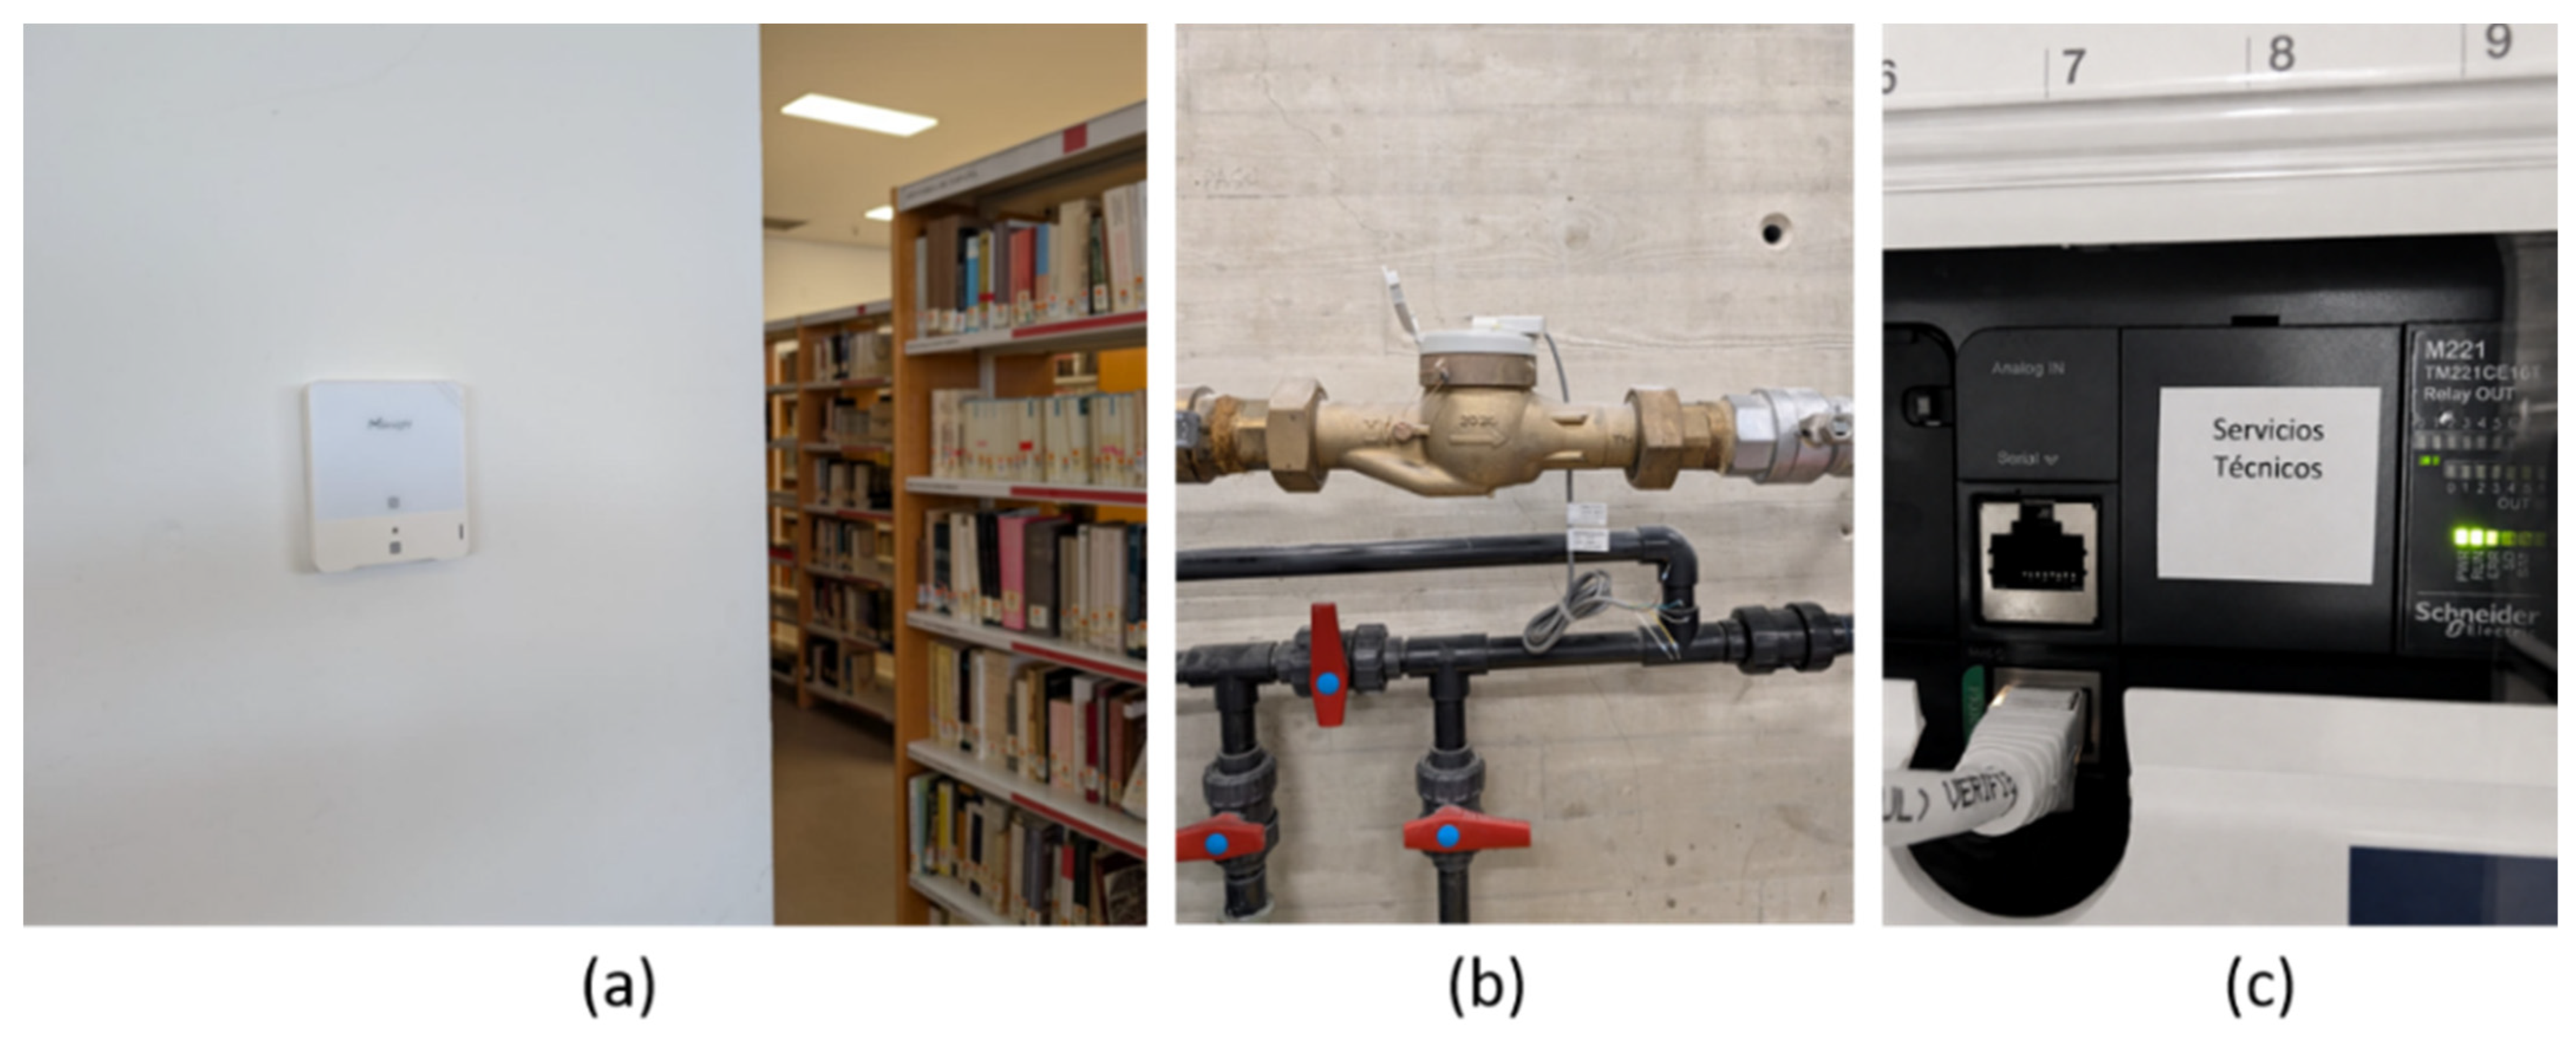
Figure 2 shows examples of sensing devices deployed across the campus infrastructure, including indoor environmental sensors and resource monitoring devices installed in buildings and technical infrastructures.
Figure 2.
Examples of sensing devices deployed in the University of Alicante Smart Campus infrastructure: (a) indoor environmental quality sensor, (b) water consumption monitoring device, and (c) energy monitoring automation device.
All these sensing infrastructures generate continuous streams of operational data that are collected and stored within the smart campus environment. These heterogeneous sensing infrastructures constitute the primary operational data sources integrated into Kunna. Their acquisition, communication mechanisms, and integration architecture are described in Section 4.1.
4. Campus-Scale Digital Twin Architecture
Kunna has been designed as a modular digital twin platform capable of integrating data streams from multiple campus systems into a unified operational environment. The platform architecture supports data acquisition, storage, processing, visualization, and spatial integration through a campus-scale digital twin [1,3,26].
The proposed platform establishes a continuous connection between the physical university environment and its digital representation. Data generated by distributed sensing systems deployed across the campus are continuously collected, processed, and integrated into a centralized environment that supports both operational monitoring and analytical services. Through this process, real-world conditions associated with buildings, infrastructures, environmental variables, resource consumption, and occupancy patterns are reflected within the digital twin environment, enabling synchronized monitoring and contextualized data exploration.
Unlike domain-specific monitoring solutions focused on individual infrastructures, Kunna integrates heterogeneous operational datasets originating from multiple sensing domains, including environmental monitoring, electricity consumption, water management, irrigation systems, photovoltaic generation, and WiFi-based occupancy estimation. This unified approach allows information originating from independent monitoring systems to be analyzed jointly within a common spatial and temporal framework, facilitating cross-domain analysis and supporting campus-wide supervision activities.
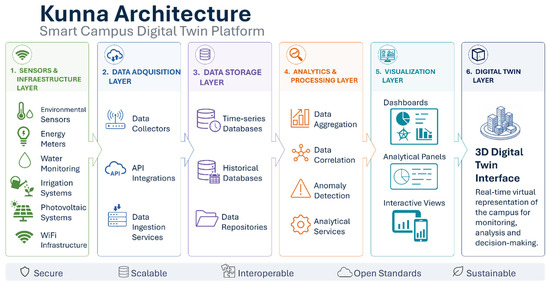
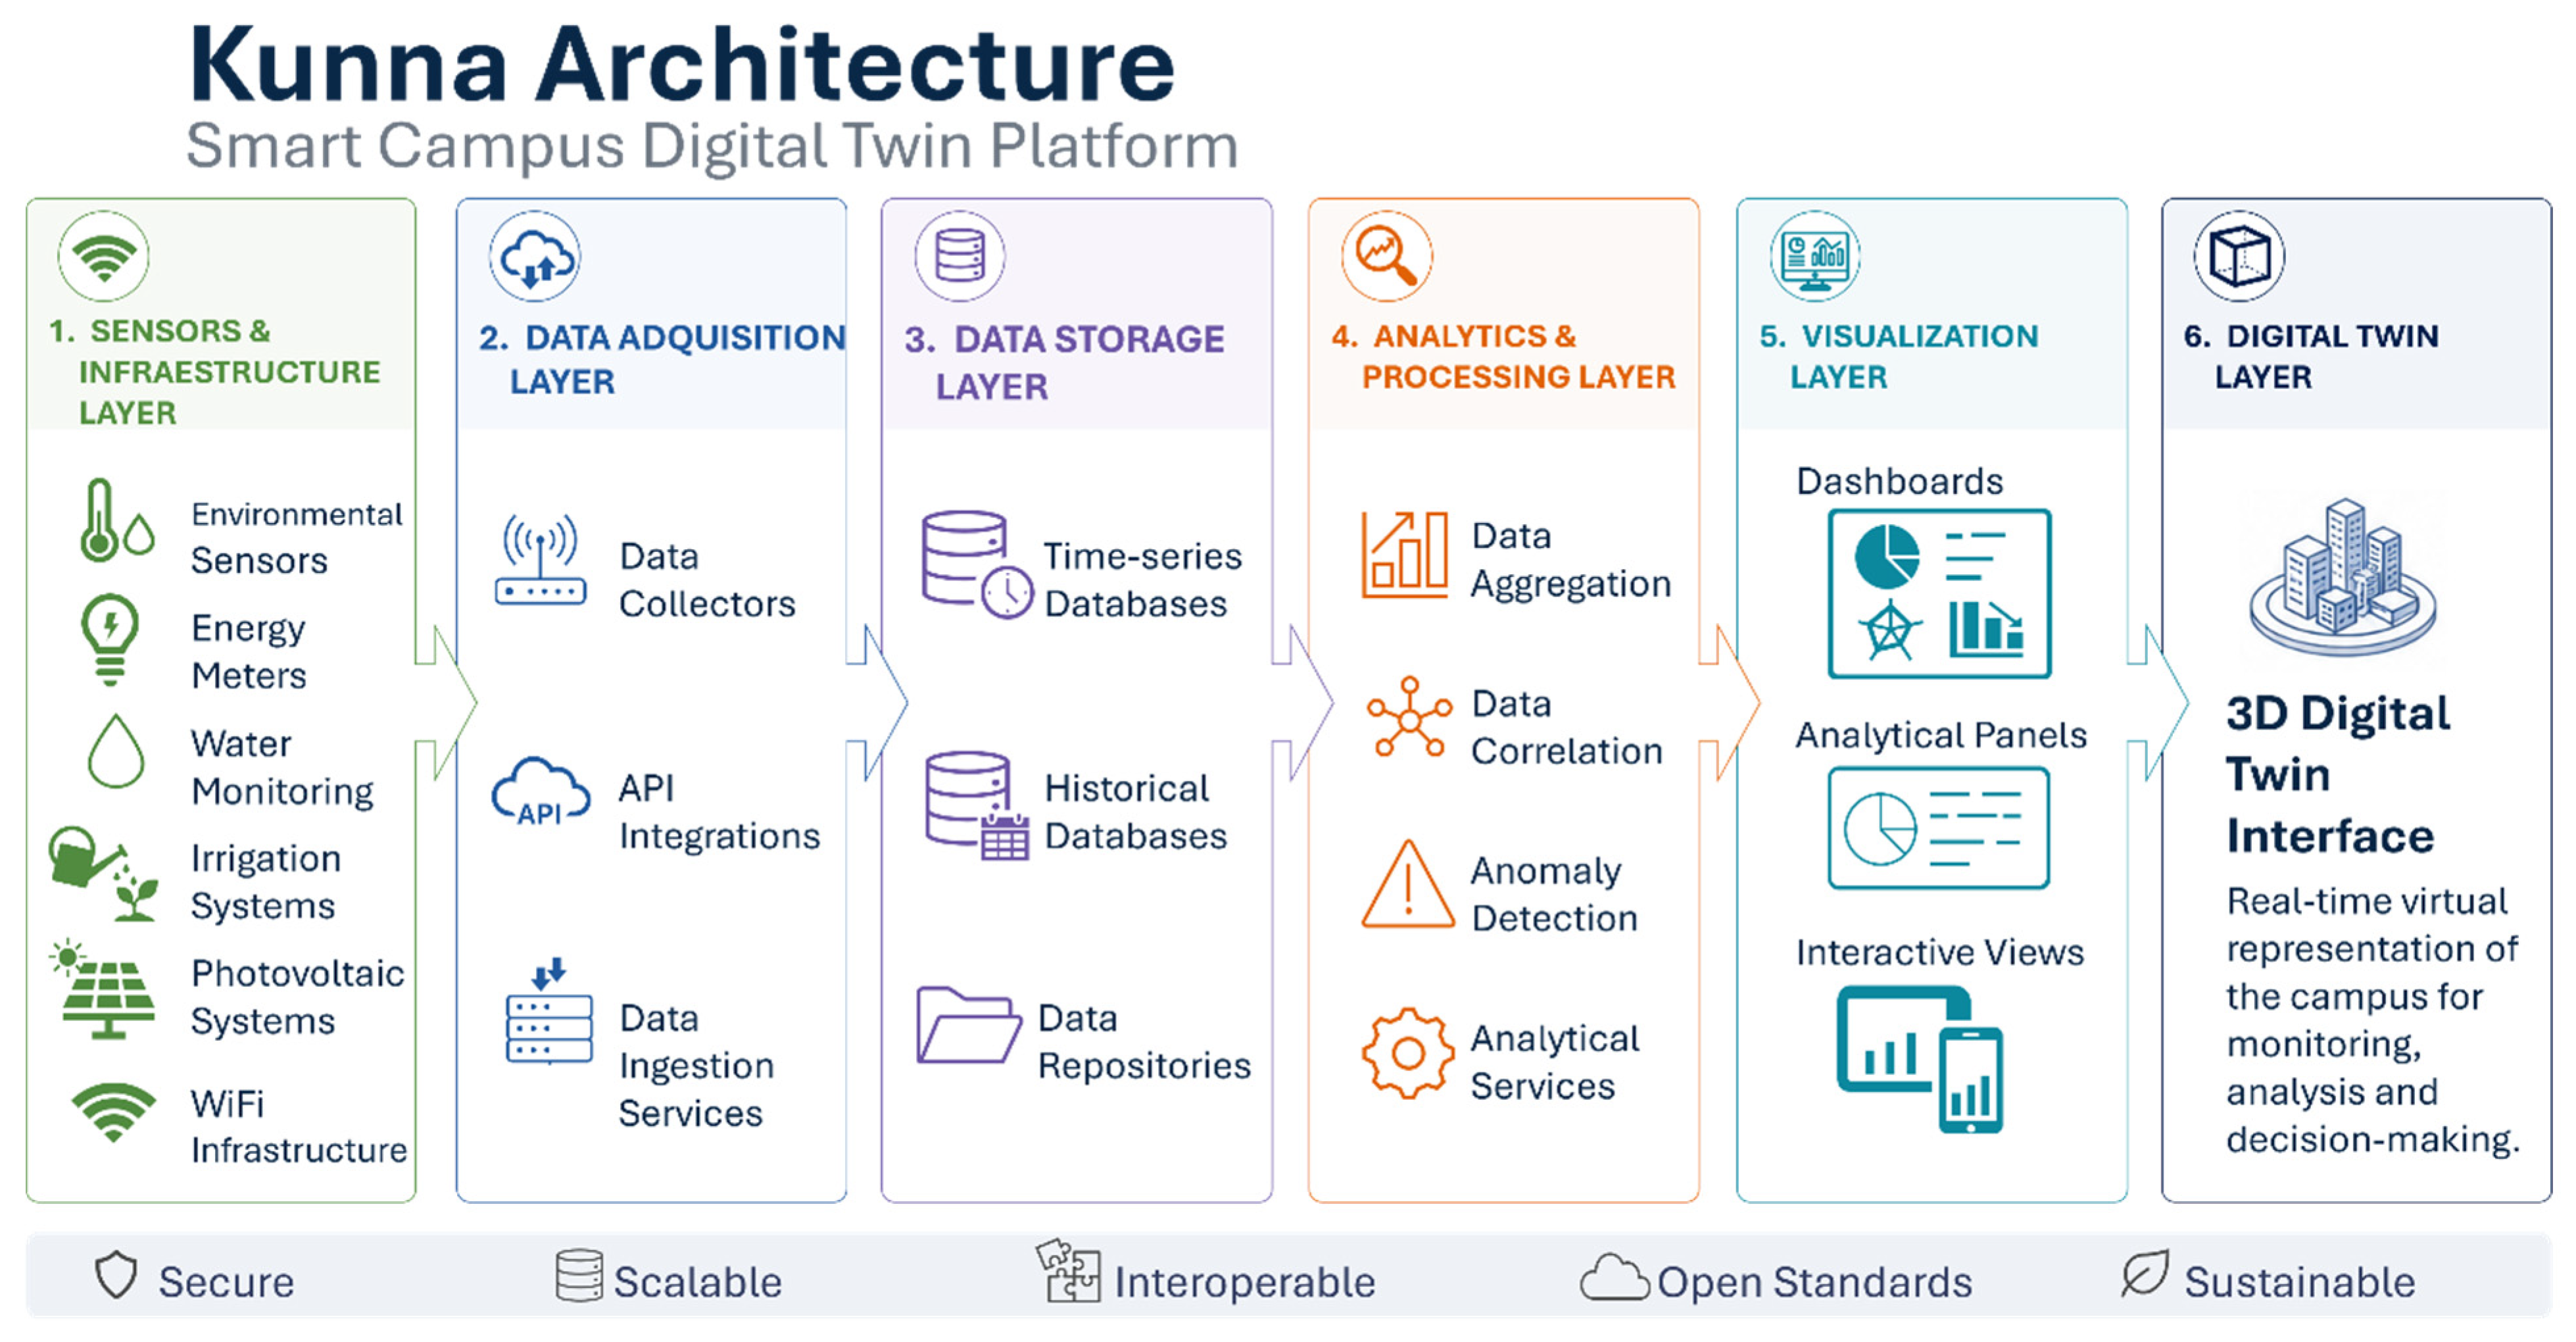
Figure 3 illustrates the overall architecture of the proposed system and the main information flow between sensing infrastructures, data management services, analytical components, and user-facing visualization mechanisms. The platform is organized into several functional layers that manage the complete infrastructure data lifecycle, from data acquisition to visualization and interaction.
Figure 3.
Architecture of the smart campus digital twin platform.
4.1. Data Acquisition and Integration
The acquisition layer is responsible for collecting operational measurements from the different infrastructures integrated into the campus environment. Data ingestion is performed through a combination of data collectors, communication interfaces, and API-based integration mechanisms that retrieve information from distributed monitoring systems.
The architecture supports the incorporation of data streams generated at different temporal resolutions and from infrastructures with heterogeneous communication mechanisms. This modular design facilitates the progressive integration of new monitoring systems into Kunna as additional sensing infrastructures are deployed across the campus.
The sensing infrastructure combines commercial monitoring devices and existing institutional infrastructures rather than custom-designed IoT hardware. Indoor environmental conditions are monitored using commercial multi-parameter LoRaWAN sensors measuring temperature, relative humidity, CO2 concentration, volatile organic compounds (TVOC), particulate matter (PM2.5), and atmospheric pressure. Electricity consumption is acquired through Schneider Electric PLC-based smart metering gateways deployed in electrical cabinets, while water consumption and irrigation monitoring rely on commercial flow meters integrated through LoRaWAN gateways. Occupancy estimation is obtained from the existing Cisco enterprise WiFi infrastructure, avoiding the deployment of dedicated occupancy sensors. Most sensing devices acquire measurements every 15 min, although sampling frequencies are configurable depending on the monitored infrastructure and operational requirements.
Kunna adopts an open communication architecture based on widely used industrial and IoT protocols to facilitate interoperability across heterogeneous infrastructures. Data acquisition combines LoRaWAN, Modbus, MQTT, and BACnet at the sensing layer, while Ethernet and WiFi provide IP connectivity between gateways and platform services. Operational information is exposed through REST APIs over HTTPS, allowing the integration of external applications, analytical services, and institutional information systems.
In order to maintain interoperability between infrastructures, the acquisition layer transforms incoming measurements into a unified internal representation before storing them within Kunna. Data quality is supported through the use of certified commercial sensing devices, manufacturer-calibrated sensors, standardized communication protocols, and continuous operational validation during platform deployment.
4.2. Data Storage and Processing Pipeline
Once acquired, measurements are stored within a centralized storage layer designed to manage large volumes of historical and real-time operational data. The storage infrastructure supports continuous data ingestion and efficient retrieval mechanisms required for visualization and analytical services.
Kunna currently maintains several years of historical operational measurements collected from distributed monitoring systems across the campus environment. The storage layer also incorporates indexing and aggregation mechanisms that facilitate temporal queries and multi-source data exploration across heterogeneous campus infrastructures.
On top of the storage infrastructure, the processing layer implements the data pipeline responsible for transforming raw measurements into structured information suitable for analysis and visualization. These processes include data aggregation, temporal synchronization, filtering, and correlation between datasets obtained from different campus systems.
The modular organization of the processing pipeline allows analytical services to be progressively incorporated into Kunna without modifying the underlying acquisition and storage mechanisms. This modularity is complemented by an interoperability-oriented approach based on standardized APIs, which facilitates the integration of heterogeneous sensing systems and external information sources. This strategy has enabled the progressive incorporation of new infrastructures and supports future integrations with additional operational services and institutional information systems.
4.3. Visualization and Digital Twin Environment
The upper layer of the architecture provides user interfaces for exploring operational data through both analytical and spatial perspectives.
Analytical interfaces include configurable dashboards that support the exploration of measurements across different temporal scales. These interfaces allow users to explore time-series data, compare variables obtained from different monitoring systems, and supervise operational conditions within campus facilities.
Complementing these analytical interfaces, Kunna incorporates a campus-scale digital twin that provides a three-dimensional representation of the university environment and enables the geospatial integration of operational data.
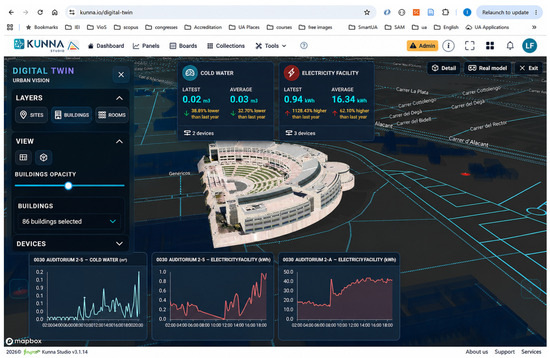
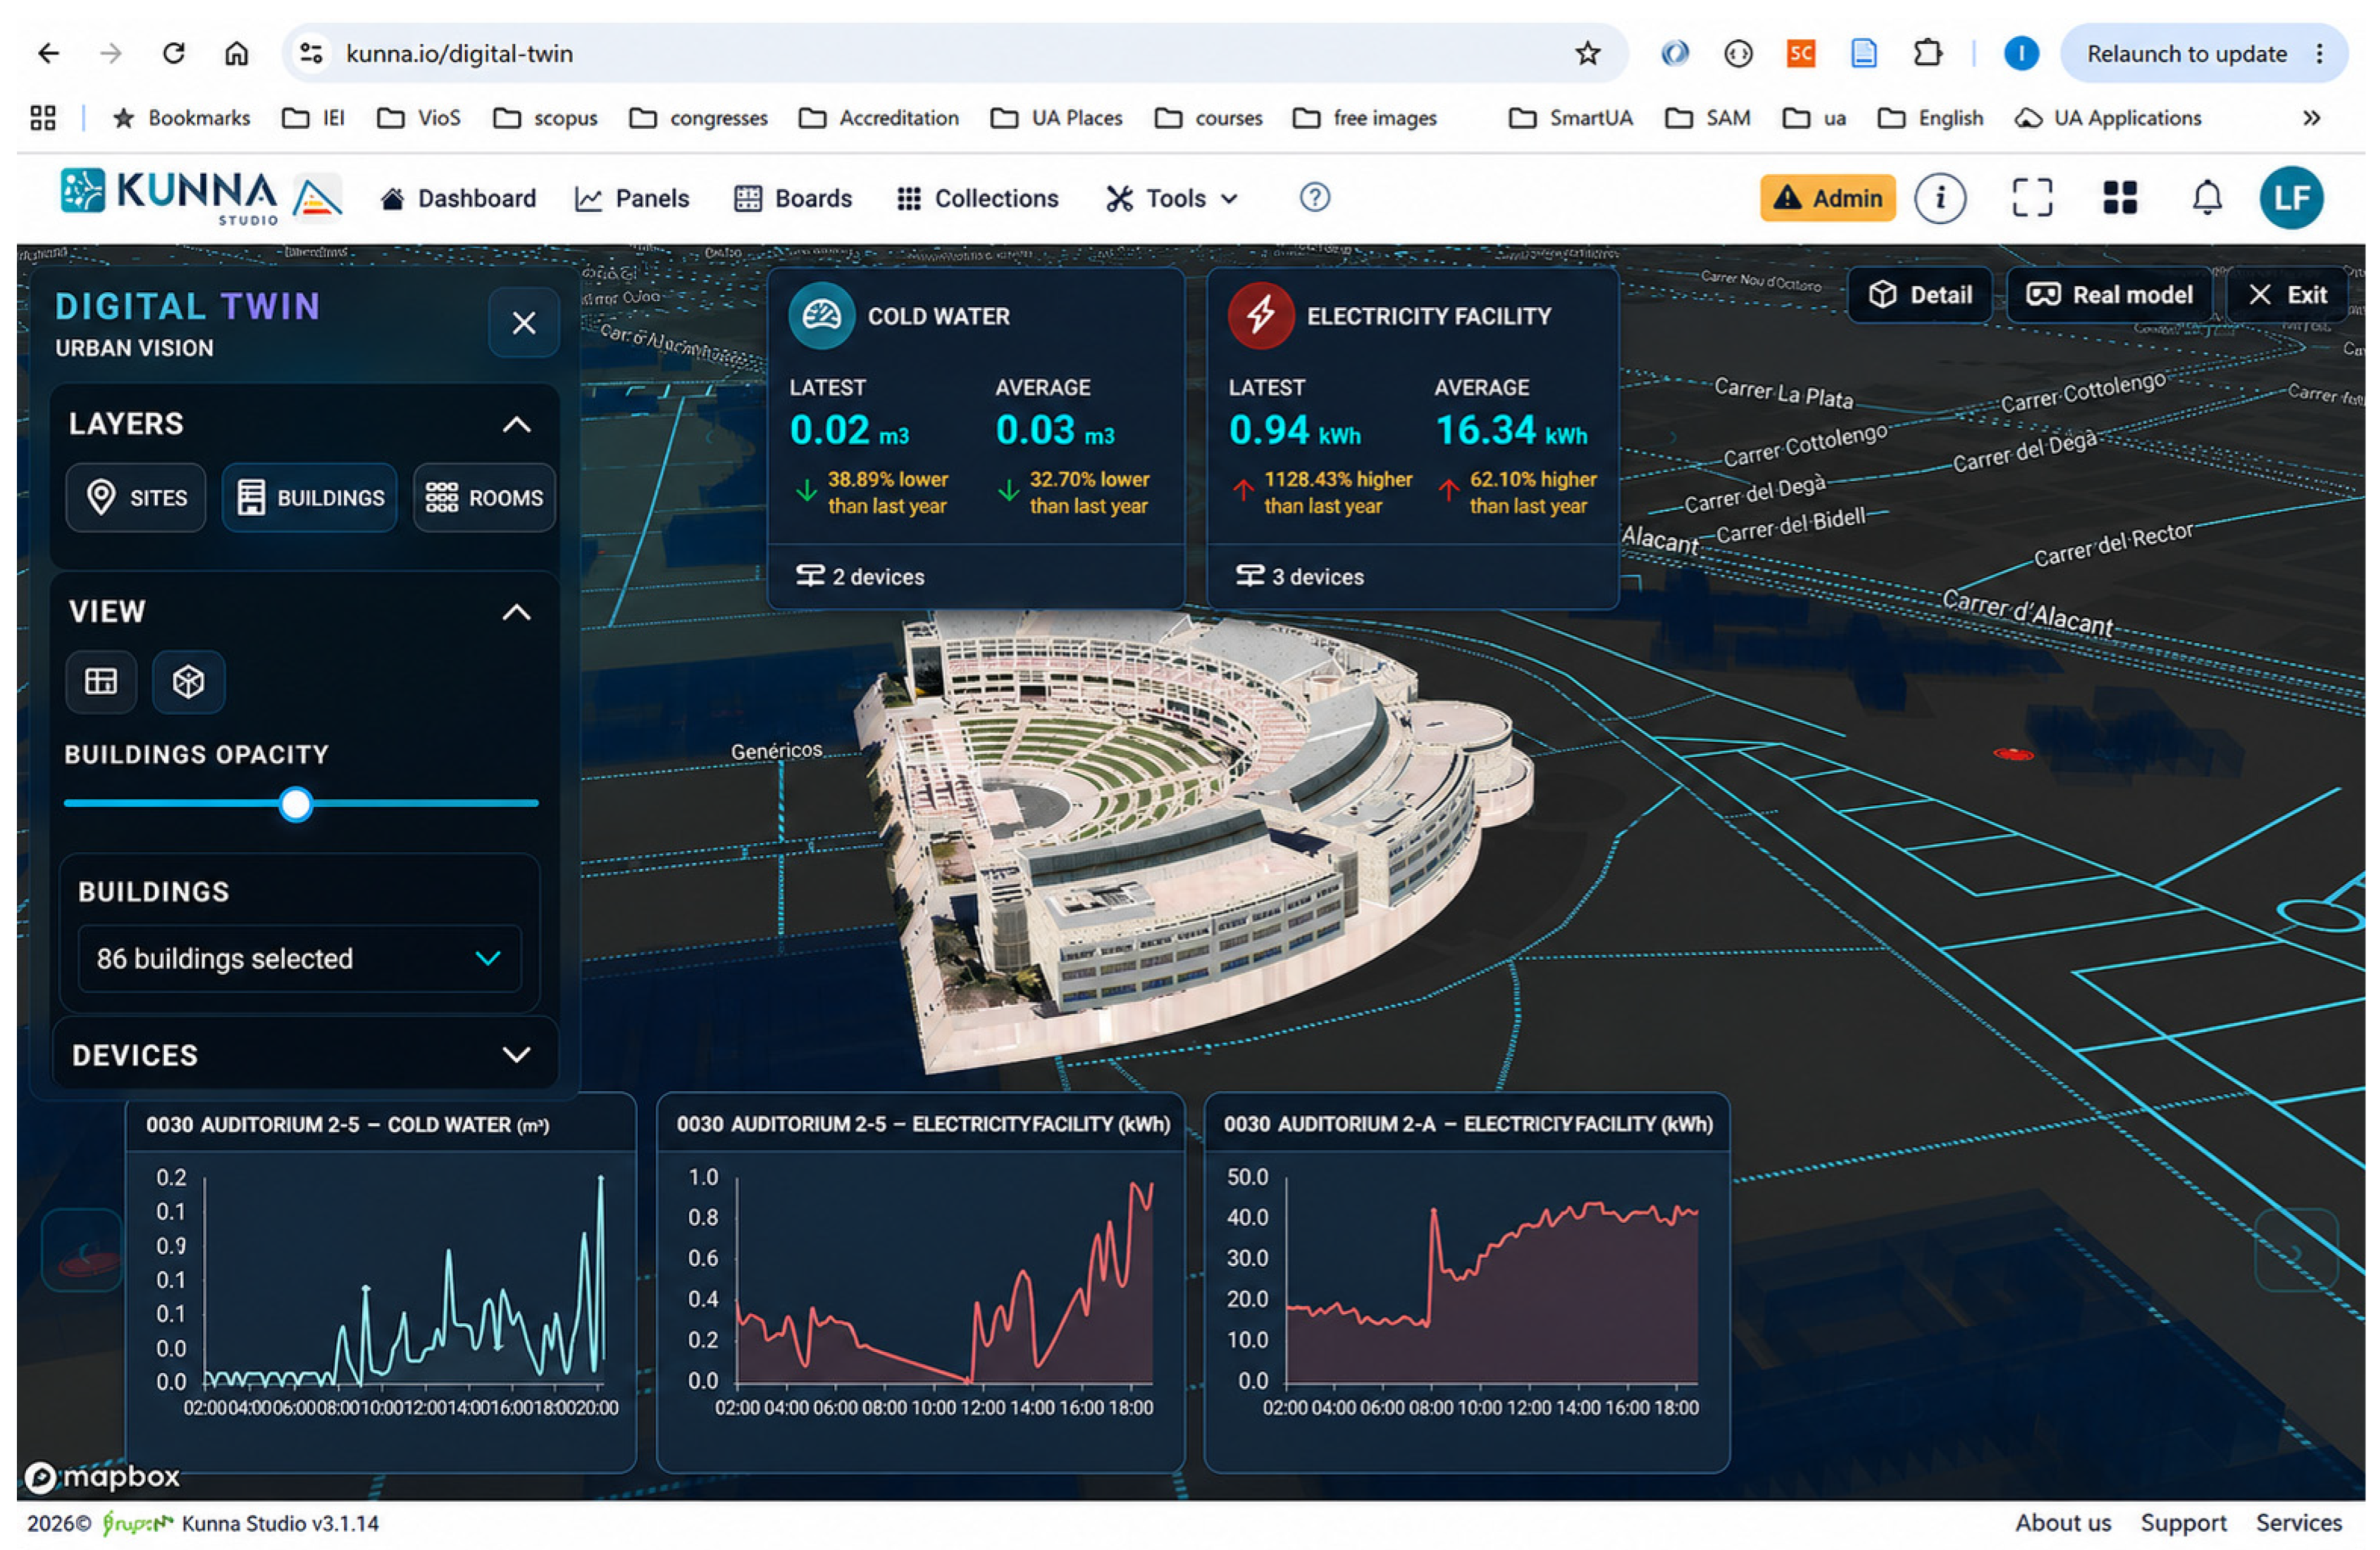
Figure 4 presents the digital twin environment integrated into Kunna.
Figure 4.
Three-dimensional digital twin of the University of Alicante campus integrating sensor data.
Through the digital twin environment, users can navigate the campus in three dimensions and access infrastructure information within its spatial context.
Together, the analytical interfaces and the digital twin provide complementary temporal and spatial perspectives of campus operation within a unified environment.
4.4. Digital Twin Synchronization and Spatial Context
A key aspect of Kunna is the association between operational measurements and their corresponding physical locations within the campus environment. Buildings, rooms, outdoor areas, and sensing devices are represented within the digital twin as spatial entities, allowing measurements to be interpreted within their physical context.
This spatial association enables the platform to move beyond conventional dashboard-based monitoring. Operational data can be explored not only as time-series measurements, but also as part of a continuously updated digital representation of the campus. In this way, Kunna acts as a campus-scale digital twin that continuously links physical campus assets, operational measurements, and their digital representation within a unified spatial environment.
This synchronization between the physical campus and its digital representation provides the basis for the monitoring, visualization, and anomaly detection use cases presented in the following sections.
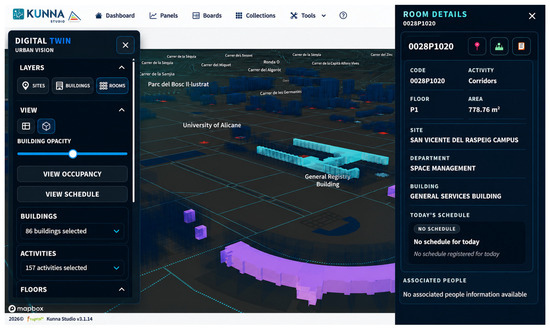
Figure 5 illustrates the spatial synchronization mechanisms integrated into the Kunna digital twin environment. Through the association of buildings, rooms, sensing devices, and operational measurements within a three-dimensional campus representation, the platform enables infrastructure data to be explored directly within its physical context. This integration allows users to navigate campus spaces, access contextual information associated with monitored areas, and visualize real-time measurements linked to their corresponding physical locations. This capability facilitates contextual interpretation of operational measurements and supports more intuitive campus supervision activities.
Figure 5.
Spatial synchronization between physical campus spaces and operational data within the digital twin environment.
5. Data Exploration and Analytical Visualization
Kunna provides several mechanisms for exploring time-series data generated by the infrastructures integrated into the smart campus environment. These capabilities allow users to analyze measurements across temporal and spatial scales through configurable graphical interfaces.
The platform supports time-series graphs, bar charts, comparative views, heat maps, and spatial representations integrated within the digital twin environment. These tools are intended to support both operational monitoring and exploratory analysis tasks, enabling users to identify trends, compare heterogeneous variables, and investigate infrastructure behavior across different campus domains.
Figure 6 presents examples of analytical panels used to explore different categories of time-series data.
Figure 6.
Analytical dashboards for infrastructure monitoring.
5.1. Temporal and Spatial Data Exploration
The platform allows users to explore infrastructure measurements over different temporal intervals, including daily, weekly, seasonal, and long-term periods. These representations support the comparison of variables collected from different infrastructures and facilitate the identification of temporal variations in environmental conditions, occupancy estimation, and resource consumption.
The system also incorporates spatial analysis mechanisms that enable monitored variables to be interpreted within the geographical context of the campus. By combining spatial representations with operational measurements, users can identify how infrastructure conditions vary across campus locations and relate observed patterns to their physical surroundings.
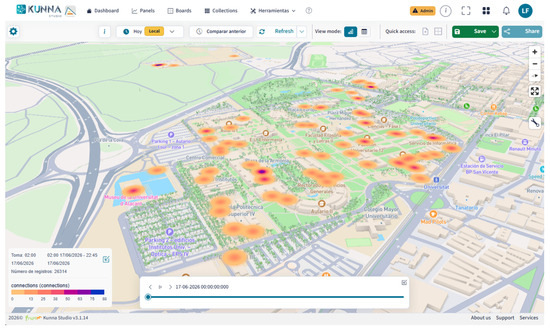
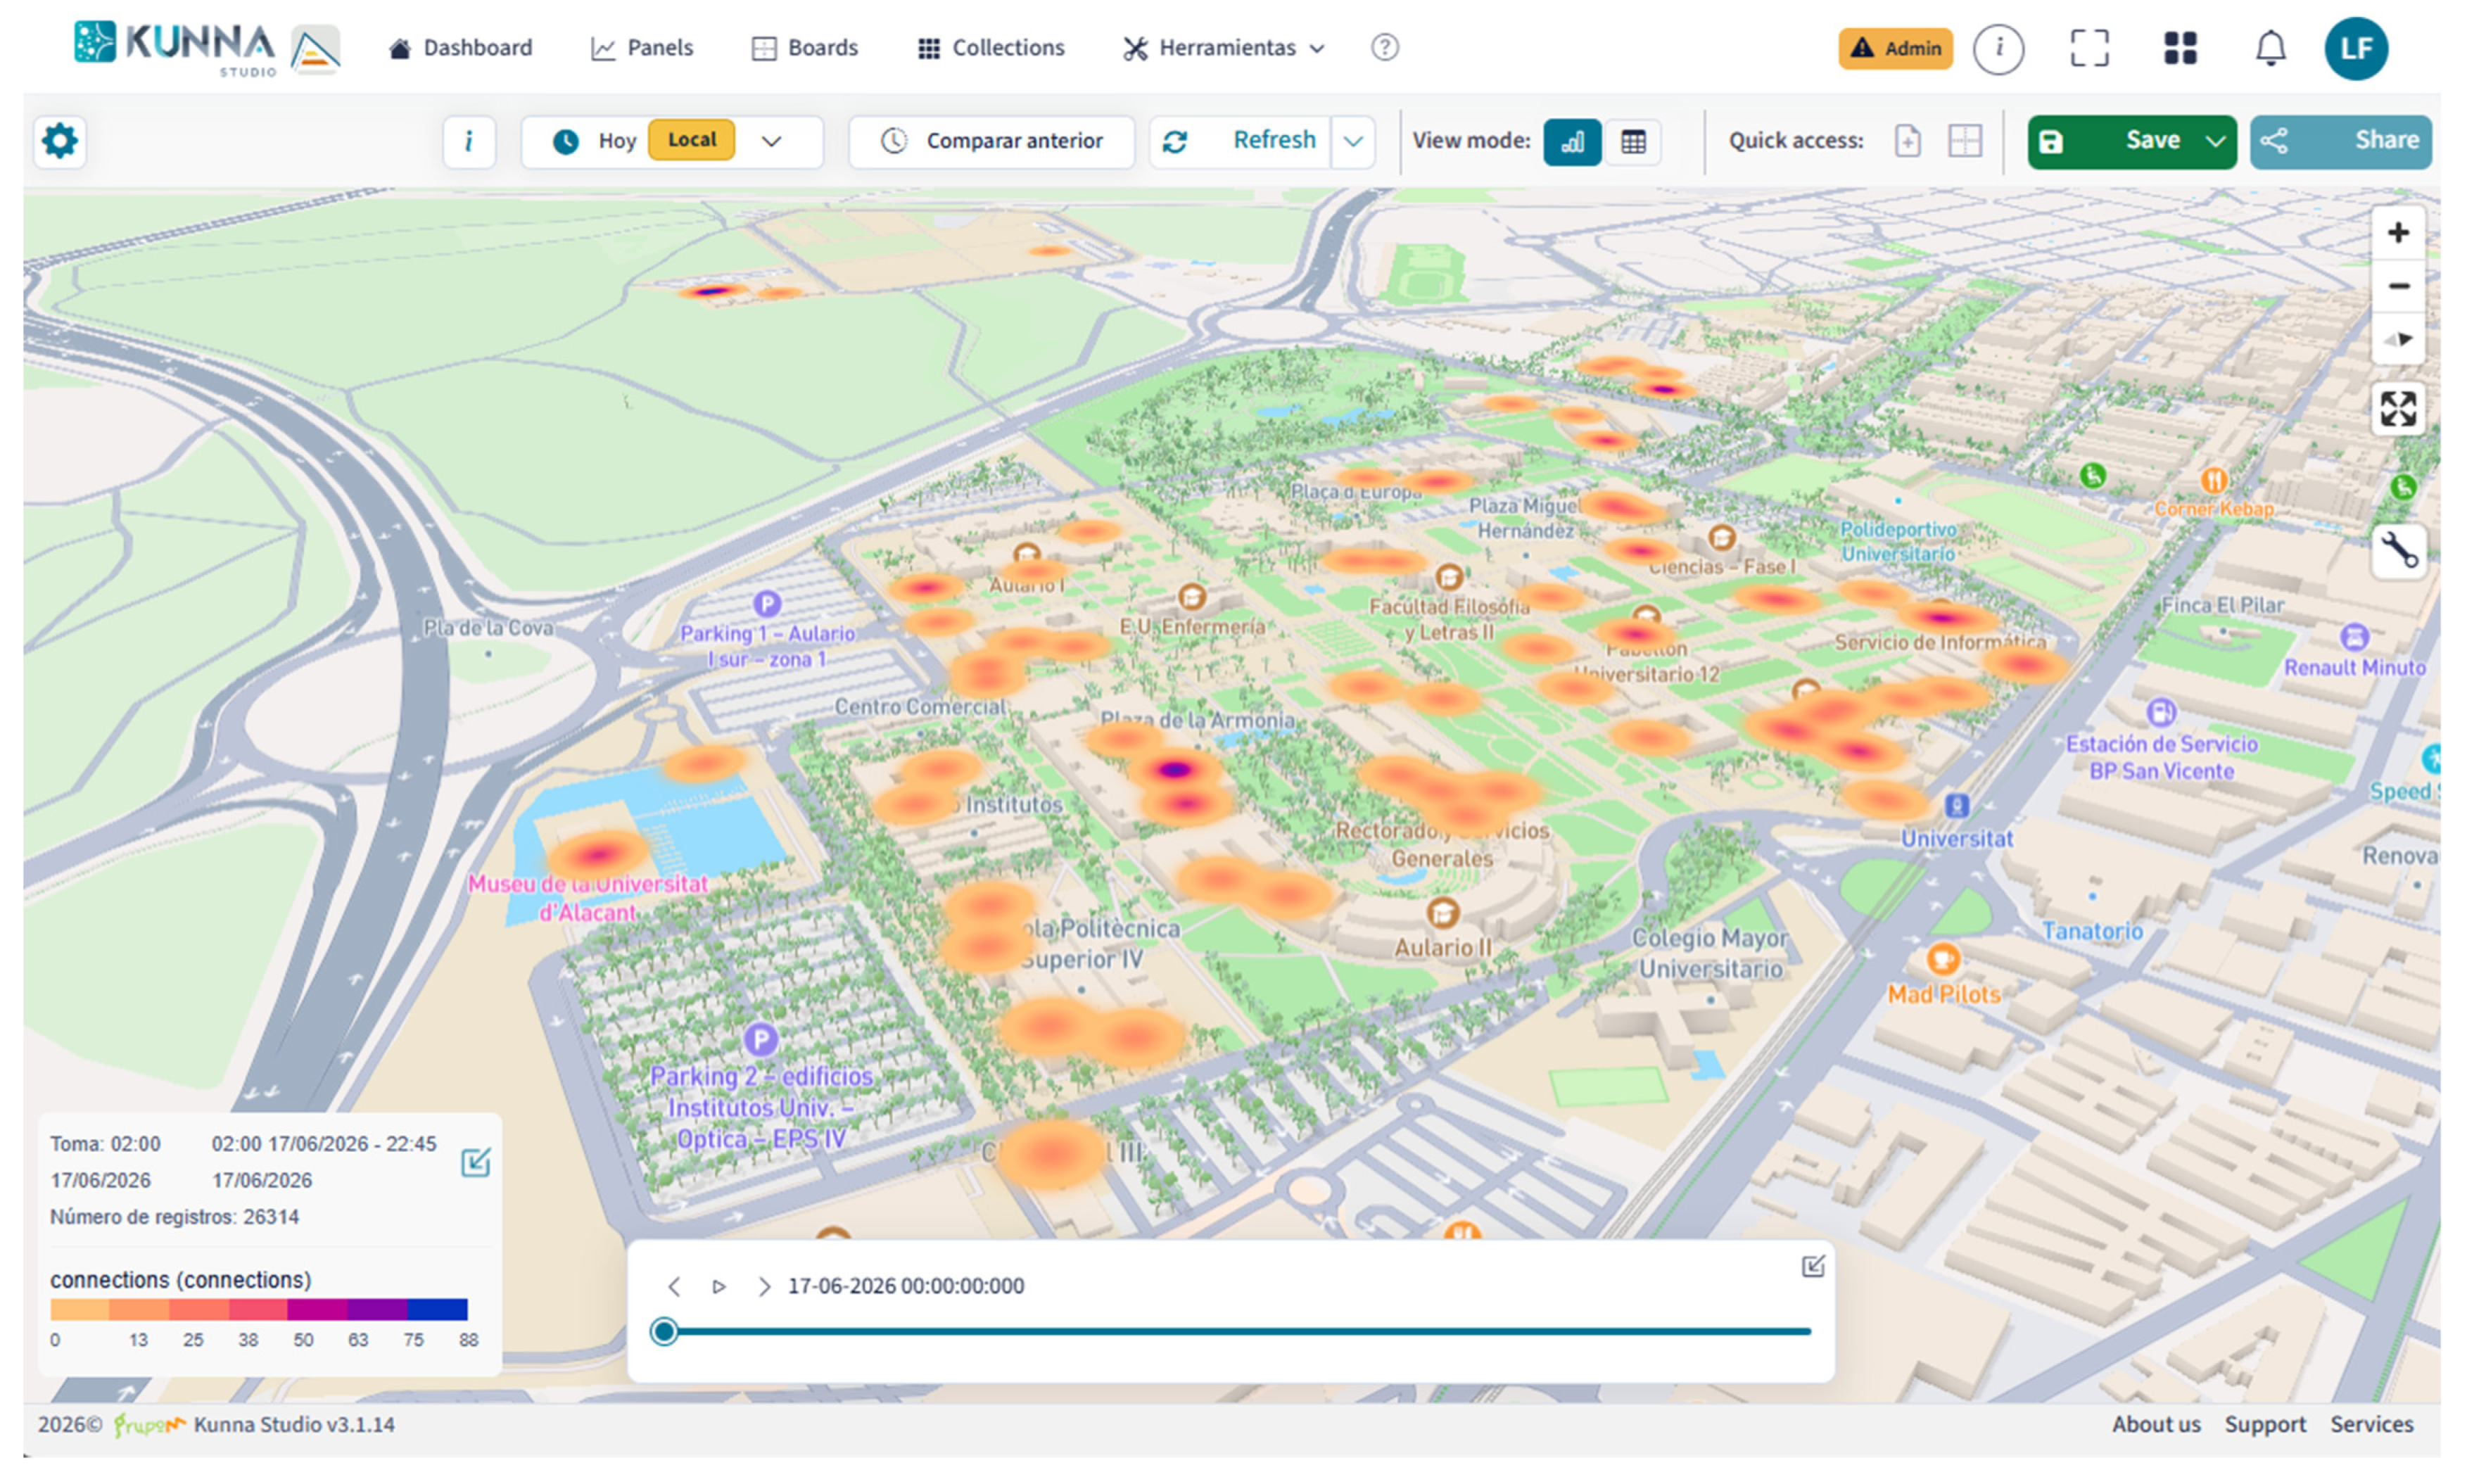
Figure 7 illustrates an example of spatial analysis using heat maps derived from WiFi connectivity information.
Figure 7.
Spatial visualization of infrastructure data.
These heat maps provide an intuitive representation of how occupancy-related measurements evolve across different campus areas over time. The integration of geographical context with operational data facilitates the interpretation of campus activity patterns and supports the identification of areas exhibiting different usage behaviors.
5.2. Cross-Analysis of Infrastructure Data
One of the analytical capabilities provided by Kunna is the possibility of combining and comparing measurements obtained from different infrastructures within the same analytical view. This functionality enables the exploration of relationships between variables collected from independent data sources through synchronized graphical representations.
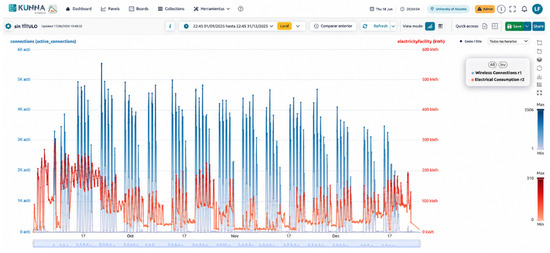
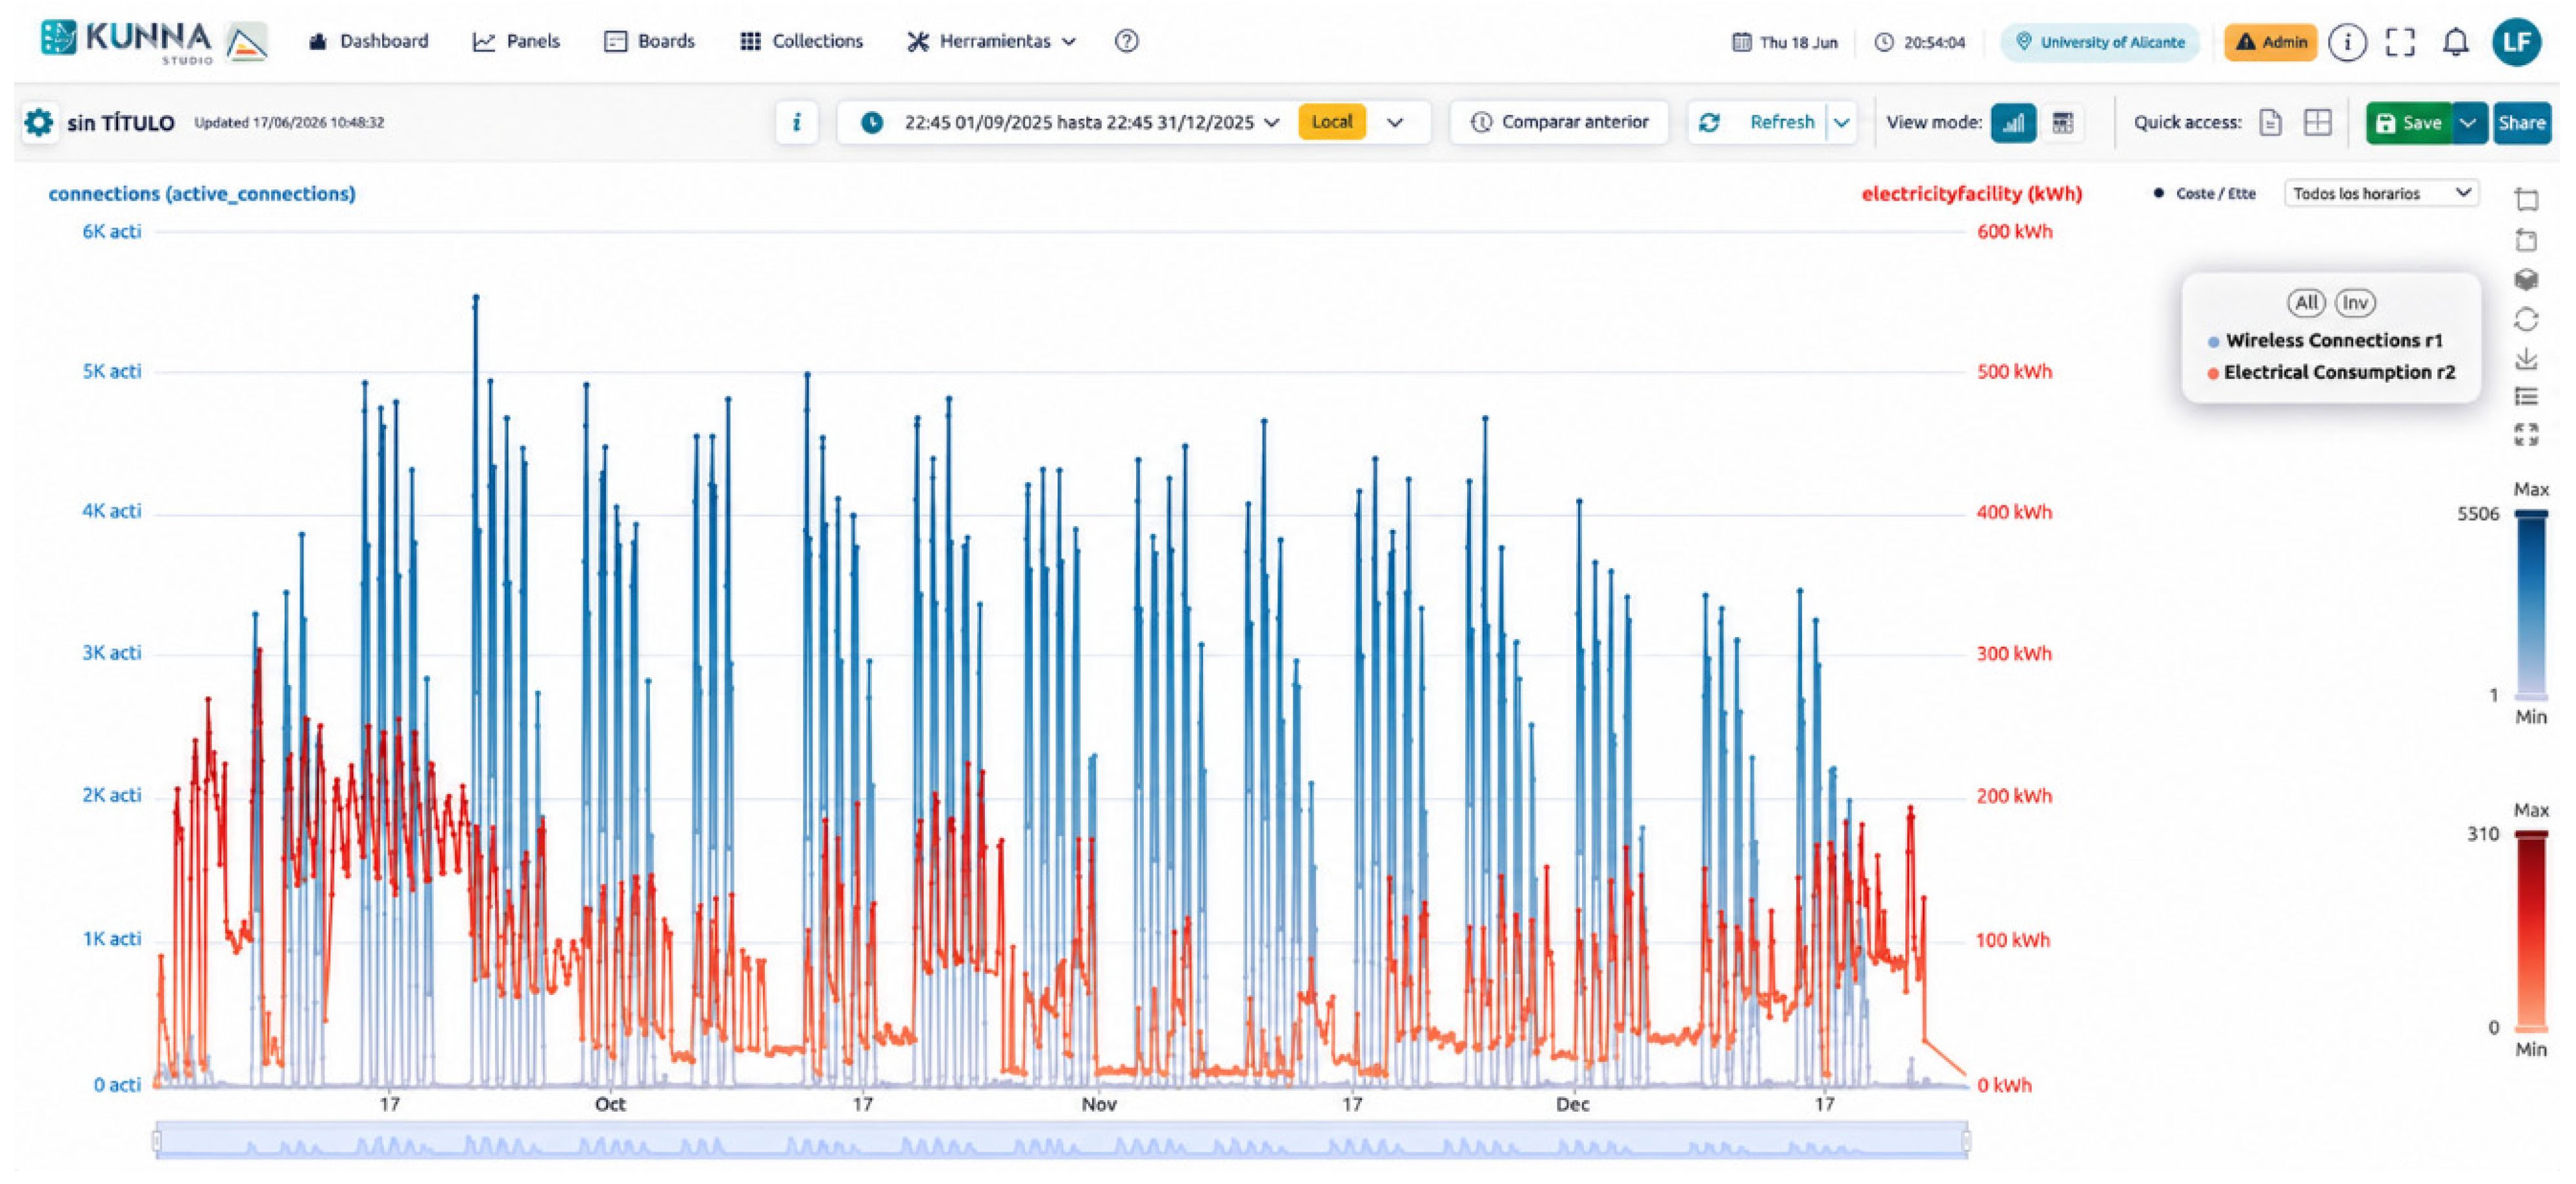
Figure 8 presents an example of cross-analysis combining WiFi connectivity information with electricity consumption measurements.
Figure 8.
Cross-analysis of heterogeneous infrastructure data.
The integration of heterogeneous datasets facilitates multi-variable exploration and comparative analysis across different temporal scales. This capability is particularly relevant in campus environments where operational phenomena often emerge from the interaction between multiple independent infrastructures rather than from isolated measurements. The possibility of jointly analyzing occupancy indicators, environmental conditions, and resource consumption measurements provides a richer understanding of campus dynamics and operational behavior.
5.3. Integrated Monitoring Dashboards
The platform also incorporates configurable thematic dashboards that consolidate multiple indicators within unified analytical views. These dashboards allow users to organize information associated with specific monitoring scenarios and support day-to-day operational supervision.
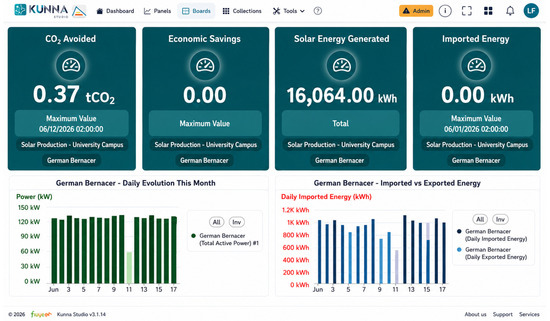
Thematic dashboards integrate environmental indicators, classroom status information, pollutant measurements, and renewable energy production data. By consolidating heterogeneous indicators within a common interface, they provide a comprehensive overview of campus conditions and support both operational monitoring and long-term analysis.
The capabilities described in this section provide the basis for the use cases presented in Section 7.
6. Platform Deployment in the University of Alicante Smart Campus
The digital twin platform has been progressively deployed within the University of Alicante Smart Campus as part of an ongoing institutional initiative focused on campus digitalization and sustainability-oriented management processes.
The deployment has evolved over several years through the incorporation of multiple monitoring systems and operational datasets associated with buildings, environmental conditions, resource consumption, renewable energy generation, and campus connectivity services.
The deployment currently covers the entire University of Alicante campus and integrates monitoring infrastructures distributed across 88 buildings. Electricity consumption, water consumption, and WiFi-based occupancy estimation services are available campus-wide, providing comprehensive coverage of the main university facilities. In addition, indoor environmental quality monitoring is currently deployed in 15 monitored spaces distributed across two representative buildings, while irrigation telemetry is available in 12 irrigation sectors distributed throughout the campus grounds. This heterogeneous sensing infrastructure enables the continuous collection of operational measurements across multiple domains and constitutes the basis of the campus-scale digital twin environment.
6.1. Deployment Scale and Historical Datasets
The deployment scale of the Kunna platform was introduced in Section 3 (Table 3). This section focuses on the operational maturity of the deployment and the historical datasets accumulated through more than a decade of continuous operation.
One of the main strengths of Kunna is the availability of large-scale historical datasets collected from operational infrastructures distributed across the campus environment.
Continuous data acquisition has been maintained since 2014, allowing Kunna to progressively accumulate approximately 300–400 million operational measurements. The current historical repository exceeds 40 GB of time-series data describing environmental conditions, resource consumption, occupancy estimation, and infrastructure operation across the campus.
The long-term availability of these datasets enables the exploration of temporal trends, comparative analyses, and the evolution of infrastructure behavior over extended time periods. Rather than serving solely as a historical repository, the accumulated data provide the foundation for several operational and analytical services currently deployed within Kunna. Historical measurements are used to calibrate the WiFi-based occupancy estimation methodology described in Section 7.2, to establish baseline operational patterns supporting infrastructure anomaly detection, and to train AI models supporting occupancy prediction, comfort assessment, and anomaly detection services integrated into the platform. Several of these AI-based analytical services, including energy anomaly detection and intelligent environmental assessment, have been previously described and experimentally validated using anonymized subsets of the historical datasets managed by the platform [27,28]. These datasets are publicly available through the corresponding publications and can be used to reproduce and benchmark the associated AI methodologies. These examples illustrate how the accumulated historical data continuously support both operational services and research activities within the digital twin environment.
In addition to the deployment scale, the maturity of Kunna can also be characterized through operational indicators associated with its continuous use. Table 4 summarizes representative metrics related to data ingestion, alert generation, AI-enabled analytical services, and institutional operation.
Table 4.
Operational indicators of the Kunna platform.
Within Kunna, alerts correspond to automatic notifications generated when monitored variables exceed predefined operational thresholds. In contrast, infrastructure incidents refer to anomalous operational conditions identified through historical anomaly analysis that require investigation or corrective actions. Consequently, not every alert results in an incident, and incidents may involve a more comprehensive analytical assessment than simple threshold exceedance.
These indicators illustrate that Kunna is not only a large-scale sensing infrastructure but also an actively used operational platform supporting daily monitoring, infrastructure supervision, and institutional decision-making processes.
The reported infrastructure incidents correspond to anomalies that have been reviewed through the university maintenance workflow before corrective actions are undertaken.
6.2. Operational and Institutional Integration
Beyond its role as a research platform, Kunna is currently used as an operational tool supporting monitoring activities within the university environment.
The platform is being progressively integrated into campus management workflows in collaboration with the University of Alicante Vice-Rectorate for Infrastructure and Sustainability. This collaboration has enabled the incorporation of supervision processes associated with environmental conditions, resource consumption, and operational monitoring activities. Kunna is currently used by infrastructure managers, maintenance personnel, library management staff, and more than 25 research groups, supporting both institutional management activities and research initiatives.
To support these activities, the system incorporates configurable alerting mechanisms that allow notifications to be generated when monitored variables exceed predefined operational thresholds. These mechanisms support the early identification of abnormal conditions associated with environmental indicators, resource consumption measurements, or operational anomalies.
In this way, operational events occurring within the physical campus environment are reflected within the digital twin through synchronized visualizations, analytical reports, and automated alert generation mechanisms.
Beyond monitoring activities, Kunna has progressively evolved into a strategic data integration platform supporting infrastructure supervision and sustainability-oriented decision-making processes. Historical analyses and anomaly reports generated by the platform have contributed to the identification of multiple incidents related to abnormal water and electricity consumption patterns, enabling technical personnel to investigate infrastructure inefficiencies and resource management issues.
The platform is also being incorporated into operational maintenance workflows. Current developments focus on integrating maintenance work orders and operational records with infrastructure measurements, allowing facility managers and technical personnel to analyze maintenance activities together with historical sensor data and infrastructure performance indicators. This integration is expected to strengthen the role of the digital twin as a decision-support environment for campus operations.
Beyond operational management, Kunna has become an important institutional data source supporting research activities across different disciplines. The platform currently provides data for studies related to occupancy analysis, mobility patterns, environmental comfort, sustainability assessment, and infrastructure performance evaluation. For example, ongoing research activities are using occupancy, environmental, and meteorological data collected by Kunna to analyse pedestrian mobility patterns and identify climate-comfortable routes across the campus environment.
The platform also integrates information obtained from institutional information systems, including academic schedules and enrolment data, which can be combined with occupancy measurements to provide additional contextual information about the use of campus facilities. This capability facilitates a more comprehensive interpretation of infrastructure utilization patterns and strengthens the connection between operational monitoring and institutional processes.
Finally, the institutional consolidation of Kunna has influenced the definition of new infrastructure acquisition and deployment strategies within the university. As additional monitoring systems are incorporated into the campus environment, interoperability and data accessibility requirements are increasingly considered to facilitate their integration into the digital twin platform. This approach supports the continuous evolution of Kunna and contributes to the long-term sustainability of the smart campus ecosystem.
The institutional integration of the platform has also promoted the progressive evaluation of new sensing deployments, allowing the digital twin environment to evolve together with the physical campus environment.
The continuous operational use of Kunna has contributed to consolidating the smart campus as a living laboratory where new sensing technologies, analytical services, and digital twin functionalities can be progressively evaluated under real operational conditions while simultaneously supporting data-driven campus management and sustainability-oriented decision-making.
7. Infrastructure Monitoring Use Cases
This section presents representative use cases illustrating the operational application of the Kunna digital twin platform within the University of Alicante environment. The selected examples demonstrate how the platform supports infrastructure supervision, occupancy analysis, environmental monitoring, and operational decision-making processes through the integration of heterogeneous data sources within a unified digital environment.
7.1. Indoor Environmental Quality and Comfort Monitoring
Kunna is currently used by the University of Alicante Vice-Rectorate for Infrastructure and Sustainability as a centralized monitoring environment for supervising campus infrastructures and supporting sustainability-oriented management activities. The platform consolidates information associated with electricity consumption, water usage, renewable energy production, and indoor environmental conditions, allowing technical personnel to evaluate the operational status of campus facilities through a unified interface. The information managed by the platform also contributes to sustainability assessment activities aligned with institutional and external evaluation frameworks, including university sustainability indicators and environmental reporting initiatives.
Environmental monitoring dashboards provide continuous information about temperature, relative humidity, CO2 concentration, and air quality indicators, facilitating the evaluation of comfort conditions in classrooms, libraries, and other shared spaces. Similar monitoring services are available for energy consumption, water management, irrigation systems, and photovoltaic installations distributed across the campus environment.
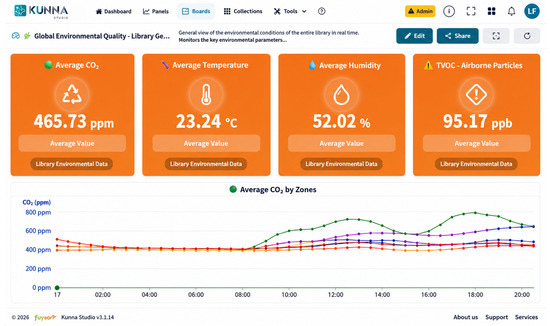
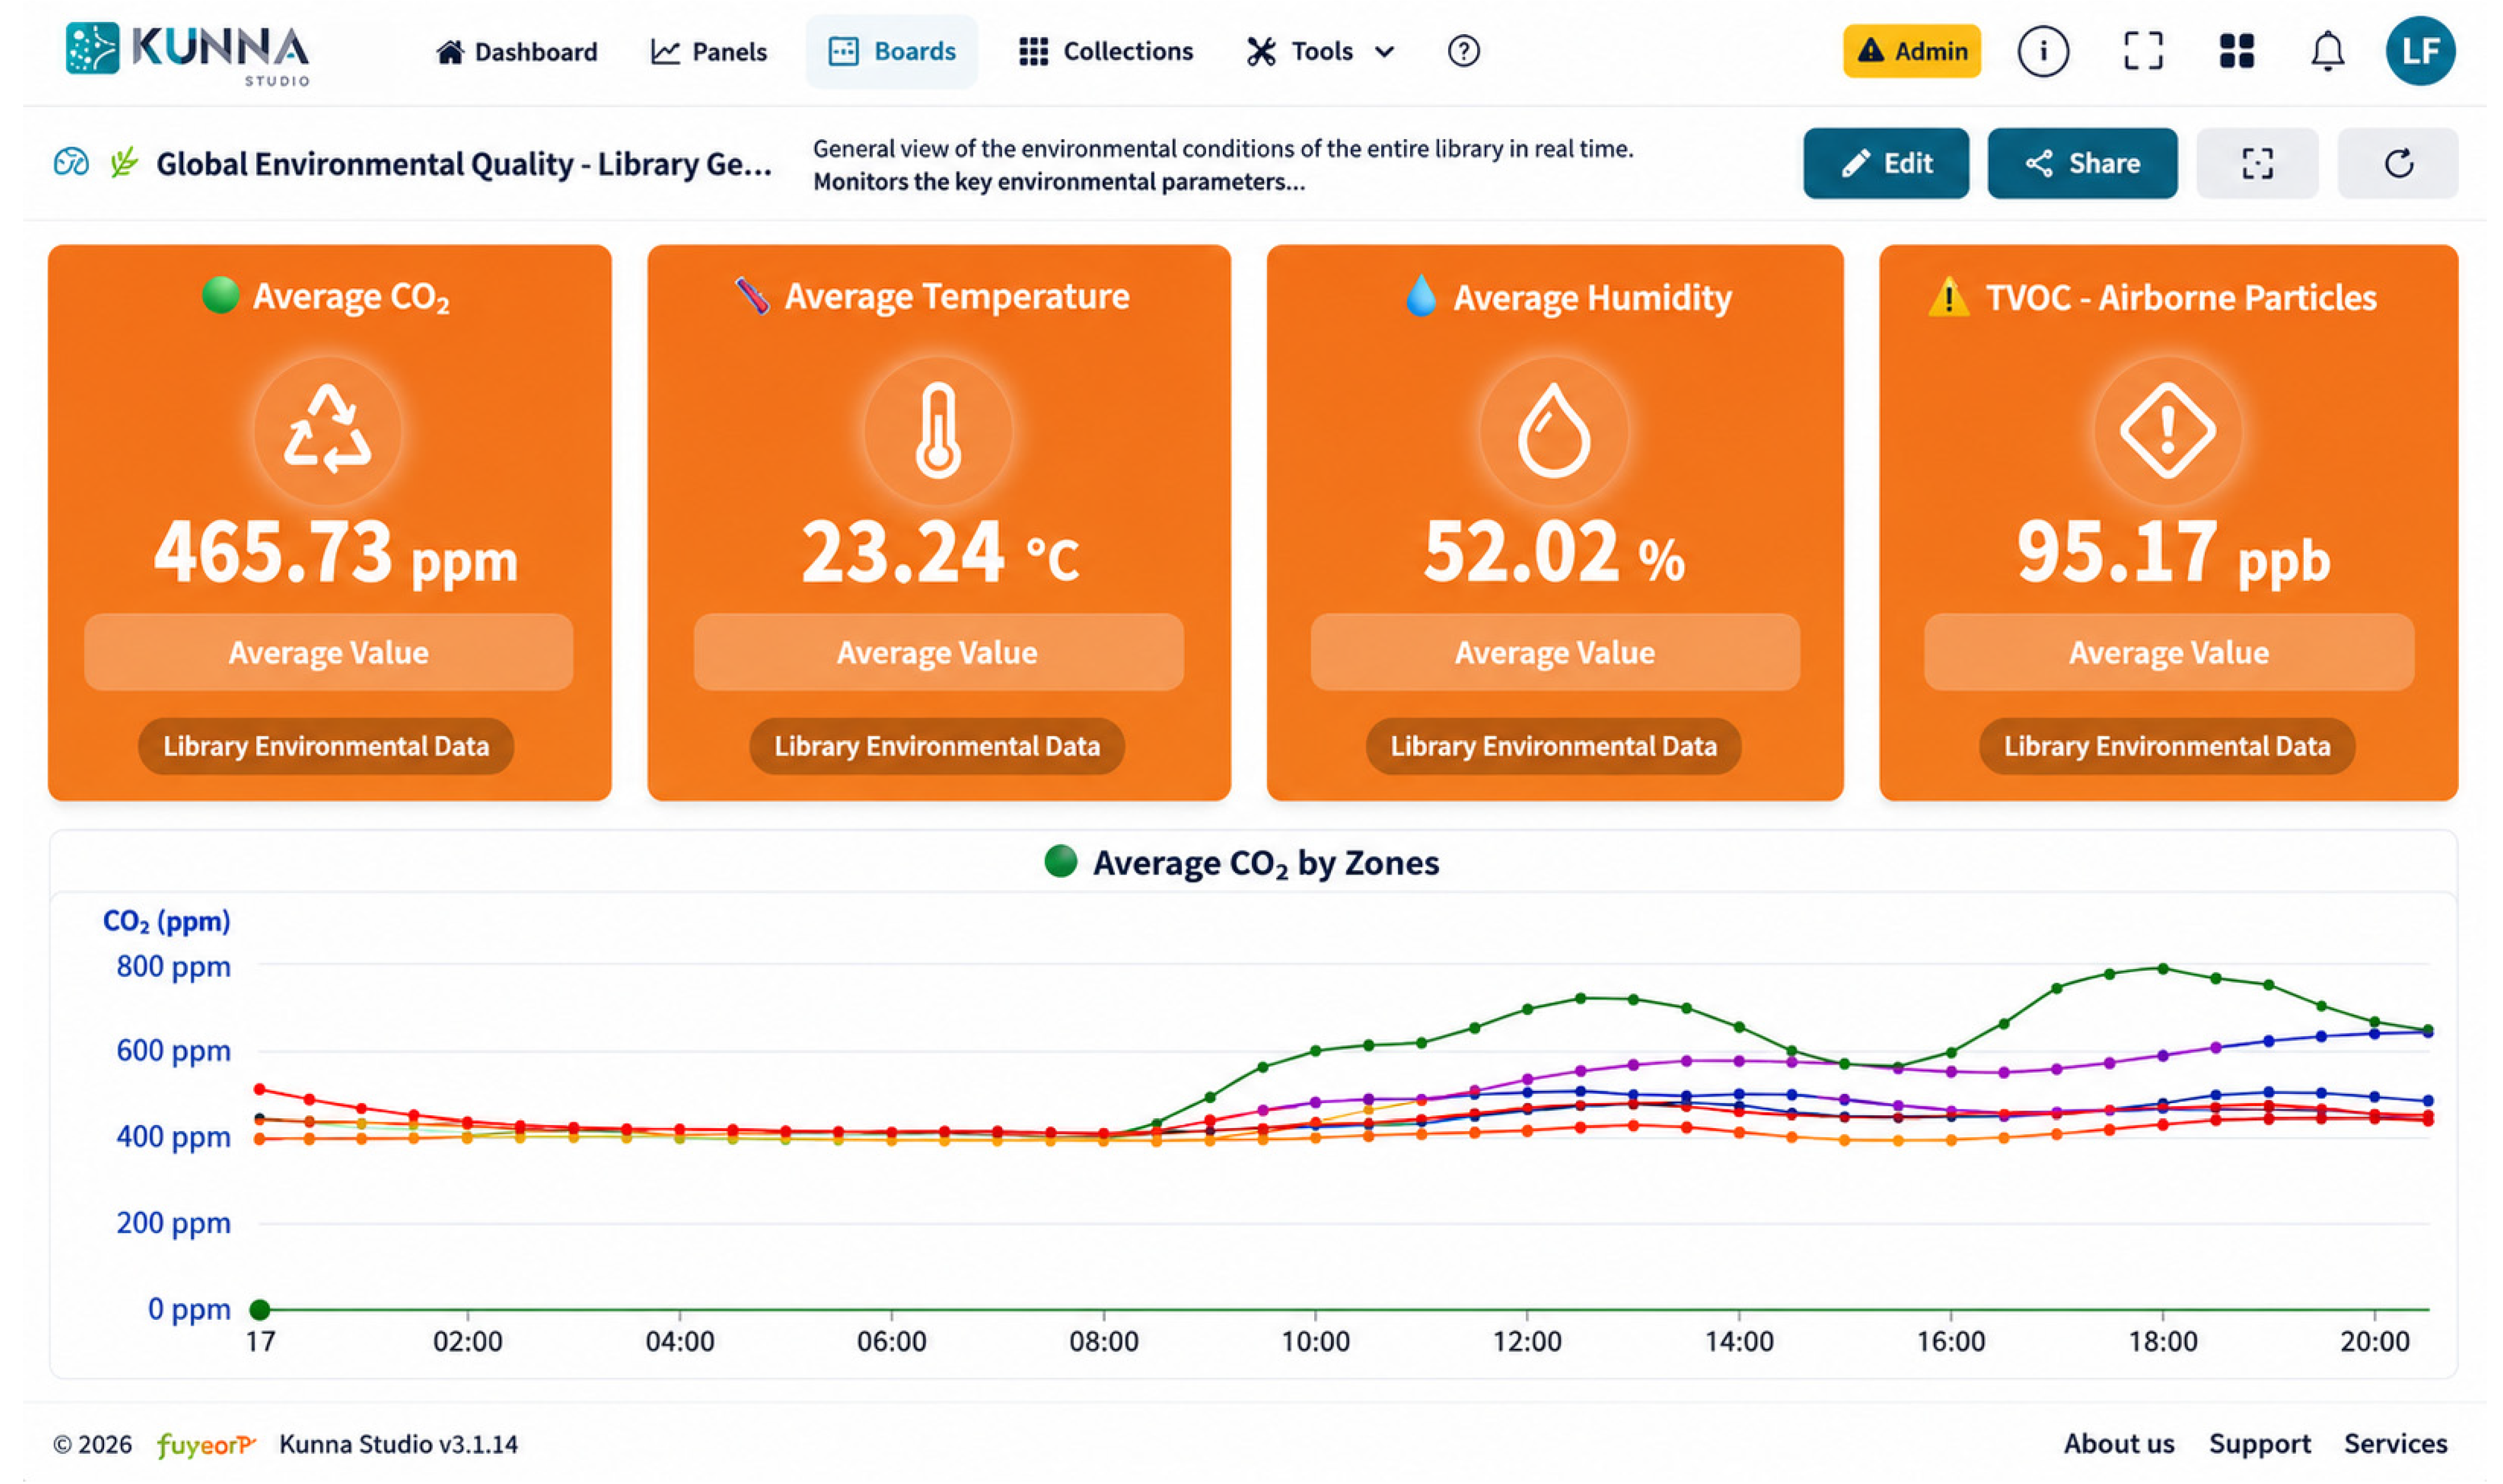
The integration of these monitoring domains within a common analytical environment enables cross-domain analyses and contributes to a more comprehensive understanding of infrastructure behavior. Through configurable dashboards and historical visualizations, users can explore operational trends, compare monitored spaces, and evaluate the impact of management actions over time. Figure 9 shows an example of an environmental monitoring dashboard integrating indoor air quality and comfort indicators within the university library environment.
Figure 9.
Environmental monitoring dashboard integrating indoor air quality and comfort indicators.
7.2. Occupancy and Space Utilization Analysis
Occupancy estimation constitutes another relevant application domain supported by the digital twin platform. Kunna combines information obtained from WiFi connectivity services and occupancy sensing infrastructures to provide a continuous overview of space utilization across different campus facilities.
Occupancy estimation is primarily derived from the number of client devices connected to the university WiFi infrastructure. Since the number of connected devices does not directly correspond to the number of occupants, Kunna applies an empirically derived calibration coefficient obtained through the long-term analysis of historical WiFi connectivity data together with complementary occupancy indicators, including registered enrolment information, indoor CO2 measurements, direct field observations performed by the research team, and dedicated people-counting sensors recently deployed in the university library. The operational coefficient is periodically updated as additional historical operational data become available, reflecting the continuous evolution of the platform. Consequently, the current value of 0.87 occupants per active WiFi connection should be interpreted as an empirically calibrated operational parameter rather than as a fixed universal constant. This calibration accounts for permanently connected devices, multiple devices associated with a single occupant, and users who are present without connecting to the wireless network. The resulting estimates are intended to support operational monitoring, space utilization analysis, and long-term occupancy studies rather than exact headcount estimation.
These capabilities are currently employed to support occupancy supervision within university libraries, where real-time occupancy indicators provide information about space availability, utilization levels, and user distribution patterns. Such information facilitates the management of shared spaces and contributes to improving user experience within highly frequented facilities.
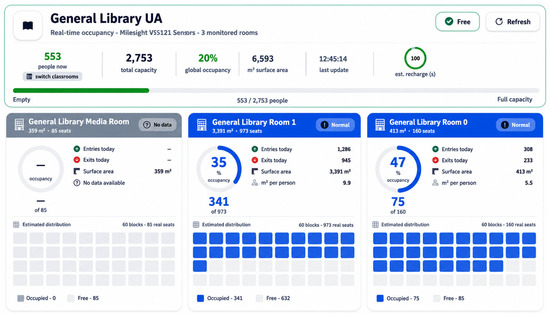
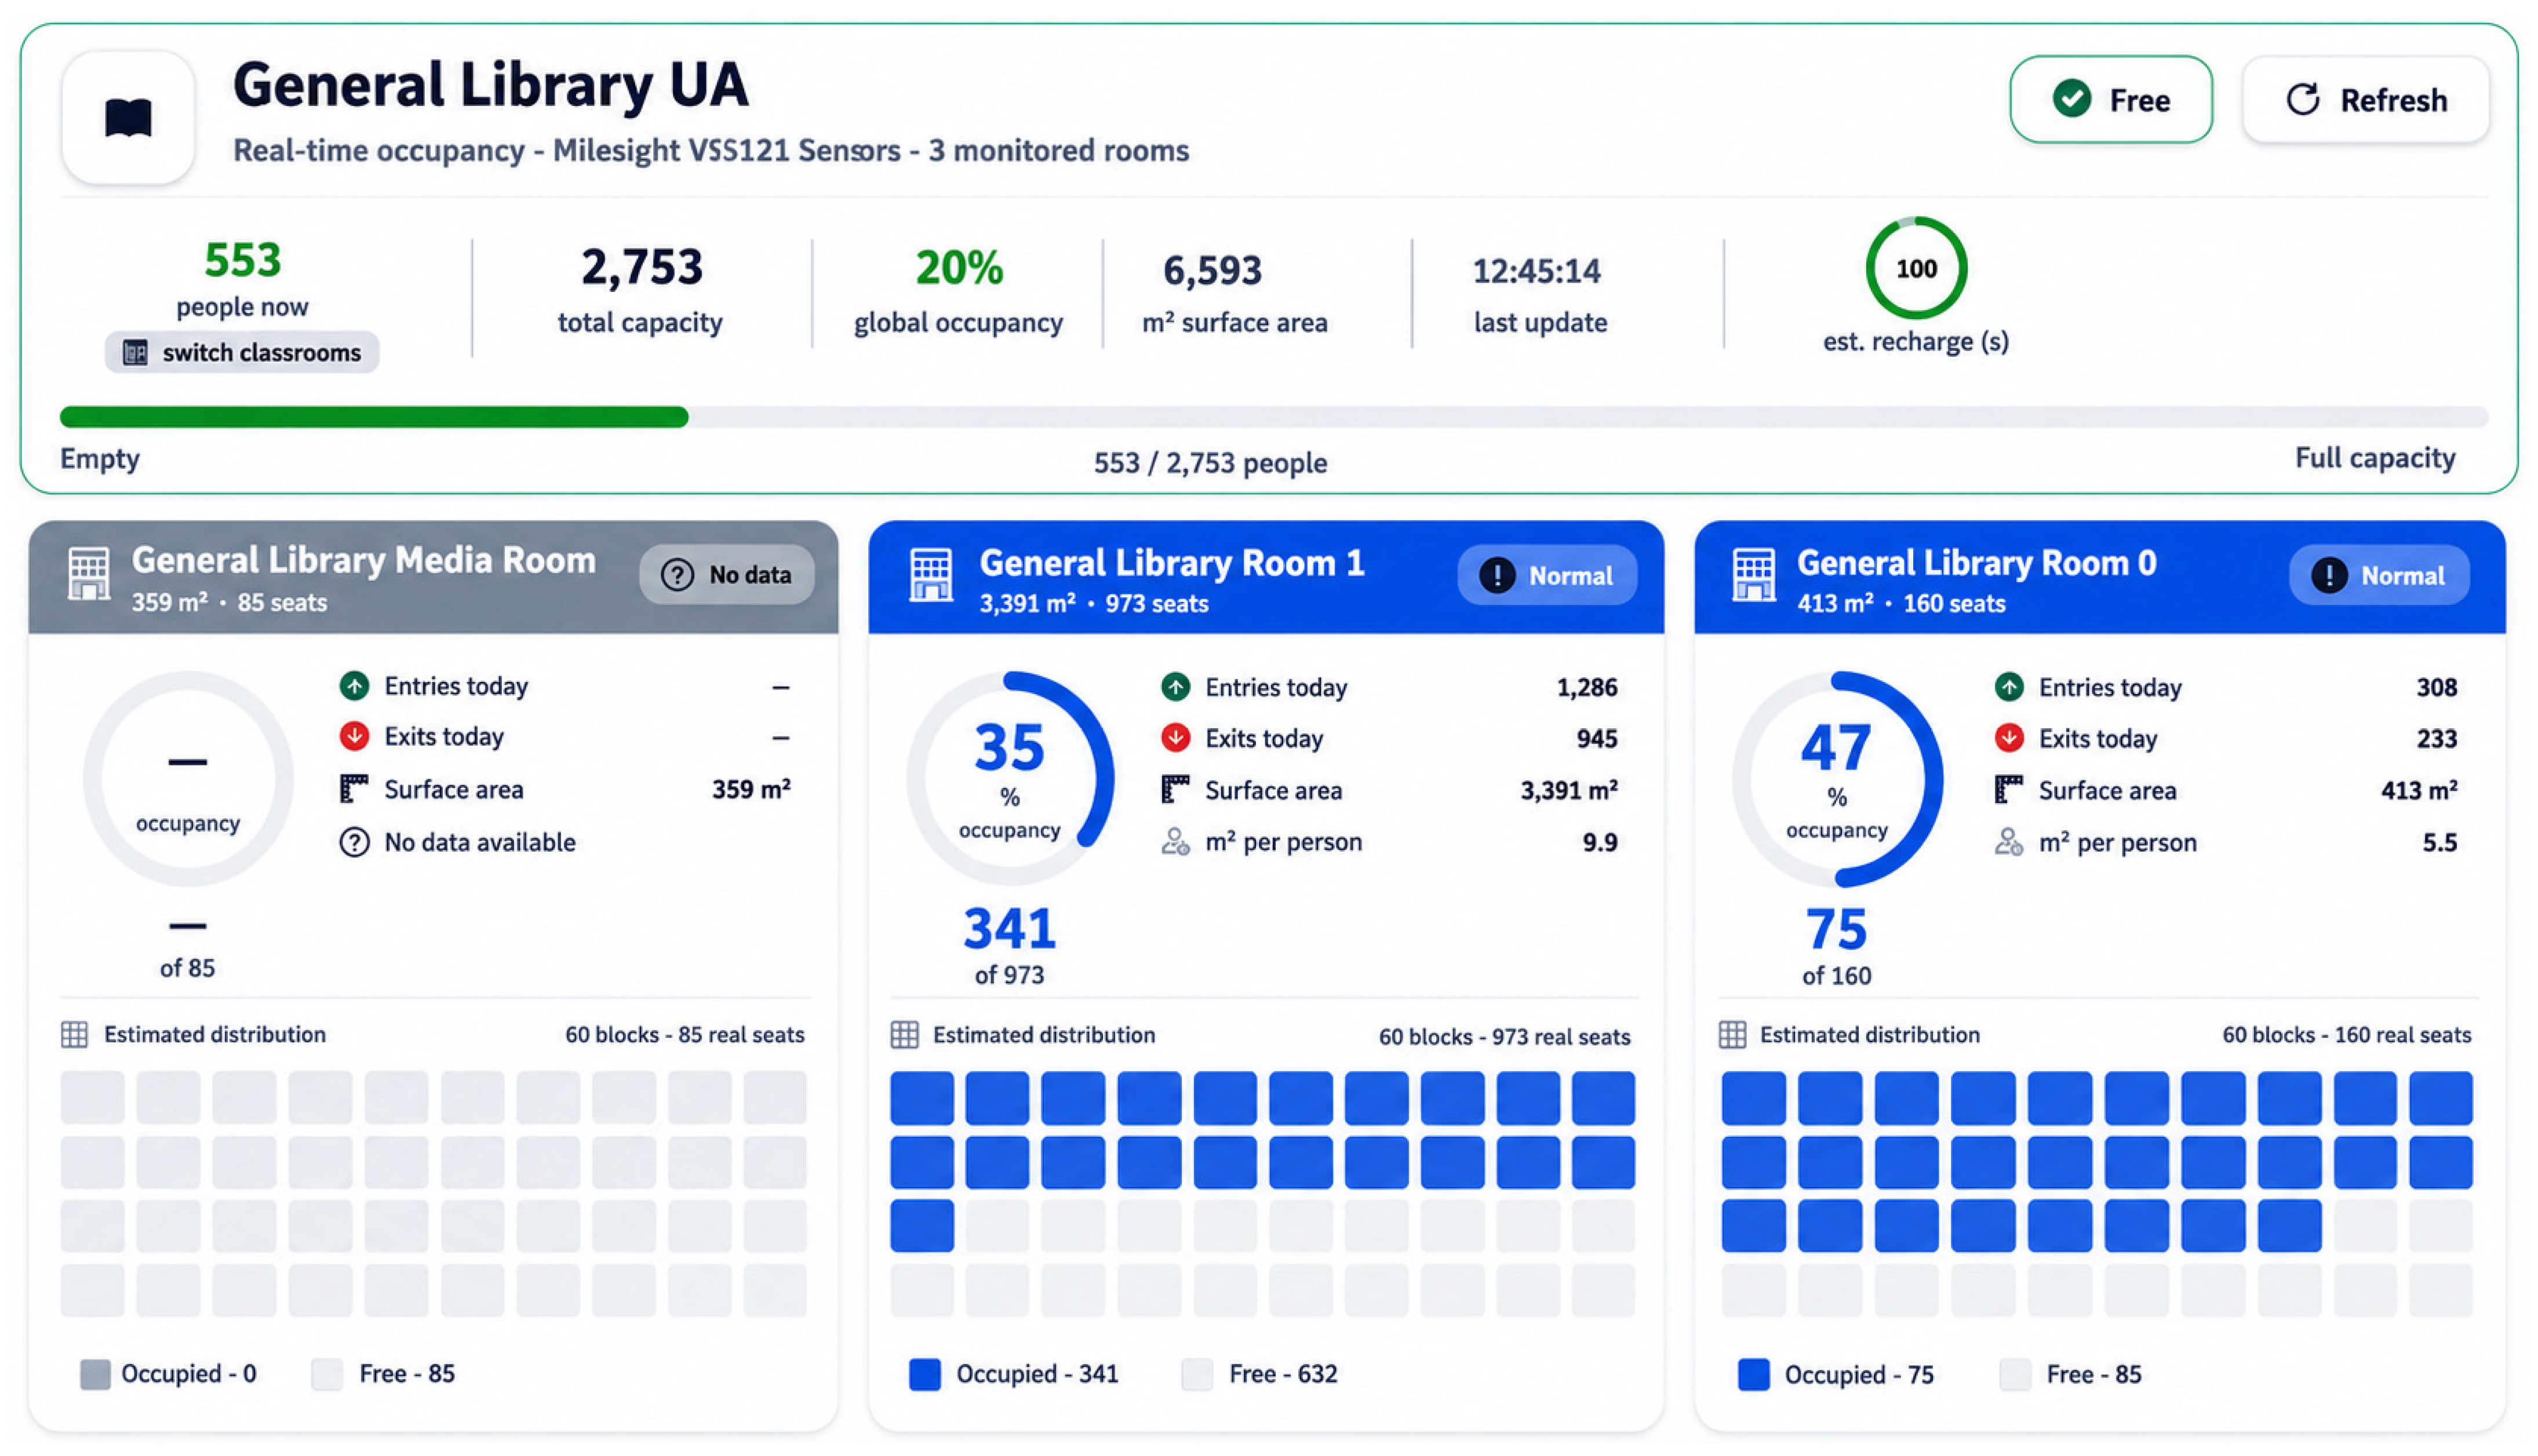
Beyond operational supervision, occupancy information has become an important source of data for research activities conducted within the university. Current studies are exploring mobility patterns, space utilization dynamics, and pedestrian circulation behavior across the campus environment using datasets managed by the platform. The integration of occupancy information with environmental and infrastructure data further enables the analysis of relationships between comfort conditions, user behavior, and resource utilization. Figure 10 illustrates a real-time occupancy monitoring dashboard used to analyze space utilization within the university library environment.
Figure 10.
Real-time occupancy monitoring and space utilization analysis within the university library environment.
7.3. Infrastructure Anomaly Detection
The large historical repositories managed by Kunna enable the application of analytical mechanisms aimed at identifying abnormal infrastructure behavior and supporting operational decision-making processes. Historical measurements associated with water consumption, electricity usage, environmental conditions, and other monitored variables can be analyzed to detect deviations from expected operational patterns.
The generated anomaly detection reports have been successfully used to identify unusual water and electricity consumption behaviors associated with infrastructure incidents, operational inefficiencies, and abnormal resource usage conditions. By comparing current measurements against historical patterns, the platform assists technical personnel in prioritizing inspections and investigating potential issues affecting campus infrastructures.
In addition to analytical reporting, Kunna incorporates configurable alerting mechanisms that generate notifications whenever monitored variables exceed predefined operational thresholds. These mechanisms support the early detection of abnormal conditions and contribute to reducing response times during infrastructure supervision activities.
The platform is currently being progressively integrated into operational maintenance workflows, where anomaly reports and alerting mechanisms assist technical staff in prioritizing corrective actions and improving infrastructure management processes. The combination of historical analysis, anomaly detection reports, and automated alerts has enabled a more proactive monitoring strategy and reinforces the role of the operational digital twin as a decision-support environment supporting infrastructure management and sustainability-oriented operational processes.
Although the present work does not attempt to quantify the environmental or economic savings directly attributable to the platform, Kunna provides the operational information required to support sustainability-oriented management processes. In practice, anomaly reports and automated alerts have enabled the identification of multiple abnormal electricity and water consumption events, facilitating maintenance interventions and contributing to more efficient resource management. From this perspective, the contribution of the platform lies in supporting data-driven operational decision-making rather than directly delivering sustainability outcomes.
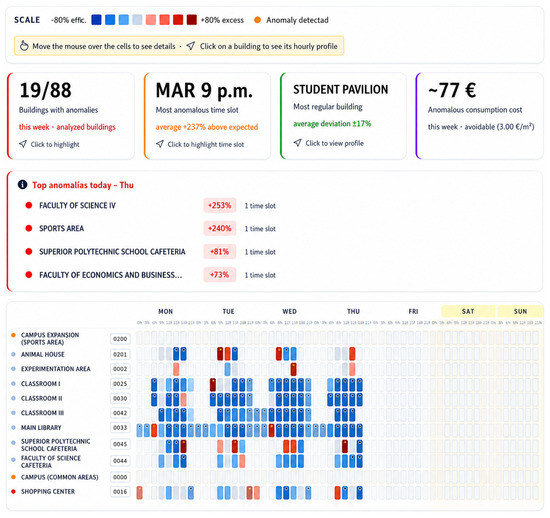
Figure 11 presents an example of an infrastructure anomaly detection report generated from water consumption measurements.
Figure 11.
Example of infrastructure anomaly detection report.
Anomaly detection in Kunna follows a hybrid strategy that combines expert-defined operational thresholds, statistical analysis of historical operating patterns, and AI-based anomaly detection models depending on the monitored service. The specific methodology is selected according to the characteristics of each monitored variable, allowing each monitoring service to employ the detection strategy most appropriate to its operational characteristics. For example, water consumption anomalies are identified through statistical deviations from historical usage patterns, including abnormal water consumption during low-activity or nighttime periods, while environmental comfort monitoring incorporates AI-based techniques for anomaly identification. This modular design enables different anomaly detection methodologies to coexist within the same platform while facilitating the future incorporation of additional AI models, including deep learning approaches, without modifying the underlying platform architecture.
8. Discussion
The results presented in this work illustrate the feasibility of deploying a campus-scale digital twin platform capable of integrating operational data from multiple monitoring systems within a unified environment.
In this work, the concept of digital twin is adopted from an operational perspective, consistent with the recent literature recognizing different levels of digital twin maturity according to the intended application domain [1,5,7]. This interpretation is also aligned with recent standardization efforts for the built environment, where digital twins encompass different operational capabilities depending on their intended application and maturity level [5]. From this perspective, the emphasis is placed on the continuous synchronization between physical infrastructures, operational measurements, and their digital representation rather than on predictive simulation, what-if analysis, or closed-loop control. Consequently, Kunna is presented as an operational digital twin supporting monitoring, supervision, and decision-making, while predictive simulation, what-if analysis, and autonomous optimization constitute future stages in the evolution of the platform.
One of the most relevant aspects of the proposed approach is the integration of temporal analytics and spatial visualization mechanisms within the same operational framework. While many digital twin proposals focus either on graphical representations or isolated monitoring systems, the presented platform combines analytical dashboards, geospatial visualization, and historical operational datasets within a spatially synchronized digital environment. This approach moves beyond conventional dashboard-based monitoring by maintaining a continuously updated digital representation of the campus environment linked to its corresponding physical spaces.
The proposed approach additionally enables operational conditions occurring within the physical campus environment to be reflected within the digital twin through synchronized monitoring, reporting, and alerting mechanisms.
Another significant contribution is the long-term operational nature of the deployment. In contrast to experimental or laboratory-scale digital twin implementations frequently described in the literature, the presented platform has evolved over several years as part of an institutional smart campus initiative. This continuous operation has enabled the accumulation of large historical datasets and the progressive incorporation of new monitoring capabilities.
The institutional integration of Kunna represents an important differentiating factor. The collaboration with university management units has facilitated the transition from a research-oriented deployment toward an operational environment supporting real supervision activities, anomaly reporting, and alert generation processes. Beyond monitoring and reporting functions, the platform has progressively evolved into a shared operational asset used by different institutional stakeholders. Information generated by Kunna supports infrastructure supervision activities, sustainability initiatives, occupancy assessment, environmental monitoring, and resource management processes. The integration of operational datasets with institutional information sources provides additional contextual knowledge that facilitates the interpretation of infrastructure behavior and enables more informed decision-making processes.
Beyond its institutional adoption, Kunna also illustrates the role of campus digital twins as living laboratories for the continuous evaluation of sensing technologies, analytical services, and data-driven management strategies under real operational conditions [6,16]. The university campus provides a controlled but complex environment where new monitoring systems, interoperability mechanisms, and decision-support services can be progressively tested, validated, and incorporated into institutional workflows.
The modular organization of the architecture additionally facilitates scalability and interoperability. This architectural approach enables the deployment to evolve incrementally while preserving compatibility between heterogeneous sensing systems, analytical services, and visualization components. Consequently, the proposed approach can be applied to other complex built environments beyond university campuses while maintaining synchronization between operational measurements and their spatial representation within the digital twin environment.
Another relevant aspect is the role of the platform as a data ecosystem rather than a standalone monitoring application. The continuous incorporation of heterogeneous data sources and the growing institutional requirement for interoperable interfaces have enabled Kunna to become a central integration point for campus information. This strategy not only simplifies the incorporation of new sensing infrastructures but also facilitates future integrations with maintenance systems, operational workflows, and advanced analytical services.
Despite these advantages, several limitations remain. Kunna depends on the availability and reliability of distributed sensing systems, and incomplete sensor coverage or communication failures may affect data continuity. In addition, although the platform provides extensive visualization and exploration capabilities, the interpretation of operational behavior still requires expert knowledge in many scenarios. Furthermore, maintaining synchronization between physical infrastructures, institutional information systems, and digital representations requires continuous governance efforts. Changes in sensing deployments, building configurations, or operational procedures must be consistently reflected within the platform to preserve data quality and semantic consistency across the digital twin environment.
Although the proposed calibration procedure improves the representativeness of WiFi-based occupancy estimation, this approach remains subject to inherent limitations. Occupancy estimates may still be affected by changes in user connectivity behavior, variations in the number of personal devices carried by users, or visitors who do not connect to the institutional WiFi network. These factors may influence the robustness of occupancy estimation over extended operational periods. Consequently, the operational coefficient is periodically updated based on historical operational data and complementary occupancy indicators to maintain reliable long-term operational estimates. Future work will further validate and refine the calibration methodology using the recently deployed vision-based people-counting sensors once sufficiently long-term datasets become available.
Future developments will focus on extending Kunna from an operational digital twin towards a more autonomous digital twin framework through the incorporation of predictive analytics, operational condition modelling, what-if scenario analysis, anomaly diagnosis services, and AI-based decision-support mechanisms. Additional efforts are also being directed towards the integration of maintenance workflows, work-order management systems, advanced occupancy and mobility analysis, and tighter integration with institutional operational processes.
9. Conclusions
This paper presented Kunna, a campus-scale digital twin deployed at the University of Alicante as part of its Smart Campus initiative. The platform integrates heterogeneous operational datasets, sensing infrastructures, analytical services, and spatial representations within a unified environment that combines historical data management, analytical visualization, and geospatial exploration capabilities.
The presented deployment demonstrates how digital twin technologies can evolve beyond isolated monitoring applications and become operational platforms supporting the management of complex built environments. Through the integration of environmental monitoring systems, energy and water consumption infrastructures, occupancy estimation mechanisms, renewable energy assets, and institutional information sources, Kunna provides a continuously updated digital representation of campus operations linked to their physical context.
A distinguishing aspect of the presented work is its long-term operational deployment and institutional adoption. The platform is currently used to support infrastructure supervision, sustainability initiatives, anomaly detection processes, environmental monitoring activities, and research projects, illustrating the potential of digital twins to act as shared data ecosystems connecting operational, analytical, and decision-support processes. The modular architecture additionally enables the progressive incorporation of new sensing systems and services while preserving interoperability and scalability.
The results obtained demonstrate the feasibility of deploying and maintaining a campus-scale digital twin capable of supporting both operational management and research activities through the integration of heterogeneous data sources within a spatially synchronized environment.
Future work will focus on extending the analytical capabilities of the platform through the incorporation of predictive analytics, AI-based anomaly diagnosis mechanisms, advanced occupancy and mobility analysis services, and tighter integration with maintenance workflows and operational decision-support processes.
Author Contributions
Conceptualization, I.L.-F., F.M.-P. and O.G.-M.; methodology, I.L.-F., F.M.-P. and O.G.-M.; software, I.L.-F., J.M.S.-B. and F.M.-P.; validation, I.L.-F., O.G.-M. and J.M.S.-B.; formal analysis, I.L.-F. and F.M.-P.; investigation, I.L.-F., O.G.-M., J.M.S.-B. and F.M.-P.; resources, O.G.-M. and J.M.S.-B.; data curation, I.L.-F. and J.M.S.-B.; writing—original draft preparation, I.L.-F.; writing—review and editing, I.L.-F., O.G.-M., J.M.S.-B. and F.M.-P.; visualization, I.L.-F. and J.M.S.-B.; supervision, F.M.-P.; project administration, I.L.-F. and F.M.-P. All authors have read and agreed to the published version of the manuscript.
Funding
This research received no external funding.
Data Availability Statement
The complete operational dataset cannot be publicly released because it contains institutional operational information and occupancy-related data. However, anonymized subsets of the datasets used to develop and validate specific AI services have been previously published, are publicly available through the studies referenced in [27,28], and can be used to reproduce the corresponding AI methodologies.
Acknowledgments
The authors acknowledge the University of Alicante Vice-Rectorate for Infrastructure, Sustainability and Occupational Safety and Vice-Rectorate for Digital Transformation for their collaboration in the deployment and operational use of the Kunna Smart Campus platform.
Conflicts of Interest
The authors declare no conflict of interest.
References
- Jones, D.; Snider, C.; Nassehi, A.; Yon, J.; Hicks, B. Characterising the Digital Twin: A systematic literature review. CIRP J. Manuf. Sci. Technol. 2020, 29, 36–52. [Google Scholar] [CrossRef] [Scilit]
- Deng, M.; Menassa, C.C.; Kamat, V.R. From BIM to digital twins: A systematic review of the evolution of intelligent building representations in the AEC-FM industry. J. Inf. Technol. Constr. ITcon 2021, 26, 58–83. [Google Scholar] [CrossRef] [Scilit]
- Boje, C.; Guerriero, A.; Kubicki, S.; Rezgui, Y. Towards a semantic Construction Digital Twin: Directions for future research. Autom. Constr. 2020, 114, 103179. [Google Scholar] [CrossRef] [Scilit]
- Fuller, A.; Fan, Z.; Day, C.; Barlow, C. Digital Twin: Enabling Technologies, Challenges and Open Research. IEEE Access 2020, 8, 108952–108971. [Google Scholar] [CrossRef] [Scilit]
- CEN/TR 18077:2024; Building Information Modelling. Digital Twins Applied to the Built Environment. Use Cases. CEN: Brussels, Belgium, 2024. Available online: https://www.nen.nl/en/cen-tr-18077-2024-en-328811 (accessed on 20 June 2026).
- Min-Allah, N.; Alrashed, S. Smart campus—A sketch. Sustain. Cities Soc. 2020, 59, 102231. [Google Scholar] [CrossRef] [Scilit] [PubMed]
- Mousavi, Y.; Gharineiat, Z.; Karimi, A.A.; McDougall, K.; Rossi, A.; Gonizzi Barsanti, S. Digital Twin Technology in Built Environment: A Review of Applications, Capabilities and Challenges. Smart Cities 2024, 7, 2594–2615. [Google Scholar] [CrossRef] [Scilit]
- Omrany, H.; Al-Obaidi, K.M.; Husain, A.; Ghaffarianhoseini, A. Digital Twins in the Construction Industry: A Comprehensive Review of Current Implementations, Enabling Technologies, and Future Directions. Sustainability 2023, 15, 10908. [Google Scholar] [CrossRef] [Scilit]
- Ma, T.; Xiao, F.; Zhang, C.; Zhang, J.; Zhang, H.; Xu, K.; Luo, X. Digital twin for 3D interactive building operations: Integrating BIM, IoT-enabled building automation systems, AI, and mixed reality. Autom. Constr. 2025, 176, 106277. [Google Scholar] [CrossRef] [Scilit]
- Hu, X.; Olgun, G.; Assaad, R.H. An intelligent BIM-enabled digital twin framework for real-time structural health monitoring using wireless IoT sensing, digital signal processing, and structural analysis. Expert Syst. Appl. 2024, 252, 124204. [Google Scholar] [CrossRef] [Scilit]
- Yang, S.-W.; Lee, Y.; Kim, S.-A. Design and Validation of a Real-Time Maintenance Monitoring System Using BIM and Digital Twin Integration. Buildings 2025, 15, 1312. [Google Scholar] [CrossRef] [Scilit]
- Lu, Q.; Xie, X.; Parlikad, A.K.; Schooling, J.M. Digital twin-enabled anomaly detection for built asset monitoring in operation and maintenance. Autom. Constr. 2020, 118, 103277. [Google Scholar] [CrossRef] [Scilit]
- Ma, N.; Li, W.; Jiang, C.; Sun, X.; Zhang, J. Development of digital twin system for central air-conditioning based on BIM. J. Build. Eng. 2025, 111, 113171. [Google Scholar] [CrossRef] [Scilit]
- Zhairy, A.E.; Daoud, A.O.; Mohamed, A.G. Transforming facility management with BIM, IoT, and Digital Twin: A data-driven approach to air quality monitoring. Archit. Eng. Des. Manag. 2026, 22, 426–445. [Google Scholar] [CrossRef] [Scilit]
- Pavón, R.M.; Galao, O.; Pardo, M.A.; Alberti, M.G. Digital Twin development and implementation for the management of irrigation networks. Expert Syst. Appl. 2026, 297, 129330. [Google Scholar] [CrossRef] [Scilit]
- Haggag, M.; Oulefki, A.; Amira, A.; Kurugollu, F.; Mushtaha, E.; Soudan, B.; Hamad, K.; Foufou, S. Integrating advanced technologies for sustainable Smart Campus development: A comprehensive survey of recent studies. Adv. Eng. Inform. 2025, 66, 103412. [Google Scholar] [CrossRef] [Scilit]
- Alvarez-Campana, M.; López, G.; Vázquez, E.; Villagrá, V.A.; Berrocal, J. Smart CEI Moncloa: An IoT-based Platform for People Flow and Environmental Monitoring on a Smart University Campus. Sensors 2017, 17, 2856. [Google Scholar] [CrossRef] [Scilit] [PubMed]
- Ceccarini, C.; Mirri, S.; Salomoni, P.; Prandi, C. On exploiting Data Visualization and IoT for Increasing Sustainability and Safety in a Smart Campus. Mob. Netw. Appl. 2021, 26, 2066–2075. [Google Scholar] [CrossRef] [Scilit] [PubMed]
- Ahmed, M.A.; Chavez, S.A.; Eltamaly, A.M.; Garces, H.O.; Rojas, A.J.; Kim, Y.-C. Toward an Intelligent Campus: IoT Platform for Remote Monitoring and Control of Smart Buildings. Sensors 2022, 22, 9045. [Google Scholar] [CrossRef] [Scilit] [PubMed]
- Zaballos, A.; Briones, A.; Massa, A.; Centelles, P.; Caballero, V. A Smart Campus’ Digital Twin for Sustainable Comfort Monitoring. Sustainability 2020, 12, 9196. [Google Scholar] [CrossRef] [Scilit]
- García-Aranda, C.; Martínez-Cuevas, S.; Torres, Y.; Pedrote Sanz, M. A Digital Twin of a University Campus from an Urban Sustainability Approach: Case Study in Madrid (Spain). Urban Sci. 2024, 8, 167. [Google Scholar] [CrossRef] [Scilit]
- Ye, X.; Jamonnak, S.; Van Zandt, S.; Newman, G.; Suermann, P. Developing campus digital twin using interactive visual analytics approach. Front. Urban Rural Plan. 2024, 2, 9. [Google Scholar] [CrossRef] [Scilit] [PubMed]
- Manokeaw, S.; Khuwuthyakorn, P.; Chan, Y.-C.; Tengtrairat, N.; Jintapitak, M.; Thinnukool, O.; Buachart, C.; Sinthamrongruk, T.; Na Ayutthaya, T.K.; Suriyanon, N.; et al. A Dynamic Digital Twin Framework for Sustainable Facility Management in a Smart Campus: A Case Study of Chiang Mai University. Technologies 2025, 13, 439. [Google Scholar] [CrossRef] [Scilit]
- Bäcklund, K.; Lundqvist, P.; Molinari, M. Showcasing a digital twin for higher educational buildings: Developing the concept toward human centricity. Front. Built Environ. 2024, 10, 1347451. [Google Scholar] [CrossRef] [Scilit]
- Pavón, R.M.; Alberti, M.G.; Álvarez, A.A.A.; Cepa, J.J. Bim-based Digital Twin development for university Campus management. Case study ETSICCP. Expert Syst. Appl. 2025, 262, 125696. [Google Scholar] [CrossRef] [Scilit]
- Macia Perez, F.; Berna Martinez, J.V.; Lorenzo Fonseca, I. Modelling and Implementing Smart Universities: An IT Conceptual Framework. Sustainability 2021, 13, 3397. [Google Scholar] [CrossRef] [Scilit]
- Lorenzo-Fonseca, I.; Macia-Perez, F.; Macia-Fiteni, A.; Arnau-Munoz, L. AI-Driven Multiagent IoT System for Energy Consumption Anomaly Detection. IEEE Internet Things J. 2026, 13, 2196–2205. [Google Scholar] [CrossRef] [Scilit]
- Macia-Perez, F.; Lorenzo-Fonseca, I.; Berna-Martinez, J.V. Dynamic ventilation certificate for smart universities using artificial intelligence techniques. Comput. Methods Programs Biomed. 2023, 236, 107572. [Google Scholar] [CrossRef] [Scilit] [PubMed]

Disclaimer/Publisher’s Note: The statements, opinions and data contained in all publications are solely those of the individual author(s) and contributor(s) and not of MDPI and/or the editor(s). MDPI and/or the editor(s) disclaim responsibility for any injury to people or property resulting from any ideas, methods, instructions or products referred to in the content. |
© 2026 by the authors. Licensee MDPI, Basel, Switzerland. This article is an open access article distributed under the terms and conditions of the Creative Commons Attribution (CC BY) license.