


Abstract
Network Function Virtualization (NFV) is a novel concept in computer networking that enhances scalability and flexibility in network services. Its increasing complexity and highly dynamic nature challenge reliable and efficient cyberattack detection. This study evaluates the predictive performance and computational efficiency of ensemble machine learning (ML) models, including Random Forest, eXtreme Gradient Boosting (XGBoost), and CatBoost, using three NFV-specific subsets of the VNFCYBERDATA dataset, and compares them with a stacking-based meta learner for classifying benign and malicious network traffic. To enhance the ML workflow, a reproducible preprocessing pipeline and automated hyperparameter optimization with the Optuna framework were employed. Performance was assessed using: precision, recall, F1-score, false positive rate (FPR), Precision–Recall Area Under the Curve (PR-AUC), training and inference speed, memory usage, and serialized model size. SHapley Additive exPlanations (SHAP) was used to interpret model predictions and identify the strongest indicators of cyberattacks. The results demonstrate that Random Forest and the stacked meta learner consistently achieved the highest predictive performance, attaining precision and PR-AUC values of up to 99%, while retaining very low false positive rates. Meanwhile, XGBoost and CatBoost demonstrated higher efficiency, resulting in substantially faster training and inference times (10–12 ms), which makes them better suited for latency-sensitive deployments. These findings support the applicability of boosting models in resource-constrained environments, while bagging and stacking models provide robust detection in high-dimensional and imbalanced datasets. SHAP analysis identified traffic volume, transport-layer protocol flags, and network flow characteristics as the strongest indicators of malicious activity in NFV networks, providing deeper insights into model predictions.
1. Introduction
Network Function Virtualization (NFV) is one of the most transformative paradigms in computer networking. Additionally, practical applications of NFV—virtualized network functions (VNFs)—redefined how traditional networking services are implemented, deployed, and managed. Specifically, VNFs are virtualized appliances that perform the functions of firewalls, routers, load balancers, and intrusion detection systems (IDS), which significantly reduce maintenance of hardware infrastructures. Consequently, centralized management of computer networks helps organizations achieve greater flexibility, scalability, and a significant reduction in capital expenditures [1].
Despite the advantages, security challenges continue to expand the attack surface of NFV environments due to the highly dynamic nature of NFV topologies, where virtualized network appliances can be created, scaled, and terminated automatically. In addition, virtualized network environments rely on multiple layers of abstraction, which increase the complexity of network traffic patterns.
To mitigate security risks in NFV environments, the domain of artificial intelligence (AI) offers promising solutions. Specifically, machine learning (ML) models in cybersecurity perform highly accurate cyberattack detection. Unlike signature-based detection systems, such as firewalls and IDS appliances, ML models learn from diverse, complex patterns in network traffic datasets and produce reliable predictions, and risk mitigation strategies. As discussed in [2], ML and deep learning (DL) algorithms offer advanced predictive capabilities for cybersecurity applications, ranging from antivirus programs to large-scale network monitoring. However, several challenges persist across real-world implementations of ML and DL in cybersecurity, where model explainability and resource consumption remain the most problematic. In addition, issues with data quality, data availability, and predictions based on behavioral patterns in computer networks also challenge the widespread adoption of ML in cybersecurity [3]. Ensemble and hybrid ML models demonstrate enhanced predictive performance, which is thoroughly discussed in [4]. These models combine the strengths of multiple algorithms and thereby detect intricate patterns in data that traditional, single-variant models cannot capture effectively. Therefore, ensemble learning methods, such as Random Forest and eXtreme Gradient Boosting (XGBoost), have demonstrated consistently robust performance in cybersecurity.
Stacking-based meta learning models in cybersecurity learn from the predictions of multiple base models, enhancing the learning process and predicting cyberattacks with greater accuracy. Although existing research has reported that stacking-based meta learners exhibit superior performance in comparison to single-variant ML models, relatively few studies provide performance comparisons of stacking-based meta learners and ensemble models, especially across cyberattack prediction and resource usage spheres. These research gaps are articulated significantly across NFV ecosystems, where many studies rely on legacy benchmark datasets, such as CIC-IDS2017 or UNSW-NB15, rather than traffic specifically generated by VNF appliances. Dynamic service chaining, multi-tenancy, multiple layers of abstraction, and reduced visibility of east–west traffic between VNFs are the characteristics that substantially differ from traditional intrusion detection datasets.
This study trained, evaluated and compared three ensemble models (Random Forest, XGBoost, and CatBoost) with a stacking-based meta model using the VNFCYBERDATA dataset, focusing on VNF services [5]. The main aim is to evaluate whether stacking-based meta learning models provide measurable advantages over established ensemble methods for cyberattack detection in NFV environments, considering predictive performance, computational efficiency, and explainability dimensions. To address the limitations identified across various publications, our research applies an explainable AI technique and offers clear insights into the “why” behind the decisions made by the compared models. Additionally, the study focuses on network traffic and network behavior signals, which are important for cyberattack predictions.
The main contributions of this study are as follows:
- It presents a comprehensive evaluation of ensemble learning and stacking-based meta learning models specifically for cyberattack detection in NFV environments using the domain-specific VNFCYBERDATA dataset.
- It presents preprocessing steps in sufficient detail to support reproducibility and employs a model-agnostic feature selection technique.
- It demonstrates automated hyperparameter optimization using Optuna to ensure a systematic and fair comparison of all evaluated models.
- It thoroughly evaluates the models across multiple dimensions, such as predictive performance and computational efficiency, which is important for deployment considerations in NFV infrastructures.
- Finally, it complements the aforementioned points with a feature attribution and model explainability analysis to identify the primary network traffic features driving attack predictions.
2. Literature Review
AI expansion and its advancements are shaping the evolution of cybersecurity and NFV research, especially through ML and DL techniques. Recent studies demonstrate a significant shift in how networks, systems and data can be safeguarded. There is a gradual shift from the traditional security mechanisms to AI-driven security systems. As subdomains of cybersecurity, intrusion detection and network anomaly detection strongly rely on AI models in detecting highly sophisticated cyberattacks.
H. Adoga and D. Pezaros (2022) provide a taxonomy of NFV implementation frameworks covering resource allocation and service orchestration, performance tuning, and resilience and fault recovery [1]. Their study discusses AI-driven automation, traffic classification, anomaly detection, and intelligent resource allocation as fundamental building blocks of future NFV systems. Likewise, ref. [2] provides a survey of ML classifiers for network intrusion detection, including Support Vector Machine (SVM), Random Forest, Decision Trees, Naïve Bayes, and k-Nearest Neighbors (kNN). These models were evaluated on well-known datasets such as KDD Cup 1999, NSL-KDD, UNSW-NB15, and CIC-IDS2017. While metrics such as accuracy, precision, recall, and F1-score dominate research and industry practice, the following barriers to widespread adoption of ML in cybersecurity persist: the acquisition of up-to-date datasets, class imbalance problems, transition from manual to automated hyperparameter tuning, and validation of model performance in real-world deployments.
Beyond NFV, ML adoption spans financial technology and other industries. Kokogho et al. (2025) use the Preferred Reporting Items for Systematic Reviews and Meta-Analyses (PRISMA) framework to identify predictive modeling as central for the detection of suspicious transactions, user behavior, and network traffic patterns, but also mention computing resource constraints and data quality issues [3]. Mohamed (2025) similarly notes that although DL models outperform traditional ML in intrusion detection and malware classification, they do so at the expense of high computational complexity and limited interpretability [4].
Supervised learning dominates cybersecurity environments, which strongly relies on training in ML models and differentiation between network traffic types or cyberattack categories. In contrast, unsupervised learning techniques could be used in cases where labeled data is limited. These techniques can effectively detect abnormal network traffic patterns and network anomalies. Jain (2025) reviews common supervised learning algorithms and emphasizes that Decision Trees possess high interpretability but suffers from overfitting [6]. A study in [7] thoroughly discusses overfitting, which represents the tendency of models to learn “noise” in the data, affecting the model generalization when applied to previously unseen datasets. Random Forest, as an ensemble of Decision Trees, is a specific model that mitigates overfitting and captures nonlinear relationships in network traffic data [8]. This capability of ensemble methods is particularly relevant in cloud and NFV environments, where traditional detection approaches struggle with novel attacks and Application Programming Interface (API) exploits, posing a problem due to the cloud’s multitenancy features and global accessibility [9]. A study in [10] also confirms the robustness of ensemble models across various domains, like Random Forest for security risk analysis in healthcare networks.
Alharthi et al. (2025) discuss the persistent challenge of detecting zero-day threats and emphasize the potential of meta learning models in this regard, which combine predictions and metadata from multiple algorithms [11]. Zero-day threats stem from undiscovered vulnerabilities in computer systems, which hackers can exploit as soon as they discover them. A study in [12] proposes a Multi-Improved Model-Agnostic Meta-Learning (MI-MAML) method to improve malware classification through data augmentation and model-agnostic meta learning strategies. Specifically, the method includes conversion of malware binaries into grayscale and color-coded images to visually present how malicious actors can “tweak” very small portions of code and create patterns that are often ignored by signature-based detection systems. A study in [13] also motivates the fusion of ML models for the purpose of reducing false positive rate (FPR), which remains a critical operational concern in traditional security systems.
Ness et al. (2025) compare ML algorithms for network anomaly detection and report that tree-based ensembles, such as Random Forest and XGBoost, adapt well to class imbalance [14]. Meanwhile, SVM uses its radial basis function (RBF) kernel to effectively capture nonlinear patterns, such as those present in polymorphic malware, but suffers from scalability issues [15]. The study in [14] also compares the computational efficiency of each model, which is one of the most important considerations for real-world deployments. For example, SVM demonstrates good accuracy and recall percentages, but its computational complexity increases drastically with dataset size. Meanwhile, Random Forest builds its Decision Trees in parallel, as each tree is independent of the other trees, controlling the usage of the processor and memory.
Within the context of Software-Defined Network (SDN) security, ensemble methods demonstrate strong performance in Distributed Denial of Service (DDoS) attack detection [16,17]. Fundamentally, SDN achieves high network programmability and flexibility by separating the control plane from the data plane. However, configuration template tampering and policy tampering represent some of the greatest security risks currently present in this domain. The results of the study have shown that significant attack detection improvements could occur by integrating the Ensemble of Random Forests with the SDN control plane, with Fuzzy Neural Networks providing a good alternative.
Many businesses worldwide invest in swift migrations of their on-premises infrastructure to the cloud and shifting towards NFV. Despite the scalability and flexibility advantages provided by NFV infrastructures, security challenges persist. G. Karamchand (2025) offers a review of practical implications of AI in NFV and cloud infrastructure security [18]. The paper proposes a multilayered cybersecurity framework for protecting NFV on top of cloud infrastructure, centering on real-time and automated AI threat protection capabilities. However, due to the complexity of AI adoption across diverse NFV ecosystems, it is important for businesses to continuously plan and invest in reliable computing and storage infrastructure [18,19].
For greater understanding of the defense strategies and advantages of AI in NFV ecosystems, A. Sahbi et al. (2025) identified key security risks and threats associated with virtualized networks [20]. The study reports that one of the most critical security risks lies in the complexity of VNF management. Although the process of instantiation, migration, monitoring, and on-demand termination of VNF instances can be automated, ensuring service availability and proper isolation in multitenant environments is still a burdensome challenge. Additionally, the orchestration layer of NFV is at a great risk of security threats due to its centralized nature, where authorization components must remain particularly strong.
Yang et al. (2022) provides a survey of multiple meta-learning paradigms, emphasizing the potential of stacked ensemble-based approaches for malware classification and rare attack detection [21]. The study supports their applicability for zero-day attack detection and adaptation to advanced security threats, which are identified as the most common problems in modern network infrastructures, such as NFV.
Studies on Session Initiation Protocol with Voice over Internet Protocol (SIP-VoIP) DDoS detection [22], semantic-driven intrusion detection [23], and optimized stacked models that address high dimensionality, high FPR, and class imbalance issues [24] further emphasize the benefits of meta learning techniques. Other studies report similar findings, especially in the context of: network anomaly detection [25], firewall log classification [26], Internet of Things (IoT) botnet detection [27], darknet traffic analysis [28,29], where tree-based ensemble methods surpass single-model variants in attack detection by almost 27%, and finally email spam detection, where stacking significantly enhances baseline model accuracy [30].
3. Materials and Methods
This section presents the experimental materials and workflow used to compare ensemble and stacking-based meta learning models for cyberattack detection in NFV environments, including the following: a novel NFV-specific dataset, details on hardware and software environment, preprocessing and feature selection strategies, as well as model training, hyperparameter optimization, and model evaluation procedures. All methodological decisions outlined in this section are motivated by the need for a reproducible ML workflow, as well as by the aim of providing fair and transparent comparison of models included in the experiment. We designed the experimental methodology to address three research objectives: (i) to compare the predictive performance of state-of-the-art ensemble learning models for cyberattack detection in NFV, (ii) to evaluate the models’ computational efficiency, and (iii) to assess the explainability of their predictions using SHAP.
3.1. Dataset Description
This study uses the VNFCYBERDATA dataset, developed by the Department of Communications and Computer Engineering at the University of Malta [5]. It captures realistic network behavior in NFV environments, containing seven million session records, as well as encompassing benign network traffic and various simulated cyberattacks. The virtualized network infrastructure used by the dataset authors for attack simulation and session captures includes the following VNF components: a virtual router/firewall, Domain Name System (DNS) server, proxy, load balancer, and IDS. In this study, we focus on sessions captured from the virtual router/firewall, DNS server, and IDS. This resulted in three datasets, respectively: vRouter_vFirewall (139,901 records), vDNS (104,283 records), and vIDS (15,145 records). In comparison to the sessions of the excluded VNF appliances, the selected sessions possess higher diversity in attack classes (e.g., DNS spoofing and amplification, scanning, and malware attacks), and better model generalization. Also, the model training on the complete VNFCYBERDATA collection would not be feasible due to hardware resource constraints, especially for the stacking-based meta learning model. Therefore, we filtered the session files and selected those with fewer records, but substantial coverage of traffic variations and attack types. Regardless of the assumption that larger session files may provide better coverage, the selected session files allow our experimental pipeline to be reproduced even on commodity hardware.
Each of the three network traffic datasets selected for this study consists of 40 features, which include temporal data (e.g., session start and stop times, session duration), protocol-related data, Internet Protocol (IP) and Media Access Control (MAC) addressing information, traffic volume metrics (e.g., number of bytes exchanged in a single network session, total packet count), and various other sources of network information. The target feature in VNFCYBERDATA is the multiclass ‘label’ feature of categorical type, which differentiates each network traffic flow as either benign or belonging to a specific malicious traffic class. All attack classes were mapped to a single ‘Malicious’ label, while normal network traffic retained the ‘Benign’ label. Such mapping was used for the evaluation of the traffic classification abilities of the models included in the study. The selected datasets are representative of realistic NFV traffic conditions because they were collected from multiple VNFs (router/firewall, DNS server, and IDS) and include benign and malicious traffic that spans diverse network protocols, traffic characteristics, and attack scenarios.
3.2. Exploratory Data Analysis
To gain a deeper understanding of the data and motivate subsequent preprocessing decisions, we conducted an exploratory data analysis before any modeling workflows were performed. In this phase, we analyzed the dataset structure, along with feature types and distributions, dominant categories, and missing value patterns.
An initial inspection of the structural composition of the three selected datasets indicated that the feature space was predominantly heterogeneous. In general, the numerical features included the following: session timestamps, source and destination ports, number of transmitted packets and raw data bytes per session, Transmission Control Protocol (TCP) control bits, session segment count and session duration, and finally, network latency and Border Gateway Protocol (BGP) information. Meanwhile, the categorical features mostly contained: network addressing information, country metadata, protocol combinations, payloads encoded in Unicode Transformation Format 8 (UTF-8), diagnostic and debugging information, routing information, and contextual indicators at the application layer of the TCP/IP stack.
Then, this study identified an imbalance in target class labels across all datasets. Class imbalance can bias ML algorithms toward the majority class and produce misleading performance estimates. The filtered vDNS dataset exhibited the most prominent class imbalance, where approximately 87% of the data was labeled as a malicious traffic flow, and only 13% was labeled as benign. This is an unusual case of network traffic data, since many research and engineering teams report that, on average, benign network traffic in real-world environments occurs more frequently than malicious traffic [31]. Such cases could be compared to problems with imbalanced classes by using appropriate imbalanced learning methods. This study applied the class weighting during model training for successful mitigation of the effects of class imbalance and prevention of synthetic traffic with oversampling methods.
Descriptive statistics for the three VNF datasets revealed highly skewed distributions for several features, such as the ‘packets’ feature in the vDNS dataset, which represents the total number of network packets sent and received in a network session. Specifically, at least 75% of network sessions involved the exchange of only a single packet. At the same time, we observed a maximum of 10,000 packets transferred in one of the sessions. This indicates anomalous and potentially malicious behavior, such as data exfiltration attempts. For the vRouter_vFirewall and vIDS datasets, the means of the features of the traffic volume characteristics also demonstrates extremely right-skewed distributions. Additionally, most sessions in the vIDS dataset did not exceed 42 ms, as the median of the ‘session length’ feature indicated. However, several lengthy sessions significantly skewed the distribution of this feature, confirmed by the mean value of 3,362,034 ms and standard deviation value of 110,481,000. Our observations reflect realistic user and system behavior in computer networks, which further motivates the use of robust ML techniques for cyberattack detection.
A better understanding of network protocol usage across different network sessions required an analysis of the frequency of protocol combinations detected in the three VNF datasets. For vDNS, the majority of network sessions included User Datagram Protocol (UDP) traffic, resulting in 85,192 sessions that relied on plain, connectionless UDP. Meanwhile, for the vRouter_vFirewall sessions, DNS over UDP dominated at a frequency of 93,238. In contrast to vDNS, this dataset had a large amount of TCP-driven network traffic, resulting in 22,124 sessions. Finally, the combination of UDP and DNS was the dominant protocol combination in the vIDS dataset, with 4316 sessions including it. In comparison with the previous datasets, vIDS contained a high volume of encrypted network traffic, as indicated by 2756 sessions that rely on TCP over Transport Layer Security (TLS) protocol. Figure 1 shows three bar plots that present the frequency distribution of each protocol combination across the three vDNS, vRouter_vFirewall, and vIDS datasets.
Figure 1.
Frequency distribution of each network protocol combination across the VNF datasets.
Besides the structure of the datasets and feature distribution analysis, we conducted a missing value pattern analysis to determine whether the missingness was systematic across features or if it occurred randomly. We used this analysis to justify the choice of a model-based imputation strategy, which is described in Section 3.4.1.
Figure 2, Figure 3 and Figure 4 present three correlation heatmaps, which illustrate the patterns of missingness across the vDNS, vRouter_vFirewall, and vIDS datasets, respectively. Each cell of the heatmaps provides explanations about the co-occurrence of missing values in any pair of features. The heatmaps show several strongly positive correlations between missing values, as indicated by correlation scores close to or equal to 1.00. Perfectly correlated missing values within protocol-specific groups, such as groups of features representing TCP flags, evidently form a pattern that is not random. This pattern is evident across all datasets and indicates that missing values most likely co-occurred because they shared the same network traffic flow, where pairs of TCP flags were extracted from the same TCP header. From the vRouter_vFirewall dataset, we found that DNS lookup hostnames (represented by the ‘host’ feature) have strong negative correlations with the values of TCP flags. We can explain this pattern by observing how traffic is typically handled across different network communication layers. Specifically, application-layer DNS traffic does not include TCP headers within its payload, since these headers belong to the underlying transport layer, and vice versa. Based on the heatmap for the vIDS dataset, the initial round-trip time (RTT) is strongly correlated with TCP flags, resulting in a score of 0.8. Specifically, TCP Synchronize (SYN) and TCP Acknowledge (ACK) flags were missing within network flows in which the initial RTT was also missing, because RTT is directly computed from the time required to establish a TCP handshake. These observations imply nonrandom missingness within benign network traffic samples.
Figure 2.
Heatmap of missing value correlation patterns in the vDNS dataset.
Figure 3.
Heatmap of missing value correlation patterns in the vRouter_vFirewall dataset.
Figure 4.
Heatmap of missing value correlation patterns in the vIDS dataset.
Because of systematic missingness across all datasets, conditioned by nonlinear relationships between features, this study proposed a model-based imputation approach over simpler approaches, such as mean and median imputation.
3.3. Experimental Environment
3.3.1. Hardware Specifications
For model training, hyperparameter optimization, and model testing, we used a laptop running a 64-bit Windows 11 Pro operating system, with 16 gigabytes (GB) of Random-Access Memory (RAM). The laptop has a 12th Generation Intel® Core™ i5-1235U processor, operating at a 1.30 gigahertz (GHz) frequency and is equipped with 10 processing cores. The system’s graphics card is an integrated Intel® Iris® Xe Graphics with 128 megabytes (MB) of allocated memory.
3.3.2. Software Environment and Tools
This study implemented all experiments in Python (version 3.13.0) using the Jupyter Notebook (notebook version 7.2.2) platform. To manipulate data, perform numerical computations, and measure the usage of computational resources, this study utilized Python DataFrames and various Python libraries, such as pandas, NumPy, time, psutil, and others. The data preprocessing requirements included: MissForest imputation, Isolation Forest and winsorization for outliers, and target encoding for categorical features. Then, we trained and evaluated multiple ML models using scikit-learn library, and optimized the models’ hyperparameters via Optuna. Finally, we supported the model explainability dimension in the study by using SHapley Additive exPlanations (SHAP).
3.4. Data Cleaning and Preprocessing
Data cleaning and preprocessing are two essential steps in transforming raw network traffic data, which is inherently noisy and imbalanced, into a format required by ML models for accurate decision-making and strong ability to predict cyberattacks.
First, we excluded several features because of their limited relevance to network flow analysis, as discussed in [32]. These features were less representative of malicious behavior, especially in the context of evolving and zero-day attacks. Following established behavioral attack detection principles, we removed features relying strictly on predefined attack signatures to reduce dataset dimensionality and improve generalizability. To avoid overfitting issues described in [11], we excluded temporal features, such as timestamps, and identifiers such as IP and MAC addresses. Additionally, we removed features that represent the first 8 bytes of source and destination payloads, due to their noisy nature. Finally, we excluded the remaining high-cardinality features, including Uniform Resource Identifiers (URIs), hostnames, alternative names, and geolocations.
Then, we removed duplicate rows and performed the correction of data inconsistencies and errors, based on the following findings:
- Invalid source and destination port numbers (normal range for TCP and UDP port numbers is between 0 and 65,535);
- Faulty occurrences of less than one packet sent or received in an active network session;
- Negative counts of transferred raw bytes and data bytes in a network session;
- Negative values for the number of session segments in a single network session;
- Negative session length (session duration expressed in milliseconds);
- Negative initial RTT (initial network latency expressed in milliseconds);
- Negative values for TCP flags.
For example, the possible causes of negative values of initial RTT in network sessions range from processor issues, system clock synchronization, measurement and logging errors, to post-imputation effects. By definition, TCP flag and initial RTT values should be nonnegative, but we discovered several negative values for these features in the VNF datasets. Therefore, we safely clipped such values to zero, indicating “no time delay” for the ‘initial RTT’ feature and “TCP flag unset” for each TCP flag feature.
We performed data splitting across the three VNF datasets using 70% of the data for training and 30% for testing. Further, we performed stratification based on the target class labels to ensure that the training and test sets maintain an equal proportion of classes to the original data after random splitting. As the datasets at hand were highly imbalanced, this type of stratified sampling prevented potential model bias towards an overrepresented class. Finally, we utilized StratifiedKFold as a cross-validation strategy for a balanced distribution of classes across 10 folds, ensuring that each fold fully represents the data at hand. All preprocessing objects were fitted exclusively on the training folds and subsequently applied to test data to prevent data leakage.
3.4.1. Imputation of Missing Values
Missing values in network traffic datasets can arise as a result of packet loss, transmission issues, logging errors, or packet capture tool limitations. This study used MissForest to impute the missing values present in our VNF datasets. MissForest iteratively refines missing value estimates by utilizing the predictive power of the Random Forest algorithm. Due to its ability to handle both numerical and categorical features, and capture nonlinear relationships among features, MissForest serves as a suitable method for handling missing data in heterogeneous network traffic datasets, as described in [33]. In addition, MissForest minimizes the risk of losing valuable data when performing simple row elimination, and the risk of introducing bias with univariate imputation methods as described in [25].
Based on the missing value pattern analysis described in Section 3.2, we applied MissForest to all three VNF datasets. First, we removed columns that solely contained missing values from the dataset and encoded categorical features prior to imputation. Then, we fitted the imputer object on the training set and subsequently applied it to the test data to prevent data leakage.
3.4.2. Outlier Handling
In the context of computer networking, outliers or network anomalies are extreme values that significantly deviate from the majority of data. However, in network traffic datasets, outliers can be meaningful indicators of cyberattacks. Instead of completely removing outliers, the aim of this study was to detect them using the Isolation Forest algorithm and explicitly flag anomalous points by using a new, binary indicator feature titled ‘is_outlier’. This strategy allowed our models to learn abnormal traffic patterns and ensured that information relevant for attack detection was preserved.
Isolation Forest is an unsupervised learning algorithm, often used for anomaly detection applications. It is very effective on high-dimensional data and assumes minimally the shapes of feature distributions. After randomly partitioning the feature space and isolating anomalous data points, Isolation Forest computes anomaly scores. This study identified data points that required the least number of splits to be isolated as potential outliers, as supported by [34]. To prepare the Isolation Forest model, we defined several parameters. Firstly, we set a value of 100 for the n_estimators parameter, indicating the number of Isolation Trees for the model training. Secondly, we set a fixed random integer for the random_state parameter, to enable reproducible results, since Isolation Forest relies on a degree of randomization when calculating anomaly scores. Finally, algorithm predictions were used, in which outliers were assigned an integer value of 1 and normal data points were assigned an integer value of 0, to fill the new ‘is_outlier’ column.
Tree-based ensembles were used in this study because these models natively handle outliers. Ensembles such as Random Forest, XGBoost, and CatBoost split data based on thresholds in the feature space and are relatively robust to outliers [35]. On the other hand, linear models such as Linear Regression are highly sensitive to outliers because of their impact on the global loss function. Hence, they were excluded from evaluation in the study. To reduce the potential negative effects of retaining outliers in the data, we used a winsorization technique to cap the extreme values at the 5th and 95th percentiles. Section 4 demonstrates the effects of winsorization.
3.4.3. Categorical Feature Encoding
Another important step in data preprocessing is encoding of categorical features, as most ML algorithms require numerical input. In this study, we used the Target Encoder from the category_encoders Python library to transform each categorical feature of the VNF datasets into numerical values. Target encoding uses the mean of the target column for each category to perform the encoding. Unlike other methods, such as one-hot encoding, target encoding does not inflate the feature space by creating new features for each category. Also, target encoding captures probabilistic associations between the categories and the target [36].
We first fit the Target Encoder object on the training set and then applied it to the test set. During initialization, we used a smoothing parameter to balance the target mean for each category with the global target mean, mitigating noise and overfitting caused by rare categories [36].
3.5. Feature Selection
In this study, we performed a feature selection procedure primarily to exclude redundant features and reduce feature space dimensionality. Secondly, technique selection was based on efficiency considerations and fair model comparison using the same subset of features across all models. As part of this procedure, the following feature selection techniques were examined: permutation importance and SelectKBest with Mutual Information scoring function.
Scikit-learn’s SelectKBest with Mutual Information is a filter method, independent of any particular algorithm, which selects the top K features for the final feature subset based on scores calculated using the Mutual Information scoring function. This method was used for the selection of the top 10 most informative features ranked by the strength of their statistical relationship with the target variable. Research has demonstrated that this method is highly performant on feature sets with both linear and nonlinear associations with the target variable [37].
The second feature selection method evaluated in the study was permutation importance, a wrapper method. It uses a specific ML model to calculate feature importance scores by performing random value permutations for each feature in the dataset. Then, it quantifies the reduction in model performance after the values are permuted. Unlike SelectKBest, permutation importance captures complex relationships among any pair of features, but is highly dependent on a pretrained ML model and its hyperparameters [38]. Using 5 permutations per feature on test data of 15,809 instances from the vDNS dataset, along with a Random Forest model, we conducted a runtime efficiency measurement for the permutation importance method. At the same time, we measured runtime efficiency for our SelectKBest implementation. We discuss the runtime efficiency results in Section 4.1.
Ultimately, SelectKBest was selected as the primary feature selection method for our experiment, obtaining the top 10 most informative features for cyberattack prediction based on Mutual Information scoring. This choice resulted in a feature set that is unbiased and unaffected by any ML algorithm and therefore more suitable for fair cross-model comparison. At the same time, feature importance scores computed by SelectKBest maintained statistical relevance, while the improved runtime efficiency provided by this method ensured that the feature engineering pipeline was sustainable. This aligns with the objectives of the study regarding predictive performance and computational efficiency.
3.6. Model Training
In this section, we describe the training and evaluation of four ML models—Random Forest, XGBoost, CatBoost, and a stacked meta classifier. Using the three VNF datasets, we collected mean predictive performance and computational efficiency results across 10 stratified folds for each model. We implemented the stacked meta model using stacked generalization, a technique that uses the predictions of multiple base classifiers at the meta learning layer, with Logistic Regression serving as the meta classifier. We also used Optuna, an automated hyperparameter optimization framework, to evaluate each model at its best performance. The following subsections describe the models used in our experiment, while Section 3.7 defines the evaluation metrics.
3.6.1. Random Forest
Random Forest is an ensemble learning method that is widely used in cybersecurity applications. It uses a technique called bootstrapping to train its decision trees on random subsets (bootstrap samples) of training data and aggregates the class predictions via majority voting [39]. In this study, we selected Random Forest effective handling of outliers, capturing the intricacies of nonlinear relationships between features, and providing quick predictions via parallelized tree processing.
3.6.2. XGBoost
XGBoost is another ensemble learning method used in our study, which relies on gradient boosting to train decision trees sequentially. In this method, each decision tree attempts to correct the residual errors of the previous trees, thereby increasing the accuracy of the model’s predictions. In addition, XGBoost uses Lasso (L1) and Ridge (L2) regularization parameters to systematically prevent overfitting, which is critical in NFV environments characterized by complex network traffic patterns. Current research has shown that XGBoost is very suitable for processing large datasets such as network traffic logs, especially because of its parallel processing and Graphics Processing Unit (GPU) acceleration capabilities [40]. Hence, we evaluated its predictive performance and computational efficiency in this study.
3.6.3. CatBoost
CatBoost is an ensemble learning method that uses mechanisms of gradient boosting to build decision trees and simplify handling of categorical data. Unlike XGBoost, it uses ordered boosting to overfitting problems, which often occur in datasets with many numerical and categorical features [41]. This feature of CatBoost suits security-critical NFV environments, where heterogeneous data is commonly found in network traffic logs. CatBoost processes a mixture of IP packet sizes, session durations, or protocol features, and provides more reliable predictions than standard gradient boosting methods. Hence, we evaluated its performance in our study.
3.6.4. Stacking-Based Meta Learning Model
To combine the strengths of multiple models and achieve substantial performance improvements, we trained and evaluated a stacked meta learning model using the same set of performance metrics as the previously described models. Stacking, also known as stacked generalization, is a meta learning approach in which the predictions of multiple base models are combined using a meta layer estimator to produce a high-level outcome. The essence of meta learning lies in “learning how to learn”, describing a system in which a high-level model leverages the patterns learned by the models at the lower levels, which improves generalization abilities and strengthens performance [21]. The feature space used as input for the meta learner does not suffer from high dimensionality, since it contains base model predictions instead of the original feature set. To build our stacked model, we used Random Forest, XGBoost, and CatBoost as base learners, which were trained using the optimal combinations of hyperparameters obtained via the Optuna framework. We selected Logistic Regression for the meta learner, because of its ability to quickly and effectively process a simple feature space, such as the base model predictions.
3.6.5. Hyperparameter Optimization
To optimize the hyperparameter space of each ML model included in the study, we used the Optuna software framework (version 4.6.0). It automatically searches for an optimal combination of hyperparameters in a specified number of sequential trials. To ensure comprehensive coverage of the hyperparameter space, we performed a total of 50 trials for each model, specifying StratifiedKFold as the cross-validation parameter. Our system utilized all processor cores in parallel for training and optimization. To increase precision and recall scores for each model in the optimization process, we selected the F1-score objective function to be maximized by Optuna during trial runs. Also, we set fixed random seeds so that our results can be reproduced across multiple optimization function calls. Appendix A lists the detailed search ranges and the resulting optimal hyperparameter combinations for each model.
3.7. Performance Evaluation Metrics
To perform an evaluation of ML models included in the study, we used a set of predictive performance metrics that provide a more informative assessment of model performance than overall accuracy. These metrics assess cyberattack detection capability on imbalanced NFV traffic datasets, which is characteristic of the datasets used in this study. The metrics include: precision, recall, FPR, F1-score, and Precision–Recall Area Under the Curve (PR-AUC). For the equations listed below, we derived True Positive (TP), True Negative (TN), False Positive (FP) and False Negative (FN) predictions from each model’s confusion matrix.
This study used precision to measure the proportion of correctly predicted malicious network flows out of all the flows predicted as malicious by each model. Equation (1) demonstrates how to calculate precision scores:
Then, we used recall to measure models’ detection rate, showcasing the ability to correctly detect all cases of malicious network traffic. Equation (2) provides the formula for calculating recall:
We included the FPR metric to measure the percentage of benign network traffic that was falsely classified as malicious. High FPR is one of the most common sources of operational inefficiency in security operations centers (SOCs), causing problems with alert fatigue. Equation (3) demonstrates the calculation of FPR:
F1-score serves as a reliable predictive performance metric suited for imbalanced datasets, such as VNFCYBERDATA. We can calculate F1-score as the harmonic mean of precision and recall, as given in Equation (4):
We also used PR-AUC to quantify models’ ability to differentiate between benign and malicious network flows, which is suitable for model evaluation on imbalanced datasets. PR-AUC balances precision and recall across multiple decision thresholds. In the context of cyberattack detection, it measures the ability of the given model to detect more cyberattacks while simultaneously reducing the number of false positives.
Finally, we evaluated our models using several computational efficiency and resource usage metrics. The aim was to determine the applicability of these models for deployment in resource-constrained NFV environments. We used the following computational performance metrics:
- Training time: time required to train a model, expressed in seconds;
- Inference time: time spent by a model on generating predictions from test data;
- RAM usage: peak memory consumption during model execution, measured in MB;
- Model size: serialized model size expressed in MB, reflecting the size of a model when it is stored on disk as a stream of bytes.
4. Results
4.1. Feature Selection Results
After measuring the runtime efficiency for the two feature selection methods, we obtained the following results: the execution time for SelectKBest with Mutual Information was 10.073 s, while for permutation importance it was 27.031 s. These results demonstrate that filter methods, such as SelectKBest, can perform significantly faster, especially for large datasets (>100,000 rows). However, in real-world production deployments, the trade-off between efficiency and predictive power achieved through dimensionality reduction depends primarily on dataset size and the need for deeper insights into each feature’s contribution to model performance. Although wrapper and embedded feature selection approaches provide more precise feature importance insights, we selected SelectKBest with Mutual Information as the final choice for the experiment. Such selection ensured fair model comparison and evaluation by an identical set of features, but also because of its model-agnostic nature, avoiding bias towards any specific classification algorithm. Across all datasets, the features selected by SelectKBest primarily include: transport-layer indicators, routing patterns, protocol combinations, and traffic volume attributes.
4.2. Winsorization Effects
To clearly demonstrate the effects of outliers on data distribution, we could compare the difference between the original mean and the winsorized mean for one of the numerical features in the vDNS dataset—the total number of raw bytes sent and received in a single network session. The original mean for this feature was 52,272.59. After winsorization, the mean shifted to a value of 548.53. It can be observed that the original mean was significantly higher because it was influenced by extremely high raw byte values. The winsorization technique contributed to the preservation of the original feature distribution, while controlling the negative influence of extreme values.
4.3. Model Performance Comparison
We evaluated all models on the holdout test set drawn from the three network traffic datasets (vDNS, vRouter_vFirewall, and vIDS) and reported mean predictive performance and computational efficiency across the 10 stratified folds. We present the predictive performance results obtained using the vDNS test set in Table 1, while computational efficiency results for the same test set are presented in Table 2.
Table 1.
Predictive performance results on the vDNS dataset.
Table 2.
Computational efficiency results on the vDNS dataset.
All models achieved high predictive performance scores on the vDNS test set, with PR-AUC values over 0.997 demonstrating a strong ability to distinguish between benign and malicious patterns in virtual network traffic. Random Forest resulted in the highest precision score (0.998), closely followed by the stacked meta classifier (0.996). The highest recall and F1 scores were achieved by XGBoost (0.966 and 0.976, respectively), indicating its sensitivity in capturing malicious traffic while maintaining relatively high precision. The stacked model achieved the highest PR-AUC (0.999) and the second-best FPR (1.4%) after Random Forest, which produced the lowest FPR (0.6%). These results indicate the Random Forest and stacked models’ superiority in minimizing false security alarms in comparison to gradient boosting methods.
In terms of computational efficiency, XGBoost and CatBoost achieved the lowest inference times, resulting in 62 and 26 ms, respectively. While the stacked model resulted in the longest training time (93.785 s), the tuned XGBoost model took only 2.384 s to train. Regarding memory resources, the Random Forest model resulted in the highest memory consumption (557.813 MB). Meanwhile, we measured the largest serialized model size for the stacked model (7.812 MB), where multiple base models contributed to higher storage requirements.
Table 3 presents the predictive performance results collected using the vRouter_vFirewall test set, while computational efficiency results are presented in Table 4.
Table 3.
Predictive performance results on the vRouter_vFirewall dataset.
Table 4.
Computational efficiency results on the vRouter_vFirewall dataset.
According to the results displayed in Table 3, the Random Forest model accomplished very high scores across multiple performance metrics: precision (0.999), recall (0.998), F1-score (0.999), and PR-AUC (0.999). The stacked model achieved a slightly lower FPR of 0.001 compared to Random Forest, but it also maintained equally high precision and PR-AUC. In this case, its score was 0.999 for both metrics.
Based on the results given in Table 4, the training process for XGBoost completed in only 1.602 s. Meanwhile, the duration of this process was much higher for the stacked model, which completed its training in approximately 194.050 s. The CatBoost model consumed the least RAM (176.457 MB) and also generated its predictions in only 46 ms, as indicated by its inference time result. XGBoost was the lightest on disk space, as evident from its serialized model size of 0.720 MB. Meanwhile, the stacked model had the largest model size (4.537 MB) and would require approximately 6.3 times more space on the disk if we assume that its size would continue to grow at the same rate.
Table 5 presents the predictive performance results collected using the vIDS test set, while computational efficiency results are presented in Table 6.
Table 5.
Predictive performance results on the vIDS dataset.
Table 6.
Computational efficiency results on the vIDS dataset.
Based on the results in Table 5, a slight reduction in precision, FPR and PR-AUC was detected for the stacked model compared to its performance on the previous dataset. However, when the model was applied on the new test set, its recall increased from 0.735 to 0.977, indicating that the model’s sensitivity was heightened to malicious traffic samples. Additionally, its F1-score increased from 0.847 to 0.945, suggesting that the model improved its ability to balance between precision and recall using a smaller test set. The CatBoost model demonstrated the highest recall and PR-AUC scores on the vIDS test data, resulting in respective values of 0.978 and 0.988.
Based on Table 6, the CatBoost model attained the shortest inference time of only 10 ms, while XGBoost followed very closely behind at 12 ms. At the same time, Random Forest achieved the fastest training time (0.638 s), but it also consumed 411.856 MB of memory, which is significant for a single model trained on a relatively small dataset. Finally, the stacked model had the largest model size out of all the models, consuming 1.697 MB of storage resources.
Overall, Random Forest demonstrated the most consistent predictive performance across all three test sets. It achieved precision scores above 0.99 on vDNS and vRouter_vFirewall, shared the highest PR-AUC score (0.999) on vRouter_vFirewall with the stacking model, and produced the lowest FPR (0.006) on vDNS. Despite excellent predictive scores, Random Forest consumed the largest amount of RAM across all test sets (293.5–557.8 MB). Meanwhile, we found XGBoost and CatBoost to be more efficient alternatives for resource-restricted deployments, without a significant reduction in predictive power. While XGBoost demonstrated superior recall (0.966) and F1-score (0.976) on the vDNS test set, confirming its ability to capture malicious traffic and simultaneously reduce false alerts, CatBoost achieved the highest recall (0.978) and PR-AUC (0.988) on the vIDS test set. Both gradient boosting models had the shortest inference times (<0.14 s). Finally, the results emphasize the stacked model’s excellent discriminatory power, even in the presence of imbalanced classes. By combining multiple base classifiers, it produced highly accurate predictions across all decision thresholds, as evident by its consistently high PR-AUC (>0.98). Additionally, it maintained very low FPR (between 0.1% and 6%) and high precision scores (between 0.915 and 0.999) across all test sets. However, the stacked model resulted in the highest training times (up to 194 s) and the largest model sizes (up to 7.812 MB). In general, the results indicate a clear predictive performance and computational efficiency trade-off that requires detailed planning before deploying stacked meta models in resource-constrained NFV environments.
4.4. Model Explainability and Feature Attribution Analysis
This subsection demonstrates the application of an explainable AI technique called SHAP. Additionally, the subsection provides a feature attribution analysis, demonstrating the usage of SHAP visualization tools for plotting the impact of each network traffic feature on final model predictions. This helps us better interpret models’ decisions and detect any potential algorithmic biases. In the context of ML-based cyberattack detection, explainable ML models help security practitioners better understand the decisions generated by analytics engines, embedded in various security software products. For example, if the model raises a security alert, we want to understand the “why” behind the alert, especially which specific network traffic features strongly influenced its activation.
Firstly, we provide SHAP summary plots to demonstrate global feature importance for each of the three VNF datasets, as ranked by the Random Forest, XGBoost, and CatBoost models. Then, we provide SHAP dependence plots per model to illustrate how the exact values of each feature influence specific predictions. Dependence plots also allow us to analyze any feature interactions learned by the models and how these interactions influence the final predictions.
Figure 5 presents three SHAP summary plots for the Random Forest, XGBoost, and CatBoost models, which demonstrate the importance and influence of features from the vDNS dataset on cyberattack predictions. There is an observable consistency in feature importance across all three models, in which features that describe traffic volume per session receive high importance rankings, such as the number of raw and data bytes sent from the source. This indicates that the models primarily use traffic volume features as attack indicators. The calculated SHAP values quantify the impact of each feature on model predictions.
Figure 5.
SHAP summary plots for the ensemble models, showing global feature importance using the vDNS dataset. Each point represents a single network session, colored according to the feature magnitude (low to high).
By observing the SHAP summary plot for the Random Forest model, the number of raw and data bytes transferred per network session creates a very wide distribution of SHAP values, indicating that these features strongly impact global predictions, although their contribution is not uniform across all network sessions. This occurs because tree splits in the Random Forest ensemble may use low byte values to predict attacks from one group of sessions, while using them for benign traffic predictions for another group. Whereas, high values for the TCP SYN and TCP Push (PSH) flags indicate a higher probability of attacks, as confirmed by positive SHAP values. Since many packets have TCP SYN and TCP PSH flags set, this suggests extreme spikes in connection attempts and data transfer events, often present in cyberattacks involving automated vulnerability scans, brute-force attacks, or exploit uploads to target hosts. Equivalently, the XGBoost model uses high TCP SYN values and traffic volume features, such as raw and data bytes sent by the source, to classify traffic. However, the distribution of raw source bytes differs slightly, with numerous low byte values pushing predictions toward the malicious class and indicating potential nonlinear interactions with other features. The CatBoost model demonstrates a similar ordering of feature attributions, with a relatively symmetric distribution of source data bytes, pushing TCP SYN, TCP PSH, and TCP SYN-ACK flags higher in importance ranking.
Figure 6 contains three SHAP dependence plots to demonstrate the prediction and interaction effects of the most important features in the vDNS dataset, presented across the Random Forest, XGBoost, and CatBoost models. The x-axis presents feature values, while the corresponding SHAP values are provided on the y-axis. Each plot also includes a feature that displays the strongest interaction with the plotted feature, as automatically selected by SHAP’s Explainer object. The exact values of the second feature that interact with the values of the plotted feature are color-coded based on a scale on the right side of the plot.
Figure 6.
SHAP dependence plots for the ensemble models, demonstrating prediction and interaction effects of the most important features in the vDNS dataset.
If we observe the Random Forest model, the dependence plot reveals that for many network sessions with fewer than 200 data bytes transferred by the source, interaction effects become strong when the number of TCP SYN packets in a session exceeds 0.5. This interaction largely dominates benign traffic predictions, as indicated by negative SHAP values between −0.2 and 0, although several occurrences of very low data byte counts (<100) primarily drive malicious traffic predictions. The dependence plot for the XGBoost model demonstrates a wider separation of feature values, where a lower number of raw bytes sent by the source is directly predictive of malicious traffic, yet there is a cluster of sessions with fewer than 250 bytes that predicts benign traffic. Low raw source byte values interacting with total data bytes clustered around 500 push predictions toward the malicious class, whereas sessions carrying more than 2000 raw bytes and more than 2500 total data bytes are mostly used to predict benign traffic. The dependence plot for the CatBoost model reveals that lower counts of source data bytes primarily drive benign traffic predictions, although several groups of sessions use these instances to predict malicious traffic, as shown by positive SHAP values (>2). In a few cases, higher values of both source data bytes and raw bytes increase SHAP values, thereby contributing to malicious traffic predictions.
Figure 7 presents three SHAP summary plots for the Random Forest, XGBoost, and CatBoost models, which demonstrate the importance and influence of features from the vRouter_vFirewall dataset on cyberattack predictions.
Figure 7.
SHAP summary plots for the ensemble models, showing global feature importance using the vRouter_vFirewall dataset.
As shown in the figure, the Random Forest model relies on the lower range of raw source bytes with an irregular pattern of influence on malicious flow prediction. Different decision trees split different thresholds, leading to a wider distribution of feature influence that aligns with the previously observed distribution for the vDNS dataset, suggesting that this feature is context-sensitive and should be interpreted interactively with other features to understand the positive (attack) predictions. The summary plot for XGBoost exhibits a similar distribution for raw source bytes, but also relies on TCP PSH and TCP Reset (RST) flags to discriminate between benign and malicious flows. Higher frequencies of data uploads and connection resets, as indicated by red dots near the origin point, can suggest possible spoofing, probing, or command-and-control threats. The CatBoost model exhibits a similar distribution of raw source byte values to the previous models. However, there is the data bytes and bytes feature compact distribution, as well as interpretable influence based on the magnitude of byte values. Based on the plot, it is evident that CatBoost utilizes the total number of data and raw bytes transferred per session to discriminate between benign and malicious network flows, with values in the lower range primarily influencing attack predictions.
Figure 8 contains three SHAP dependence plots to demonstrate the prediction and interaction effects of the most important features in the vRouter_vFirewall dataset, presented across the Random Forest, XGBoost, and CatBoost models.
Figure 8.
SHAP dependence plots for the ensemble models, demonstrating prediction and interaction effects of the most important features in the vRouter_vFirewall dataset.
The dependence plot for the Random Forest model explains how the effect of source bytes on the predictions varied with TCP flag values, suggesting that the model generally produced positive (attack) predictions for a small group of sessions sending fewer than 500 raw bytes from the source, most of which contained TCP SYN-ACK values above 1.0. On the other hand, when the number of raw source bytes increased, SHAP values remained negative, indicating that a high traffic volume was generally not associated with cyberattacks. The dependence plot for XGBoost displays a similar cumulative effect of raw source bytes and TCP SYN-ACK values, where increasing SYN-ACK values form tight clusters at negative SHAP values even as raw source bytes increase. However, we can observe a few sessions with values at lower ranges for both features, which appear at positive SHAP values and increase the probability of malicious traffic detection. CatBoost, in contrast, strongly correlates raw source bytes with TCP PSH values, where extremely low values for both features spread across prediction boundaries. However, there is a distinct cluster of low-byte and low-PSH flows that pushes the predictions toward the malicious class.
Figure 9 presents three SHAP summary plots for the Random Forest, XGBoost, and CatBoost models, which demonstrate the importance and influence of features from the vIDS dataset on cyberattack predictions.
Figure 9.
SHAP summary plots for the ensemble models, showing global feature importance using the vIDS dataset.
To accurately discriminate between benign and malicious flows, all three models mainly relied on protocol-related information, autonomous system numbers (ASNs) calculated from destination IP addresses, and the number of raw bytes transferred from source addresses. It is important to note that each protocol category and destination ASN was encoded using the mean target value, represented as probably malicious flow if it includes that specific category or ASN. The models notably associated high values for the encoded protocol categories with a greater likelihood of cyberattacks. The summary plots for XGBoost and CatBoost exhibit consistent patterns with Random Forest in terms of the two top-ranked features. However, there is slight variability in the distribution of raw source byte values across the three models. While the lower values, in general, tend to increase SHAP values and thereby help the models predict malicious traffic, several clusters of points are more aligned with benign traffic predictions.
Figure 10 contains SHAP dependence plots for demonstrating the prediction and interaction effects of the most important features in the vIDS dataset, presented across the Random Forest, XGBoost, and CatBoost models.
Figure 10.
SHAP dependence plots for the ensemble models, demonstrating prediction and interaction effects of the most important features in the vIDS dataset.
As shown in the figure, the plotted points form seven vertical clusters. This pattern is consistent across all models, where the clusters represent specific network protocol categories, which form strong interaction patterns with different destination ASNs. The patterns imply that some protocol combinations have a higher likelihood of belonging in malicious traffic flows, especially if specific destination ASNs accompany them. Based on the color and position on the Cartesian plane, each plotted point explains the magnitude and direction of the interaction between these features.
By performing a mapping between protocol categories and the probabilities of being used in malicious flows, we can interpret the dependence plots as follows:
- The leftmost cluster of network sessions is associated with negative SHAP values, is centered around a protocol value of 0.0, and contains a mix of destination ASN types, as indicated by various point colors in the cluster. Based on these observations and the described mapping, we found that the following protocol combinations have an extremely low likelihood of being included in malicious traffic flows: (TCP, TLS), (DNS, UDP), (TCP, Hypertext Transfer Protocol (HTTP2), TLS), (Dynamic Host Configuration Protocol (DHCP), UDP), (UDP, DHCP), (Network Time Protocol (NTP), UDP), UDP, and (UDP, Quick UDP Internet Connections (QUIC)).
- The topmost cluster of sessions is associated with positive SHAP values, is positioned in a protocol range of 0.8 to 1.0, and contains only a few high-risk destination ASNs in its packet headers. Therefore, we can identify the following protocol combinations as the most indicative of malicious traffic: (UDP, DNS), (UDP, NTP), and (TCP, DNS).
Overall, this analysis helped us identify the features that exert the strongest influence on attack predictions, as well as contributed to higher interpretability and explainability of the models included in the study.
5. Discussion
5.1. Ensemble and Stacked Meta Learners in Cybersecurity
Several academic publications reported that ensembles based on Decision Trees often suffer from overfitting [6,7]. In our experiment, gradient boosting models (XGBoost and CatBoost) demonstrated high recall and low precision on the largest test set with many multi-collinearities among features, suggesting greater sensitivity to noise and an increased risk of overfitting compared with other models.
Random Forest is an exception to this issue, as it is inherently robust and, despite the noise and complexity in network traffic datasets, can achieve high performance score. For this reason, Random Forest is commonly used for security threat classification [6]. The consistency in performance of our Random Forest ensemble across multiple datasets is supported by [10], which reports high precision, recall, and F1-scores for this model on several intrusion detection datasets. Our results similarly demonstrate robustness, with these metrics exceeding 88%, as described in Section 4.
Methodologically, the stacking model combines multiple ensembles to achieve performance enhancements for the network traffic classification task. It achieved excellent results across all three test sets, particularly in precision, FPR, and PR-AUC, which aligns with the hybrid approach for network anomaly detection proposed in [10]. That study also reports reduced false positives, consistent with the FPR improvements made by our stacking model. In security operations, one of the most significant challenges for security practitioners is alert fatigue, caused by a large influx of false alerts generated by systems that rely on traditional threat detection strategies [13]. Our results demonstrate that ensemble and stacking-based models introduce significant operational improvements, as evident by their low FPRs and high PR-AUC values. By reducing the number of false alerts and producing more reliable predictions, the incident response process in SOCs can be accelerated.
Regarding rare and evolving cyberthreats, a study in [12] discusses few-shot learning for malware classification and the importance of improved meta learning for detecting novel malware families, often present in zero-day attacks. Our findings suggest that robust tree-based ensembles and stacked models can capture rare and potentially malicious traffic patterns, while model-driven preprocessing substantially improves data quality and performance. Tree-based ensembles and stacked models also demonstrate great potential in detecting polymorphic malware [15]. High recall, F1-score, and PR-AUC scores of our models across multiple VNF datasets reflect similar results.
Ensemble models have also proven their effectiveness in SDN and NFV environments, particularly for DDoS detection using Random Forest in SDN control planes [16]. Comparable findings are reported in [17], where XGBoost and Random Forest achieved strong generalization on the UNSW-NB15 dataset. Unlike these studies, our work extends the literature by incorporating a stacked meta learner to examine performance and efficiency trade-offs for NFV infrastructures.
Design trade-offs must also be considered when selecting a meta learner. We used Logistic Regression for the meta layer of our stacked architecture, to aggregate the predictions of tree-based ensembles and achieve very high performance. But, its recall and F1-score declined on the largest dataset (vRouter_vFirewall), possibly due to the selection of a linear model, which aligns with the results in [26]. In contrast, ref. [20] reports excellent results using XGBoost as a meta learner, at the expense of increased computational complexity.
Compared with stacked model evaluations on benchmark datasets, such as NSL-KDD and UNSW-NB15 [24,27], our study evaluates tree-based ensembles and stacked generalization on multiple, service-specific VNF datasets that better reflect real NFV deployments. Furthermore, prior studies primarily emphasize accuracy and F1-score as performance metrics, while our inclusion of PR-AUC and FPR provides a more reliable evaluation using imbalanced network traffic data. Unlike [27], which focuses on hyperparameter tuning conceptually, as well as [30], where the authors used grid search to construct decision trees with large depth parameters and high learning rates, our work explicitly covers highly efficient optimization using Optuna.
Studies on darknet traffic [28,29] further confirm that tree-based ensemble methods can effectively and timely capture the security risks and complex patterns present within darknet access channels, such as Virtual Private Networks (VPNs). In contrast to the bagging approach explicitly used in [28], our study integrates methods based on bagging, boosting, and stacked generalization.
In general, our experimental results and previously discussed findings emphasize the importance of selecting a robust model to be implemented at the meta layer, without creating a significant computational overhead in NFV environments. We also highlight the importance of efficient hyperparameter tuning strategies across various research publications. Finally, the referenced literature necessitates the usage of models that balance low FPR with high recall, enabling security practitioners to mitigate security risks in an operationally efficient way.
5.2. Computational Efficiency Considerations
In order to incorporate ML-based security into the design of virtualized network environments, such as NFV, we must consider computational efficiency. To accurately plan computing resources that support the deployment of ML models, we must estimate the size of the data that will be ingested and used in model training, as well as anticipate any class imbalance issues [11]. Although model training is typically performed offline and therefore has less direct impact on runtime operation, shorter training times facilitate more frequent model retraining as network traffic patterns, as well as attack patterns evolve.
A study in [9] thoroughly investigates near real-time threat detection capabilities of ML models, which must be supported by a low-latency and scalable infrastructure, especially in cloud environments with pay-as-you-go pricing plans. In addition, the study emphasizes the importance of optimizing inference times of ML models to achieve real-time detection. Based on our experimental results, XGBoost and CatBoost models resulted in the shortest inference times (<0.14 s), while XGBoost also had the shortest training time on two out of three test sets. These results demonstrate their applicability for near real-time detection in resource-contrained NFV systems, as proposed in [20]. The challenge of achieving computationally efficient models in conventional networking scenarios has also been discussed in [14]. Our findings are consistent with those reported in [14], where the authors used a KDD Cup 1999 network intrusion detection dataset to demonstrate that ensemble models like Random Forest suffer from high inference times and high memory usage. On the other hand, because of their virtualized design, dynamic service orchestration, and stringent latency constraints, timely detection of malicious activity propagating through chained VNFs requires robust security mechanisms that not only achieve high detection accuracy and low false positive rate, but also preserve low inference latency and low computing overhead. Predictive performance results of our Random Forest model align with those in [14], but our study further shows that, in NFV network environments, deployment decisions must strongly balance predictive performance with computational efficiency mainly due to virtualization overhead and high dynamism. Therefore, our results demonstrate a systematic and practical evaluation of inference times across diverse models and data subsets, where XGBoost and CatBoost demonstrated the greatest potential for real-time attack detection and latency-sensitive services due to rapid inference.
Several studies also report recurring complexity in implementing ML models in virtual ecosystems, where robust computing, memory and storage infrastructures for model deployment require significant investments [18,19]. For instance, cloud, edge, NFV, and similar virtual environments allow computing, memory, and storage resource sharing among multiple services, such as VNFs. On top of that, excessive memory consumption or long inference times caused by deployed ML models can introduce significant latency and performance degradation. Therefore, our study analyzes the feasibility of implementing robust ensembles in operational NFV environments to reduce the need for substantial computing resources due to the models’ low inference and training times.
However, the results reporting RAM usage and serialized size of our stacking model indicate that the model suffers from storage inefficiencies, as supported by [21]. Computational inefficiencies are also evident from the model’s training times, which exceeded 16 s for a medium-sized dataset with less than 10,500 instances and 10 features. Despite the advantages of flexibility and reliable predictions across diverse data inputs, stacking models require significant disk space and RAM resources.
The study in [24] also reports uncompressed model sizes for stacking and tree-based classifiers, with stacking models consuming between 5.8905 MB and 9.8779 MB across datasets. Although direct comparison with our models is limited due to differences in model architectures and experimental environments, both studies confirm that tree-based ensembles and stacking classifiers typically require more storage space, partly due to the depth of Decision Trees.
5.3. Model Explainability and Cyberattack Indicators
A study in [10] examines challenges related to AI and ML adoption for cybersecurity risk modeling in healthcare and identifies model explainability limitations as a major barrier in highly regulated environments. To support regulatory compliance and practical deployment of AI-driven network monitoring, the study emphasizes the need for highly interpretable model development. The study in [11] also emphasized this need, where the authors propose the usage of explainable AI techniques to improve transparency and trust in cybersecurity applications.
A study in [18] also discusses the limitations in AI-driven cybersecurity systems, including automated Security Information and Event Management (SIEM) tools. Although such systems enable near real-time threat detection, they often suffer from limited interpretability, particularly in NFV environments with scarce labeled attack data. The lack of interpretable alerts and recommendations generated by AI-driven security software further intensifies this problem. To address it, our study incorporates a detailed SHAP analysis, providing global and per-feature insights into models’ decisions. By analyzing SHAP plots, we validated whether the models relied on network features that are meaningful from a security analyst’s perspective. From an operational perspective, SHAP-based explainability can support security analysts by providing transparent, precise and insightful alerts based on model predictions. This transparency creates a shift in modern SOC environments, where security analysis shifts from triaging black-box alerts to understanding why a specific network flow was classified as malicious. For instance, alerts triggered by high TCP SYN or RST flag activity can be prioritized as potential scanning or DoS attempts, Therefore, explainability improves incident triage efficiency by reducing alert fatigue and allowing analysts to focus on critical traffic patterns in NFV infrastructures.
Beyond model selection, we should also consider robust feature engineering strategies, especially for the security of virtualized network environments. If we want to build strongly predictive models, various feature engineering techniques can help us identify the most important features that, from the perspective of network behavior, can accurately indicate malicious traffic samples. The study in [9] highlights network flow statistics, system request and response patterns, authentication events, and resource consumption metrics as most indicative signals for attack prediction. This partially aligns with the results of our SHAP analysis, where we found network flow characteristics, as well as system request and response patterns to be strongly indicative of cyberattacks.
A study in [23] provides evidence on the importance of behavioral signals, where a meta learner integrated with semantic feature extraction achieved significant improvements in classifying benign, attack, and rare attack traffic. The study identifies session duration, protocols, total received packets, and total packet length as the strongest indicators of rare attacks. These findings are consistent with our results and support the suitability of the selected models for detecting rare and polymorphic threats [12,15].
As identified in [42,43], stacking models based on meta learning are generally less interpretable than standalone ensembles. We can attribute this drawback to their multilayered structure and a set of input features used by the meta model to learn and generate predictions. Specifically, our Logistic Regression meta learner accepts a linear combination of probabilities of the base classifiers instead of the original network features, which creates unclear feature-level explanations of the decisions produced by the meta model. The outputs of the base classifiers already provide sufficient and transparent insight into the final decision process. Therefore, we restricted our SHAP analysis to the base classifiers to demonstrate how the exact values of specific network traffic features affect the final cyberattack predictions.
5.4. Limitations and Future Directions
Although our performance, computational efficiency, and explainability findings look promising in the context of NFV security, we must discuss several limitations and practical implications of our work in relation to the existing literature. As mentioned by Zehra et al. in [44], currently implemented ML models in network and security monitoring products struggle to achieve real-time detection, especially in highly dynamic and resource-constrained NFV environments. Although several models that we evaluated in our study demonstrate excellent detection capabilities and efficient resource usage, their adaptability and scalability in real-world NFV environments remain underexplored. Future work should focus on exploring these areas, as well as how to increase the computational efficiency of stacked meta learners. Since all measurements were conducted on commodity hardware (Intel Core i5-1235U CPU with 16 GB RAM), future studies should validate the proposed workflow and the results using the complete VNFCYBERDATA dataset, as well as additional cybersecurity datasets on production-scale GPU clusters. The usage of additional cybersecurity datasets to perform the validation would also enhance the generalizability of the proposed methods. Future measurements should incorporate statistical significance testing, such as the Wilcoxon signed-rank test for pairwise comparisons, to provide stronger evidence of performance differences between models. Additionally, future studies should explore the multiclass classification abilities of the models included in this study, since real-world SOC environments often require a clear distinction between multiple attack categories rather than binary classification alone.
Another limitation of this work lies in the primarily reactive nature of the models examined in the study. As emphasized by Sarker in [45], there is an urgent need to transform the AI-driven cybersecurity systems from reactive to fully proactive systems, by enhancing their security risk mitigation and response capabilities. Therefore, future research directions should focus on more robust algorithms for meta learning, as well as the adoption of automated ML (AutoML) in NFV orchestration and incident response.
Finally, we restricted our SHAP analysis to individual ensembles, which is not fully representative of the entire stacking system with a meta learning layer. In alignment with [43], stacked meta learners rely on a layered decision-making process due to their multilayered structure, which introduces comparable limitations to those of deep neural networks. To address this limitation, a study in [42] explores the capabilities of XStacking, a promising technique for enhancing the explainability of stacking models. The proposed technique optimizes the feature space specifically for the meta learner, where the inputs are not restricted to the predictions of base models, but also include their feature importance scores. Future work should extend this analysis by enhancing the explainability of stacked meta learners in a more comprehensive manner.
6. Conclusions
This study analyzed the predictive and computational efficiency performance of ensemble and stacking-based ML models across diverse VNF appliances. The experimental results demonstrated the applicability of gradient boosting methods for near real-time cyberattack detection, while tree-based methods and stacking meta learners were highly accurate in detecting attacks from high-dimensional datasets with complex network traffic patterns. The capabilities of our models could become a feasible choice for securing highly dynamic and critical NFV systems, which are often susceptible to serious security risks. While the proposed framework demonstrates that ensemble learning and stacked meta models can achieve highly accurate cyberattack detection in NFV environments, future research should investigate large-scale real-time deployment under resource constraints, adaptive online learning, robustness against adversarial threats, and validation across additional VNF-specific datasets. We also examined the models in the context of explainable AI and network behavior analysis, for the purpose of identifying the strongest threat indicators in standard VNF traffic logs. Overall, the experimental results and findings of this project can be aggregated into actionable insights for deploying efficient, interpretable, and accurate ML models in security-critical NFV systems.
Author Contributions
Conceptualization, S.F. and E.Y.; methodology, S.F. and E.Y.; software, S.F.; validation, S.F. and E.Y.; formal analysis, S.F. and E.Y.; investigation, S.F.; resources, S.F.; data curation, S.F.; writing—original draft preparation, S.F.; writing—review and editing, S.F. and E.Y.; visualization, S.F.; supervision, E.Y.; project administration, S.F. and E.Y. All authors have read and agreed to the published version of the manuscript.
Funding
This research received no external funding.
Data Availability Statement
The original data presented in the study are openly available in FigShare at https://figshare.com/s/f065022eb85701278c58 (accessed on 4 February 2026).
Acknowledgments
The authors would like to thank Mehmet Akif Yaman (akif.yaman@yee.org.tr) for providing valuable scientific input and constructive feedback throughout the research process. We particularly acknowledge the significant contributions made during the manuscript revision, which helped address the reviewers’ comments, improve the manuscript, and strengthen its overall scientific quality.
Conflicts of Interest
The authors declare no conflicts of interest.
Abbreviations
The following abbreviations are used in this manuscript:
| NFV | Network Function Virtualization |
| VNF | Virtualized Network Function |
| IDS | Intrusion Detection System |
| AI | Artificial Intelligence |
| ML | Machine Learning |
| DL | Deep Learning |
| XGBoost | eXtreme Gradient Boosting |
| SVM | Support Vector Machine |
| kNN | k-Nearest Neighbors |
| MI-MAML | Multi-Improved Model-Agnostic Meta-Learning |
| FPR | False Positive Rate |
| RBF | Radial Basis Function |
| SDN | Software-Defined Networking |
| DDoS | Distributed Denial of Service |
| SIP-VoIP | Session Initiation Protocol-Voice over Internet Protocol |
| SHAP | SHapley Additive exPlanations |
| PR-AUC | Precision–Recall Area Under the Curve |
| SOC | Security Operations Center |
| ASN | Autonomous System Number |
| VPN | Virtual Private Network |
| SIEM | Security Information and Event Management |
| AutoML | Automated Machine Learning |
Appendix A
To address the problem of imbalanced classes in all three VNF datasets, we trained each model using balanced class weights. For Random Forest, we set the class_weight parameter to ‘balanced’, assigning stronger weights to the minority class and mitigating the dominant impact of the majority class on the model’s predictions. For XGBoost, we defined the scale_pos_weight parameter as the ratio of benign to malicious samples, increasing the impact of rare samples during gradient boosting. Then, we set CatBoost’s auto_class_weights to ‘Balanced’, reducing bias toward the majority class. Finally, we set the class_weight parameter of Logistic Regression in the stacked model to ‘balanced’ and trained the model in up to 500 iterations until convergence.
The hyperparameter optimization procedure for Random Forest covered the following hyperparameters and search ranges: number of decision trees (n_estimators) between 100 and 500, maximum depth of a tree (max_depth) in a range from 10 to 50, minimum number of samples required to split a node (min_samples_split) in a range from 2 to 20, and maximum number of leaf nodes (max_leaf_nodes) between 2 and 30. After the trials were completed, Optuna selected the combination of hyperparameters that achieved the highest F1-score and used it to train the Random Forest model.
Meanwhile, for XGBoost, Optuna explored the following hyperparameters and search ranges: number of decision trees (n_estimators) between 100 and 500, maximum depth of a tree (max_depth) in a range from 6 to 20, learning rate (eta) between 0.01 and 0.1, and minimum sum of instance weights in a child node (min_child_weight) between 1 and 50.
Finally, for CatBoost, Optuna searched the following hyperparameters and corresponding ranges: maximum number of trees (iterations) between 100 and 500, maximum depth of a tree (depth) in a range from 4 to 10, learning rate (learning_rate) between 0.01 and 0.3, and minimum number of samples or data points per leaf node (min_data_in_leaf) between 1 and 64.
Table A1, Table A2 and Table A3 summarize the optimal sets of hyperparameter values selected by Optuna per model for vDNS, vRouter_vFirewall, and vIDS datasets, respectively.
Table A1.
Optimal hyperparameter values for each model trained on the vDNS dataset.
Table A2.
Optimal hyperparameter values for each model trained on the vRouter_vFirewall dataset.
Table A3.
Optimal hyperparameter values for each model trained on the vIDS dataset.
References
- Adoga, H.U.; Pezaros, D.P. Network function virtualization and service function chaining frameworks: A comprehensive review of requirements, objectives, implementations, and open research challenges. Future Internet 2022, 14, 59. [Google Scholar] [CrossRef] [Scilit]
- Halbouni, A.; Gunawan, T.S.; Habaebi, M.H.; Halbouni, M.; Kartiwi, M.; Ahmad, R. Machine learning and deep learning approaches for cybersecurity: A review. IEEE Access 2022, 10, 19572–19585. [Google Scholar] [CrossRef] [Scilit]
- Kokogho, N.E.; Okon, N.R.; Omowole, N.B.M.; Ewim, N.C.P.-M.; Onwuzulike, N.O.C. Enhancing cybersecurity risk management in fintech through advanced analytics and machine learning. Int. J. Front. Sci. Technol. Res. 2025, 8, 001–023. [Google Scholar] [CrossRef] [Scilit]
- Mohamed, N. Artificial intelligence and machine learning in cybersecurity: A deep dive into state-of-the-art techniques and future paradigms. Knowl. Inf. Syst. 2025, 67, 6969–7055. [Google Scholar] [CrossRef] [Scilit]
- Ayodele, B.; Buttigieg, V. The VNF cybersecurity dataset for research (VNFCYBERDATA). Data 2024, 9, 132. [Google Scholar] [CrossRef] [Scilit]
- Jain, N.S. Advancing cybersecurity with artificial intelligence and machine learning: Architectures, algorithms, and future directions in threat detection and mitigation. World J. Adv. Eng. Technol. Sci. 2025, 14, 273–290. [Google Scholar] [CrossRef] [Scilit]
- Aliferis, C.; Simon, G. Overfitting, underfitting and general model overconfidence and under-performance pitfalls and best practices in machine learning and AI. In Health Informatics; Springer: Cham, Switzerland, 2024; pp. 477–524. [Google Scholar] [CrossRef] [Scilit] [PubMed]
- Salman, A.M.; Al-Nuaimi, B.T.; Subhi, A.A.; Alkattan, H.; Alfilh, R.H.C. Enhancing cybersecurity with machine learning: A hybrid approach for anomaly detection and threat prediction. Mesopotamian J. Cybersecur. 2025, 5, 202–215. [Google Scholar] [CrossRef] [Scilit]
- Sundaramurthy, S.K.; Ravichandran, N.; Inaganti, A.C.; Muppalaneni, R. AI-driven threat detection: Leveraging machine learning for real-time cybersecurity in cloud environments. Artif. Intell. Mach. Learn. Rev. 2025, 6, 23–43. [Google Scholar]
- Adesokan-Imran, T.O.; Popoola, A.D.; Ejiofor, V.O.; Salako, A.O.; Onyenaucheya, O.S. Predictive cybersecurity risk modeling in healthcare by leveraging AI and machine learning for proactive threat detection. J. Eng. Res. Rep. 2025, 27, 144–165. [Google Scholar] [CrossRef] [Scilit]
- Alharthi, A.; Alaryani, M.; Kaddoura, S. A comparative study of machine learning and deep learning models in binary and multiclass classification for intrusion detection systems. Array 2025, 26, 100406. [Google Scholar] [CrossRef] [Scilit]
- Ji, Y.; Zou, K.; Zou, B. Mi-maml: Classifying few-shot advanced malware using multi-improved model-agnostic meta-learning. Cybersecurity 2024, 7, 72. [Google Scholar] [CrossRef] [Scilit]
- Haq, H.B.U.; Younis, R.; Ali, M.S. Towards robust network security: Evaluating machine learning algorithms for intrusion detection. Decis. Mak. Adv. 2025, 3, 126–138. [Google Scholar] [CrossRef] [Scilit]
- Ness, S.; Eswarakrishnan, V.; Sridharan, H.; Shinde, V.; Janapareddy, N.V.P.; Dhanawat, V. Anomaly detection in network traffic using advanced machine learning techniques. IEEE Access 2025, 13, 16133–16149. [Google Scholar] [CrossRef] [Scilit]
- Anil, D.; Shreeshayana, R.; Kiran, B. Advanced malware detection methods for polymorphic virus identification. In Proceedings of the 5th International Conference on Communication, Computing & Industry 6.0 (C2I6), Bengaluru, India, 6–7 December 2024; pp. 1–6. [Google Scholar] [CrossRef] [Scilit]
- Hirsi, A.; Audah, L.; Salh, A.; Alhartomi, M.A.; Ahmed, S. Enhancing SDN security using ensemble-based machine learning approach for DDoS attack detection. Indones. J. Electr. Eng. Comput. Sci. 2025, 38, 1073–1085. [Google Scholar] [CrossRef] [Scilit]
- Allaw, Z.; Zein, O.; Ahmad, A.-M. Cross-layer security for 5G/6G network slices: An SDN, NFV, and AI-based hybrid framework. Sensors 2025, 25, 3335. [Google Scholar] [CrossRef] [Scilit] [PubMed]
- Karamchand, G. AI-optimized network function virtualization (NFV) security in cloud infrastructure. Int. J. Humanit. Inf. Technol. 2025, 7, 1–12. [Google Scholar]
- Jmila, H.; Khedher, M.I.; El Yacoubi, M. The promise of applying machine learning techniques to network function virtualization. Int. J. Netw. Dyn. Intell. 2024, 3, 100020. [Google Scholar] [CrossRef] [Scilit]
- Sahbi, A.; Jaidi, F.; Bouhoula, A. Next-generation network security: An analysis of threats, challenges and emerging intelligent defenses within SDN and NFV architectures. Int. J. Adv. Comput. Sci. Appl. 2025, 16, 1–10. [Google Scholar] [CrossRef] [Scilit]
- Yang, A.; Lu, C.; Li, J.; Huang, X.; Ji, T.; Li, X.; Sheng, Y. Application of meta-learning in cyberspace security: A survey. Digit. Commun. Netw. 2022, 9, 67–78. [Google Scholar] [CrossRef] [Scilit]
- Yoro, R.E.; Okpor, M.D.; Akazue, M.I.; Okpako, E.A.; Eboka, A.O.; Ejeh, P.O.; Ojugo, A.A.; Odikanaose, C.C.; Binitie, A.P.; Ako, R.W.; et al. Adaptive DDoS detection mode in software-defined SIP-VoIP using transfer learning with boosted meta-learner. PLoS ONE 2025, 20, e0326571. [Google Scholar] [CrossRef] [Scilit] [PubMed]
- Jerusha, Y.A.; Ibrahim, S.P.S.; Varadharajan, V. A novel semantic driven meta-learning model for rare attack detection. IEEE Access 2025, 13, 73219–73235. [Google Scholar] [CrossRef] [Scilit]
- Pramanick, N.; Mathew, J.; Selvarajan, S.; Agarwal, M. Leveraging stacking machine learning models and optimization for improved cyberattack detection. Sci. Rep. 2025, 15, 16757. [Google Scholar] [CrossRef] [Scilit] [PubMed]
- Rahman, A.; Khan, M.S.I.; Eidmum, M.Z.A.; Shaha, P.; Muiz, B.; Hasan, N.; Debnath, T.; Kundu, D.; Tamanna, J.T.; Sayduzzaman, M.; et al. Stacked ensemble method: An advanced machine learning approach for anomaly-based intrusion detection system. Stat. Optim. Inf. Comput. 2025, 14, 434–453. [Google Scholar] [CrossRef] [Scilit]
- Ali, M.; Mushtaq, M.F.; Akram, U.; Ramzan, S.; Tahir, S.; Ahsan, M. An ensemble approach for firewall log classification using stacked machine learning models. J. Comput. Biomed. Inform. 2025, 8, 1–6. [Google Scholar] [CrossRef] [Scilit]
- Ali, M.; Mushtaq, M.F.; Akram, U.; Aray, D.G.; Vergara, M.M.; Karamti, H.; Ashraf, I. Botnet detection in internet of things using stacked ensemble learning model. Sci. Rep. 2025, 15, 21012. [Google Scholar] [CrossRef] [Scilit] [PubMed]
- Al-Haija, Q.A.; Krichen, M.; Elhaija, W.A. Machine-learning-based darknet traffic detection system for IoT applications. Electronics 2022, 11, 556. [Google Scholar] [CrossRef] [Scilit]
- Gayard, L. Darknet: Geopolitics and Uses; John Wiley & Sons: Hoboken, NJ, USA, 2018. [Google Scholar] [CrossRef] [Scilit]
- Tian, Y.; Dai, X.; Li, Z.; Guo, H.; Mao, X. Improving the accuracy of cybersecurity spam email detection using ensemble techniques: A stacking approach. PLoS ONE 2025, 20, e0331574. [Google Scholar] [CrossRef] [Scilit] [PubMed]
- Shanmugam, V.; Razavi-Far, R.; Hallaji, E. Addressing class imbalance in intrusion detection: A comprehensive evaluation of machine learning approaches. Electronics 2024, 14, 69. [Google Scholar] [CrossRef] [Scilit]
- Zhang, W.; Lazaro, J.P. A survey on network security traffic analysis and anomaly detection techniques. Int. J. Emerg. Technol. Adv. Appl. 2024, 1, 8–16. [Google Scholar] [CrossRef] [Scilit]
- Szczepański, M.; Pawlicki, M.; Kozik, R.; Choraś, M. The application of deep learning imputation and other advanced methods for handling missing values in network intrusion detection. Vietnam J. Comput. Sci. 2022, 10, 1–23. [Google Scholar] [CrossRef] [Scilit]
- Chugh, B.; Malik, N.; Gupta, D.; Alkahtani, B.S. A probabilistic approach driven credit card anomaly detection with CBLOF and isolation forest models. Alex. Eng. J. 2024, 114, 231–242. [Google Scholar] [CrossRef] [Scilit]
- Buschjäger, S.; Honysz, P.-J.; Morik, K. Randomized outlier detection with trees. Int. J. Data Sci. Anal. 2020, 13, 91–104. [Google Scholar] [CrossRef] [Scilit]
- Pargent, F.; Pfisterer, F.; Thomas, J.; Bischl, B. Regularized target encoding outperforms traditional methods in supervised machine learning with high cardinality features. Comput. Stat. 2022, 37, 2671–2692. [Google Scholar] [CrossRef] [Scilit]
- Ji, R.; Kumar, N.; Padha, D. Hybrid enhanced intrusion detection frameworks for cyber-physical systems via optimal feature selection. Indian J. Sci. Technol. 2024, 17, 3069–3079. [Google Scholar] [CrossRef] [Scilit]
- Abdelaziz, M.T.; Radwan, A.; Mamdouh, H.; Saad, A.S.; Abuzaid, A.S.; AbdElhakeem, A.A.; Zakzouk, S.; Moussa, K.; Darweesh, M.S. Enhancing network threat detection with random forest-based NIDS and permutation feature importance. J. Netw. Syst. Manag. 2024, 33, 2. [Google Scholar] [CrossRef] [Scilit]
- Ma, R.; Wang, Q.; Bu, X.; Chen, X. Real-time detection of DDoS attacks based on random forest in SDN. Appl. Sci. 2023, 13, 7872. [Google Scholar] [CrossRef] [Scilit]
- Henriques, J.; Caldeira, F.; Cruz, T.; Simões, P. Combining K-means and XGBoost models for anomaly detection using log datasets. Electronics 2020, 9, 1164. [Google Scholar] [CrossRef] [Scilit]
- Ahmed, M.A.O.; AbdelSatar, Y.; Alotaibi, R.; Reyad, O. Enhancing internet of things security using performance gradient boosting for network intrusion detection systems. Alex. Eng. J. 2025, 116, 472–482. [Google Scholar] [CrossRef] [Scilit]
- Garouani, M.; Barhrhouj, A.; Teste, O. XStacking: An effective and inherently explainable framework for stacked ensemble learning. Inf. Fusion 2025, 124, 103358. [Google Scholar] [CrossRef] [Scilit]
- Vourganas, I.J.; Michala, A.L. Applications of Machine Learning in Cyber Security: A Review. J. Cybersecur. Priv. 2024, 4, 972–992. [Google Scholar] [CrossRef] [Scilit]
- Zehra, S.; Faseeha, U.; Syed, H.J.; Samad, F.; Ibrahim, A.O.; Abulfaraj, A.W.; Nagmeldin, W. Machine learning-based anomaly detection in NFV: A comprehensive survey. Sensors 2023, 23, 5340. [Google Scholar] [CrossRef] [Scilit] [PubMed]
- Sarker, I.H. Machine learning for intelligent data analysis and automation in cybersecurity: Current and future prospects. Ann. Data Sci. 2022, 10, 1473–1498. [Google Scholar] [CrossRef] [Scilit]
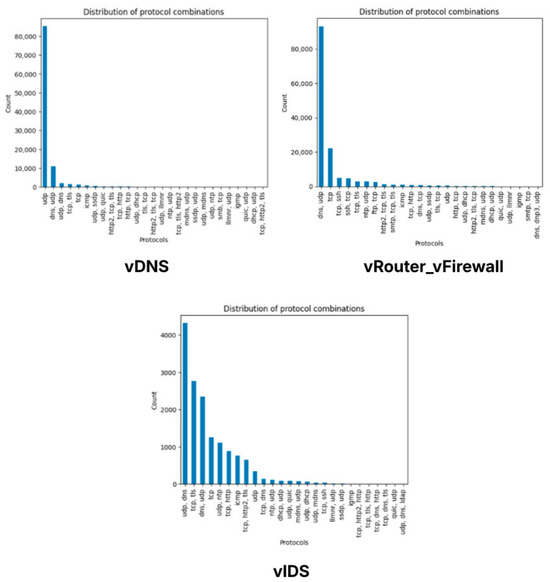
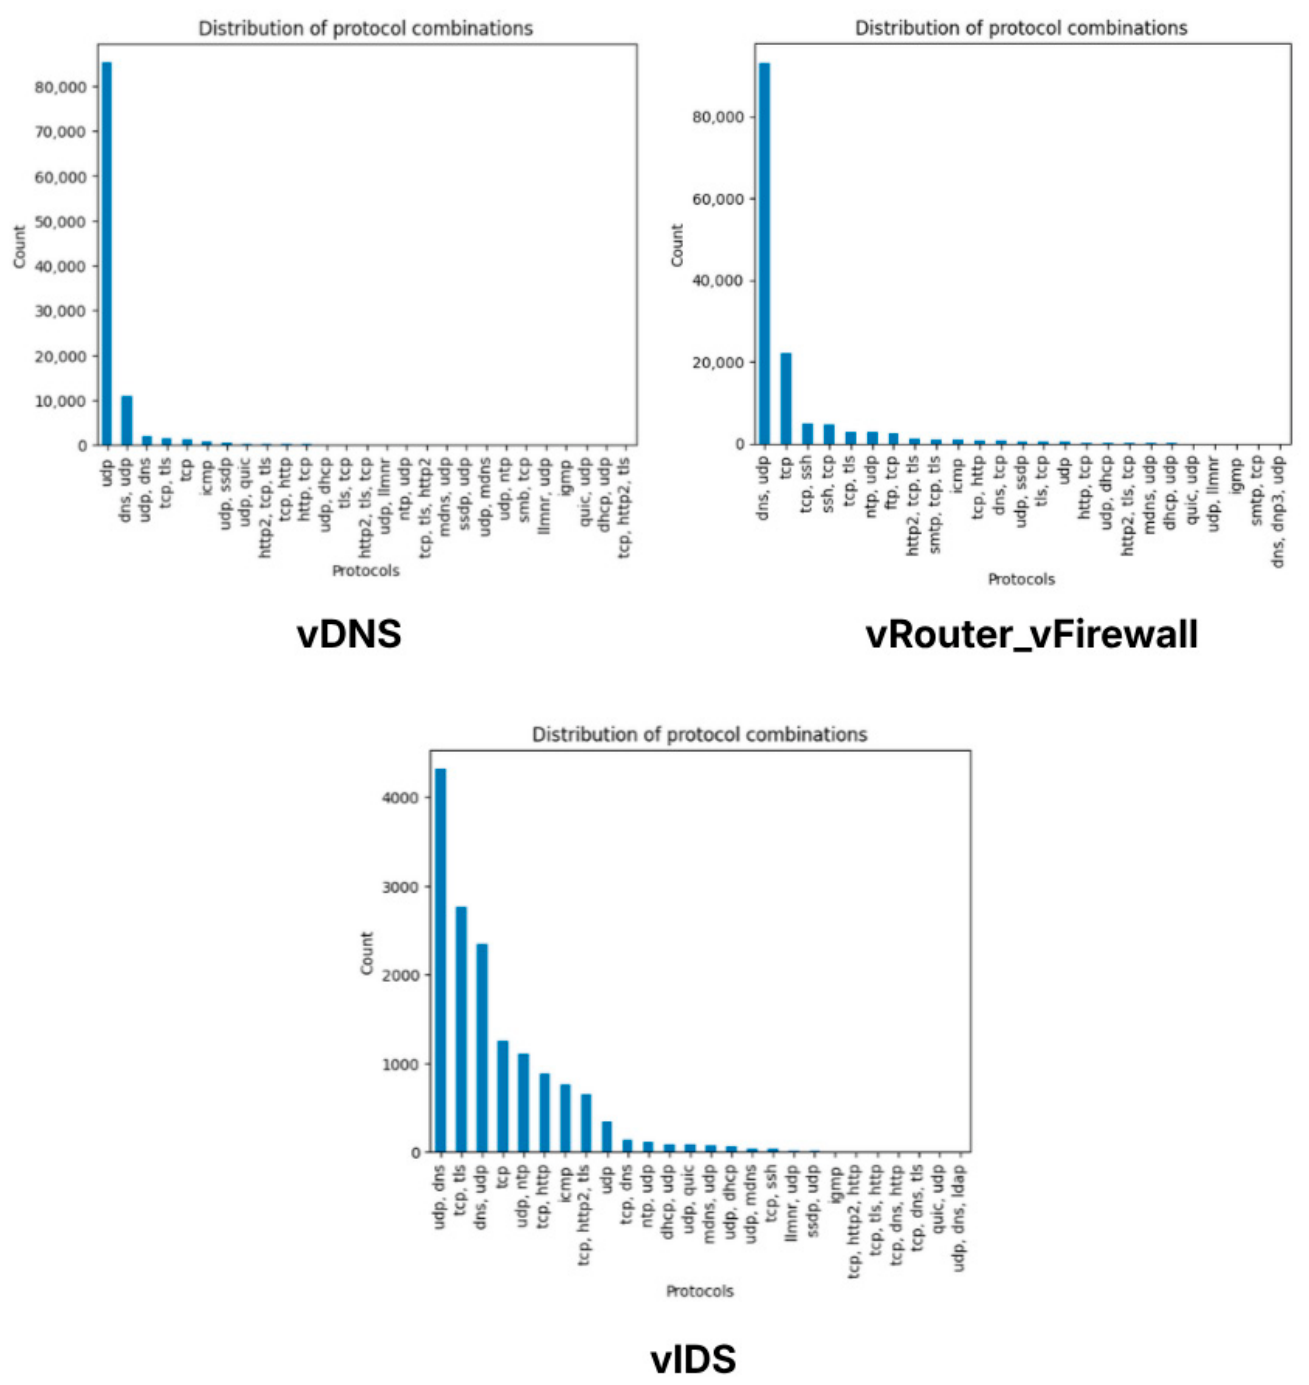
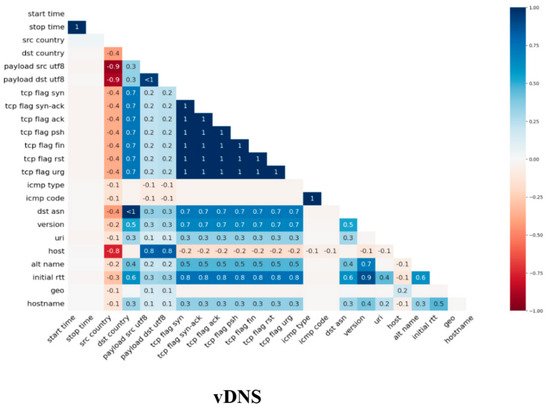
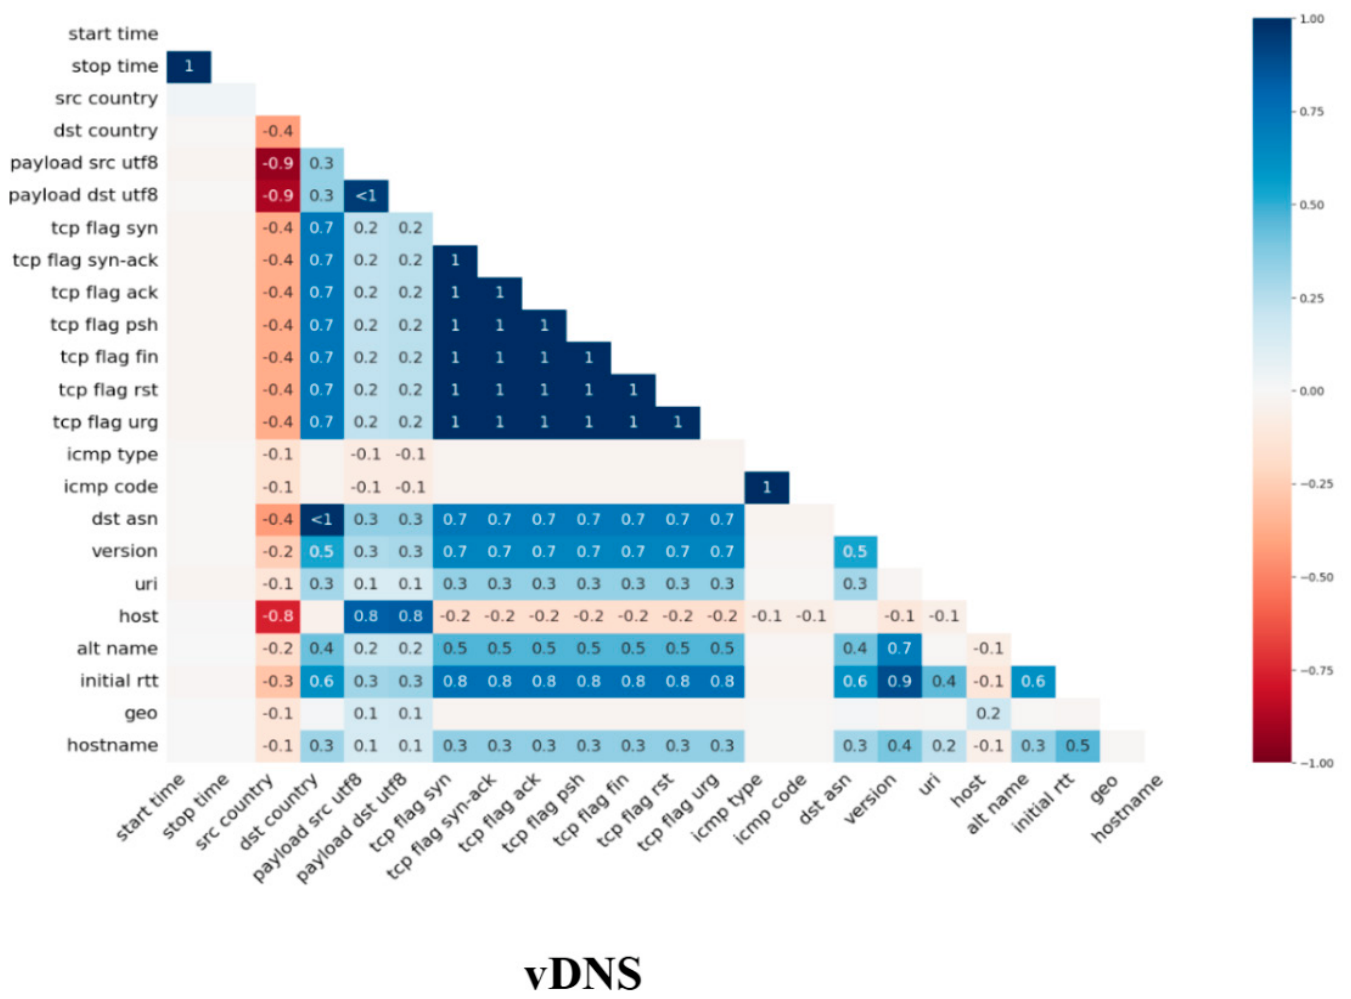
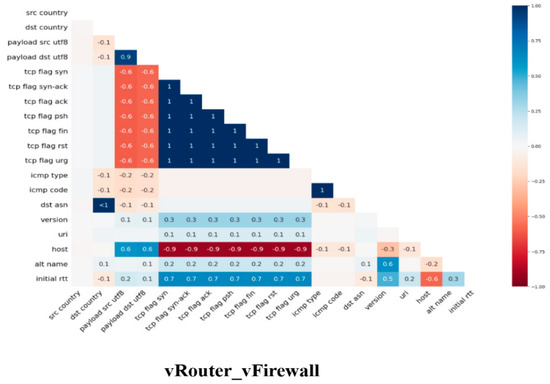
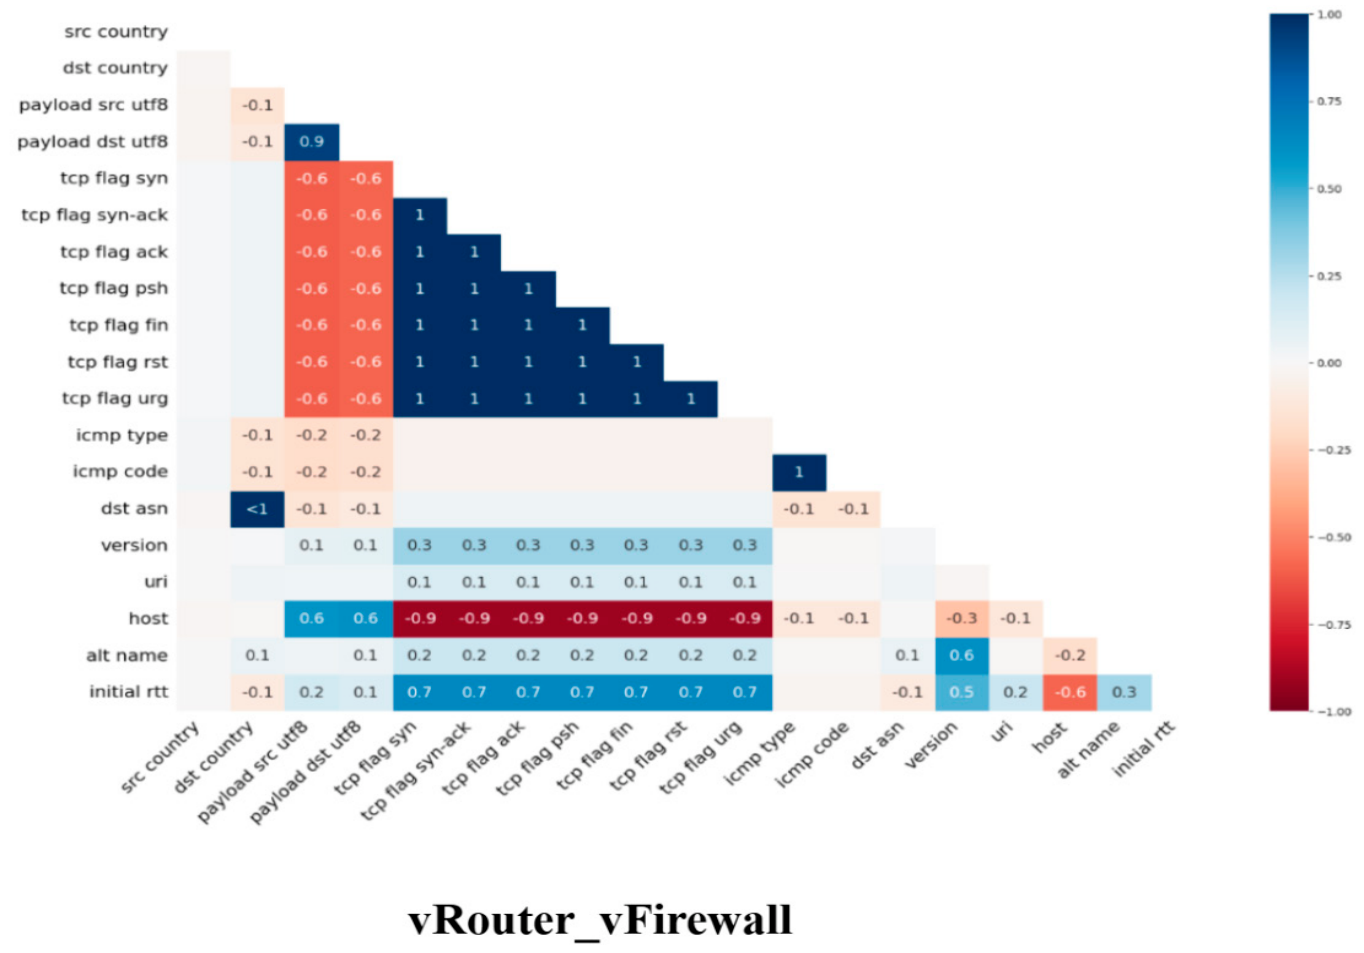
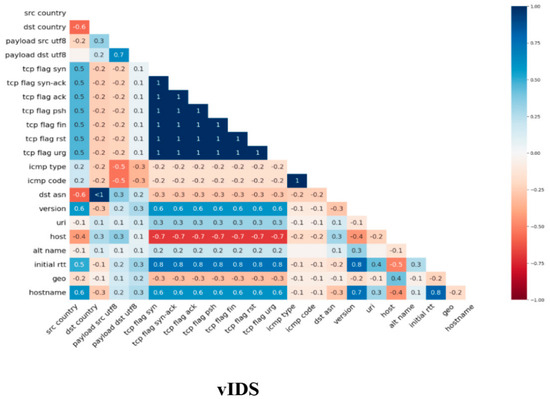
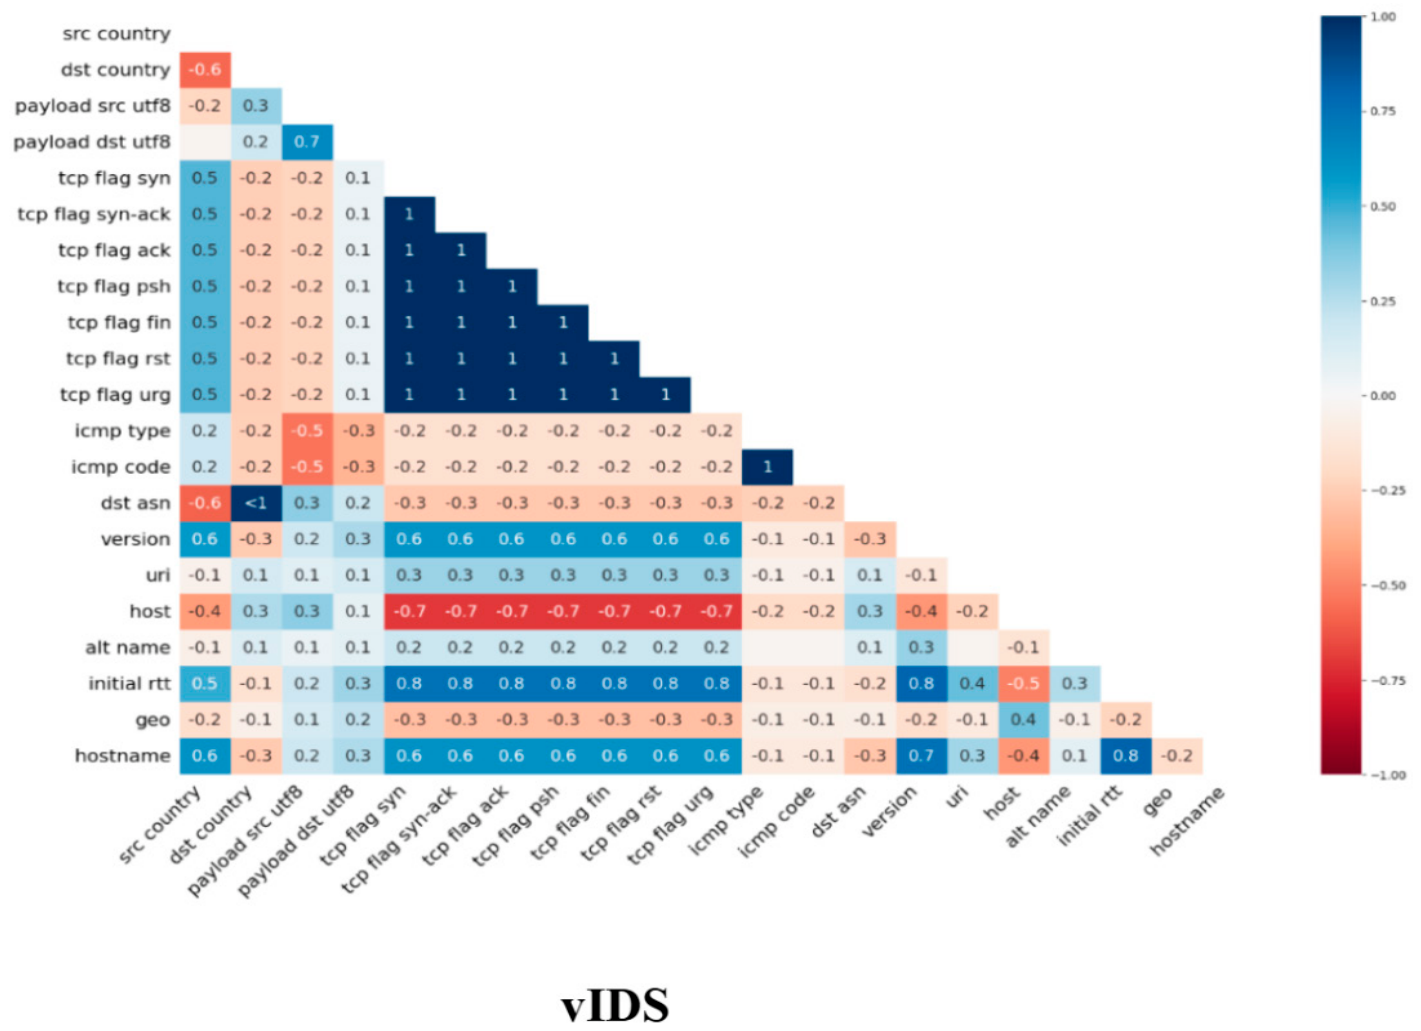
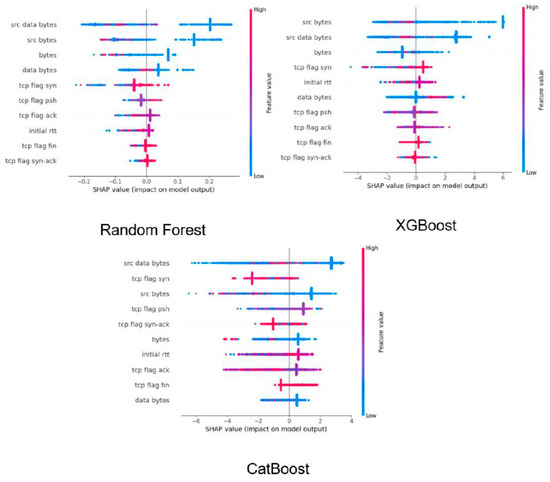
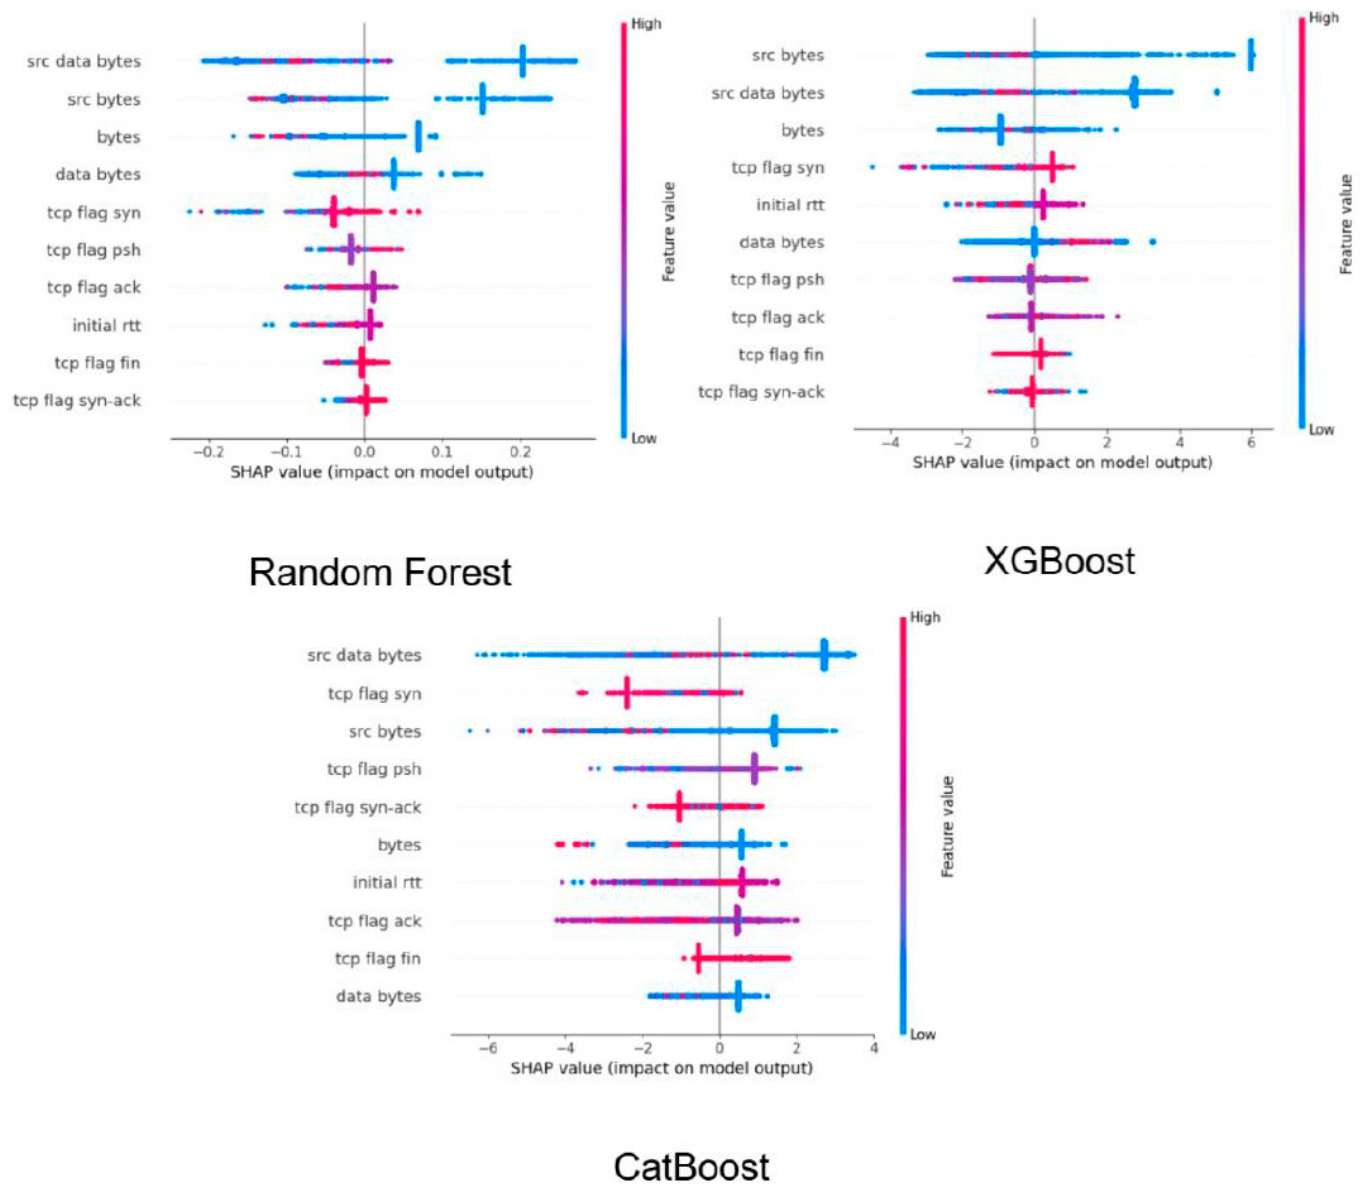
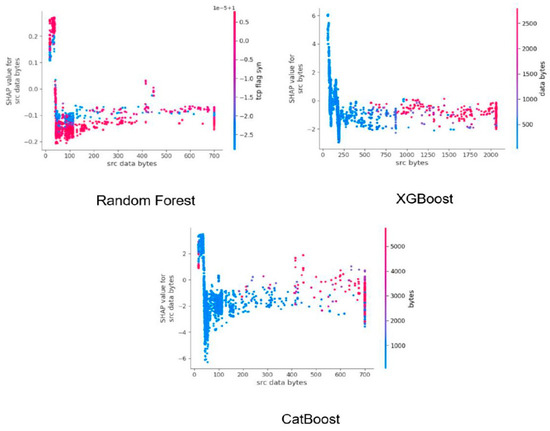
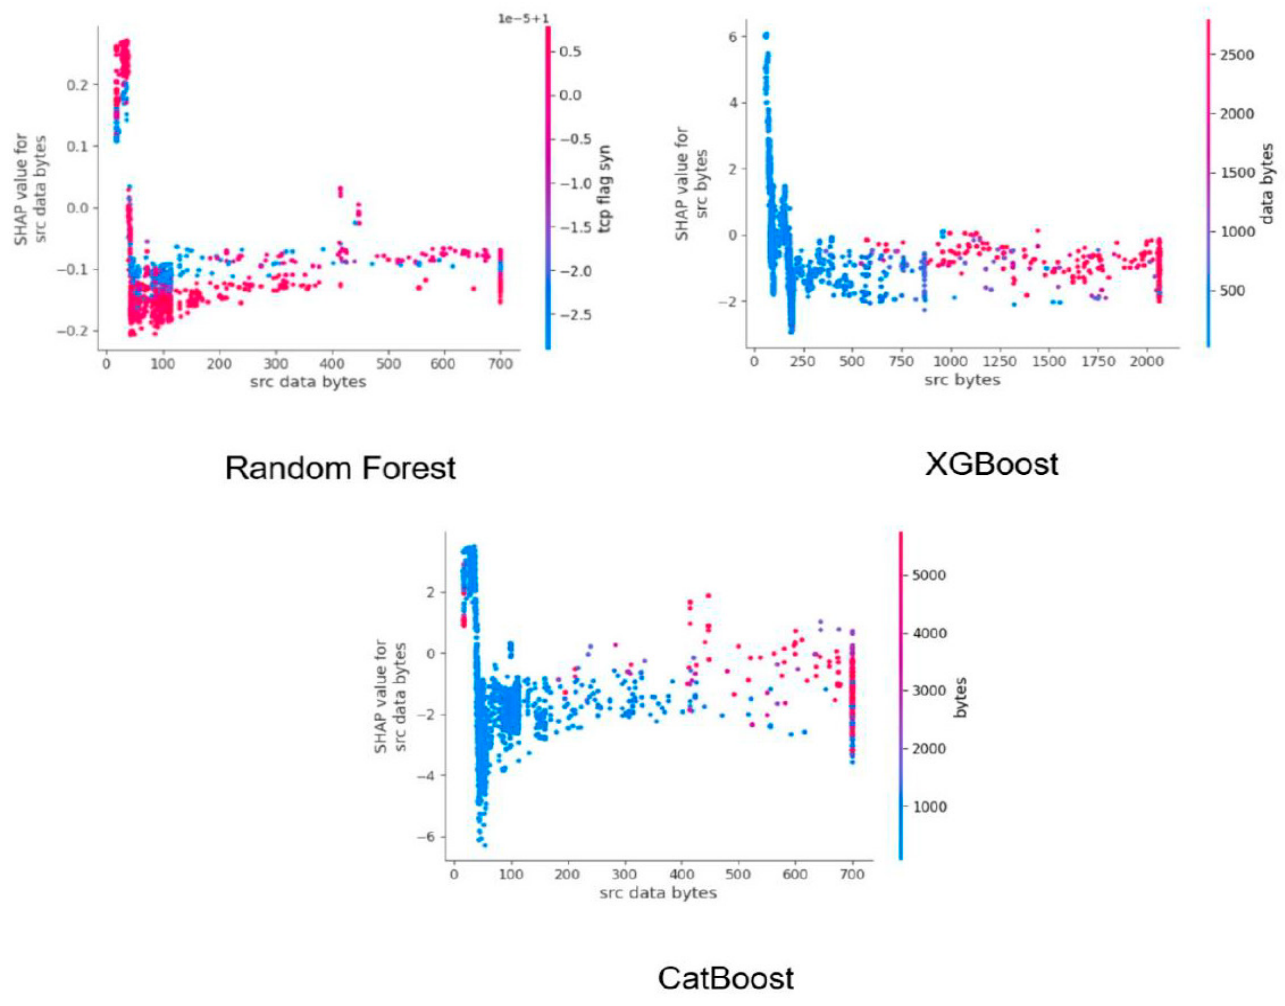
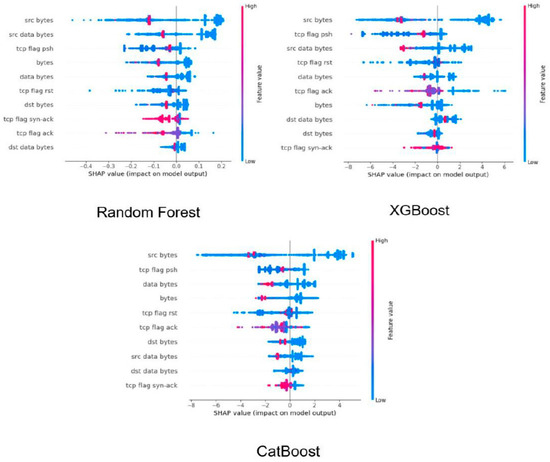
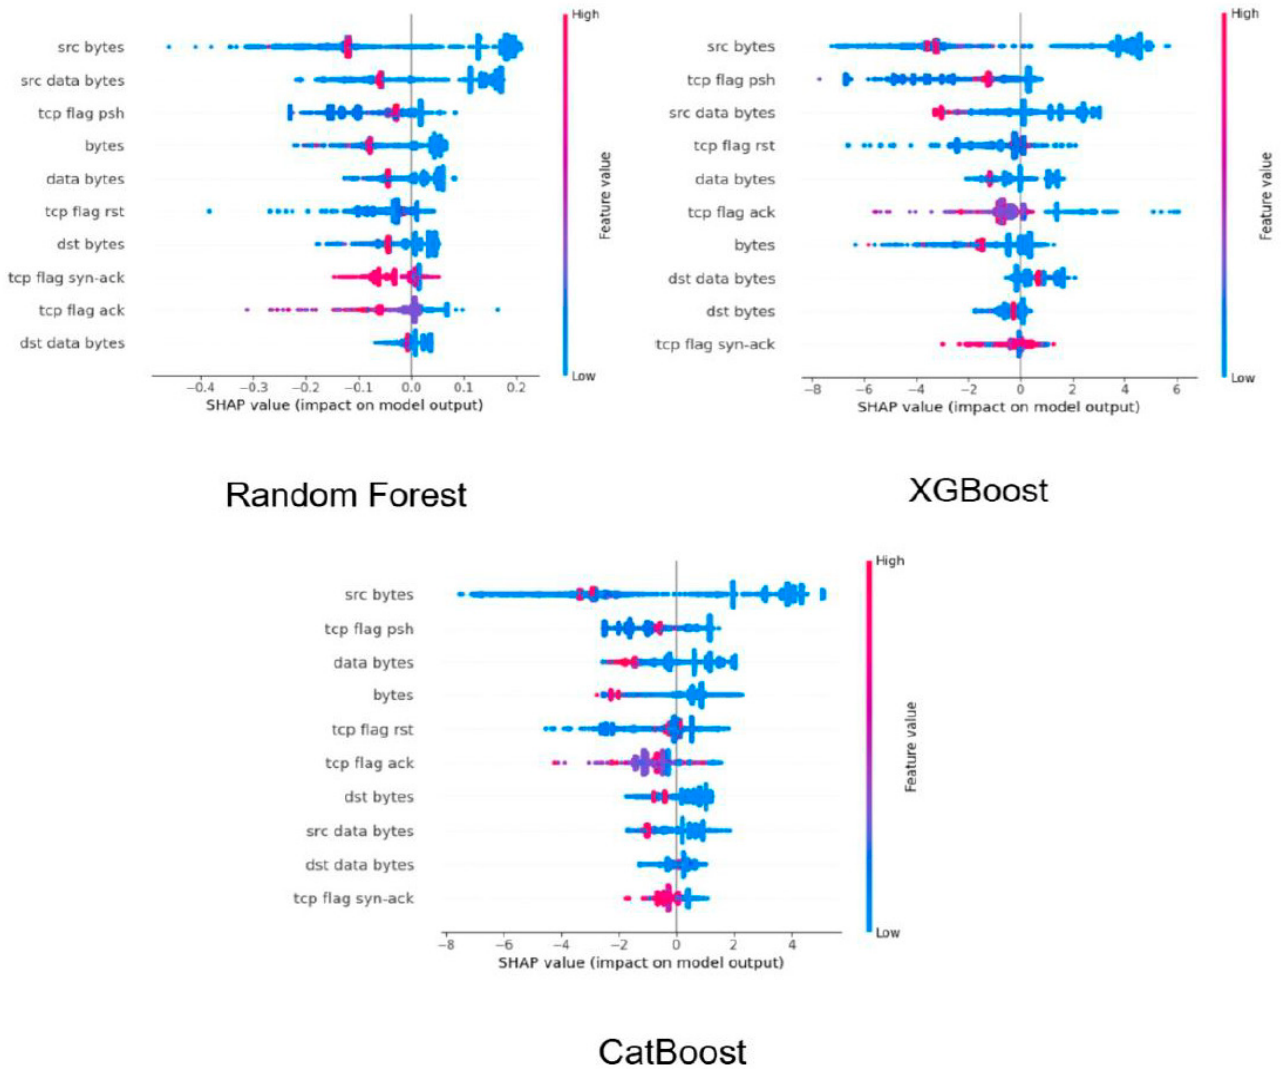
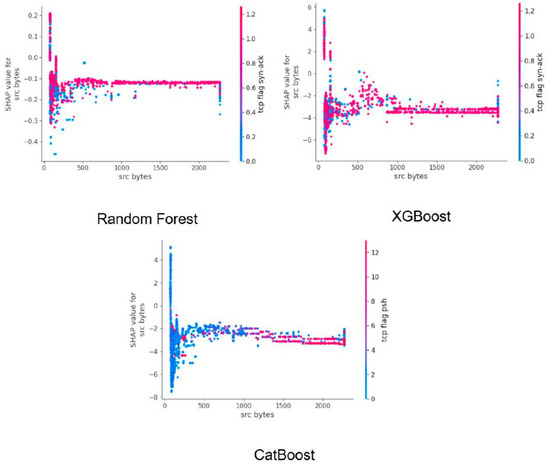
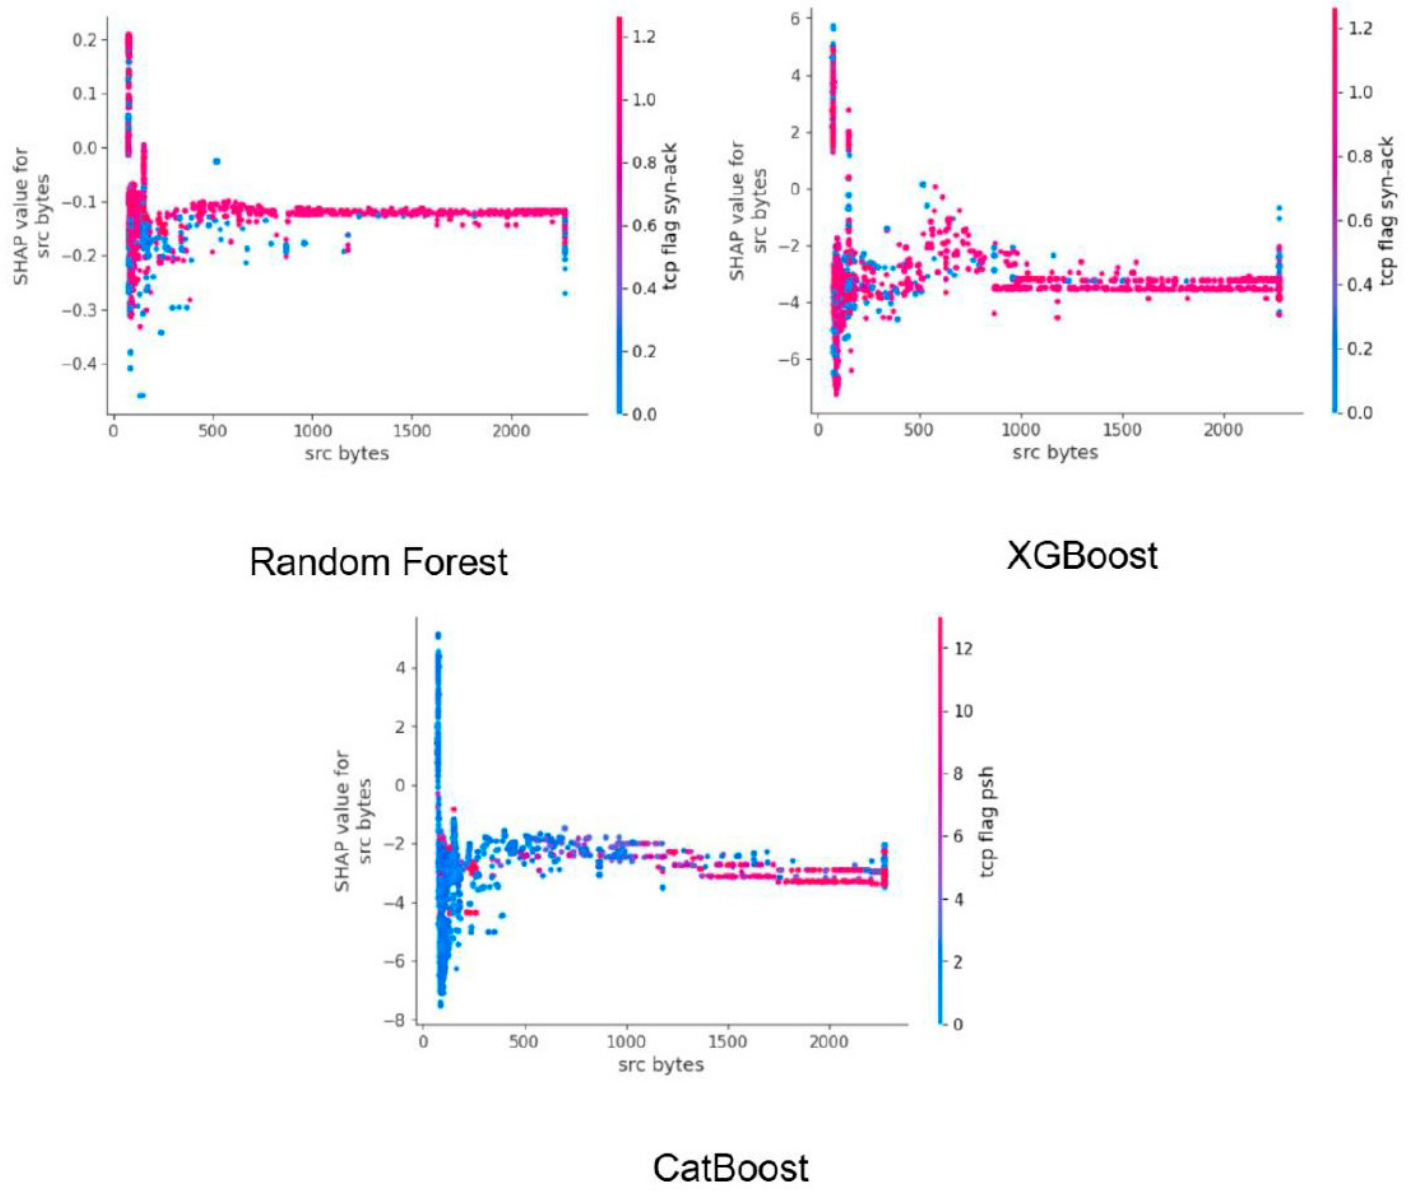
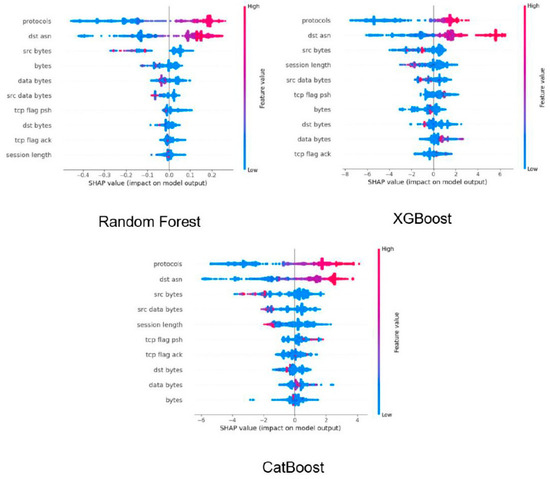
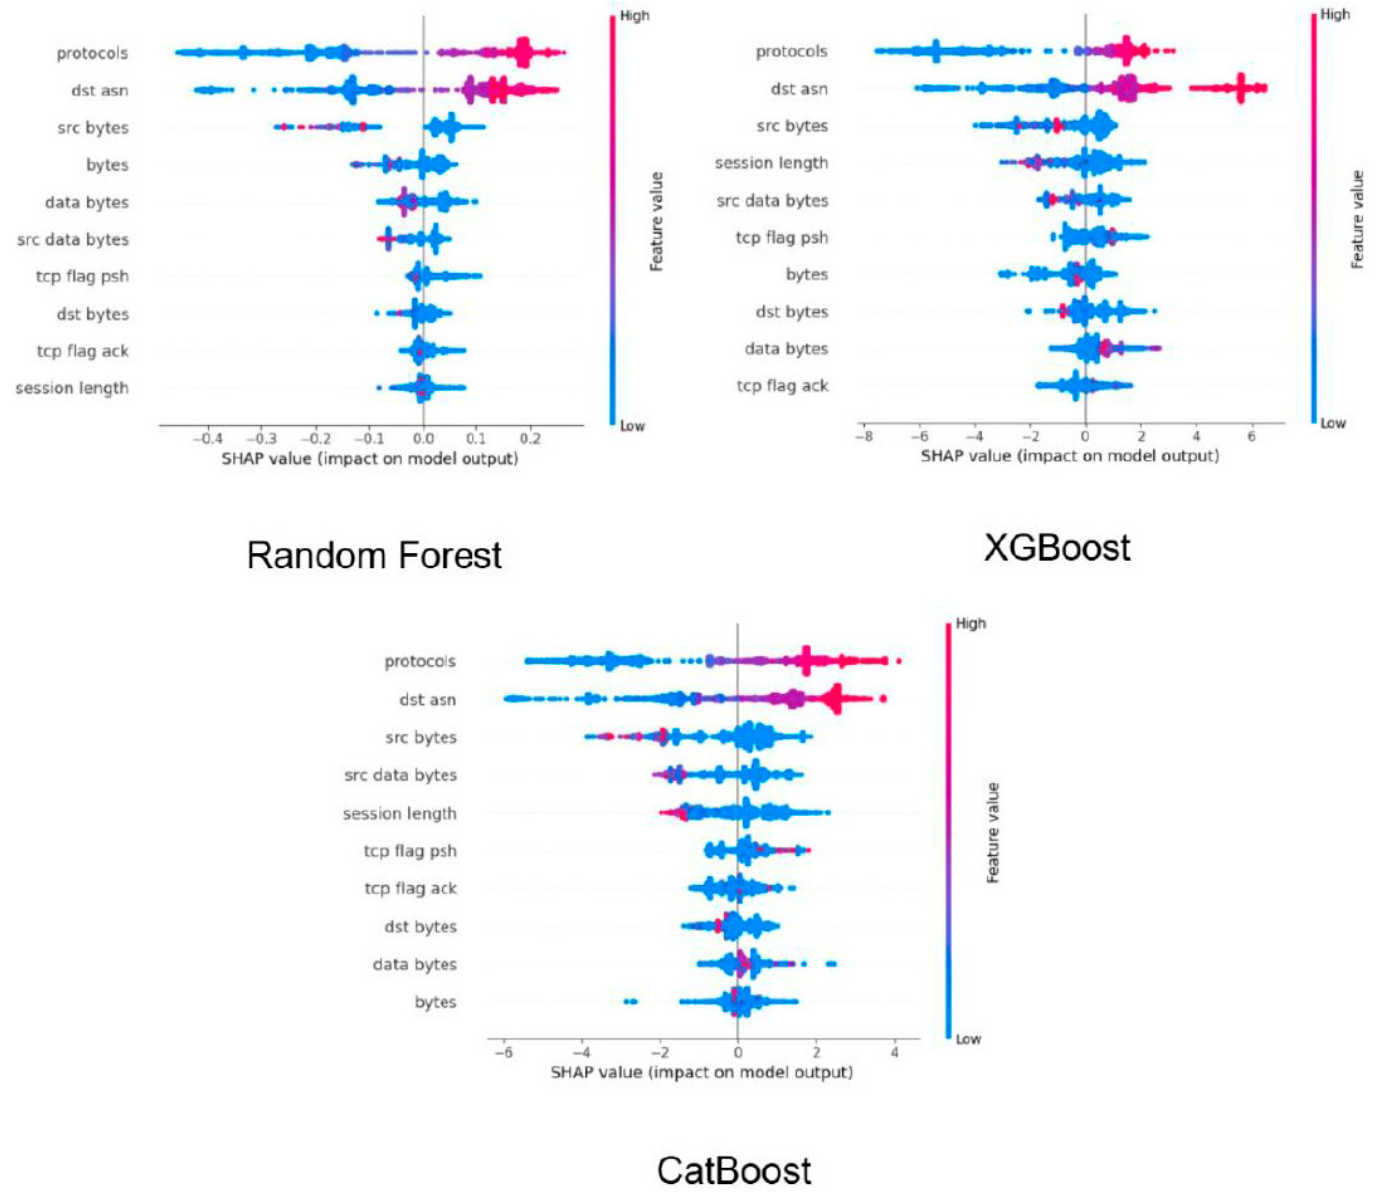
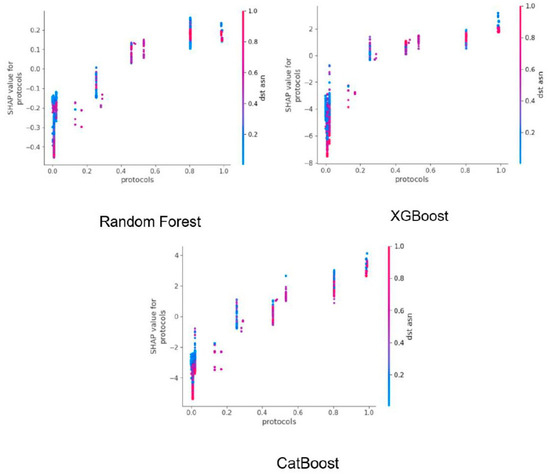
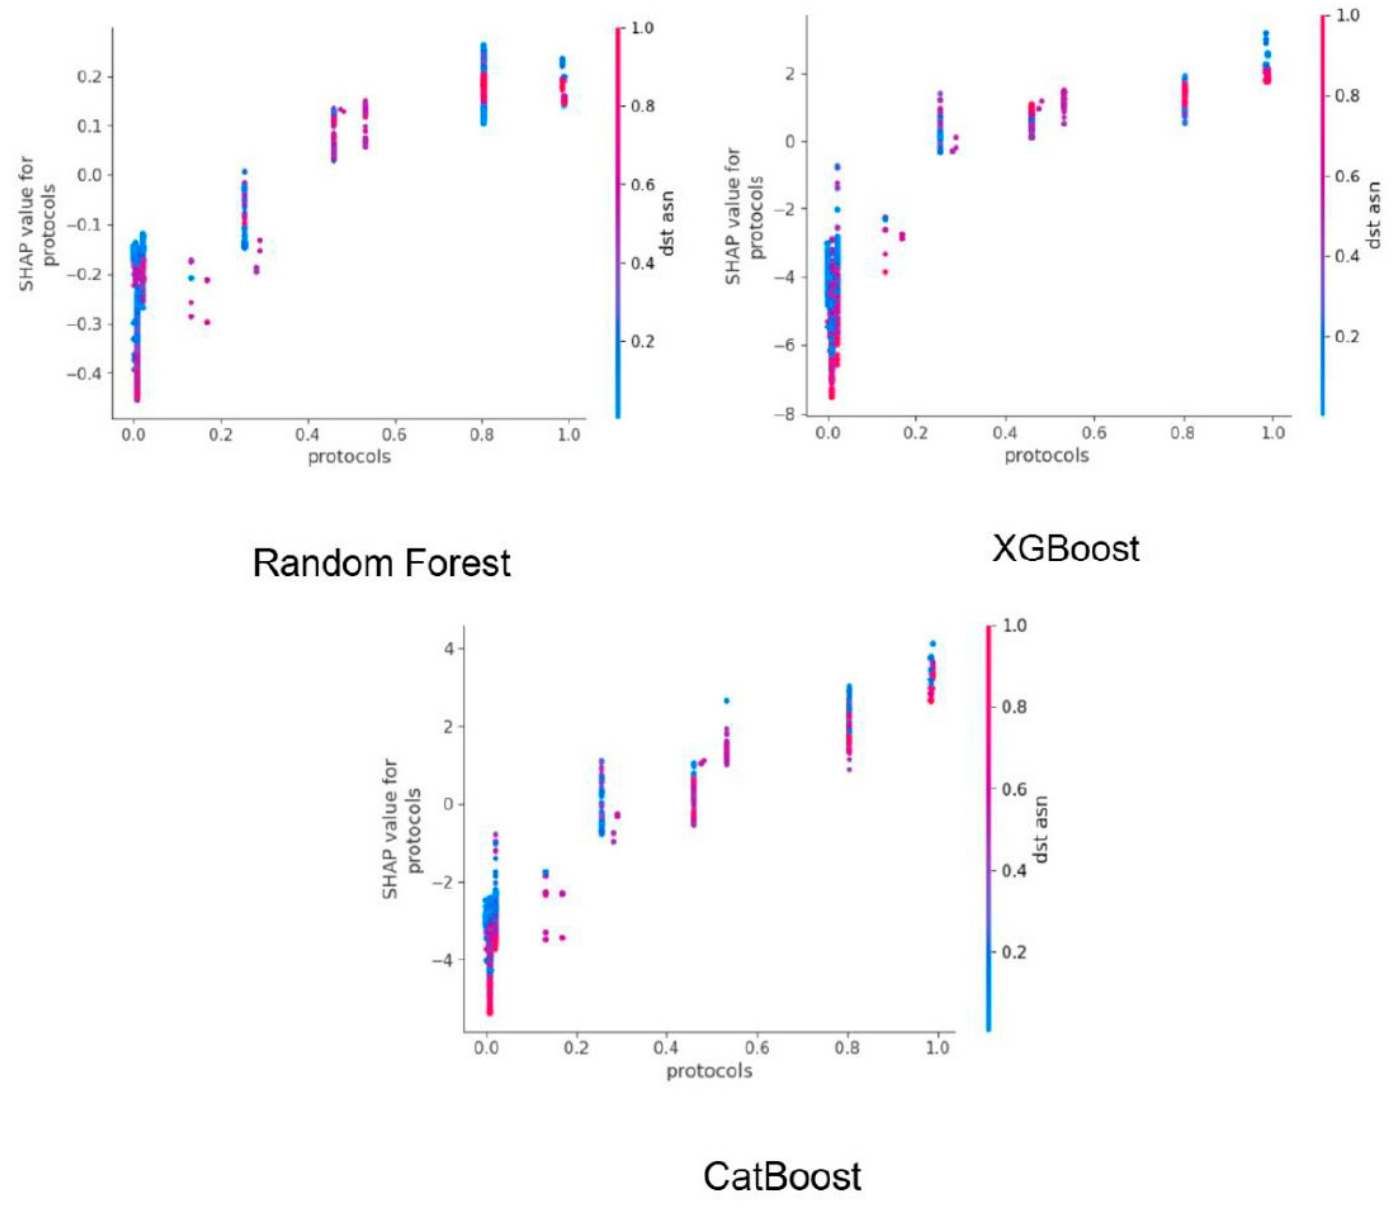

Disclaimer/Publisher’s Note: The statements, opinions and data contained in all publications are solely those of the individual author(s) and contributor(s) and not of MDPI and/or the editor(s). MDPI and/or the editor(s) disclaim responsibility for any injury to people or property resulting from any ideas, methods, instructions or products referred to in the content. |
© 2026 by the authors. Licensee MDPI, Basel, Switzerland. This article is an open access article distributed under the terms and conditions of the Creative Commons Attribution (CC BY) license.