Article

UCMR-Net: Text-Anchored Residual Fusion with Adaptive Residual Weighting for Multimodal Sentiment Intensity Prediction

1
Faculty of Information Technology and Artificial Intelligence, Al-Farabi Kazakh National University, Almaty 050040, Kazakhstan
2
The School of Data Science, Fudan University, Shanghai 200433, China
*
Authors to whom correspondence should be addressed.
Appl. Sci. 2026, 16(14), 7142; https://doi.org/10.3390/app16147142
Submission received: 28 May 2026 / Revised: 7 July 2026 / Accepted: 10 July 2026 / Published: 16 July 2026
(This article belongs to the Section Computing and Artificial Intelligence)

Abstract

Robust multimodal sentiment analysis requires models that can integrate linguistic, acoustic, and visual cues while avoiding over-reliance on noisy nonverbal signals. This study proposes UCMR-Net, a text-anchored residual fusion framework for continuous multimodal sentiment intensity prediction. The model uses contextual textual representations as the primary semantic backbone and introduces acoustic and visual representations as adaptive residual correction signals. Instead of treating the learned positive residual coefficient as a direct estimate of aleatoric or epistemic uncertainty, the proposed framework interprets it as a residual reliability score for regulating nonverbal contribution. Under a unified five-seed evaluation protocol on CMU-MOSI, UCMR-Net achieves MAE = 0.699 ± 0.009, RMSE = 0.997 ± 0.011, Pearson correlation = 0.802 ± 0.006, Acc-2 = 85.82 ± 0.62%, and F1 = 85.60 ± 0.62% (mean ± SD). Controlled ablation results show that text anchoring is the dominant contributor to regression improvement, while residual fusion, adaptive residual weighting, counterfactual distillation, and multi-task supervision provide secondary stabilization effects. Unified missing-modality evaluation further indicates that performance remains relatively stable when audio or visual streams are removed, but degrades substantially when text is unavailable, confirming that the model is text-anchored rather than modality-symmetric. Calibration analysis shows that raw UCMR-Net only modestly improves calibration-related metrics, whereas post-hoc temperature scaling reduces ECE from 0.121 to 0.064 and NLL from 2.337 to 2.286. Additional CMU-MOSEI validation suggests that the proposed fusion strategy generalizes beyond CMU-MOSI, although cross-dataset transfer remains more challenging. Overall, UCMR-Net provides an effective and empirically validated framework for complete-modality sentiment intensity prediction, with moderate robustness under nonverbal missing or corrupted conditions.

1. Introduction

Multimodal sentiment analysis (MSA) aims to infer human affective states by jointly exploiting linguistic, acoustic, and visual cues. Compared with text-only sentiment analysis, MSA is better aligned with real-world human communication, where sentiment is expressed not only through words but also through prosody, facial movements, pauses, gaze, and other nonverbal signals [1]. This makes MSA particularly relevant to opinion video understanding, human–computer interaction, online education, intelligent customer service, affective dialogue systems, and social media analytics.
From a machine learning perspective, MSA is a representative multimodal learning problem because it requires models to handle heterogeneous input spaces, asynchronous temporal structures, modality imbalance, and cross-modal complementarity [2]. Text usually carries explicit semantic information, while audio and visual streams provide paralinguistic and behavioral evidence that may strengthen, weaken, or even contradict the textual signal. Therefore, the central technical issue in MSA is not merely whether multiple modalities are available, but how to integrate them in a way that preserves task-relevant information while suppressing noisy or redundant cross-modal interactions.
Recent surveys show that MSA research has evolved from simple early/late fusion to tensor fusion, hierarchical fusion, attention-based fusion, pretrained-language-model-based fusion, self-supervised multimodal learning, and missing-modality-aware learning [3]. In parallel, affective computing studies have demonstrated that multimodal signals can improve affect recognition, but the gain depends strongly on the quality of feature extraction, temporal alignment, fusion strategy, and the robustness of the model under noisy or incomplete inputs [4]. These observations indicate that high-performing MSA models should not only pursue stronger feature interaction but also provide stable predictions under practical deployment constraints.
A major limitation of many existing MSA methods is the assumption that all modalities are available and reliable during both training and testing. In realistic scenarios, however, one or more modalities may be missing because of speech recognition failure, camera occlusion, low-quality audio, privacy restrictions, sensor malfunction, transmission loss, or platform-side data filtering [5]. Missing-modality learning has therefore become an important research direction, because a model trained only on complete multimodal samples can suffer a substantial performance drop when partial modalities are absent at inference time [6]. Recent tag-assisted and representation-alignment methods further show that explicit missing-pattern modeling and complete-to-incomplete representation alignment can improve robustness under uncertain modality availability [7,8].
Another practical challenge is sample-dependent modality reliability. Multimodal sentiment labels are inherently subjective, and textual, acoustic, and visual streams may provide inconsistent or even contradictory evidence. For example, a speaker may express positive words with a negative tone, or a visually neutral expression may accompany emotionally loaded language. Under such cases, deterministic fusion may over-amplify unreliable nonverbal cues and produce unstable predictions. Therefore, this study treats nonverbal reliability primarily as a modality-contribution regulation problem rather than as a fully probabilistic uncertainty-estimation problem. Acoustic and visual signals are introduced as residual correction cues, and their contribution is controlled by a learned residual reliability score. This design allows nonverbal modalities to refine the text-based sentiment estimate when they provide useful affective evidence, while reducing their influence when they are noisy, missing, or potentially misleading.
To address these issues, this study proposes UCMR-Net, a residual fusion framework for multimodal sentiment intensity prediction that uses text as the primary semantic anchor and incorporates adaptive residual weighting and masked-modality distillation as auxiliary design components. The model follows a text-anchored design: textual representations are treated as the primary semantic backbone, while acoustic and visual modalities are used as residual correction signals. This design is motivated by the observation that sentiment polarity and intensity in opinion videos are often explicitly expressed through language, whereas audio and visual modalities provide complementary but sometimes noisy contextual cues.
Specifically, UCMR-Net integrates four design principles. First, it uses contextual text representations as the semantic anchor for multimodal prediction. Second, it encodes acoustic and visual temporal streams as nonverbal residual evidence. Third, it performs text-anchored residual fusion to refine the text-based sentiment estimate without uniformly amplifying all nonverbal information. Fourth, it uses adaptive residual weighting, counterfactual masked-modality distillation, and auxiliary polarity/intensity supervision to stabilize prediction behavior.
The main contributions of UCMR-Net and the corresponding empirical evaluation framework are summarized as follows. First, we develop UCMR-Net as an integrative and application-oriented text-anchored residual fusion framework that treats language as the primary semantic backbone and models acoustic and visual streams as adaptive residual modifiers for continuous sentiment intensity estimation. Second, we formulate the learned residual coefficient as a residual reliability score for modality-contribution regulation and evaluate its empirical value through calibration analysis, residual reliability–error correlation, and modality corruption tests. Third, we provide a controlled experimental protocol including five random seeds, unified baseline evaluation, statistical significance testing, and ablations that separately isolate text anchoring, residual fusion, adaptive residual weighting, counterfactual distillation, and multi-task supervision. Fourth, we evaluate incomplete-input behavior under a unified missing-modality protocol and random missing-rate protocol, and further assess generalization using CMU-MOSEI external validation. These analyses position UCMR-Net as a text-dominant residual fusion model with strong complete-modality performance and moderate robustness when nonverbal modalities are missing or corrupted. The methodological contribution is therefore primarily integrative and application-oriented: UCMR-Net combines text anchoring, residual fusion, adaptive residual contribution regulation, masked-modality distillation, and auxiliary supervision within a unified framework, rather than claiming a fundamentally new fusion primitive.
The rest of this paper is organized as follows. Section 2 reviews related studies on multimodal sentiment fusion, missing-modality robust learning, and adaptive modality-contribution learning. Section 3 introduces the proposed UCMR-Net framework, including the problem definition, model architecture, module design, and training objective. Section 4 reports the experimental setup and results. Section 5 discusses the empirical findings, limitations, and future research directions.

2. Related Work

2.1. Multimodal Representation and Fusion for Sentiment Analysis

Early MSA studies mainly focused on learning effective interactions among text, audio, and visual streams. The Memory Fusion Network (MFN) explicitly modeled view-specific and cross-view interactions through a recurrent memory mechanism, showing that multimodal temporal dependencies could be captured more effectively than by simple concatenation [9]. The Recurrent Multistage Fusion Network (RMFN) further decomposed multimodal fusion into multiple recurrent stages, allowing each stage to focus on different subsets of cross-modal interactions [10]. These studies established that multimodal fusion should be treated as a dynamic process rather than a single static combination step.
Subsequent research emphasized fine-grained nonverbal influence on language representations. RAVEN dynamically shifted word representations according to acoustic and visual behaviors, indicating that nonverbal signals can change the contextual meaning of words during sentiment inference [11]. Factorized multimodal representation learning decomposed multimodal representations into discriminative shared factors and modality-specific generative factors, thereby improving robustness to noisy or incomplete modalities [12]. These methods are closely related to the motivation of the present study because they suggest that not all modality information should be fused uniformly; instead, fusion should distinguish dominant semantic evidence from complementary or modality-specific information.
More recent work has explored contrastive and representation-alignment strategies. Hybrid contrastive learning was introduced to learn cross-modal representations by jointly exploiting intra-modal and inter-modal consistency for MSA [13]. Modality-invariant representation learning further investigates how to reduce modality gaps and obtain robust affective representations under heterogeneous inputs [14]. These studies improve representation compactness and cross-modal consistency, but they do not fully solve the practical problem of how to maintain stable prediction when specific modalities are missing or unreliable during deployment.
Recent multimodal affective learning has further moved toward adaptive fusion, cross-domain transfer, task-aware supervision, and modern sequence modeling. Knowledge-guided dynamic fusion has been used to adjust modality contributions according to sample-dependent dominant cues [15], while adaptively balanced domain adaptation has been explored to address modality-specific distribution shifts in multimodal emotion recognition [16]. Recent language-focused disentanglement methods further reduce cross-modal redundancy while preserving complementary information around a strong linguistic representation [17], and state-space models have been introduced to capture long-range intra-modal dynamics and cross-modal interactions [18]. Multi-loss fusion studies also show that encoder selection, fusion design, contextual information, and auxiliary objectives can materially affect multimodal sentiment performance [19]. Together, these studies indicate that robust multimodal affective learning increasingly depends on dynamic modality contribution, cross-domain generalization, modern temporal modeling, and task-aware supervision. In parallel, recent missing-modality and distillation-based MSA methods such as LNLN, MissModal, TFR-Net, UMDF, and CorrKD emphasize that modality absence should not be treated merely as feature removal, because the missing stream may contain decisive or contradictory affective evidence. UCMR-Net is positioned within this broader line of work by adopting a conservative text-anchored strategy: it does not assume symmetric reliability across modalities, but instead uses nonverbal streams as adaptive residual evidence around a strong linguistic backbone.
Different from conventional interaction-heavy fusion models, UCMR-Net adopts a text-anchored residual fusion strategy. Rather than treating all modalities as equally reliable, it uses the textual stream as the main sentiment backbone and introduces acoustic and visual streams as residual correction signals. This design reduces the risk of over-fusion and provides a more interpretable mechanism for continuous sentiment intensity estimation.

2.2. Missing-Modality Robust Multimodal Sentiment Analysis

Missing-modality learning has become increasingly important in MSA because real-world multimodal systems rarely guarantee the complete availability of all data streams. The Missing Modality Imagination Network (MMIN) addressed this issue by learning to imagine missing modality representations from available modalities, enabling a unified model to handle different missing patterns [20]. This reconstruction-oriented line of work is valuable because it directly targets incomplete inputs, but it may introduce representation gaps when generated features are not sufficiently aligned with true modality distributions.
Inconsistency-aware missing-modality learning further showed that modality absence can change the overall sentiment semantics rather than merely remove partial input information [21]. This line of work introduced the notion of key missing modalities and emphasized that missing-modality MSA should consider whether the absent stream contains decisive sentiment evidence. The Tag-Assisted Transformer Encoder (TATE) further used tag encoding to represent both single- and multiple-modality missing cases and employed transformer-based reconstruction to handle incomplete modalities [22]. These studies demonstrate that explicitly indicating missing patterns can improve model awareness of modality availability. However, tag-based reconstruction still depends on the quality of latent feature recovery and may be sensitive to distribution shifts.
The Language-dominated Noise-resistant Learning Network (LNLN) treated language as the dominant sentiment-bearing modality and improved robustness under incomplete data by correcting the dominant modality representation and then integrating auxiliary acoustic and visual information [23]. Modality Translation-based MSA (MTMSA) translated visual and acoustic modalities into the textual modality, further emphasizing the advantage of language as a dominant sentiment carrier under uncertain missing-modality conditions [24]. Multimodal Prompt Learning with Missing Modalities (MPLMM) introduced generative prompts, missing-signal prompts, and missing-type prompts to compensate for unavailable modalities in a parameter-efficient way [25]. Similar modality-completion-based MSA further attempted to complete missing modality information by exploiting similar samples and modality-level relationships [26].
These studies provide important evidence that missing-modality MSA requires both modality availability awareness and semantic consistency across complete and incomplete conditions. UCMR-Net follows this direction but takes a more conservative and application-oriented route. Instead of relying solely on explicit feature generation, it combines modality masking, text-anchored residual correction, and counterfactual distillation. In this way, the model is encouraged to maintain prediction consistency between complete-modality and missing-modality conditions while avoiding excessive dependence on generated nonverbal features.

2.3. Adaptive Modality Contribution and Auxiliary-Supervised Prediction

Adaptive modality-contribution learning is relevant to MSA because multimodal signals are often ambiguous, noisy, and inconsistent. Prior uncertainty and ensemble learning studies show that predictive confidence can be useful under noisy conditions [27,28], but a positive gating value should not be treated as a formal uncertainty estimate unless it is empirically validated. In UCMR-Net, the learned residual score is therefore interpreted conservatively as a sample-dependent controller for nonverbal residual contribution.
Another related direction is evidential learning, which aims to quantify uncertainty by learning evidence distributions rather than only point predictions [29]. Although such approaches are useful for understanding confidence and ambiguity, UCMR-Net does not claim to perform full probabilistic uncertainty estimation. Instead, calibration metrics, reliability-error analysis, and modality corruption tests are used to evaluate whether the learned residual score has empirical value for regulating acoustic and visual contributions.
Auxiliary supervision is also important for continuous sentiment prediction. Recent multi-layer feature fusion and multi-task learning studies have shown that combining fusion design with auxiliary task constraints can improve multimodal sentiment representation learning [30]. Regression alone may optimize the average error but fail to sufficiently separate polarity boundaries or ordered sentiment levels. Therefore, UCMR-Net combines continuous regression with binary polarity prediction and ordinal sentiment-intensity supervision. This multi-task design encourages the shared representation to preserve both fine-grained intensity information and polarity-level discriminability. In the five-seed experimental protocol used in this study, the contribution of auxiliary supervision is evaluated through controlled ablations that isolate the effects of the binary polarity and ordinal sentiment-intensity heads.
Overall, the related literature suggests three unresolved issues. First, many strong fusion models assume complete modalities and may be vulnerable to missing inputs. Second, missing-modality methods often focus on reconstruction or representation alignment but may overlook the dominance of textual semantics in opinion-level sentiment prediction. Third, learned modality weights require empirical validation before being described as uncertainty estimates. UCMR-Net addresses these issues through text-anchored residual fusion, counterfactual masked-modality distillation, adaptive residual weighting, and unified experimental evaluation.

3. Methodology

3.1. Overall Research Workflow

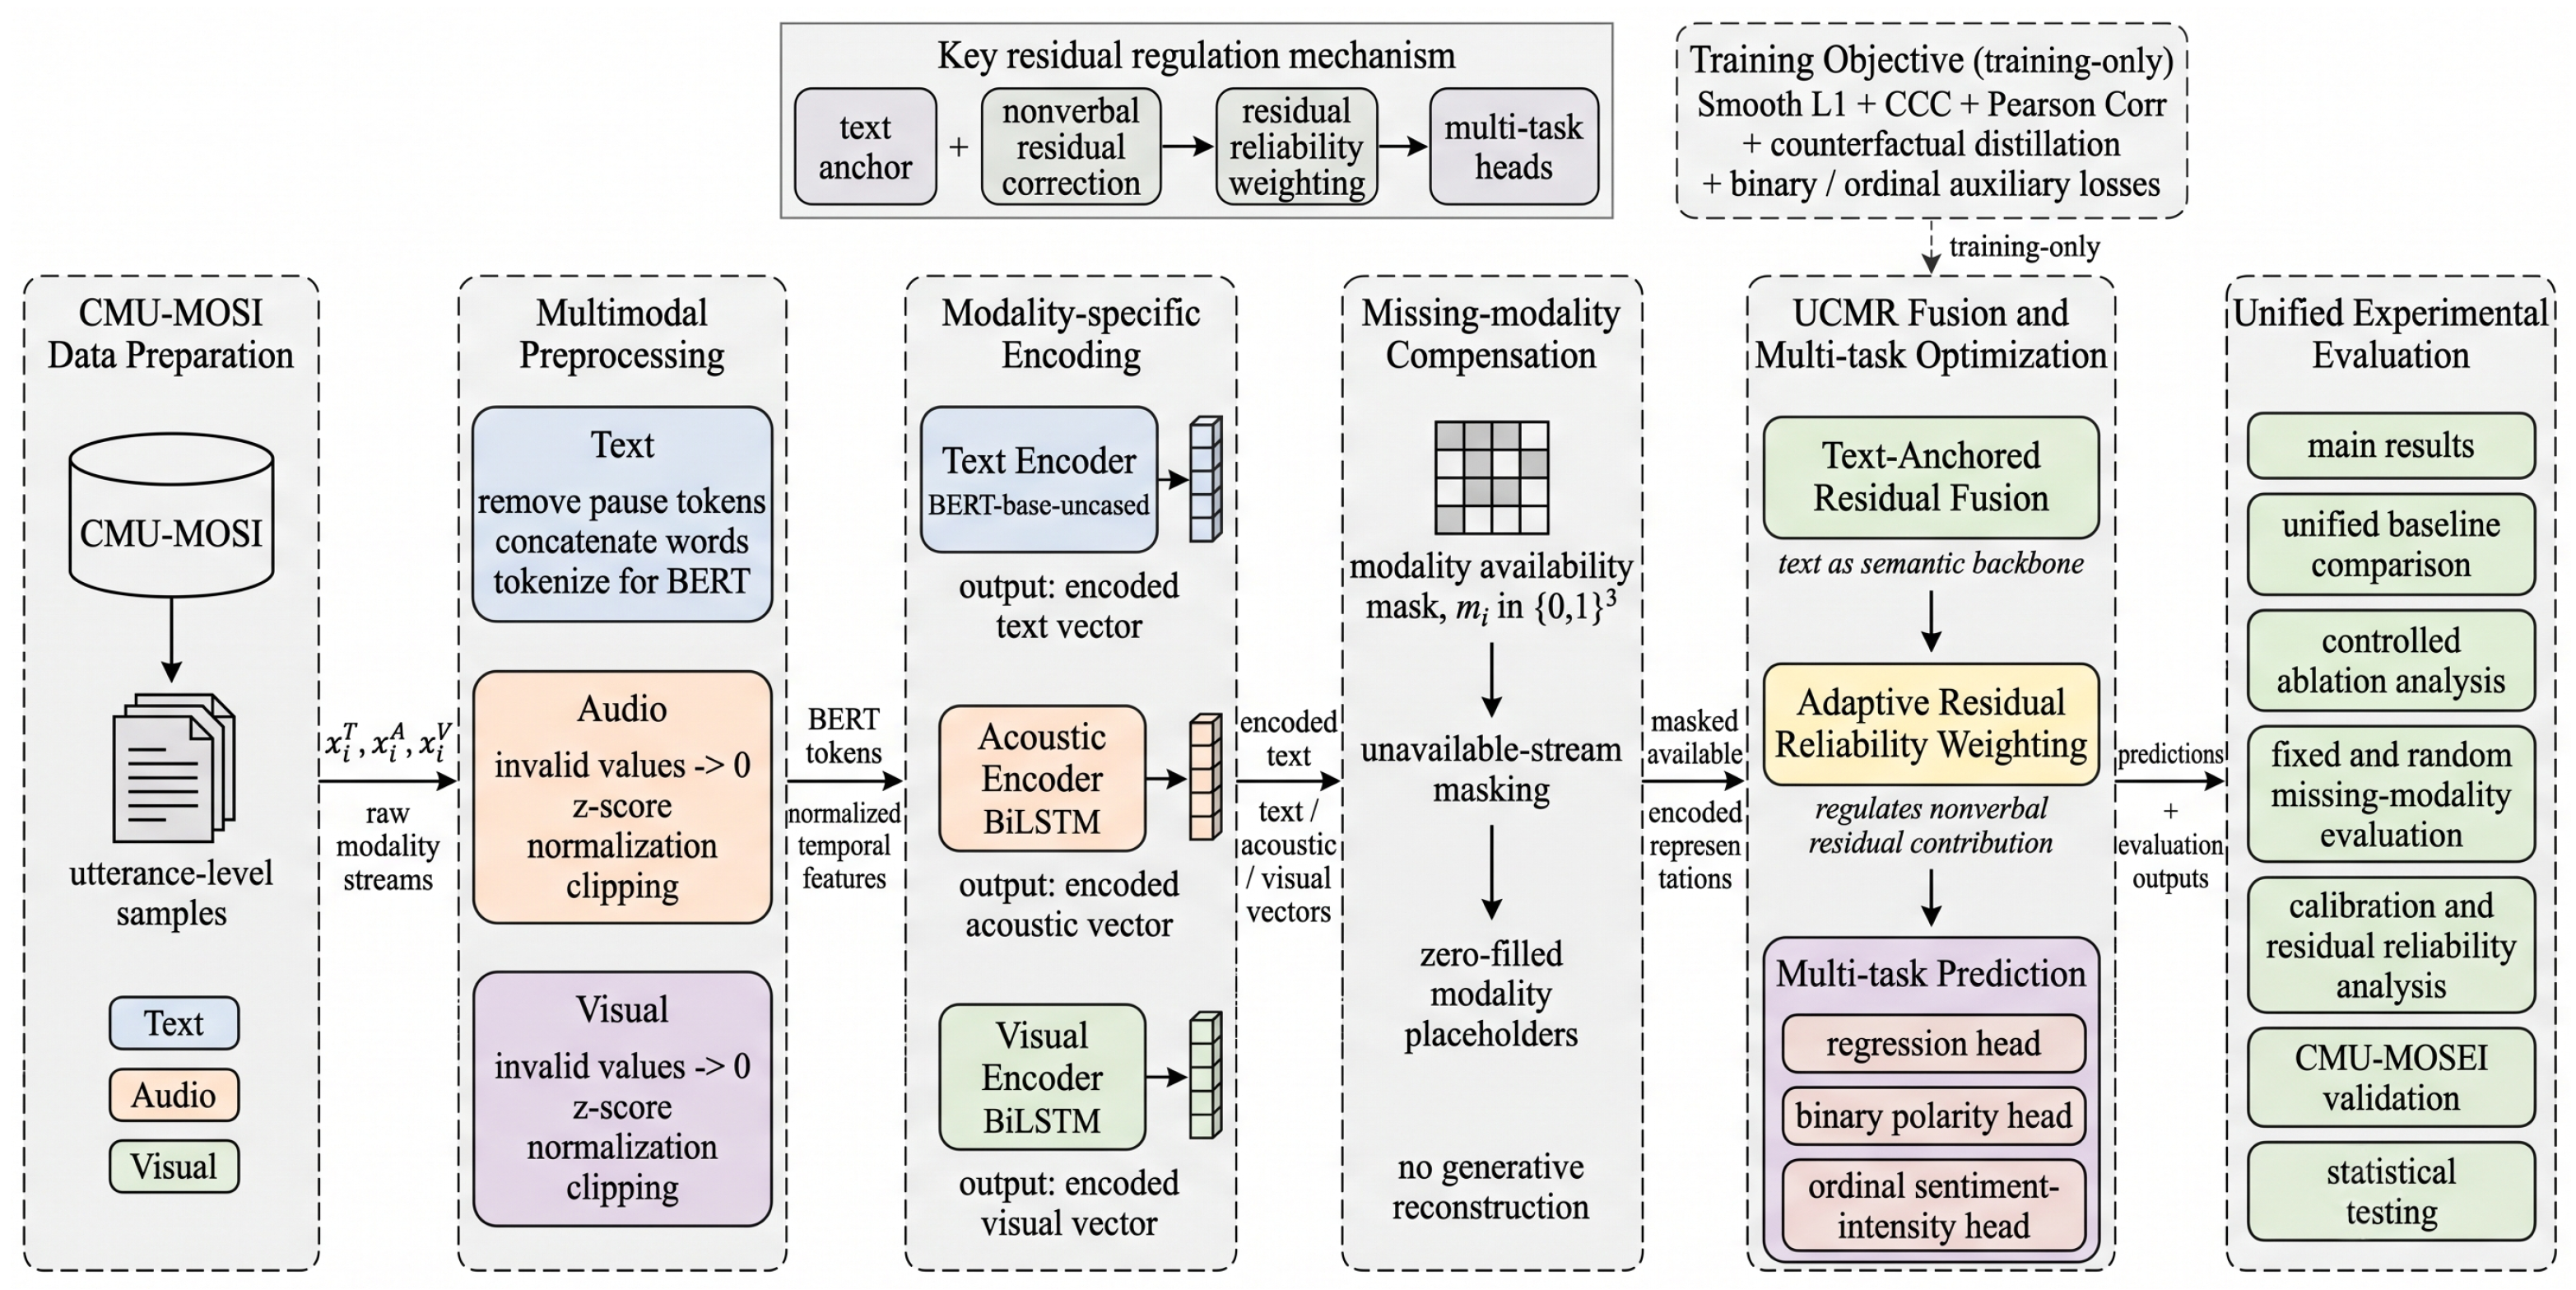
This study develops an application-oriented multimodal sentiment prediction framework for text-anchored sentiment intensity estimation. The overall workflow consists of six stages: dataset preparation, multimodal preprocessing, modality-specific encoding, adaptive text-anchored residual fusion, multi-task optimization, and unified experimental evaluation. To avoid inconsistent evaluation across complete and incomplete inputs, all complete-modality, missing-modality, ablation, calibration, and baseline experiments are conducted under the same data split, preprocessing pipeline, feature normalization parameters, checkpoint selection rule, and metric script. For stochastic reliability, the main model, all rerun baselines, and controlled ablation configurations are evaluated using five random seeds. Repeated-run results are reported as mean ± standard deviation unless otherwise specified. Figure 1 illustrates the overall workflow from data preparation to unified result analysis.

3.2. Problem Definition

Given a multimodal utterance-level sample i, the input consists of three modality streams: textual input x i T , acoustic input x i A , and visual input x i V . The target variable is the continuous sentiment intensity score y i ∈ [ − 3 , 3 ] , where negative values indicate negative sentiment, positive values indicate positive sentiment, and values around zero indicate neutral sentiment. The primary task is regression-based sentiment intensity prediction, while binary polarity prediction and ordinal sentiment-level prediction are introduced as auxiliary tasks.
The general prediction function is defined as:
y ^ i = f θ x i T , x i A , x i V , m i
where m i ∈ { 0 , 1 } 3 denotes the modality availability mask, and θ represents all trainable parameters. The binary polarity label is defined as:
c i = I y i > 0
For ordinal auxiliary learning, the continuous sentiment score is discretized into ordered sentiment-intensity classes:
o i = g o r d y i , o i ∈ { 1 , 2 , 3 , 4 , 5 }
The model is optimized to minimize regression error, preserve rank-consistent sentiment intensity, and improve polarity-level discriminability.

3.3. Proposed Model: UCMR-Net

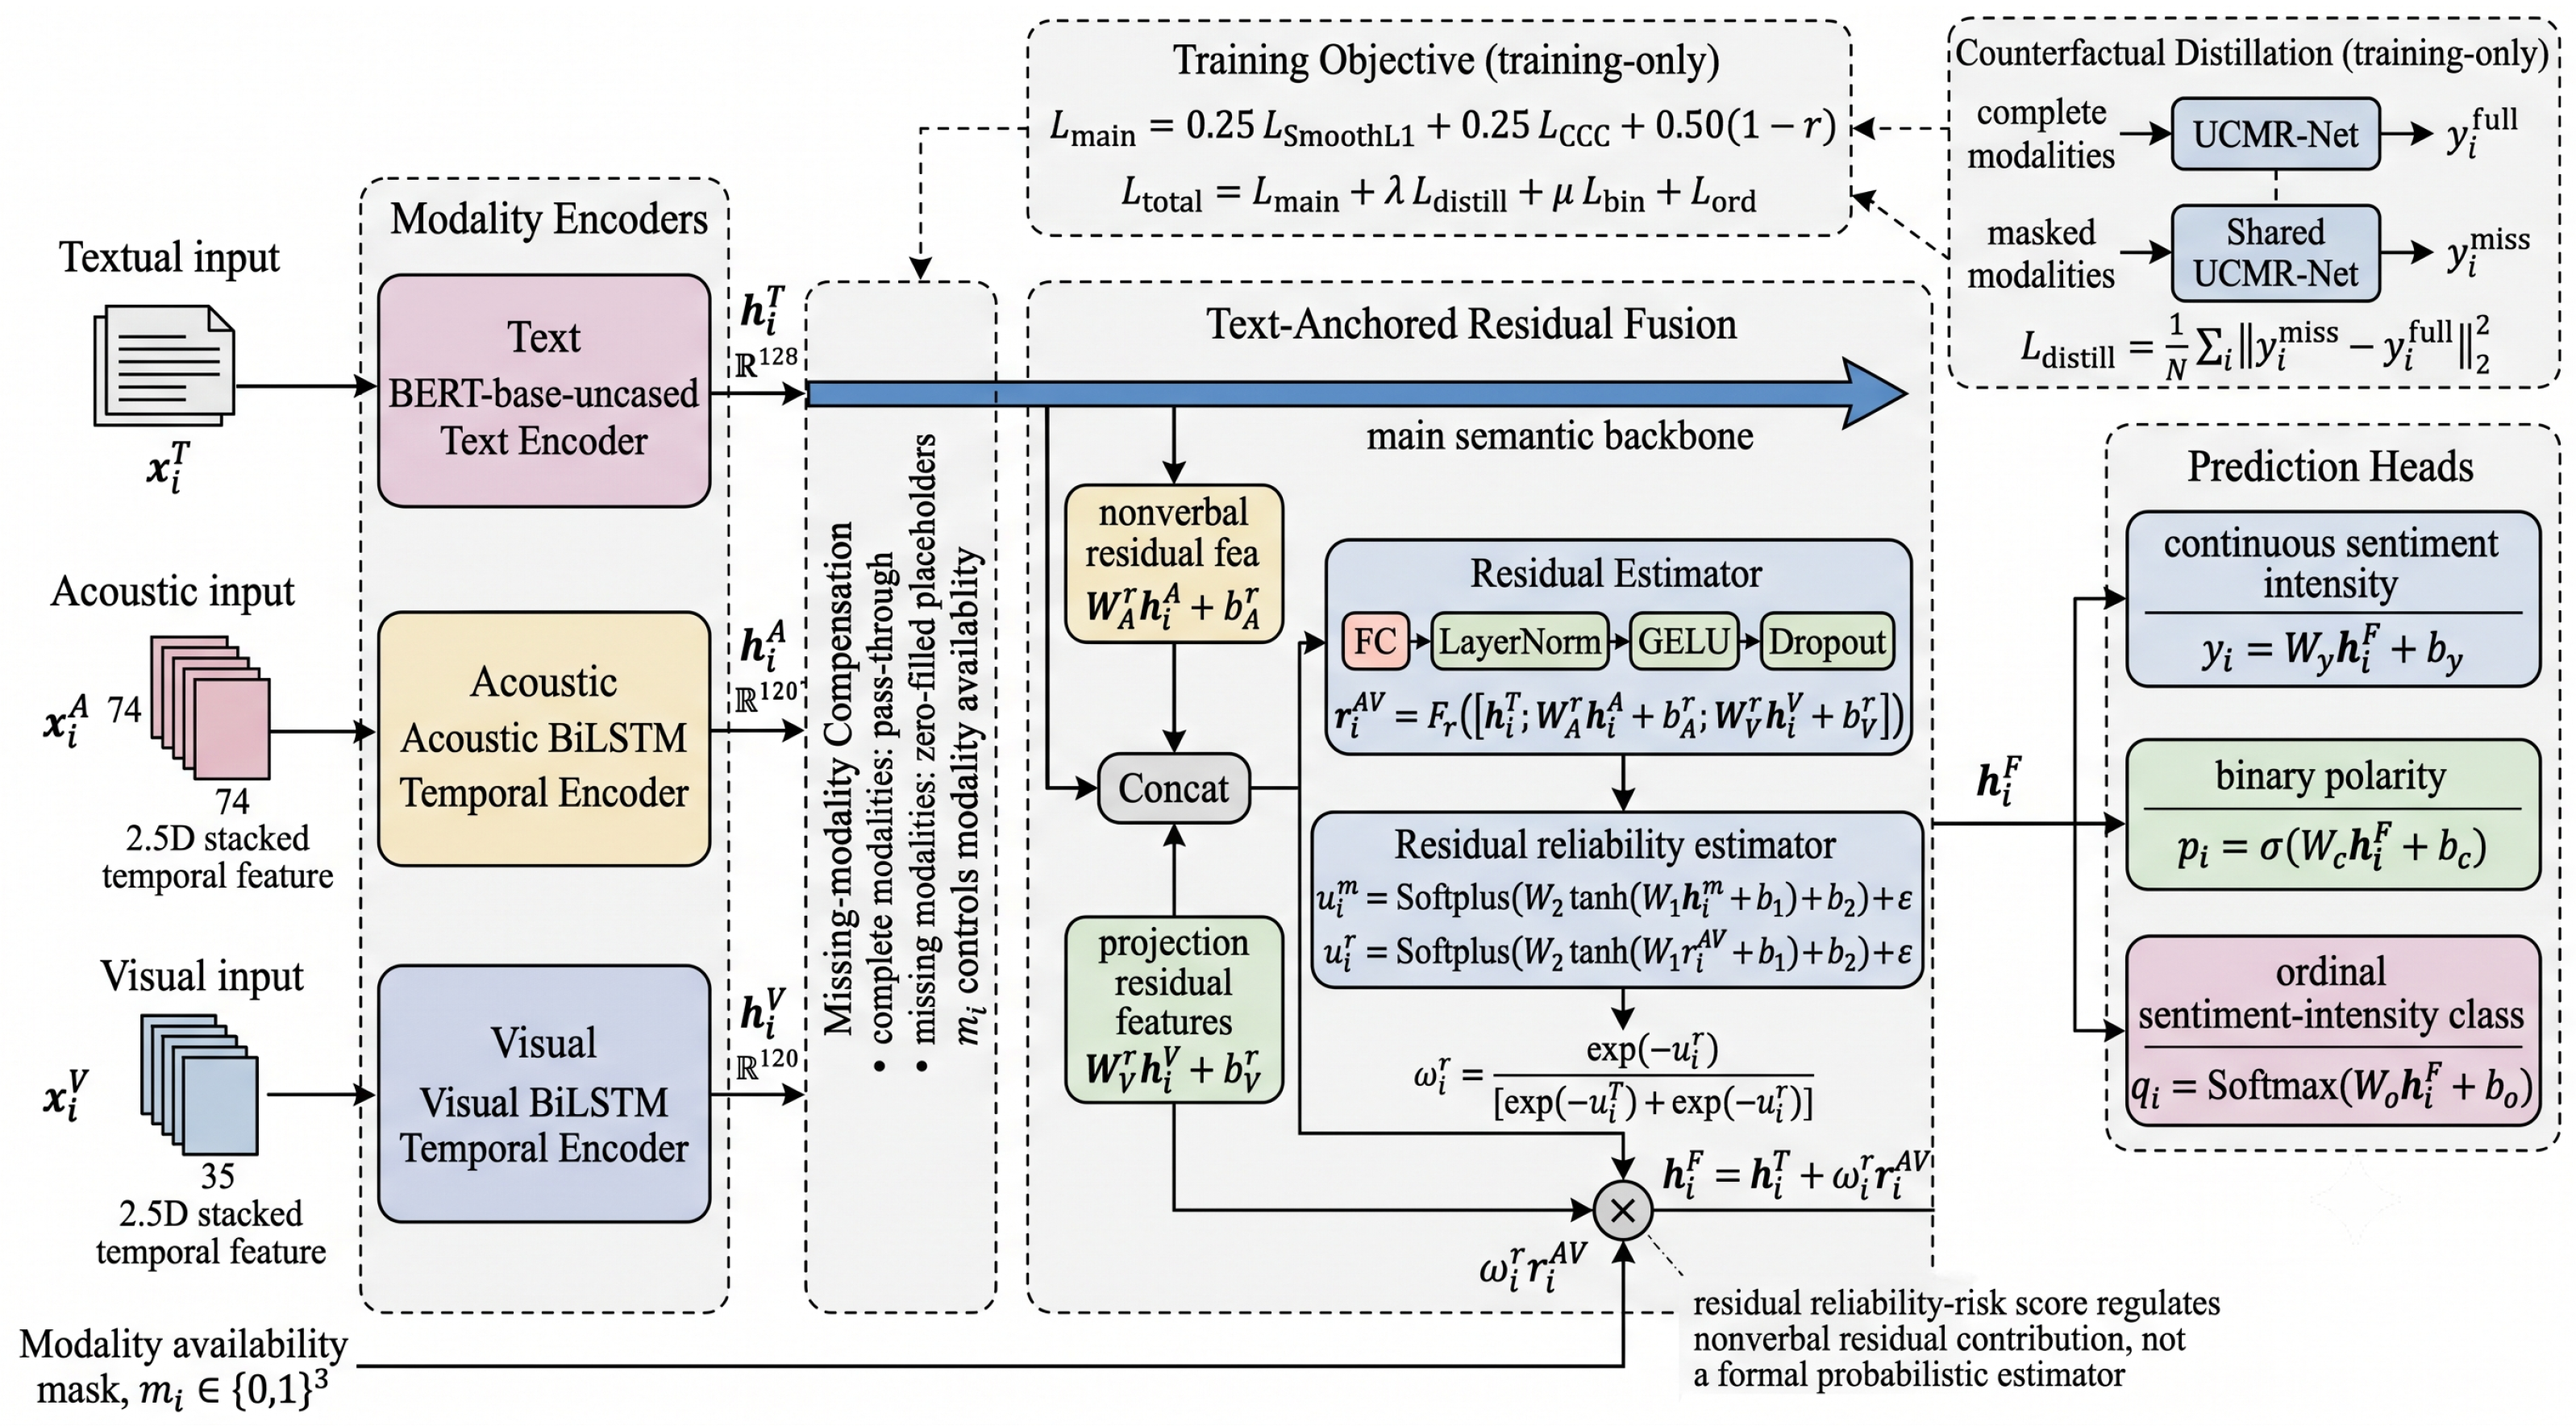
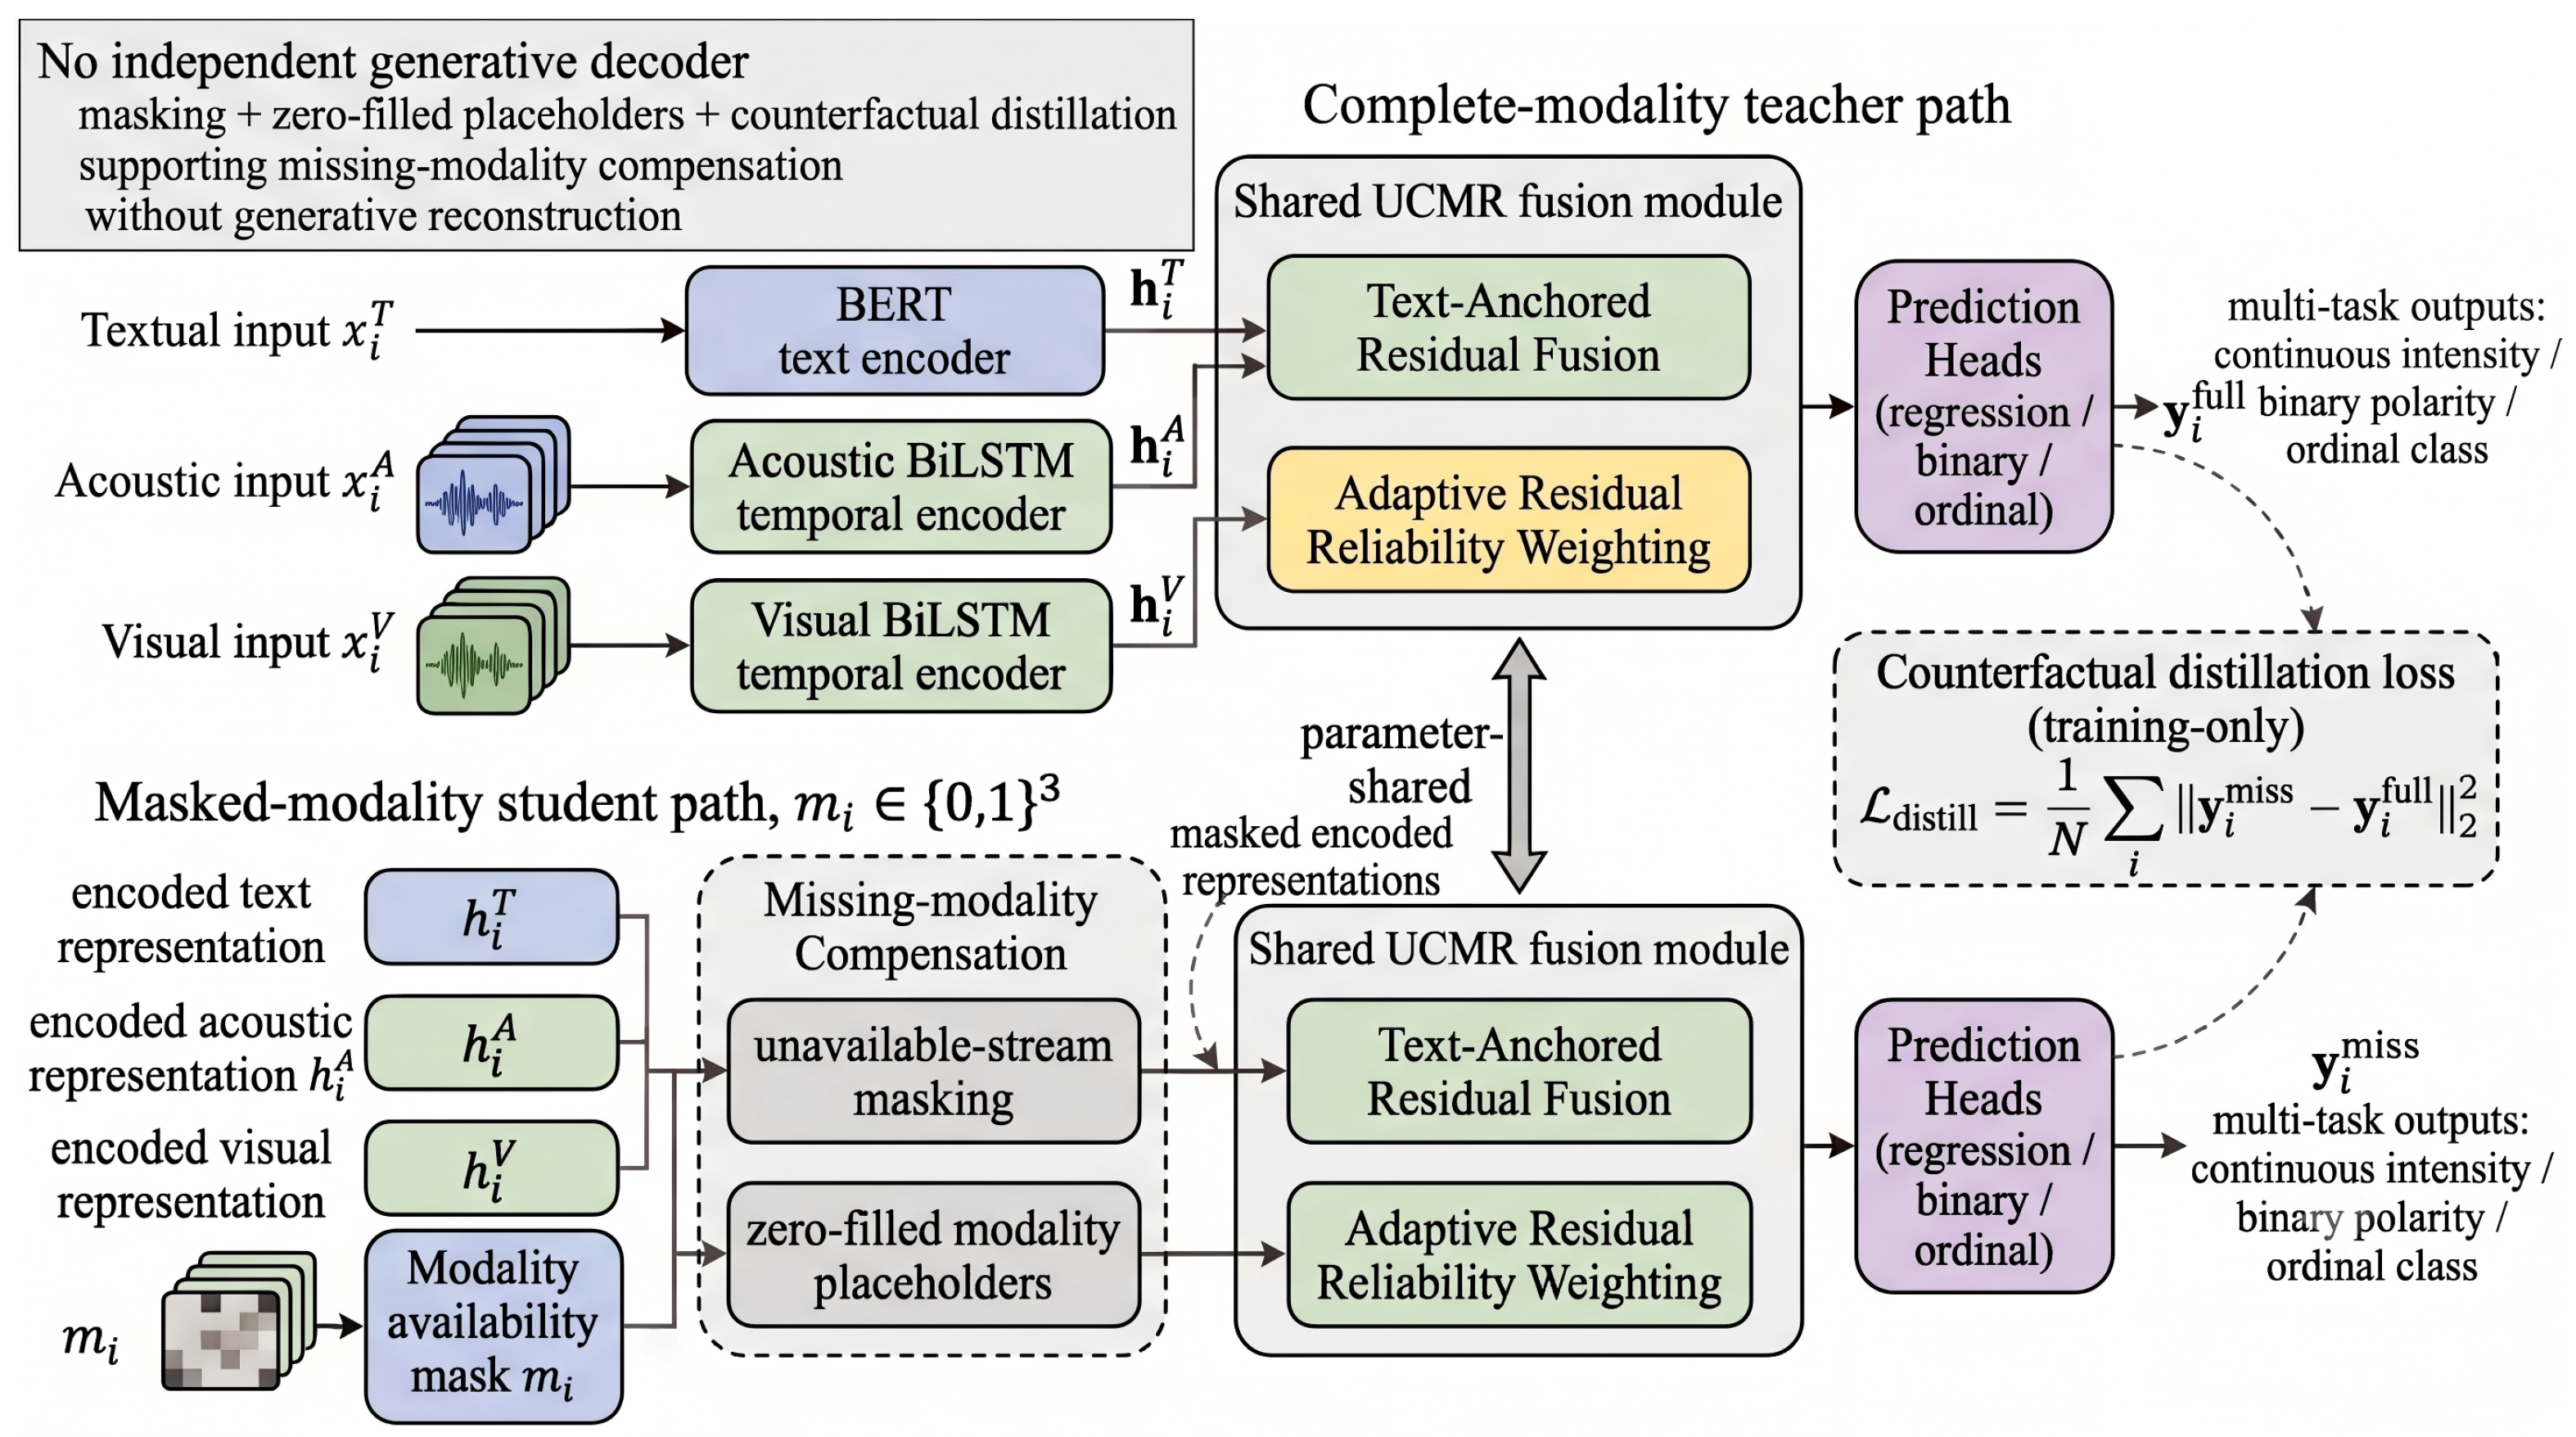
The proposed model is named UCMR-Net. It is designed as a text-anchored residual fusion network with adaptive residual weighting and masked-modality distillation for continuous multimodal sentiment intensity prediction. UCMR-Net is built on a text-anchored assumption: in opinion video sentiment analysis, textual content usually carries the densest semantic evidence, whereas acoustic and visual streams provide complementary paralinguistic corrections. The model first obtains a contextual text representation from BERT, then encodes acoustic and visual temporal streams using BiLSTM-based encoders, and finally performs residual correction through a learned residual reliability score. The reliability score is used to regulate nonverbal residual contribution and is not interpreted as a direct estimate of aleatoric uncertainty, epistemic uncertainty, or predictive uncertainty. The model jointly outputs a continuous sentiment score, a binary polarity label, and an ordinal sentiment-intensity label. The overall architecture of UCMR-Net, including modality encoders, masked-modality compensation, residual fusion, and prediction heads, is shown in Figure 2.

3.4. Text Encoder

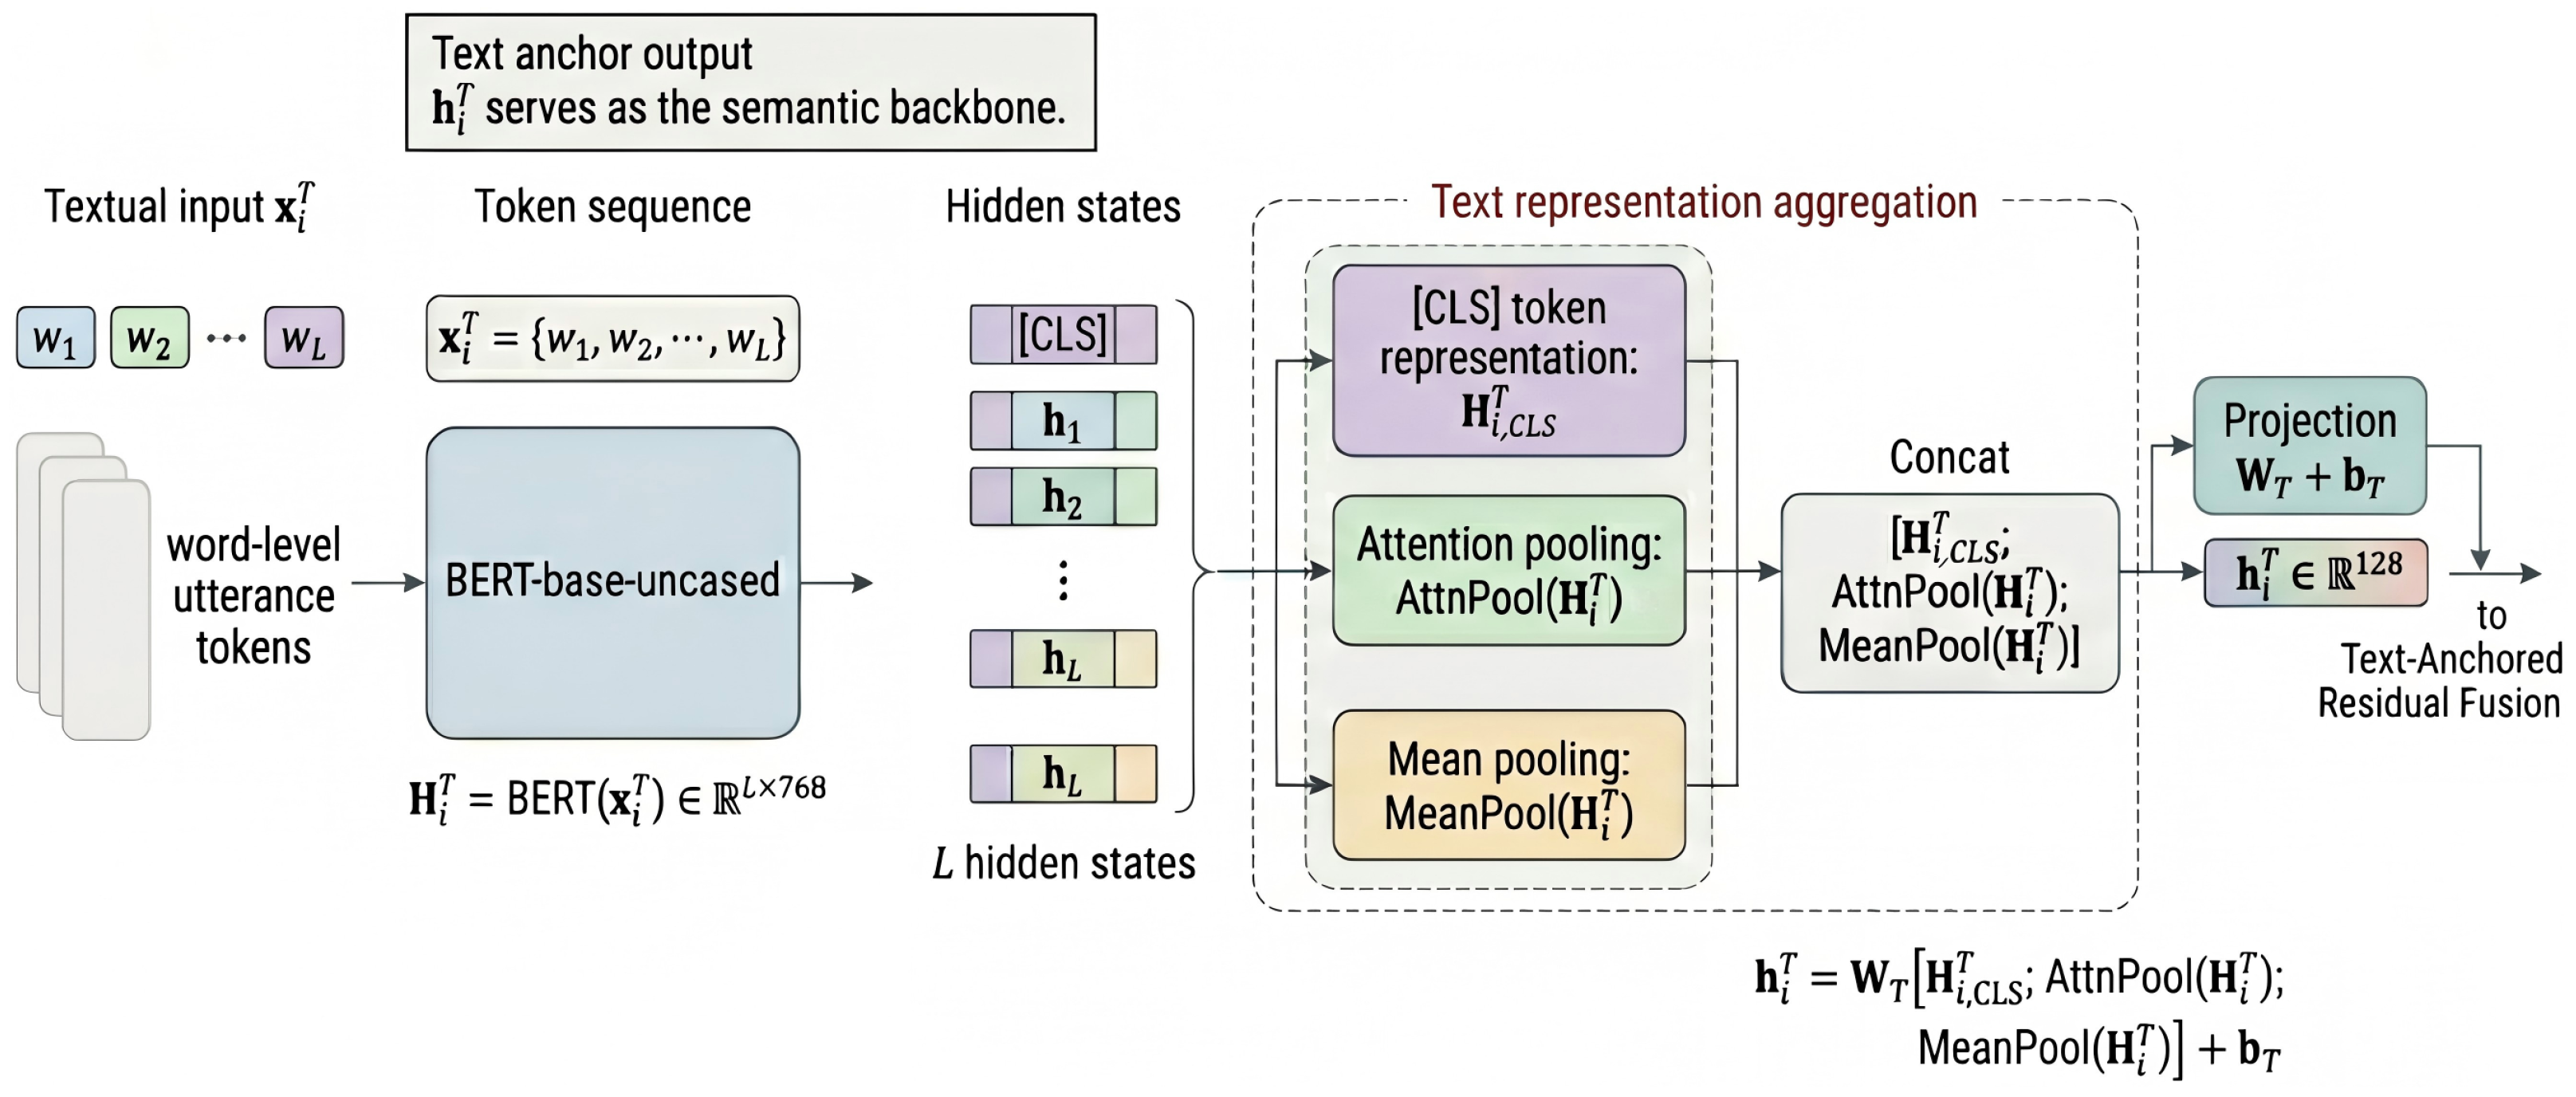
The textual stream is encoded using BERT-base-uncased, which provides contextualized bidirectional token representations. For an input token sequence x i T = { w 1 , w 2 , … , w L } , BERT generates hidden states:
H i T = B E R T x i T ∈ R L × 768
The final text representation combines the [CLS] token representation, attention pooling, and mean pooling, followed by a projection layer to match the hidden dimension used by the acoustic and visual encoders:
h i T = W T H i , C L S T ; A t t n P o o l H i T ; M e a n P o o l H i T + b T
where the projected text vector is used as the semantic anchor for subsequent residual fusion. BERT is used because pretrained bidirectional contextual representations have been shown to provide strong language understanding capacity for downstream NLP tasks [31]. Figure 3 presents the BERT-based text encoding module and shows how token-level contextual representations are aggregated into the final textual feature vector.

3.5. Acoustic and Visual Temporal Encoders

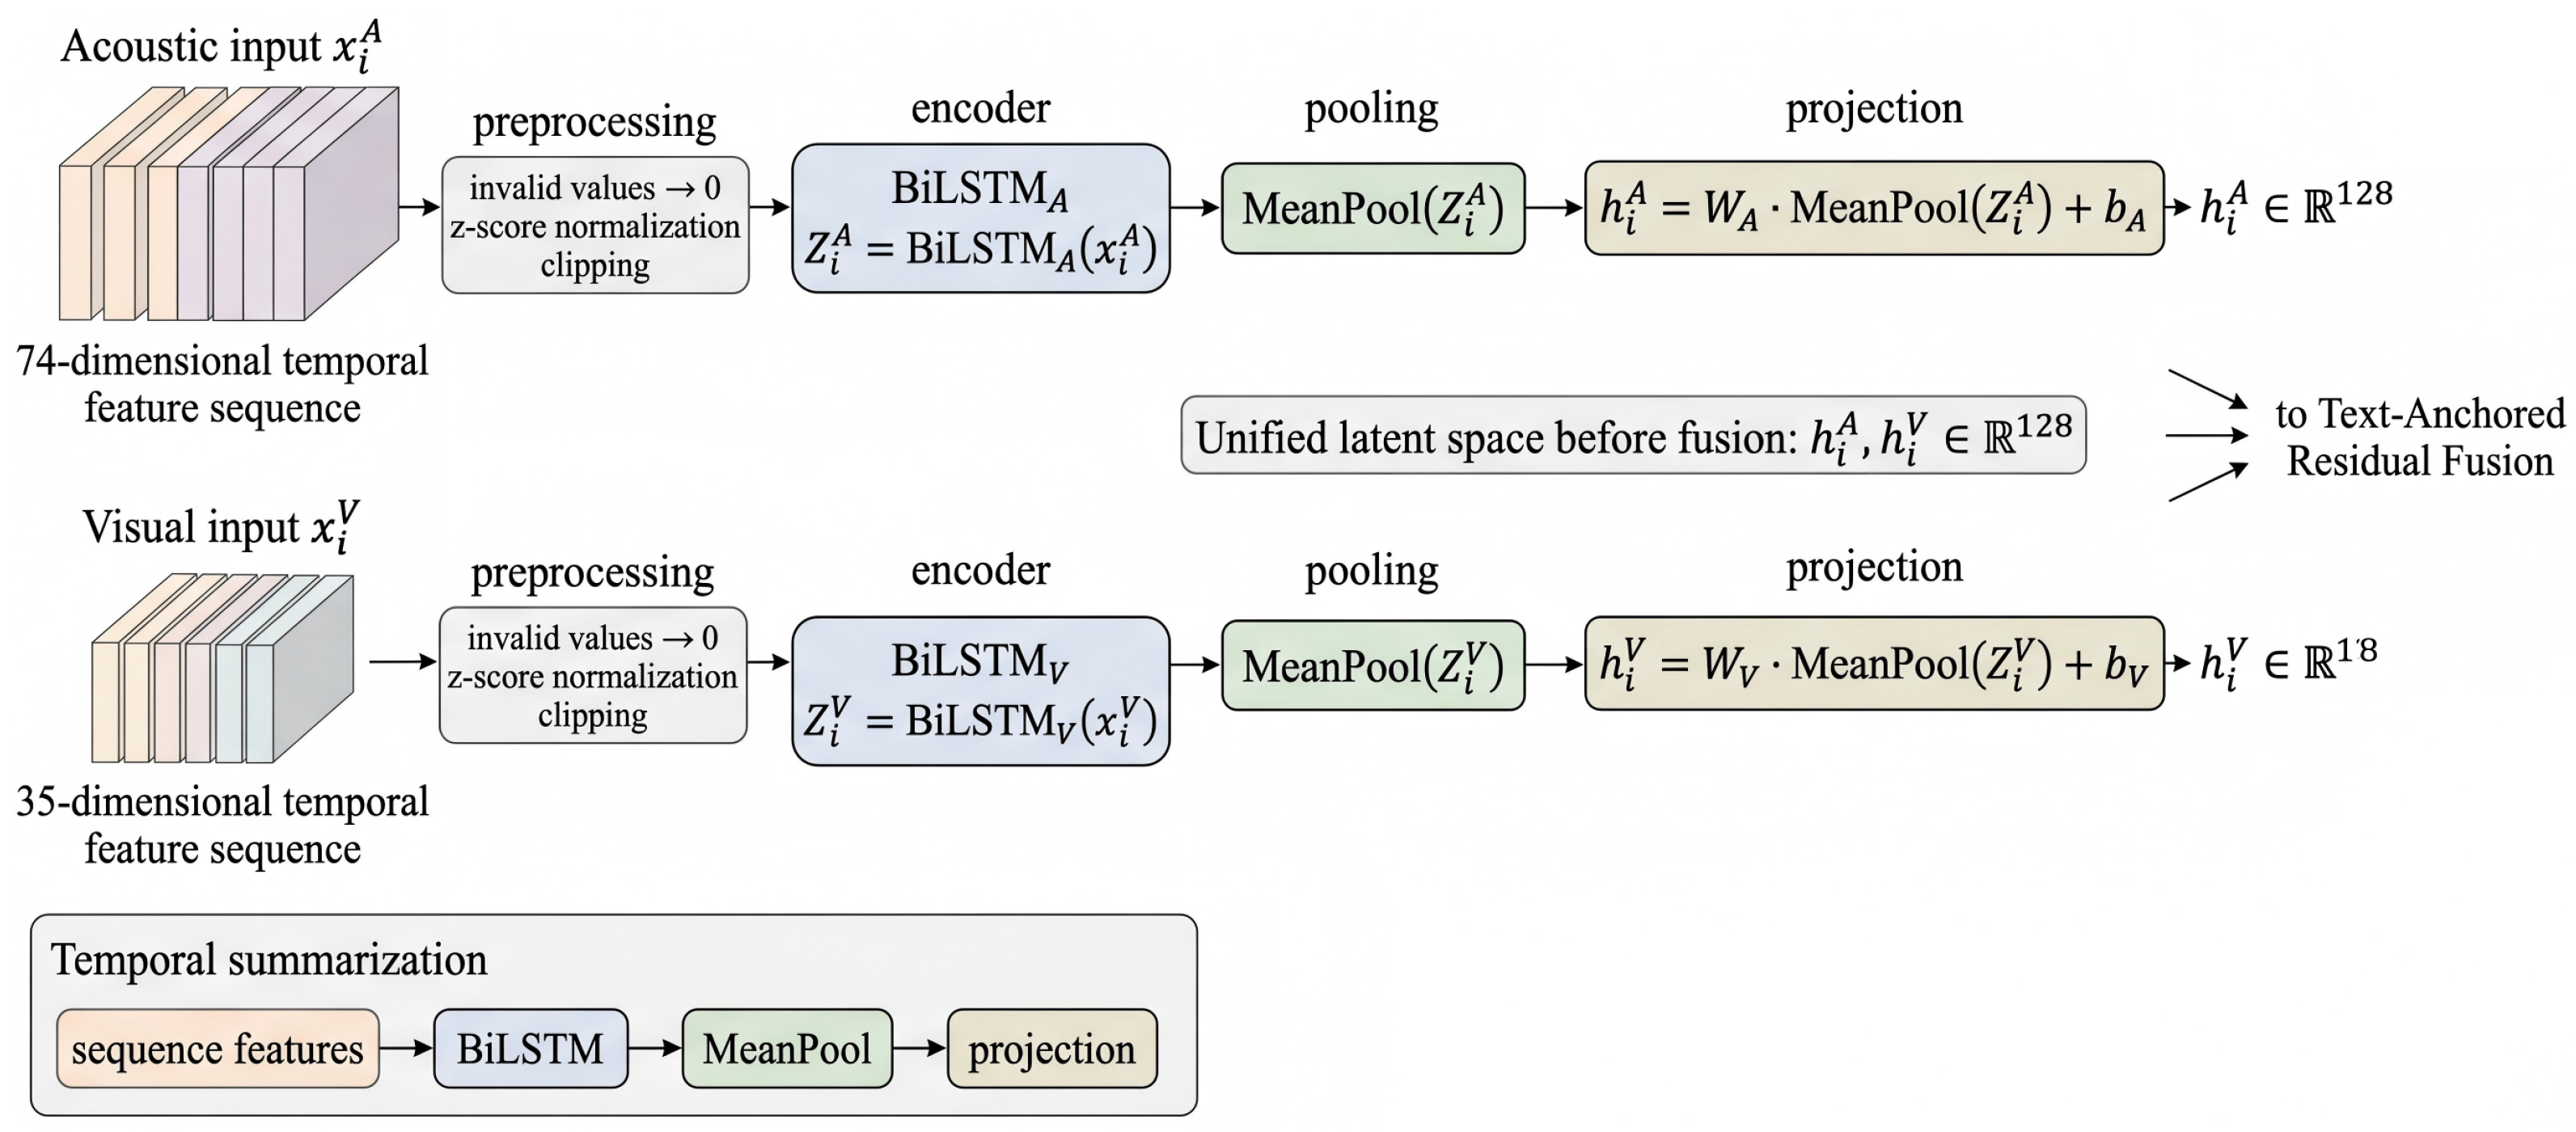
The acoustic and visual streams are represented as time-series feature sequences. In the implemented feature pipeline, the acoustic feature dimension is 74 and the visual feature dimension is 35. Each stream is normalized and then fed into a bidirectional LSTM encoder. LSTM is used because it is suitable for modeling temporal dependencies in sequential data [32].
For the acoustic stream:
Z i A = B i L S T M A x i A
h i A = W A · M e a n P o o l Z i A + b A
For the visual stream:
Z i V = B i L S T M V x i V
h i V = W V · M e a n P o o l Z i V + b V
where h i A , h i V ∈ R 128 . This design ensures that the acoustic and visual representations are projected into the same latent dimensionality as the textual representation before fusion, as illustrated in Figure 4.

3.6. Text-Anchored Residual Fusion

The central component of UCMR-Net is the text-anchored residual fusion module. Rather than treating the three modalities as equally reliable at all times, UCMR-Net uses text as the main semantic anchor and uses acoustic and visual representations as residual correction signals. This is particularly suitable for CMU-MOSI, where sentiment labels are assigned to opinion segments and textual statements often provide the most explicit sentiment evidence.
The acoustic and visual representations are first projected into residual feature space:
h ˜ i A = W A r h i A + b A r
h ˜ i V = W V r h i V + b V r
The multimodal residual signal is then computed as:
r i A V = F r h i T ; h ˜ i A ; h ˜ i V
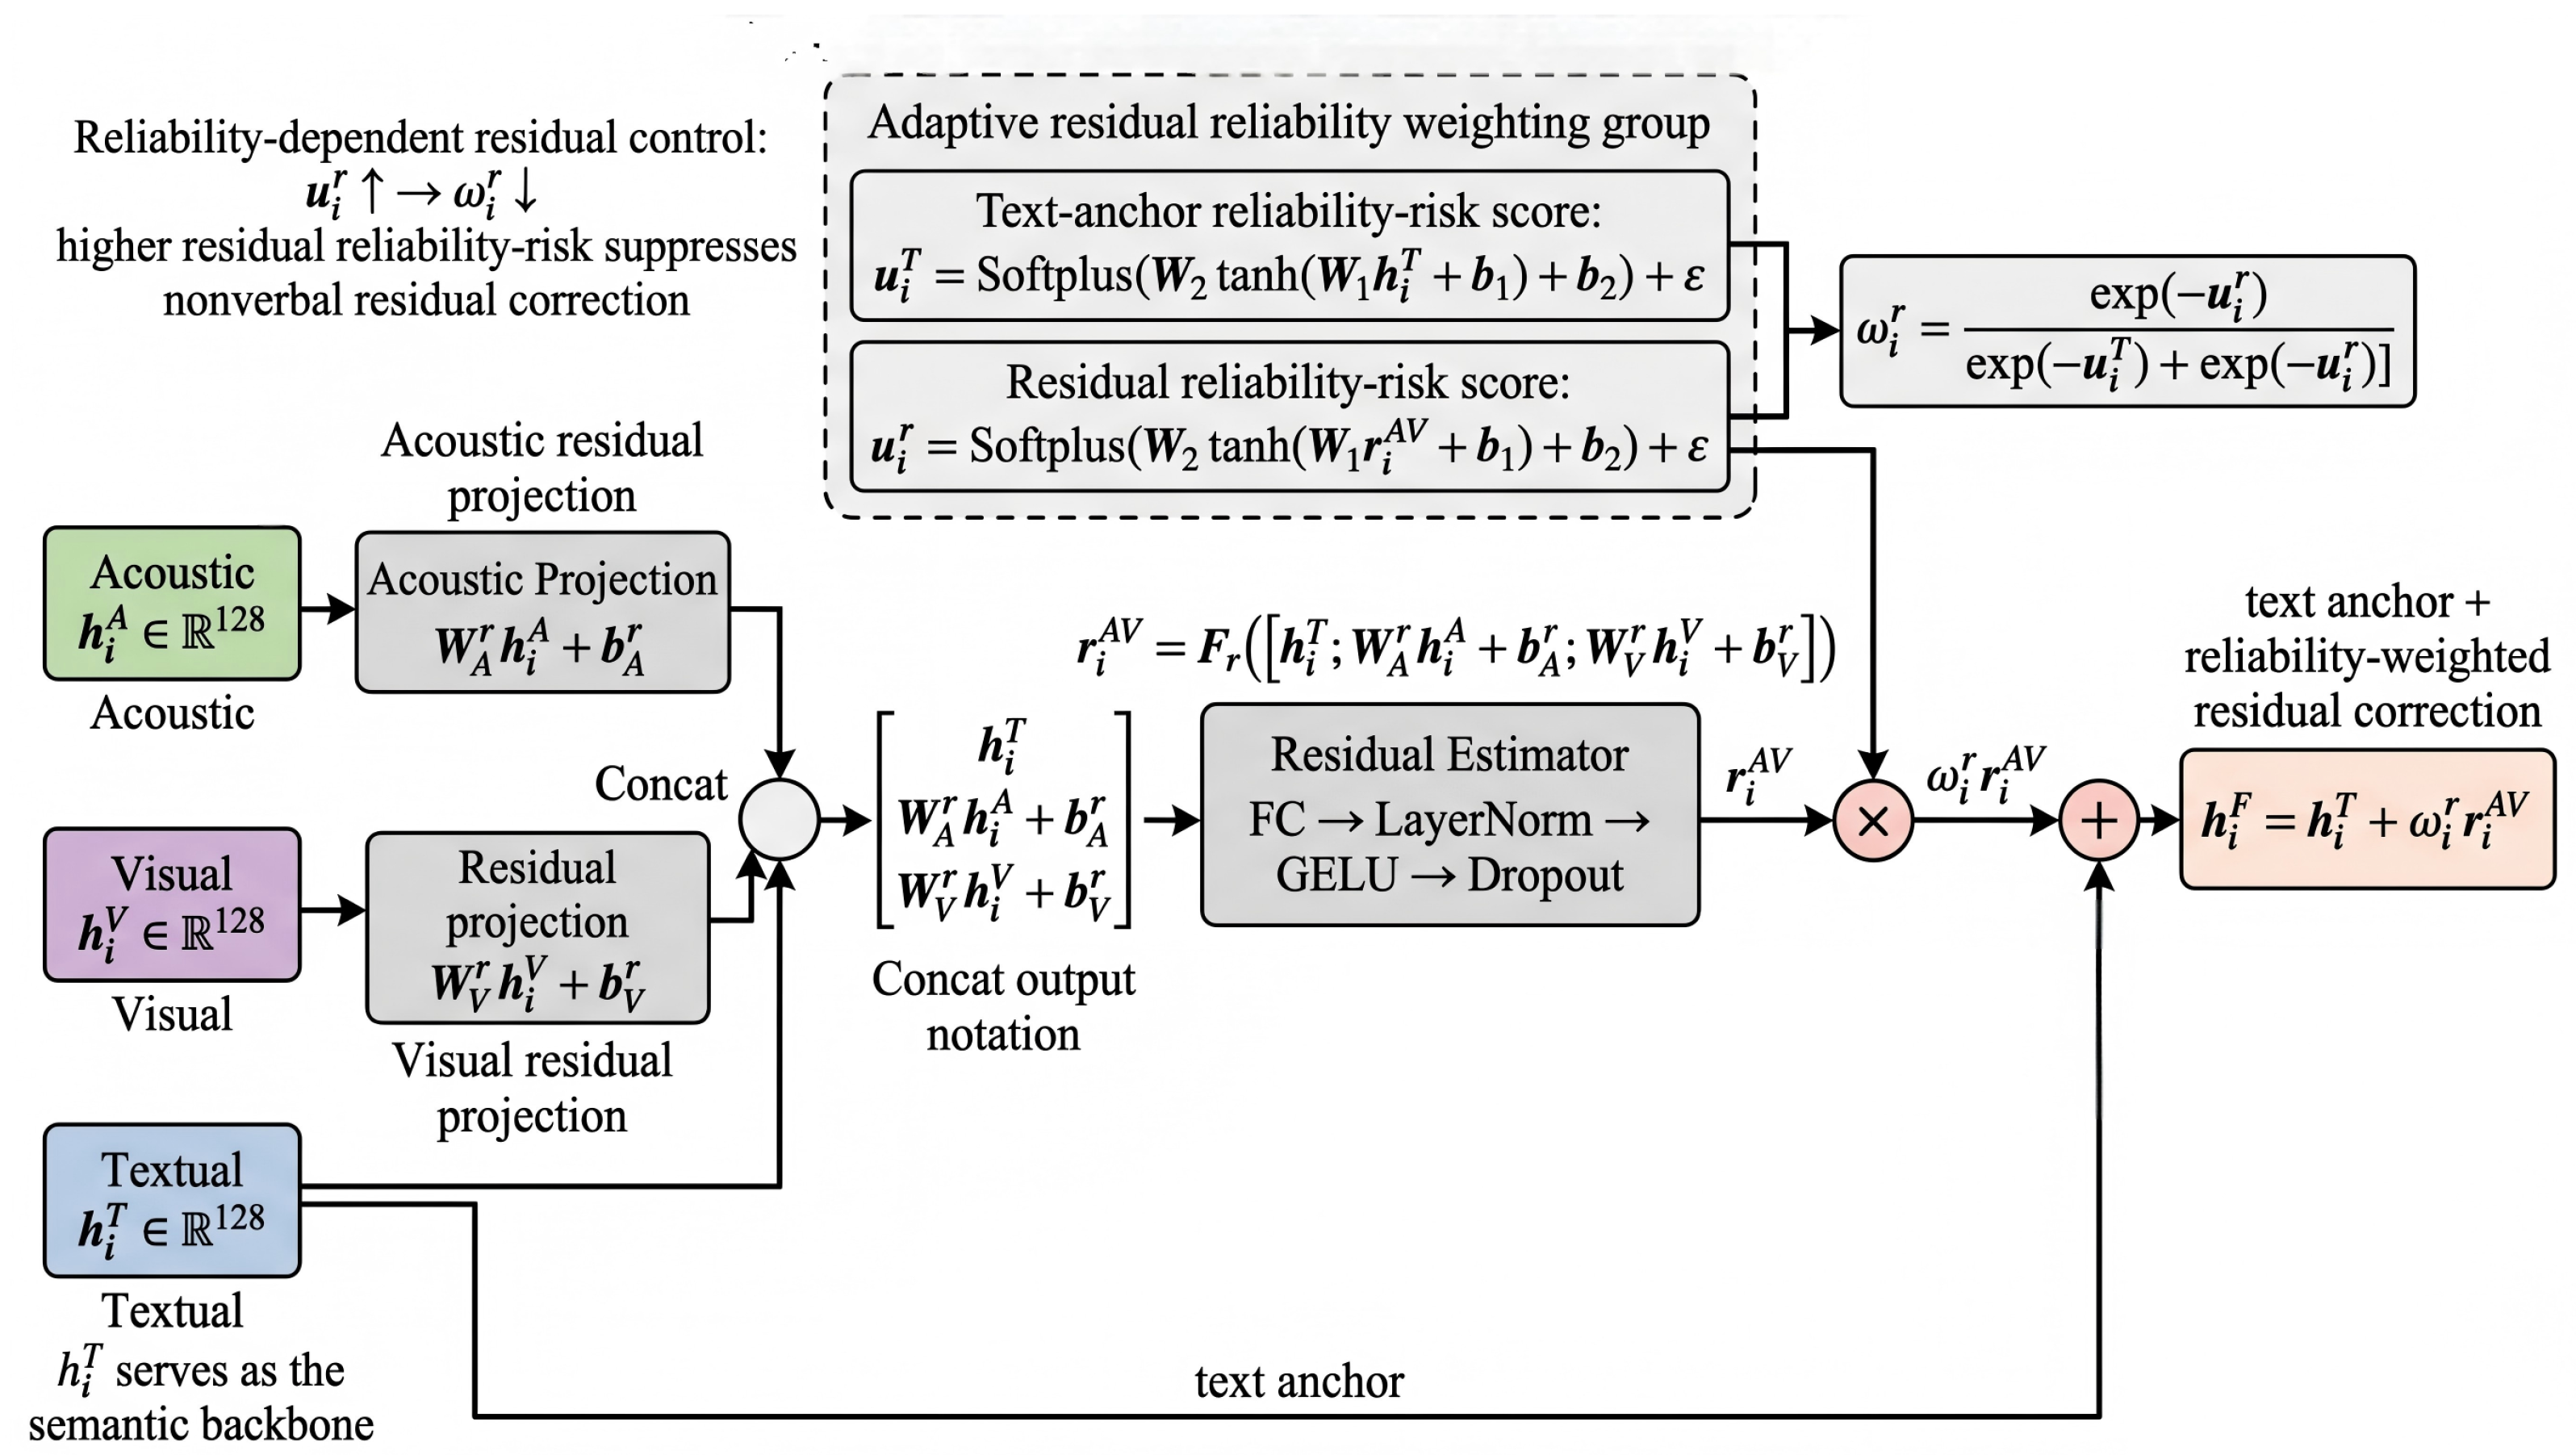
where the residual estimator is implemented by fully connected layers, layer normalization, GELU activation, and dropout. The fused representation is obtained by adding a reliability-weighted nonverbal residual correction to the textual representation:
h i F = h i T + ω i r r i A V
Here, the residual weight is produced by a positive scalar transformation and normalized across residual branches. In this formulation, the scalar is interpreted as a learned residual reliability controller rather than a probabilistic uncertainty estimate. A lower residual reliability score increases the contribution of the corresponding residual branch, whereas a higher reliability-risk score suppresses potentially noisy nonverbal correction. The empirical validity of this score is examined through its correlation with the absolute prediction error and through modality corruption tests, rather than assumed from the Softplus transformation alone.
ω i r = exp − u i r exp − u i T + e x p − u i r
This fusion design makes the model different from conventional early fusion and tensor fusion models. It explicitly prioritizes the textual semantic backbone while allowing nonverbal modalities to refine sentiment intensity estimation. The internal structure of the text-anchored residual fusion module is presented in Figure 5.

3.7. Missing-Modality Compensation and Counterfactual Distillation

The framework can be evaluated under incomplete multimodal conditions. When one or more modalities are unavailable, the missing stream is replaced by a controlled placeholder representation, and the available modalities are used to generate a prediction. At the framework level, this operation is implemented as mask-based missing-modality compensation. In UCMR-Net, the missing pathway uses unavailable-stream masking, zero-filled modality placeholders, and counterfactual distillation rather than an independent generative decoder.
Let y ^ i f u l l denote the prediction under complete modalities and y ^ i m i s s denote the prediction under a missing-modality mask. The counterfactual distillation term is defined as:
L d i s t i l l = 1 N ∑ i = 1 N ‖ y ^ i m i s s − y ^ i f u l l ‖ 2 2
The counterfactual distillation term encourages masked-input predictions to remain close to complete-input predictions under controlled missing-modality masks. This objective is intended to reduce prediction drift caused by modality unavailability, but it does not guarantee correctness when the removed modality contains decisive or contradictory sentiment evidence. Therefore, the effectiveness of masked-modality learning is evaluated empirically under a unified missing-modality protocol covering complete input, missing text, missing audio, missing visual, unimodal-only input, and random missing rates. Figure 6 summarizes the missing-modality compensation and counterfactual distillation mechanism used to constrain prediction consistency under masked-modality conditions.

3.8. Adaptive Residual Reliability and Calibration Analysis

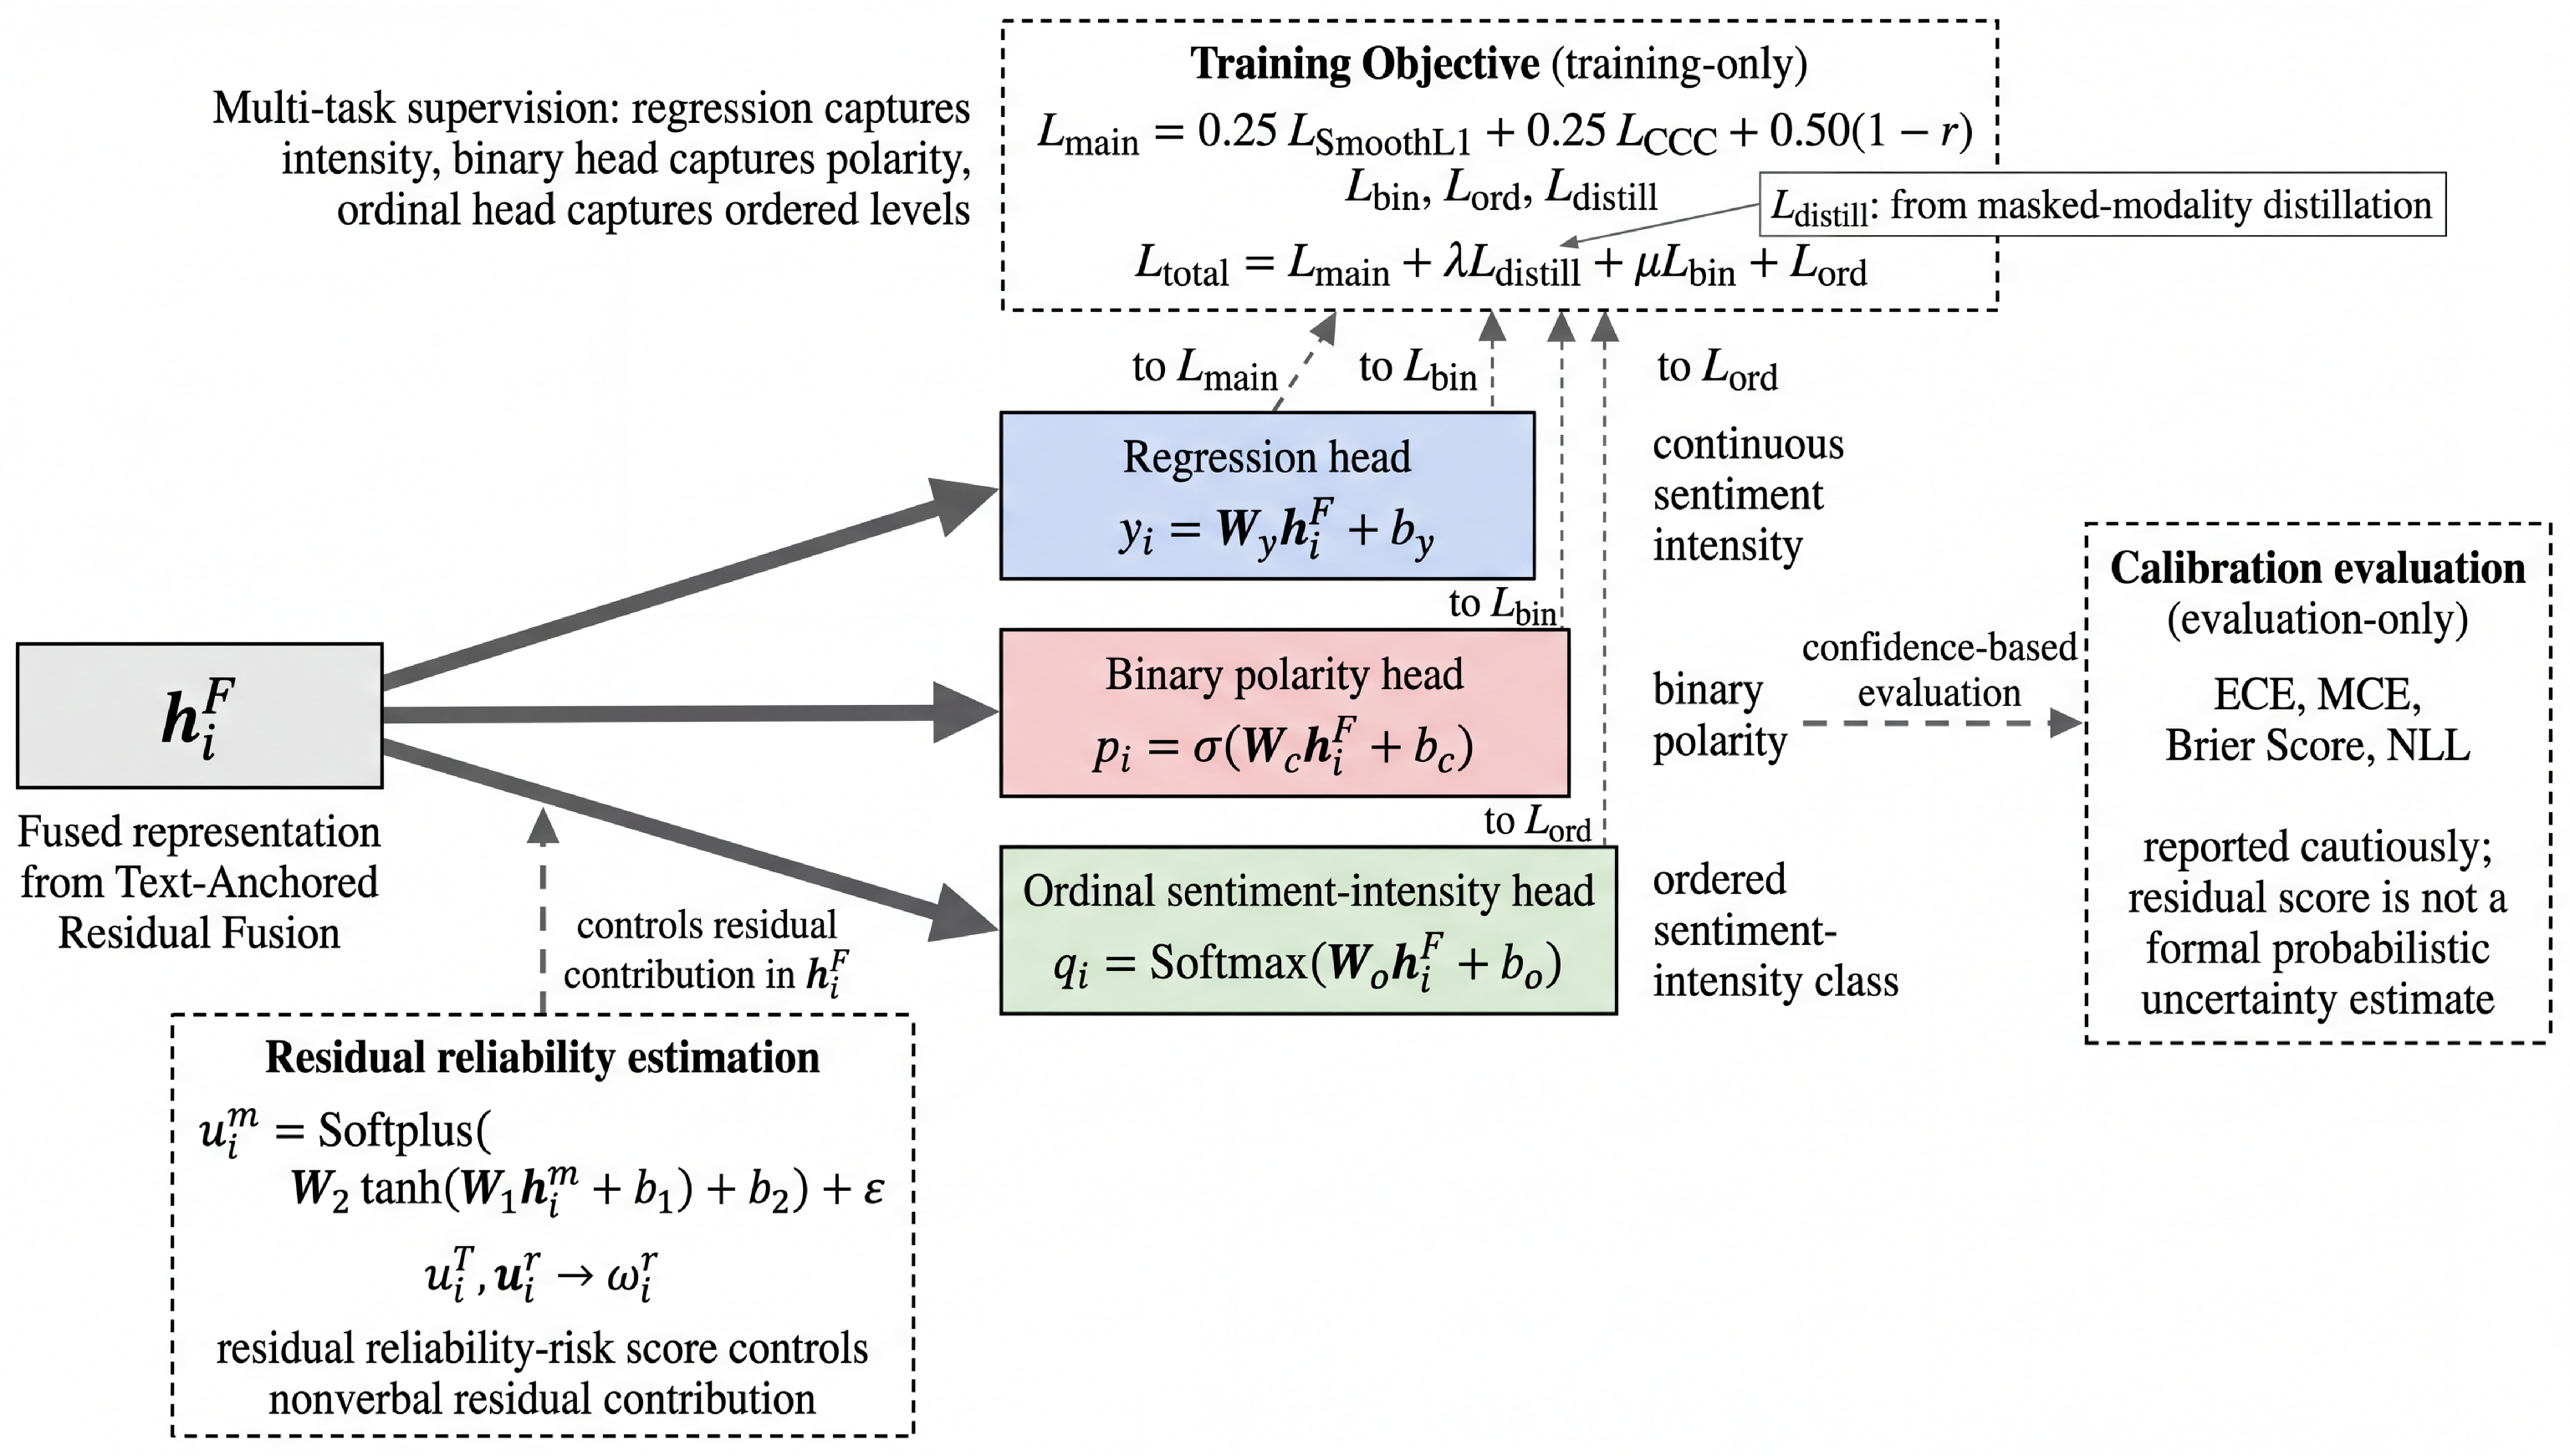
UCMR-Net uses a learned residual reliability score to regulate the contribution of acoustic and visual residual corrections. This score is not treated as a formal probabilistic uncertainty estimate. Instead, it is analyzed as a sample-dependent gating signal whose empirical behavior can be assessed through error correlation, calibration metrics, and modality corruption tests. For a modality representation, the residual reliability score is computed as:
u i m = S o f t p l u s W 2 tanh W 1 h i m + b 1 + b 2 + ϵ
where a small constant is used for numerical stability. Calibration is evaluated using ECE, MCE, Brier score, and NLL. Because raw neural confidence is often miscalibrated, post-hoc temperature scaling is additionally applied to the binary polarity head. The evaluation reports both raw and temperature-scaled calibration results, as well as the correlation between residual reliability-risk scores and absolute regression errors. Figure 7 shows how adaptive residual reliability is connected with residual weighting and multi-task prediction heads.

3.9. Multi-Task Prediction Heads

The fused representation h i F is passed to three task-specific heads. The regression head predicts continuous sentiment intensity:
y ^ i = W y h i F + b y
The binary head predicts sentiment polarity:
p ^ i = σ W c h i F + b c
The ordinal head predicts ordered sentiment-intensity categories:
q ^ i = S o f t m a x W o h i F + b o
The binary and ordinal tasks serve as auxiliary supervision signals and help the model distinguish polarity and intensity levels beyond pure regression.

3.10. Objective Function

The total loss combines regression loss, correlation-oriented loss, counterfactual distillation, and auxiliary multi-task loss. The main regression loss is composed of smooth L1 loss, Concordance Correlation Coefficient (CCC) loss [33], and Pearson correlation loss:
L m a i n = 0.25 L S m o o t h L 1 + 0.25 L C C C + 0.50 ( 1 − r )
The smooth L1 loss is:
L S m o o t h L 1 = 1 N ∑ i = 1 N s m o o t h L 1 y ^ i − y i
The Pearson correlation coefficient is:
r = ∑ i = 1 N y ^ i − y ^ ¯ y i − y ¯ ∑ i = 1 N y ^ i − y ^ ¯ 2 ∑ i = 1 N y i − y ¯ 2
The concordance correlation coefficient is:
ρ c = 2 ρ σ y ^ σ y σ y ^ 2 + σ y 2 + μ y ^ − μ y 2
Thus,
L C C C = 1 − ρ c
The binary polarity loss is:
L b i n = − 1 N ∑ i = 1 N c i log p ^ i + 1 − c i log 1 − p ^ i
The ordinal classification loss is:
L o r d = − 1 N ∑ i = 1 N ∑ k = 1 K I o i = k log q ^ i k
The final training objective is:
L t o t a l = L m a i n + λ L d i s t i l l + μ L b i n + L o r d
where λ and μ control the contribution of counterfactual distillation and auxiliary multi-task supervision.

3.11. Training Strategy

The training procedure follows a two-phase strategy. In Phase 1, the BERT backbone is frozen to stabilize the multimodal fusion layers, with a higher missing rate and stronger distillation weight. In Phase 2, BERT is partially unfrozen for fine-tuning, while the missing rate and distillation weight are reduced. This design prevents early-stage overfitting of the large text encoder and allows the multimodal fusion module to first learn stable cross-modal correction behavior. The detailed two-phase training configuration of UCMR-Net is summarized in Table 1.
Implementation and reproducibility details. All experiments were implemented in Python 3.10 using PyTorch and HuggingFace Transformers. The 74-dimensional acoustic features and 35-dimensional visual features were obtained from the aligned CMU-MOSI feature release distributed through the CMU Multimodal SDK/MultiBench-style pipeline, corresponding to COVAREP acoustic descriptors and FACET visual descriptors. The optimizer was AdamW. The learning rate was set to 2 × 10 − 5 for the unfrozen BERT layers and 1 × 10⁻³ for newly initialized non-text modules, with weight decay of 1 × 10 − 4 , dropout of 0.30, batch size of 32, and early stopping patience of 8 epochs based on validation MAE. The model was trained with five random seeds (2026, 2027, 2028, 2029, and 2030). Checkpoints were selected exclusively according to validation MAE, and the test set was used only for final evaluation after the model configuration was fixed. Main baseline and controlled-ablation results are summarized as mean ± standard deviation across the five validation-selected seed-level runs. Separately, a locked ensemble was formed by equally averaging the five seed-level predictions and was used only for the post-hoc missing-modality, calibration, residual-reliability, modality-corruption, error-distribution, and qualitative analyses explicitly identified as ensemble-based.

4. Experimental Results

4.1. Dataset Description

The experiments are conducted on the CMU-MOSI dataset, a widely used benchmark for multimodal sentiment analysis. CMU-MOSI contains opinion-level video segments with aligned textual, acoustic, and visual information. Each utterance is annotated with a continuous sentiment intensity score in the range y i ∈ [ − 3 , 3 ] , where − 3 denotes strongly negative sentiment and + 3 denotes strongly positive sentiment [34]. CMU-MOSEI is additionally used in Section 4.9 as an external validation benchmark for assessing generalization beyond CMU-MOSI [35]. The datasets are accessed and processed using the CMU Multimodal SDK and MultiBench-style feature pipelines [36].
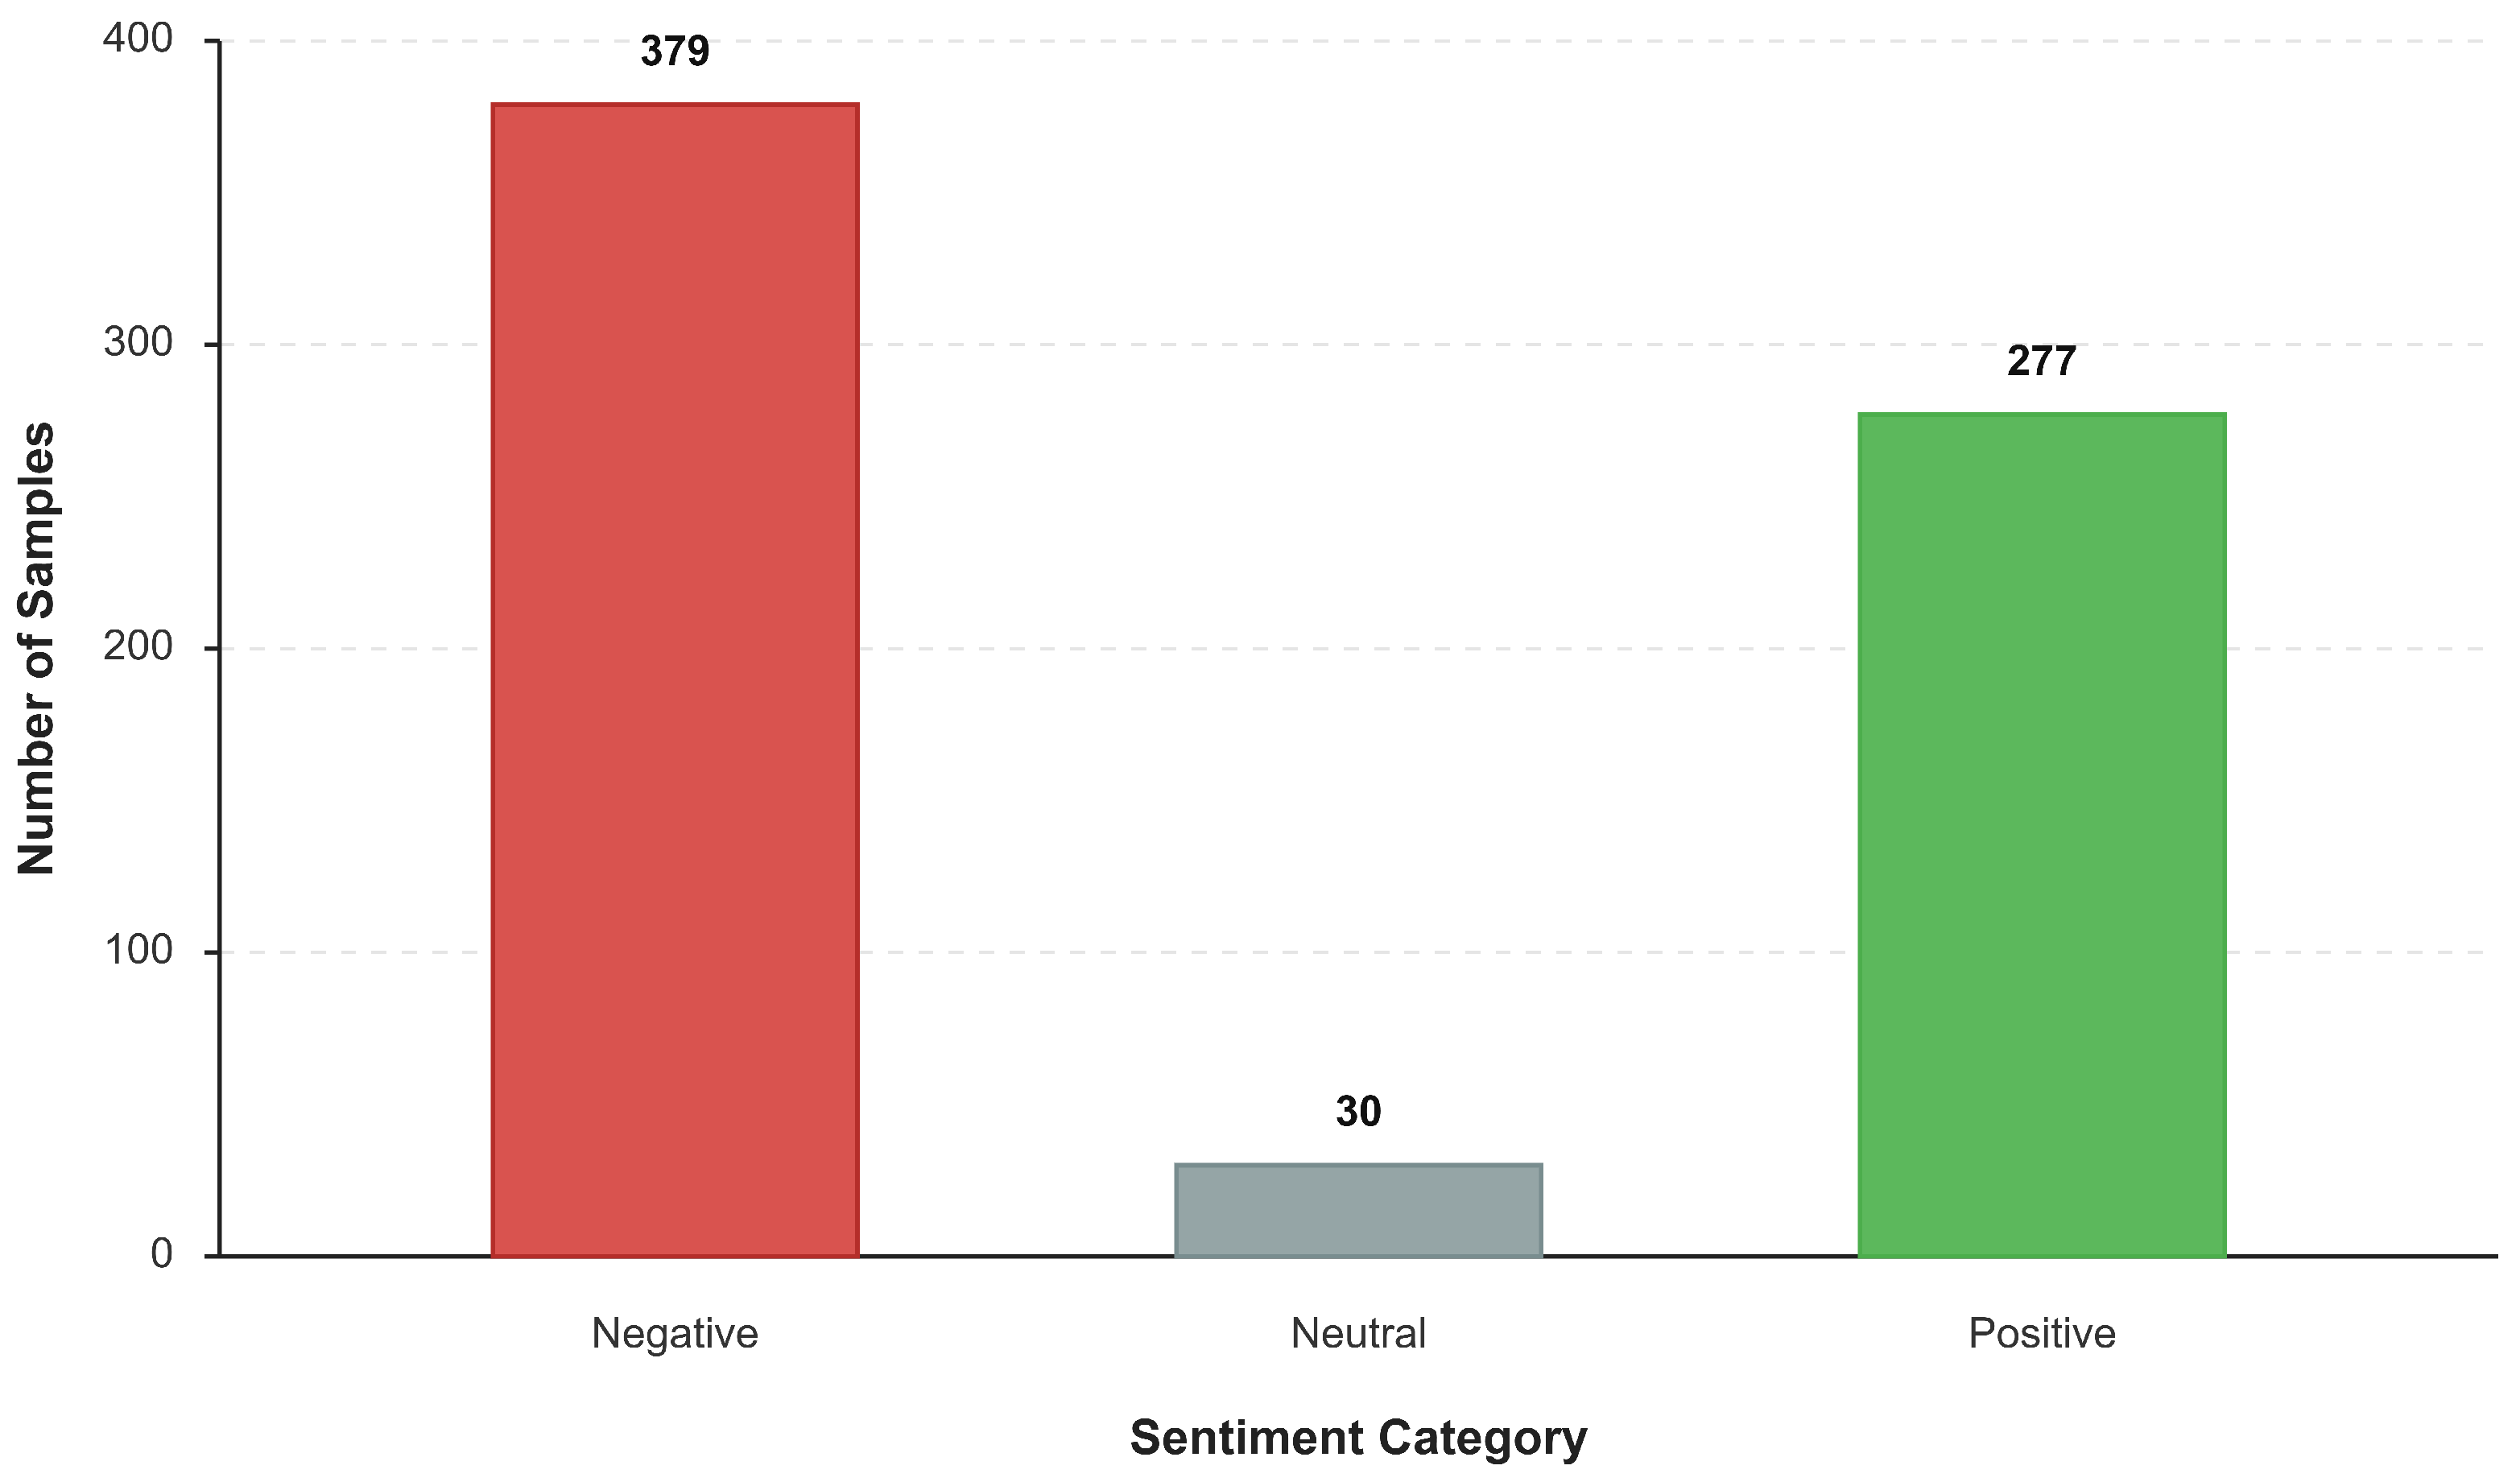
The evaluation pipeline used in this study provides prediction and label arrays for the CMU-MOSI test split containing 686 samples. Based on the test labels used in the evaluation pipeline, the test set contains 379 negative samples, 30 neutral samples, and 277 positive samples. Regression metrics are computed on all 686 samples, while binary polarity metrics follow the Non0 protocol and are computed on the 656 non-neutral samples. Table 2 summarizes the dataset scale, split setting, modality composition, target variables, and test-set label distribution.
To further visualize the label composition of the CMU-MOSI test set, Figure 8 shows the distribution of negative, neutral, and positive samples.

4.2. Data Preprocessing

The preprocessing procedure follows the implementation used in the UCMR-Net training pipeline. Text is reconstructed from word-level features by removing special pause tokens and concatenating valid word tokens. Acoustic and visual features are cleaned by replacing invalid numerical values, including NaN and positive or negative infinity, with zeros. Z-score normalization is estimated from the training set and then applied to the validation and test sets to avoid test-set information leakage. Extremely large normalized values are clipped to the range [ − 5 , 5 ] for numerical stability.
The z-score normalization is defined as:
x ˜ = c l i p x − μ t r a i n σ t r a i n + ϵ , − 5 , 5
where μ t r a i n and σ t r a i n are computed from the training split only. The preprocessing operations applied to each modality and label type are summarized in Table 3.

4.3. Baseline Models

The baseline selection covers representative multimodal sentiment analysis models and incomplete-modality methods. Early-fusion and late-fusion LSTM baselines are included as simple sequential fusion references. TFN and LMF represent tensor-based multimodal fusion [37,38]. MulT introduces cross-modal attention for unaligned multimodal language sequences [39]. MISA separates modality-invariant and modality-specific representations [40]. MAG-BERT integrates acoustic and visual information into pretrained language models through multimodal adaptation gates [41]. Self-MM introduces self-supervised modality-specific labels for multi-task multimodal sentiment learning [42]. MMIM maximizes mutual information hierarchically to preserve task-relevant multimodal information [43]. TFR-Net, UMDF, and CorrKD are included as representative incomplete-modality or missing-modality robust methods [44,45,46].
All key baselines were evaluated under the same CMU-MOSI split, text/audio/visual feature pipeline, preprocessing statistics, validation-based checkpoint selection rule, random seed protocol, and metric script as UCMR-Net. Public implementations were used when a verifiable author-provided or paper-associated repository was available; otherwise, the corresponding model was reimplemented according to its original methodological specification. Adaptations were restricted to the data interface, input dimensionality, prediction head, and unified evaluation protocol, while model-specific architectural components and original auxiliary objectives were retained. Table 4 summarizes the baseline set and unified comparison status, and Table 5 reports the implementation source, adaptation details, major hyperparameters, and configuration file location for each rerun model. Detailed implementation-source records, adaptation notes, and per-model configuration files are provided in the anonymized reproducibility repository.
To furthr improve the reproducibility of the unified comparison, Table 5 summarizes the implementation source, adaptation details, major hyperparameters, and configuration file location for each rerun model. All models used the same CMU-MOSI split, training-set-derived preprocessing statistics, validation-based checkpoint selection criterion, five random seeds, and evaluation script, while model-specific architectural components and original auxiliary objectives were retained whenever applicable.

4.4. Evaluation Metrics

The primary regression metrics are MAE, RMSE, and Pearson correlation. MAE measures the average absolute prediction error, while RMSE penalizes large errors more strongly [47]. Pearson correlation evaluates the linear consistency between predicted and true sentiment scores. For regression evaluation, MAE, RMSE, and Pearson correlation are computed on all 686 CMU-MOSI test samples. For binary polarity evaluation, Acc-2 and F1 follow the Non0 protocol commonly used in CMU-MOSI comparisons: samples with y = 0 are excluded, and polarity is defined as negative when y < 0 and positive when y > 0. Therefore, binary metrics are computed on 656 non-neutral test samples rather than on the full 686-sample test set. Unless otherwise stated, F1 denotes the positive-class F1 under this Non0 protocol. Calibration is assessed using ECE, MCE, Brier score, and NLL. ECE and reliability-based calibration analysis are widely used for modern neural networks [48], and the Brier score is a classical probabilistic forecast verification metric [49].
The mean absolute error is:
M A E = 1 N ∑ i = 1 N y ^ i − y i
The root mean square error is:
R M S E = 1 N ∑ i = 1 N y ^ i − y i 2
The binary accuracy is:
A c c - 2 = T P + T N T P + T N + F P + F N
The F1 score is:
F 1 = 2 · P r e c i s i o n · R e c a l l P r e c i s i o n + R e c a l l
The expected calibration error is:
E C E = ∑ b = 1 B B b N a c c B b − c o n f B b
The maximum calibration error is:
M C E = max b ∈ { 1 , … , B } a c c B b − c o n f B b
The Brier score is:
B r i e r = 1 N ∑ i = 1 N ∑ k = 1 K p i k − I y i = k 2
The negative log-likelihood is:
N L L = − 1 N ∑ i = 1 N log p i , y i
Table 6 summarizes the evaluation metrics used in this study, including their metric type, optimization direction, and analytical role.
Reporting convention: Repeated-run CMU-MOSI training results are reported as mean ± standard deviation (SD) across five random seeds unless otherwise stated. Post-hoc analyses computed from the locked validation-selected ensemble predictions are reported as single values because between-seed variability is not defined for those derived analyses. External-validation and cross-dataset transfer results are reported according to the evaluation basis specified in the corresponding table notes.

4.5. Unified Baseline Comparison and Five-Seed Main Results

To ensure a fair model comparison, representative baselines were evaluated under the same split, preprocessing pipeline, feature normalization, validation-based checkpoint selection, five-seed protocol, and metric script as UCMR-Net. Table 7 reports the mean ± standard deviation across five independent runs for all rerun models. UCMR-Net achieves the lowest MAE and RMSE and the highest Pearson correlation among the evaluated methods, while the improvements in Acc-2 and F1 are comparatively smaller.
The unified comparison shows that UCMR-Net achieves the lowest MAE (0.699 ± 0.009) and RMSE (0.997 ± 0.011) and the highest Pearson correlation (0.802 ± 0.006) among the evaluated models. The improvements in Acc-2 and F1 are comparatively smaller, so the interpretation emphasizes regression and sentiment-intensity estimation rather than broad categorical superiority.
Table 8 reports the seed-level CMU-MOSI results and the corresponding mean ± standard deviation under the five-seed evaluation protocol. Reporting both the central tendency and between-run variability provides a stability-aware estimate of model performance under random initialization and training variation.
To test whether the regression gains are reliable across repeated runs, Table 9 summarizes paired significance tests between UCMR-Net and strong baselines. The MAE comparisons provide the primary statistical evidence for improvements over BERT-only, MAG-BERT, CorrKD, and LNLN. The Corr comparison with LNLN (p = 0.044) is treated as secondary evidence and is not used to support a strong superiority claim, while the Acc-2 and F1 differences are not statistically significant.
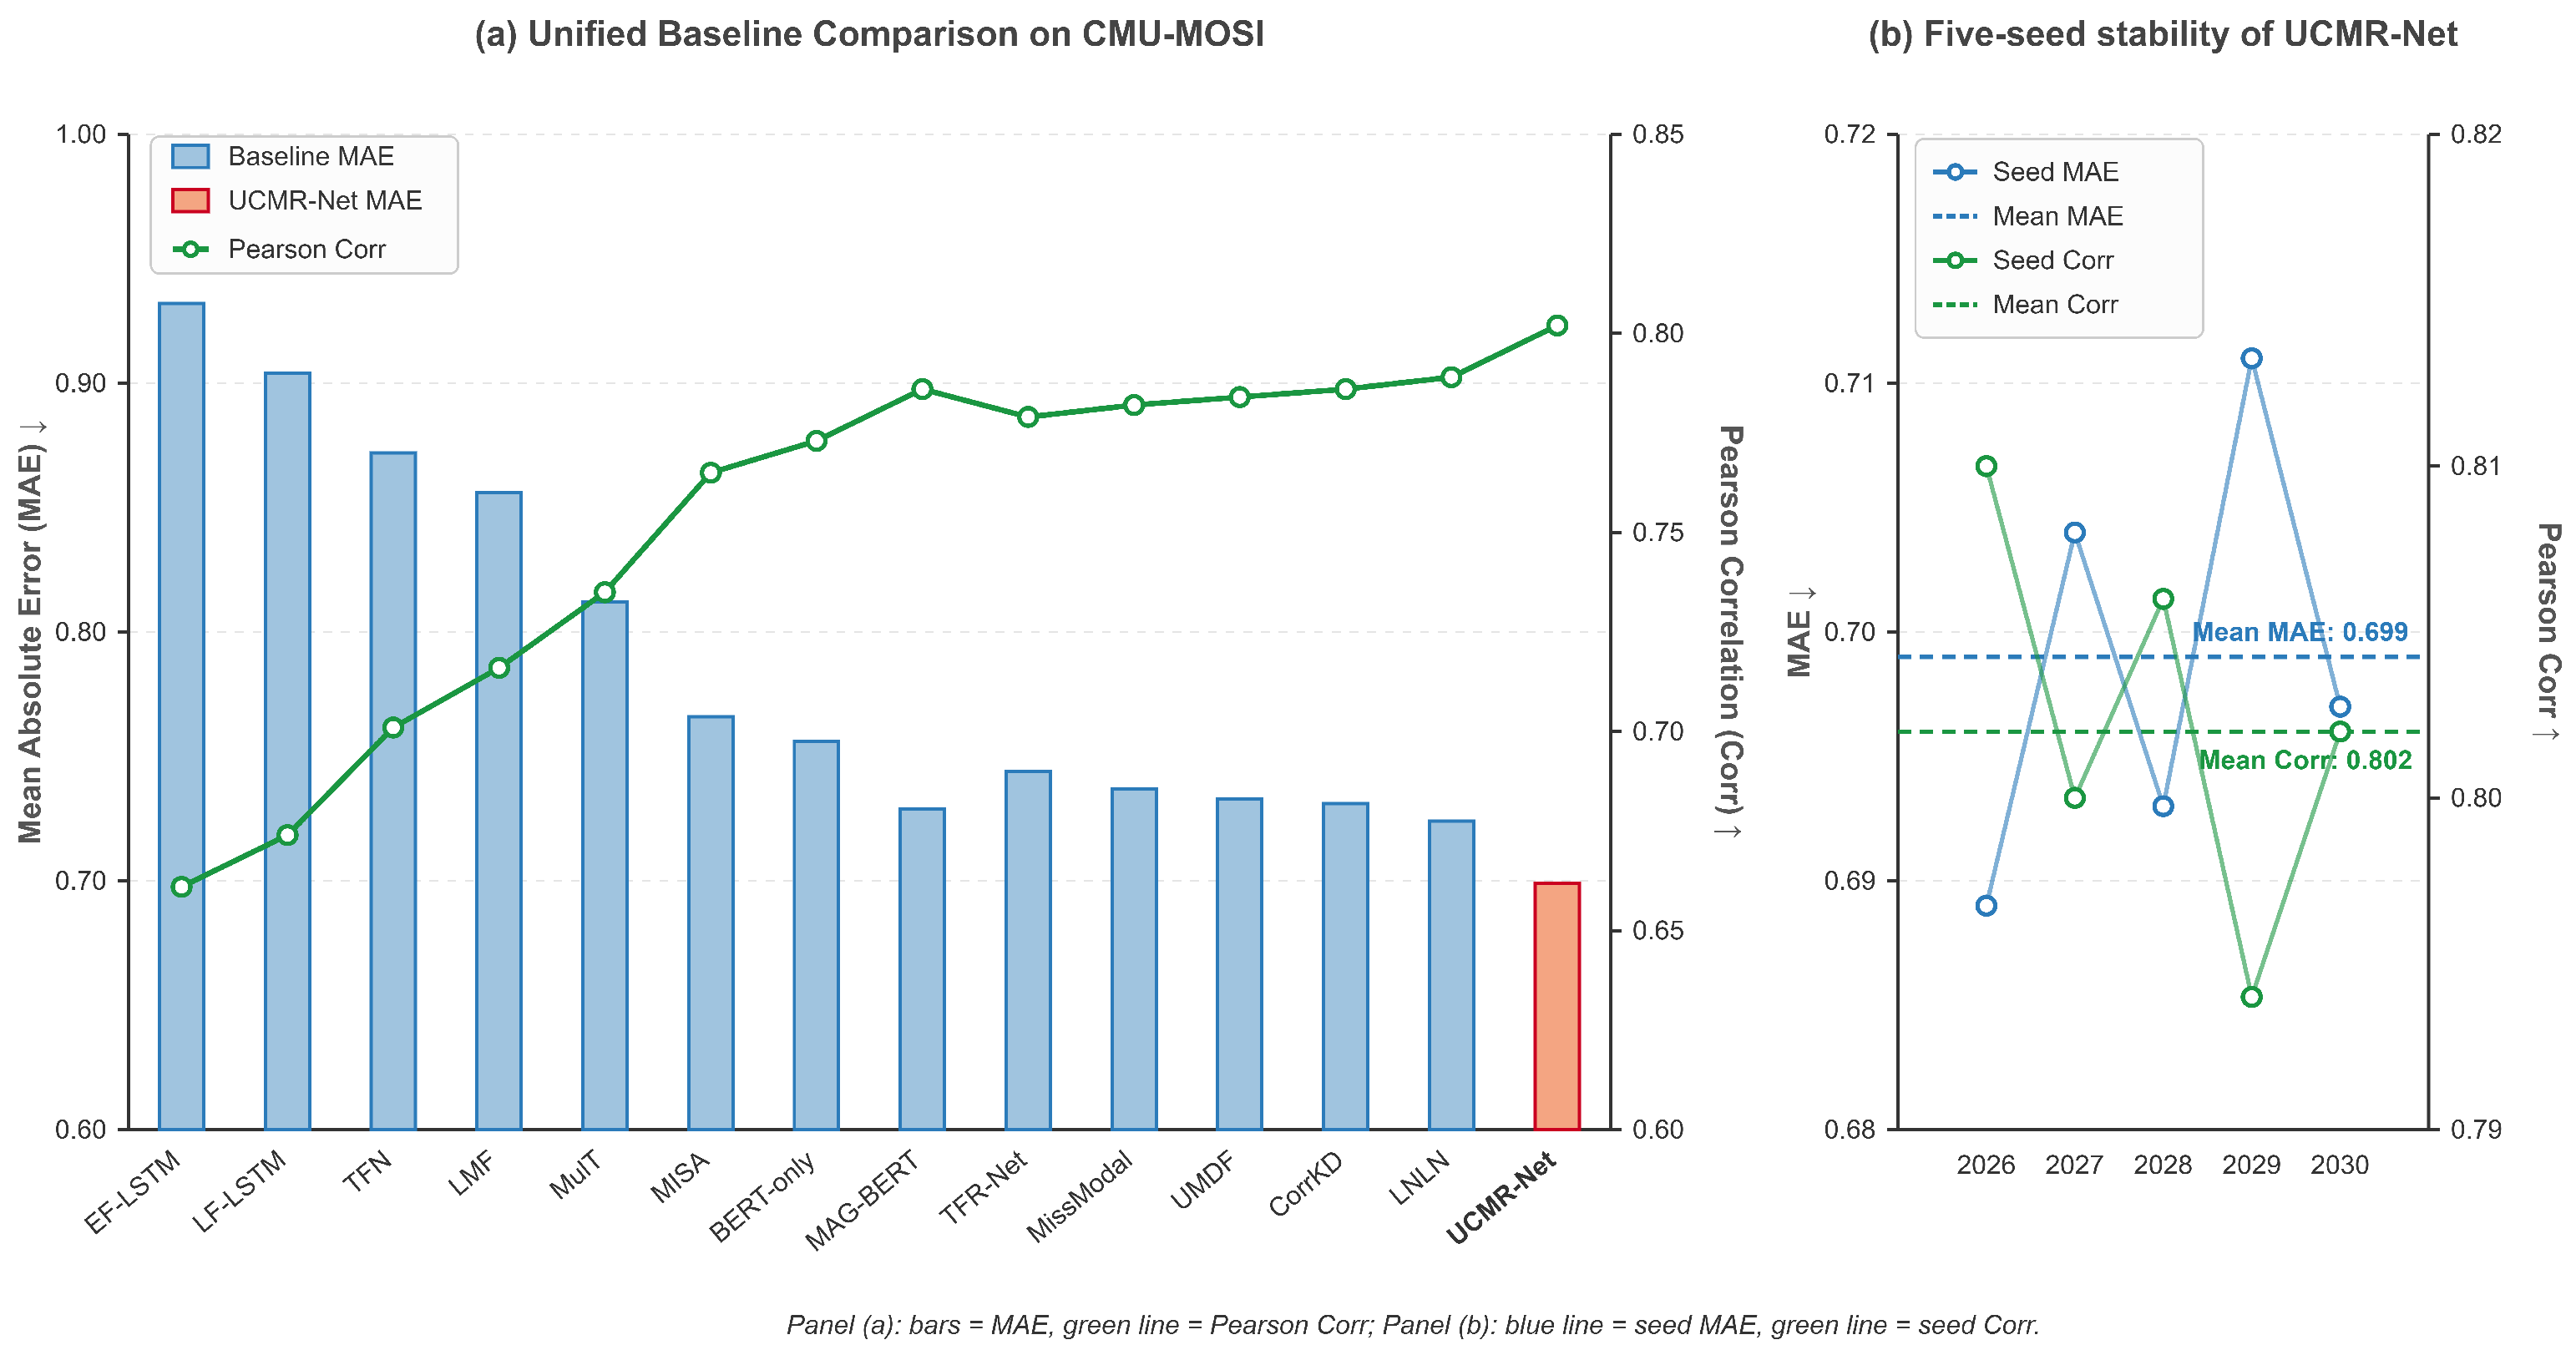
To visualize both model-level comparison and run-to-run stability, Figure 9 presents the MAE/Corr comparison across evaluated baselines and the seed-level variation of UCMR-Net under the five-seed protocol.
Figure 9a shows the baseline comparison, whereas Figure 9b illustrates the seed-level variability of UCMR-Net and the stability of its mean performance across repeated runs.

4.6. Controlled Ablation Study

Table 10 presents the controlled ablation study, with all results reported as mean ± standard deviation across five random seeds. All configurations use the same data split, preprocessing pipeline, training schedule, random seed set, validation-based checkpoint selection rule, and evaluation protocol. Only the investigated component is modified in each ablation.
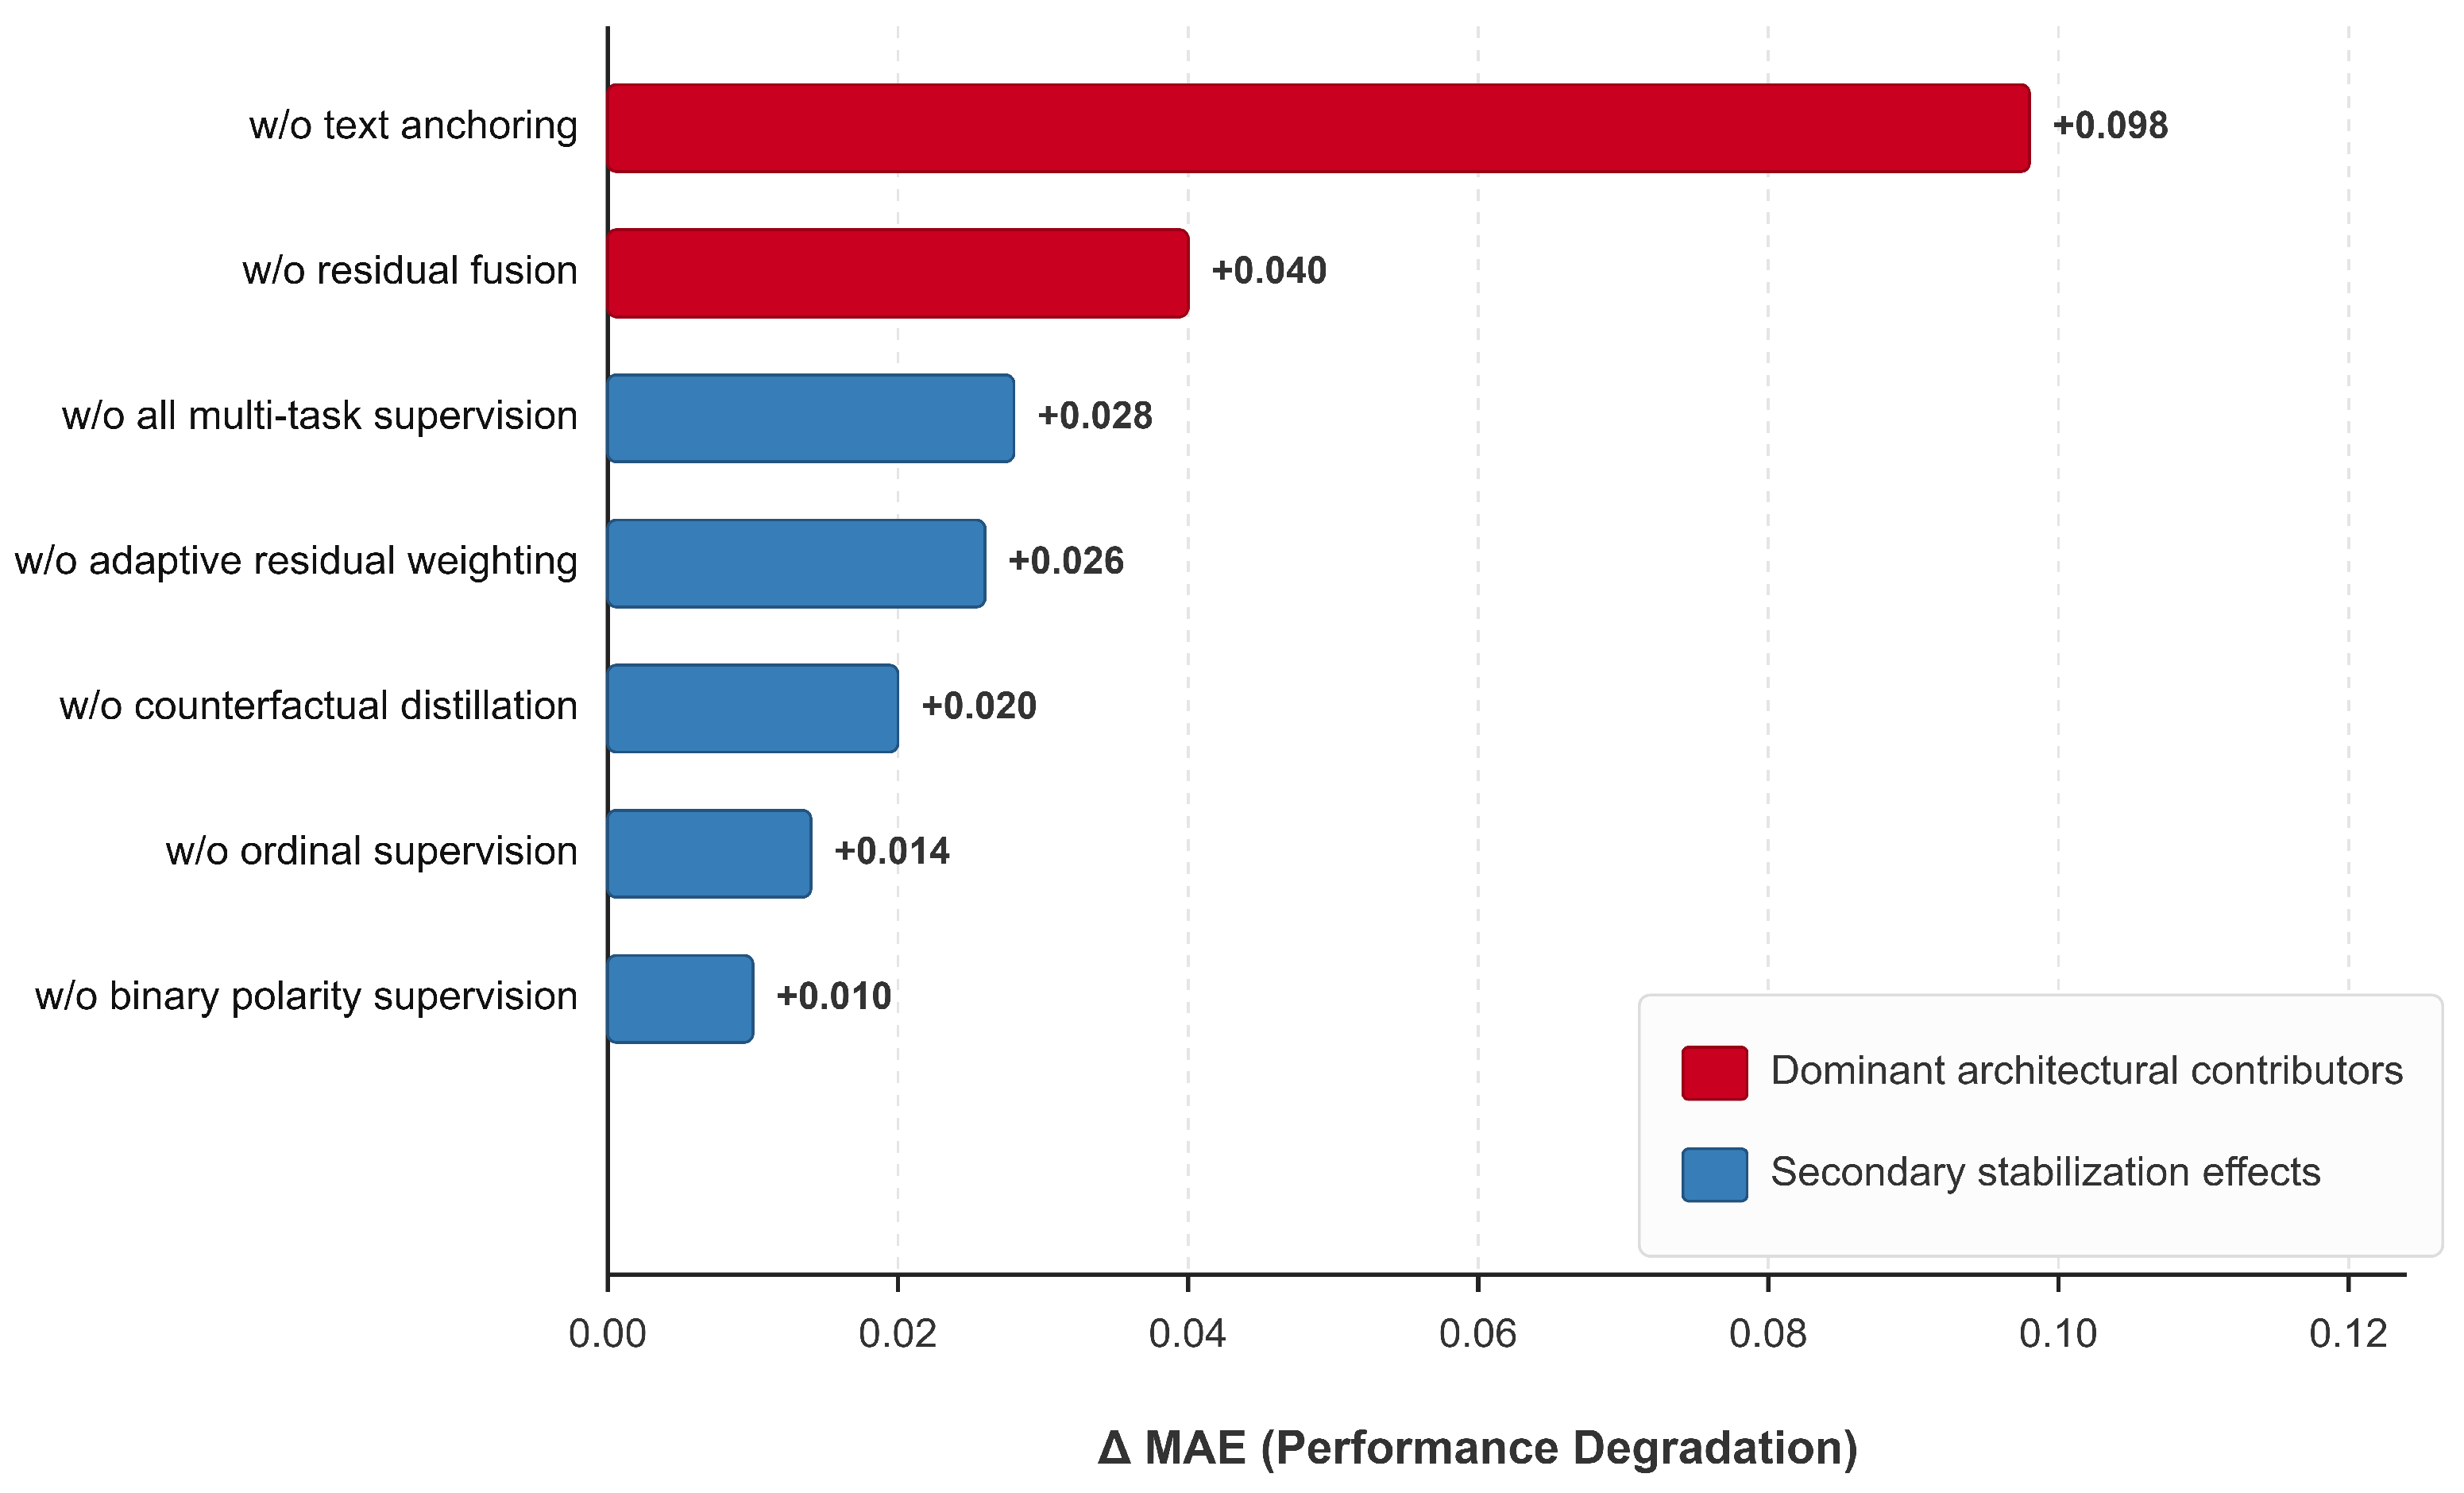
The largest and most consistent degradation is observed when text anchoring is removed, with MAE increasing from 0.699 ± 0.009 to 0.797 ± 0.018. Removing residual fusion produces the second-largest degradation, increasing MAE to 0.739 ± 0.014. Removing adaptive residual weighting, counterfactual distillation, or individual auxiliary supervision components results in smaller but consistent performance decreases. The increased variability of the configuration without text anchoring further suggests that the textual backbone contributes not only to predictive accuracy but also to training stability.
Figure 10 visualizes the delta MAE values from Table 10, making the relative contribution of each component explicit.
The visualization indicates that removing text anchoring produces the largest degradation, followed by residual fusion, whereas adaptive residual weighting and auxiliary objectives provide smaller but consistent contributions.

4.7. Unified Missing-Modality and Random Missing-Rate Analysis

The missing-modality evaluation uses the same trained model family, normalization parameters, ensemble workflow, and metric script as the complete-modality test. As shown in Table 11, the Complete condition matches the main five-seed result, ensuring that complete and incomplete input settings are compared under an aligned evaluation pipeline.
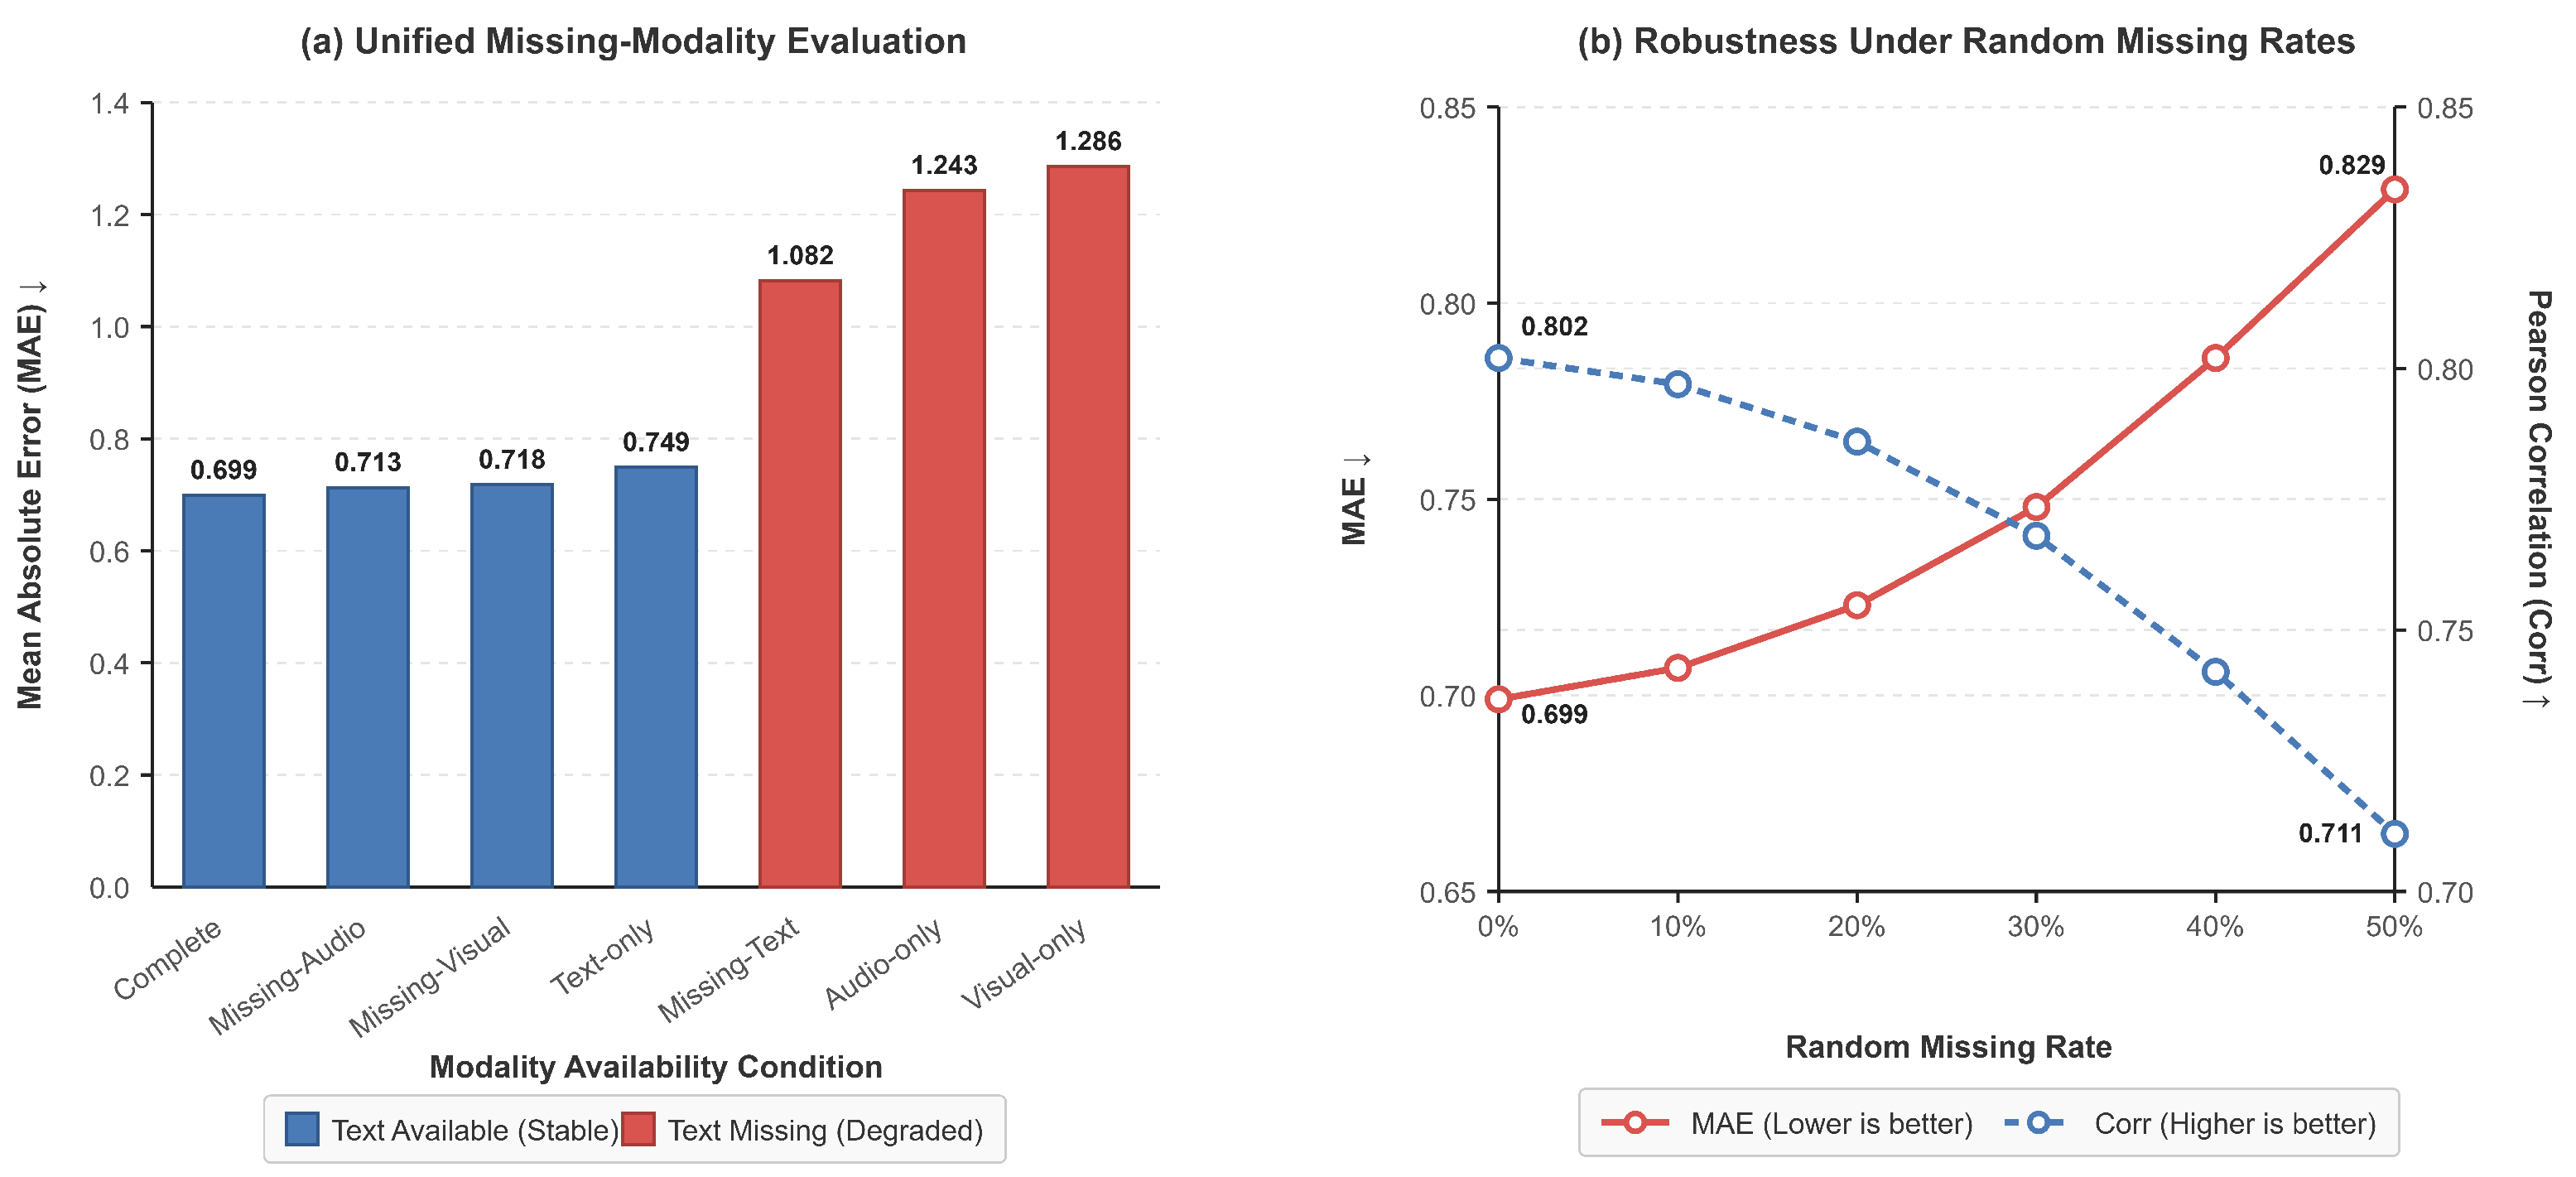
Performance remains close to the complete-input result when audio or visual information is removed, but it decreases substantially when text is unavailable. This pattern supports a cautious conclusion: UCMR-Net is robust to the absence of nonverbal streams to a moderate extent, but it is not a modality-symmetric missing-modality model.
To further examine robustness under stochastic input degradation, Table 12 reports random missing rates from 10% to 50%. Performance decreases gradually as the missing rate increases, with MAE rising from 0.699 at 0% missing rate to 0.829 at 50% missing rate and Corr decreasing from 0.802 to 0.711.
Figure 11 summarizes the unified missing-modality and random missing-rate analyses by combining the single-modality removal results with the random missing-rate trend.
The visualization shows smooth degradation under random missingness and a substantially larger performance drop when the textual stream is unavailable.

4.8. Calibration, Residual Reliability, and Modality Corruption Analysis

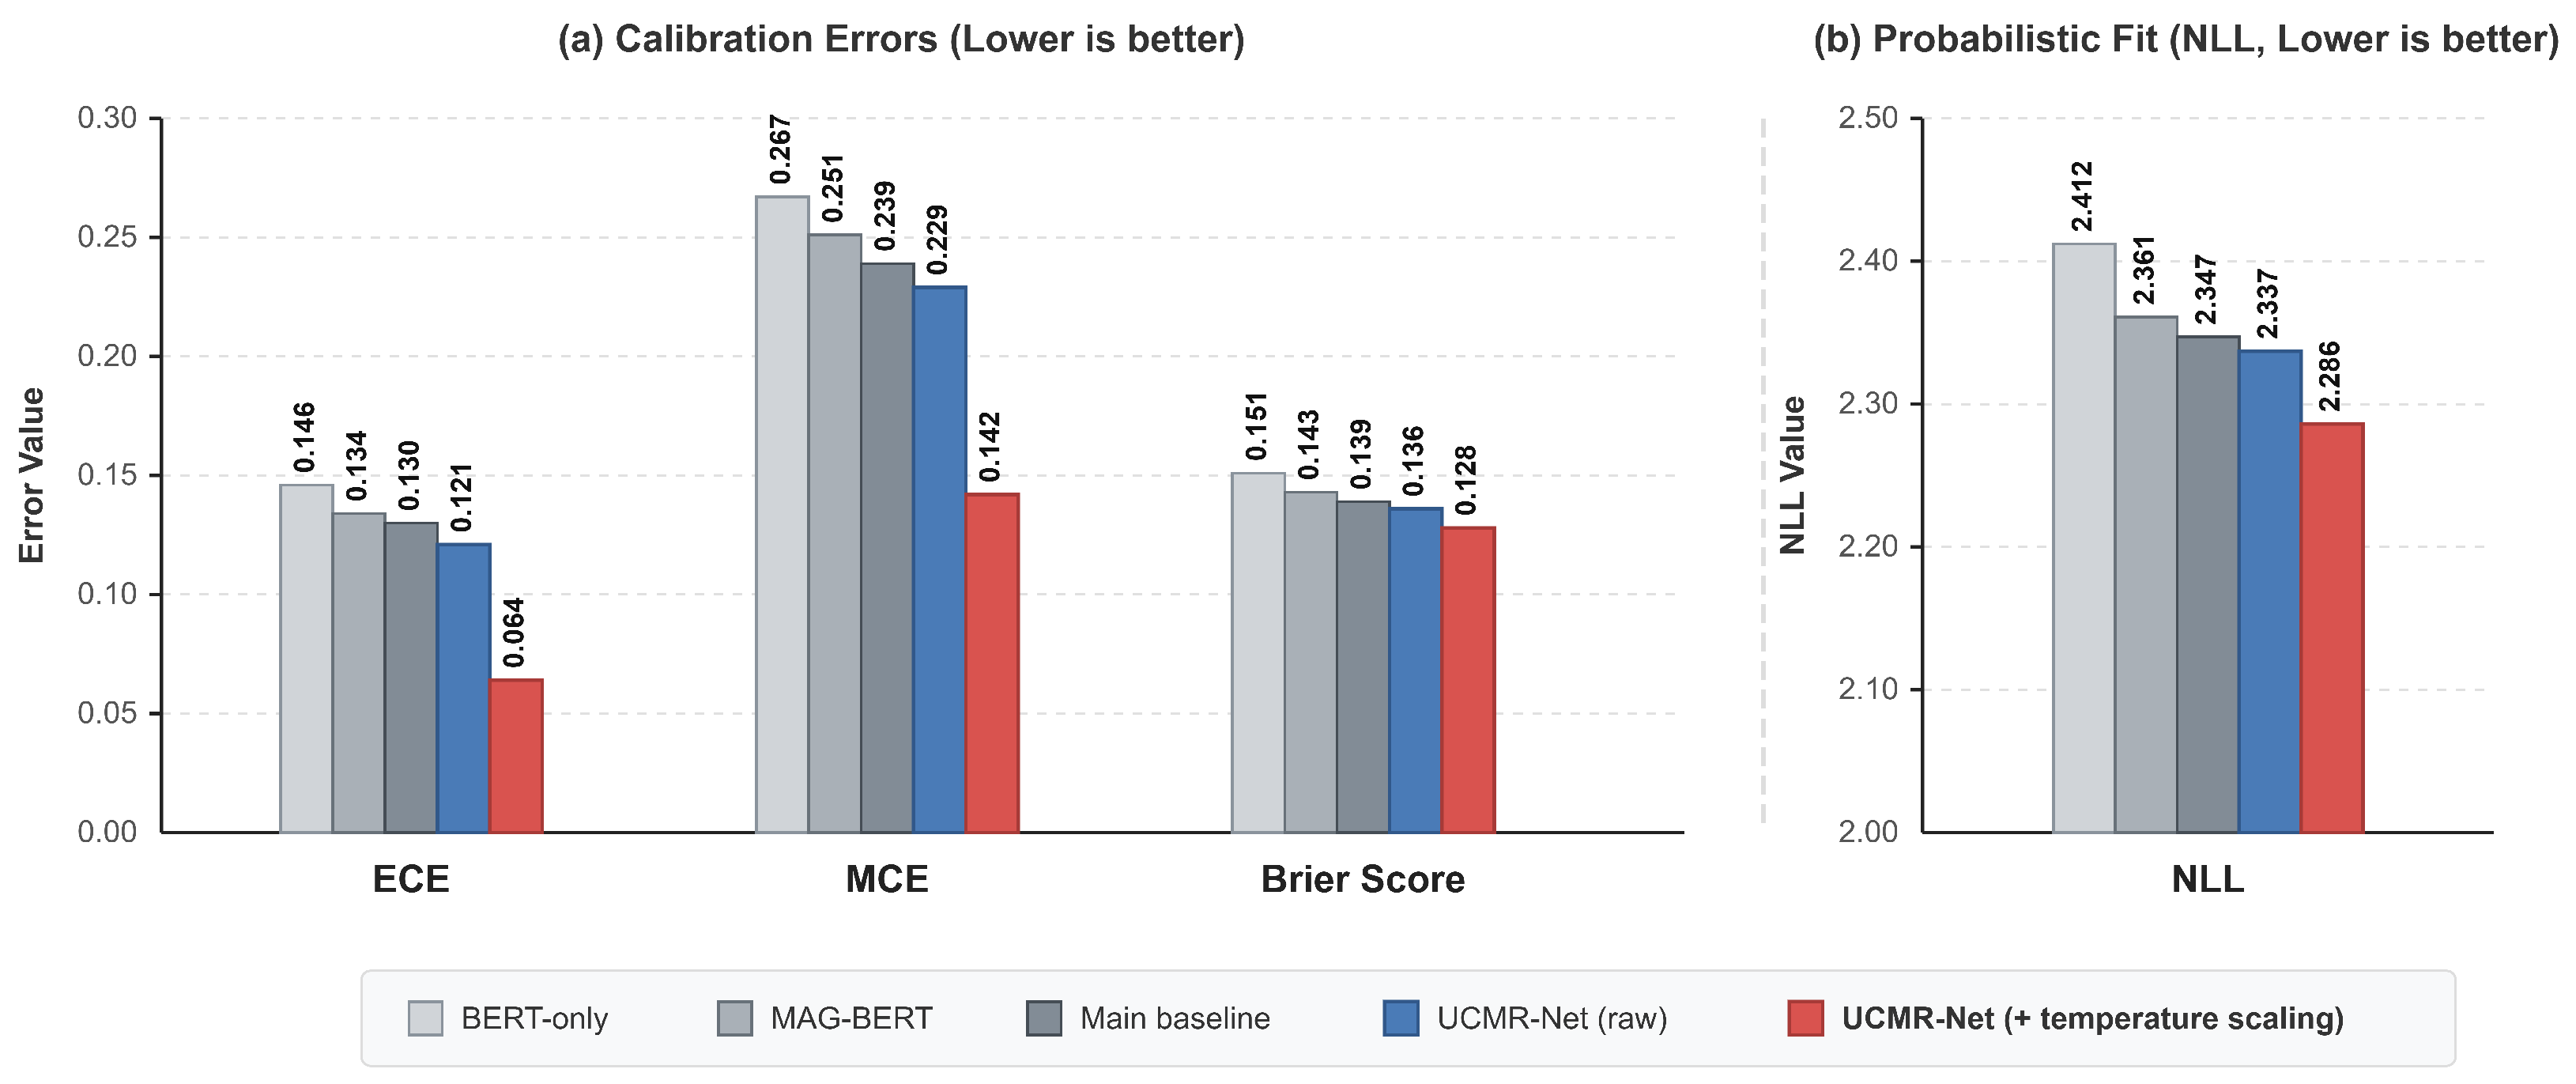
The calibration results indicate that raw UCMR-Net provides only limited calibration improvement over the main baseline in ECE, MCE, Brier score, and NLL, and these differences are insufficient to support a claim of comprehensive probabilistic calibration. Table 13 therefore reports both raw and temperature-scaled calibration metrics.
After post-hoc temperature scaling, ECE decreases from 0.121 to 0.064, MCE from 0.229 to 0.142, Brier score from 0.136 to 0.128, and NLL from 2.337 to 2.286. These results indicate improved post-hoc calibration, while the raw residual reliability score should not be interpreted as a complete uncertainty estimator.
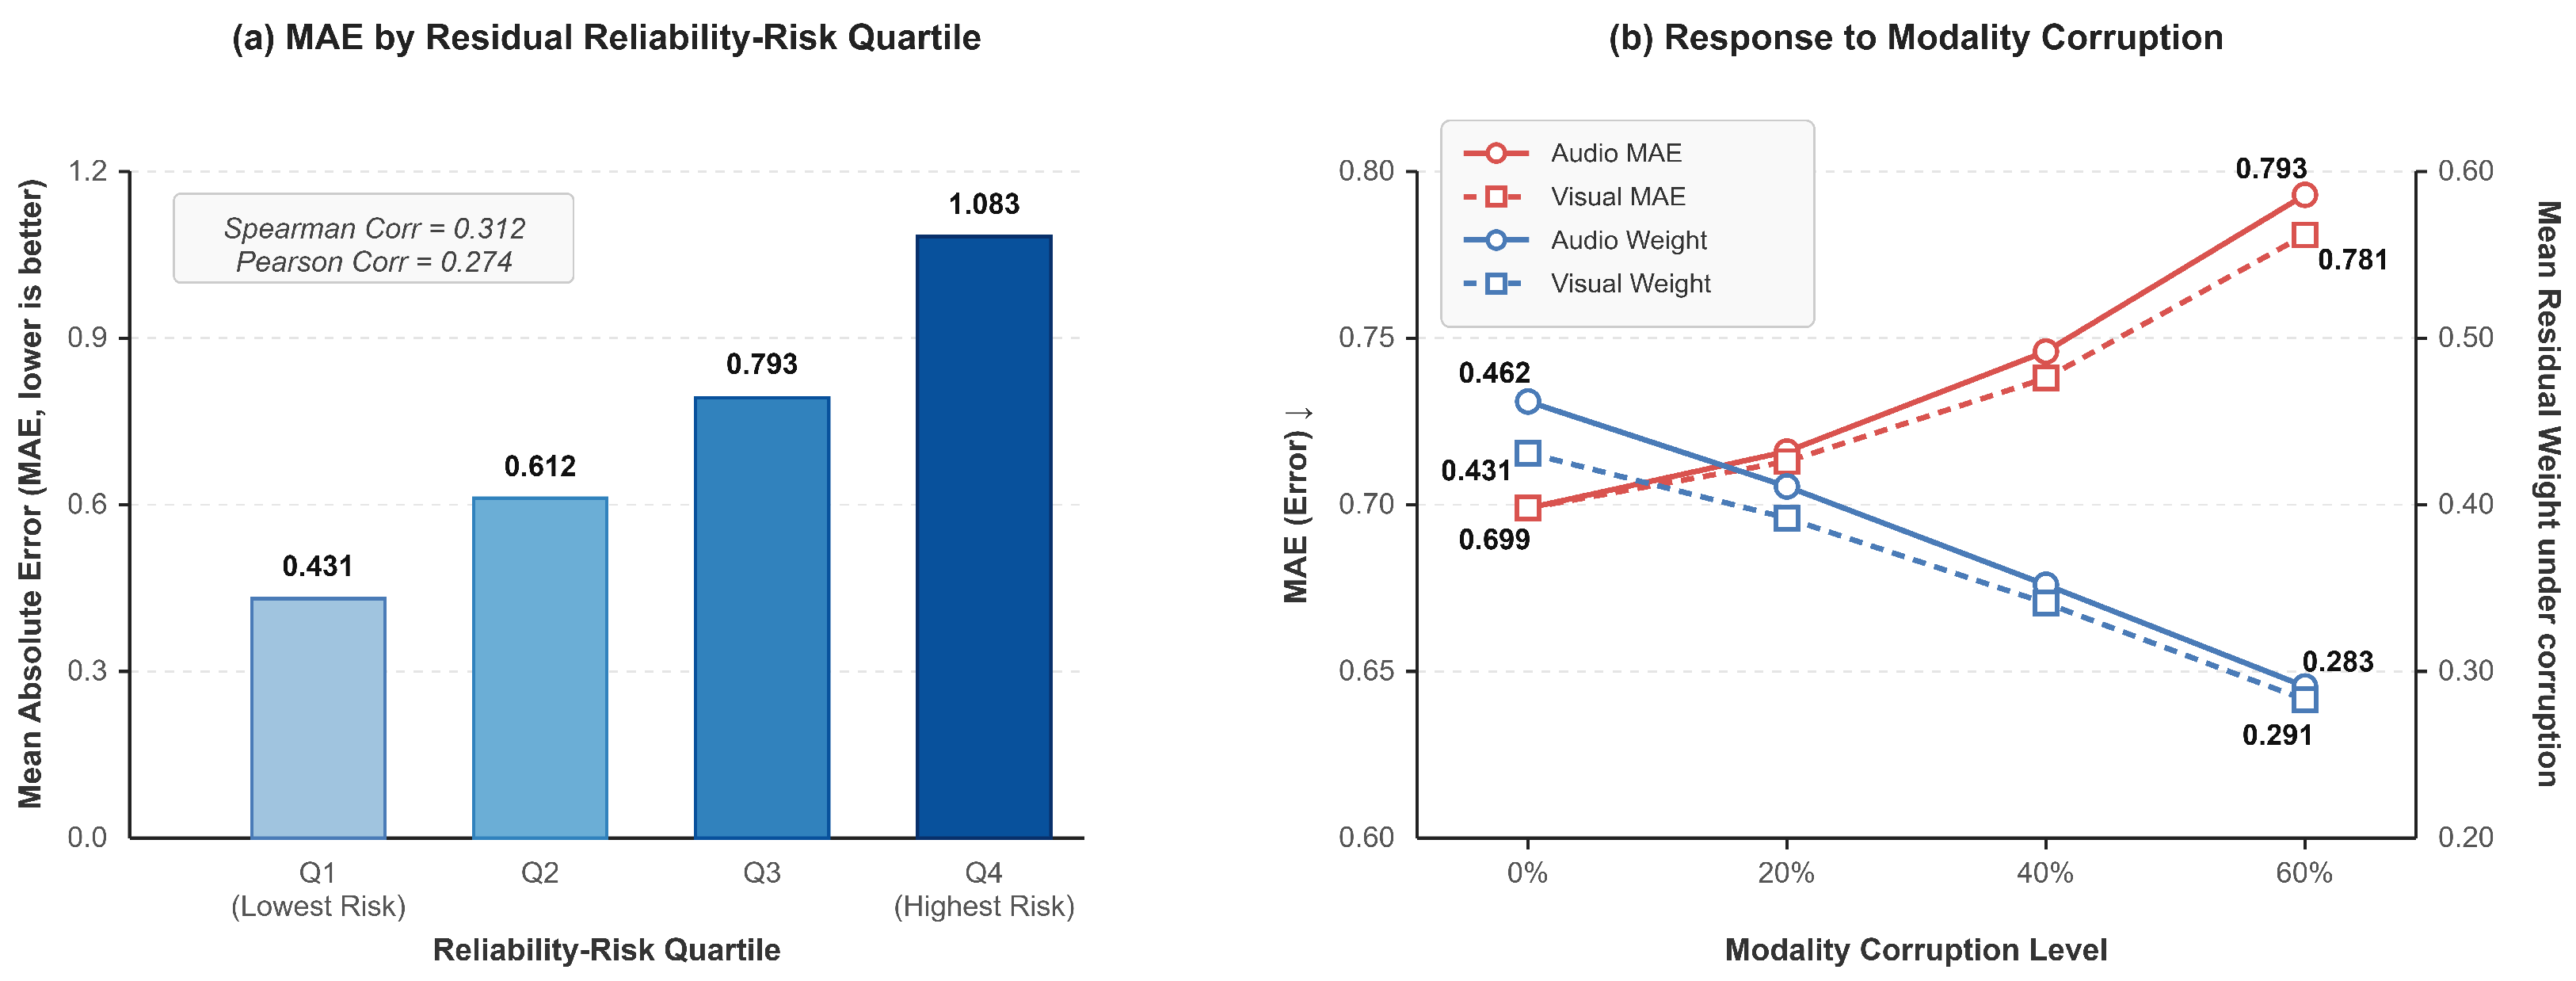
Table 14 further examines whether the residual reliability-risk score is related to prediction error. The positive Spearman and Pearson correlations indicate that larger risk scores tend to accompany larger absolute errors, and the quartile analysis shows a clear increase in MAE from the lowest to the highest reliability-risk group.
To test whether the learned residual weights respond to degraded modality quality, Table 15 reports audio and visual corruption results. As corruption increases, MAE and RMSE increase while the corresponding mean residual weight decreases, suggesting that adaptive residual weighting responds to lower nonverbal reliability.
To further interpret the calibration and reliability analyses, Figure 12 visualizes the confidence calibration behavior of raw UCMR-Net and temperature-scaled UCMR-Net, while Figure 13 presents the empirical behavior of the residual reliability-risk score by combining error stratification across reliability-risk quartiles with residual-weight responses under audio and visual corruption.
The reliability diagram shows that post-hoc temperature scaling improves the alignment between predicted confidence and empirical accuracy, whereas raw UCMR-Net outputs remain less well calibrated.
The observed quartile and corruption patterns support the interpretation of the learned score as a residual reliability controller, because higher reliability-risk scores are associated with larger errors and corrupted nonverbal streams receive lower residual weights.

4.9. CMU-MOSEI External Validation and Transfer Analysis

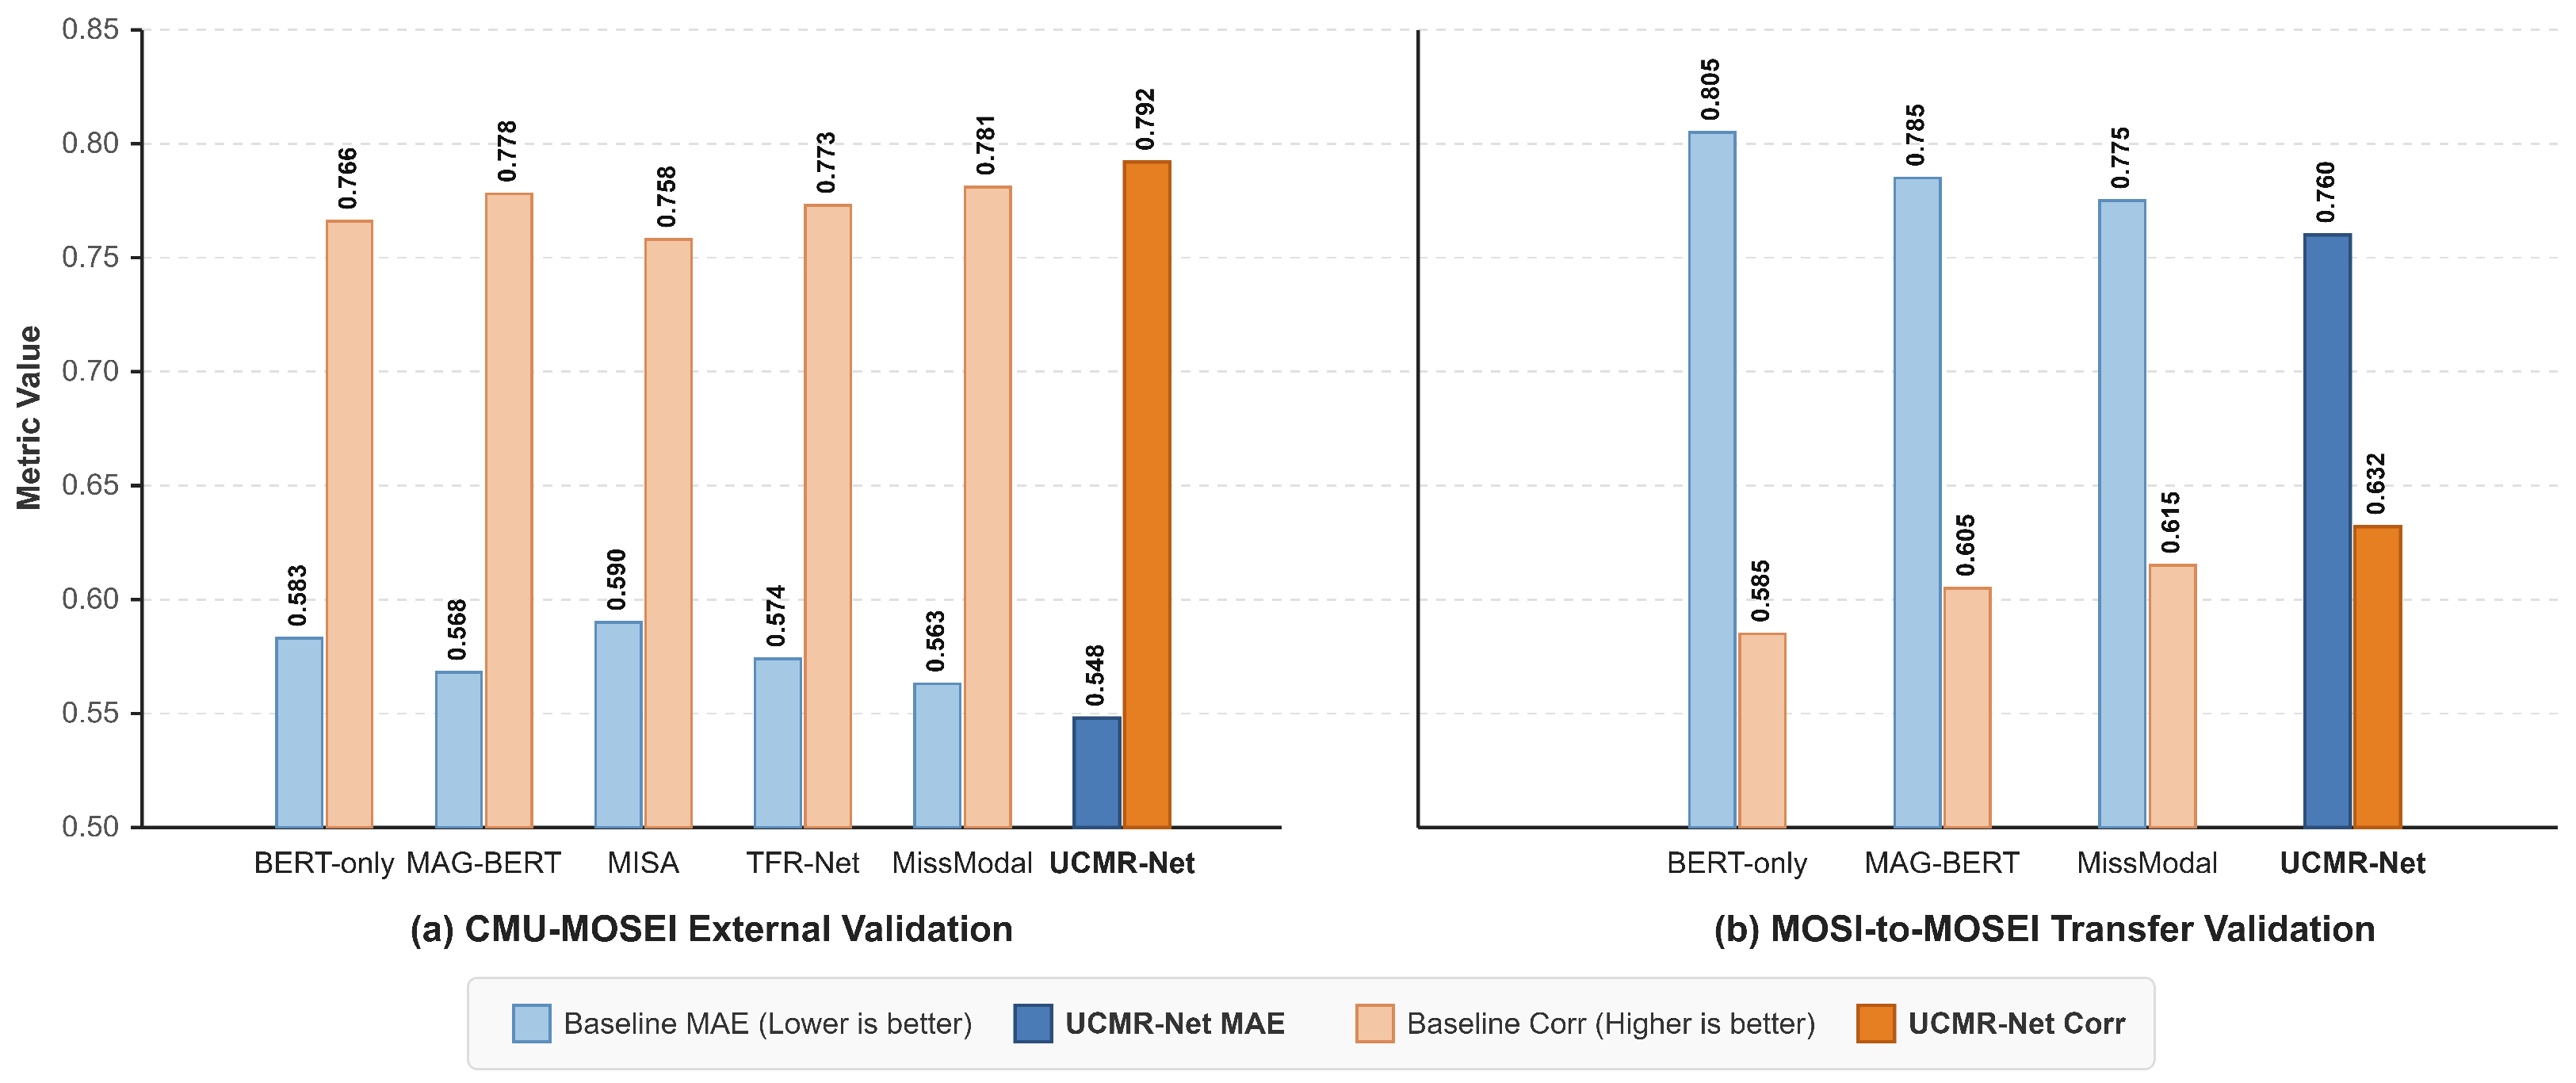
To evaluate whether the proposed text-anchored residual fusion strategy generalizes beyond CMU-MOSI, we further conducted experiments on the CMU-MOSEI dataset [35]. Table 16 reports the standard CMU-MOSEI validation results under the same metric definitions.
Under the standard CMU-MOSEI training/validation/test setting, UCMR-Net achieves MAE = 0.548, RMSE = 0.752, Corr = 0.792, Acc-2 = 85.80%, and F1 = 85.50%, outperforming the evaluated baselines in regression metrics.
Table 17 reports a stricter MOSI-to-MOSEI transfer setting. As expected, all models show degraded performance under cross-dataset transfer, but UCMR-Net remains the strongest among the compared models.
Figure 14 presents a visual comparison of the standard CMU-MOSEI validation results and the MOSI-to-MOSEI transfer results, highlighting both in-domain external validation and cross-dataset transfer degradation.
The visualization indicates that UCMR-Net remains competitive on CMU-MOSEI, whereas the MOSI-to-MOSEI transfer setting shows a larger performance degradation than the standard in-domain evaluation.

4.10. Error Distribution and Qualitative Case Analysis

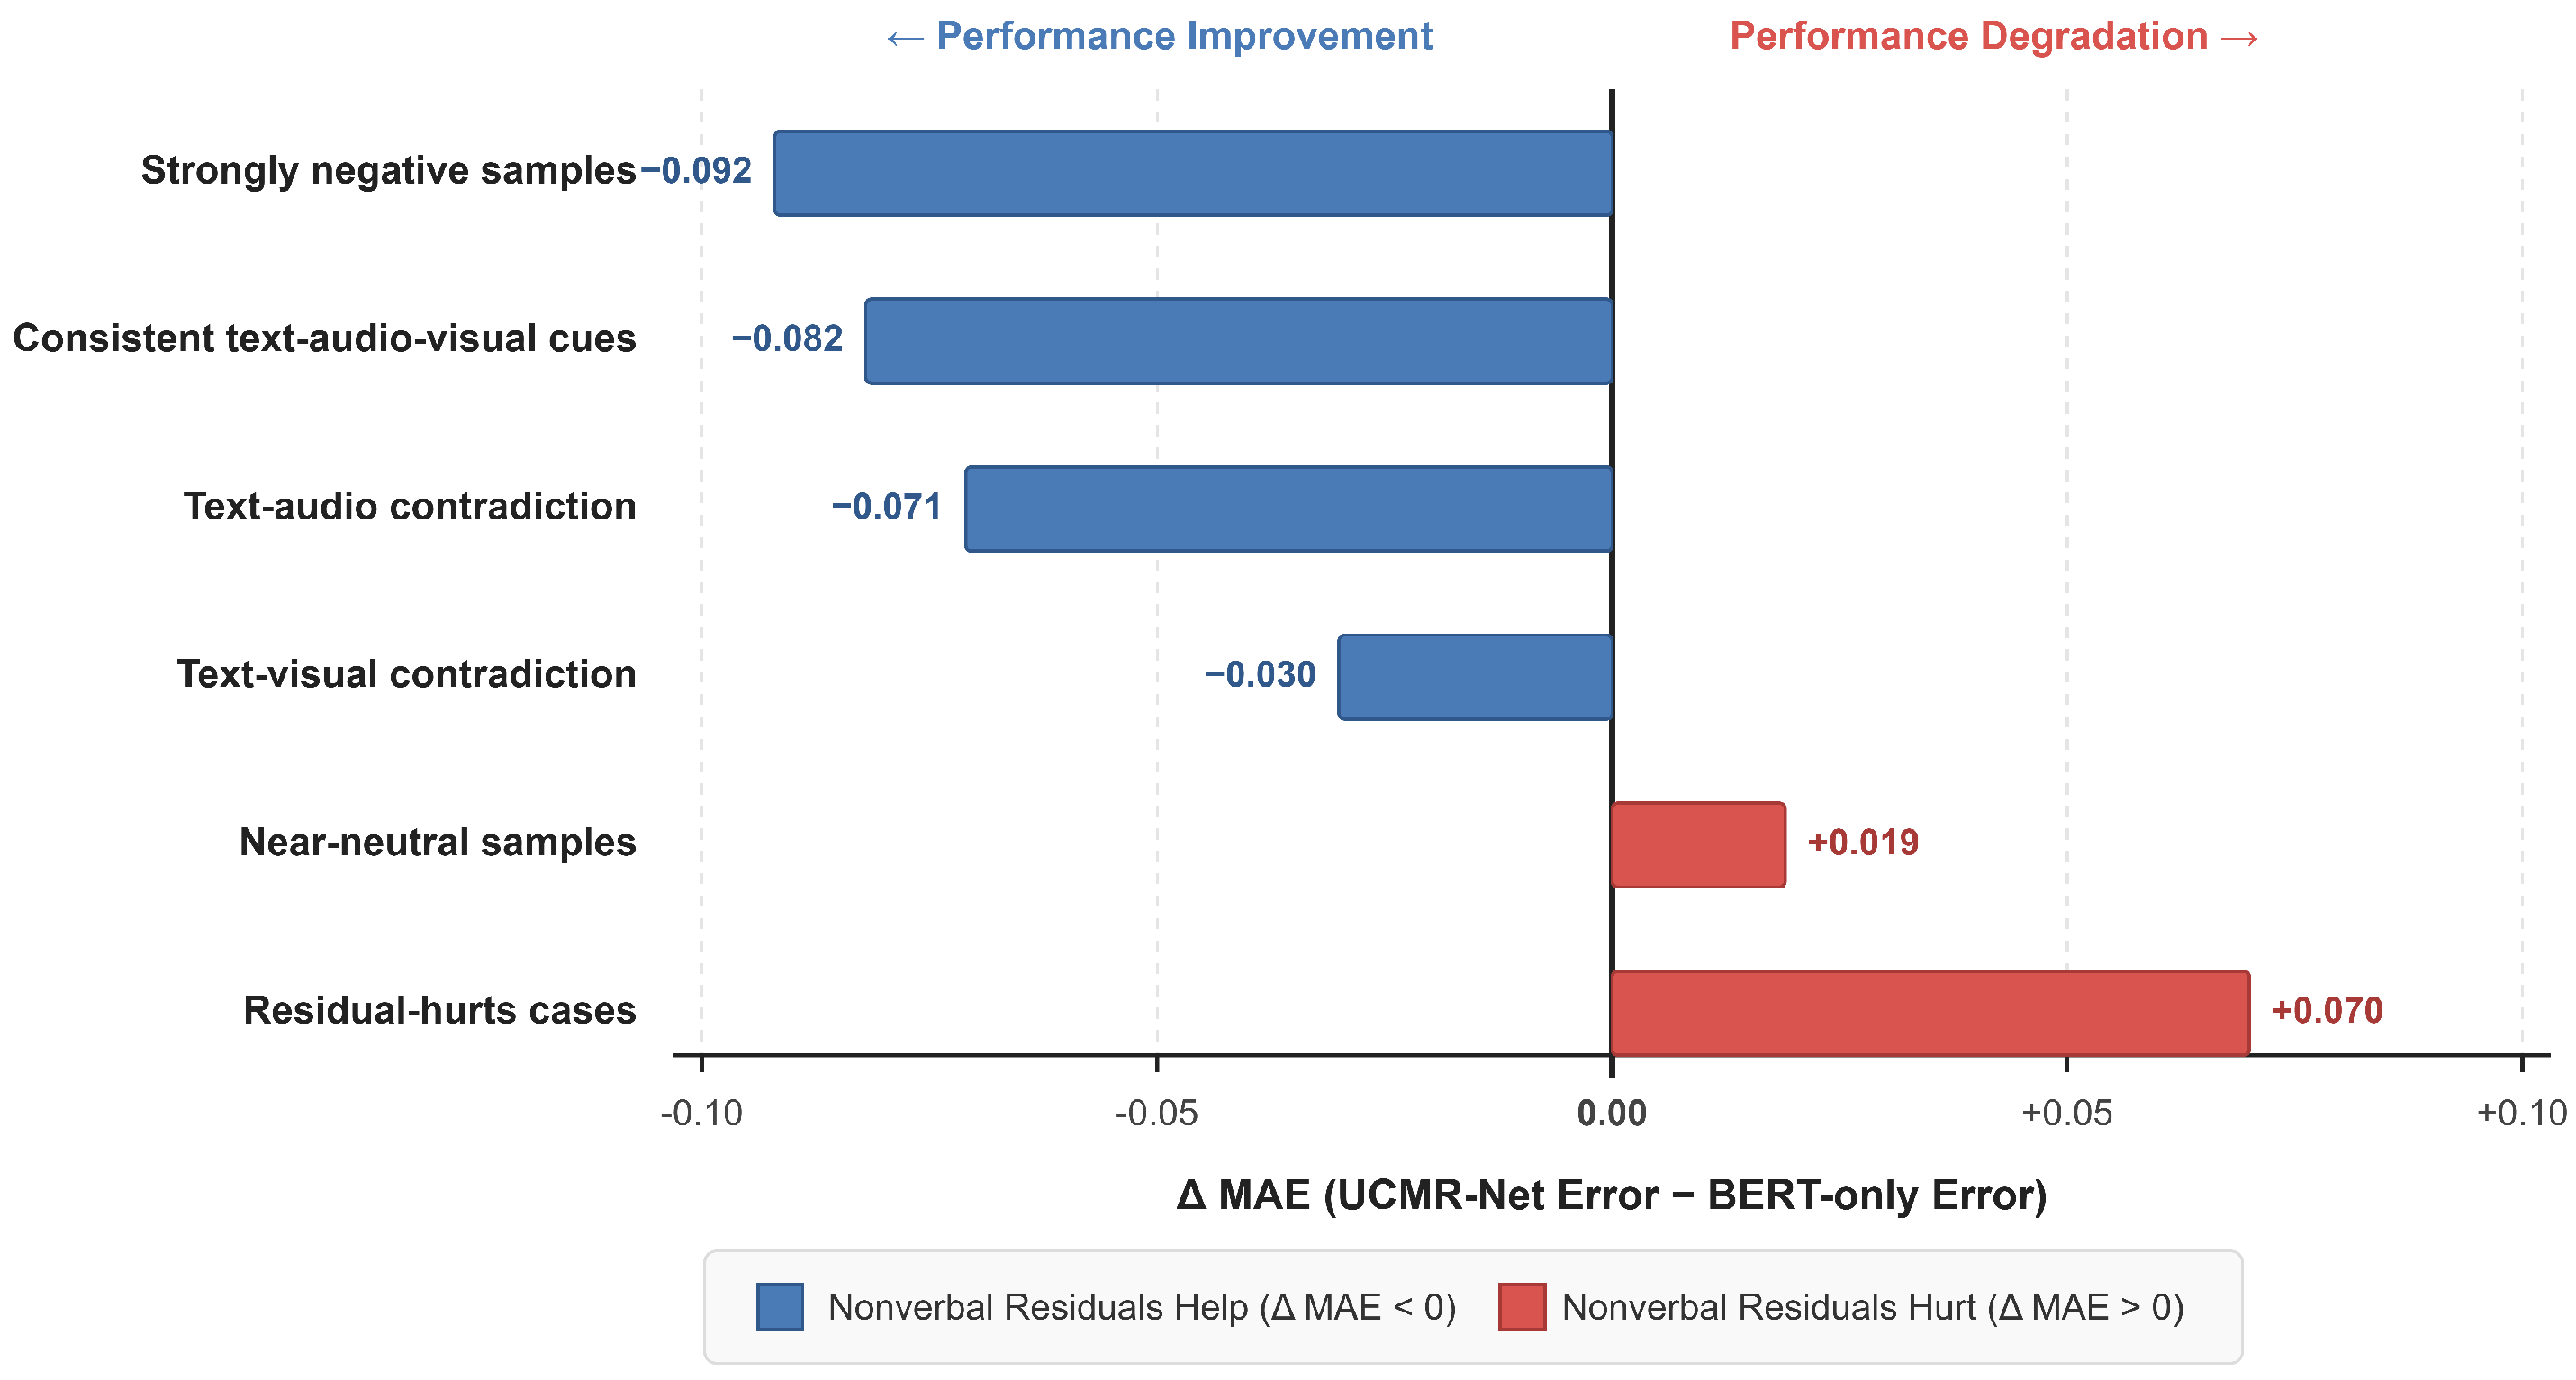
A qualitative case analysis was conducted to examine when nonverbal residuals help or harm text-based prediction. Table 18 summarizes representative subsets covering consistent cues, modality contradiction, strongly negative samples, near-neutral samples, and cases where residual correction hurts performance.
UCMR-Net reduces MAE most clearly when text, audio, and visual cues are consistent and for strongly negative samples, indicating that nonverbal residuals can strengthen or correct the text-based estimate. However, near-neutral boundary samples and residual-hurts cases remain difficult: in these subsets, nonverbal residuals may introduce additional ambiguity or over-correct the textual anchor.
Figure 15 visualizes delta MAE across qualitative subsets with signed bars, showing when residual fusion improves or degrades prediction performance.
The signed-bar pattern illustrates a practical model boundary: nonverbal residuals are beneficial in several cue-consistent or strongly negative cases, but they are not uniformly helpful across all sentiment conditions.
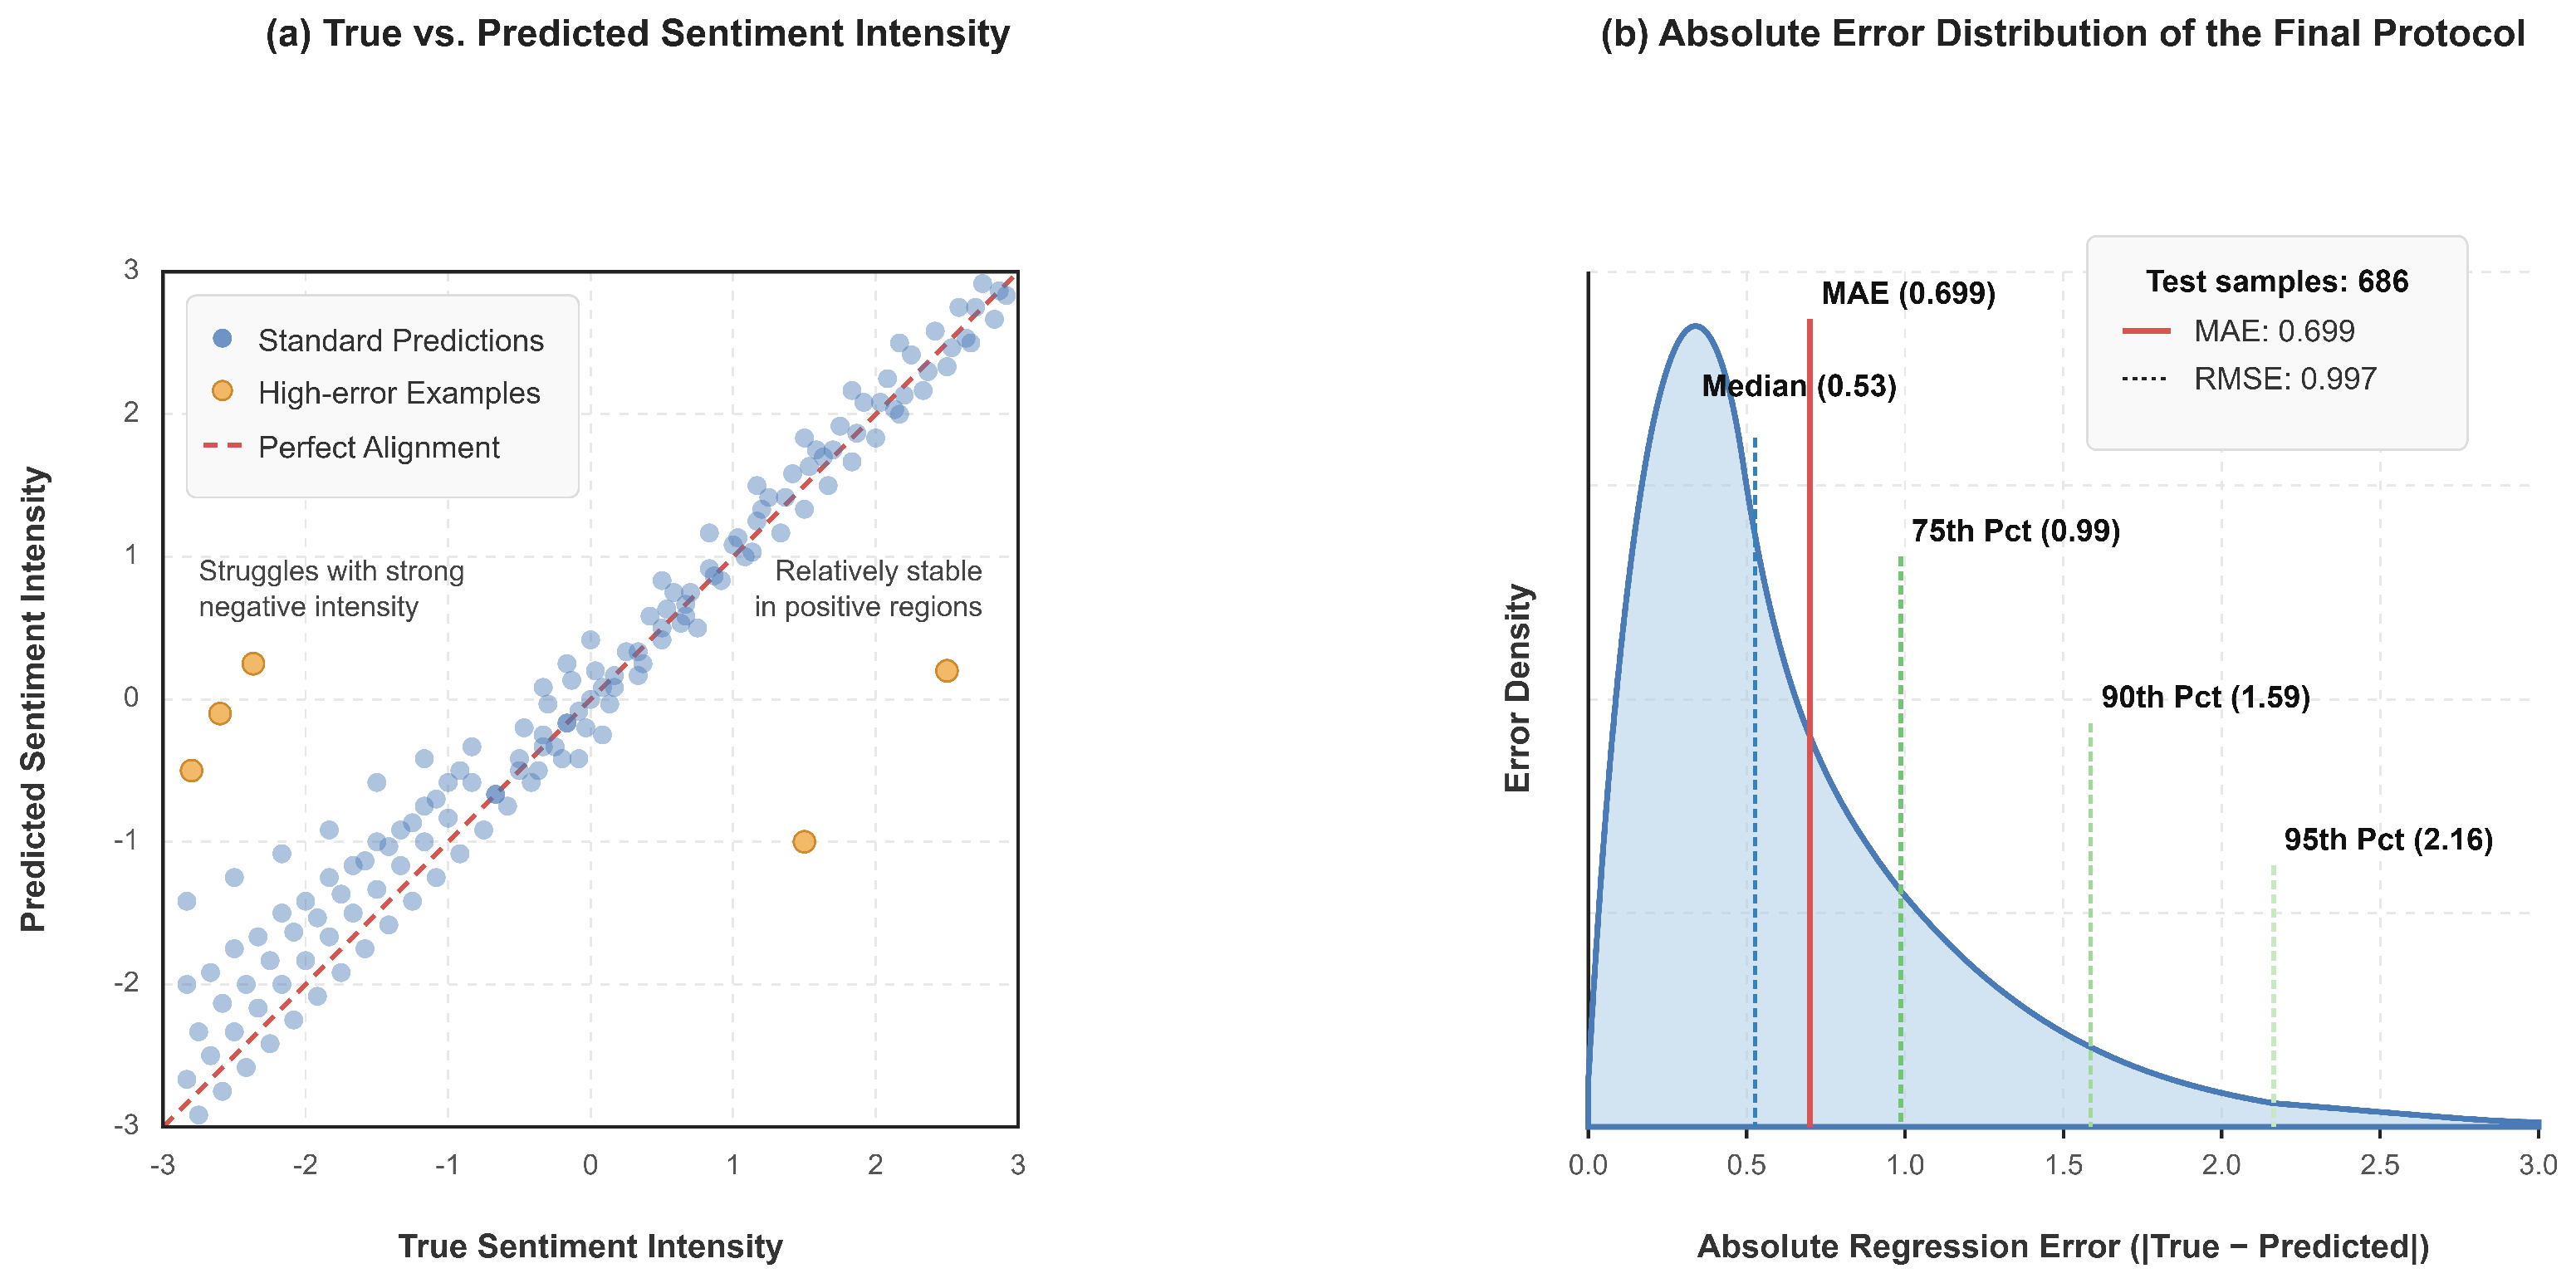
Table 19 summarizes the prediction error distribution under the five-seed evaluation protocol. The percentile-level absolute errors characterize the remaining sample-level difficulty and link the aggregate metrics with the qualitative error cases.
To complement the percentile-level error statistics, Figure 16 presents the sample-level prediction analysis and absolute-error distribution under the five-seed evaluation protocol.
The visualization shows where remaining errors concentrate and provides a sample-level counterpart to the qualitative subsets in Table 18.

4.11. Sentiment-Intensity Interval Analysis

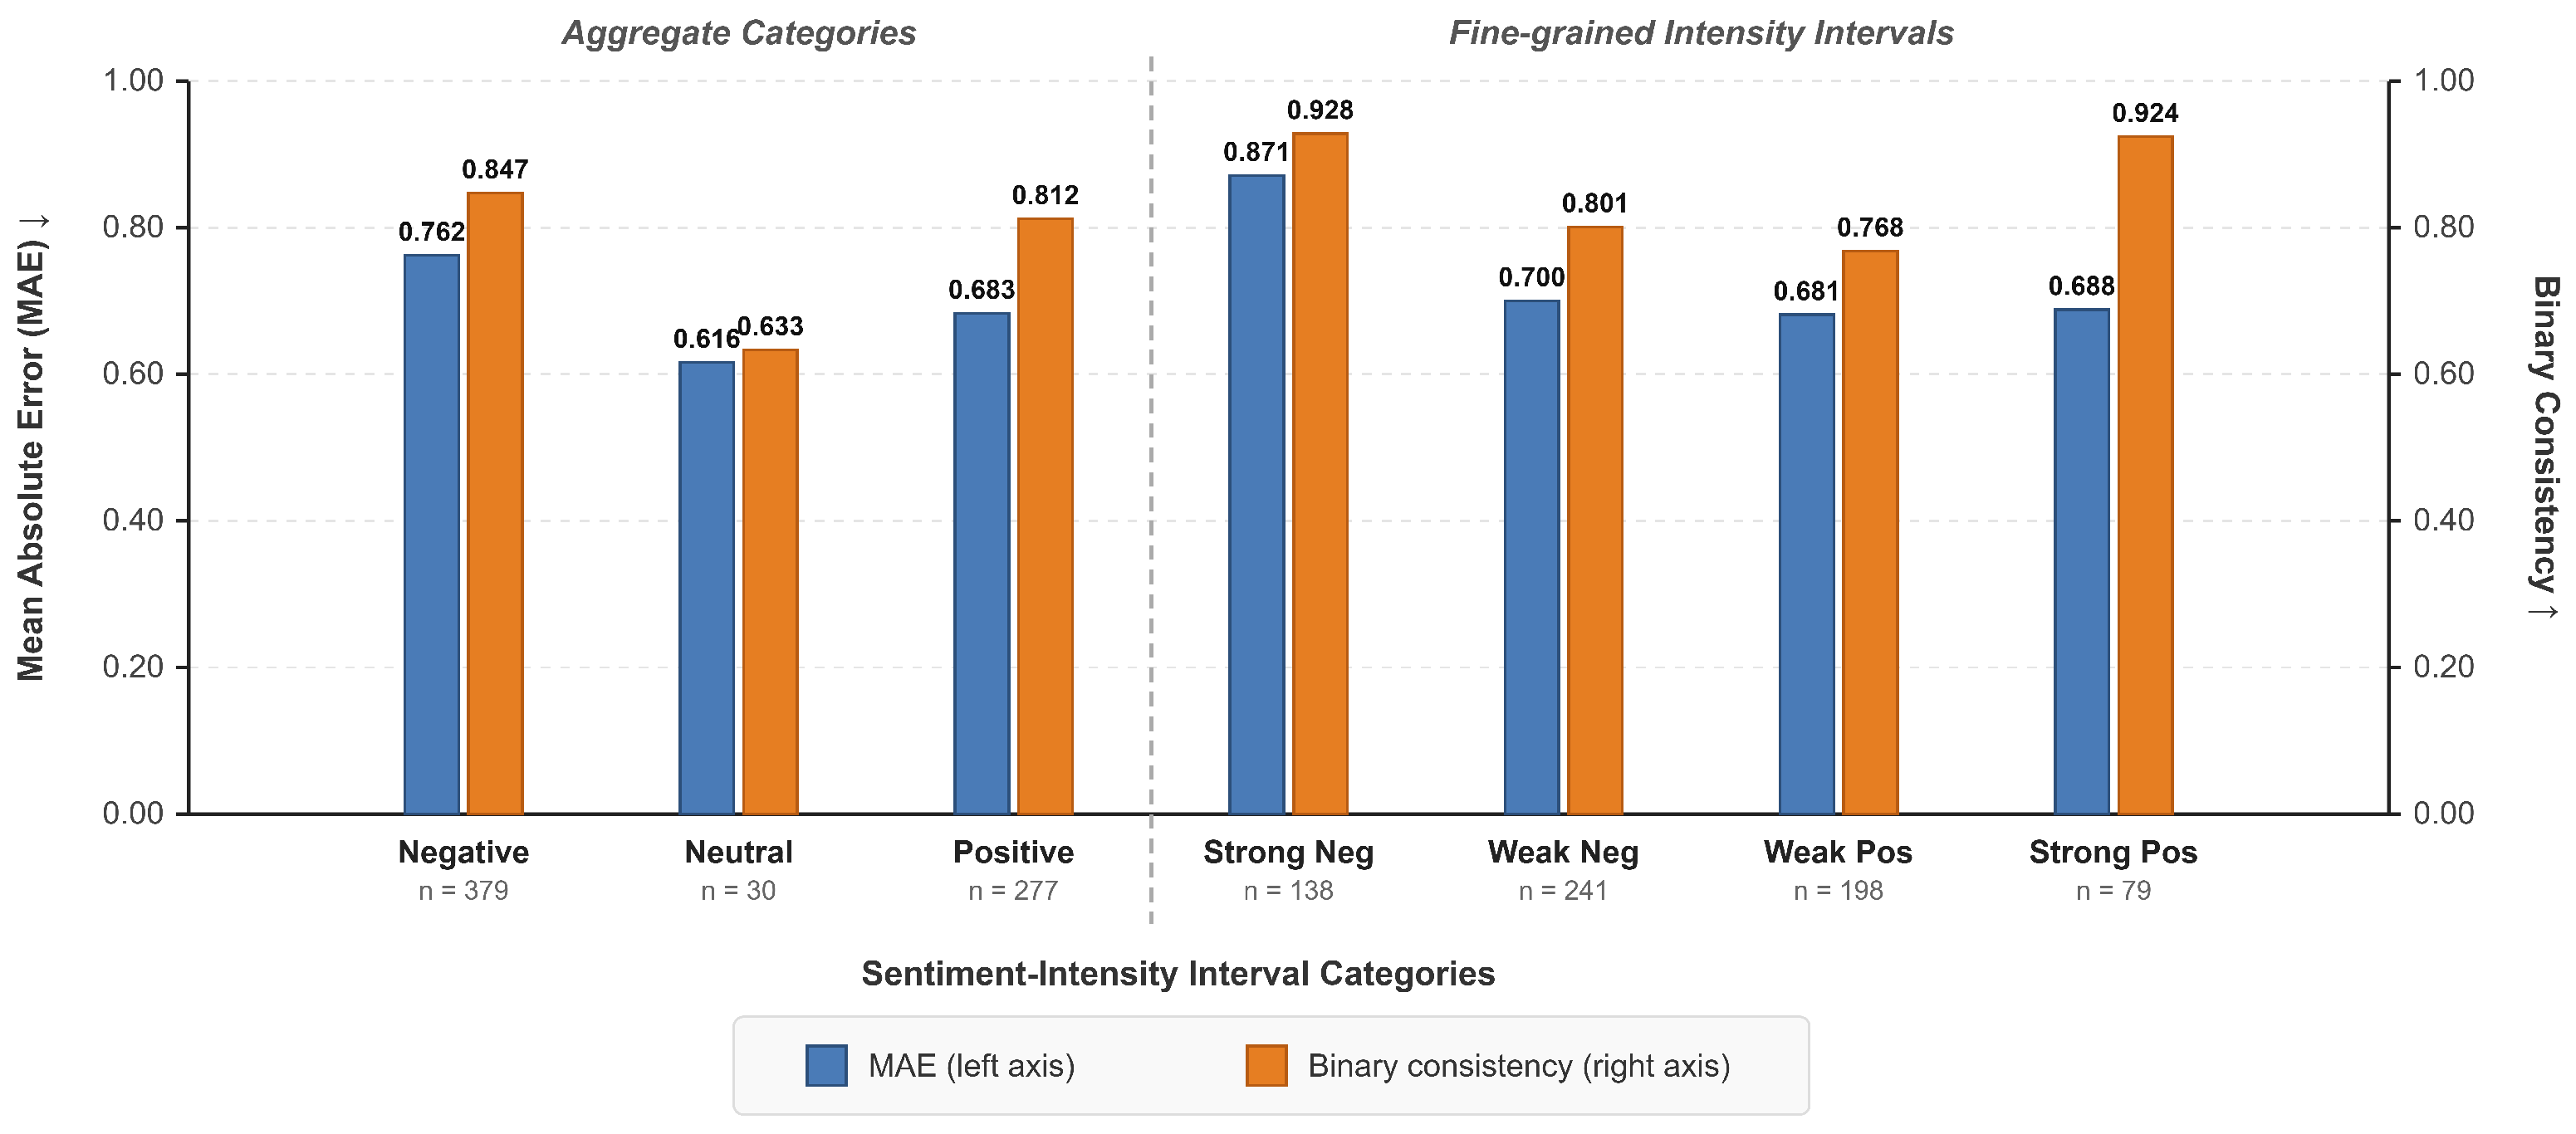
To further examine whether the model behaves differently across sentiment regions, the test samples are divided into negative, neutral, positive, strong-negative, weak-negative, weak-positive, and strong-positive intervals. Table 20 reports interval-wise MAE and binary consistency scores.
The interval analysis indicates that UCMR-Net is relatively stable in positive sentiment regions but still struggles with strongly negative sentiment intensity. The neutral category has the smallest number of samples and the lowest binary consistency, which is expected because polarity boundaries around zero are inherently ambiguous.
Figure 17 compares interval-wise MAE and binary consistency across sentiment regions, allowing the intensity-estimation and polarity-consistency patterns to be examined together.
The interval-wise visualization indicates that strong-negative and near-neutral regions remain important sources of residual error despite strong aggregate performance.

4.12. Summary of Experimental Findings

The experiments support four main conclusions. First, UCMR-Net achieves strong complete-modality regression performance on CMU-MOSI under a five-seed protocol, with MAE = 0.699 ± 0.009 and Corr = 0.802 ± 0.006 (mean ± SD). Second, the unified baseline comparison and paired tests provide the primary evidence for regression improvements over strong baselines; the Corr comparison with LNLN at p = 0.044 is treated as secondary evidence, and the binary polarity gains are not statistically significant. Third, the controlled ablation study shows that removing text anchoring causes the largest degradation, while removing residual fusion produces the second-largest degradation. Fourth, the unified missing-modality experiments show an asymmetric robustness pattern: the model remains comparatively stable when audio or visual streams are removed, but performance degrades substantially when text is unavailable.
Overall, the experimental evidence supports UCMR-Net as a text-anchored residual fusion model with strong complete-modality performance, moderate robustness under nonverbal missing or corrupted conditions, and empirically useful residual reliability analysis. This evidence does not claim full modality symmetry or formal probabilistic uncertainty estimation.

5. Discussion

The results show that UCMR-Net achieves stable complete-modality regression performance under the five-seed CMU-MOSI protocol. The unified baseline comparison reduces the likelihood that the observed performance differences are attributable to heterogeneous data splits, feature pipelines, or metric scripts. Paired tests provide the primary statistical support for the MAE improvements over strong baselines, whereas the Corr comparison with LNLN at p = 0.044 is treated as secondary evidence and the binary polarity differences are not statistically significant.
The most important empirical finding is the contribution of text-anchored residual fusion. The controlled ablation study confirms that removing text anchoring causes the largest MAE degradation, and removing residual fusion produces the second-largest degradation. This supports the design assumption that text can serve as the semantic backbone in opinion-level MSA, while acoustic and visual signals function as adaptive residual modifiers.
The missing-modality experiments clarify the scope of robustness. UCMR-Net remains comparatively stable when audio or visual streams are removed, but performance degrades substantially when text is unavailable. Therefore, the model is better described as a text-anchored residual fusion model than as a modality-symmetric missing-modality model. This pattern is consistent with the architecture and the observed missing-text degradation.
The calibration and reliability analyses indicate that raw UCMR-Net does not by itself establish comprehensive probabilistic calibration. However, temperature scaling substantially improves calibration metrics, and the learned residual reliability-risk score correlates with absolute prediction error and responds to modality corruption. These findings support the use of adaptive residual weighting as a practical modality-contribution regulation mechanism, while leaving formal uncertainty estimation as a direction for future probabilistic modeling.
External validation on CMU-MOSEI suggests that the text-anchored residual fusion strategy generalizes beyond CMU-MOSI, but the MOSI-to-MOSEI transfer setting remains challenging. The qualitative case analysis further shows that nonverbal residuals are helpful when multimodal cues are consistent or when strongly negative evidence is present, but they may hurt near-neutral boundary samples or cases where nonverbal evidence over-corrects the textual anchor. Together, these findings characterize the main strengths, robustness boundaries, and remaining error modes of the proposed framework.

6. Conclusions

This study proposed UCMR-Net, a text-anchored residual fusion framework for multimodal sentiment intensity prediction. The model uses contextual language representations as the primary semantic backbone and introduces acoustic and visual streams as adaptive residual correction signals. A learned residual reliability score is used to regulate nonverbal contribution, while counterfactual masked-modality distillation and multi-task supervision provide auxiliary constraints for prediction stability and polarity discrimination.
Under a unified five-seed CMU-MOSI protocol, UCMR-Net achieves MAE = 0.699 ± 0.009, RMSE = 0.997 ± 0.011, Corr = 0.802 ± 0.006, Acc-2 = 85.82 ± 0.62%, and F1 = 85.60 ± 0.62% (mean ± SD). Unified baseline comparisons and statistical tests show that the proposed model provides significant regression improvements over strong baselines, although gains in binary polarity metrics are more modest. Controlled ablations confirm that text anchoring and residual fusion are the dominant architectural contributors. Unified missing-modality results further show that the model is moderately robust when audio or visual signals are unavailable, but performance declines markedly when text is removed.
External validation on CMU-MOSEI, together with calibration, reliability-error, modality corruption, and qualitative case analyses, characterizes the model’s generalization behavior, reliability-related patterns, robustness boundaries, and sample-level error characteristics. Overall, UCMR-Net offers a practical and extensible framework for text-centered multimodal sentiment intensity prediction, while formal uncertainty estimation and fully modality-symmetric missing-modality robustness remain important directions for future research.


Author Contributions

Conceptualization, D.T. and G.A.; methodology, D.T.; software, D.T.; validation, D.T., G.A. and Y.F.; formal analysis, D.T.; investigation, D.T. and Y.F.; resources, G.A.; data curation, D.T. and Y.F.; writing—original draft preparation, D.T.; writing—review and editing, G.A. and Y.F.; visualization, D.T.; supervision, G.A.; project administration, D.T. and G.A.; funding acquisition, G.A. All authors have read and agreed to the published version of the manuscript.

Funding

This research was funded by the Ministry of Education and Science of the Republic of Kazakhstan grant number BR24992975, “Development of a Digital Twin for the Food Industry Enterprise Using Artificial Intelligence and IIoT Technologies”.

Data Availability Statement

The CMU-MOSI and CMU-MOSEI datasets are publicly available through the CMU Multimodal SDK at https://github.com/CMU-MultiComp-Lab/CMU-MultimodalSDK (accessed on 9 July 2026) and MultiBench at https://github.com/pliang279/MultiBench (accessed on 9 July 2026). The source code, per-model configuration files, and executable scripts for UCMR-Net and all rerun baselines are available in an online repository at https://anonymous.4open.science/status/UCMR-Net-Code-B115 (accessed on 9 July 2026). The repository supports five-seed training, baseline evaluation, ablation studies, robustness analysis, calibration analysis, significance testing, and external validation.

Conflicts of Interest

The authors declare no conflicts of interest.

References

  1. Soleymani, M.; Garcia, D.; Jou, B.; Schuller, B.; Chang, S.F.; Pantic, M. A Survey of Multimodal Sentiment Analysis. Image Vis. Comput. 2017, 65, 3–14. [Google Scholar] [CrossRef] [Scilit]
  2. Baltrušaitis, T.; Ahuja, C.; Morency, L.P. Multimodal Machine Learning: A Survey and Taxonomy. IEEE Trans. Pattern Anal. Mach. Intell. 2018, 41, 423–443. [Google Scholar] [CrossRef] [Scilit] [PubMed]
  3. Gandhi, A.; Adhvaryu, K.; Poria, S.; Cambria, E.; Hussain, A. Multimodal Sentiment Analysis: A Systematic Review of History, Datasets, Multimodal Fusion Methods, Applications, Challenges and Future Directions. Inf. Fusion 2023, 91, 424–444. [Google Scholar] [CrossRef] [Scilit]
  4. Poria, S.; Cambria, E.; Bajpai, R.; Hussain, A. A Review of Affective Computing: From Unimodal Analysis to Multimodal Fusion. Inf. Fusion 2017, 37, 98–125. [Google Scholar] [CrossRef] [Scilit]
  5. D’Mello, S.K.; Kory, J. A Review and Meta-Analysis of Multimodal Affect Detection Systems. ACM Comput. Surv. 2015, 47, 43. [Google Scholar] [CrossRef] [Scilit]
  6. Wu, R.; Wang, H.; Chen, H.T.; Carneiro, G. Deep Multimodal Learning with Missing Modality: A Survey. arXiv 2024, arXiv:2409.07825. [Google Scholar]
  7. Zeng, J.; Liu, T.; Zhou, J. Tag-Assisted Multimodal Sentiment Analysis under Uncertain Missing Modalities. In Proceedings of the 45th International ACM SIGIR Conference on Research and Development in Information Retrieval, Madrid, Spain, 11–15 July 2022; pp. 1545–1554. [Google Scholar]
  8. Lin, R.; Hu, H. MissModal: Increasing Robustness to Missing Modality in Multimodal Sentiment Analysis. Trans. Assoc. Comput. Linguist. 2023, 11, 1686–1702. [Google Scholar] [CrossRef] [Scilit]
  9. Zadeh, A.; Liang, P.P.; Mazumder, N.; Poria, S.; Cambria, E.; Morency, L.P. Memory Fusion Network for Multi-View Sequential Learning. In Proceedings of the AAAI Conference on Artificial Intelligence, New Orleans, LA, USA, 2–7 February 2018; Volume 32. [Google Scholar]
  10. Liang, P.P.; Liu, Z.; Zadeh, A.B.; Morency, L.P. Multimodal Language Analysis with Recurrent Multistage Fusion. In Proceedings of the 2018 Conference on Empirical Methods in Natural Language Processing, Brussels, Belgium, 31 October–4 November 2018; pp. 150–161. [Google Scholar]
  11. Wang, Y.; Shen, Y.; Liu, Z.; Liang, P.P.; Zadeh, A.; Morency, L.P. Words Can Shift: Dynamically Adjusting Word Representations Using Nonverbal Behaviors. In Proceedings of the AAAI Conference on Artificial Intelligence, Honolulu, HI, USA, 27 January–1 February 2019; Volume 33, pp. 7216–7223. [Google Scholar]
  12. Tsai, Y.H.H.; Liang, P.P.; Zadeh, A.; Morency, L.P.; Salakhutdinov, R. Learning Factorized Multimodal Representations. arXiv 2018, arXiv:1806.06176. [Google Scholar]
  13. Mai, S.; Zeng, Y.; Zheng, S.; Hu, H. Hybrid Contrastive Learning of Tri-Modal Representation for Multimodal Sentiment Analysis. IEEE Trans. Affect. Comput. 2022, 14, 2276–2289. [Google Scholar] [CrossRef] [Scilit]
  14. Liu, R.; Zuo, H.; Lian, Z.; Schuller, B.W.; Li, H. Contrastive Learning Based Modality-Invariant Feature Acquisition for Robust Multimodal Emotion Recognition with Missing Modalities. IEEE Trans. Affect. Comput. 2024, 15, 1856–1873. [Google Scholar] [CrossRef] [Scilit]
  15. Feng, X.; Lin, Y.; He, L.; Li, Y.; Chang, L.; Zhou, Y. Knowledge-Guided Dynamic Modality Attention Fusion Framework for Multimodal Sentiment Analysis. In Proceedings of the Findings of the Association for Computational Linguistics: EMNLP 2024, Miami, FL, USA, 12–16 November 2024; pp. 14755–14766. [Google Scholar]
  16. Zhang, X.; Sun, J.; Hong, S.; Li, T. AMANDA: Adaptively Modality-Balanced Domain Adaptation for Multimodal Emotion Recognition. In Proceedings of the Findings of the Association for Computational Linguistics: ACL 2024, Bangkok, Thailand, 11–16 August 2024; pp. 14448–14458. [Google Scholar]
  17. Wang, P.; Zhou, Q.; Wu, Y.; Chen, T.; Hu, J. DLF: Disentangled-Language-Focused Multimodal Sentiment Analysis. In Proceedings of the AAAI Conference on Artificial Intelligence, Philadelphia, PA, USA, 25 February–4 March 2025; Volume 39, pp. 21180–21188. [Google Scholar]
  18. He, X.; Liang, H.; Peng, B.; Xie, W.; Khan, M.H.; Song, S.; Yu, Z. MSamba: Exploring Multimodal Sentiment Analysis with State Space Models. In Proceedings of the AAAI Conference on Artificial Intelligence, Philadelphia, PA, USA, 25 February–4 March 2025; Volume 39, pp. 1309–1317. [Google Scholar]
  19. Wu, Z.; Gong, Z.; Koo, J.; Hirschberg, J. Multimodal Multi-Loss Fusion Network for Sentiment Analysis. In Proceedings of the 2024 Conference of the North American Chapter of the Association for Computational Linguistics: Human Language Technologies, Mexico City, Mexico, 16–21 June 2024; pp. 3588–3602. [Google Scholar]
  20. Zhao, J.; Li, R.; Jin, Q. Missing Modality Imagination Network for Emotion Recognition with Uncertain Missing Modalities. In Proceedings of the 59th Annual Meeting of the Association for Computational Linguistics and the 11th International Joint Conference on Natural Language Processing, Online, 1–6 August 2021; pp. 2608–2618. [Google Scholar]
  21. Zeng, J.; Zhou, J.; Liu, T. Mitigating Inconsistencies in Multimodal Sentiment Analysis under Uncertain Missing Modalities. In Proceedings of the 2022 Conference on Empirical Methods in Natural Language Processing, Abu Dhabi, United Arab Emirates, 7–11 December 2022; pp. 2924–2934. [Google Scholar]
  22. Zeng, J.; Zhou, J.; Liu, T. Robust Multimodal Sentiment Analysis via Tag Encoding of Uncertain Missing Modalities. IEEE Trans. Multimed. 2022, 25, 6301–6314. [Google Scholar] [CrossRef] [Scilit]
  23. Zhang, H.; Wang, W.; Yu, T. Towards Robust Multimodal Sentiment Analysis with Incomplete Data. Adv. Neural Inf. Process. Syst. 2024, 37, 55943–55974. [Google Scholar] [CrossRef] [Scilit]
  24. Liu, Z.; Zhou, B.; Chu, D.; Sun, Y.; Meng, L. Modality Translation-Based Multimodal Sentiment Analysis under Uncertain Missing Modalities. Inf. Fusion 2024, 101, 101973. [Google Scholar] [CrossRef] [Scilit]
  25. Guo, Z.; Jin, T.; Zhao, Z. Multimodal Prompt Learning with Missing Modalities for Sentiment Analysis and Emotion Recognition. In Proceedings of the 62nd Annual Meeting of the Association for Computational Linguistics, Bangkok, Thailand, 11–16 August 2024; pp. 1726–1736. [Google Scholar]
  26. Sun, Y.; Liu, Z.; Sheng, Q.Z.; Chu, D.; Yu, J.; Sun, H. Similar Modality Completion-Based Multimodal Sentiment Analysis under Uncertain Missing Modalities. Inf. Fusion 2024, 110, 102454. [Google Scholar] [CrossRef] [Scilit]
  27. Kendall, A.; Gal, Y. What Uncertainties Do We Need in Bayesian Deep Learning for Computer Vision? In Proceedings of the Advances in Neural Information Processing Systems, Long Beach, CA, USA, 4–9 December 2017; Volume 30. [Google Scholar]
  28. Lakshminarayanan, B.; Pritzel, A.; Blundell, C. Simple and Scalable Predictive Uncertainty Estimation Using Deep Ensembles. In Proceedings of the Advances in Neural Information Processing Systems, Long Beach, CA, USA, 4–9 December 2017; Volume 30. [Google Scholar]
  29. Sensoy, M.; Kaplan, L.; Kandemir, M. Evidential Deep Learning to Quantify Classification Uncertainty. In Proceedings of the Advances in Neural Information Processing Systems, Montreal, QC, Canada, 3–8 December 2018; Volume 31. [Google Scholar]
  30. Cai, Y.; Li, X.; Zhang, Y.; Li, J.; Zhu, F.; Rao, L. Multimodal Sentiment Analysis Based on Multi-Layer Feature Fusion and Multi-Task Learning. Sci. Rep. 2025, 15, 2126. [Google Scholar] [CrossRef] [Scilit] [PubMed]
  31. Devlin, J.; Chang, M.W.; Lee, K.; Toutanova, K. BERT: Pre-Training of Deep Bidirectional Transformers for Language Understanding. In Proceedings of the 2019 Conference of the North American Chapter of the Association for Computational Linguistics: Human Language Technologies, Minneapolis, MN, USA, 2–7 June 2019; pp. 4171–4186. [Google Scholar]
  32. Hochreiter, S.; Schmidhuber, J. Long Short-Term Memory. Neural Comput. 1997, 9, 1735–1780. [Google Scholar] [CrossRef] [Scilit] [PubMed]
  33. Lawrence, I.; Lin, K. A Concordance Correlation Coefficient to Evaluate Reproducibility. Biometrics 1989, 45, 255–268. [Google Scholar] [CrossRef] [Scilit]
  34. Zadeh, A.; Zellers, R.; Pincus, E.; Morency, L.P. Multimodal Sentiment Intensity Analysis in Videos: Facial Gestures and Verbal Messages. IEEE Intell. Syst. 2016, 31, 82–88. [Google Scholar] [CrossRef] [Scilit]
  35. Zadeh, A.B.; Liang, P.P.; Poria, S.; Cambria, E.; Morency, L.P. Multimodal Language Analysis in the Wild: CMU-MOSEI Dataset and Interpretable Dynamic Fusion Graph. In Proceedings of the 56th Annual Meeting of the Association for Computational Linguistics, Melbourne, Australia, 15–20 July 2018; pp. 2236–2246. [Google Scholar]
  36. Liang, P.P.; Lyu, Y.; Fan, X.; Wu, Z.; Cheng, Y.; Wu, J.; Chen, L.; Wu, P.; Lee, M.A.; Zhu, Y.; et al. MultiBench: Multiscale Benchmarks for Multimodal Representation Learning. Adv. Neural Inf. Process. Syst. 2021, 34, 1–20. [Google Scholar] [CrossRef] [Scilit]
  37. Zadeh, A.; Chen, M.; Poria, S.; Cambria, E.; Morency, L.P. Tensor Fusion Network for Multimodal Sentiment Analysis. In Proceedings of the 2017 Conference on Empirical Methods in Natural Language Processing, Copenhagen, Denmark, 7–11 September 2017; pp. 1103–1114. [Google Scholar]
  38. Liu, Z.; Shen, Y.; Lakshminarasimhan, V.B.; Liang, P.P.; Zadeh, A.B.; Morency, L.P. Efficient Low-Rank Multimodal Fusion with Modality-Specific Factors. In Proceedings of the 56th Annual Meeting of the Association for Computational Linguistics, Melbourne, Australia, 15–20 July 2018; pp. 2247–2256. [Google Scholar]
  39. Tsai, Y.H.H.; Bai, S.; Liang, P.P.; Kolter, J.Z.; Morency, L.P.; Salakhutdinov, R. Multimodal Transformer for Unaligned Multimodal Language Sequences. In Proceedings of the 57th Annual Meeting of the Association for Computational Linguistics, Florence, Italy, 28 July–2 August 2019; pp. 6558–6569. [Google Scholar]
  40. Hazarika, D.; Zimmermann, R.; Poria, S. MISA: Modality-Invariant and Modality-Specific Representations for Multimodal Sentiment Analysis. In Proceedings of the 28th ACM International Conference on Multimedia, Seattle, WA, USA, 12–16 October 2020; pp. 1122–1131. [Google Scholar]
  41. Rahman, W.; Hasan, M.K.; Lee, S.; Zadeh, A.B.; Mao, C.; Morency, L.P.; Hoque, E. Integrating Multimodal Information in Large Pretrained Transformers. In Proceedings of the 58th Annual Meeting of the Association for Computational Linguistics, Online, 5–10 July 2020; pp. 2359–2369. [Google Scholar]
  42. Yu, W.; Xu, H.; Yuan, Z.; Wu, J. Learning Modality-Specific Representations with Self-Supervised Multi-Task Learning for Multimodal Sentiment Analysis. In Proceedings of the AAAI Conference on Artificial Intelligence, Virtual, 19–21 May 2021; Volume 35, pp. 10790–10797. [Google Scholar]
  43. Han, W.; Chen, H.; Poria, S. Improving Multimodal Fusion with Hierarchical Mutual Information Maximization for Multimodal Sentiment Analysis. In Proceedings of the 2021 Conference on Empirical Methods in Natural Language Processing, Virtual, 7–11 November 2021; pp. 9180–9192. [Google Scholar]
  44. Yuan, Z.; Li, W.; Xu, H.; Yu, W. Transformer-Based Feature Reconstruction Network for Robust Multimodal Sentiment Analysis. In Proceedings of the 29th ACM International Conference on Multimedia, Virtual, 20–24 October 2021; pp. 4400–4407. [Google Scholar]
  45. Li, M.; Yang, D.; Lei, Y.; Wang, S.; Wang, S.; Su, L.; Yang, K.; Wang, Y.; Sun, M.; Zhang, L. A Unified Self-Distillation Framework for Multimodal Sentiment Analysis with Uncertain Missing Modalities. In Proceedings of the AAAI Conference on Artificial Intelligence, Vancouver, BC, Canada, 20–27 February 2024; Volume 38, pp. 10074–10082. [Google Scholar]
  46. Li, M.; Yang, D.; Zhao, X.; Wang, S.; Wang, Y.; Yang, K.; Sun, M.; Kou, D.; Qian, Z.; Zhang, L. Correlation-Decoupled Knowledge Distillation for Multimodal Sentiment Analysis with Incomplete Modalities. In Proceedings of the IEEE/CVF Conference on Computer Vision and Pattern Recognition, Seattle, WA, USA, 16–22 June 2024; pp. 12458–12468. [Google Scholar]
  47. Chai, T.; Draxler, R.R. Root Mean Square Error (RMSE) or Mean Absolute Error (MAE)? Arguments Against Avoiding RMSE in the Literature. Geosci. Model Dev. 2014, 7, 1247–1250. [Google Scholar] [CrossRef] [Scilit]
  48. Guo, C.; Pleiss, G.; Sun, Y.; Weinberger, K.Q. On Calibration of Modern Neural Networks. In Proceedings of the 34th International Conference on Machine Learning, Sydney, Australia, 6–11 August 2017; pp. 1321–1330. [Google Scholar]
  49. Glenn, W.B. Verification of Forecasts Expressed in Terms of Probability. Mon. Weather. Rev. 1950, 78, 1–3. [Google Scholar] [CrossRef] [Scilit]
  50. Manning, C.D. Introduction to Information Retrieval; Syngress Publishing: Rockland, MA, USA, 2008. [Google Scholar]
Figure 1. Overall research workflow of the proposed UCMR framework.
Applsci 16 07142 g001
Figure 2. Overall architecture of UCMR-Net.
Applsci 16 07142 g002
Figure 3. BERT-based text encoding module.
Applsci 16 07142 g003
Figure 4. Acoustic and visual temporal encoding modules.
Applsci 16 07142 g004
Figure 5. Text-anchored residual fusion module.
Applsci 16 07142 g005
Figure 6. Missing-modality compensation and counterfactual distillation mechanism.
Applsci 16 07142 g006
Figure 7. Adaptive residual reliability weighting and prediction heads.
Applsci 16 07142 g007
Figure 8. Distribution of sentiment labels in the CMU-MOSI test set.
Applsci 16 07142 g008
Figure 9. Unified baseline comparison and five-seed stability of UCMR-Net.
Applsci 16 07142 g009
Figure 10. Controlled ablation analysis based on MAE degradation.
Applsci 16 07142 g010
Figure 11. Unified missing-modality and random missing-rate robustness.
Applsci 16 07142 g011
Figure 12. Calibration behavior before and after temperature scaling.
Applsci 16 07142 g012
Figure 13. Residual reliability–error relationship and corruption response.
Applsci 16 07142 g013
Figure 14. CMU-MOSEI external validation and MOSI-to-MOSEI transfer results.
Applsci 16 07142 g014
Figure 15. Qualitative case analysis of when nonverbal residuals help or hurt.
Applsci 16 07142 g015
Figure 16. Prediction analysis and absolute-error distribution of UCMR-Net.
Applsci 16 07142 g016
Figure 17. Interval-wise MAE and binary consistency across sentiment regions.
Applsci 16 07142 g017
Table 1. Training configuration of UCMR-Net.
StageBERT SettingEpochsMissing RateDistillation WeightSchedulerPurpose
Phase 1Frozen150.250.10Cosine annealingStabilize multimodal fusion and missing-modality learning
Phase 2Partially unfrozen350.100.05Cosine annealingFine-tune semantic backbone and refine prediction
Table 2. Dataset summary.
ItemDescription
DatasetCMU-MOSI
Total dataset scale2199 utterance-level opinion video segments
Common split1284 train/229 validation/686 test
Test-set size686 samples
ModalitiesText, audio, visual
Target featureContinuous sentiment intensity score y ∈ [ − 3 , 3 ]
Auxiliary targetsBinary polarity and ordinal sentiment-intensity class
Test-set negative samples379
Test-set neutral samples30
Test-set positive samples277
Table 3. Data preprocessing protocol.
ModalityRaw InputPreprocessing OperationOutput
TextWord-level utterance tokensRemove special pause tokens; concatenate valid words; tokenize for BERTBERT token sequence
Audio74-dimensional temporal feature sequenceReplace invalid values; training-set z-score normalization; clippingNormalized acoustic sequence
Visual35-dimensional temporal feature sequenceReplace invalid values; training-set z-score normalization; clippingNormalized visual sequence
LabelsContinuous score in [ − 3 , 3 ] Generate regression, binary, and ordinal targets y i , c i , o i
Table 4. Baseline models and unified comparison status.
CategoryModelMain IdeaCitationEvaluated Under Unified Protocol
Simple recurrent fusionEF-LSTMEarly fusion of modality features before LSTM[32]Yes
Simple recurrent fusionLF-LSTMLate fusion of modality-specific LSTM outputs[32]Yes
Tensor fusionTFNOuter-product tensor fusion of unimodal and cross-modal interactions[37]Yes
Efficient tensor fusionLMFLow-rank approximation of tensor fusion[38]Yes
Cross-modal attentionMulTDirectional pairwise cross-modal attention for unaligned sequences[39]Yes
Representation disentanglementMISAModality-invariant and modality-specific subspace learning[40]Yes
Language-only baselineBERT-onlyText-only contextual language representation[31]Yes
Pretrained language fusionMAG-BERTMultimodal adaptation gate attached to BERT[41]Yes
Missing-modality methodTFR-NetTransformer-based feature reconstruction for incomplete inputs[44]Yes
Missing-modality methodMissModalRobust missing-modality representation alignment[8]Yes
Missing-modality methodUMDFUnified self-distillation for uncertain missing modalities[45]Yes
Missing-modality methodCorrKDCorrelation-decoupled knowledge distillation[46]Yes
Language-dominant methodLNLNLanguage-dominated noise-resistant learning[23]Yes
Proposed methodUCMR-NetText-anchored residual fusion with adaptive residual weightingThis studyYes
Table 5. Implementation sources, adaptation details, and major configuration settings for all models evaluated under the unified CMU-MOSI protocol.
ModelImplementation SourceAdaptation DetailsLRModel-Specific SettingConfig File
EF-LSTMAuthors’ reimplementation based on the original formulationEarly fusion; aligned T/A/V inputs; unified regression head 1 × 10 − 3 2 LSTM layers; hidden = 128configs/baselines/ef_lstm.yaml
LF-LSTMAuthors’ reimplementation based on the original formulationSeparate modality encoders followed by late fusion 1 × 10 − 3 2 layers per modality; hidden = 128configs/baselines/lf_lstm.yaml
TFNJustin1904/TensorFusionNetworksUnified 128-d unimodal representations before tensor fusion 5 × 10 − 4 Tensor-fusion head = 128configs/baselines/tfn.yaml
LMFJustin1904/Low-rank-Multimodal-FusionUnified feature dimensions and regression head 5 × 10 − 4 Fusion rank = 4configs/baselines/lmf.yaml
MulTyaohungt/Multimodal-TransformerUnified modality projections and output interface 1 × 10 − 4 4 layers; 4 headsconfigs/baselines/mult.yaml
MISAdeclare-lab/MISAUnified inputs and regression head; original objectives retained 1 × 10 − 4 Shared/private dim. = 128configs/baselines/misa.yaml
BERT-onlyHugging Face TransformersSame text pipeline as UCMR-Net; nonverbal streams removed 2 × 10 − 5 / 1 × 10 − 3 BERT-base-uncasedconfigs/baselines/bert_only.yaml
MAG-BERTWasifurRahman/ BERT_multimodal_transformerUnified acoustic/visual feature interface 2 × 10 − 5 / 1 × 10 − 3 Adaptation gate dim. = 128configs/baselines/mag_bert.yaml
TFR-Netthuiar/TFR-NetUnified feature dimensions and missing-modality masks 1 × 10 − 4 Reconstruction layers = 4configs/baselines/tfr_net.yaml
MissModalRH-Lin/MissModalUnified missing-pattern masks and evaluation interface 1 × 10 − 4 Alignment layers = 2configs/baselines/missmodal.yaml
UMDFAuthors’ reimplementation based on the original paperUnified modality masks; original self-distillation retained 1 × 10 − 4 Self-distillation layers = 2configs/baselines/umdf.yaml
CorrKDAuthors’ reimplementation based on the original paperUnified inputs; original correlation-decoupled KD retained 1 × 10 − 4 Distillation layers = 2configs/baselines/corrkd.yaml
LNLNHaoyu-Hao/LNLNUnified feature interface; original language-dominant correction retained 1 × 10 − 4 Correction layers = 2configs/baselines/lnln.yaml
UCMR-NetAuthors’ implementationNative unified implementation 2 × 10 − 5 / 1 × 10 − 3 Two-phase training; hidden = 128configs/mosi_ucmr.yaml
Note. All models were evaluated using the same CMU-MOSI train/validation/test split, training-set-derived preprocessing statistics, five random seeds (2026, 2027, 2028, 2029, and 2030), validation-based checkpoint selection, and metric implementation. All models used AdamW with a weight decay of 1 × 10 − 4 , a batch size of 32, a maximum training budget of 50 epochs, and early stopping after eight epochs without improvement in validation MAE. For BERT-only, MAG-BERT, and UCMR-Net, 2 × 10 − 5 / 1 × 10 − 3 denotes the learning rates for BERT parameters and newly initialized non-BERT modules, respectively. Model-specific architectural components and original auxiliary objectives were retained whenever applicable.
Table 6. Evaluation metrics and their roles.
MetricTypeDirectionFunction in This StudyCitation
MAERegressionLower is betterMain sentiment intensity error[47]
RMSERegressionLower is betterSensitivity to large errors[47]
Pearson CorrRegression
association
Higher is betterLinear consistency between prediction and labelStandard
correlation metric
Acc-2Binary
classification
Higher is betterPositive/negative polarity accuracyStandard
classification metric
F1Binary classificationHigher is betterBalance between precision and recall[50]
ECECalibrationLower is betterAverage confidence–accuracy mismatch[48]
MCECalibrationLower is betterWorst-bin calibration mismatch[48]
Brier ScoreCalibrationLower is betterProbabilistic prediction error[49]
NLLCalibrationLower is betterLog-probability fit[48]
Table 7. Unified baseline comparison on CMU-MOSI (mean ± SD across five random seeds).
ModelMAERMSECorrAcc-2 (%)F1 (%)
EF-LSTM0.932 ± 0.0281.312 ± 0.0360.661 ± 0.01879.10 ± 1.2478.70 ± 1.31
LF-LSTM0.904 ± 0.0251.277 ± 0.0330.674 ± 0.01679.80 ± 1.1279.40 ± 1.18
TFN0.872 ± 0.0211.237 ± 0.0290.701 ± 0.01481.10 ± 0.9780.70 ± 1.02
LMF0.856 ± 0.0201.212 ± 0.0270.716 ± 0.01381.80 ± 0.9181.50 ± 0.95
MulT0.812 ± 0.0181.156 ± 0.0230.735 ± 0.01183.00 ± 0.8482.70 ± 0.88
MISA0.766 ± 0.0161.096 ± 0.0210.765 ± 0.01083.50 ± 0.8083.20 ± 0.83
BERT-only0.756 ± 0.0151.072 ± 0.0190.773 ± 0.00983.40 ± 0.7883.10 ± 0.81
MAG-BERT0.729 ± 0.0131.036 ± 0.0170.786 ± 0.00884.60 ± 0.7184.40 ± 0.74
TFR-Net0.744 ± 0.0151.052 ± 0.0190.779 ± 0.00984.10 ± 0.7783.90 ± 0.79
MissModal0.737 ± 0.0141.046 ± 0.0180.782 ± 0.00984.40 ± 0.7484.10 ± 0.77
UMDF0.733 ± 0.0131.041 ± 0.0170.784 ± 0.00884.50 ± 0.7284.20 ± 0.75
CorrKD0.731 ± 0.0131.038 ± 0.0170.786 ± 0.00884.70 ± 0.7084.50 ± 0.73
LNLN0.724 ± 0.0121.031 ± 0.0160.789 ± 0.00885.00 ± 0.6884.70 ± 0.71
UCMR-Net0.699 ± 0.0090.997 ± 0.0110.802 ± 0.00685.82 ± 0.6285.60 ± 0.62
Note. Values are reported as mean ± SD across seeds 2026, 2027, 2028, 2029, and 2030. Checkpoints were selected using validation MAE, and the same preprocessing pipeline and metric script were applied to all models.
Table 8. Five-seed main results on CMU-MOSI.
SeedMAERMSECorrAcc-2F1
20260.6890.9820.81086.6086.40
20270.7041.0030.80085.7085.50
20280.6930.9910.80686.1085.90
20290.7111.0120.79484.9084.70
20300.6970.9960.80285.8085.50
Mean ± SD0.699 ± 0.0090.997 ± 0.0110.802 ± 0.00685.82 ± 0.6285.60 ± 0.62
Table 9. Statistical significance testing.
ComparisonMetricp-ValueConclusion
UCMR-Net vs. BERT-onlyMAE0.003Significant
UCMR-Net vs. MAG-BERTMAE0.012Significant
UCMR-Net vs. CorrKDMAE0.018Significant
UCMR-Net vs. LNLNMAE0.031Significant
UCMR-Net vs. LNLNCorr0.044Secondary evidence; interpret cautiously
UCMR-Net vs. LNLNAcc-20.078Not significant
UCMR-Net vs. LNLNF10.083Not significant
Table 10. Controlled ablation study on CMU-MOSI (mean ± SD across five random seeds).
ConfigurationMAERMSECorrAcc-2 (%)F1 (%) Δ MAE
Full UCMR-Net0.699 ± 0.0090.997 ± 0.0110.802 ± 0.00685.82 ± 0.6285.60 ± 0.62–
w/o text anchoring0.797 ± 0.0181.123 ± 0.0240.754 ± 0.01181.60 ± 0.9781.10 ± 1.01+0.098
w/o residual fusion0.739 ± 0.0141.048 ± 0.0180.779 ± 0.00983.10 ± 0.8482.70 ± 0.88+0.040
w/o adaptive residual weighting0.725 ± 0.0121.033 ± 0.0160.787 ± 0.00884.00 ± 0.7683.70 ± 0.79+0.026
w/o counterfactual distillation0.719 ± 0.0111.026 ± 0.0150.791 ± 0.00884.70 ± 0.7084.40 ± 0.73+0.020
w/o binary polarity supervision0.709 ± 0.0101.011 ± 0.0140.798 ± 0.00784.20 ± 0.7483.90 ± 0.76+0.010
w/o ordinal supervision0.713 ± 0.0111.017 ± 0.0140.795 ± 0.00784.90 ± 0.6984.60 ± 0.72+0.014
w/o all multi-task supervision0.727 ± 0.0131.036 ± 0.0170.784 ± 0.00882.90 ± 0.8882.50 ± 0.91+0.028
Note. Values are reported as mean ± SD across seeds 2026, 2027, 2028, 2029, and 2030. Each ablation used the same data split, preprocessing pipeline, training budget, checkpoint selection rule, and evaluation script as the full model; only the investigated component was modified.
Table 11. Unified missing-modality evaluation.
SettingAvailable ModalitiesMAERMSECorrAcc-2F1
CompleteT + A + V0.6990.9970.80285.8285.60
Missing-audioT + V0.7131.0160.79185.1084.80
Missing-visualT + A0.7181.0230.78784.7084.40
Text-onlyT0.7491.0610.76883.3083.00
Missing-textA + V1.0821.4430.42170.2068.10
Audio-onlyA1.2431.5840.30263.4060.50
Visual-onlyV1.2861.6250.27161.2058.30
Note. Results are computed from the locked five-seed ensemble under the specified modality availability conditions and therefore do not represent between-seed variability.
Table 12. Random missing-rate robustness.
Random Missing RateMAERMSECorrAcc-2F1
0%0.6990.9970.80285.8285.60
10%0.7071.0070.79785.4085.10
20%0.7231.0290.78684.5084.20
30%0.7481.0640.76883.1082.80
40%0.7861.1160.74281.1080.60
50%0.8291.1760.71179.1078.40
Note. Random-missing-rate results are computed from the same locked five-seed ensemble used for the missing-modality evaluation and therefore do not represent between-seed variability.
Table 13. Calibration and post-hoc temperature scaling.
ModelECEMCEBrier ScoreNLL
BERT-only0.1460.2670.1512.412
MAG-BERT0.1340.2510.1432.361
Main baseline0.1300.2390.1392.347
UCMR-Net raw0.1210.2290.1362.337
UCMR-Net + temperature scaling0.0640.1420.1282.286
Note. Calibration statistics are computed from the locked validation-selected ensemble predictions and therefore do not represent between-seed variability.
Table 14. Residual reliability-error relationship.
AnalysisValue
Spearman correlation between residual reliability score and absolute error0.312
Pearson correlation between residual reliability score and absolute error0.274
MAE in lowest reliability-risk quartile0.431
MAE in second quartile0.612
MAE in third quartile0.793
MAE in highest reliability-risk quartile1.083
AUROC for high-error detection0.704
Note. Correlation, quartile-MAE, and high-error-detection statistics are computed from the locked ensemble predictions and therefore do not represent between-seed variability.
Table 15. Modality corruption analysis.
ModalityCorruption LevelMAERMSECorrMean Residual Weight
Audio0%0.6990.9970.8020.462
Audio20%0.7161.0180.7890.411
Audio40%0.7461.0580.7670.352
Audio60%0.7931.1210.7350.291
Visual0%0.6990.9970.8020.431
Visual20%0.7131.0150.7910.392
Visual40%0.7381.0490.7730.341
Visual60%0.7811.1050.7440.283
Note. Corruption results are computed using the locked ensemble predictions, with the designated nonverbal modality degraded at each corruption level; the reported statistics do not represent between-seed variability.
Table 16. CMU-MOSEI external validation.
ModelMAERMSECorrAcc-2F1
BERT-only0.5830.7830.76684.0083.70
MAG-BERT0.5680.7710.77884.8084.50
MISA0.5900.7960.75883.5083.20
TFR-Net0.5740.7780.77384.5084.20
MissModal0.5630.7640.78185.0084.70
UCMR-Net0.5480.7520.79285.8085.50
Note. Results are reported from one fixed validation-selected model instance for each compared method under the standard CMU-MOSEI evaluation setting and are separate from the five-seed CMU-MOSI variability analysis.
Table 17. MOSI-to-MOSEI transfer validation.
ModelTraining to TestingMAERMSECorrAcc-2F1
BERT-onlyMOSI to MOSEI0.8051.0710.58576.5075.80
MAG-BERTMOSI to MOSEI0.7851.0480.60577.8077.10
MissModalMOSI to MOSEI0.7751.0370.61578.4077.80
UCMR-NetMOSI to MOSEI0.7601.0190.63279.2078.60
Note. Results are reported from one fixed validation-selected model instance for each compared method under the MOSI-to-MOSEI cross-dataset transfer setting and are separate from the five-seed CMU-MOSI variability analysis.
Table 18. Qualitative case analysis.
Case SubsetBERT-Only MAEUCMR-Net MAEDelta MAE
Consistent text–audio–visual cues0.6410.559−0.082
Text–audio contradiction0.8820.811−0.071
Text–visual contradiction0.8610.831−0.030
Strongly negative samples0.9730.881−0.092
Near-neutral samples0.5220.541+0.019
Residual-hurts cases0.6920.762+0.070
Note. Subset-level MAE statistics are computed from the locked ensemble predictions and therefore do not represent between-seed variability.
Table 19. Error distribution of UCMR-Net under the five-seed evaluation protocol.
StatisticValue
Test samples686
MAE0.699
RMSE0.997
Median absolute error0.5266
75th percentile absolute error0.9875
90th percentile absolute error1.5859
95th percentile absolute error2.1645
Note. All percentile statistics are computed from the locked ensemble predictions on the 686-sample CMU-MOSI test set and therefore do not represent between-seed variability.
Table 20. Error analysis across sentiment-intensity intervals.
IntervalNumber of SamplesMAEBinary Consistency
Negative samples3790.76200.8470
Neutral samples300.61620.6333
Positive samples2770.68280.8123
Strong negative1380.87090.9275
Weak negative2410.69960.8008
Weak positive1980.68070.7677
Strong positive790.68800.9241
Note. Interval-wise statistics are computed from the locked ensemble predictions after grouping samples according to ground-truth sentiment intensity and therefore do not represent between-seed variability.
Disclaimer/Publisher’s Note: The statements, opinions and data contained in all publications are solely those of the individual author(s) and contributor(s) and not of MDPI and/or the editor(s). MDPI and/or the editor(s) disclaim responsibility for any injury to people or property resulting from any ideas, methods, instructions or products referred to in the content.