


Abstract
Solutions with NaCl and Na2SO4 mixture simulating three real industrial RO waste brines were treated by membrane crystallization (MCr) with the aim of recovering the ions as crystals. In particular, the three different solutions have NaCl and Na2SO4 molar ratios of 1:2, 2:1 and 1:1, respectively. Experiments at two different feed temperatures were performed and analyzed. Results showed that the separation of the NaCl and Na2SO4 mixture can be realized by the MCr process and the Na2SO4 salts were successfully recovered from the mixture. Different morphologies of Na2SO4 crystals were obtained by selecting an appropriate feed temperature. Crystal size distribution (CSD) and cumulative fraction of the crystals were calculated to determine the distribution of the crystals’ size and their variation around the average size. The Na2SO4 salts obtained from all experiments were of high purity, indicating promising salt separation, recovery, and reuse from RO brine from a sustainable perspective.
1. Introduction
Human activities on Earth consumes a lot of resources, such as fossil fuels, water, raw materials, etc. Therefore, the amount of resources available is becoming increasingly scarce. As human activities are highly reliant on the Earth’s resources, recovering them from waste and reusing them is one of the most important and valuable strategies for sustainable development. Membrane operations are technologies that can be effectively applied to resource recovery, including membrane crystallization (MCr), one of the most advanced membrane technologies that can achieve zero liquid discharge and has attracted growing attention in recent years. It is a thermally driven membrane process in which hydrophobic porous membranes are used as the separation media. The driving force of MCr lies in the vapor pressure difference between the feed and permeate sides. The volatile components (normally water vapor) are transferred from the feed solution across the membrane pores, and collected in the permeate side. The solutes in the feed side therefore become concentrated and crystallized when approaching the saturated level [1]. When the feed is a salt solution, MCr allows for the simultaneous production of desalinated water and salts, adding value to the entire process. Although various studies have investigated the crystallization of salts from synthetic single-salt solutions [2,3,4], the real challenge is to achieve the selective separation of individual salts from multicomponent mixtures, such as seawater or wastewater. Undoubtedly, developing this capability would represent a major breakthrough for both scientific research and human development.
This paper aims to make an initial contribution to the study of direct contact membrane crystallization (DCMCr) for common-ion salt mixtures by presenting the experimental results related to the recovery of Na2SO4 (of high purity) from synthetic RO brines of Na2SO4 and NaCl in water, without any chemical addition and related processing procedures. Although some articles in the literature report the recovery of Na2SO4 from salt mixtures [5], they normally involve chemical cleaning or are combined with other operating processes. Na2SO4 and NaCl separation is traditionally performed by evaporation crystallization, antisolvent crystallization [5], or frozen crystallization, etc., which generally present the problem of co-crystallization, or with impurity ions, etc. Shi et al. [6] recovered Na2SO4 and NaCl using ultrafiltration (UF) to pre-filter calcium, silica, or other organic ions from coal chemical wastewater. Then, nanofiltration (NF) was used to separate monovalent from divalent ions (i.e., to separate SO42− and Cl−). Finally, the salts were dried using evaporation crystallization. HCl and H2SO4 solutions were used to clean the membranes. Quist-Jensen et al. [7] recovered thernadite from industrial wastewater and compared the performance of NF-pretreated real industrial wastewater in MD and MCr with that of wastewater without pretreatment. Their results showed that the unpretreated wastewater yielded Na2SO4 of higher purity, indicating the potential for recycling salts from wastewater. Wang et al. [8] separated Na2SO4 and NaCl using a hybrid method through frozen crystallization and stepwise decompression evaporation. They provide a theoretical basis for salt recovery from salt mixtures by combined methods.
Regarding Na2SO4 poly-morphologies, articles can be found in the literature showing that there are different types of Na2SO4 crystals, including Na2SO4 (thenardite), Na2SO4•H2O, Na2SO4•7H2O (heptahydrate), and Na2SO4•10H2O (mirabilite). For thenardite, there are also five different morphologies: phase I, phase II, phase III, phase IV, and phase V. Phases I, II, and IV are formed at high temperatures and regarded as metastable phases under ambient temperatures. Phase V and phase III are relatively more stable and phase V is the most stable. Thenardite phase V crystals are hexagonal, while thenardite phase III crystals are generally needle-shaped [9].
In this study, Na+, SO42− and Cl− ions are present in the feed solution, with varying compositions, simulating the composition of three different industrial wastewater streams, with molar ratios of NaCl and Na2SO4 at 1:2, 2:1, and 1:1, respectively. The molar ratios were selected according to two types of industrial RO brines: one South African mining plant and one Chinese industrial plant (see the compositions from SI: Section S1, Tables S1 and S2) [10,11,12]. As indicated from these solutions’ composition, the molar ratio of Na2SO4: NaCl in the RO brine, disposed from the South African mining wastewater, ranges from 1:1 to 2:1; while the ratio disposed from the Chinese papermaking industrial wastewater is 1:2. Therefore, the molar ratios for the two salts were chosen as 1:2, 2:1, and 1:1, respectively. Two different feed temperatures (30 °C and 45 °C) were investigated in MCr, to obtain the different morphologies of Na2SO4 crystals and, at the same time, to realize the separation of NaCl and Na2SO4. The obtained Na2SO4 crystals were analyzed and identified. To the best of our knowledge, this is the first attempt to separate NaCl and Na2SO4 by DCMCr from the synthetic solutions simulating RO industrial brine, without any chemical addition or combined operation process.
2. Experimental
2.1. Materials
Analytical-grade sodium chloride (NaCl), and sodium sulfate (Na2SO4) were purchased from VWR International bvba Geldenaaksebaan 464-B-3001 Leuven, Belgium, which were used without further purification. Deionized water was prepared in the laboratory (Water purification system, ZENEER RO 180 VER 2.0, Serial No. ZE 5131108-110-K.T.LEE, Human corporation, Seoul, Republic of Korea). Commercial PP hollow-fiber membranes were purchased from Membrana 3M (Wuppertal, Germany). The membrane module prepared in the laboratory contains three commercial PP hollow-fiber membranes in a glass tube. The specific parameters of the membrane are listed in Table 1.
Table 1.
Commercial PP hollow-fiber membrane parameters [13].
2.2. Crystal Morphology Estimation
Since all feed solutions contain NaCl and Na2SO4, the precipitated crystals may consist of either salt. Generally, the compound with the lower solubility precipitates first. According to the single-salt solubility data (Table 2), Na2SO4 has a significantly lower molar solubility than NaCl; therefore, Na2SO4 is expected to crystallize first. The solubility of NaCl increases slightly with temperature, rising from 35.7 g at 0 °C to 39.8 g at 100 °C [14]. In contrast, Na2SO4 exhibits non-monotonic solubility behavior over the same temperature range. From 0 °C to approximately 40 °C, its solubility increases sharply from 4.9 g to 48.8 g. Beyond this temperature, however, it gradually decreases to 42.5 g at 100 °C. This difference can be explained by thermodynamic considerations. The dissolution of NaCl involves the hydration of Na+ and Cl− ions, and the associated enthalpy change is slightly positive. As a result, the dissolution process is mildly endothermic, and increasing the temperature shifts the equilibrium toward greater dissolution. In contrast, sodium sulfate exhibits anomalous solubility behavior characteristic of many alkali metal sulfates. Its solubility increases with temperature up to approximately 32.38 °C and then decreases as the temperature rises further [9]. Accordingly, dissolution is endothermic below this transition temperature and becomes exothermic above it. In general, solubility is influenced by several factors, including solvent polarity and hydrogen bonding interactions [15]. In the case studies reported here, both salts are dissolved in water, and the common-ion effect of Na+ must also be taken into account, as it affects the overall solubility equilibrium [16].
Table 2.
Solubility of NaCl and Na2SO4/100 g water.
As mentioned above, Na2SO4 crystals can precipitate as Na2SO4·10H2O (mirabilite), Na2SO4·7H2O (heptahydrate), or anhydrous Na2SO4 (thenardite) [17]. These phases form under different operating conditions, such as temperature, concentration, and relative humidity [18]. Figure S1 [19,20] presents the phase diagram of Na2SO4 as a function of temperature and concentration. Since the tested feed temperature was approximately 30 °C (303.15 K), it can be estimated that the resulting Na2SO4 crystals may be either thenardite or mirabilite when only Na2SO4 is present in the solution (according to Figure S1a). Because the Na2SO4 concentrations in all three feeds were above 50 wt% (as shown in Table 3), the crystals were likely thenardite at the early stage of the experiment (see Figure S1b). As crystallization progressed and the Na2SO4 concentration gradually decreased, the crystal morphology may have changed accordingly.
Table 3.
NaCl and Na2SO4 mixture solution composition for three different feeds tested in DCMCr.
Figure S2a illustrates the temperature-dependent solubility of different Na2SO4 phases: (1) Na2SO4•10H2O; (2) Na2SO4 V; (3) Na2SO4 III; (4) Na2SO4•7H2O (freezing temperature); (5) Na2SO4•7H2O (boiling temperature); and (6) modeling results reported by Steiger et al. [18]. This figure represents the case of pure Na2SO4 in solution. It shows that between 0 and 32 °C, Na2SO4 precipitates as Na2SO4·10H2O (line 1). With further temperature increase, it transforms into Na2SO4 V (line 2). When additional salts are present in the solution, the precipitated crystals may contain less water of crystallization, such as Na2SO4·7H2O (line 4). Around 28 °C, a transformation to Na2SO4 III (line 3) may occur, after which the solubility of Na2SO4 gradually decreases with increasing temperature up to 100 °C.
The situation changes when NaCl is present in the solution. As shown in Figure S2b, the solubility of Na2SO4 decreases with increasing NaCl concentration. In addition, the transition temperature to Na2SO4 III decreases as the NaCl concentration increases [21]. The transformation temperature is 32.38 °C in the absence of NaCl. It decreases to 29.5 °C when the NaCl concentration is 5%, and further declines to 25 °C when the NaCl concentration reaches 15%.
2.3. Tested Feed Solutions
Three different feeds (named as Feed 1, Feed 2, and Feed 3) were prepared (see in SI Section S2) and tested in DCMCr at the temperature of 30 °C. The composition of the three feeds is shown in Table 3.
The initial salt concentration values are close to their corresponding saturation level of the mixture at a feed temperature of 30 °C.
2.4. DCMCr Tests
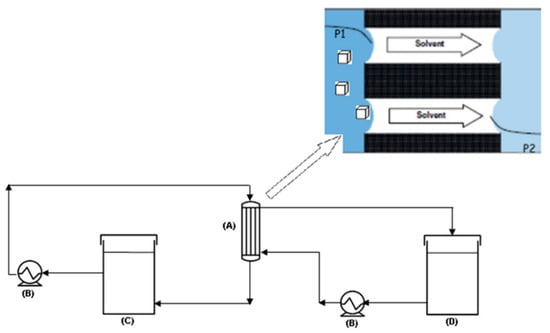
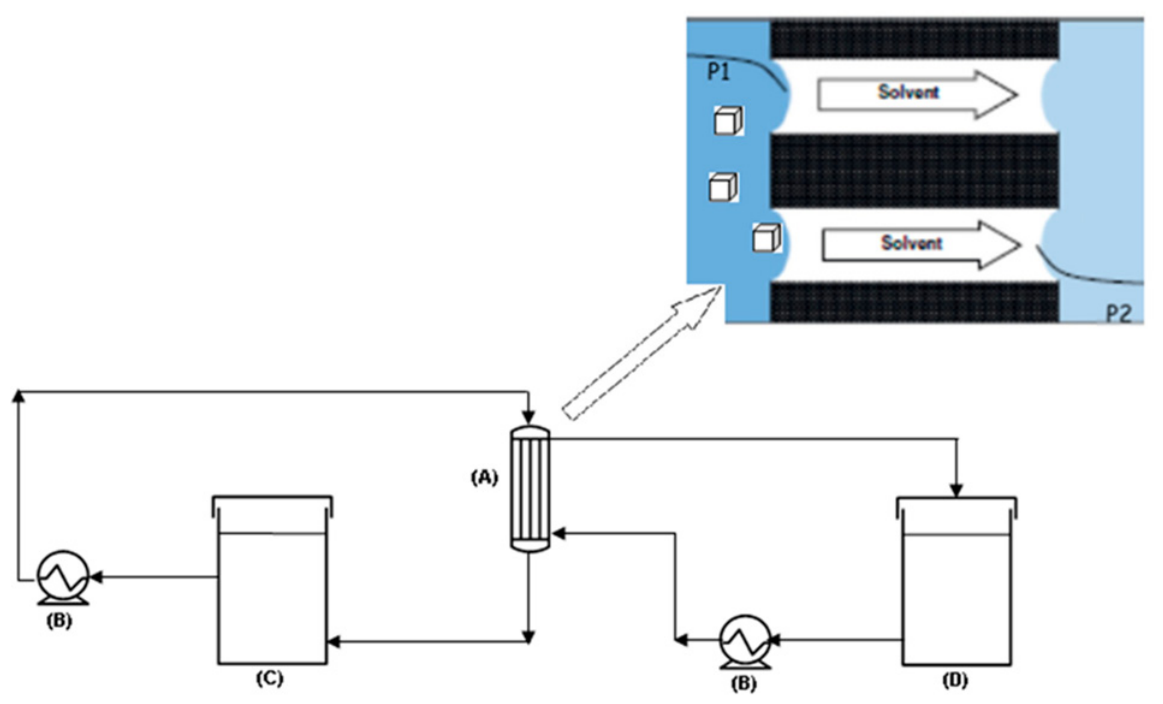
All three different feeds with different NaCl/Na2SO4 ratios were investigated in DCMCr tests, a process where water molecules evaporate at the interface of the microporous hydrophobic membranes on the feed side, diffuse through the membrane pores, and condense on the cold side. Therefore, the feed solutions are concentrated continuously up to the saturated level when the crystals precipitate from the solution and crystals can be recovered. The feed and permeate temperatures are around 30 °C and 10 °C, respectively. The feed and permeate flow rates are set at 250 mL/min and 100 mL/min, respectively. The heating and cooling equipments in this configuration consisted of two thermal circulator water baths, FALC SB15 (Treviglio, Italy) and Digital plus NESLAB RTE-17 (Newington, CT, USA) respectively. Two peristaltic pumps (Heidolph Instruments GmbH & Co. kG, Schwabach, Germany and Masterflex®, L/S®, Thermal Fisher Scientific Inc. Loughborough, Leicestershire, UK) were used to circulate the two streams (i.e., retentate and permeate) on the two membrane sides in the counter-current recirculation. A digital balance (EU-C LCD by Gibertini Electtronica S.R.L., Novate Milanese, Italy) was used to measure the permeate collected during the experiment. The schematic diagram of the experimental setup is shown in Figure 1. Each test was repeated to prove the repeatability. The crystals deposited on the bottom of the feed tank were collected and examined under the microscope (Nikon H600 L/Eclipse LV100ND, Nikon Metrology, Tokyo, Japan). An additional experiment, aiming at the production of Na2SO4 crystals exhibiting a different morphology compared to that at 30 °C, was carried out at a higher feed temperature (45 °C), while leaving the other experimental conditions unchanged.
Figure 1.
Schematic diagram of the MCr unit used: (A) membrane module, (B) peristaltic pump; (C) feed tank and (D) permeate tank (adapted from [22]).
2.5. Crystal Analysis
During the experiment, feed samples were withdrawn from the tank and observed by microscopy to check if crystals had formed. After the first crystals were detected, the samples were taken from the feed tank every 30 min, and the obtained images were measured and analyzed to identify the shape and size of the crystals. At the end of each day, the over-saturated feed was filtered, and all the obtained salts were dried in the air and later moved to the oven and dried at around 40 °C to a constant weight. The dried salts were collected and weighted. The selected crystal samples were analyzed by FTIR (PerkinElmer, Spectrum One, New York, NY, USA) and EDX.
2.6. FTIR Analysis
The collected dried salts were stored in the dryer before FTIR analysis. Around 120 mg dried KBr was weighted and mixed with around 1 mg dried salts. Then, the mixed samples were grinded in a marble mortar for several minutes until completely mixed. The mixed powder was pressed in the specially made cylinder mold at around 10 MPa for about 1 min. Afterwards, the pressure was released and a round plate with a thickness of 0.5 mm and diameter of 13 mm was obtained. The achieved samples were placed on the test stand. Before starting the measurement, the background was measured without putting any samples on the test stand.
2.7. EDX (Energy-Dispersive X-Ray Spectroscopy) Analysis
EDX analysis is used to measure the elemental composition of the obtained salts. It is performed using the same machine as SEM (scanning electron microscopy). Salt samples were dried completely and spread evenly onto the tape that was attached to the stabs. Then, the stabs with the samples were pressed upside down to prevent the samples from being extracted in the vacuum chamber. All the stabs were sputtered by a layer of gold before being placed into the vacuum chamber to increase the conductivity. The elements Cl, S, O, and Na were selected. The operation magnification resolution used for EDX is higher than that in SEM.
3. Results and Discussion
3.1. Crystallization of Na2SO4 from Feeds 1, 2, and 3 at 30 °C
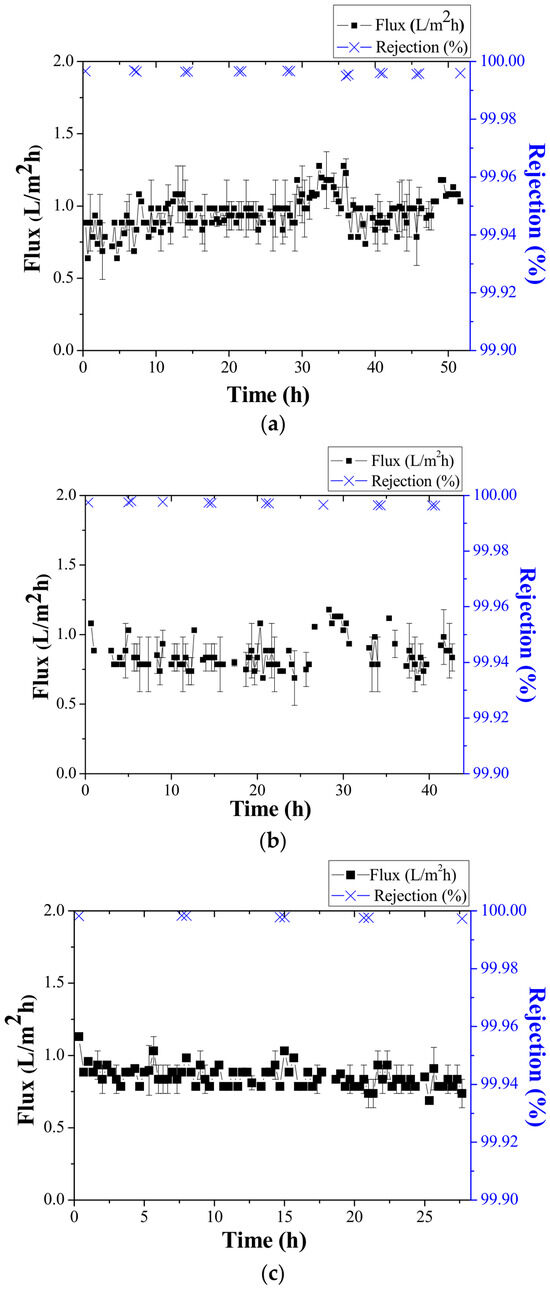
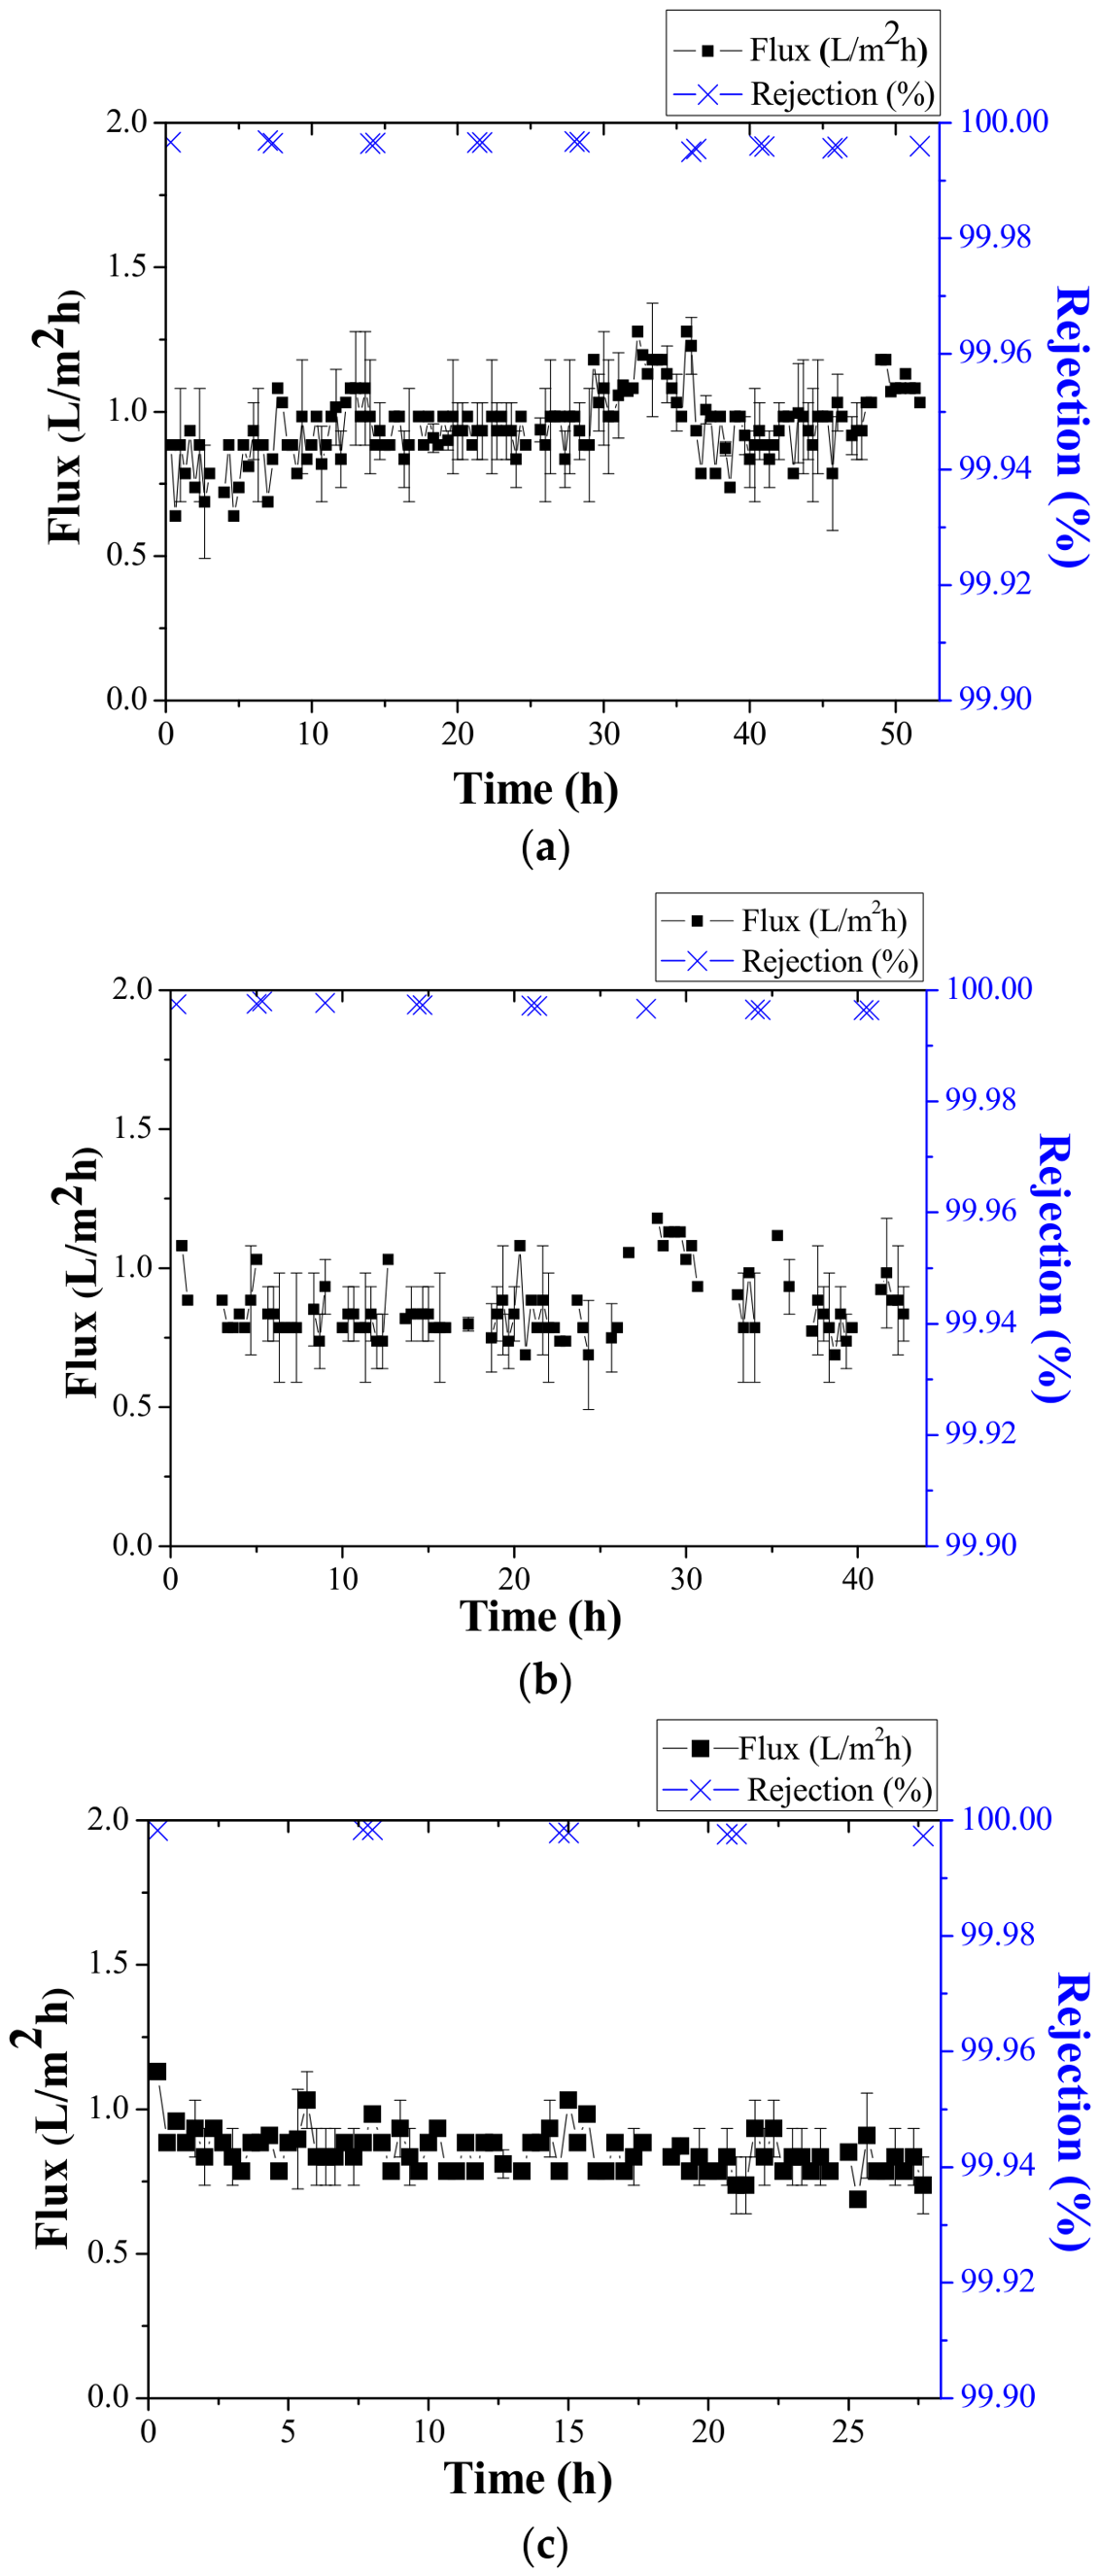
Figure 2 shows the average transmembrane flux and salt rejections associated with the three feeds investigated. It can be seen that the salt rejections are all above 99.99%, showing the excellent separation ability of the commercial PP hollow-fiber membrane. The total operation time varies among the three used feeds due to differences in their compositions, which affect the time required for crystal formation. The flux of Feed 1, around 1 L/m2h, proved slightly higher than that of Feeds 2 and 3 (about 0.8 L/m2h). This is due to the relatively lower concentration of Feed 1 (325.35 g/L) compared to Feed 2 (364.7887 g/L) and Feed 3 (360.9 g/L). The lower concentration solution has a higher activity coefficient of water and water vapor pressure. The driving force was therefore increased for vapor to pass through the membrane pores [23]. At a lower feed concentration, the concentration polarization phenomenon is less severe than that at a higher feed concentration [24,25]. Also, the error bar of the fluxes for Feed 1 and Feed 2 is larger than that of Feed 3, which means that the flux fluctuation for Feeds 1 and 2 are larger. The flux obtained with Feed 3 proves more stable compared with that of Feeds 1 and 2. The crystals of Na2SO4 are obtained when the concentration of the feed approaches solubility (i.e., 2.55 mol/L for Feed 1; 2.02 mol/L for Feed 2; and 2.3 mol/L for Feed 3, respectively at 30 °C), as will be further analyzed in the next section. There is almost no flux decline throughout the experimental operation period, indicating no scaling and/or fouling on the membrane. Also, the conductivity of the permeate remained at a low level (around 20 μS/cm) and the membrane maintained its hydrophobicity during the experimentation, indicating that no wetting occurred.
Figure 2.
Fluxes and salt rejections for (a) Feed 1, (b) Feed 2, and (c) Feed 3, respectively.
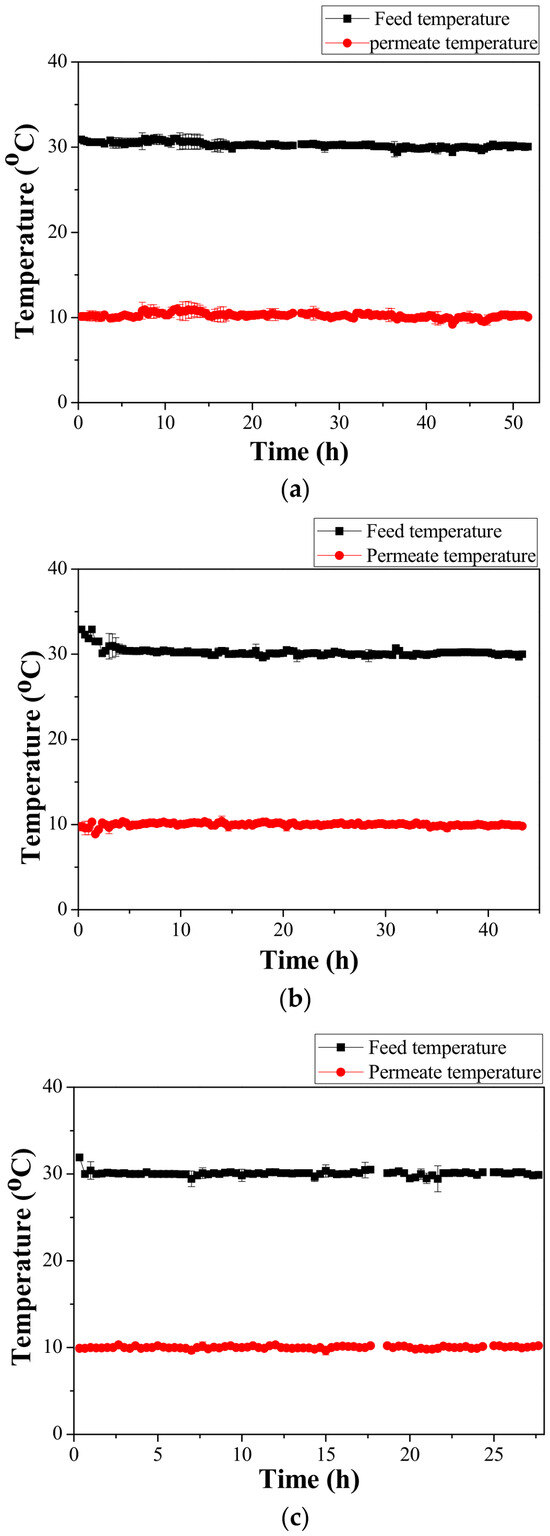
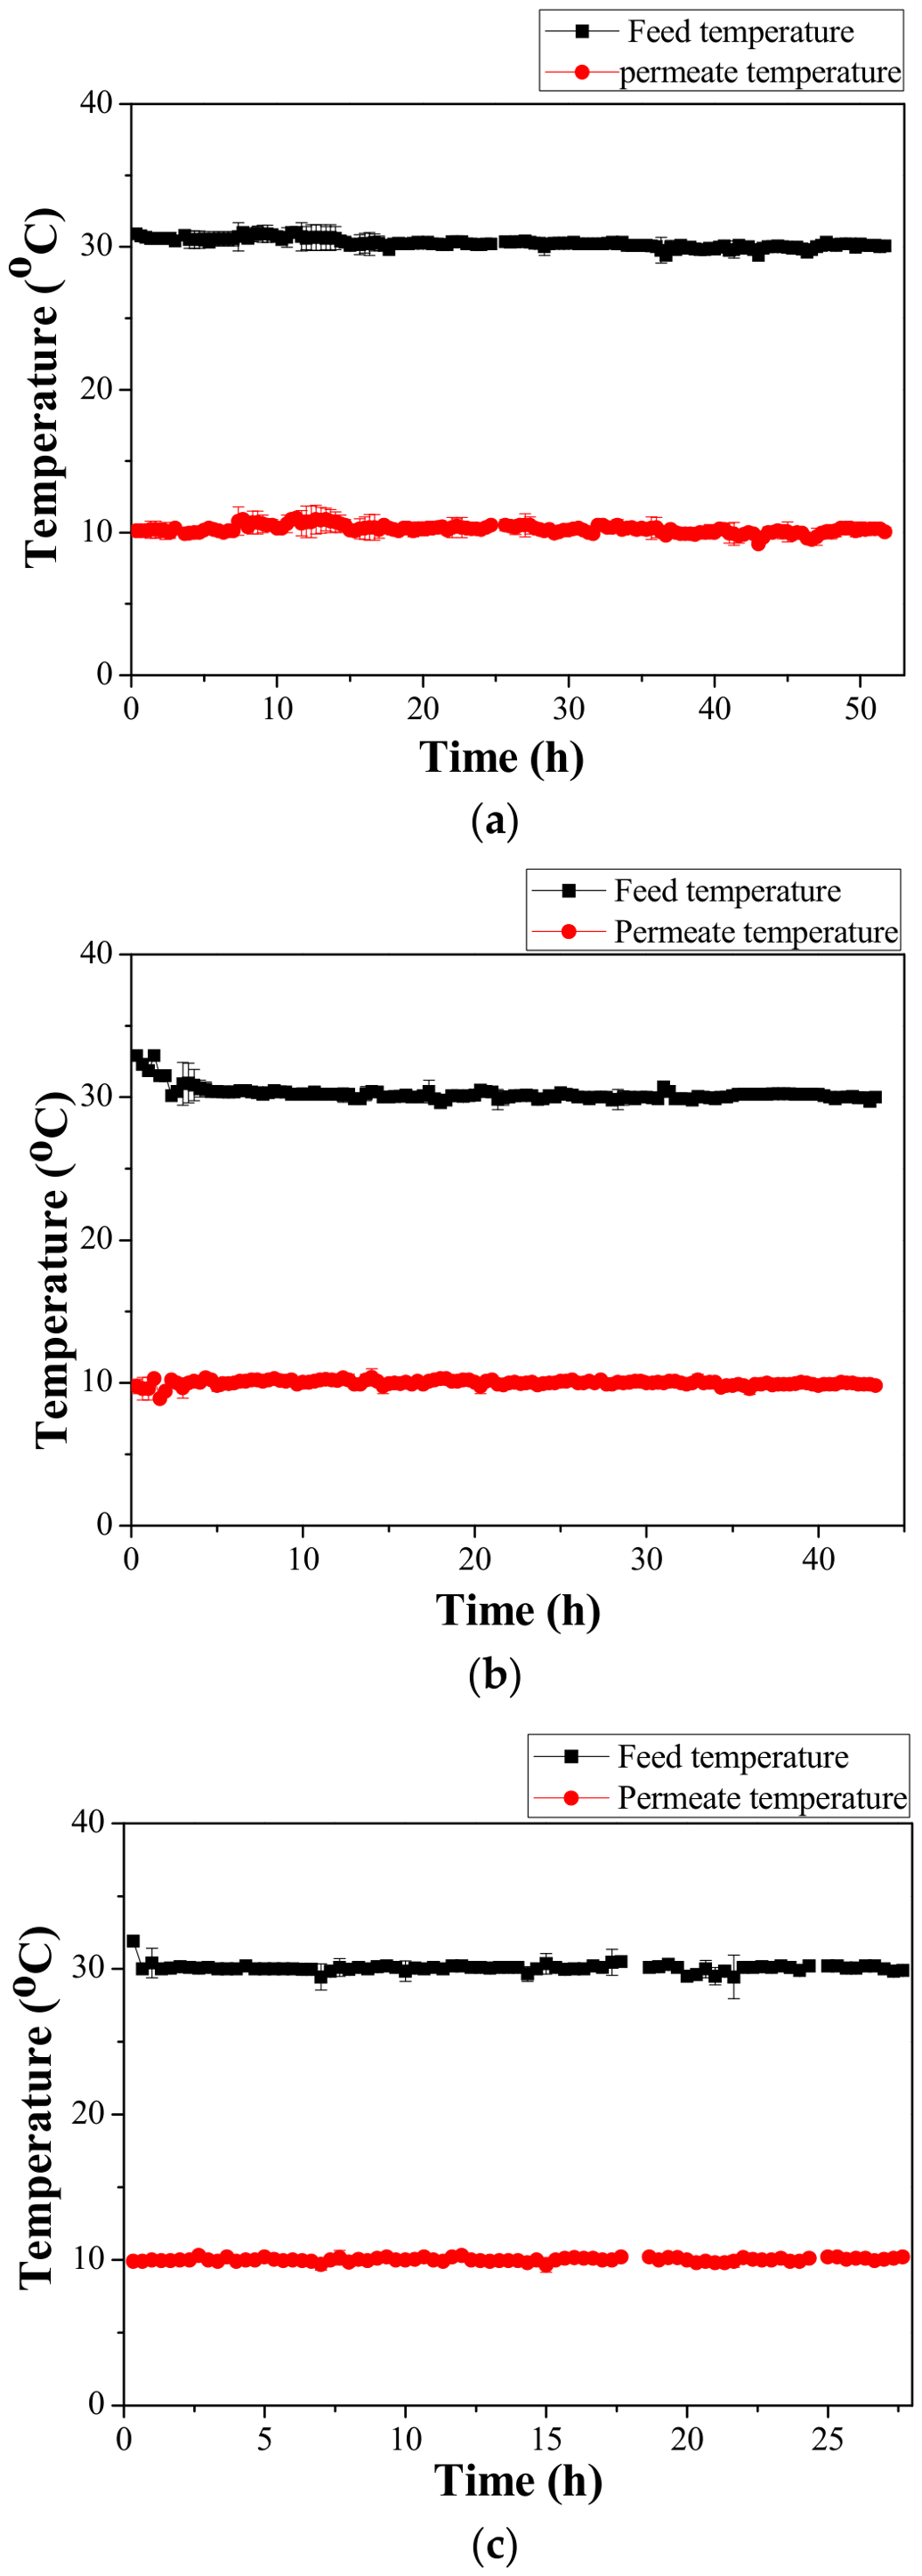
Figure 3 presents the temperature fluctuations during the tests. It can be seen that the temperature remained stable on both sides of the membrane in all three tests. This ensured a stable temperature gradient of 20 °C throughout the tests. Therefore, any flux variations recorded during the experiments had to be attributed only to the feed-side concentration. Table 4 lists the average time in which the first crystals of Feed 1, Feed 2, and Feed 3 occurred. The obtained average crystallization times differ from one feed to another, due to the diverse initial concentration of the salt mixtures and solubility of Na2SO4, as illustrated by Table 3. Moreover, good repeatability of the tests carried out can be observed.
Figure 3.
Temperature variation of feed and permeate side for (a) Feed 1, (b) Feed 2, and (c) Feed 3 as a function of time.
Table 4.
First crystallization time for each feed (500 mL).
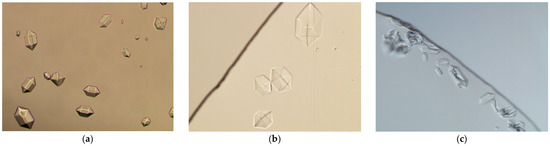
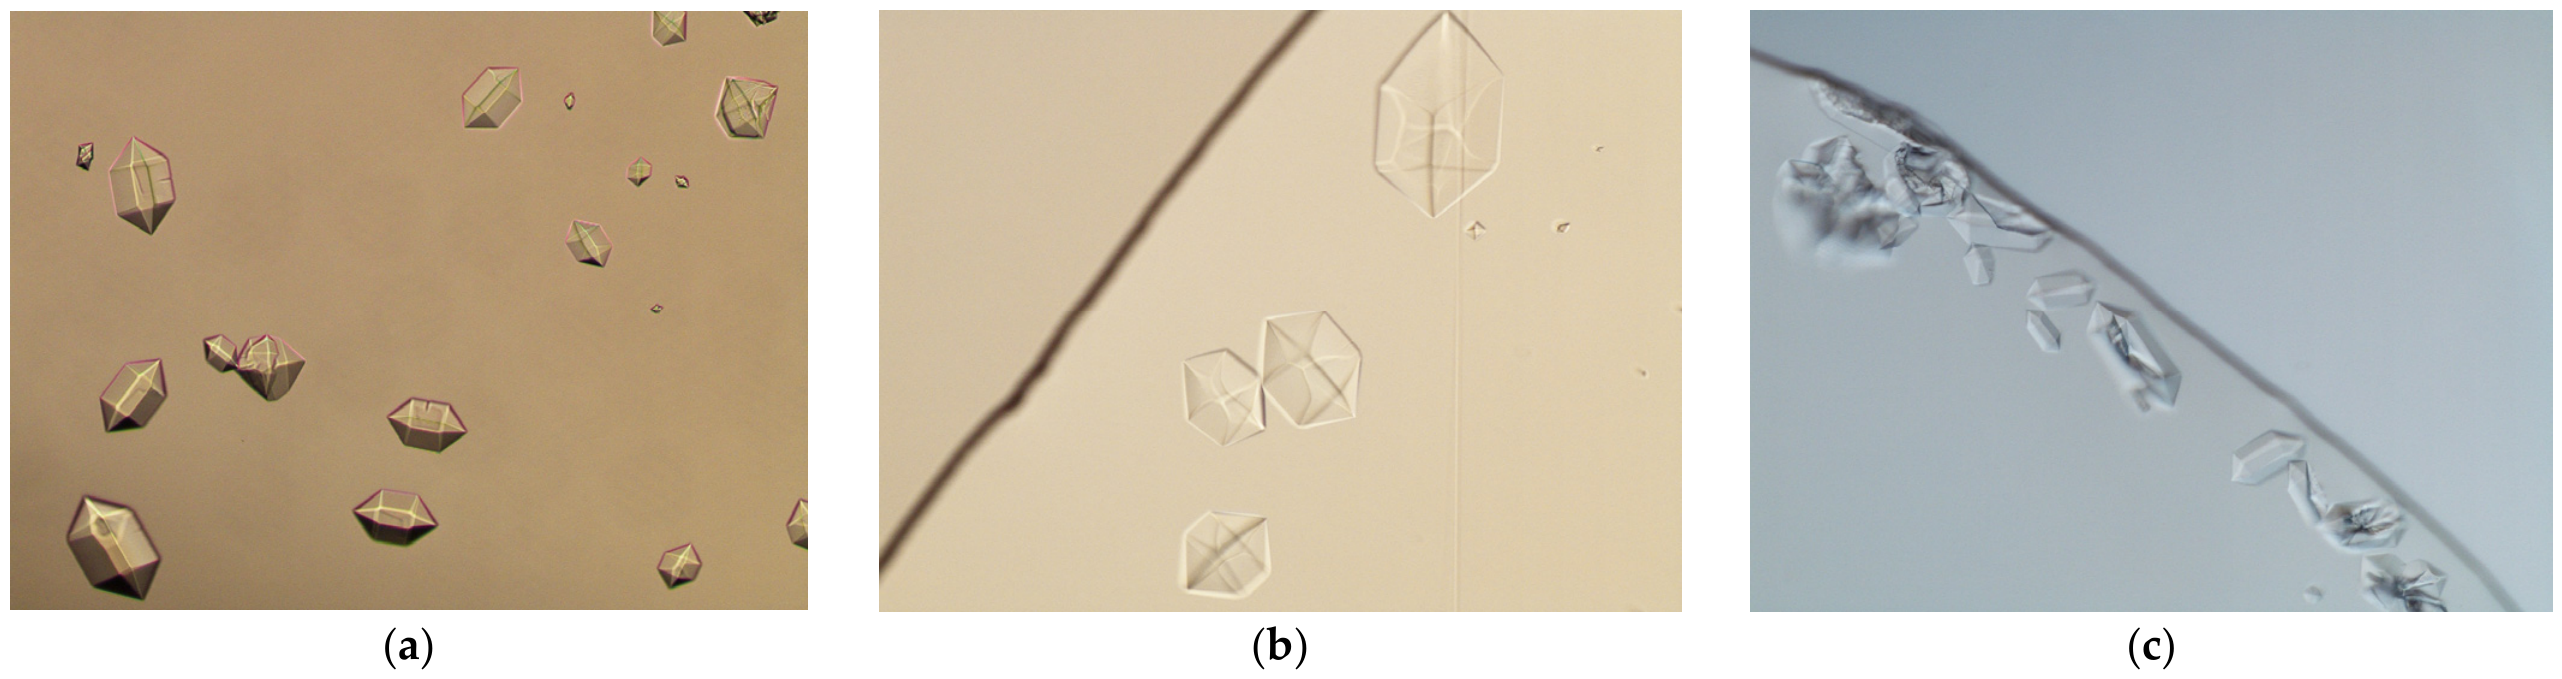
Figure 4 shows the microscope images of the crystals obtained in each experiment as soon as the crystals occurred. All the Na2SO4 crystals produced exhibit a hexagonal morphology, corresponding to thenardite phase V [26]. This is in agreement with the crystal morphology from the literature [26]. The crystals obtained in the experiment gradually expanded, which indicates their growth as the crystallization test progressed. The purity of the obtained salts was analyzed by FTIR and EDX (see Section 3.3 and Section 3.4).
Figure 4.
Microscope images of the first crystals for (a) Feed 1, (b) Feed 2, and (c) Feed 3 (magnification: ×20).
For each feed, Table 5 presents the data of the total experimental time and the middle diameter (dm) of the obtained crystals. It also includes the values of the coefficient of variation (CV), which has been calculated according to the following Equation (1):
where PD is the crystal length at the indicated percentage. It follows that lower CVs are associated with a narrow crystal size distribution (CSD).
Table 5.
Data of the obtained Na2SO4 (phase V) crystals at the feed temperature of 30 °C.
The CVs of the three feeds reported in the table were similar, with values of approximately 30%, indicating a narrow crystal size distribution (CSD). When compared with single-salt Na2SO4 crystals recovered by MCr at a similar feed temperature reported in the literature [7], the presence of NaCl appears to slightly influence the CV, reducing it from about 40% to around 30%. As the NaCl content in the feed increases, the CV tends to decrease further, resulting in a narrower CSD [7]. Moreover, the measured crystal size (middle length) shows a decreasing trend with increasing NaCl fraction (molar ratio) in the feed solution (Feed 1 Feed 3 Feed 2).
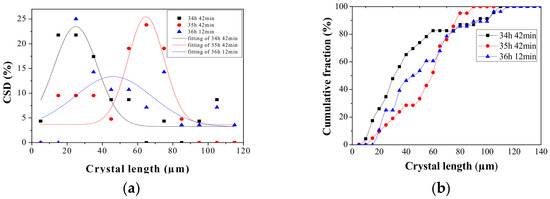
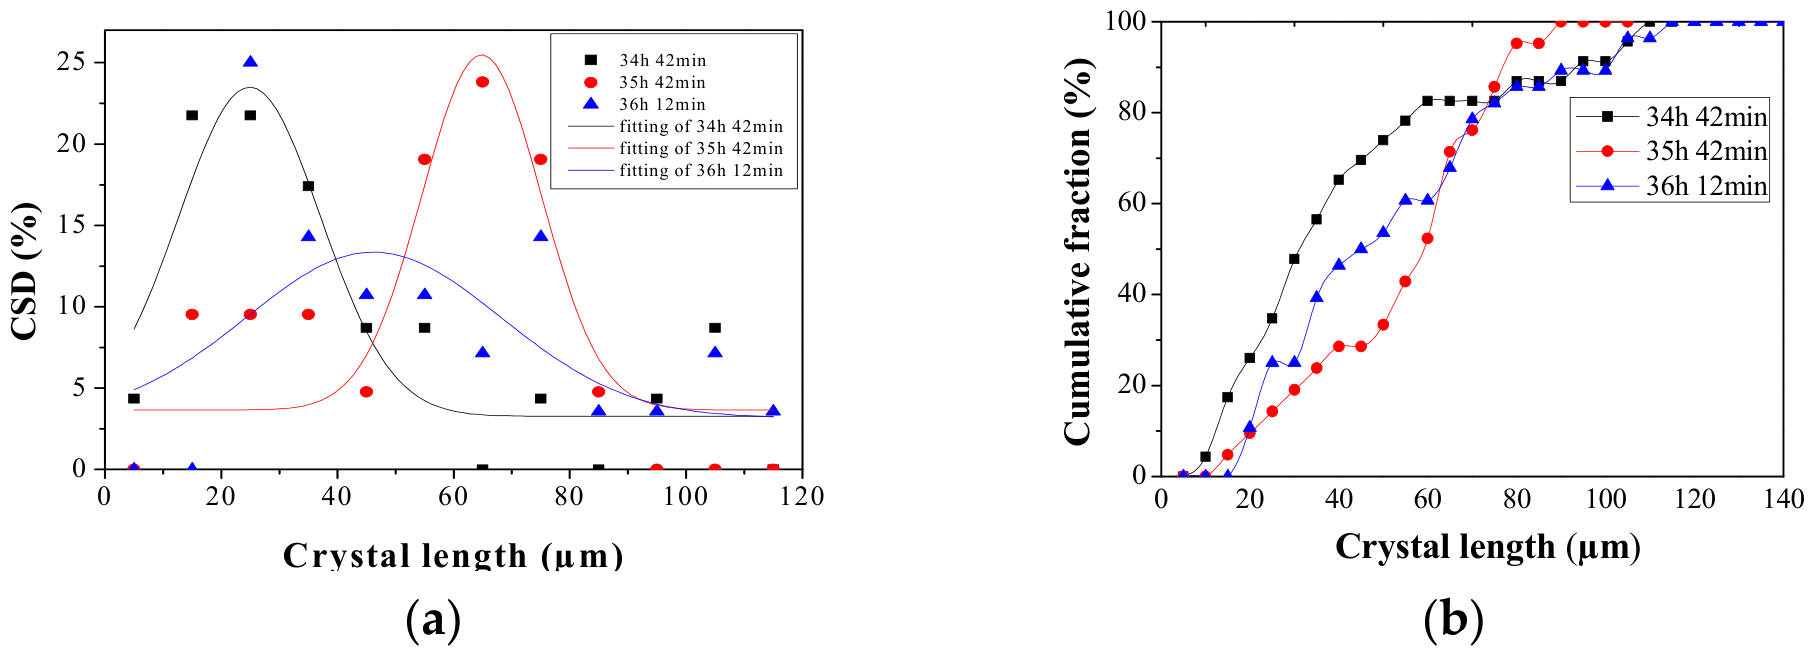
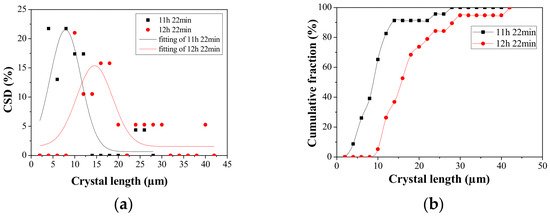
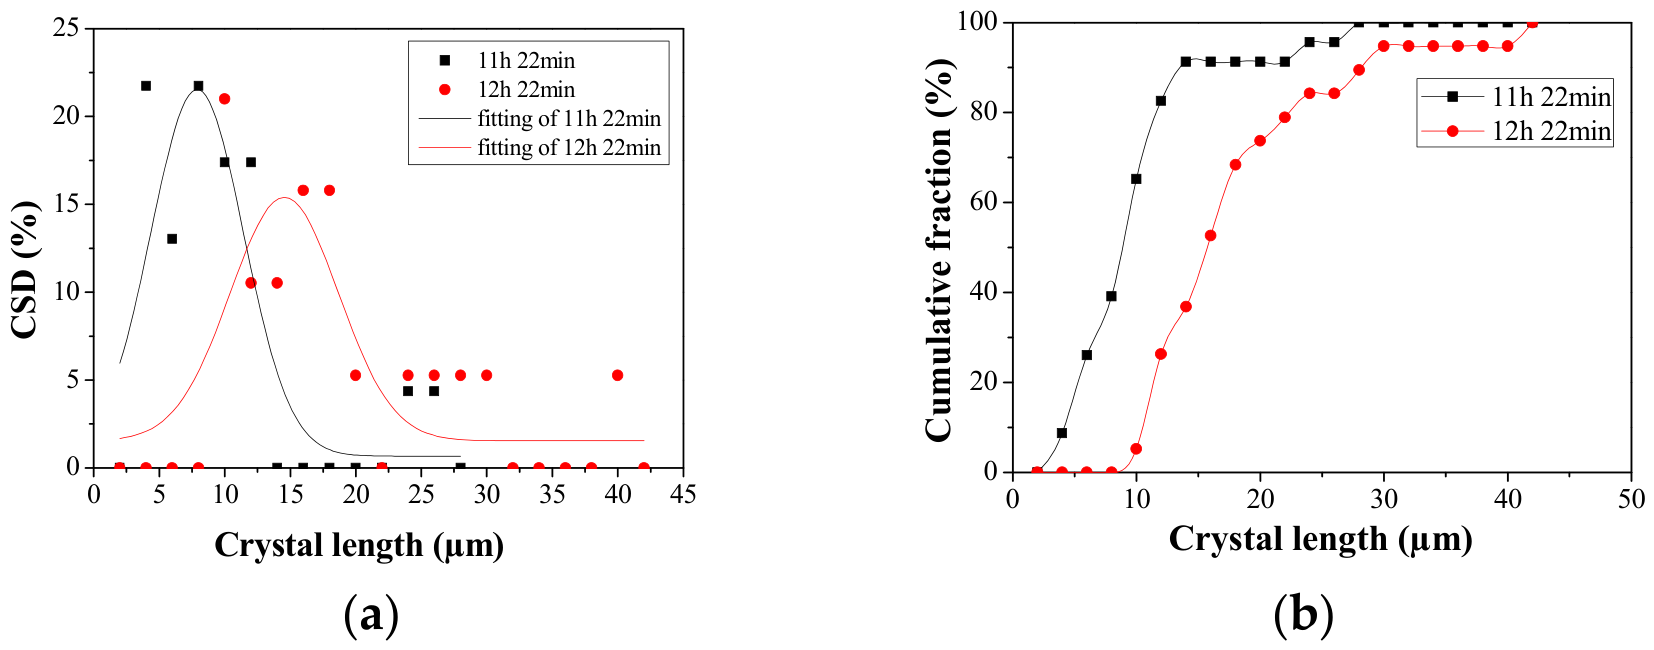
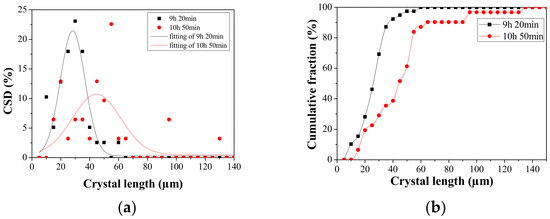
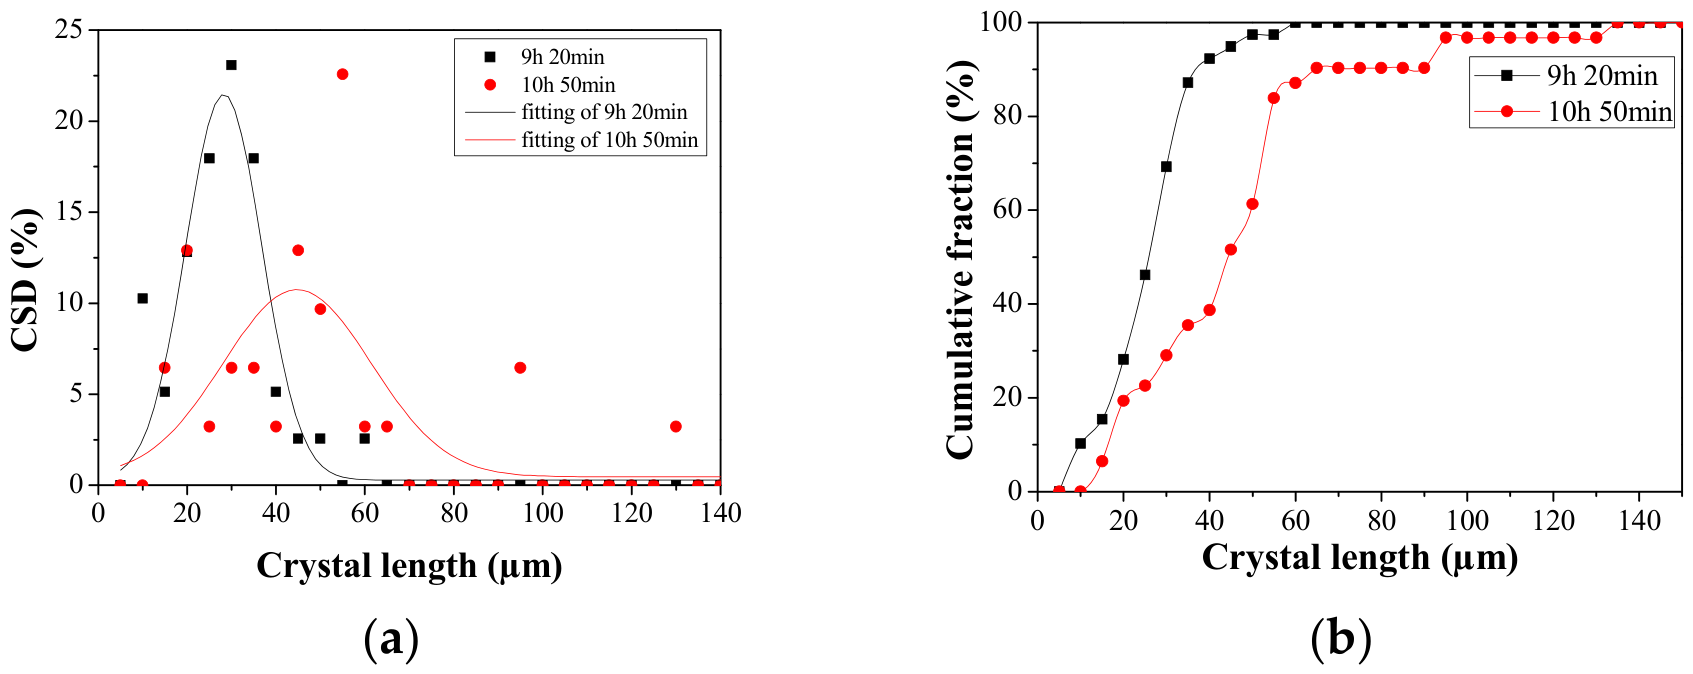
The crystal size distribution (CSD) and the cumulative distribution fraction for Feed 1, Feed 2, and Feed 3 are reported in Figure 5, Figure 6 and Figure 7, respectively. The CSD curves were fitted using a symmetric normal distribution (Gauss) model. During the fitting procedure, a small number of data points that were identified as outliers and deviated significantly from the main distribution were excluded in order to obtain a representative fit of the dominant particle population. The discussion of the CSD peak positions is based on the fitted distributions representing the main crystal population rather than on the excluded outlier data. The trends reported in Figure 5, Figure 6 and Figure 7 show, for the three feeds, the shift of the curves towards larger dimensions, which is indicative of the growth process of the crystalline material as time passes.
Figure 5.
(a) CSD of Na2SO4 crystals produced from Feed 1 and (b) the corresponding cumulative fraction of crystals obtained at 30 °C.
Figure 6.
(a) CSD of Na2SO4 crystals produced from Feed 2 and (b) the corresponding cumulative fraction of crystals obtained at 30 °C.
Figure 7.
(a) CSD of Na2SO4 crystals produced from Feed 3 and (b) the corresponding cumulative fraction of crystals obtained at 30 °C.
Figure 5a refers to the CSD of Feed 1, at different crystallization times. It can be observed that the CSD of the first sample, promptly removed from the setup as soon as the crystals are visible, was very narrow at the length of 25 μm. Due to the crystal growth, the peak of the CSD curve moved at around 65 μm after 1 h since the start of crystallization. As the experimental time continued to 30 min, the peak moved back instead (around 43 μm), which was probably due to the precipitation of the big crystals and the formation and growth of the new smaller crystals.
Figure 6a shows that the peak of the CSD curve shifts to the right after 1 h of the Feed 2 crystallization test, from around 5–10 μm to about 15 μm, again indicating the gradual growth of crystal size over time.
From Figure 7a, it can be seen that at the time of 9 h 20 min, the crystal size shows a narrow distribution and the peak occurred at around 30 μm. After about 1 h 30 min, the peak moved to 45 μm, indicating the growth of the crystals. However, the distribution enlarges, indicating the formation of new crystals (as also proved by the increase in CV in Table 5). The CSDs of Na2SO4 crystals for the other two feeds also showed a similar growth trend. The cumulative fractions for all three feeds gradually reach their 100% status from 0% in terms of crystal length. The sharper slope (the black line) for Feeds 2 and 3 compared to Feed 1 indicates that more crystals emerged in the smaller crystal size range. This means that when the percentage of NaCl (molar ratio) is more than 50% in the feed solution (Feeds 2 and 3), the crystal sizes tend to be smaller (which agrees with the data in Table 5).
3.2. Crystallization of Na2SO4 from Feed 1 at 45 °C
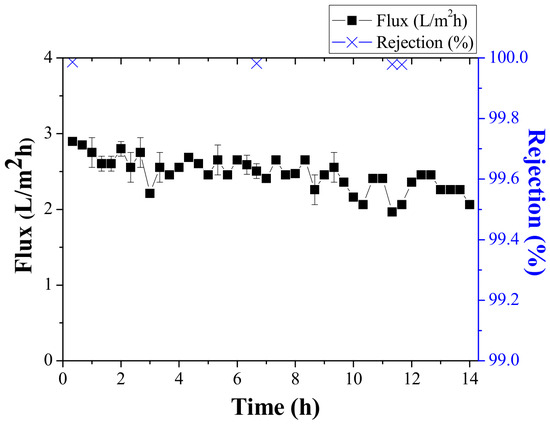
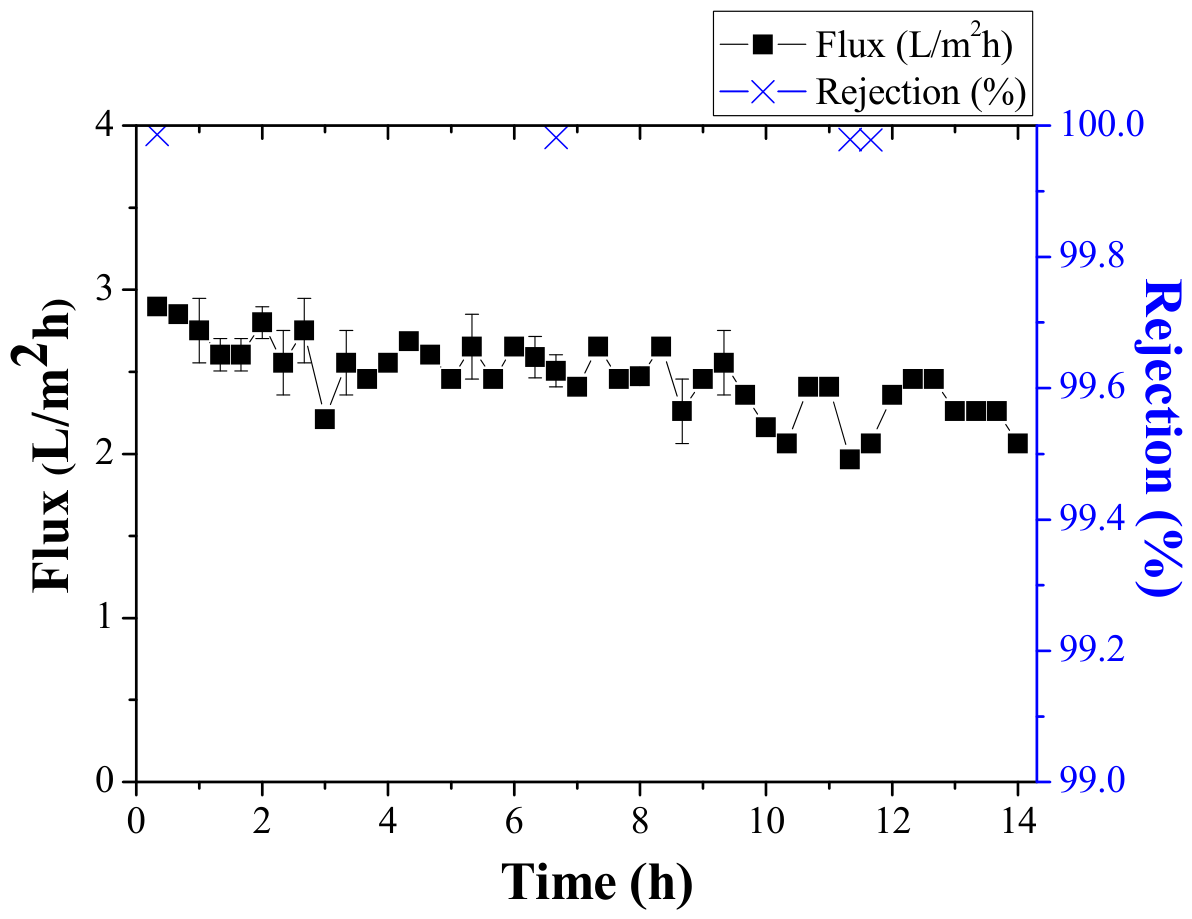
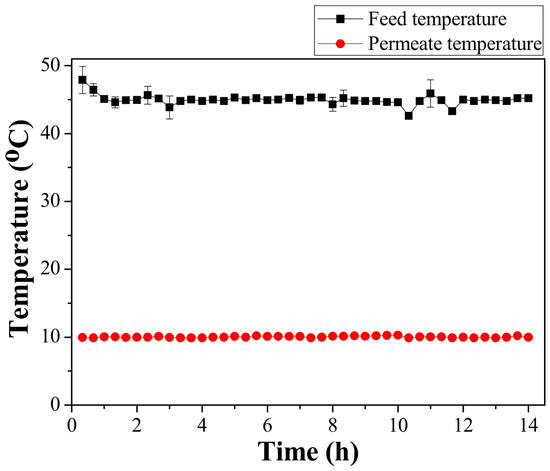
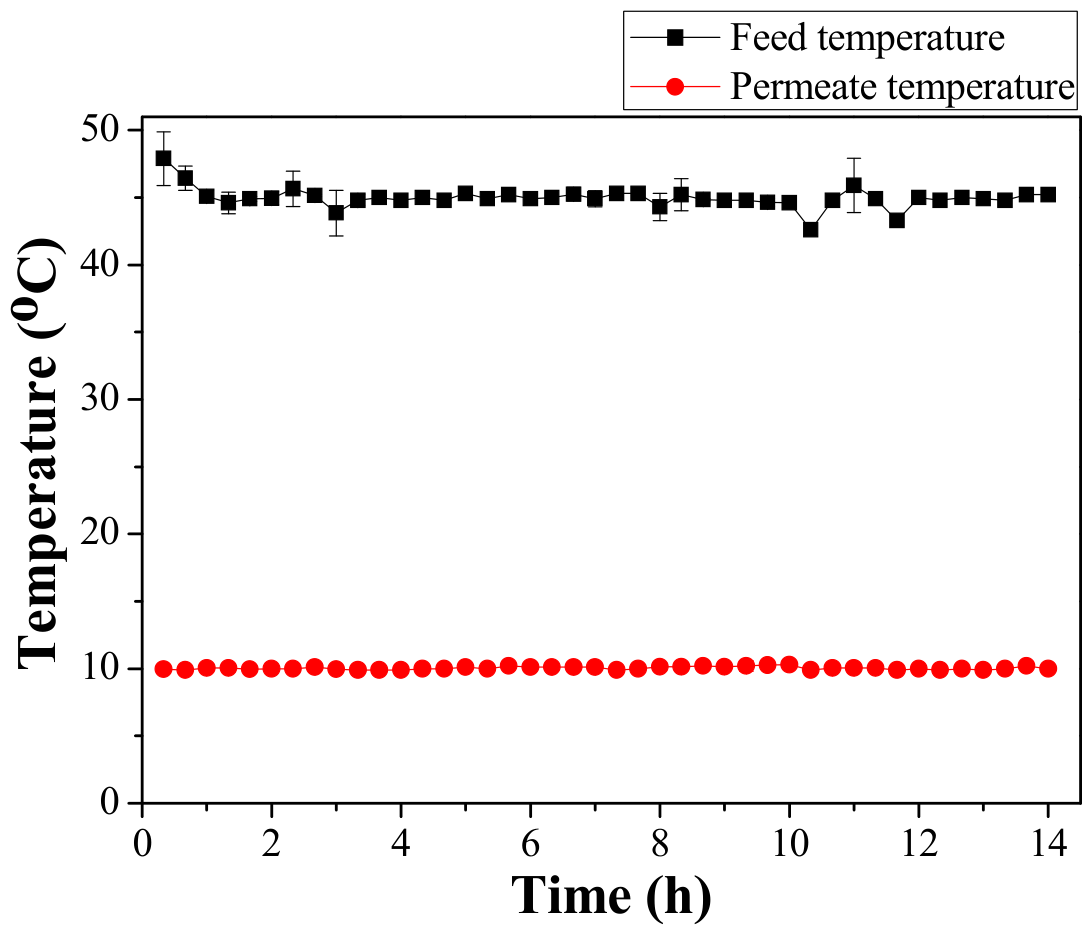
As indicated above, if crystallization occurs at temperatures above 30 °C, Na2SO4 crystals present a different crystal morphology [21]. For this reason, tests aimed at a different crystallizing polymorphic form of Na2SO4 were performed at around 45 °C. Among the feed compositions proposed in Table 3, Feed 1 was selected for the test due to its relatively high concentration of Na2SO4. The trend of flux and salt rejection over time is shown in Figure 8. Compared to Figure 2a, the flux increased by about 2.5 times, with an average value of around 2.5 L/m2h, due to the higher temperature applied on the feed side. The flux shows a slight decline with operation time. This indicates that the membrane fouling phenomenon occurred gradually (caused by the increase in concentration feed-side). This phenomenon is due to the increase in driving force with temperature and, therefore, higher transport of water vapor passing through the membrane pores, which increases the concentration of ions more quickly than at a lower temperature. Therefore, the concentration polarization phenomenon is more severe than that at the lower temperature. Also, the fast transport of water vapor strengthened the crystals blocking on the membrane surface and increased the fouling phenomenon. Moreover, the temperature polarization at this higher temperature was more severe than that at a lower temperature [27]. Salt rejections all remained above 99.99%, indicating no membrane wetting. The temperatures on the feed and permeate side are shown in Figure 9. It can be observed that the temperature gradient between the two sides of the membrane is almost stable along the test and equal to around 35 °C.
Figure 8.
Flux and salt rejection of Feed 1 tested under the temperature of 45 °C.
Figure 9.
Temperature variation of Feed 1 for feed and permeate side as a function of time.
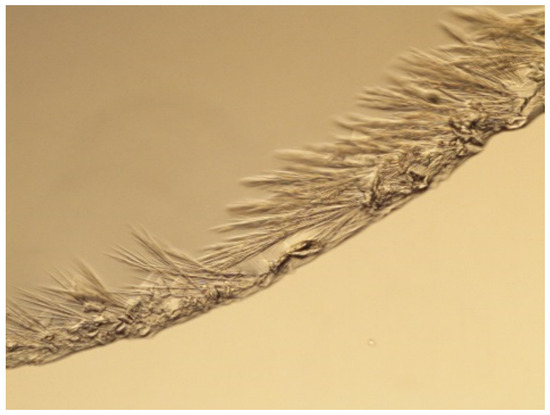
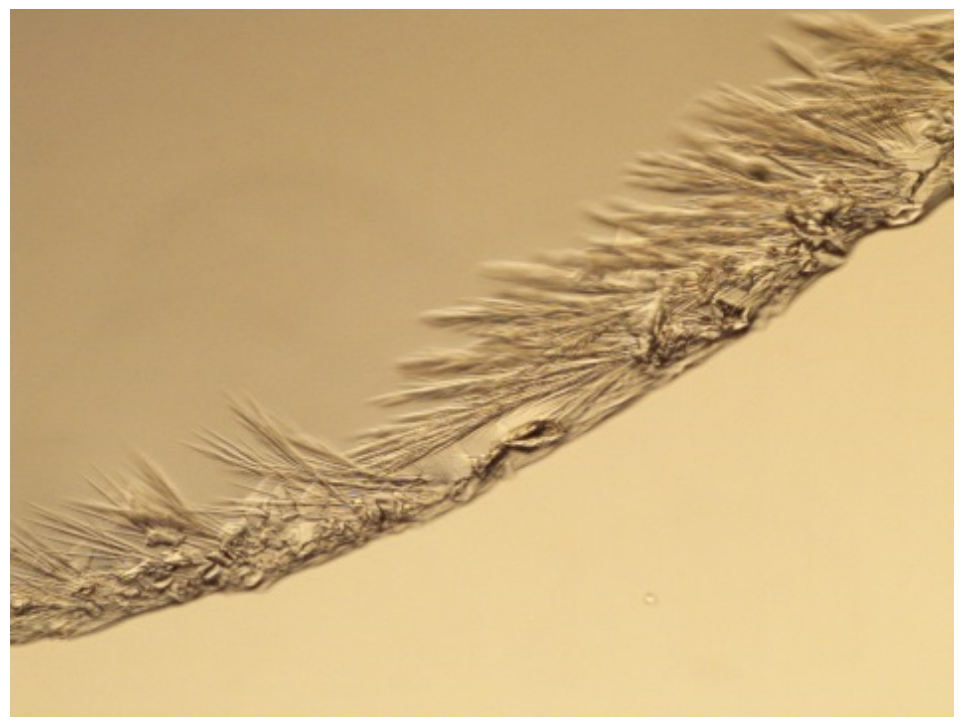
The morphology of the obtained crystals is presented in Figure 10. Crystals present a particular needle shape, which is very different from those exhibited by crystals produced at 30 °C (see Figure 4). They correspond to metastable thernadite phase III, as estimated in the previous Figure S2, showing the relationship of the crystal type with temperature. This is also in accordance with the images from the literature [28,29] and confirms that by changing the condition of the crystallization environment (such as temperature), it is possible to adjust the crystal type and morphology.
Figure 10.
Crystal images obtained from Feed 1 at the temperature of 45 °C (magnification: 20).
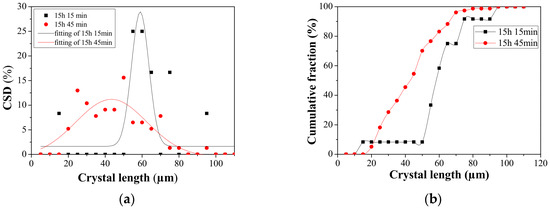
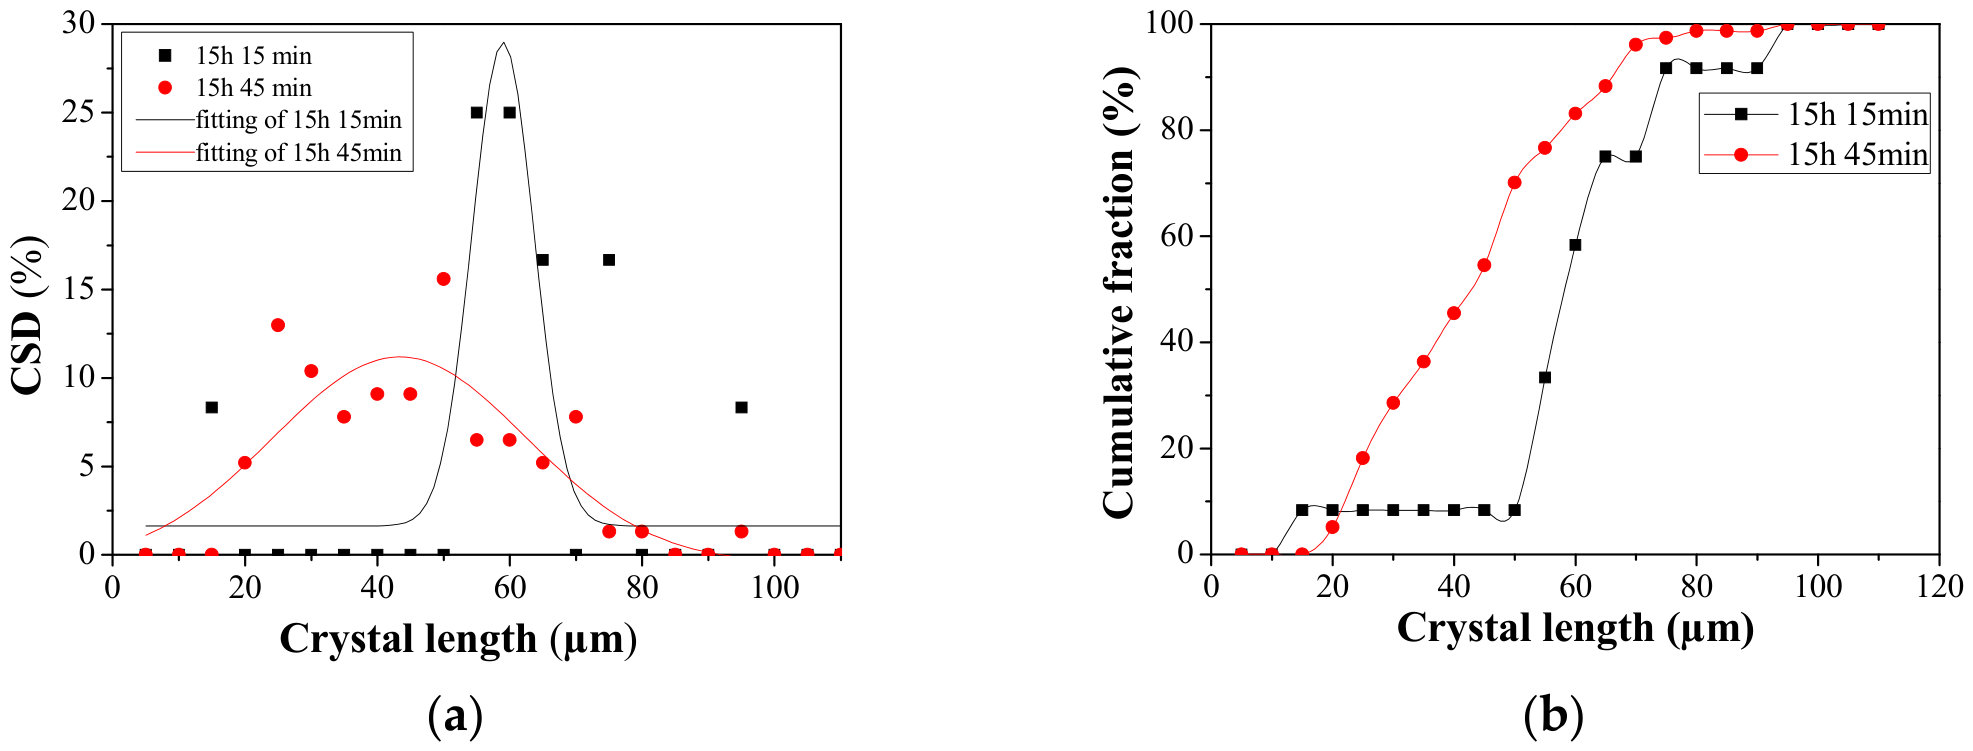
Table 6 presents the total experimental time, middle diameter (dm) of crystals, and CV of two samples taken from Feed 1 at 45 °C. Their CSD and cumulative fraction are presented in Figure 11, where (a) it is noted that a peak occurred at 58 μm at the test time of 15 h 15 min, while the highest peak moved back to 40–50 μm after 30 min, which is due to the growth of previously formed crystals and, at the same time, the formation of new crystals in this 30 min (as proved by the measured crystals smaller than 20 μm). Compared with the CVs achieved at a lower feed temperature of 30 °C (see Table 5), the CVs show smaller values, indicating a narrower crystal size distribution around the average size. This is probably due to the crystal morphology obtained at this temperature (i.e., needle shape), where the length of the crystals tends to grow faster and longer than the hexagonal shape (as they grow only in one direction (length direction) without considering the width direction of the hexagonal shape).
Table 6.
Data of the obtained Na2SO4 (phase III) crystal at 45 °C for Feed 1.
Figure 11.
(a) CSD of Na2SO4 crystals produced from Feed 1 and (b) the corresponding cumulative distribution of crystals obtained at 45 °C.
The cumulative fraction shown in Figure 11b exhibits a steeper slope for the curve recorded at 15 h 15 min in the size range of approximately 50–80 μm, indicating a higher proportion of crystals within this interval and thus a narrower crystal size distribution. This observation is consistent with the sharp peak observed in Figure 11a. In contrast, after 30 min, the curve corresponding to 15 h 45 min in Figure 11b becomes less steep, reflecting a broader crystal size distribution, as also evidenced by the wider CSD profile shown in Figure 11a.
3.3. FTIR Analysis of the Obtained Crystals
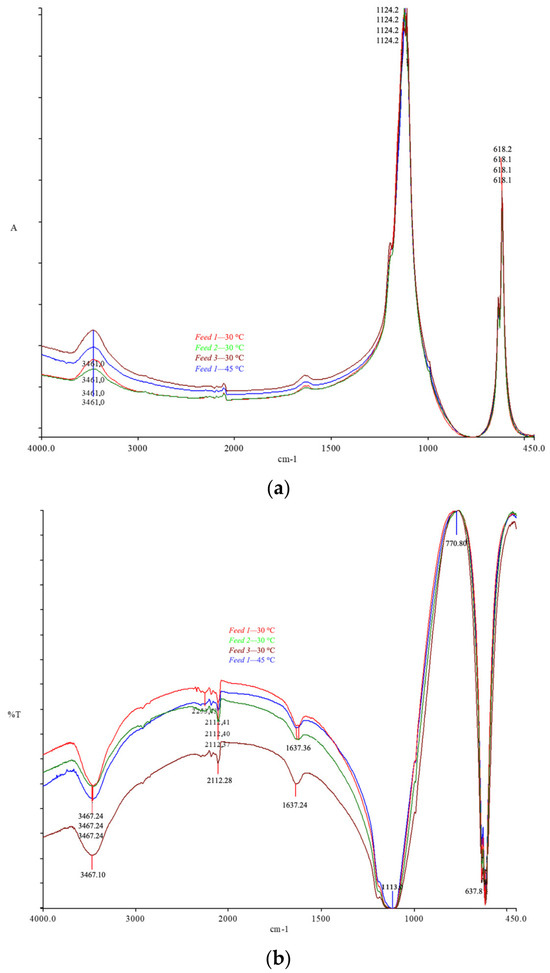
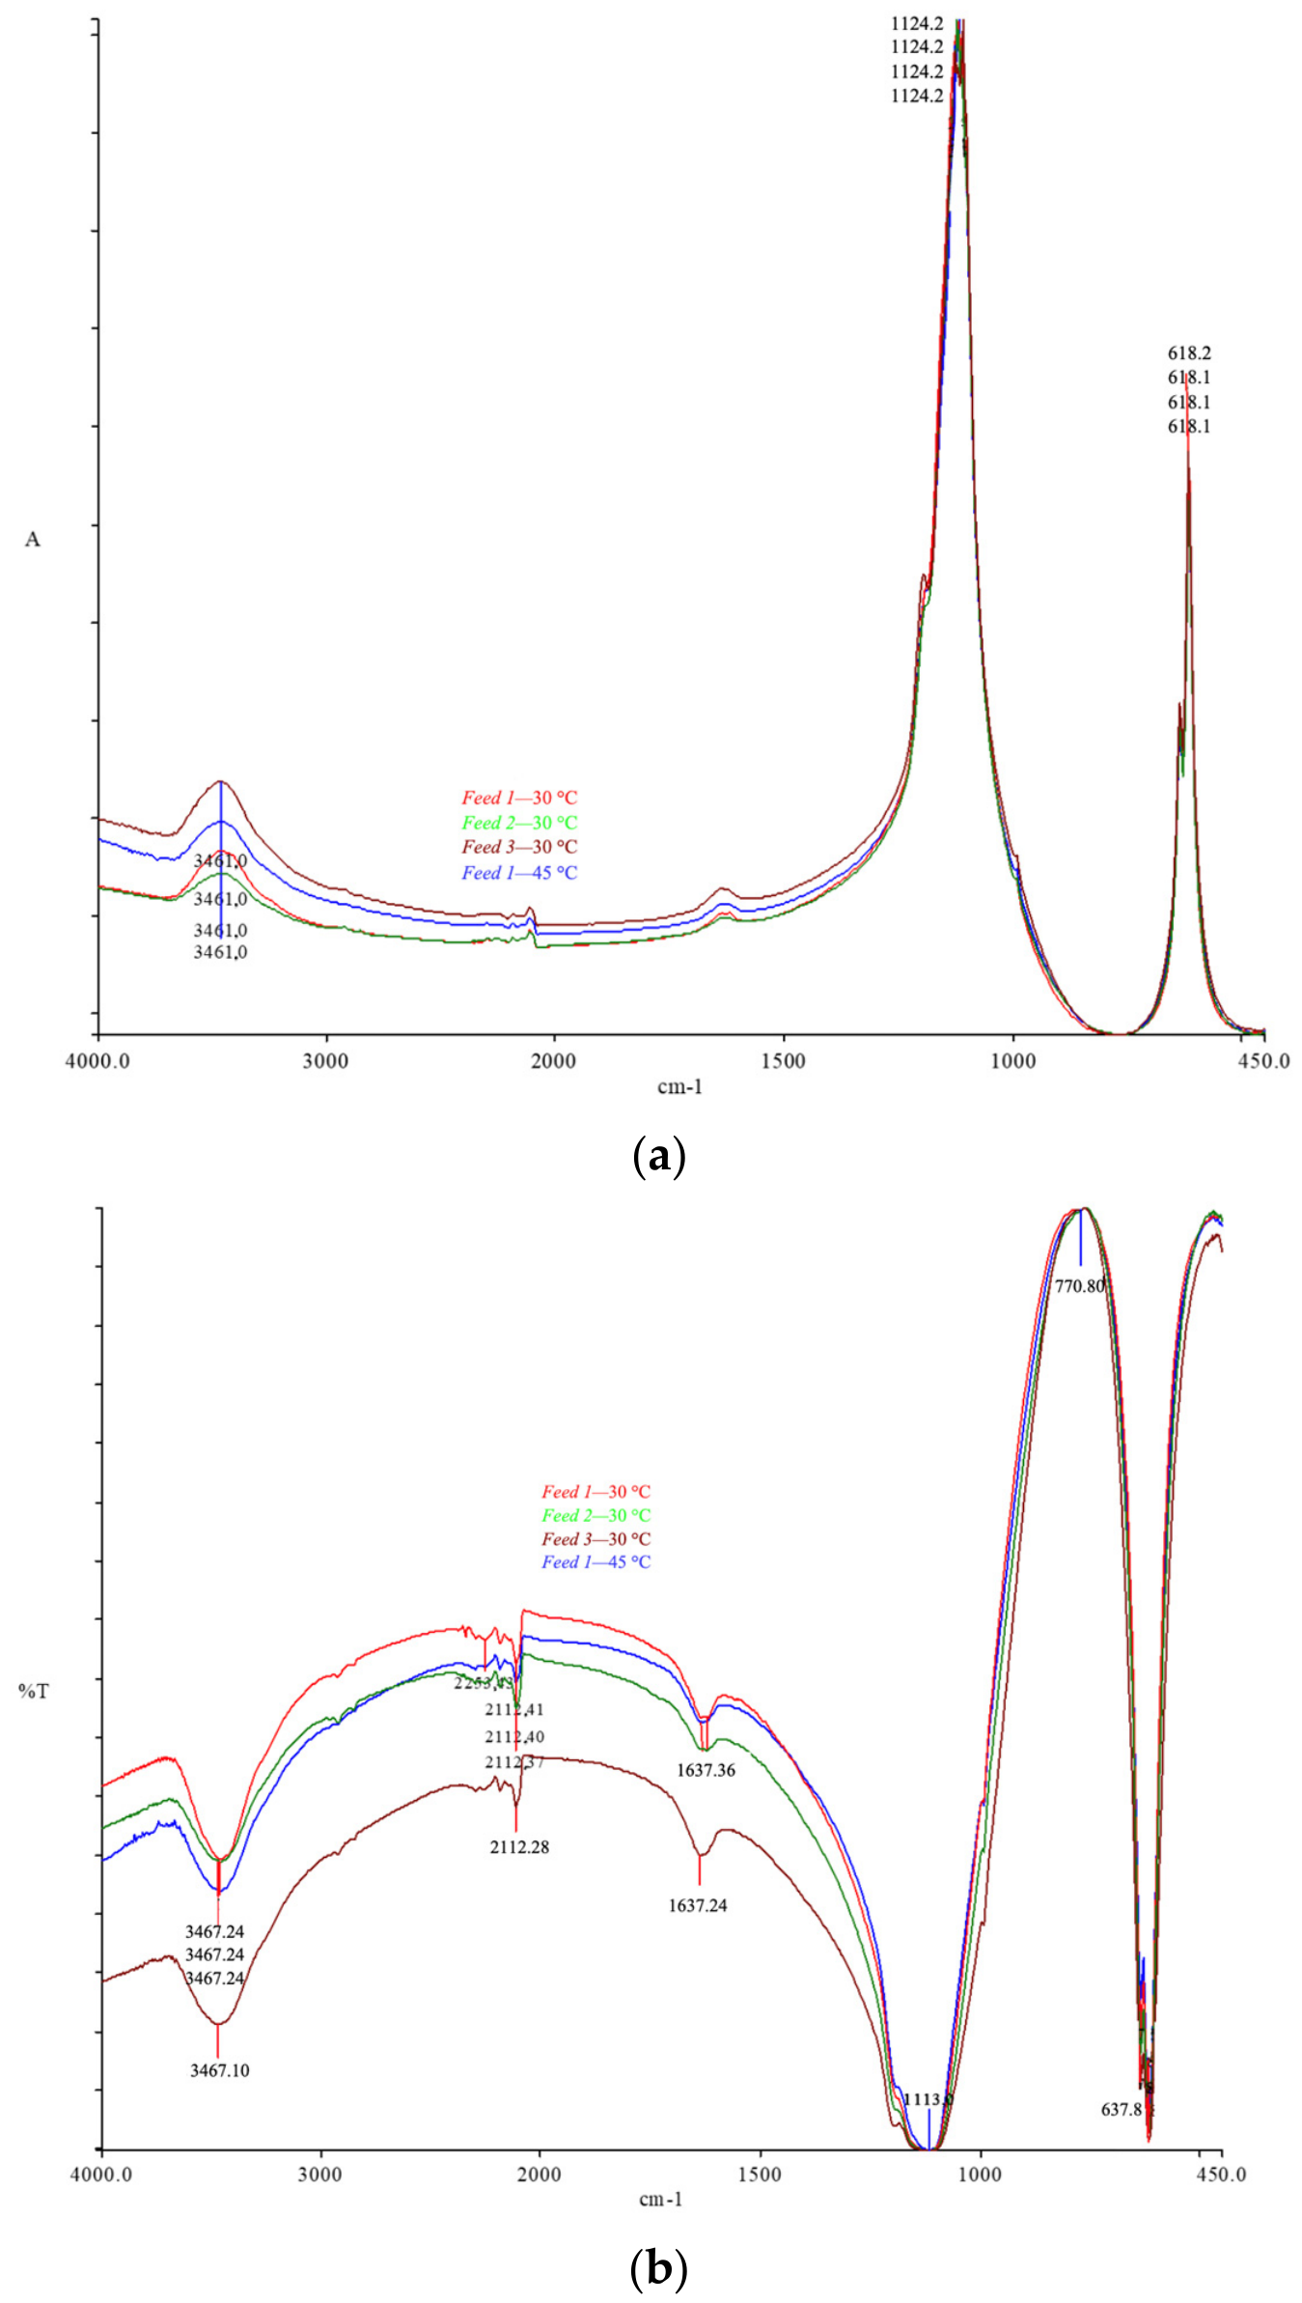
Figure 12 illustrates the FTIR spectra of salts obtained from Feeds 1, 2, and 3. Both Figure 12a,b report the frequency of light (cm−1) on the x-axis. Regarding the ordinates, the former displays the absorbance while the values of transmittance are plotted in the latter.
Figure 12.
FTIR spectra of the salts obtained with Feeds 1, 2 and 3: (a) absorbance and (b) transmittance.
Fourier transform infrared (FTIR) spectroscopy is a rapid and not-destructive technique, which is extremely useful for confirming the identity of pure compounds [30,31]. The major advantage of the FTIR technique over other spectroscopic methods is that practically all compounds show the absorption/emission characteristic in the IR spectral region, and based on this property, they can be analyzed both quantitatively and qualitatively [32]. It is a form of vibrational spectroscopy that makes it possible to identify the functional groups within molecules. In effect, when a material is irradiated by a specific wavelength of light, its functional groups vibrate (either through stretching or bending). In FTIR spectra, the intensity of these vibrations and the corresponding frequency of light are reported on the y-axis and x-axis, respectively. The ordinate is generally expressed as %T or %A, depending on whether the physical property under consideration is transmittance or absorbance [33].
By observing Figure 12a,b it can be qualitatively stated that the salts obtained at 30 °C for Feeds 1, 2, and 3 and at 45 °C for Feed 1 show a similar trend under the FTIR spectrum: From the transmittance image presented in Figure 12b, it can be observed that two peaks occurred at around 1100 cm−1 and 630 cm−1; and the absorbance image presents a peak at around 610 cm−1. These results are consistent with the peak characteristics of Na2SO4, proving that the obtained salts from all feed solutions are all Na2SO4 (thenardite anhydrous form).
3.4. EDX Analysis of the Obtained Crystals
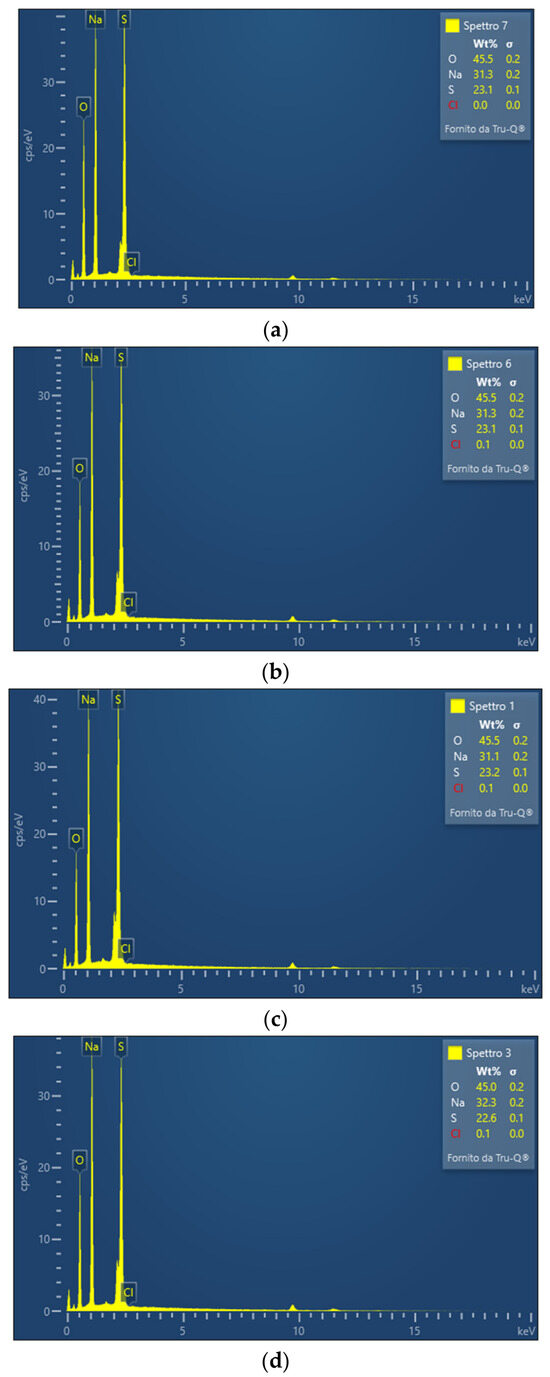
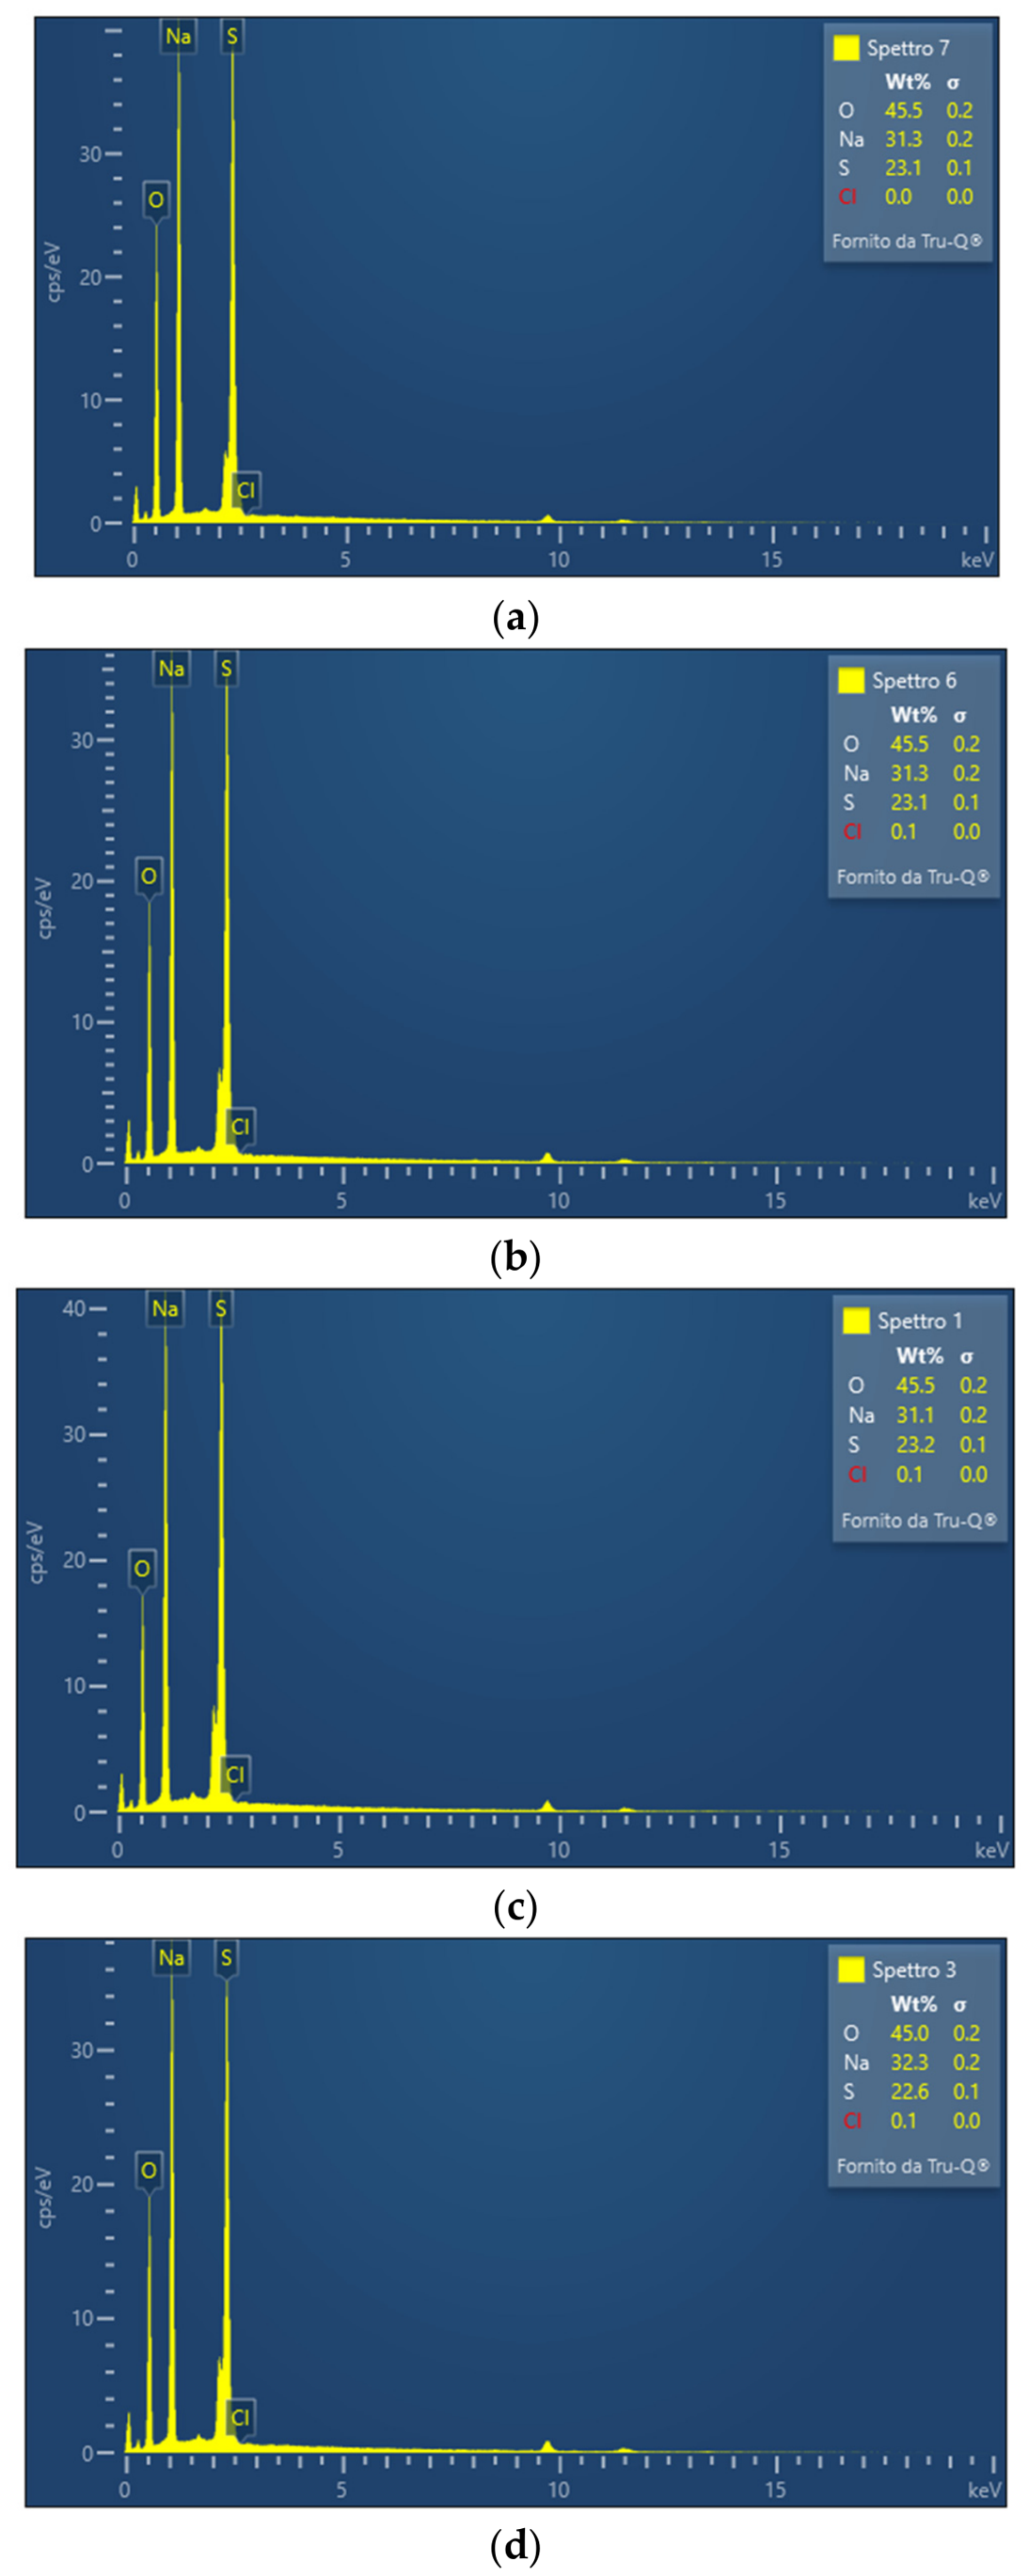
To further confirm the purity of the obtained salts, an EDX analysis of the obtained salts was performed. The results are shown in Figure 13 below.
Figure 13.
EDX results of the salts obtained at 30 °C for (a) Feed 1, (b) Feed 2, (c) Feed 3, and (d) Feed 1 at 45 °C.
According to the EDX analysis, all samples exhibited only trace levels of Cl (approximately 0–0.1 wt.%). Moreover, the Cl peaks are nearly indistinguishable from the baseline and fall within the width of the S peak, indicating a negligible presence of Cl in the recovered crystals. These findings confirm the high purity of the obtained Na2SO4. Therefore, the results demonstrate that the MCr process can selectively produce high-purity crystals even from multicomponent saline solutions.
3.5. Recovery Factor
Water and salt recovery values of the tests discussed above are reported in Table 7. The water recovery was calculated according to the following equation:
Table 7.
Water and salt recovery data of Feeds 1, 2, and 3 at the operating temperature conditions investigated.
The salt recovery values have been obtained through the following formula:
Table 7 shows that the salts recovery factor ranges from around 29% for Feed 3 to 48% for Feed 1 at 45 °C, with an inverse trend compared to the water recovery factor, which ranges from around 53% for Feed 1 at 45 °C to 65% for Feed 2. The recovery factor for Na2SO4 obtained in this study is lower than the values reported in the literature [19] for systems combining membrane crystallization with other processes. This difference may be partly attributed to the dead volume of the utilized experimental setup, which cannot be neglected. Further modifications and optimization studies could be explored to potentially enhance the recovery rate, for example by reducing the dead volume of the setup employed and increasing the initial feed volume.
4. Conclusions
Three different NaCl and Na2SO4 solutions simulating the compositions of reverse osmosis industrial brine were tested in direct contact membrane crystallization. The molar ratios of NaCl and Na2SO4 in the feed solutions were 1:2, 1:1, and 2:1. The effects of feed temperature and molar ratio of NaCl and Na2SO4 mixtures on Na2SO4 crystals were investigated. The obtained crystals were analyzed under microscope, FTIR, and EDX. Results showed that pure Na2SO4 can be recovered from NaCl and Na2SO4 mixtures by one-step membrane crystallization, without using any chemical reagents and combined processes. Different Na2SO4 crystal morphologies were obtained from the mixtures by adjusting the feed temperature in the DCMCr process. At the feed temperature of 30 °C, thernadite (Na2SO4) phase V was obtained; at the feed temperature of 45 °C, thernadite (Na2SO4) phase III was recovered. About 53–65% Na2SO4 were recovered from the NaCl and Na2SO4 mixtures. Furthermore, FTIR and EDX analysis proved the purity of the obtained Na2SO4 crystals. The experiment gave an indication of recovering pure and valuable Na2SO4 from industrial RO brine using a one-step MCr process.
Supplementary Materials
The following supporting information can be downloaded at: https://www.mdpi.com/article/10.3390/app16147136/s1, Figure S1: Phase diagram of Na2SO4 in terms of temperature and weight/molar ratio; Figure S2: Different phases of Na2SO4 and its solubility changes with NaCl inside; Table S1: Na+, Cl− and SO42− compositions of RO brine from one south Africa mining plant; Table S2: Na+, Cl− and SO42− compositions of RO brine from one Chinese industrial Plant.
Author Contributions
X.L.: Investigation, experimental, writing—original draft, writing—review and editing; S.C.: Writing-review and editing; M.F.: Validation; E.D.: Supervision; F.M.: Conceptualization, review, and supervision. All authors have read and agreed to the published version of the manuscript.
Funding
This research received no external funding.
Data Availability Statement
The data presented in this study are available on request from the corresponding author.
Acknowledgments
Xue Li would like to thank the Institute on Membrane Technology (CNR-ITM) and the University of Padova, Department of Chemical Science (UniPD-DISC) for jointly granting her PhD scholarship. Drioli passed away on 31 October 2024. The experiment was completed under his supervision before the year 2022. This work is a tribute to his important contribution.
Conflicts of Interest
The authors declare that they have no known competing financial interests or personal relationships that could have appeared to influence the work reported in this paper.
References
- Li, X.; Pan, J.; Macedonio, F.; Ursino, C.; Carraro, M.; Bonchio, M.; Drioli, E.; Figoli, A.; Wang, Z.; Cui, Z. Fluoropolymer Membranes for Membrane Distillation and Membrane Crystallization. Polymers 2022, 14, 5439. [Google Scholar] [CrossRef] [Scilit] [PubMed]
- Nariyoshi, Y.N.; Pantoja, C.E.; Seckler, M.M. Evaluation of sodium chloride crystallization in membrane distillation crystallization applied to water desalination. Braz. J. Chem. Eng. 2016, 33, 675–690. [Google Scholar] [CrossRef] [Scilit]
- Quist-Jensen, C.A.; Ali, A.; Mondal, S.; Macedonio, F.; Drioli, E. A study of membrane distillation and crystallization for lithium recovery from high-concentrated aqueous solutions. J. Membr. Sci. 2016, 505, 167–173. [Google Scholar] [CrossRef] [Scilit]
- Bouchrit, R.; Boubakri, A.; Mosbahi, T.; Hafiane, A.; Bouguecha, S.A.T. Membrane crystallization for mineral recovery from saline solution: Study case Na2SO4 crystals. Desalination 2017, 412, 1–12. [Google Scholar] [CrossRef] [Scilit]
- Huang, X.; Song, M.; Wang, H.; Lv, S.; Qi, S.; Wang, C.; Zhang, H.; Ruan, X. Waste salt separation by antisolvent crystallization process: Mechanism study of Na2SO4-NaCl-solvent ternary phase diagrams and its life cycle assessment. Desalination 2025, 613, 118985. [Google Scholar] [CrossRef] [Scilit]
- Shi, Y.T.; Meng, X.; Yao, L.; Tian, M. A full-scale study of nanofiltration: Separation and recovery of NaCl and Na2SO4 from coal chemical industry wastewater. Desalination 2021, 517, 115239. [Google Scholar] [CrossRef] [Scilit]
- Quist-Jensen, C.A.; Macedonio, F.; Horbez, D.; Drioli, E. Reclamation of sodium sulfate from industrial wastewater by using membrane distillation and membrane crystallization. Desalination 2017, 401, 112–119. [Google Scholar] [CrossRef] [Scilit]
- Wang, C.; Huang, X.; Wang, H.; Chen, R.; Ruan, X. Combined Frozen Crystallization and Stepwise Decompression Evaporation for Na2SO4/NaCl Separation from Mixed Salts. Recycling 2025, 10, 106. [Google Scholar] [CrossRef] [Scilit]
- Denecker, M.F.C.; Hebert, R.L.; Wassermann, J.; Dosseh, G.; Menendez, B.; Bourgès, A. Experimental study of the crystallization of sodium sulfate hydrates through temperature monitoring. Environ. Earth Sci. 2014, 72, 5089–5099. [Google Scholar] [CrossRef] [Scilit]
- Nathoo, J.; Randall, D.G. Thermodynamic modelling of a membrane distillation crystallisation process for the treatment of mining wastewater. Water Sci. Technol. 2016, 73, 557–563. [Google Scholar] [CrossRef] [Scilit] [PubMed]
- Jiang, C.; Wang, Y.; Zhang, Z.; Xu, T. Electrodialysis of concentrated brine from RO plant to produce coarse salt and freshwater. J. Membr. Sci. 2014, 450, 323–330. [Google Scholar] [CrossRef] [Scilit]
- Pan, J.; Chen, M.; Xu, X.; Sun, S.P.; Wang, Z.; Cui, Z.; Xing, W.; Tavajohi, N. Enhanced anti-wetted PVDF membrane for pulping RO brine treatment by vacuum membrane distillation. Desalination 2022, 526, 115533. [Google Scholar] [CrossRef] [Scilit]
- Macedonio, F.; Frappa, M.; Brunetti, A.; Barbieri, G.; Drioli, E. Recovery of water and contaminants from cooling tower plume. Environ. Eng. Res. 2020, 25, 222–229. [Google Scholar] [CrossRef] [Scilit]
- Pavuluri, S. Kinetic Approach for Modeling Salt Precipitation in Porous-Media. 2014. Available online: https://www.researchgate.net/publication/262495450_Kinetic_approach_for_modeling_salt_precipitation_in_porous-media (accessed on 9 July 2026).
- Liu, B.; Ding, X.; Jiang, Z.; Wang, B.; Fang, T. Research on the Solubilities of Sodium Chloride and Sodium Sulfate Under Hydrothermal Conditions. J. Solut. Chem. 2020, 49, 1186–1207. [Google Scholar] [CrossRef] [Scilit]
- Li, P.; Li, G.; Xiao, W.; Ruan, X.; Yan, X.; He, G.; Jiang, X. Na+/Mg2+ interactions on membrane distillation permeation flux and crystallization performance during high saline solution treatment. Sep. Purif. Technol. 2021, 259, 118191. [Google Scholar] [CrossRef] [Scilit]
- Purohit, B.K.; Sistla, V.S. Studies on solution crystallization of Na2SO4·10H2O embedded in porous polyurethane foam for thermal energy storage application. Thermochim. Acta 2018, 668, 9–18. [Google Scholar] [CrossRef] [Scilit]
- Steiger, M.; Asmussen, S. Crystallization of sodium sulfate phases in porous materials: The phase diagram Na2SO4–H2O and the generation of stress. Geochim. Cosmochim. Acta 2008, 72, 4291–4306. [Google Scholar] [CrossRef] [Scilit]
- Li, W.; Van der Bruggen, B.; Luis, P. Integration of reverse osmosis and membrane crystallization for sodium sulphate recovery. Chem. Eng. Process. Process Intensif. 2014, 85, 57–68. [Google Scholar] [CrossRef] [Scilit]
- Marliacy, P.; Solimando, R.; Bouroukba, M.; Schuffenecker, L. Thermodynamics of crystallization of sodium sulfate decahydrate in H2O–NaCl–Na2SO4: Application to Na2SO4·10H2O-based latent heat storage materials. Thermochim. Acta 2000, 344, 85–94. [Google Scholar] [CrossRef] [Scilit]
- Bharmoria, P.; Gehlot, P.S.; Gupta, H.; Kumar, A. Temperature-dependent solubility transition of Na2SO4 in water and the effect of NaCl therein: Solution structures and salt water dynamics. J. Phys. Chem. B 2014, 118, 12734–12742. [Google Scholar] [CrossRef] [Scilit] [PubMed]
- Tsai, J.-H.; Perrotta, M.L.; Gugliuzza, A.; Macedonio, F.; Giorno, L.; Drioli, E.; Tung, K.-L.; Tocci, E. Membrane-Assisted Crystallization: A Molecular View of NaCl Nucleation and Growth. Appl. Sci. 2018, 8, 2145. [Google Scholar] [CrossRef] [Scilit]
- Cheng, T.-W.; Han, C.-J.; Hwang, K.-J.; Ho, C.-D.; Cooper, W.J. Influence of Feed Composition on Distillate Flux and Membrane Fouling in Direct Contact Membrane Distillation. Sep. Sci. Technol. 2010, 45, 967–974. [Google Scholar] [CrossRef] [Scilit]
- Matthiasson, E.; Sivik, B. Concentration polarization and fouling. Desalination 1980, 35, 59–103. [Google Scholar] [CrossRef] [Scilit]
- Martinez-Diez, L.; Florido-Diaz, F.J.; Vazquez-Gonzalez, M.I. Study of polarization phenomena in membrane distillation of aqueous salt solutions. Sep. Sci. Technol. 2000, 35, 1485–1501. [Google Scholar] [CrossRef] [Scilit]
- Shen, Y.; Linnow, K.; Steiger, M. Crystallization Behavior and Damage Potential of Na2SO4–NaCl Mixtures in Porous Building Materials. Cryst. Growth Des. 2020, 20, 5974–5985. [Google Scholar] [CrossRef] [Scilit]
- Ali, A.; Macedonio, F.; Drioli, E.; Aljlil, S.; Alharbi, O.A. Experimental and theoretical evaluation of temperature polarization phenomenon in direct contact membrane distillation. Chem. Eng. Res. Des. 2013, 91, 1966–1977. [Google Scholar] [CrossRef] [Scilit]
- Rodriguez-Navarro, C.; Doehne, E.; Sebastian, E. How does sodium sulfate crystallize? Implications for the decay and testing of building materials. Cem. Concr. Res. 2000, 30, 1527–1534. [Google Scholar] [CrossRef] [Scilit]
- Linnow, K.; Steiger, M.; Lemster, C.; De Clercq, H.; Jovanović, M. In situ Raman observation of the crystallization in NaNO3-Na2SO4-H2O solution droplets. Environ. Earth Sci. 2013, 69, 1609–1620. [Google Scholar] [CrossRef] [Scilit]
- Schoonheydt, R.A.; Johnston, C.T. Surface and interface chemistry of clay minerals. In Developments in Clay Science; Bergaya, F., Theng, B.K.G., Lagaly, G., Eds.; Elsevier: Amsterdam, The Netherlands, 2006; pp. 87–113. [Google Scholar] [CrossRef] [Scilit]
- Worsfold, P.; Townshend, A.; Poole, C.F.; Miró, M. Encyclopedia of Analytical Science, 3rd ed.; Elsevier: Amsterdam, The Netherlands, 2019. [Google Scholar]
- Bacsik, Z.; Mink, J.; Keresztury, G. FTIR Spectroscopy of the Atmosphere. I. Principles and Methods. Appl. Spectrosc. Rev. 2004, 39, 295–363. [Google Scholar] [CrossRef] [Scilit]
- Capizzano, S.; Frappa, M.; Drioli, E.; Alessandro, F.; Macedonio, F. Chemical interaction between PVDF and Li cations during LiCl crystallization in VMCr. J. Membr. Sci. 2022, 658, 120733. [Google Scholar] [CrossRef] [Scilit]

Disclaimer/Publisher’s Note: The statements, opinions and data contained in all publications are solely those of the individual author(s) and contributor(s) and not of MDPI and/or the editor(s). MDPI and/or the editor(s) disclaim responsibility for any injury to people or property resulting from any ideas, methods, instructions or products referred to in the content. |
© 2026 by the authors. Licensee MDPI, Basel, Switzerland. This article is an open access article distributed under the terms and conditions of the Creative Commons Attribution (CC BY) license.