


Abstract
Butter texture is one of the key quality attributes affecting both technological performance and consumer perception. Although the effects of milk composition and fatty acid profile on butter properties have been widely investigated, studies integrating chemical composition, fatty acid profile, instrumental firmness, and sensory texture characteristics in butter produced from different animal species remain limited. This study evaluated the relationships among chemical composition, fatty acid profile, instrumental firmness, and sensory texture attributes of butter produced from cow, sheep, and goat milk. Sheep butter showed the highest total solids and fat contents (86.84 and 85.27 g/100 g), whereas cow and goat butter contained significantly higher water levels (approximately 17.9 g/100 g; p < 0.05). Cow butter was characterised by higher proportions of long-chain saturated fatty acids, particularly palmitic acid (32.39%), and the highest monounsaturated fatty acid content (24.11%). Although instrumental firmness did not differ significantly among butter types (p > 0.05), cow butter exhibited the highest mean firmness value (6.07 N) and the highest sensory firmness score. Goat butter contained elevated levels of short- and medium-chain fatty acids, and the highest polyunsaturated fatty acid content (4.83%), which was associated with lower firmness (3.04 N). Sheep butter exhibited the highest stearic acid content (11.08%), together with greater spreadability and fatty mouthfeel. Principal component analysis provided an exploratory overview of the relationships among compositional, instrumental, and sensory variables and highlighted potential associations between fatty acid composition and butter texture characteristics. Under the conditions of this pilot-scale study, milk origin was associated with distinct compositional and textural profiles of butter.
1. Introduction
Butter is a traditional dairy product defined as a water-in-oil emulsion, in which dispersed water droplets are embedded within a continuous fat phase that is partially crystallised [1]. According to Codex Alimentarius standards [2], butter must contain at least 80% milk fat, with a maximum water content of 16%. The physical structure and quality of butter are determined primarily by the organisation of the milk fat crystal network and the distribution of the aqueous phase within this matrix [3].
Milk fat is one of the most structurally complex natural lipids, comprising several hundred individual fatty acids that differ in chain length, degree of saturation, and positional distribution on the glycerol backbone. Saturated fatty acids (SFA) generally predominate, accounting for approximately 65–70% of total fatty acids, while monounsaturated (MUFA) and polyunsaturated fatty acids (PUFA) contribute to a lesser extent [4,5]. Differences in fatty acid composition contribute substantially to fat crystallisation behaviour, melting characteristics, and the mechanical properties of butter [5,6]. Long-chain saturated fatty acids, particularly palmitic (C16:0) and myristic (C14:0) acids, crystallise at relatively high temperatures and promote the formation of rigid, interconnected crystal networks, resulting in increased firmness. In contrast, short- and medium-chain saturated fatty acids and unsaturated fatty acids lower the melting point of milk fat, disrupt the fat crystal network structure, and contribute to softer, more spreadable textures [1,7,8]. Consequently, butter texture is not solely a function of total fat content but is the result of the combined effects of fatty acid chain length distribution, degree of saturation, and fat–water organisation within the product matrix.
Although commercial butter production is dominated by cow milk, butter can also be produced from sheep and goat milk, which exhibit pronounced compositional differences compared with cow milk. Small ruminant milk is typically characterised by higher fat content, smaller fat globule size, and a higher proportion of short- and medium-chain fatty acids, particularly caproic, caprylic, and capric acids [9,10,11]. These compositional characteristics result in dairy products with distinct physicochemical and sensory properties, which have attracted increasing research interest in recent years [10,11,12]. Previous studies have investigated the chemical composition, fatty acid profile, instrumental texture, and sensory properties of butter produced from different milk sources [13,14,15,16,17,18,19]. Several authors have demonstrated relationships between fatty acid composition and butter firmness, while others have highlighted the influence of processing conditions and water distribution on butter texture [16,17]. While some studies have compared butter or cream from different animal species, most have focused on selected compositional, technological, or sensory characteristics rather than providing an integrated assessment of composition, instrumental texture, and sensory texture attributes. Consequently, the relationships among milk composition, lipid characteristics, mechanical behaviour, and sensory texture perception remain insufficiently understood, particularly for butter produced from different animal species. Studies directly comparing butter produced from cow, sheep, and goat milk within a single experimental framework and integrating compositional, instrumental, and sensory data remain scarce.
Moreover, studies directly comparing cow, sheep, and goat butter within a single experimental framework are limited. Existing research has primarily focused on compositional differences or selected quality attributes [18,19], whereas the integrated assessment of chemical composition, fatty acid profile, instrumental texture, and sensory texture perception remains scarce. Such an approach is important because butter texture is a multidimensional property resulting from complex interactions among lipid composition, aqueous phase distribution, and sensory perception.
Multivariate statistical techniques, such as principal component analysis (PCA), offer an opportunity to explore these relationships simultaneously and to identify the key variables associated with texture differentiation. However, the application of PCA for the integrated interpretation of compositional, instrumental, and sensory characteristics of butter produced from cow, sheep, and goat milk has received limited attention [18,19].
A better understanding of the relationships between milk species–specific composition governs butter texture is of both scientific and technological relevance. From a scientific perspective, it contributes to elucidating structure–function relationships in milk fat systems. From an industrial perspective, it offers a basis for differentiating butter products according to milk origin and tailoring texture attributes to meet consumer preferences. Butter texture directly influences technological performance during processing, spreadability, and consumer perception and therefore represents a critical quality attribute in the development of differentiated dairy products [3,8,20,21].
Therefore, this study aimed to examine the relationships among chemical composition, fatty acid profile, instrumental firmness, and sensory texture attributes of butter produced from cow, sheep, and goat milk. By integrating compositional analysis, instrumental measurements, sensory evaluation, and principal component analysis, the study sought to identify potential compositional factors associated with texture differentiation. It was hypothesised that differences in fatty acid chain length distribution and degree of saturation among milk species would be associated with measurable differences in instrumental firmness and sensory texture attributes, such as firmness, spreadability, melting behaviour, and fatty mouthfeel. The findings contribute to a better understanding of the relationships between butter composition and texture characteristics across different milk species.
2. Materials and Methods
2.1. Milk Procurement and Butter Production
Bulk cow, sheep, and goat milk were procured from local farms under comparable production conditions. Cow milk was obtained from Holstein cows, goat milk from Alpine goats, and sheep milk from Pramenka sheep. For each milk type, milk was sourced from a single commercial farm, and the same producer was used throughout the study to minimise variability associated with farm management practices. Milk collection and butter manufacture were carried out during May 2024 under comparable production conditions. The average composition of the raw milk used for butter production was 3.82% fat, 3.47% protein, and 12.91% total solids for cow milk; 3.06% fat, 3.00% protein, and 11.46% total solids for goat milk; and sheep milk was characterised by a high protein content (5.92%) and total solids content (13.54%). Upon arrival, the milk was immediately processed. Cream separation was performed at 45 °C using a centrifugal cream separator (Elecrem 1, Elecrem SAS, Fresnes, France; capacity 125 L h−1). Following separation, 7.0 kg of goat cream, 6.7 kg of cow cream, and 7.8 kg of sheep cream were obtained. The fat content of the separated cream was determined prior to standardisation and used to calculate the amount of skimmed milk required to achieve a target fat content of approximately 36%. The cream was subsequently standardised to approximately 36% fat by blending the separated cream with skimmed milk. Milk was collected during the same production period to minimise seasonal variability and transported under refrigerated conditions (≤4 °C) to a pilot-scale dairy processing facility for butter production at Department of Dairy Science, University of Zagreb Faculty of Agriculture. Upon arrival, the milk was immediately processed. Cream separation was carried out using a laboratory-scale centrifugal cream separator. The standardised cream (36% fat, w/w) was used for butter manufacture to ensure comparable churning conditions among milk types. Information on herd size, feeding regime, parity, and stage of lactation was not available. Therefore, although milk was collected under comparable production conditions and within the same production period, the observed differences cannot be attributed exclusively to milk species and may also reflect breed-, farm-, feeding-, or management-related factors. The standardised cream was pasteurised at 85 °C for 5 min and then cooled to 8 °C. Physical ripening of the cream was conducted at 8 °C for 18 h to promote partial fat crystallisation prior to churning. The selected pasteurisation and ripening conditions were applied to ensure microbiological safety and to promote the development of a suitable fat crystal structure for butter manufacture. Before churning, the pH of the ripened cream was measured and averaged 6.70, 6.63, and 6.51 for cow, goat, and sheep cream, respectively. Butter was produced by batch churning using a laboratory-scale butter churn (Tehla SE, model FJ10, Škofja Loka, Slovenia). For each milk type, the standardised cream was divided into three portions and churned separately as independent technological replicates. Churning was performed at the maximum available speed setting (4/4) and continued for approximately 45–60 min until visible butter granules formed and buttermilk separation was complete. All butter types were processed under identical churning conditions. The buttermilk was drained, and the butter grains were repeatedly washed with cold water and ice (8–10 °C) until the wash water appeared clear and free of visible buttermilk residues. Excess water was removed using a perforated drainage vessel. The butter grains were then manually kneaded with wooden spatulas until no visible water was released and a homogeneous butter mass was obtained. Sodium chloride was added at a concentration of 0.1% (w/w) during kneading. Butter samples were shaped into blocks, wrapped in fat-impermeable paper, and stored at 4 °C for 24 h prior to analysis. For each milk type, the corresponding standardised cream was divided into three portions and churned separately in three independent butter-making processes. These production batches represented independent technological replicates (n = 3 per butter type).
2.2. Chemical Composition Analysis
Butter samples were stored at 4 °C and analysed in triplicate 24 h after production in the Reference Laboratory for Milk and Dairy Products, Department of Dairy Science, University of Zagreb Faculty of Agriculture. The dry matter content was determined by the reference method for non-fat solids according to [22]; water content by the reference method for water, non-fat solids, and fat according to [23]; milk fat by the gravimetric method according to [24]; protein by the Kjeldahl method, calculating crude protein according to [25]; and lactose by a modified enzymatic method using the Enzytec Liquid Lactose/D-Glucose and Enzytec Liquid D-Glucose kits (R-Biopharm AG, Darmstadt, Germany) [26]. Triplicate analytical determinations were performed for each technological replicate and averaged before statistical analysis.
2.3. Fatty Acid Composition
Butter fat was first isolated from the butter samples according to HRN EN ISO 17189:2008 [24]. The extracted butter fat was subsequently used for fatty acid methyl ester (FAME) preparation and gas chromatographic analysis. Fatty acid methyl esters (FAMEs) for the analysis of butter fatty acid composition were prepared in accordance with [27]. The procedure began with the transfer of 100 mg of extracted butter fat into a micro-reaction vessel, followed by dilution with 5 mL of hexane. Subsequently, 0.2 mL of a transesterification reagent, prepared by dissolving 10.8 g of sodium methoxide (NaOCH3) in 100 mL of methanol, was added and the mixture was vortexed. Five minutes after vortexing, 0.5 g of sodium hydrogen sulphate monohydrate (NaHSO4 × H2O) was added, and the mixture was re-agitated. The reaction mixture was then transferred to centrifuge tubes and centrifuged at 350 g for 3 min at room temperature. The upper layer, that is, the clear supernatant, was collected in a clean vial.
The resulting FAMEs were analysed by gas chromatography in accordance with [28], using a Shimadzu GC Plus-2010 instrument (Shimadzu Corporation, Kyoto, Japan) equipped with a flame ionisation detector (FID) and an InertCap PureWax capillary column (0.25 mm inner diameter × 30 m; film thickness 0.25 μm; GL Sciences Inc., Tokyo, Japan). The analytical method used split injection (1:50), an injector temperature of 250 °C, an FID temperature of 260 °C, a 1 μL injection volume, and helium as the carrier gas at a flow rate of 30.0 mL/min. Hydrogen and air flow rates to the detector were 40.0 and 400.0 mL/min, respectively. The column temperature programme started at 50 °C (held for 5 min), then increased linearly at 5 °C per minute to 260 °C, where it was maintained for 30 min. Helium was used as the carrier gas. Individual fatty acids were identified by comparing retention times with those of authenticated FAME standards. Fatty acids were expressed as percentages of total identified fatty acids. Saturated fatty acids (SFA), monounsaturated fatty acids (MUFA), and polyunsaturated fatty acids (PUFA) were calculated as grouped sums. The PUFA/SFA ratio and n-3/n-6 ratio were also calculated. Only the major identified fatty acids are presented. Consequently, the reported grouped sums of SFA, MUFA, and PUFA do not necessarily total 100%, as minor fatty acids in the table are not included in the grouped totals presented. Repeated analytical measurements were averaged within each technological replicate before statistical analysis.
2.4. Instrumental Texture Analysis
To determine the firmness of butter, a texture analyser (TA Plus, Lloyd Instruments, Bognor Regis, UK) equipped with a 500 N weighing station (model XLC-500-Al) was used in the laboratory of the Institute for Adriatic Cultures and Karst Reclamation in Split. Upon delivery to the laboratory, the butter was stored in a refrigerated display case at 10 °C for 24 h. Samples for measurement were taken from the upper side of the butter throughout its depth using a square-profile drill sharpened at the top. The resulting rectangular samples were further cut into two smaller cube-shaped samples (28 × 28 × 28 mm) using a cutting device with a thin, tensioned steel wire. After cutting and preparation, the samples were stored in small plastic boxes with lids and returned to the refrigerated display case for cooling at 10 °C for the next 24 h, until analysis was performed. Before instrumental testing, the temperature of the butter samples was checked, and all measurements were carried out at 10 ± 1 °C. For each technological replicate, two cube-shaped specimens (28 × 28 × 28 mm) were prepared and analysed, resulting in six measurements per butter type. Samples were taken from the upper surface of the butter block through its full depth according to a standardised sampling procedure. Sampling positions were not randomised. Samples were positioned with the upper surface facing the cutting wire, and the cutting test was performed to a depth of 20 mm using a tensioned steel wire mounted in a rectangular metal frame.
To determine butter firmness, a cutting test was performed using the wire cutter probe under the following software settings: pre-test trigger force value 0.001 N, tool movement speed 0.5 mm/s, and tool extension 20 mm. The tool movement, shown as a curve on the graph, was used to calculate firmness using Nexygen Plus 3 software. The firmness, expressed in newtons (N), represents the highest force value achieved during the test. For each technological replicate, repeated cutting measurements were averaged to obtain one replicate-level value used for statistical analysis.
2.5. Sensory Texture Evaluation
Sensory analysis was conducted under controlled conditions in the Laboratory for Sensory Analysis of Agricultural and Food Products at the University of Zagreb Faculty of Agriculture, which is equipped according to ISO 8589:2007 [29] (room conditions: temperature 20–22 °C, relative humidity 50–55%, illumination 4000 K and 500 lux at the workbench). Sensory analysis of butter samples was conducted on the third day after production using a modified quantitative descriptive analysis (QDA) with six expert evaluators (scientific and teaching staff: four women, two men; aged 38–55 years) selected and trained according to ISO 22935-1:2023 [30]. Prior to the sensory analysis, the research was approved by the Ethics Committee for Sensory Analysis of Agri-food products of the University of Zagreb Faculty of Agriculture, and assessors offered informed consent at the start of the evaluation. The panel size was considered sufficient due to the use of trained assessors, repeated evaluations, and within-panel performance verification. During the terminology development phase (8 h), the panel agreed to evaluate texture properties (spreadability, firmness, melting, mouthfeel of fat; see Table 1). After this phase, assessors were instructed on quantifying the selected terms and on intra-panel calibration to improve consistency and reproducibility using specific descriptive terms for sensory properties.
Table 1.
Sensory texture attributes, definitions, and range.
All properties were assessed using Compusense software Version 25.0.21 (Compusense Inc., Guelph, ON, Canada) with a digital questionnaire on a numerical, unipolar intensity scale from 0 to 9, where 0 indicates “not present/not expressed” and 9 indicates “strongly present/strongly expressed”.
For the sensory analysis, samples were individually coded with a three-digit code and served in sensory booths at 20–22 °C after equilibration for 30 min at room temperature. Butter samples were presented in transparent plastic containers (50 mL), each containing approximately 10 g of butter (dimensions 2 cm × 2 cm × 2 cm). Samples were presented in random order, with a 5-min break between samples and a 30-min break between sessions. Assessors used water, bread, plain unsalted crackers, and apples as palate cleansers. Three sensory evaluation sessions were conducted, each corresponding to one of the three butter types (cow, sheep, and goat). In each session, assessors evaluated three technological replicates of the same butter type, along with one repeated sample used for performance verification. Verification of assessor performance was performed using Big Sensory Soft software Version 1.0 (Centro Studi Assaggiatori, Brescia, Italy) and included assessment of repeatability (based on absolute differences between scores assigned to the same attributes in original and repeated samples), agreement with the panel median (based on absolute differences between individual assessor scores and the panel median), and discrimination ability (i.e., the ability to distinguish differences between samples). According to the software settings, all assessors achieved a performance index higher than 7, while the default threshold for interpreting assessor performance as acceptable was set at a minimum value of 6 on a 1–10 scale.
2.6. Statistical Analysis
Statistical analysis was conducted using SAS statistical software Release 3.82 [31]. Prior to applying parametric tests, data were examined for normality (Shapiro–Wilk test) and homogeneity of variance (Levene’s test), confirming that the assumptions for ANOVA were met. Data were analysed using one-way analysis of variance (ANOVA) and the PROC GLM procedure with butter type as fixed effect to assess the effect on chemical composition, fatty acid profile, and instrumental firmness. The PROC MIXED procedure with butter type as fixed effect and assessor as random effect was used to assess the effect on sensory attributes. When significant effects were observed (p < 0.05), differences between means were evaluated using Tukey HSD post hoc multiple comparison tests. The technological replicate was considered the experimental unit. Analytical and technical repeated measurements were averaged within each technological replicate before statistical analysis.
Results were expressed as means ± standard deviation. Multivariate relationships among variables were explored using the PROC FACTOR procedure for principal component analysis (PCA) based on standardised (z-score transformed) data. The correlation matrix was selected to account for differing measurement units and to normalise variance across variables. Following extraction, Varimax rotation was applied to the principal components to enhance interpretability by maximising the loading variance and promoting the formation of thematically distinct factor structures. PCA biplot was prepared in Microsoft Excel (Microsoft Corporation, Redmond, WA, USA). PCA analysis was used as an exploratory multivariate tool to visualise relationships among chemical composition parameters, fatty acid profile variables, instrumental firmness, and sensory texture attributes. Consequently, PCA results should not be interpreted as evidence of sample-level discrimination or statistical separation among butter types. Given the pilot-scale design and limited number of independent observations, PCA results were interpreted descriptively and used to support the exploration of patterns and associations among variables rather than for inferential purposes. The first two principal components were retained for graphical presentation and exploratory interpretation of relationships among variables and butter types.
3. Results
3.1. Chemical Composition of Butter
The chemical composition of butter varied significantly according to milk type (Table 2).
Table 2.
Chemical composition of butter produced from cow, sheep, and goat milk.
Significant differences in chemical composition were observed among the butter types (Table 2). Sheep butter was characterised by higher total solids and fat contents, and lower water content, than cow and goat butter (p < 0.05). In contrast, cow and goat butter had similar water contents, both significantly higher than those in sheep butter.
Cow butter contained higher levels of protein and lactose than goat butter (p < 0.05), while sheep butter generally showed intermediate values. Overall, the results demonstrate distinct compositional profiles among the butter types, particularly regarding the fat-to-water ratio and residual non-fat components.
3.2. Fatty Acid Composition
Significant differences in fatty acid composition were observed among butter types (Table 3). Saturated fatty acids predominated in all samples; however, their distribution varied according to milk type.
Table 3.
Fatty acid composition (% of total fatty acids) of butter produced from cow, sheep, and goat milk.
Goat butter was characterised by higher proportions of short- and medium-chain saturated fatty acids, whereas cow butter contained higher levels of long-chain saturated fatty acids, particularly palmitic acid, and the highest proportion of monounsaturated fatty acids. Sheep butter was distinguished by a higher stearic acid content and an intermediate overall fatty acid profile.
Monounsaturated fatty acids were most abundant in cow butter (p < 0.05), largely due to its higher oleic acid content. In contrast, goat butter had the lowest MUFA proportion but the highest total PUFA content and PUFA/SFA ratio (p < 0.05).
Sheep butter showed the most favourable n-3/n-6 ratio among the samples analysed. Overall, the results demonstrate that milk type was associated with distinct fatty acid profiles differing in chain length distribution and degree of unsaturation.
3.3. Instrumental Firmness
Instrumental firmness values of butter samples, measured by the wire-cutting test, are presented in Table 4. Mean firmness differed numerically among butter types; however, these differences were not statistically significant (p > 0.05). Cow butter showed the highest mean firmness value (6.07 N), whereas sheep and goat butter exhibited similar values (3.32 and 3.04 N, respectively). Therefore, instrumental firmness differences should be interpreted as descriptive numerical variation rather than statistically confirmed differences among butter types.
Table 4.
Instrumental firmness of butter produced from cow, sheep, and goat milk.
3.4. Sensory Texture Attributes
Sensory evaluation revealed significant differences among butter types for all evaluated texture attributes (p < 0.05; Table 5). Cow butter was perceived as firmer whereas sheep butter was characterised by greater spreadability and a fattier mouthfeel. Goat butter showed the highest melting perception and lower firmness scores. These findings indicate that butter produced from different milk types displays distinct sensory texture profiles, reflecting differences in their compositional characteristics.
Table 5.
Sensory texture attributes of butter produced from cow, sheep, and goat milk.
3.5. Principal Component Analysis (PCA)
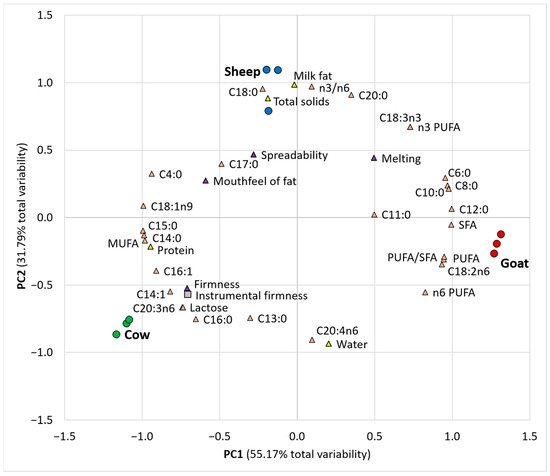
Principal component analysis (Figure 1) was applied to the dataset comprising chemical composition parameters (total solids, water, fat, protein, lactose), fatty acid profile variables (individual fatty acids and fatty acid groups), instrumental firmness, and sensory texture attributes to explore multivariate relationships and identify patterns among butter samples from different milk types.
Figure 1.
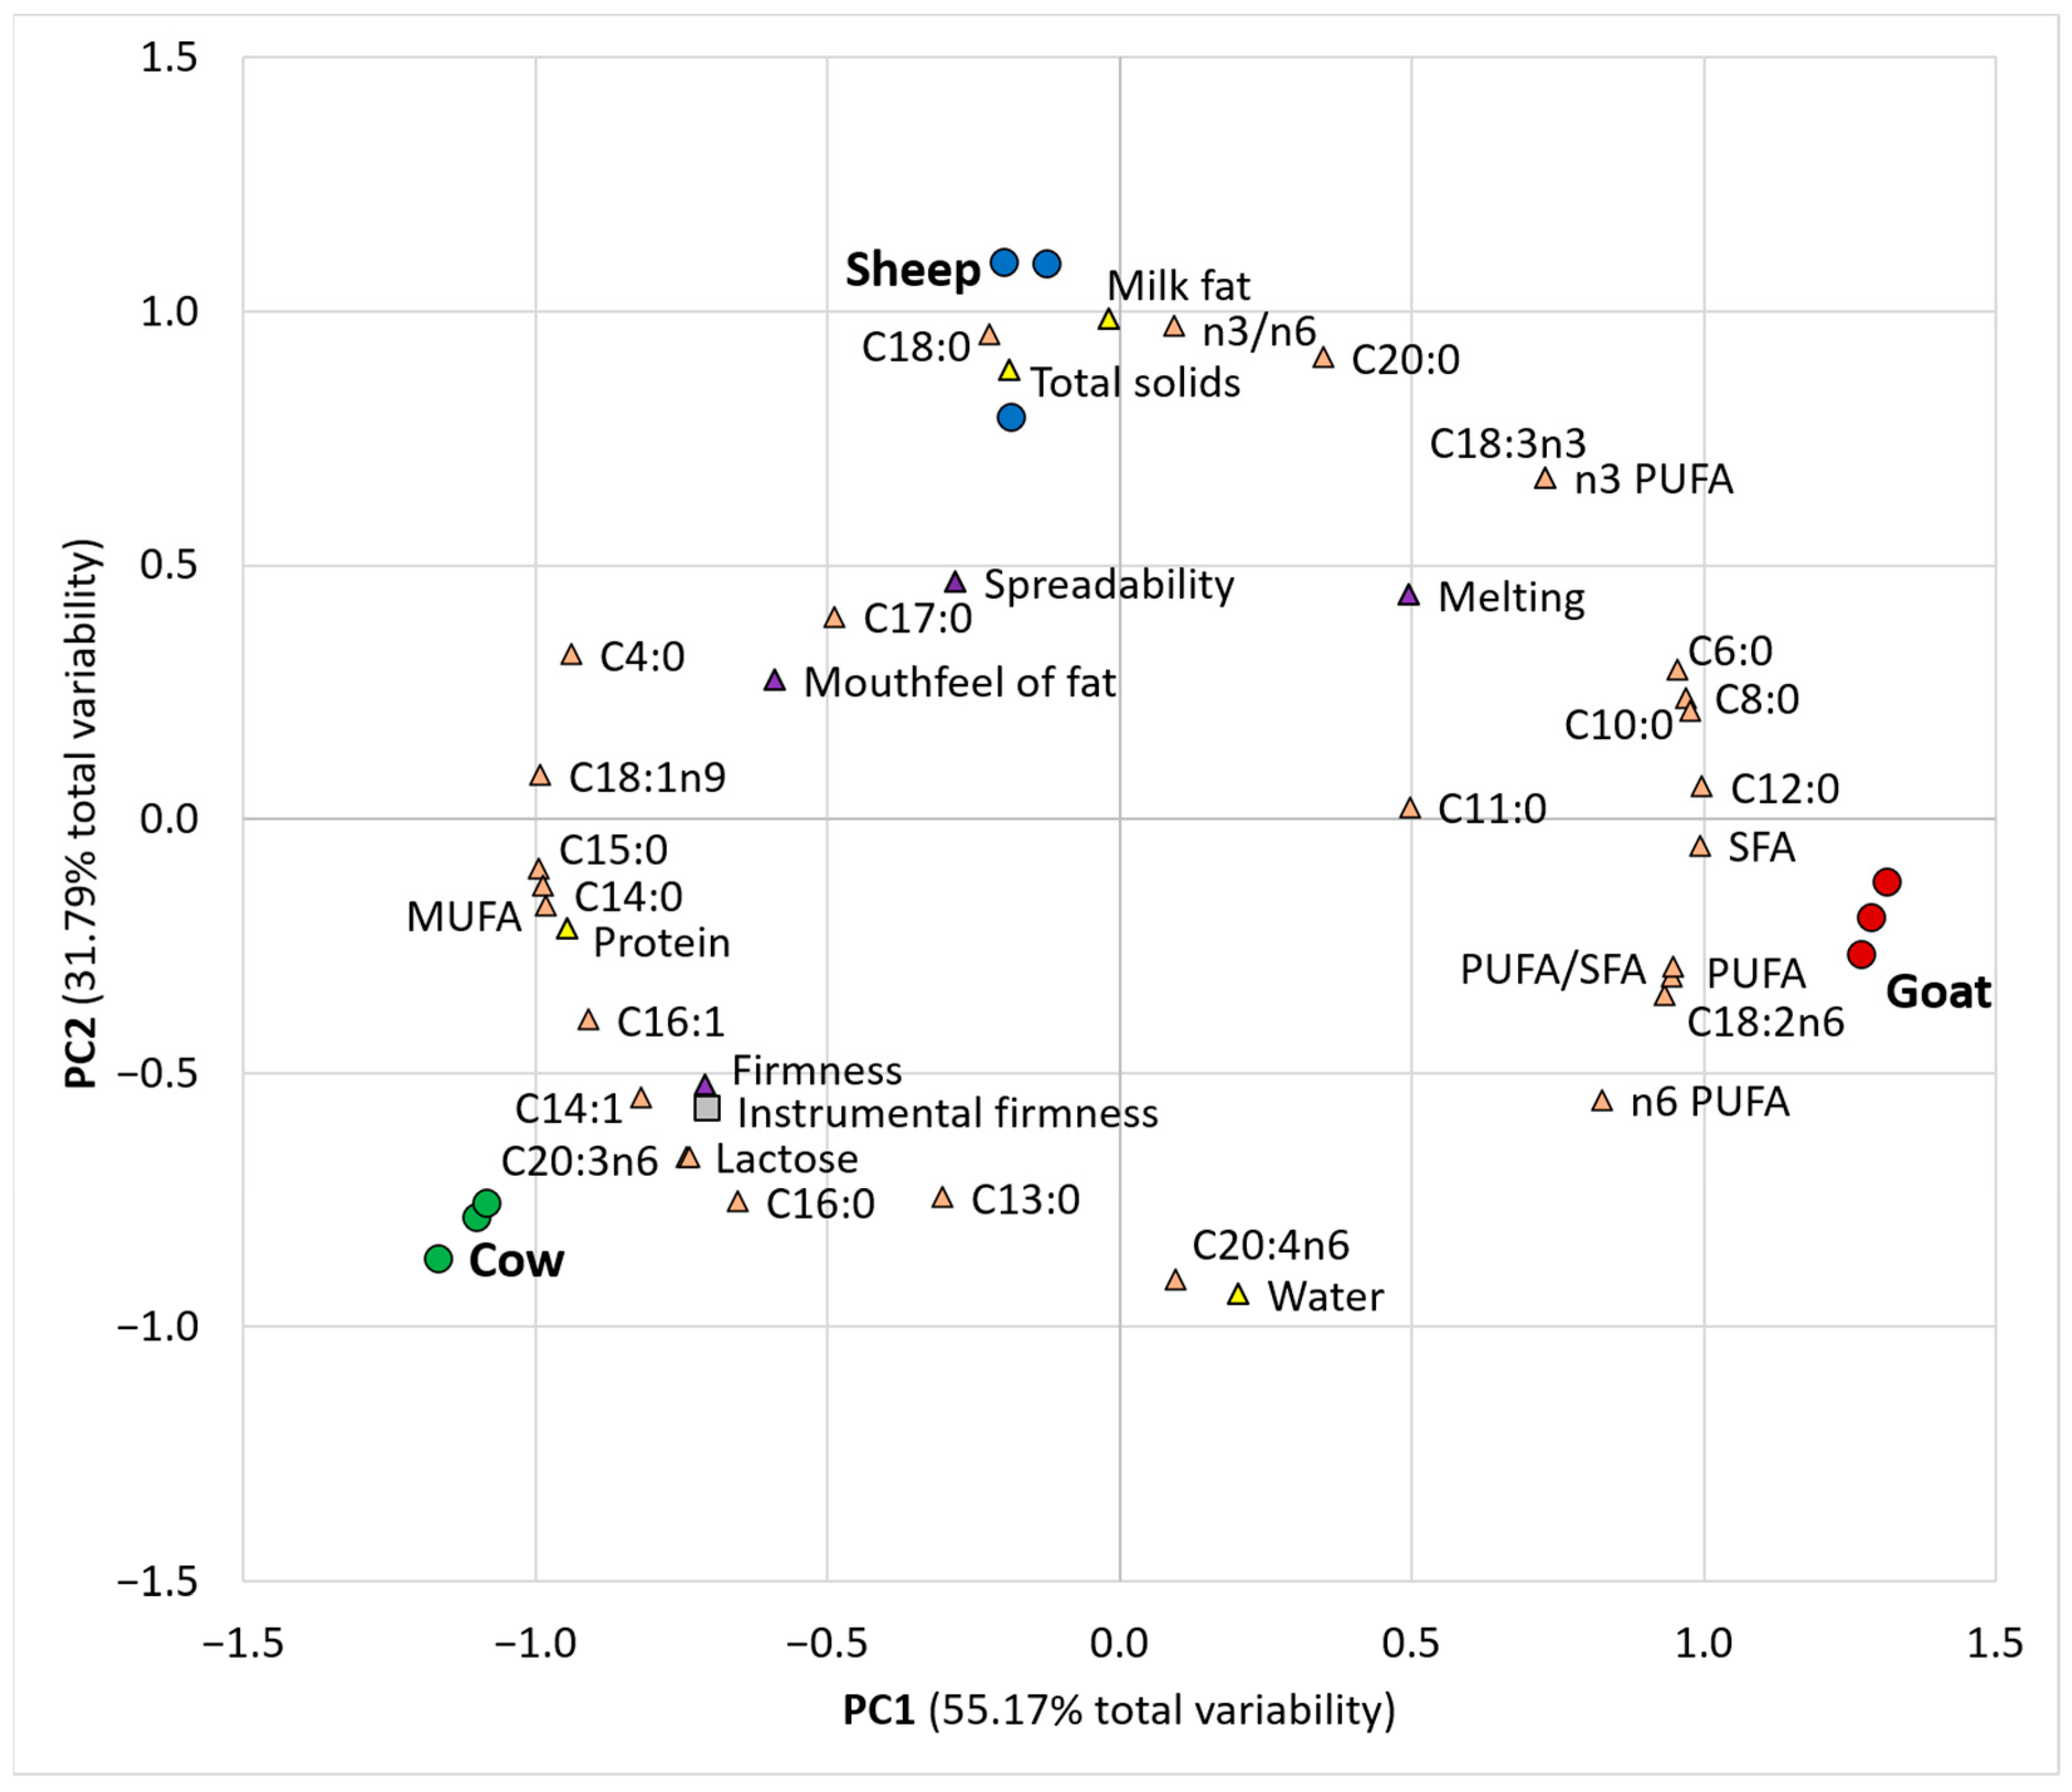
Principal component analysis (PCA) biplot of butter samples produced from cow, sheep, and goat milk. Points represent individual technological replicates (n = 3 per butter type), differentiated according to milk origin. Circles indicate butter samples (green = cow, blue = sheep, red = goat). Purple triangles represent sensory texture attributes, orange triangles represent fatty acid variables, yellow triangles represent chemical composition variables, and grey squares represent instrumental firmness. PC1 and PC2 explain 55.17% and 31.79% of the total variance, respectively.
The first two principal components (PC1 and PC2) explained 55.17% and 31.79% of the total variance, respectively, accounting together for 86.96% of the total variability. These two components were therefore retained for graphical presentation and exploratory interpretation. The PCA biplot provided an overview of the relationships among compositional, instrumental, and sensory variables, and enabled visual assessment of the distribution of cow, sheep, and goat butter samples in the multivariate space. The observed separation indicates that the combined set of compositional and textural variables may contribute to differentiation among butter types.
PC1 was mainly associated with fatty acid chain length and degree of saturation. Positive loadings on PC1 were observed for short- and medium-chain saturated fatty acids (C6:0, C8:0, C10:0, C11:0, and C12:0), total PUFA and n-3 and n-6 PUFA. In contrast, long-chain saturated fatty acids, including myristic (C14:0), pentadecanoic (C15:0), and palmitic acid (C16:0), as well as MUFA such as myristoleic (C14:1), palmitoleic (C16:1), and oleic acid (C18:1n9) exhibited negative loadings on PC1. Protein and lactose contents, instrumental firmness, and sensory firmness also demonstrated negative loadings on PC1.
PC2 appeared to be associated with variables describing the distribution between the fat and aqueous phases and selected sensory attributes. Positive loadings on PC2 were observed for milk fat content, total solids, spreadability, the n-3/n-6 ratio, and stearic acid (C18:0). Negative loadings on PC2 were primarily related to water content, and arachidonic acid (C20:4n6). Melting was located in the positive region of both PC1 and PC2, whereas firmness-related variables were positioned mainly in the negative region of PC1 and PC2.
The positioning of butter types in the PCA space suggested associations between the measured variables and the observed compositional and textural characteristics. Goat butter samples were positioned in the positive region of PC1, reflecting their association with higher proportions of short- and medium-chain fatty acids, higher PUFA content, and higher PUFA/SFA ratio. Their position opposite to mouthfeel of fat suggests that these samples were not primarily characterised by this sensory attribute in the present PCA projection. Cow butter samples were located in the negative region of PC1 and were associated with higher proportions of long-chain saturated and monounsaturated fatty acids, higher instrumental and sensory firmness, and increased protein and lactose contents. Their position opposite to melting suggests a negative association with this sensory attribute, indicating that cow butter samples were more closely related to firmness than to melting behaviour in the PCA space. Sheep butter samples were positioned along positive region of PC2, corresponding to their higher fat and total solids contents, higher spreadability, and higher n-3/n-6 ratio. This position indicates that sheep butter was differentiated primarily by variables related to the fat-rich phase and spreadability rather than by firmness-related traits.
Overall, the PCA supported the exploratory interpretation of relationships among compositional, instrumental, and sensory variables across the butter types included in this study. However, because of the limited number of replicates, the PCA results should be interpreted cautiously and used primarily as a descriptive multivariate overview rather than as confirmatory evidence of group separation.
4. Discussion
4.1. Chemical Composition of Butter in Relation to Milk Type
The chemical composition of butter varied markedly among cow, sheep, and goat samples, demonstrating that milk type significantly influences both the fat and non-fat fractions of the final product. These compositional differences are particularly relevant because the chemical matrix of butter determines its structural organisation and underpins its subsequent textural and sensory properties.
Sheep butter had the highest total solids (86.84 g/100 g) and fat content (85.27 g/100 g), both significantly higher than in cow (82.14 and 79.76 g/100 g, respectively) and goat butter (82.15 and 80.88 g/100 g, respectively). These values are consistent with the higher fat content and species-specific compositional characteristics of sheep milk compared with cow and goat milk [10,11,12]. From a technological perspective, a higher fat fraction increases the volume of the continuous fat phase in butter, affecting matrix compactness and the distribution of the aqueous phase. In contrast, cow and goat butter had significantly higher water contents (17.86 and 17.85 g/100 g, respectively) than sheep butter (13.16 g/100 g). Although the water content of cow and goat butter slightly exceeded the maximum value specified by the Codex Alimentarius standard for butter, and the fat content of cow butter was marginally below the minimum requirement, all products were manufactured under identical pilot-scale conditions to ensure comparability among milk types. Therefore, the samples should be considered experimental pilot-scale butter products rather than commercially standardised butter. These compositional deviations may be related to the small-scale production process, particularly manual kneading, as well as differences in water distribution within the butter matrix. Nevertheless, slight deviations from regulatory limits are not uncommon in laboratory- or pilot-scale butter production, where manual kneading and small-batch processing influence aqueous phase distribution [15,17].
Despite its higher water content, cow butter had the lowest fat proportion, indicating a distinct compositional balance compared with sheep butter. This profile is typical for cow butter and reflects both species-specific milk composition and differences in fat globule characteristics among milk types [32] (Dias et al., 2022). Goat butter, although exhibiting water content comparable to cow butter, showed a higher fat content (80.88 g/100 g), suggesting differences in the distribution of fat and aqueous components among butter types.
Although present at low absolute levels, protein and lactose contents differed significantly among butter types and may reflect differences in the distribution of non-fat components within the butter matrix. Cow butter contained the highest protein (0.59 g/100 g) and lactose (0.48 g/100 g) contents, whereas sheep and goat butter showed lower values. These results indicate differences in residual protein and lactose contents among butter types [3,33]. However, the mechanisms underlying these differences were not investigated in the present study. Even at low concentrations, residual protein and lactose may influence the properties of the aqueous phase and its interaction with the surrounding fat matrix, as reported in previous studies.
The comparatively low protein and lactose contents in sheep and goat butter suggest differences in the distribution of non-fat components among butter types. This is consistent with previous studies reporting lower serum component retention in butter produced from small ruminant milk [10,34]. Such differences may be relevant because the composition of the dispersed phase has been reported to influence microstructural characteristics, stability, and homogeneity during storage.
Collectively, these results indicate that butter derived from different milk types exhibits distinct compositional matrices characterised by varying fat-to-water ratios and distribution of non-fat components. These differences provide a basis for understanding the observed variation in instrumental firmness, sensory texture, and multivariate relationships among compositional and textural variables. Overall, butter texture and quality are governed by the combined effects of fat content, water distribution, and residual non-fat components, which together define the physicochemical framework of the product.
4.2. Fatty Acid Composition of Butter in Relation to Milk Type
The fatty acid composition of butter varied significantly among cow, sheep, and goat samples, confirming that milk origin is a major determinant of lipid profile and, consequently, butter functionality. Although saturated fatty acids predominated in all samples, the relative proportions of fatty acids, chain length distribution, and degree of unsaturation varied significantly, resulting in distinct fatty acid profiles for each butter type.
Saturated fatty acids (SFA) accounted for the largest proportion of total fatty acids in all butter samples, ranging from 69.24% in cow butter to 72.43% in goat butter. The significantly higher SFA content in goat butter reflects the characteristic enrichment of small ruminant milk fat in short- and medium-chain saturated fatty acids [9,10]. In particular, goat butter demonstrated markedly higher proportions of capric acid (C10:0), caprylic acid (C8:0), and caproic acid (C6:0) compared with cow butter, in which C10:0 accounted for only 3.15% of total fatty acids. This shift towards shorter-chain SFA represents a key compositional difference with direct implications for butter structure and functionality. In contrast, cow butter was characterised by a higher proportion of long-chain saturated fatty acids, particularly palmitic acid (C16:0, 32.39%) and myristic acid (C14:0, 11.93%), with values significantly higher than those in sheep and goat butter. These findings are consistent with previous reports describing cow milk fat as rich in long-chain SFA relative to small ruminant milk fat [4,14]. The predominance of long-chain SFA in cow butter may contribute to greater thermal stability and structural coherence of the lipid matrix, as suggested by previous studies.
Sheep butter exhibited an SFA profile characterised by elevated (p < 0.05) stearic acid (C18:0) content (11.08%) compared with cow (8.46%) and goat butter (8.41%). This higher C18:0 level has been consistently reported for sheep milk fat and reflects species-specific differences in rumen biohydrogenation and mammary lipid synthesis [5,35]. Although stearic acid is a long-chain saturated fatty acid, its physicochemical behaviour differs from that of palmitic acid, contributing to compositional and functional distinctions between sheep and cow butter.
Monounsaturated fatty acids (MUFA) also differed significantly among butter types and represented the second most abundant fatty acid group. Cow butter exhibited the highest total MUFA content (24.11%), followed by sheep (22.27%) and goat butter (20.08%). Oleic acid (C18:1n9) predominated in all samples, with a significantly higher proportion in cow butter (21.69%) than in goat butter (19.44%). Higher MUFA levels in cow butter are consistent with previous findings and are associated with greater milk fat plasticity and a broader melting range [36,37].
The lower MUFA content in goat butter further emphasises the compositional contrast with cow butter, reflecting the dominance of short- and medium-chain SFA. Sheep butter exhibited intermediate MUFA values, indicating a distinct fatty acid profile that differentiates it from both cow and goat butter. Recent studies have demonstrated a strong association between fatty acid composition and butter texture. Butter firmness is influenced by the overall fatty acid and triacylglycerol composition, which determine solid fat content and fat crystal network formation [38]. Similarly, changes in the proportions of saturated and monounsaturated fatty acids, driven by dairy production systems, have been shown to result in measurable differences in butter firmness and melting behaviour [39]. In the present study, the higher firmness of cow butter is therefore more appropriately interpreted as the result of its overall lipid composition rather than the effect of individual fatty acids alone. These findings support the importance of the combined fatty acid profile as a determinant of butter texture.
Polyunsaturated fatty acids (PUFA), although present at lower absolute levels than SFA and MUFA, differed significantly among butter types and contributed to their nutritional and functional differentiation. Goat butter showed the highest total PUFA content (4.83%), significantly higher than that in cow (3.21%) and sheep butter (3.20%). The difference was primarily driven by higher linoleic acid (C18:2n6) levels, consistent with previous findings for goat milk fat [9,19].
Sheep butter was characterised by the highest α-linolenic acid (C18:3n3) content (0.87%) and the most favourable n-3/n-6 ratio (0.38), compared with goat (0.22) and cow butter (0.15). From a compositional perspective, this ratio is noteworthy, as the n-3/n-6 ratio is commonly used as a descriptor of fatty acid profile quality in dairy fat studies [40]. This feature reflects species-specific feeding behaviour and lipid metabolism [5,37].
Although PUFA represented a minor fraction of total fatty acids, differences in their composition and ratios further emphasise the distinct lipid profiles of butter derived from different milk types. Recent studies indicate that even small variations in PUFA composition and n-3/n-6 ratio can influence the nutritional and sensory properties of dairy products. Products with different n-3/n-6 ratios may exhibit distinct compositional and sensory characteristics [41]. In this context, the favourable n-3/n-6 ratio observed in sheep butter in the present study further differentiates it from cow and goat butter at the compositional level (Table 2 and Table 3).
Collectively, the results indicate that butter derived from cow, sheep, and goat milk differs substantially in fatty acid composition. Each butter type is characterised by a specific distribution of saturated and unsaturated fatty acids, reflecting differences in chain length and degree of unsaturation. These compositional differences provide a basis for interpreting the observed variation in instrumental firmness, sensory texture, and multivariate behaviour between butters. Overall, butter functionality and quality are determined by species-specific fatty acid profiles, highlighting the role of milk origin in butter characterisation and product differentiation.
4.3. Instrumental Texture (Firmness) of Butter in Relation to Milk Type
Mean instrumental firmness values differed numerically among butter types, but these were not statistically significant (p > 0.05; Table 4). Cow butter had a mean firmness value of 6.07 N, nearly twice that of sheep (3.32 N) and goat butter (3.04 N). The magnitude of these differences across the production batches suggests a potentially relevant technological effect that warrants further investigation. In complex food matrices such as butter, variability in water distribution and fat crystal heterogeneity can increase within-group variance and mask statistically significant differences, particularly in small sample sets. Similar firmness ranges have been reported for butter produced under different processing and storage conditions [15,42]. Firmness values between 4 and 7 N have been observed for cow butter produced under different feeding regimes, confirming that the values obtained in the present study fall within a realistic and technologically relevant range [38].
Although differences in instrumental firmness were not statistically significant (p > 0.05), cow butter exhibited the highest mean firmness value. This tendency may be related to its compositional profile, characterised by higher proportions of long-chain saturated fatty acids, particularly palmitic acid. However, because direct measurements of solid fat content, triacylglycerol composition, melting behaviour, and microstructure were not performed, this interpretation should be regarded as a plausible association rather than a demonstrated mechanism. Further studies with a larger number of independent production batches and direct structural analyses are required to confirm the factors underlying instrumental firmness differences among butter types. Previous studies have shown that butter firmness is more strongly influenced by fatty acid chain length distribution and crystallisation behaviour than by total fat content alone [3,8,14]. In this context, the observed instrumental firmness values fall within the range reported for cow butter produced under comparable conditions [15,36].
Sheep and goat butter exhibited lower mean firmness values than cow butter; however, these differences were not statistically confirmed under the experimental conditions applied in this study. Sheep butter, despite its high fat content (85.27 g/100 g), showed intermediate firmness, consistent with its elevated stearic acid content (11.08%) and lower palmitic acid proportion compared with cow butter. Stearic acid has been reported to contribute differently to fat crystal network formation than palmitic acid, which may be associated with softer mechanical behaviour under comparable conditions [3,7].
Goat butter exhibited the lowest instrumental firmness, corresponding to its enrichment in short- and medium-chain saturated fatty acids, particularly capric acid (11.84%). Milk fats rich in shorter-chain fatty acids have been reported to form less rigid crystal networks and to exhibit reduced resistance to deformation [7,9]. The lower firmness of goat butter observed in this study is consistent with values reported for goat milk butter and spreads, supporting the consistency of this observation with previous reports [10,19]. Cow and goat butter also had higher water contents (approximately 17.9 g/100 g) than sheep butter (13.16 g/100 g). Although increased water content has been associated with reduced firmness due to disruption of the continuity of the fat crystal network [16,17], total moisture content alone cannot fully explain butter texture. Previous studies have shown that butter texture depends not only on the amount of water present, but also on the size, distribution, and spatial organisation of water droplets within the continuous fat phase, together with the organisation of the fat crystal network [7,17]. These structural characteristics influence the mechanical behaviour of butter and may account for differences in firmness even among samples with similar moisture contents. This may explain why cow butter exhibited the highest firmness despite its relatively high moisture content, suggesting that the influence of fatty acid composition and fat crystal organisation outweighed the effect of total water content under the conditions of the present study. Since neither butter microstructure nor water activity was evaluated, this interpretation rests on compositional evidence and previously published studies rather than direct structural measurements.
Collectively, the results suggest that butter firmness may be associated with milk type and lipid composition, although further studies with a larger number of independent production batches are required to confirm these relationships.
4.4. Sensory Texture Attributes of Butter in Relation to Milk Type
Sensory texture analysis revealed statistically significant differences among butter types for all evaluated attributes (p < 0.05), confirming that milk origin influences texture perception (Table 5). Sensory evaluation complements instrumental measurements by capturing attributes related to oral processing and perception.
Cow butter was perceived as the firmest sample (sensory firmness score 3.92), significantly higher than sheep (1.67) and goat butter (1.25). This perception corresponds to the instrumental firmness values, indicating that differences in mechanical resistance are reflected in sensory evaluation. Previous studies have shown that sensory firmness is associated with resistance to deformation and fracture, particularly in semi-solid fat-based systems [43,44].
Sheep butter exhibited the highest spreadability (8.25) and fatty mouthfeel (5.58), indicating a soft texture characterised by high spreadability. These attributes are consistent with its higher fat content and specific fatty acid composition, which favour deformation and lubrication rather than structural rigidity [13,45]. Similar sensory characteristics have been reported for high-fat dairy products and small ruminant milk products [10,11].
Goat butter exhibited the highest melting perception (8.17), significantly higher than that of cow butter (7.00). This could be associated with higher proportions of short- and medium-chain fatty acids and increased polyunsaturated fatty acid content of goat milk [7,46]. Furthermore, previous studies have reported associations between fatty acid composition and melting characteristics of butter [38]. The higher melting perception observed in goat butter in the present study is consistent with these reports; however, the underlying mechanisms were not directly investigated.
Collectively, the sensory results indicate that each butter type exhibits a distinct sensory texture profile: cow butter is characterised by higher firmness, sheep butter by higher spreadability and fatty mouthfeel, and goat butter by higher melting perception and lower firmness. These differences suggest that milk type contributes to variation in butter texture perception.
4.5. Integrated Interpretation of Butter Properties Based on PCA
Principal component analysis (PCA) enabled integrated interpretation of relationships among chemical composition, fatty acid profile, instrumental firmness, and sensory texture attributes of butter produced from different milk types. As PCA was performed on limited number of replicates (n = 3 per butter type), the results should be interpreted as an exploratory multivariate representation that complements univariate analyses, rather than as a basis for inferential statistical conclusions.
The positioning of cow, sheep, and goat butter samples in the PCA space suggests that milk origin may contribute to differences in butter composition and texture. The separation was primarily driven by the first principal component (PC1), which reflected variation in fatty acid chain length, degree of saturation, and firmness-related attributes. Goat butter was positioned in the positive region of PC1, associated with higher proportions of short- and medium-chain fatty acids (e.g., capric acid, 11.84%), higher polyunsaturated fatty acid content, and higher melting perception scores. This positioning is consistent with a compositional profile characterised by lower firmness and enhanced melting behaviour. Cow butter samples were located in the negative region of PC1, corresponding to higher proportions of long-chain saturated fatty acids (e.g., palmitic acid at 32.39%), higher monounsaturated fatty acid content, and higher instrumental (6.07 N) and sensory firmness values. It should be noted that differences in instrumental firmness were not statistically significant in the univariate analysis. The proximity of instrumental and sensory firmness variables in the PCA space indicates agreement between these measurements.
Sheep butter samples were primarily differentiated along the second principal component (PC2), associated with total fat content, spreadability, and the n-3/n-6 fatty acid ratio. Their positioning reflects higher fat content (85.27 g/100 g), lower water content (13.16 g/100 g), elevated stearic acid levels, and higher sensory scores for spreadability. This pattern suggests that sheep butter exhibits a distinct compositional–textural profile relative to cow and goat butter. The PCA results suggest that butter properties may be associated with the combined influence of fatty acid composition, fat-to-water ratio, and residual non-fat components. This interpretation is consistent with established models describing butter as a structurally complex system in which lipid composition and microstructural organisation have been reported to influence mechanical and sensory behaviour [3,8,18]. Previous studies have also shown that multivariate approaches can effectively capture the combined influence of compositional and texture-related variables in butter systems [18,19]. The alignment between univariate results (chemical composition, fatty acid profile, instrumental firmness, and sensory attributes) and PCA patterns supports internal consistency of the dataset, as variables identified in individual analyses contributed to sample differentiation.
The PCA further suggests that differences in butter texture among milk types may be associated with distinct compositional patterns. Cow butter is linked to higher firmness and long-chain fatty acids, sheep butter to higher fat content and spreadability-related attributes, and goat butter with short- and medium-chain fatty acids and increased melting perception. The PCA further suggests that differences in butter texture among milk types may be linked to distinct compositional patterns. Cow butter was associated with greater firmness and long-chain fatty acids, sheep butter with higher fat content and spreadability-related attributes, and goat butter with short- and medium-chain fatty acids and increased melting perception. These exploratory associations warrant further investigation using larger datasets, multiple production batches, and industrial-scale processing conditions to confirm their technological relevance.
Collectively, the PCA results suggest that butter texture and sensory perception may be associated with the combined effects of compositional and structural factors that vary among the butter types examined in this study. These findings demonstrate the usefulness of multivariate analysis for the integrated evaluation of butter characteristics and provide a basis for future studies on product differentiation among butter types.
4.6. Study Limitations
This study integrates chemical composition, fatty acid profile, instrumental, and sensory analyses to provide a comprehensive evaluation of butter quality. Nevertheless, several limitations should be acknowledged. Butter samples were produced under pilot-scale conditions during a single production period, which may limit the generalisability of the findings to industrial-scale processing and seasonal variability. In addition, the water content of cow and goat butter exceeded the maximum value specified by the Codex Alimentarius standard. Furthermore, the fat content of cow butter (79.76 g/100 g) was slightly below the minimum requirement of 80%, most likely due to its elevated moisture content. Therefore, the results should be interpreted within the context of experimentally produced butter samples rather than commercially standardised products. These deviations are likely related to pilot-scale production and manual kneading procedures and should be considered when extrapolating the results to commercial butter manufacture. Future studies should evaluate the use of automated kneading and moisture standardisation procedures to improve compliance with industrial specifications.
Furthermore, the analytical measurements were performed at different time points after butter manufacture. Although all butter types were stored under identical conditions and analysed according to the same schedule, the potential influence of storage-related fat crystallisation on texture measurements cannot be completely excluded. In addition, milk from each species originated from a single farm; therefore, the observed differences may also reflect breed-, feeding-, and farm-management-related factors rather than milk species alone. Although repeated analytical and technical measurements were averaged within technological replicates, the number of independent technological replicates remained limited. Finally, microstructural characterisation (e.g., polarised light microscopy or confocal laser scanning microscopy) and direct measurements of solid fat content were not performed. Consequently, interpretations regarding fat crystal network organisation are based on compositional data and previous literature rather than direct structural observations. Furthermore, PCA was performed on limited number of replicates and was intended solely as an exploratory tool for visualising relationships among variables. Consequently, PCA results should not be interpreted as evidence of sample-level discrimination or statistical separation among butter types. The trained sensory panel comprised six assessors. Although panel performance and repeatability were verified, a larger panel would improve the generalisability of the sensory results. Instrumental firmness differences, while quantitatively substantial, did not reach statistical significance under the applied experimental design. Future studies involving a larger number of independent production batches may provide greater resolution of potential differences in mechanical behaviour between butter types. Despite these limitations, the consistency observed across compositional, instrumental, sensory, and multivariate analyses supports the interpretation of the results. Further studies incorporating microstructural analysis and expanded sensory panels would provide a more detailed understanding of the relationships between fatty acid composition, fat crystal network organisation, and butter texture.
5. Conclusions
Butter produced from different milk species exhibited distinct compositional and sensory texture profiles that were associated with differences in fatty acid chain length distribution and degree of saturation. Cow butter showed the highest mean instrumental and sensory firmness values, although differences in instrumental firmness were not statistically significant. Principal component analysis provided an exploratory overview of the relationships among compositional, instrumental, and sensory variables, and helped to visualise patterns observed among butter types. These findings suggest that milk species may contribute to differences in butter texture and sensory properties; however, the results should be interpreted within the context of the pilot-scale design, single production period, limited sensory panel size, and absence of direct microstructural characterisation. The present findings suggest that milk species may be associated with differences in butter texture and sensory characteristics. Further studies involving multiple production periods, larger sample sets, direct microstructural analyses, and industrial-scale manufacturing conditions are required before broader technological recommendations can be made.
Author Contributions
Conceptualisation, D.B.L. and L.V.M.; methodology, D.B.L., I.K., and A.R.; software, I.K.; validation and formal analysis, D.B.L., I.K., S.K., M.T.K., N.M., and A.R.; investigation, D.B.L. and L.V.M.; resources, D.B.L., N.M., and A.R.; data curation, L.V.M.; writing—original draft preparation, D.B.L., L.V.M., and I.K.; writing—review and editing, I.K., I.D.Š., S.K., M.T.K., and I.V.; visualisation, D.B.L.; supervision, I.D.Š. and I.V.; funding acquisition, D.B.L., L.V.M., I.K., and A.R. All authors have read and agreed to the published version of the manuscript.
Funding
This research was funded by the “Food Safety and Quality Centre” (KK.01.1.1.02.0004) project funded by the European Regional Development Fund, by the University of Zagreb Faculty of Agriculture through the funds allocated by the Ministry of Science and Education of the Republic of Croatia, as well as by the InooFeed4Milk project funded by the European Union—Next Generation EU.
Institutional Review Board Statement
The research was approved by the Ethics Committee for Sensory Analysis of Agri-food Products of the University of Zagreb Faculty of Agriculture (approval reference no. 251-71-29-02/22-24-2; 15 May 2024). Assessors provided informed consent at the start of the evaluation.
Informed Consent Statement
Informed consent was obtained from all subjects involved in the study.
Data Availability Statement
The data presented in this study are available on request from the corresponding author due to commercial sensitivity of product formulations and raw data being stored in laboratory records not publicly accessible.
Conflicts of Interest
The authors declare no conflicts of interest.
References
- Fearon, A.M. Butter and butter products. In Dairy Ingredients for Food Processing; Fearon, R.C., Kilara, A., Eds.; Blackwell Publishing: Oxford, UK, 2011; pp. 199–225. [Google Scholar]
- FAO; WHO. Codex Alimentarius. Standard for Butter (CXS 279-1971); FAO/WHO Codex Alimentarius Commission: Rome, Italy, 2022. [Google Scholar]
- Walstra, P.; Wouters, J.T.M.; Geurts, T.J. Dairy Science and Technology, 2nd ed.; CRC Press: Boca Raton, FL, USA, 2006. [Google Scholar]
- Barłowska, J.; Litwińczuk, Z. Nutritional and pro-health properties of milk fat. Med. Wet. 2009, 65, 171–174. [Google Scholar]
- Mele, M.; Zotto, R.D.; Cassandro, M.; Conte, G.; Serra, A.; Buccioni, A.; Bittante, G.; Secchiari, P. Genetic parameters for conjugated linoleic acid, selected milk fatty acids, and milk fatty acid unsaturation of Italian Holstein-Fresian cows. J. Dairy Sci. 2009, 92, 392–400. [Google Scholar] [CrossRef] [Scilit] [PubMed]
- Wright, A.J.; Hartel, R.W.; Narine, S.S.; Marangoni, A.G. The effect of minor components on milk fat crystallization. J. Am. Oil Chem. Soc. 2000, 77, 463–475. [Google Scholar] [CrossRef] [Scilit]
- Shi, Y.; Smith, C.M.; Hartel, R.W. Compositional Effects on Milk Fat Crystallization. J. Dairy Sci. 2001, 84, 2392–2401. [Google Scholar] [CrossRef] [Scilit] [PubMed]
- Rønholt, S.; Mortensen, K.; Knudsen, J.C. The effective factors on the structure of butter and other milk fat-based products. Compr. Rev. Food Sci. Food Saf. 2013, 12, 468–482. [Google Scholar] [CrossRef] [Scilit] [PubMed]
- Rodriguez, A.; Bunger, A.; Castro, E.; Sousa, I. Development and optimisation of cultured goat cream butter. J. Am. Oil Chem. Soc. 2003, 80, 987–992. [Google Scholar]
- Pandya, A.J.; Ghodke, K.M. Goat and sheep milk products other than cheeses and yoghurt. Small Rumin. Res. 2007, 68, 193–206. [Google Scholar] [CrossRef] [Scilit]
- Balthazar, C.F.; Pimentel, T.C.; Ferrão, L.L.; Almada, C.N.; Santillo, A.; Albenzio, M.; Mollakhalili, N.; Mortazavian, A.M.; Nascimento, J.S.; Silva, M.C.; et al. Sheep milk: Physicochemical characteristics and relevance for functional food development. Compr. Rev. Food Sci. Food Saf. 2017, 16, 247–262. [Google Scholar] [CrossRef] [Scilit] [PubMed]
- Hilali, M.; El-Mayda, E.; Rischkowsky, B. Characteristics and utilization of sheep and goat milk in the Middle East. Small Rumin. Res. 2011, 101, 92–101. [Google Scholar] [CrossRef] [Scilit]
- Frede, E. Butter—Properties and analysis. In Encyclopedia of Dairy Sciences; Roginski, H., Ed.; Academic Press: London, UK, 2002. [Google Scholar]
- Bobe, G.; Hammond, E.G.; Freeman, A.E.; Lindberg, G.L.; Beitz, D.C. Texture of butter from cows with different milk fatty acid compositions. J. Dairy Sci. 2003, 86, 3122–3127. [Google Scholar] [CrossRef] [Scilit] [PubMed]
- Çetinkaya, A. Determination of some properties of butter made from creams extracted from whey and milk. Eur. J. Agric. Food Sci. 2021, 3, 19–24. [Google Scholar] [CrossRef] [Scilit]
- Rousseau, D.; Ghosh, S.; Park, H. Comparison of the dispersed phase coalescence mechanisms in different table spreads. J. Food Sci. 2009, 74, E1–E7. [Google Scholar] [CrossRef] [Scilit] [PubMed]
- Rønholt, S.; Kirkensgaard, J.J.K.; Mortensen, K.; Knudsen, J.C. Effect of cream cooling rate and water content on butter microstructure during four weeks of storage. Food Hydrocoll. 2014, 34, 169–176. [Google Scholar] [CrossRef] [Scilit]
- Pădureţ, S. The effect of fat content and fatty acids composition on color and textural properties of butter. Molecules 2021, 26, 4565. [Google Scholar] [CrossRef] [Scilit] [PubMed]
- Karakus, M.S.; Akgul, F.Y.; Korkmaz, A.; Atasoy, A.F. Evaluation of fatty acids, free fatty acids and textural properties of butter and sadeyag produced from ovine and bovine cream and yoghurt. Int. Dairy J. 2022, 126, 105229. [Google Scholar] [CrossRef] [Scilit]
- Lei, Y.; Guo, X.; Wu, Z.; Feng, J.; Yang, T.; Zhang, W.; Cong, Y. Evaluation of flavor quality of commercial butter: A systematic comparison of sweet cream and cultured butter. Food Chem. X 2025, 32, 103334. [Google Scholar] [CrossRef] [Scilit] [PubMed]
- Mallia, S.; Escher, F.; Schlichtherle-Cerny, H. Aroma-active compounds of butter: A review. Eur. Food Res. Technol. 2008, 226, 315–325. [Google Scholar] [CrossRef] [Scilit]
- HRN EN ISO 3727-2; Butter—Determination of Water, Non-Fat Solids and Fat Content—Part 2: Determination of Non-Fat Solids. Croatian Standards Institute: Zagreb, Croatia, 2003.
- HRN EN ISO 3727-1; Butter—Determination of Water, Non-Fat Solids and Fat Content—Part 1: Determination of Water Content. Croatian Standards Institute: Zagreb, Croatia, 2003.
- HRN EN ISO 17189; Butter, Edible Oil Emulsions and Spreads—Determination of Fat Content (Reference Method). Croatian Standards Institute: Zagreb, Croatia, 2008.
- HRN EN ISO 8968-1; Milk—Determination of Nitrogen Content—Part 1: Kjeldahl Method. Croatian Standards Institute: Zagreb, Croatia, 2014.
- HRN ISO 5765-1; Dried Milk, Ice-Cream Mix and Processed Cheese—Determination of Lactose Content—Part 1: Enzymatic Method. Croatian Standards Institute: Zagreb, Croatia, 2003.
- HRN ISO 15884; Milk Fat—Determination of Mono- and Polyunsaturated Fatty Acids by Gas Chromatography. Croatian Standards Institute: Zagreb, Croatia, 2003.
- HRN ISO 15885; Milk Fat—Determination of Milk Fat Composition by Gas-Liquid Chromatography. Croatian Standards Institute: Zagreb, Croatia, 2003.
- ISO 8589; Sensory Analysis—General Guidance for the Design of Test Rooms. International Organization for Standardization: Geneva, Switzerland, 2007.
- ISO 22935-1; Milk and Milk Products—Sensory Analysis—Part 1: Recruitment, Selection, Training and Monitoring of Assessors. International Organization for Standardization: Geneva, Switzerland, 2023.
- SAS Institute Inc. SAS Software, Release 3.82 (Enterprise Edition); SAS Institute Inc.: Cary, NC, USA, 2025. [Google Scholar]
- Dias, R.S.; Balthazar, C.F.; Cavalcanti, R.N.; Sobral, L.A.; Rodrigues, J.F.; Neto, R.P.C.; Tavares, M.I.B.; Ribeiro, A.P.B.; Grimaldi, R.; Sant’Anna, C.; et al. Nutritional, rheological and sensory properties of butter processed with different mixtures of cow and sheep milk cream. Food Biosci. 2022, 46, 101564. [Google Scholar] [CrossRef] [Scilit]
- Gazu, L.; Eshete, T.; Kassa, G. Physicochemical analysis and microbial quality of cow butter obtained from Menz district of Amhara region, Ethiopia. Afr. J. Bacteriol. Res. 2018, 10, 34–43. [Google Scholar]
- Sağdıç, O.; Dönmez, M.; Demirci, M. Comparison of characteristics and fatty acid profiles of traditional Turkish yayik butters produced from goats’, ewes’ or cows’ milk. Food Control 2004, 15, 485–490. [Google Scholar] [CrossRef] [Scilit]
- Staniewski, B.; Ogrodowska, D.; Staniewska, K.; Kowalik, J. The effect of triacylglycerol and fatty acid composition on the rheological properties of butter. Int. Dairy J. 2021, 114, 104913. [Google Scholar] [CrossRef] [Scilit]
- Bobe, G.; Zimmerman, S.; Hammond, E.G.; Freeman, A.E.; Porter, P.A.; Luhman, C.M.; Beitz, D.C. Butter composition and texture from cows with different milk fatty acid compositions fed fish oil or roasted soybeans. J. Dairy Sci. 2007, 90, 2596–2603. [Google Scholar] [CrossRef] [Scilit] [PubMed]
- O’Callaghan, T.F.; Faulkner, H.; McAuliffe, S.; O’Sullivan, M.G.; Hennessy, D.; Dillon, P.; Kilcawley, K.N.; Stanton, C.; Ross, R.P. Quality characteristics, chemical composition and sensory properties of butter from cows on pasture versus indoor feeding systems. J. Dairy Sci. 2016, 99, 9441–9460. [Google Scholar] [CrossRef] [Scilit] [PubMed]
- Timlin, M.; Brodkorb, A.; O’Callaghan, T.F.; Harbourne, N.; Drouin, G.; Pacheco-Pappenheim, S.; Murphy, J.P.; O’Donovan, M.; Hennessy, D.; Pierce, K.M.; et al. Pasture feeding improves the nutritional, textural, and techno-functional characteristics of butter. J. Dairy Sci. 2024, 107, 5376–5392. [Google Scholar] [CrossRef] [Scilit] [PubMed]
- Grille, L.; Vieitez, I.; Garay, A.; Romero, M.; Jorcín, S.; Krall, E.; Méndez, M.N.; Irigaray, B.; Bejarano, E.; López-Pedemonte, T. Fat Profiles of Milk and Butter Obtained from Different Dairy Systems (High and Low Pasture) and Seasons (Spring and Fall): Focus on Healthy Fatty Acids and Technological Properties of Butter. Dairy 2024, 5, 555–575. [Google Scholar] [CrossRef] [Scilit]
- Simopoulos, A.P. An increase in the omega-6/omega-3 fatty acid ratio increases the risk for obesity. Nutrients 2016, 8, 128. [Google Scholar] [CrossRef] [Scilit] [PubMed]
- Belabbes, M.; Attou, S.; Elaffifi, M.; Benhamimed, S.; Bouderoua, K. Impact of different regime of diet on the composition, fatty acid profile and storage capacity of traditional butter made from local sheep milk ‘Ouled Djellal’. Agric. Conspec. Sci. 2024, 89, 289–297. [Google Scholar]
- Kashaninejad, M.; Razavi, S.M.A.; Mazaheri Tehrani, M.; Kashaninejad, M. Effect of extrusion conditions and storage temperature on texture, colour and acidity of butter. Int. J. Dairy Technol. 2016, 70, 102–109. [Google Scholar] [CrossRef] [Scilit]
- Mallia, S.; Piccinali, P.; Rehberger, B.; Badertscher, R.; Escher, F.; Schlichtherle-Cerny, H. Determination of storage stability of butter enriched with unsaturated fatty acids/conjugated linoleic acids (UFA/CLA) using instrumental and sensory methods. Int. Dairy J. 2008, 18, 983–993. [Google Scholar] [CrossRef] [Scilit]
- Foegeding, E.A.; Daubert, C.R.; Drake, M.A.; Essick, G.; Trulsson, M.; Vinyard, C.J.; van de Velde, F. A Comprehensive Approach to Understanding Textural Properties of Semi- and Soft-Solid Foods. J. Texture Stud. 2011, 42, 103–129. [Google Scholar] [CrossRef] [Scilit]
- Vioque-Amor, M.; Gómez-Díaz, R.; Del Río-Celestino, M.; Avilés-Ramírez, C. Butter from Different Species: Composition and Quality Parameters of Products Commercialized in the South of Spain. Animals 2023, 13, 3559. [Google Scholar] [CrossRef] [Scilit] [PubMed]
- Ceylan, O.; Ozcan, T. Effect of the cream cooling temperature and acidification method on the crystallization and textural properties of butter. LWT 2020, 132, 109806. [Google Scholar] [CrossRef] [Scilit]

Disclaimer/Publisher’s Note: The statements, opinions and data contained in all publications are solely those of the individual author(s) and contributor(s) and not of MDPI and/or the editor(s). MDPI and/or the editor(s) disclaim responsibility for any injury to people or property resulting from any ideas, methods, instructions or products referred to in the content. |
© 2026 by the authors. Licensee MDPI, Basel, Switzerland. This article is an open access article distributed under the terms and conditions of the Creative Commons Attribution (CC BY) license.