


Abstract
Pyroshock during spacecraft separation poses a critical challenge to equipment reliability. Although the Shock Response Spectrum (SRS) is the industry standard for test equivalence, shocks with identical SRS but different time-histories can induce significantly varying structural responses. This paper aims to develop a more accurate, SRS-integrated method for establishing test equivalence through an investigation of the influence of signal features on structural responses. To ensure the validity and efficiency of the research, large-scale shock signals are synthesized using the shock-waveform superposition algorithm and screened for physical validity using a ResNet50-based deep learning approach, thereby guaranteeing the quality of the excitation signals. Three criteria for establishing test equivalence are investigated: (1) SRS, (2) SRS combined with signal effective duration and amplitude, and (3) SRS combined with the Shock Severity Infimum (SSI). Shock signal sets corresponding to these three criteria are used to excite plate structures in batch finite element analysis simulations, and the resulting structural responses are statistically analyzed. The results indicate that when using the SRS as the sole benchmark, the additional inclusion of effective duration and amplitude criteria does not lead to a significant improvement in test equivalence. The proposed dual-spectrum (SRS-SSI) criteria significantly improve the equivalence of shock environment tests, providing more accurate criteria for equipment reliability validation.
1. Introduction
Pyroshock is a transient, broad-spectrum, high-acceleration mechanical shock generated by pyrotechnic devices in aerospace and military systems [1,2]. Pyroshock produces stress waves that can excite structural resonances and amplify responses [3]. While primary structures are rarely damaged, onboard electronics and optical devices are vulnerable, risking mission failure [4]. The damage includes fatigue, cracks, and operational disruptions, with severity depending on shock intensity and proximity to the source. Accurate equivalent shock testing is therefore essential to estimate component reliability, estimate fragility, and develop mitigation strategies.
Structural shock response analysis is particularly critical for aerospace vehicles such as spacecraft and aircraft. Researchers at KAIST have generated shock environments using pyrotechnic [5,6], laser [6,7], and mechanical impact [8,9,10] excitations. Viale et al. [11] proposed an effective parametric model for pyroshock simulation and the design optimization of test facilities. Zhao and Wang [12,13] confirmed the reliability of the Finite Element Method (FEM) in simulating the shock response of separation nuts and analyzed the associated response characteristics. Zhao et al. [14] investigated predictive methodologies for the shock environment induced by satellite-launch-vehicle separation. Yan et al. [15] examined the dynamic response characteristics of aluminum honeycomb panels subjected to high-frequency laser shock excitation. Wang et al. [16] proposed a method for predicting pyroshock responses of spacecraft structures across a broad frequency range using acceleration frequency response functions and virtual modal synthesis. Zhao et al. [4] developed a hybrid modeling technique for shock response prediction of typical structures and verified its accuracy through comparative Shock Response Spectrum (SRS) analysis. Most shock response prediction and experimental measurements are converted to SRS as they provide a standardized, frequency-based summary enabling easier comparison, specification, and estimation of shock environments.
When analyzing the response or failure of a device or component, the SRS needs to be converted back to a time-domain signal waveform, especially when generating inputs for experiments and simulations of devices [17,18,19]. Initial approaches to SRS-based waveform synthesis often relied on probabilistic or experimental frameworks. For instance, Soize et al. [20] applied the maximum entropy principle to address time-domain synthesis. Similarly, Hwang and Duran [21] developed a method using probability density functions for damped sinusoid parameters. Other techniques focus on specific shock types, such as Chong et al.’s [22] laser shock reconstruction, which Kim et al. [6] extended to linear explosive separation waveforms. However, these methods are limited by their dependence on experimental data, restricting their generality. Simpler alternatives involve matching primary SRS features with basic waveforms, such as half-sine, rectangular, or sawtooth pulses. More advanced mainstream techniques employ damped sinusoid superposition or wavelet functions. Brake [23], for example, introduced an SRS inverse function method using impulse functions, damped sinusoids, and Morlet wavelets. Despite these advances, Alexander [24] highlighted that such manufactured waveforms often deviate significantly from real-world pyroshock signals. To better match target SRS without relying on experimental data, optimization strategies have emerged. Genetic Algorithms (GA) have been adapted for waveform synthesis [25,26], with Sun et al. [27] proposing an improved adaptive GA that eliminates data dependency. Yan and Li [28] developed a decomposition and synthesis approach using a general shock-waveform model to ensure SRS consistency between synthesized and original signals. Building on optimization, Song et al. [29] introduced an algorithm combining synthesized signals with continuous interpolation via second-order difference quotients. Yan and Li [30] proposed a shock signal characterization technique based on shockwave dictionaries, enabling the synthesis of numerous high-fidelity waveforms that closely match the target SRS. While these methods successfully generate signals that match the target SRS, the resulting waveforms can exhibit substantial temporal variations despite maintaining SRS compliance.
To date, SRS remain the industry standard for test equivalence in various engineering sectors, such as aerospace (e.g., NASA-STD-7003A [31]) and defense (e.g., MIL-STD-810H [32]). However, the test equivalence based on SRS is questionable. The fundamental challenge to achieving reliable test equivalence arises from the non-unique mapping between SRS and time-domain waveforms. Numerous investigations have revealed that time-histories significantly affect structural responses, even among signals exhibiting virtually identical SRS profiles. Sisemore [33] demonstrated that shock signals with distinct amplitudes, durations, and waveforms can produce virtually identical SRS curves. Lalanne [34] showed that signals with similar SRS but differing time-histories can induce up to 40% variations in Multi-Degree-of-Freedom (MDOF) model responses, particularly affecting electronic component damage. Similarly, García-Pérez [35] analyzed the STEP instrument on the Solar Orbiter spacecraft, revealing that signals with comparable SRS and durations can produce 47% divergence in acceleration responses and 37% variations in lateral force responses. Li et al. [36] investigated the damage sustained by structural components under severe shock environments and identified two critical damage states based on the SRS. According to Zhang et al. [37], these criteria were subsequently validated experimentally. Building upon this work, Hou et al. [38,39] further refined the damage boundary and extended the excitation signals to generalized shock loads. Yang and Li [40] analyzed the response of cantilever beam structures under different time-domain waveform shock loads and revealed that dual damage criteria can serve as the shock damage failure boundary for structures. Dang et al. [41] proposed a method for determining the shock fatigue damage failure boundary of BGA solder joints based on SRS, considering both fatigue cumulative damage criteria and the statistical characteristics of shock fatigue life. These studies collectively demonstrate the effectiveness and viability of the SRS as a failure boundary for shock-induced damage. Similarly, Yan and Li [42] observed that shock signals with closely aligned SRS curves may lead to variations of up to 50% in the maximum acceleration responses of equipment. To address this, they proposed a dual-spectrum method that combines the SRS with the Shock Severity Infimum (SSI) to more tightly bound the severity range of shock excitations. However, that study focused on conceptual formulation and feasibility validation using a limited number of example signals, without quantifying whether the dual-spectrum (SRS-SSI) criteria statistically improved test equivalence. Alexander [43] provided experimental evidence that sequences matching a single SRS curve can lead to substantial discrepancies in MDOF model responses, especially for complex devices with rich mid-to-high natural frequencies. A critical limitation across these investigations is their reliance on limited shock signal datasets, which may not capture the inherent stochastic nature and variability of real-world shock environments.
Test equivalence refers to the consistency in structural damage potential between the simulated test and the actual pyroshock environment. Achieving it requires equivalent shock excitation and consistent structural response. To better replicate the actual shock environment, this study proposes an integrated methodology to statistically estimate structural responses. The process begins with generating a large dataset using a signal synthesis algorithm. These signals are then screened using a ResNet50 model [44], which is trained to identify standard-conforming shock signals based on physical waveform characteristics (e.g., damped sinusoid). Subsets are further extracted based on temporal features and SSI criteria, respectively. Finally, the selected signals are used as inputs for FEM simulations to compute structural responses and perform statistical analysis to validate the effectiveness of the proposed dual-spectrum method. This study presents the first quantitative evaluation of the reduction in response dispersion achieved by the dual-spectrum criteria across various structural configurations. The contribution of this work resides in its engineering validation and statistical quantification, thereby extending the SSI methodology from theoretical formulation to practical application.
2. Methods
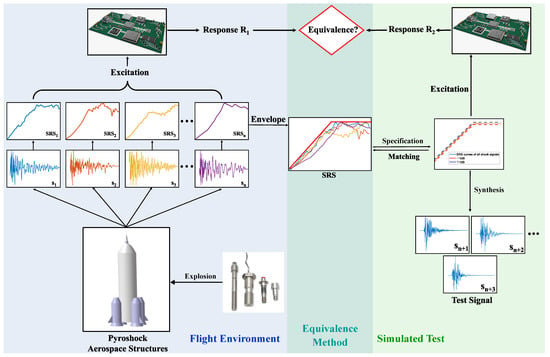
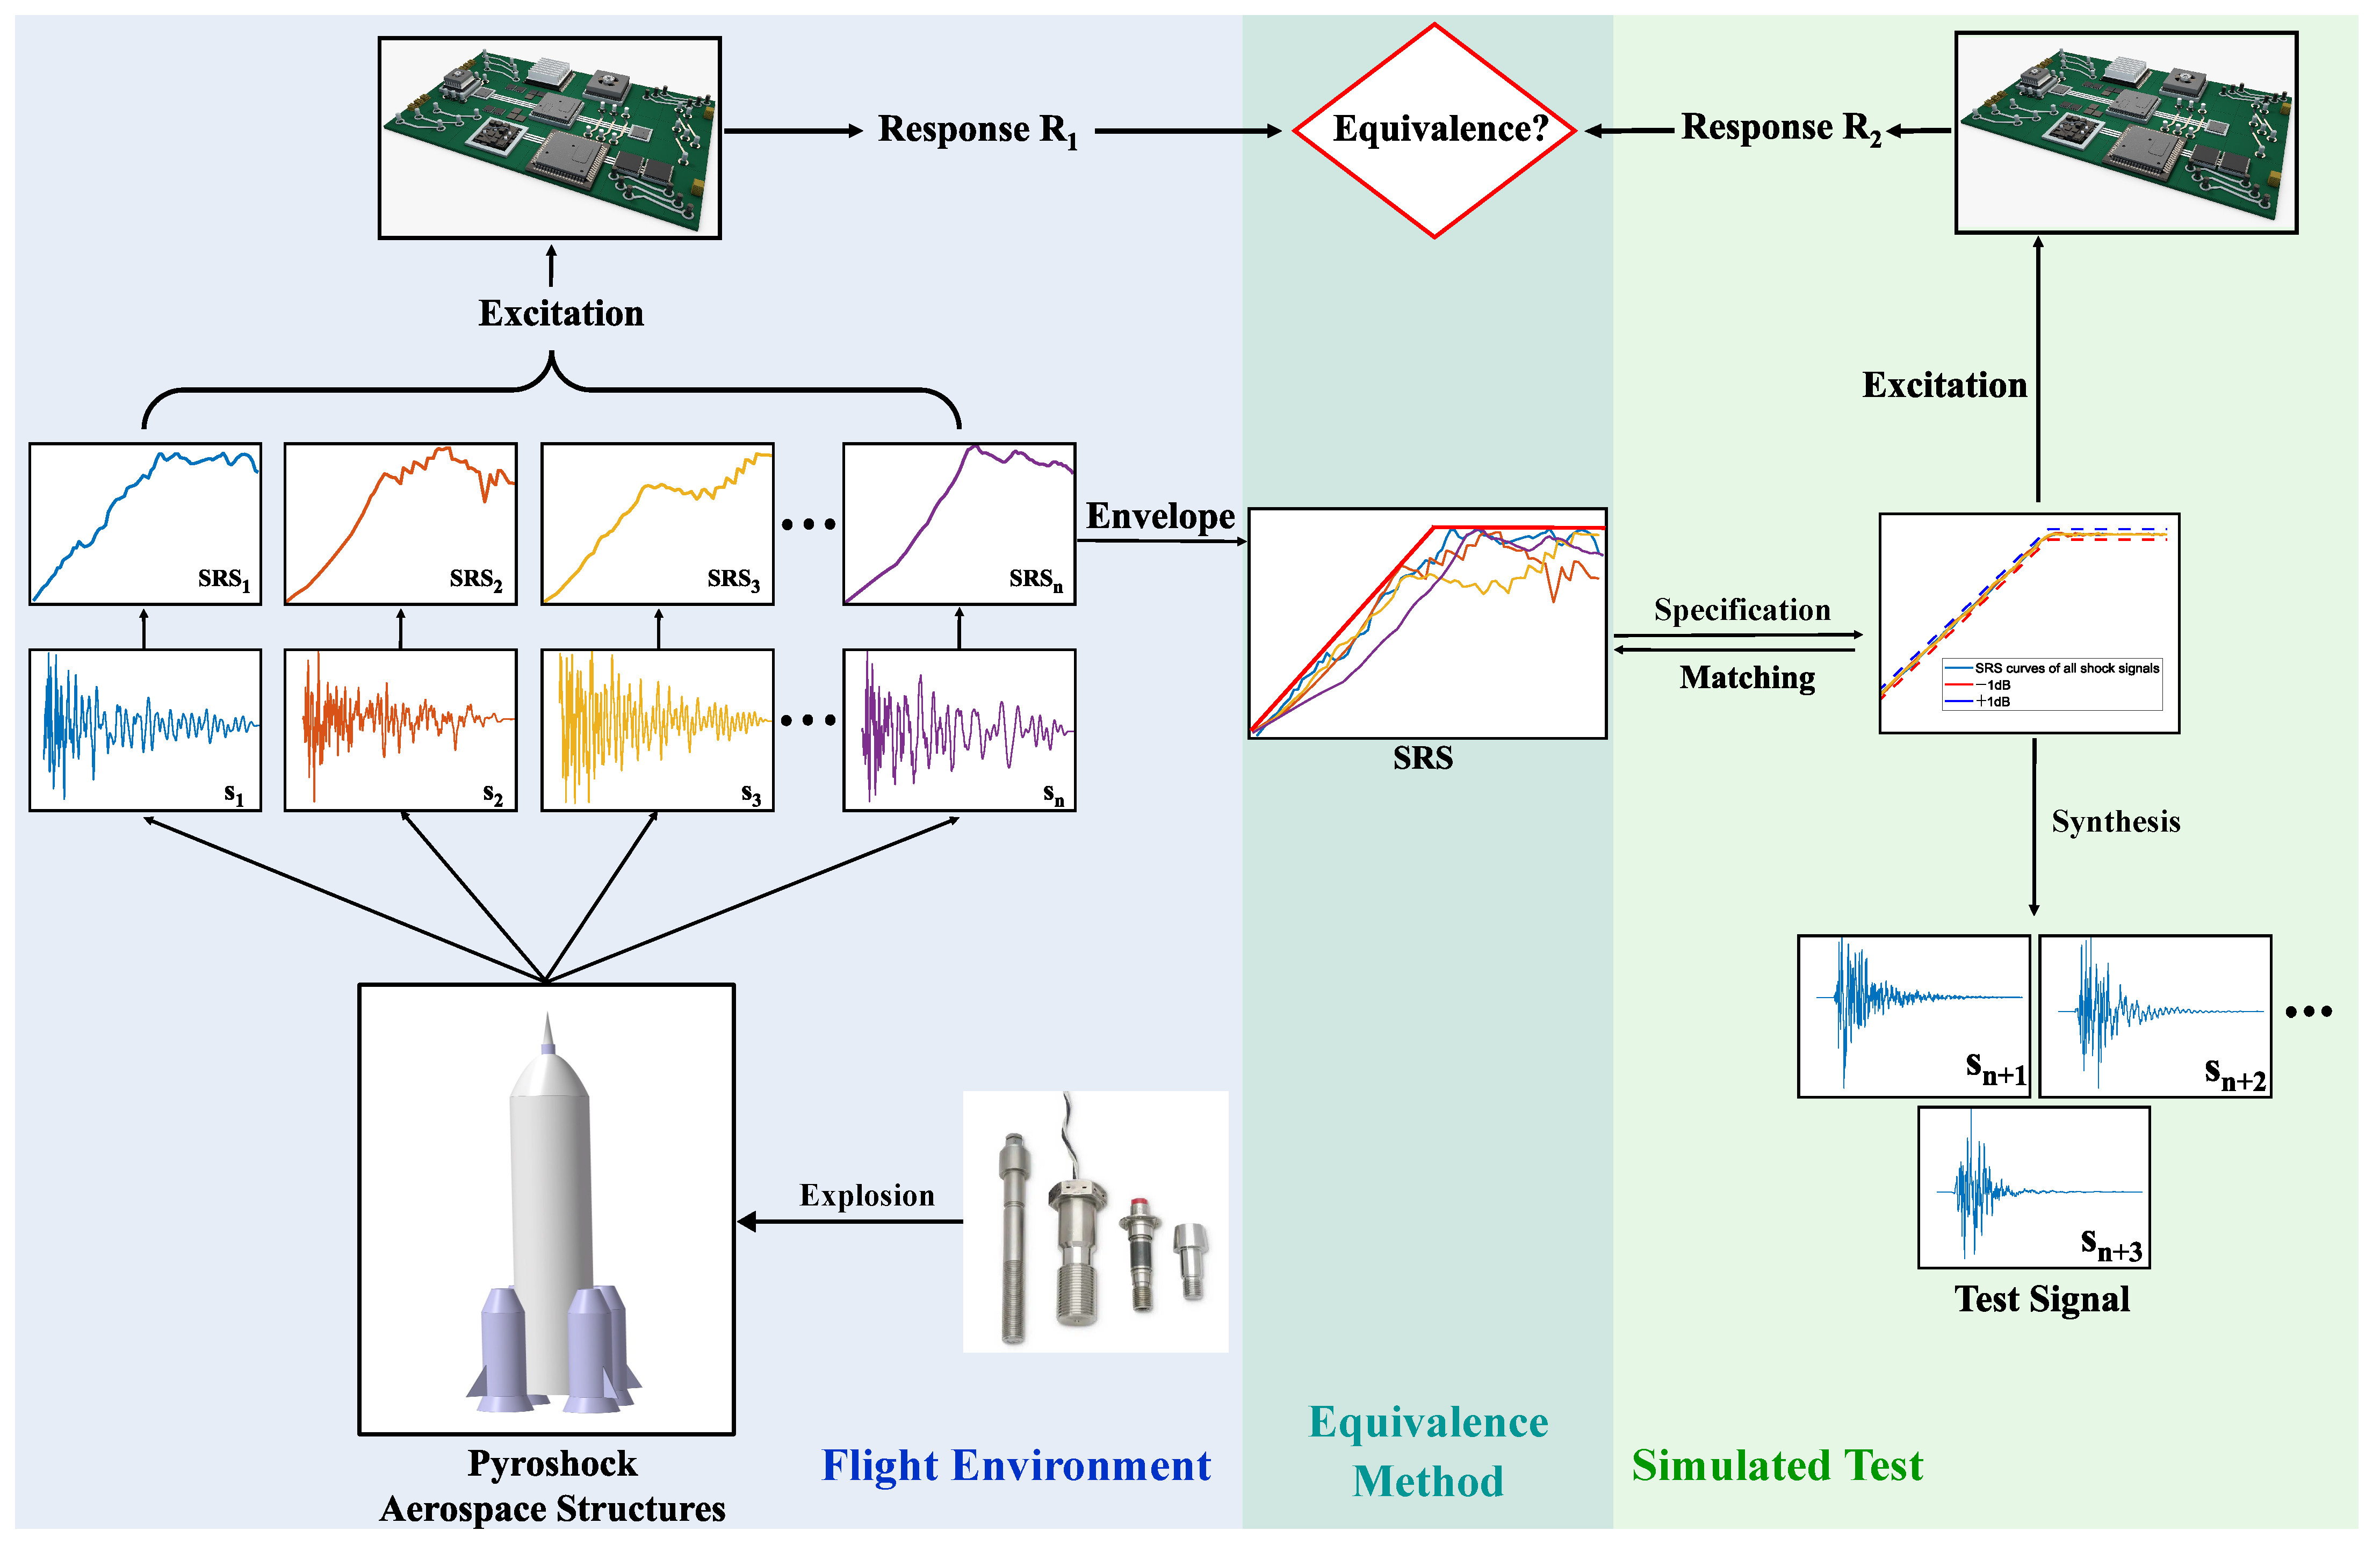
Test equivalence ensures that a laboratory or simulated test accurately reproduces the damage potential of the actual shock environment. The conceptual framework for shock environment testing in aerospace engineering is illustrated in Figure 1. As depicted, the actual shock environment, such as that during a rocket launch, is characterized by a set of measured signals. These signals produce a distribution of actual component responses, reflecting inherent environmental variability. The envelope of the SRS from these signals is typically used as the target specification for equivalent ground tests. In practice, ground tests are performed using equipment such as shakers or resonant plates to generate a set of diverse time-domain shock signals that all conform to this target SRS. When these signals are used as inputs for device components, they produce a distribution of simulated structural responses. Test equivalence is achieved if the simulated component response is consistent with the actual component response. Overall, the central scientific question is whether matching the SRS, the current industry standard, is sufficient to guarantee consistent structural responses.
Figure 1.
Flowchart for test response equivalence analysis under pyroshock.
This section presents the methods for establishing test equivalence by analyzing how structures respond to different shock signals. Section 2.1 describes the generation of time-domain shock signals that match a given reference SRS using a shock-waveform superposition method. Section 2.2 proposes a shock signal screener via a transfer learning strategy using the ResNet50 deep learning architecture. Section 2.3 introduces the extraction of shock signal subsets based on both temporal features and the SSI spectrum criteria. Finally, Section 2.4 introduces the FEM model setup of the shock response analysis problem. The principal symbols employed in this study, along with their descriptions, are presented in Table 1.
Table 1.
List of symbols and descriptions.
2.1. Synthesis of Shock Signals Using the Shock-Waveform Superposition Algorithm
To synthesize shock signals, this study adopts a damped sinusoidal basis function with an asymmetric envelope. The selection of this basis complies with the official SRS synthesis criteria specified in NASA-STD-7003A and MIL-STD-810H. Yan and Li [28] further confirm that its asymmetric envelope is tailored to characterize the morphological evolution of pyroshock signals, which transition from exponentially decaying waveforms in the near field to asymmetric profiles in the mid and far fields. This basis function efficiently captures the inherent asymmetry of pyroshock signals, enabling high-fidelity signal reconstruction in both the time domain and SRS with fewer parameters. The mathematical expression of the proposed shock-waveform basis function is given as follows:
where f is the frequency, is the damping ratio, and is the temporal position of the envelope peak (controlling the envelope asymmetry of basis functions). A shock signal s with K basis functions can be represented in the following form:
where and correspond to the amplitude and time shift of the kth basis function , respectively.
For the synthesis of shock signals, there is a parameter matrix to be determined:
Shock signal synthesis must satisfy the objective that its SRS approximates a given SRS specification (). Consequently, an objective optimization problem is formulated as follows:
where is the SRS calculation algorithm. This optimization problem can be solved by heuristic optimization algorithms, such as the particle swarm optimization algorithm.
2.2. Automated Screening of Synthesized Shock Signals via ResNet50 Model
To ensure comprehensive characterization of the shock environment, the expanded parameter space used in signal synthesis inevitably generates some distorted or non-standard signals. As a result, an efficient and automated screening approach is necessary to reliably identify standard-compliant shock signals from large-scale datasets.
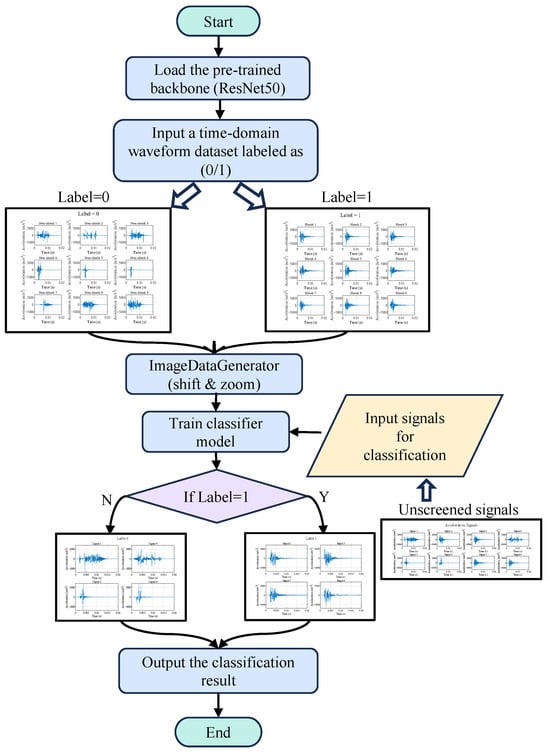
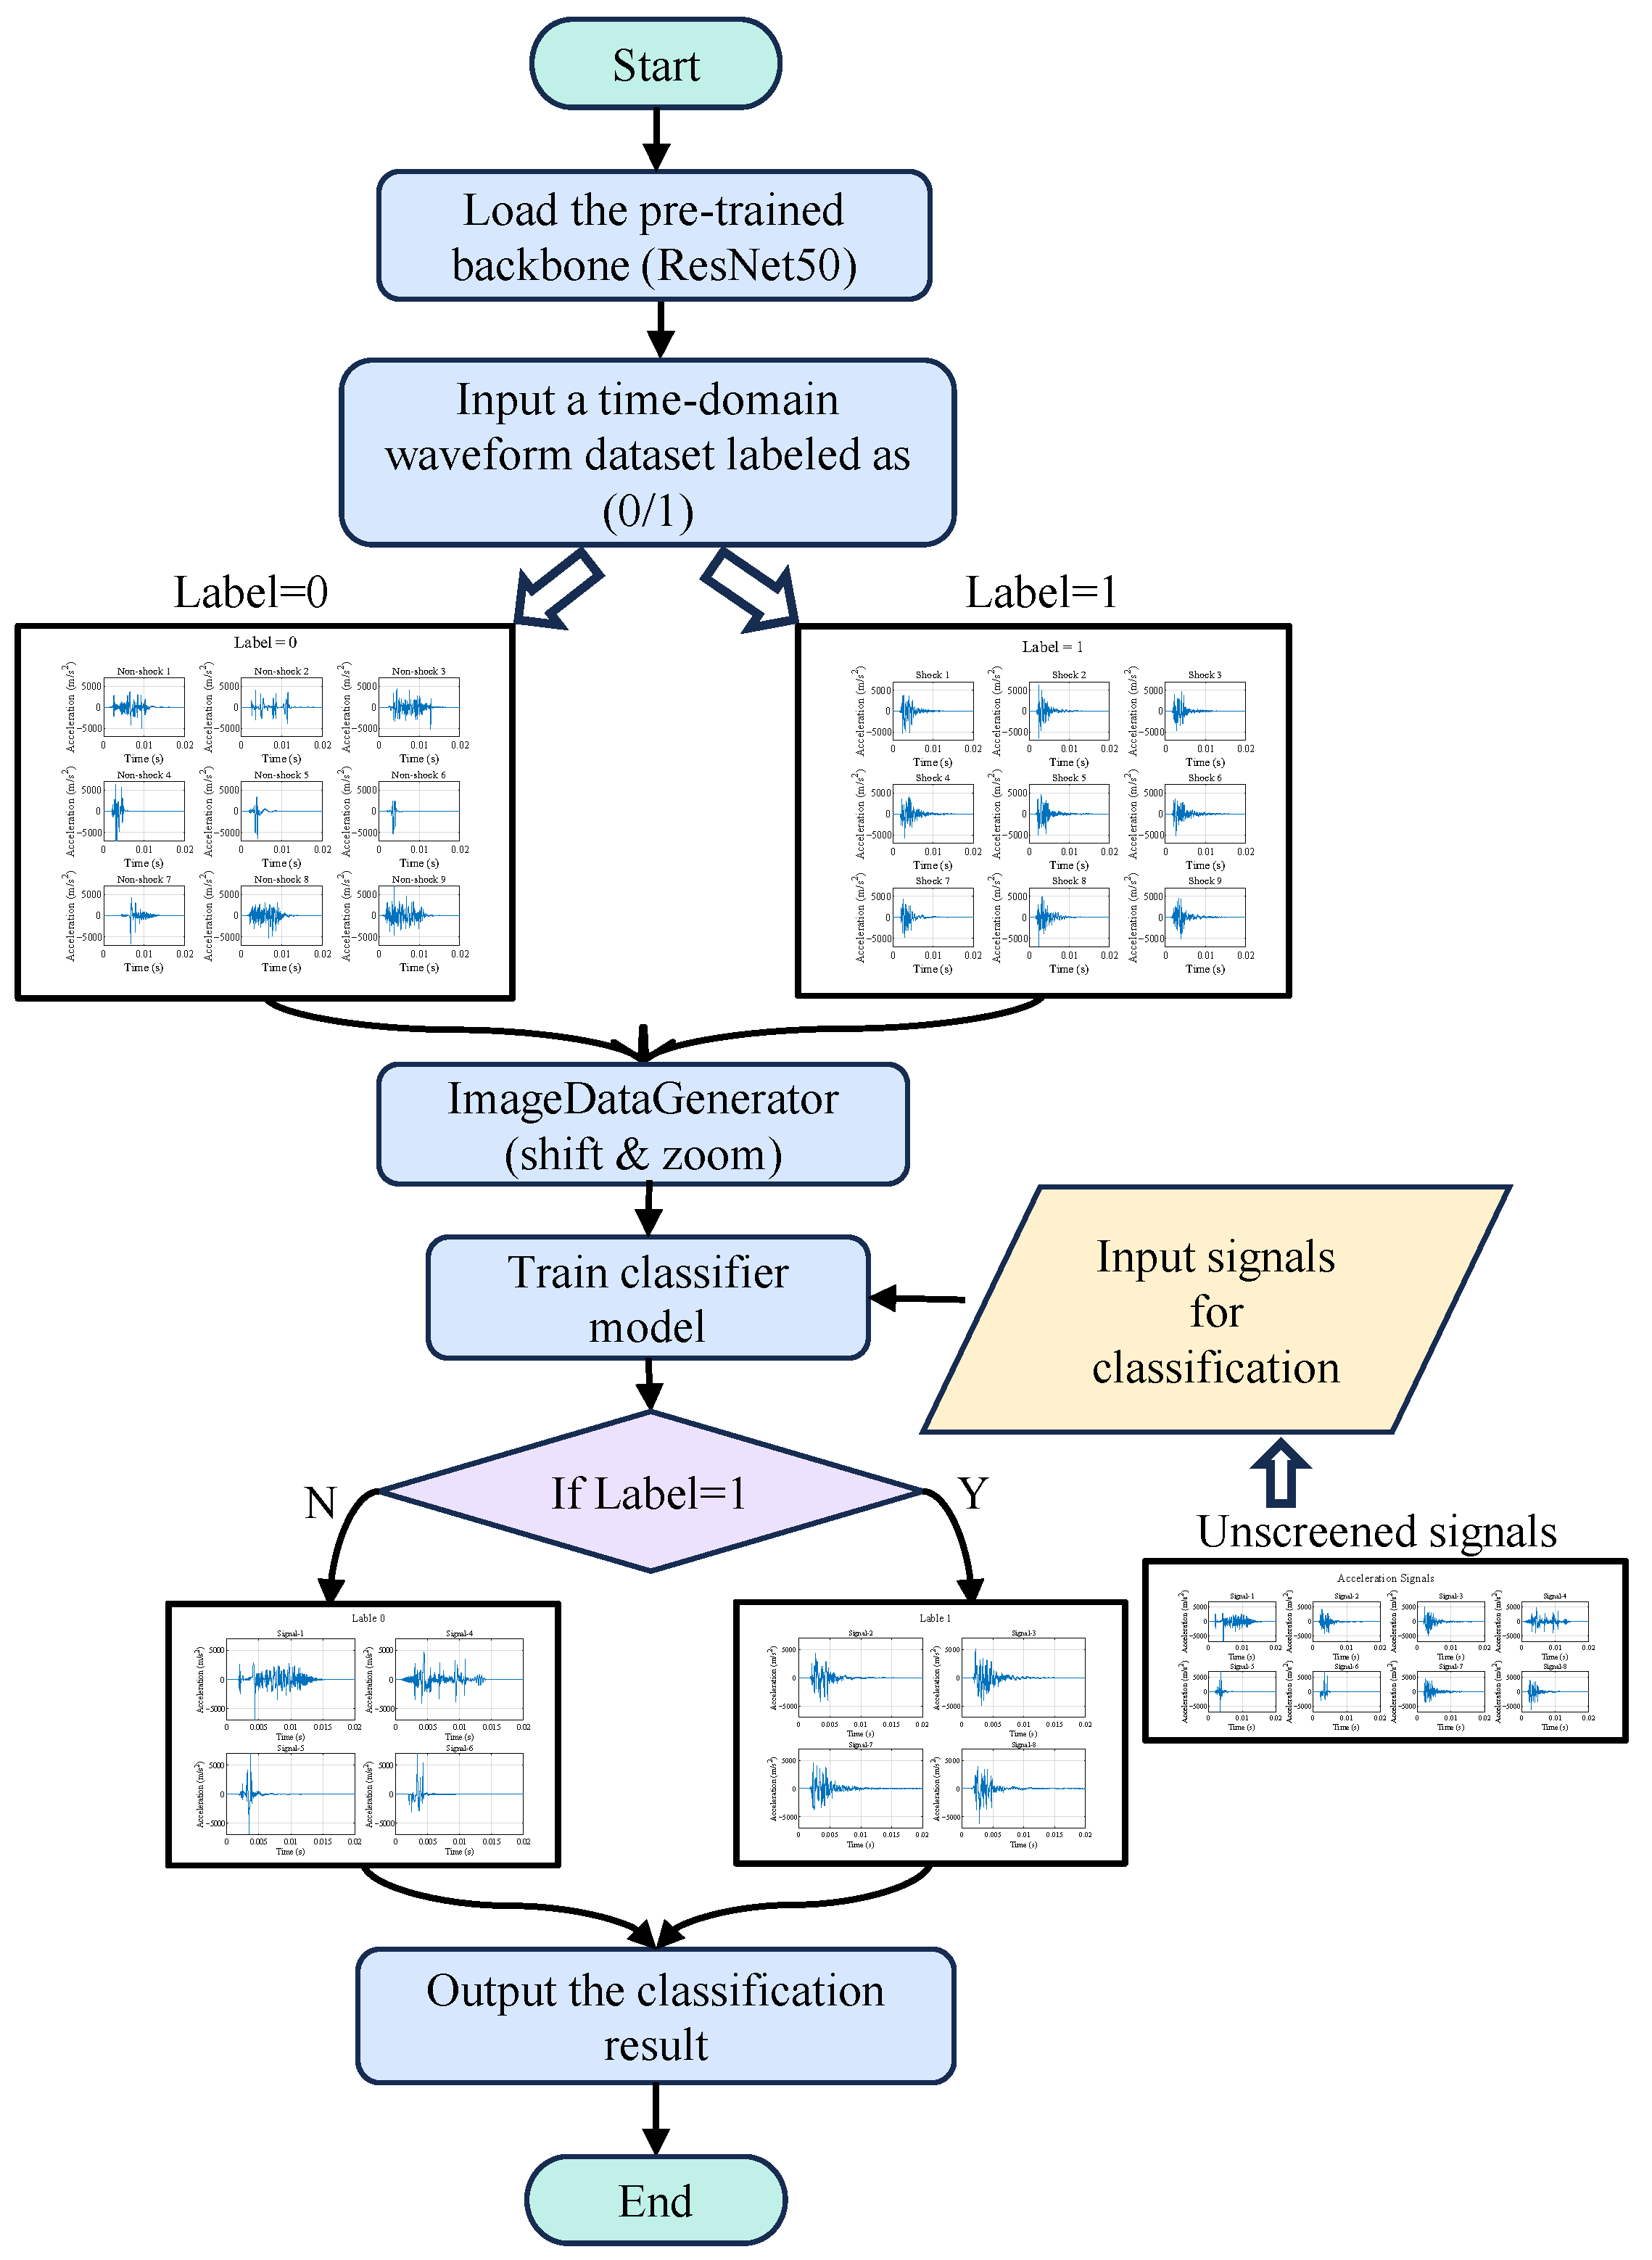
To efficiently and automatically screen large-scale synthesized shock signals, this study proposes a deep learning approach based on the ResNet50 architecture, with the overall workflow illustrated in Figure 2. First, the synthesized signals generated by Equation (2) are converted into image format, yielding a total of 2000 samples (1000 valid and 1000 invalid), and are then split into training and test sets at an 8:2 ratio. The labeling process is performed by a researcher with a background in shock dynamics, following three criteria: (1) the time-domain waveform should exhibit a single continuous transient oscillatory pattern with typical damped decaying oscillations in the tail, as opposed to constant-amplitude or divergent oscillations; (2) the primary energy of the signal should be concentrated in the first half of the shock event, consistent with the effective duration characteristics of pyroshock signals; and (3) the signal should not contain unphysical abrupt spikes or prolonged zero-amplitude segments. Signals satisfying all three criteria are labeled as valid (Label = 1); otherwise, they are labeled as invalid (Label = 0).
Figure 2.
Flowchart of the ResNet50-based workflow for screening time-domain shock-waveform signals.
The ResNet50 model pre-trained on ImageNet is adopted and adapted by adding fully connected layers and a Dropout layer, with a Sigmoid-activated output layer for binary classification [44]. To prevent overfitting, the following three strategies are employed: (1) data augmentation is performed using ImageDataGenerator [45], including random horizontal shifts (width shift range 0.05) and random zooming (zoom range 0.1), to enhance model generalization; (2) a Dropout layer with a rate of 0.5 is introduced after the fully connected layers; and (3) early stopping terminates training when the validation loss ceases to decrease for 10 consecutive epochs. The model is trained for 200 epochs using the Adam optimizer and binary cross-entropy loss. Model performance is evaluated on an independent test set of 400 samples. This framework enables rapid, high-throughput screening of standard-compliant shock signals from massive datasets, significantly improving the efficiency and reliability of the signal selection process.
A deep learning classifier is adopted because the synthesized signals, being superpositions of multiple basis functions, exhibit complex non-monotonic envelopes. Under such circumstances, traditional signal processing methods become unreliable and it is difficult to manually establish a unified set of criteria, which would likely result in the misclassification of a large number of physically valid pyroshock signals as invalid. The ResNet50 classifier circumvents these difficulties by learning discriminative features directly from the data, thereby providing an automated and consistent screening procedure.
2.3. Construction of Shock Signal Subsets Based on Different Criteria
The shock signals, generated in large quantities by Equation (2) and subsequently screened by the ResNet50 model, are collected into a universal set U,
where n denotes the number of shock signals obtained from the massive synthesis process. The set U represents shock signals that conform to the traditional SRS criterion. In this study, the universal set U of shock signals is partitioned into distinct subsets according to specific signal features. By analyzing and comparing the structural response distributions under excitations from different subsets, the influence of these features on test equivalence can be validated and quantified. This analysis thereby quantifies the accuracy of the criterion.
2.3.1. Shock Signal Subset Construction by Time-Domain Features
In most standards, effective duration and amplitude are normally recognized as the predominant factors influencing test equivalence in pyroshock environments. The effective duration would likely govern the loading period affecting structural resonance and cumulative damage processes, while the amplitude might correlate with instantaneous stress magnitude that could trigger localized failures. Accordingly, the study extracts a subset of shock signals with similar effective duration and amplitude, analyzing the influence of temporal features on structural response variations.
To quantify the effective durations of the signal, the moving Root Mean Square (RMS) method is employed, with the specific computational methodology detailed below:
where is the RMS value of the signal within a sliding window of length centered at time t. The effective duration T is extracted by
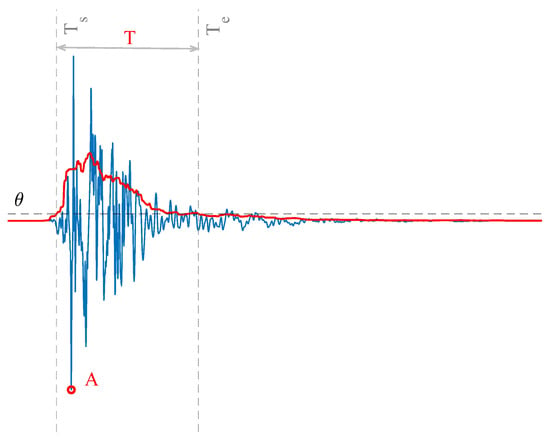
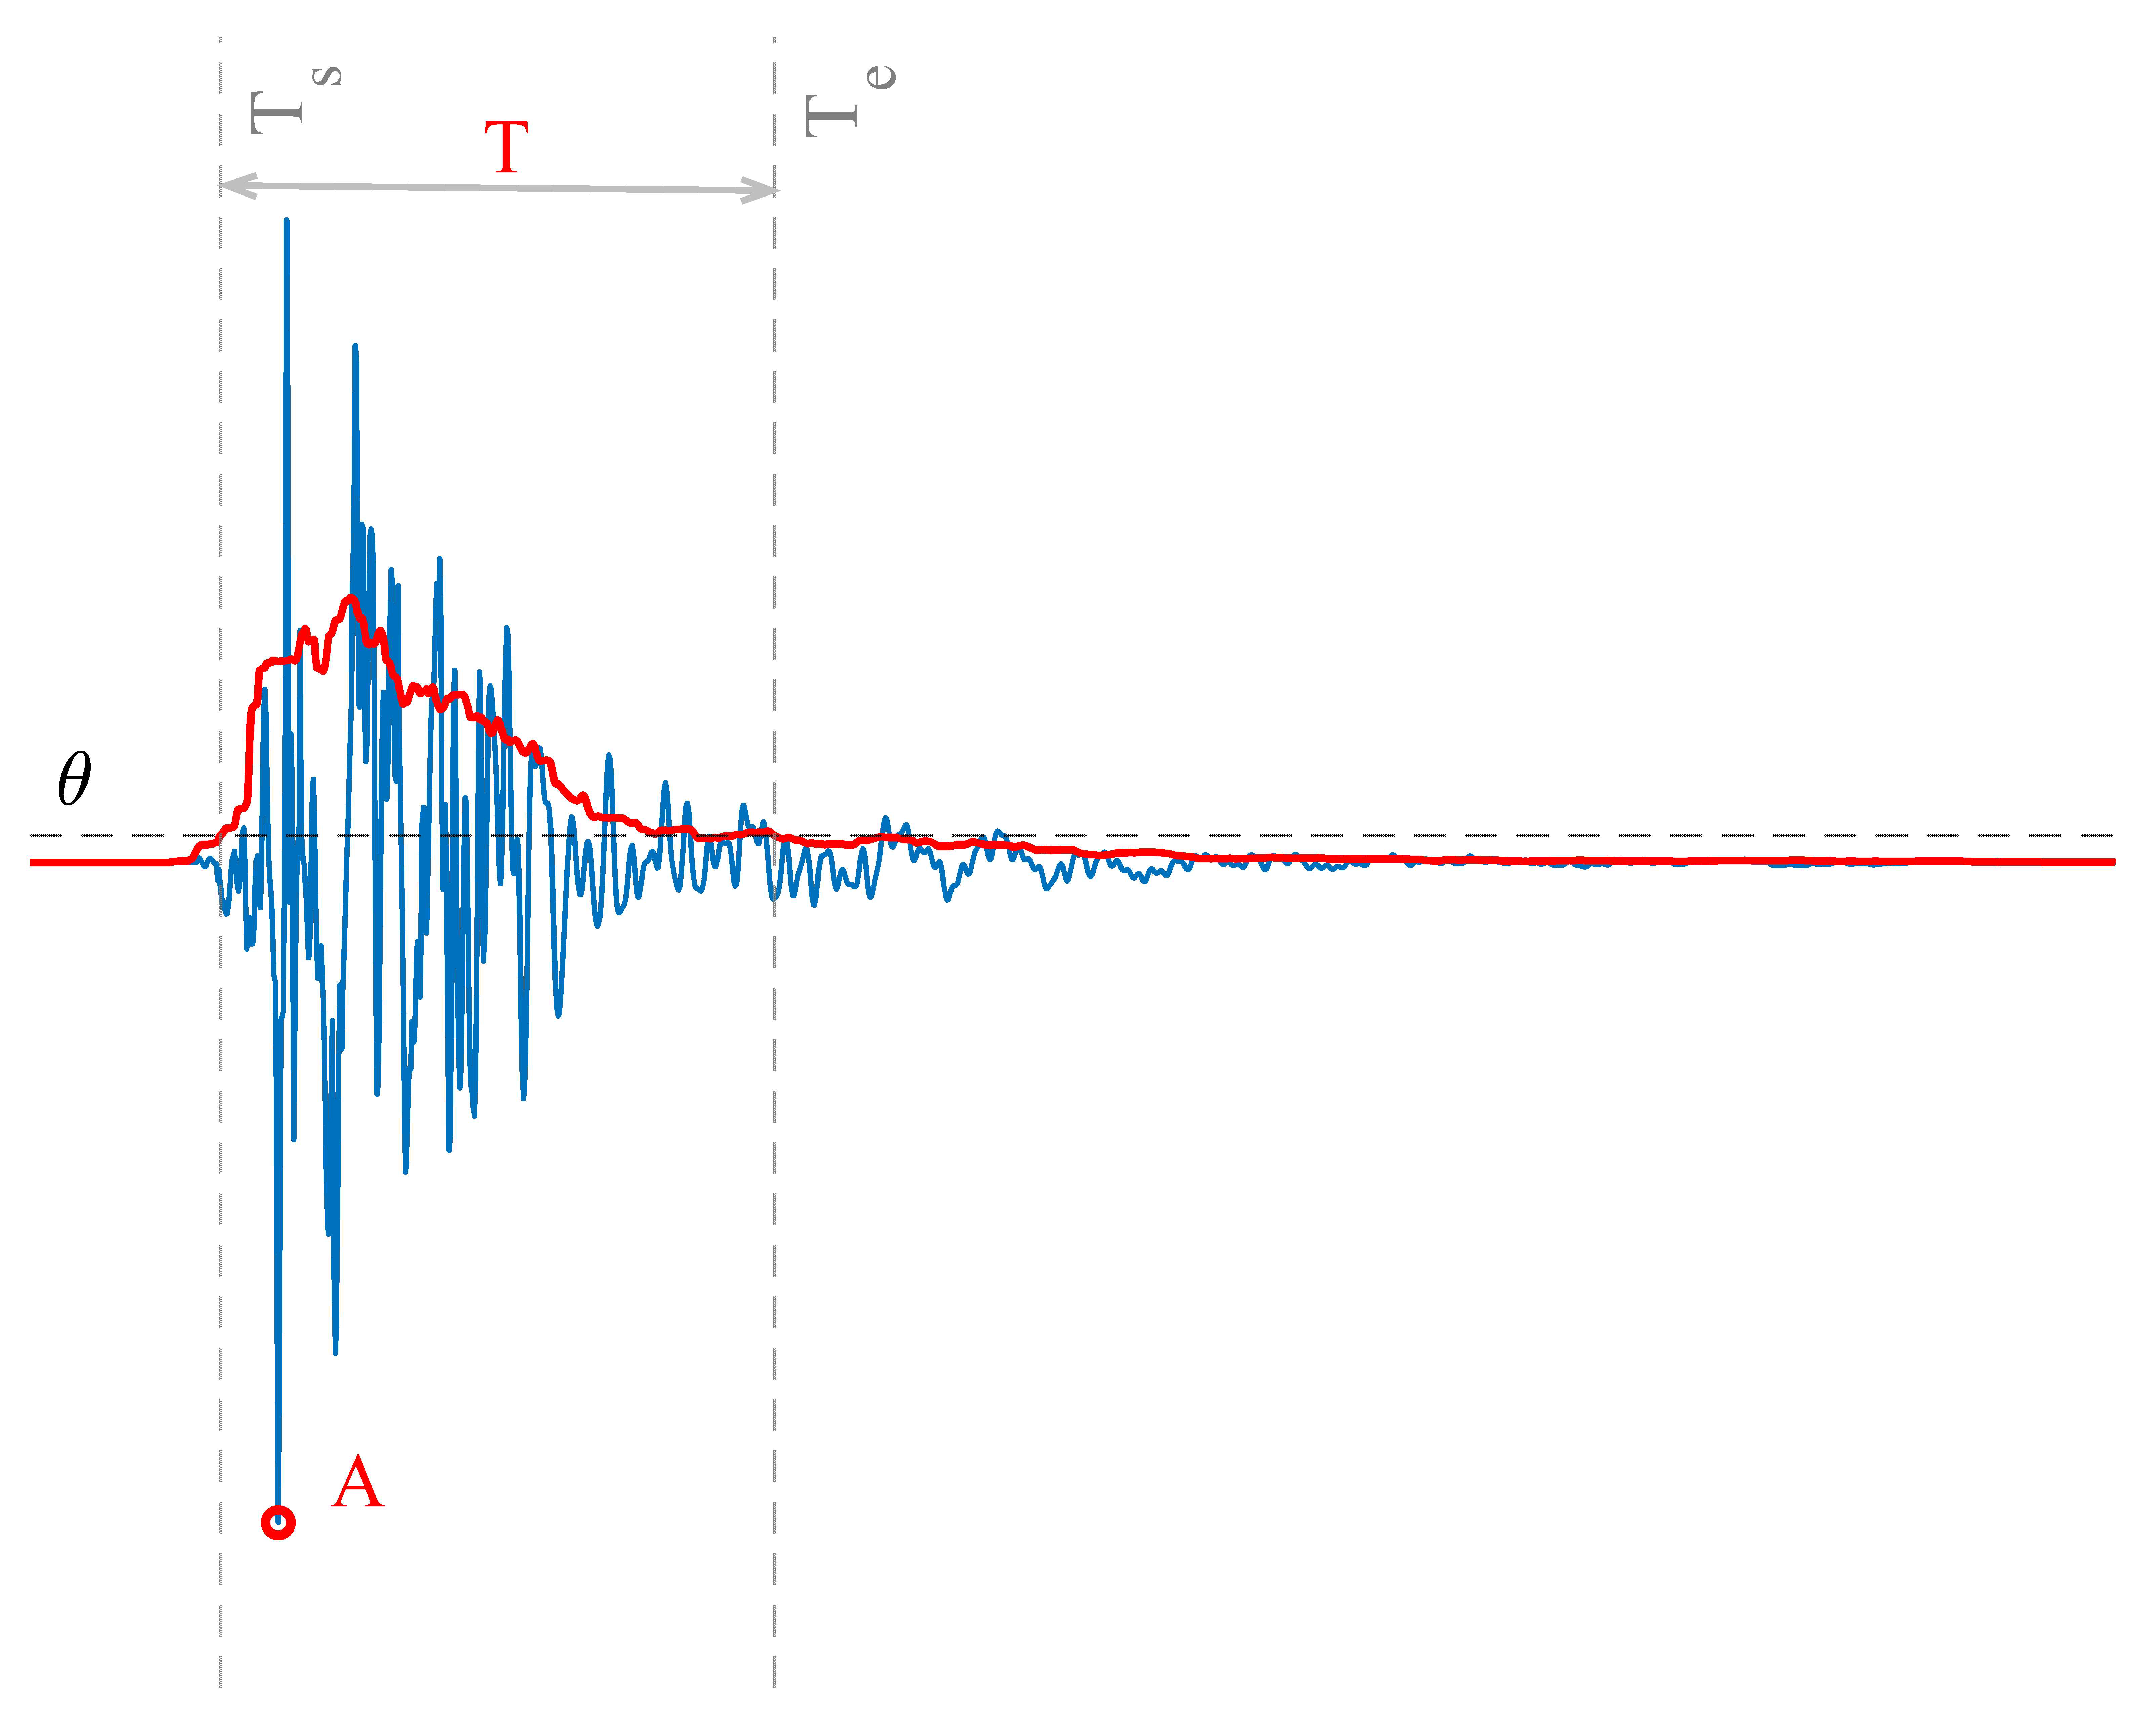
where is the threshold value; the 10% threshold follows the standard practice documented in MIL-STD-810H and NASA-STD-7003A for defining effective shock duration. is the first time instance when exceeds the threshold, is the last time instance when exceeds the threshold, and T corresponds to the effective duration of the shock signal. The sampling frequency for all shock signals in this study is uniformly set at 100 kHz. The amplitude A is simply extracted by
A schematic illustration of the extracted temporal features is shown in Figure 3. In this figure, the red curve represents the moving RMS , and the horizontal dashed line indicates the threshold .
Figure 3.
Illustration of temporal features of shock signals.
A subset of shock signals sharing similar temporal features is constructed. Given a reference effective duration and a reference amplitude , the subset S is constructed as the set of shock signals whose effective duration and amplitude both fall within the specified errors of reference and ,
where e is the allowable relative error for effective duration and amplitude. The subset S represents shock signals that conform to the criteria of both SRS and temporal features.
2.3.2. Shock Signal Subset Construction by SSI Features
A subset of signals with similar SSIs is extracted to analyze the impact of the dual-spectrum metric on structural response variability. When a shock is applied to a Single-Degree-of-Freedom (SDOF) model as base excitation, the acceleration responses of the SDOF oscillator can be calculated via Duhamel’s integral:
where m is the mass, is the natural frequency, is the damping ratio, and is the damped natural frequency.
The response matrix is constructed by calculating the acceleration amplitude responses of G time instances and H natural frequencies of SDOF oscillators:
The matrix exhibits time–frequency features. The rows and columns of represent the time variables and natural frequencies, respectively. Singular Value Decomposition (SVD) is employed to extract frequency features from matrix . The SVD method decomposes the matrix into the superposition of many rank-one matrices,
where represent temporal features, while the right singular vectors represent frequency-domain features. The singular values quantify the contribution of each mode. The SSI is the first singular vector corresponding to the largest singular value,
relative to the infimum of the structural shock response. The specific solution method and theoretical derivation of the SSI are described in reference [42].
A signal subset with similar SSI curves is also constructed. Given the reference , the overall amplitude deviation (in dB) between the SSI curves of the synthesized shocks and the reference SSI curve across the entire frequency range is calculated as
The average deviation is calculated between the SSI curves of the synthesized shocks and the reference curve, where is the SSI calculation algorithm. Shock signals whose SSI values are within the relative error are selected to form the subset M, which can be expressed as
where is the allowable error of the . The subset M represents shock signals that conform to the dual-spectrum (SRS-SSI) criteria.
2.4. Batch Finite Element Modeling and Response Analysis
This study employs numerical simulation methods, simplifying the device component into a plate structure to analyze its shock response. The simplification to plate structures is justified by standard practice in shock engineering, as key components in aerospace structures—such as PCBs, equipment mounting plates, and solar panel substrates—can be reasonably idealized as plate structures for shock analysis. In a laboratory setting, such a scenario would correspond to mounting the test structure on a resonant plate and driving it with a shaker to generate a set of shock signals with identical SRS. These signals would then be applied to the four corner points at the bottom surface of the test structure. Simulations are conducted using the LiveLink module in COMSOL Multiphysics 6.2. A corresponding FEM is established where each shock signal from the aforementioned set is applied as a load input, facilitating extensive numerical computations. This process enables the systematic analysis of the structural response to various shock inputs. This study employs the peak von Mises stress at the measurement points to estimate the influence of the shock environment on the structure. The adoption of peak response as the primary metric is dictated by the intrinsic nature of pyroshock loads. Pyroshock events are characteristically distinguished by extremely high acceleration amplitudes—typically exceeding 10,000 g—with durations on the order of milliseconds. Under such extreme transient loading, failures are governed by a single overload event: once the response peak exceeds the material strength limit, failure ensues (e.g., brittle fracture, relay malfunction, or crystal oscillator stoppage). Peak response therefore serves as the most direct and physically meaningful indicator of damage potential. This choice is also consistent with the MIL-STD-810H standard, which designates peak response as the primary variable for characterizing shock effects. The resulting response dataset for all measurement points is denoted as Q:
where is the peak von Mises stress response at the measurement point obtained from the FEM under shock excitation.
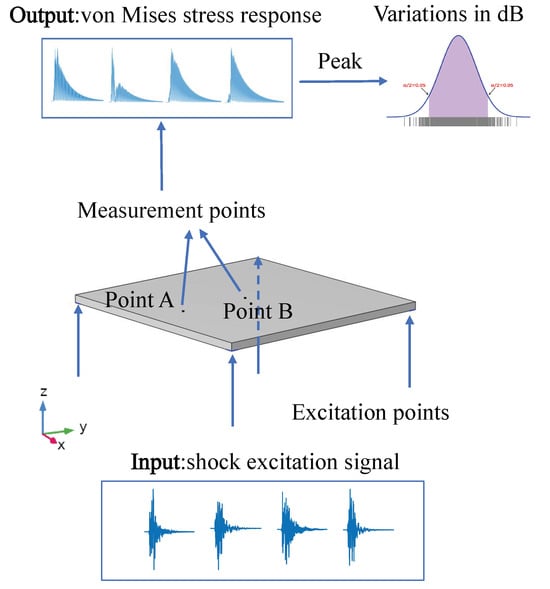
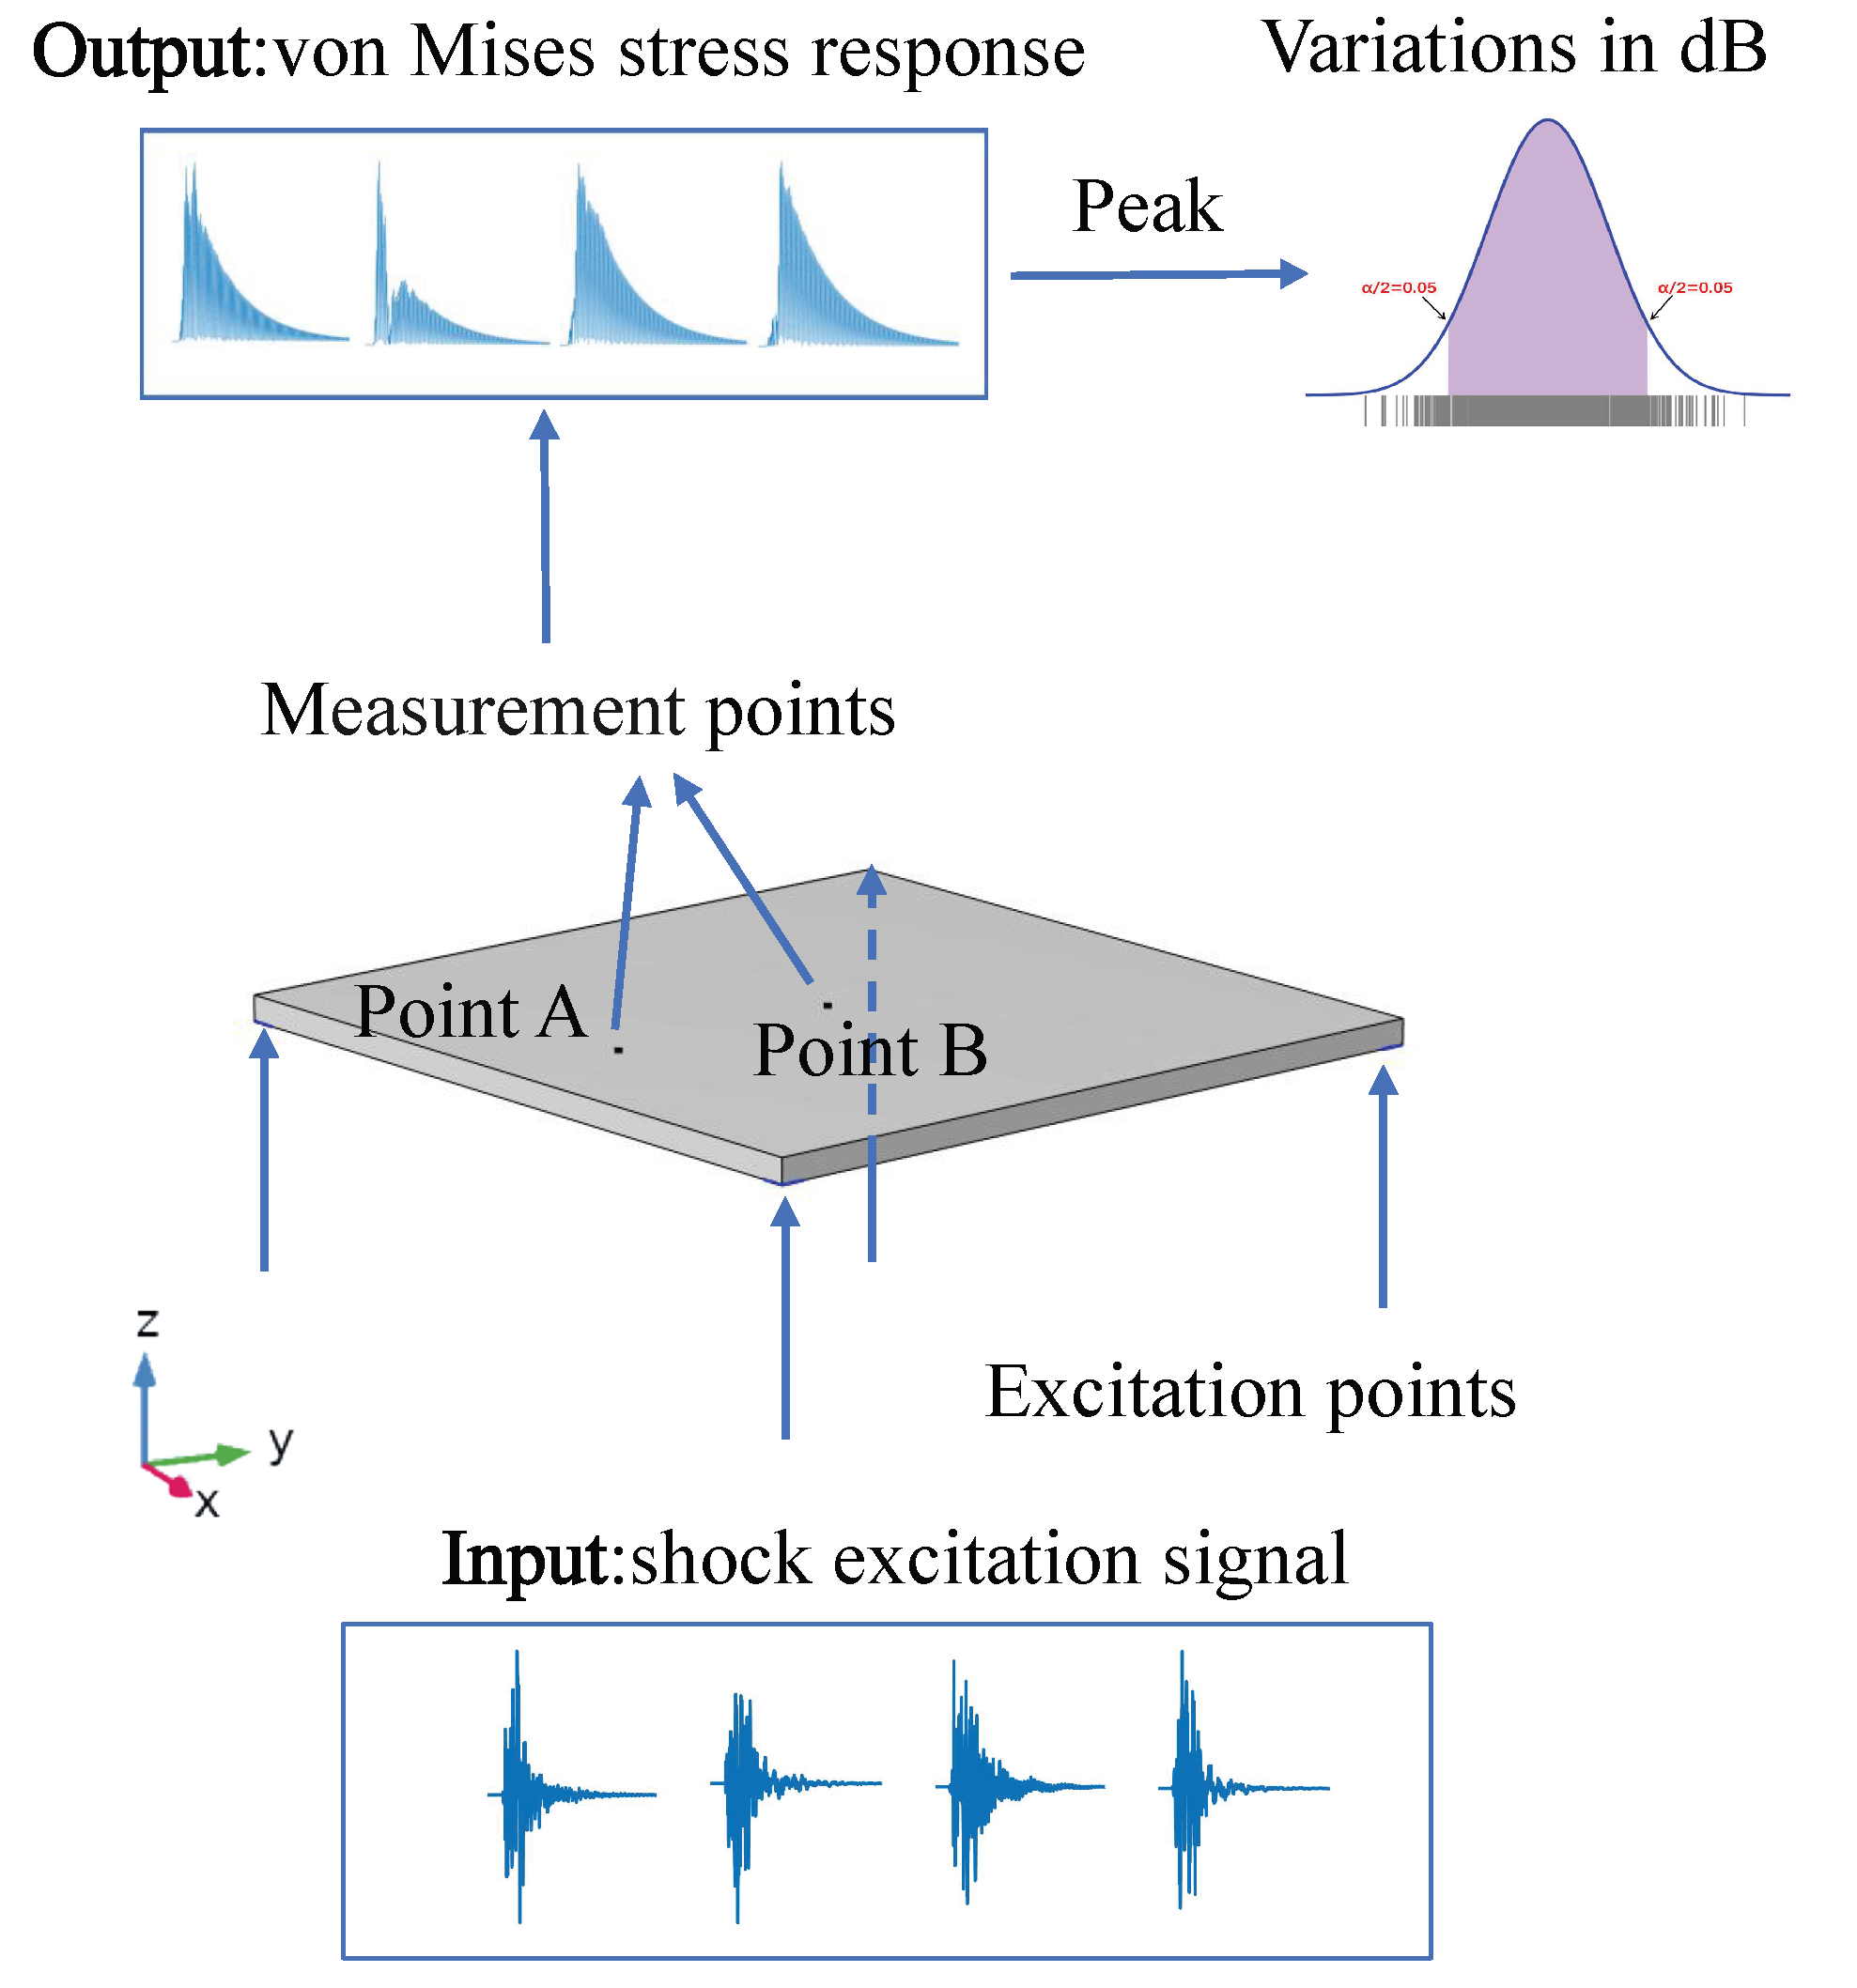
Structural responses are simulated with a linear elastic transient model employing Rayleigh damping. The modal damping ratio is set to 0.05 at 100 Hz and 10,000 Hz, resulting in Rayleigh parameters and . Two measurement points are positioned at both the edge and the center of the surface of the plate. Figure 4 presents the schematic workflow for quantifying the distribution of structural responses. The transient analysis employs a time step of 0.01 ms, matching the 100 kHz sampling rate of the excitation signal. The total duration for all input shock signals is 20 ms, and the total simulation time is 40 ms. A mesh size of 2 mm is adopted for model discretization to ensure both computational efficiency and result reliability. The proposed method enables efficient synthesis and rapid screening of shock signals, with batch finite element simulations constituting the primary computational bottleneck. Each transient analysis typically requires several minutes. Overall, the total computational cost remains within an acceptable range for engineering practice, thereby demonstrating the method’s considerable industrial applicability.
Figure 4.
Schematic flowchart of batch FEM modeling and structural response analysis.
Based on the characteristics of the simulated responses, the peak von Mises stress at each measurement point is characterized using a normal distribution. Consequently, the probability density function (PDF) for each point takes the following form:
where and are the mean and standard deviation, respectively, of the response at each measurement point.
The robustness of the test equivalence criteria is quantified by the dispersion of the structural response. Because damage is directly correlated with peak von Mises stress, a robust design must produce tightly distributed peak von Mises stress values under shock environments of identical severity. A smaller standard deviation in the simulated response indicates better equivalence of the test environment and a lower risk of under-testing. This reduces the discrepancy between and the actual response , thereby enhancing the consistency of the responses. Accordingly, the dispersion of the peak von Mises stress distribution serves as an effective indicator for estimating the quality of test equivalence criteria.
In this study, the quantitative metric for the dispersion degree of response is defined as the 90% probability interval (encompassing the central 90% of the response peak data) of the PDF following outlier removal. Accordingly, by comparing the widths of this interval under different excitations, the dispersion degree of structural responses can be quantified. A narrower interval width corresponds to a smaller standard deviation, reflecting a more concentrated distribution of simulated response values. This validates that the criterion employed enables the test to achieve better equivalence.
To align with the log-log coordinate characteristics of the SRS, the dispersion level L is calculated to characterize the variations of response on a decibel scale:
where and are the lower and upper bound of the 90% probability interval for the response dispersion. The dispersion level L quantifies the degree of dispersion in the structural response under the shock environment, providing precise data support for estimating the effects of shock environments on structures.
In the analysis of response dispersion across different subsets, small amounts of sample data may sometimes violate the assumption of normality. To verify the normality assumption underlying the 90% probability interval estimation, the Lilliefors test is employed in this study to examine the response data. For those data subsets that do not pass the normality test (p < 0.05), the Box–Cox transformation is applied as a preprocessing step [46]. After transformation, the data are confirmed to be approximately normally distributed by the Lilliefors test (p > 0.05), thereby further improving the reasonableness of the interval estimation.
where is the power transformation parameter and y refers to the transformed variable. When = 0, this operation degenerates to logarithmic transformation. The Box–Cox transformation, via its nonlinear mapping, can reconstruct skewed distributed data into an approximately normal distribution.
As the transformed data y follows a normal distribution, its 90% probability interval ( and ) can be easily calculated. This normality-based interval is back-transformed to the original data scale,
Thus, the boundary values of the 90% probability interval and then the dispersion level L for the original response data can be obtained. By analyzing the dispersion levels of structural responses across different subsets, the influence of various shock signal features on test equivalence can be effectively estimated. It should be noted that the dispersion metric L (Equation (18)) is defined as the difference between the boundary values of the 90% probability interval, which depends solely on the 5% and 95% quantiles of the distribution and is therefore insensitive to mild departures in the tails of the distribution.
3. Results
This section demonstrates the result of shock signal synthesis and screening, the structural response, and the impact of signal features on response distribution. In Section 3.1, a large dataset of time-domain shock signals is synthesized based on the superposition of shock waveforms. Section 3.2 presents the signal screening results based on the ResNet50 deep learning model. This study analyzes the structural response distribution under 1000 synthesized shock signals with similar SRS. Section 3.3 shows shock signal subsets that conform to different criteria. Section 3.4 employs the COMSOL Multiphysics 6.2 transient solver to statistically estimate the damage potential of the shock environment on structures.
3.1. Results of Signal Synthesis via Shock-Waveform Superposition
The selection of the basis function parameter space range is crucial for the characterization of the shock environment. To achieve comprehensive characterization, this study adopts the expanded parameter space boundaries specified in Table 2, while non-physical signals generated at extreme parameters are subsequently removed by the ResNet50 screening step. Parameters of shock waveforms are obtained by the particle swarm optimization algorithm within these bounds.
Table 2.
Parameter boundaries for shock signal synthesis.
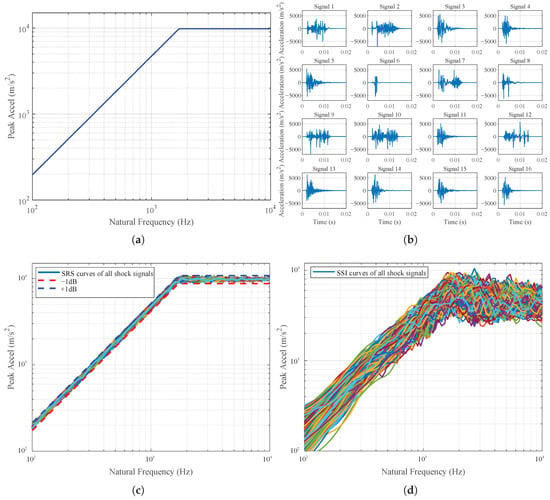
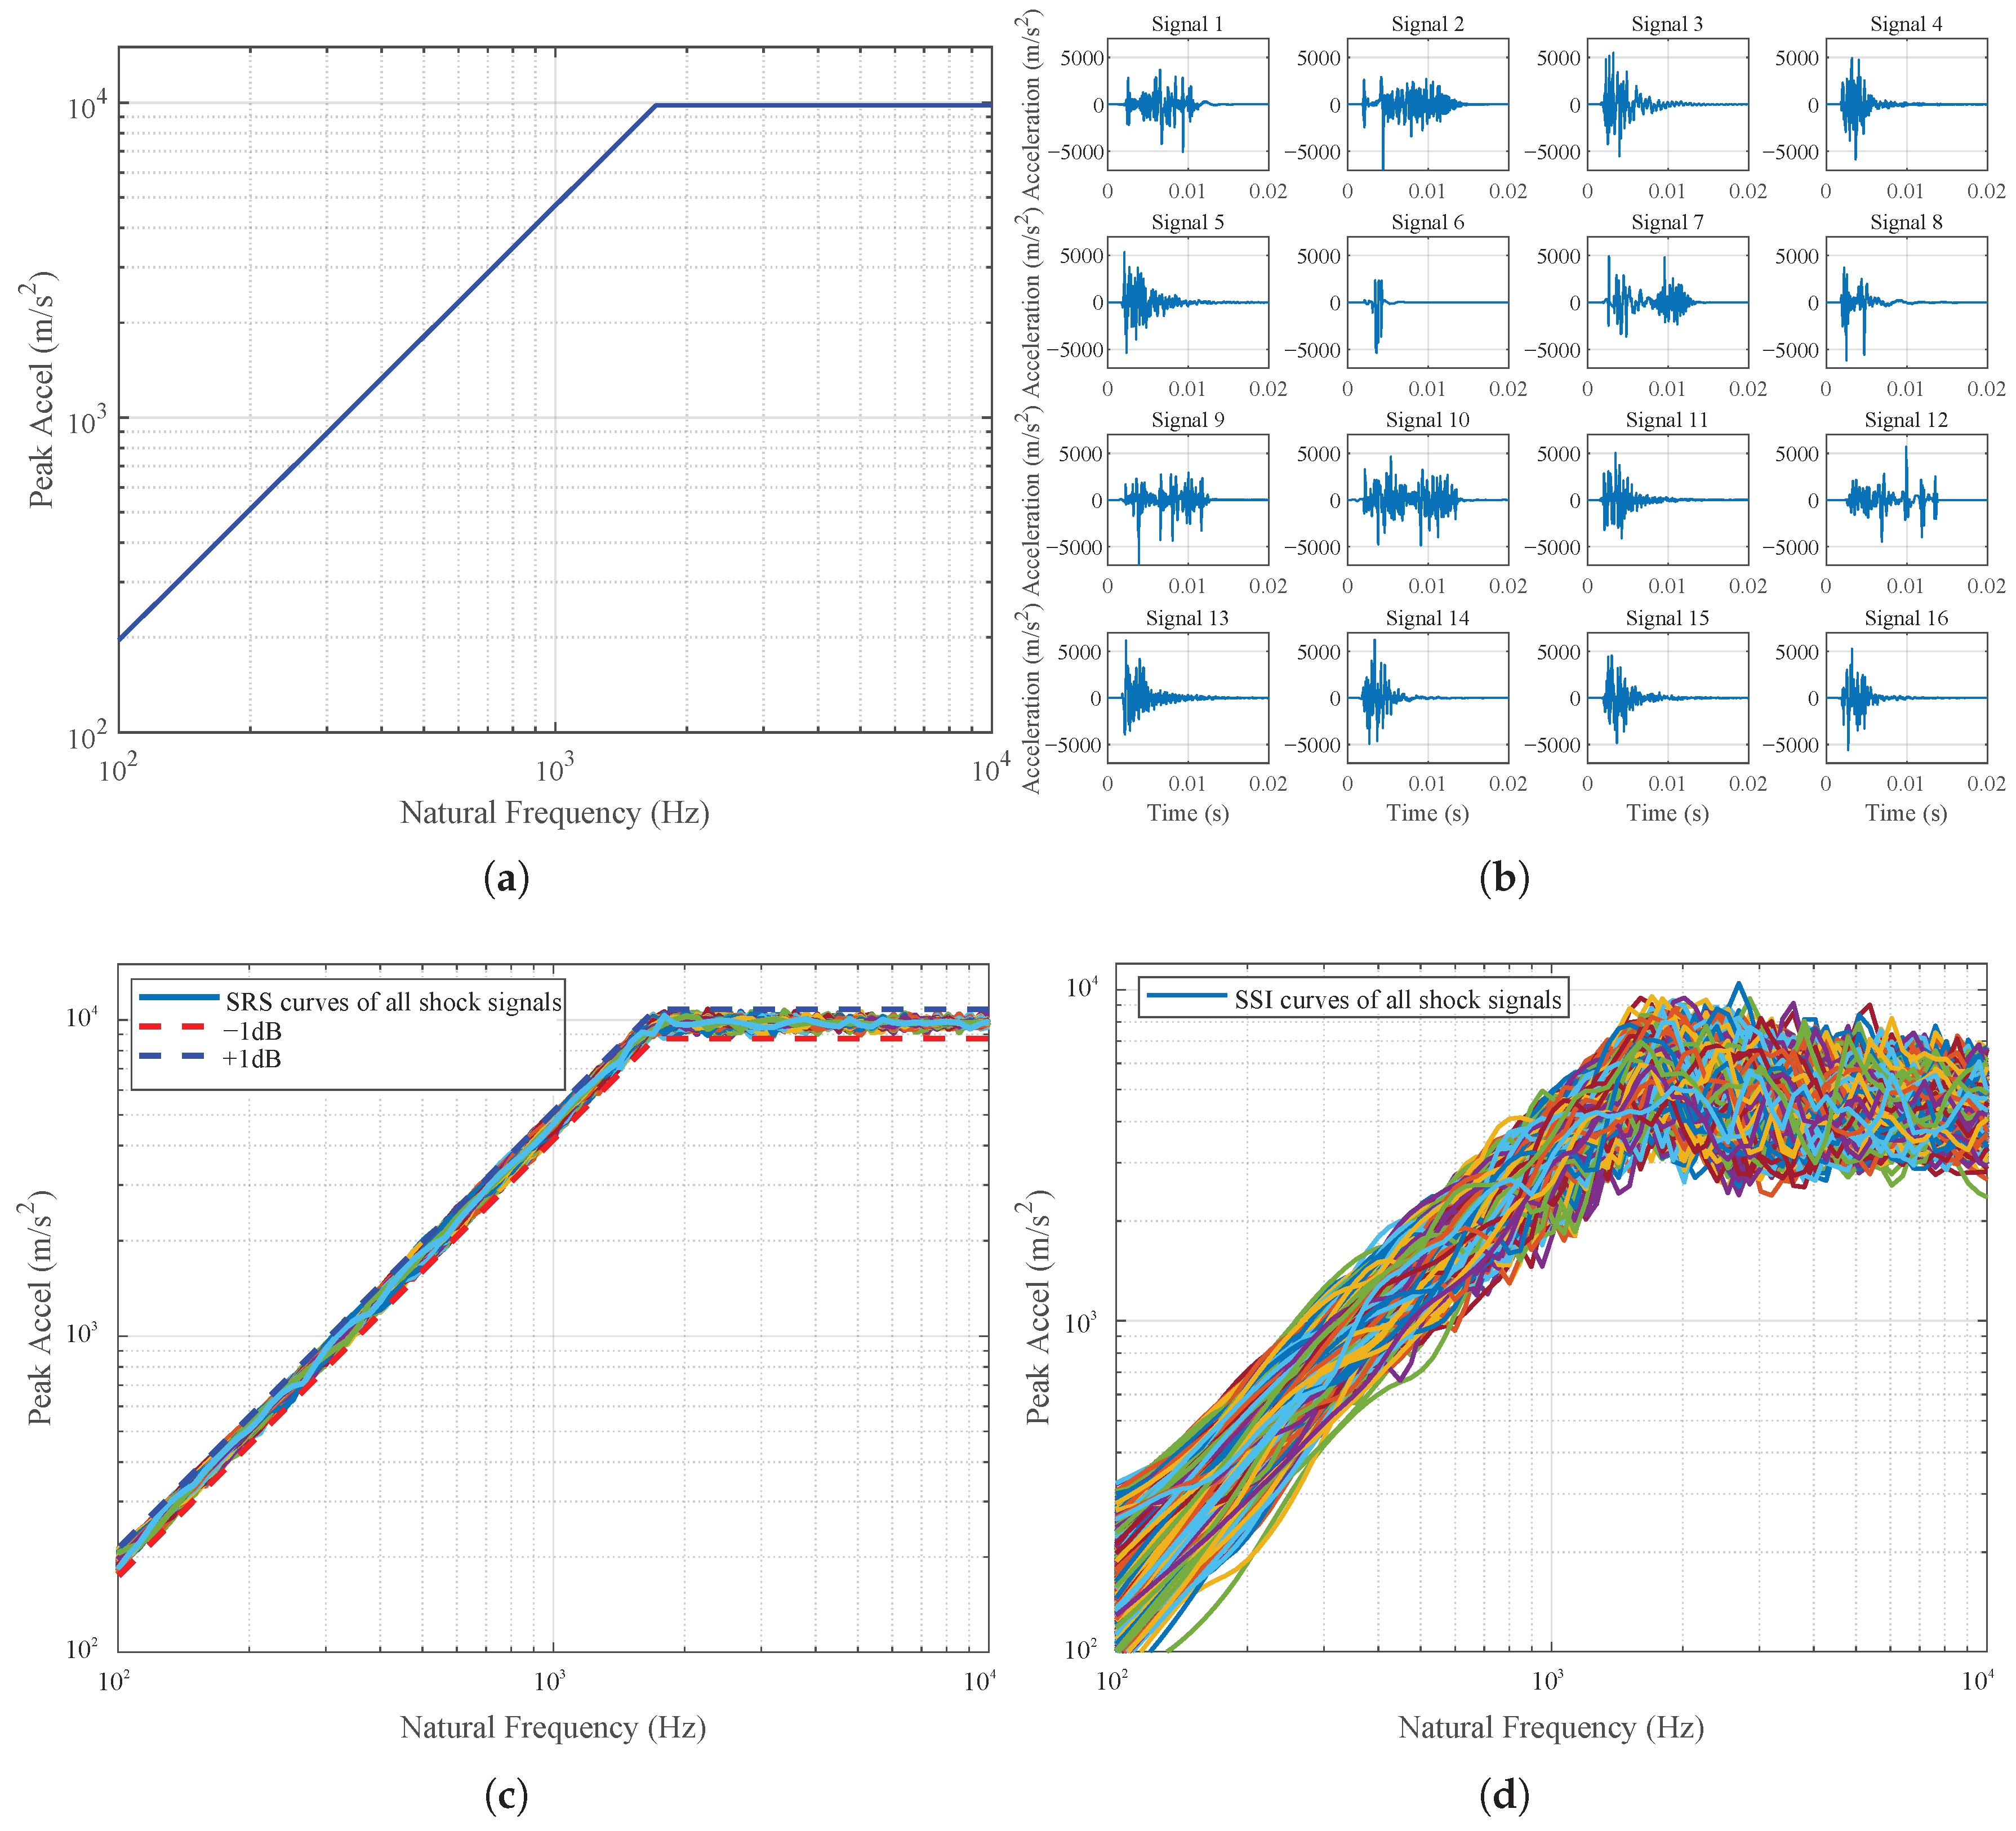
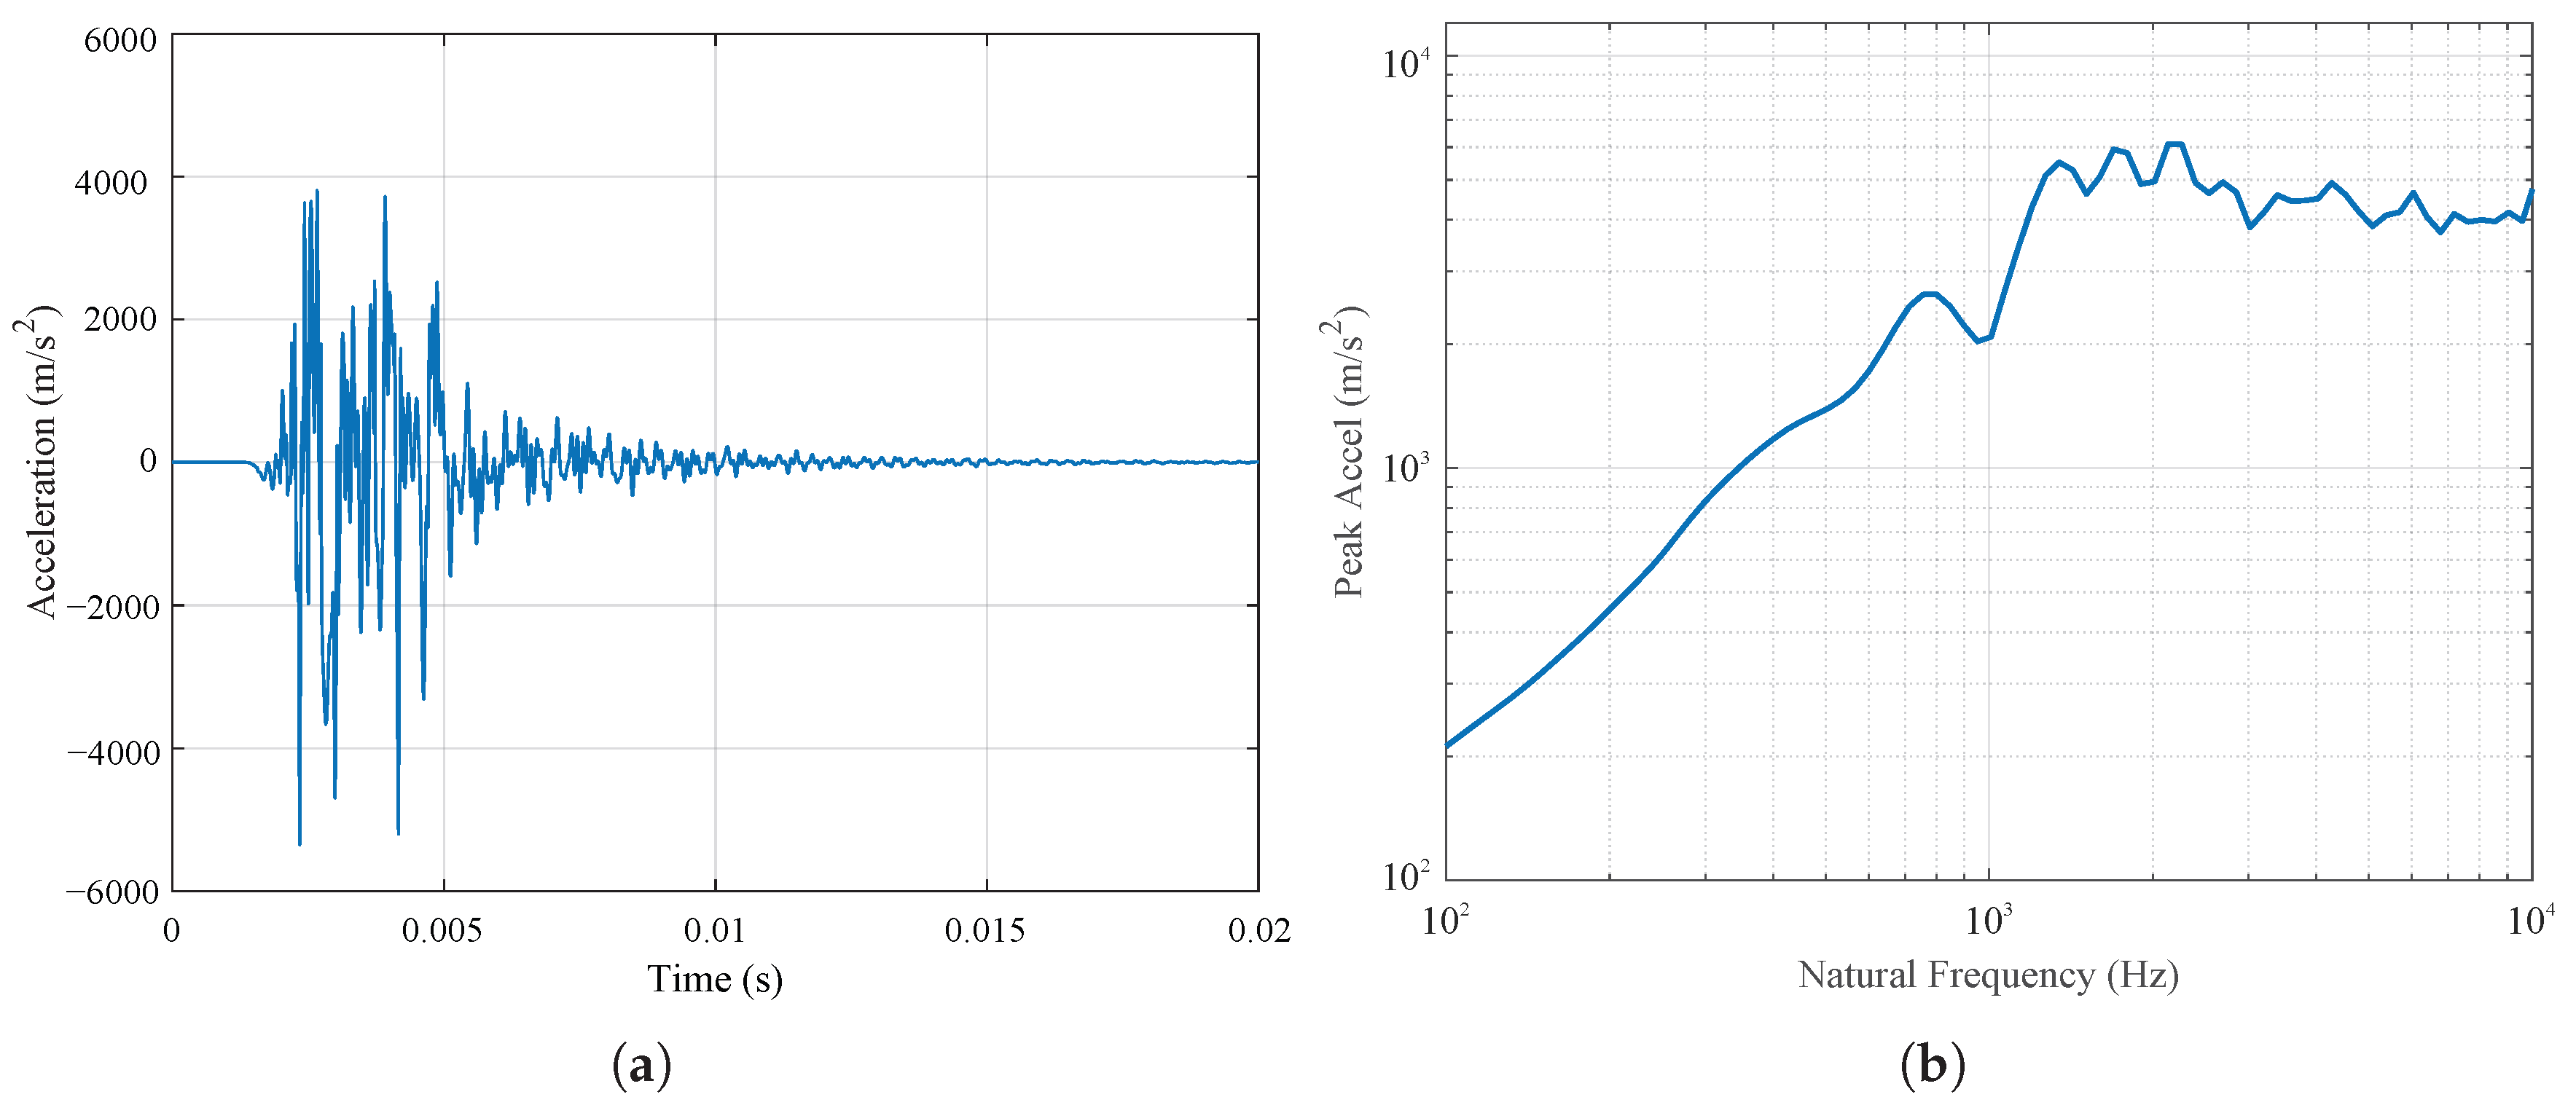
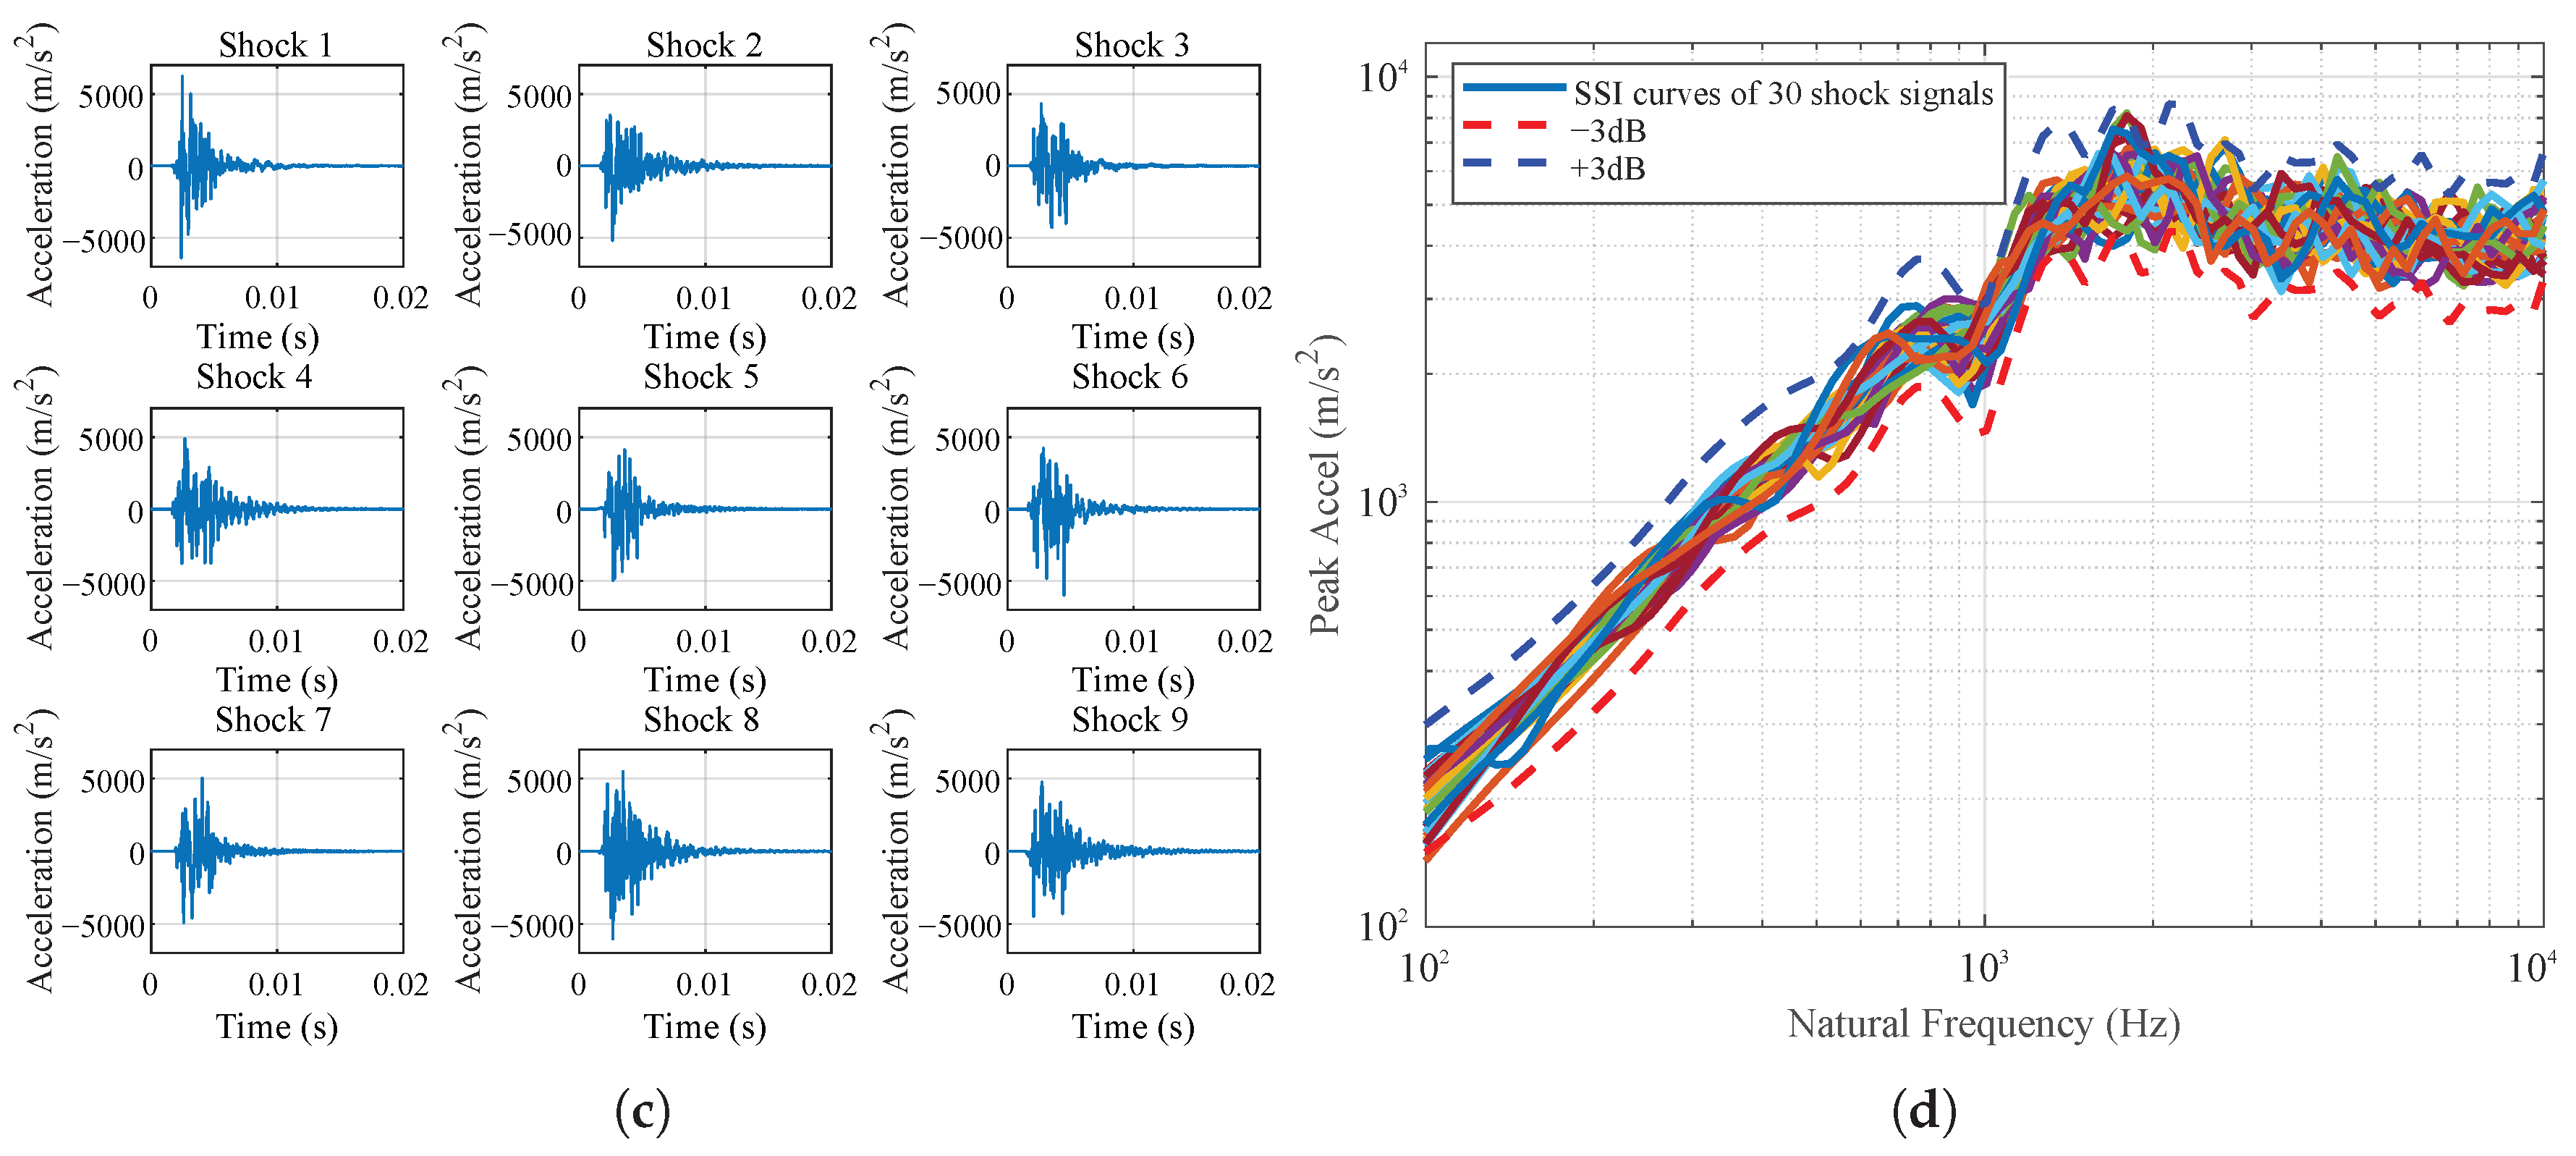
A large-scale dataset of time-domain shock signals is generated. Figure 5a presents the reference SRS, which adopts a typical two-piece format commonly used in aerospace standards. Example synthesized signals are shown in Figure 5b, providing shock inputs of diverse signal waveforms for structural response analysis. These time-domain waveforms exhibit significant variations, and some signals are unusable due to distortion. All synthetic signals match the reference SRS within a tolerance, as shown in Figure 5c. Although the synthesized signals exhibit similar SRS, their corresponding SSI curves demonstrate notable discrepancies as shown in Figure 5d.
Figure 5.
Synthesis of shock signals based a given reference SRS: (a) Reference SRS (). (b) Example synthesized shock signals. (c) SRS curves of all synthesized shock signals. (d) SSI curves of all synthesized shock signals.
3.2. Results of Shock Signal Screening Based on ResNet50
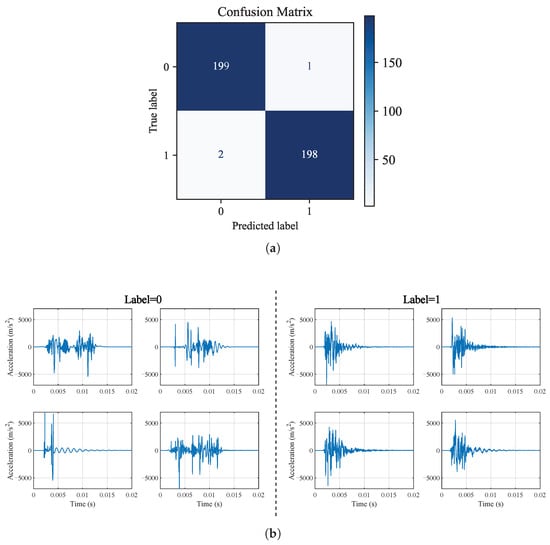
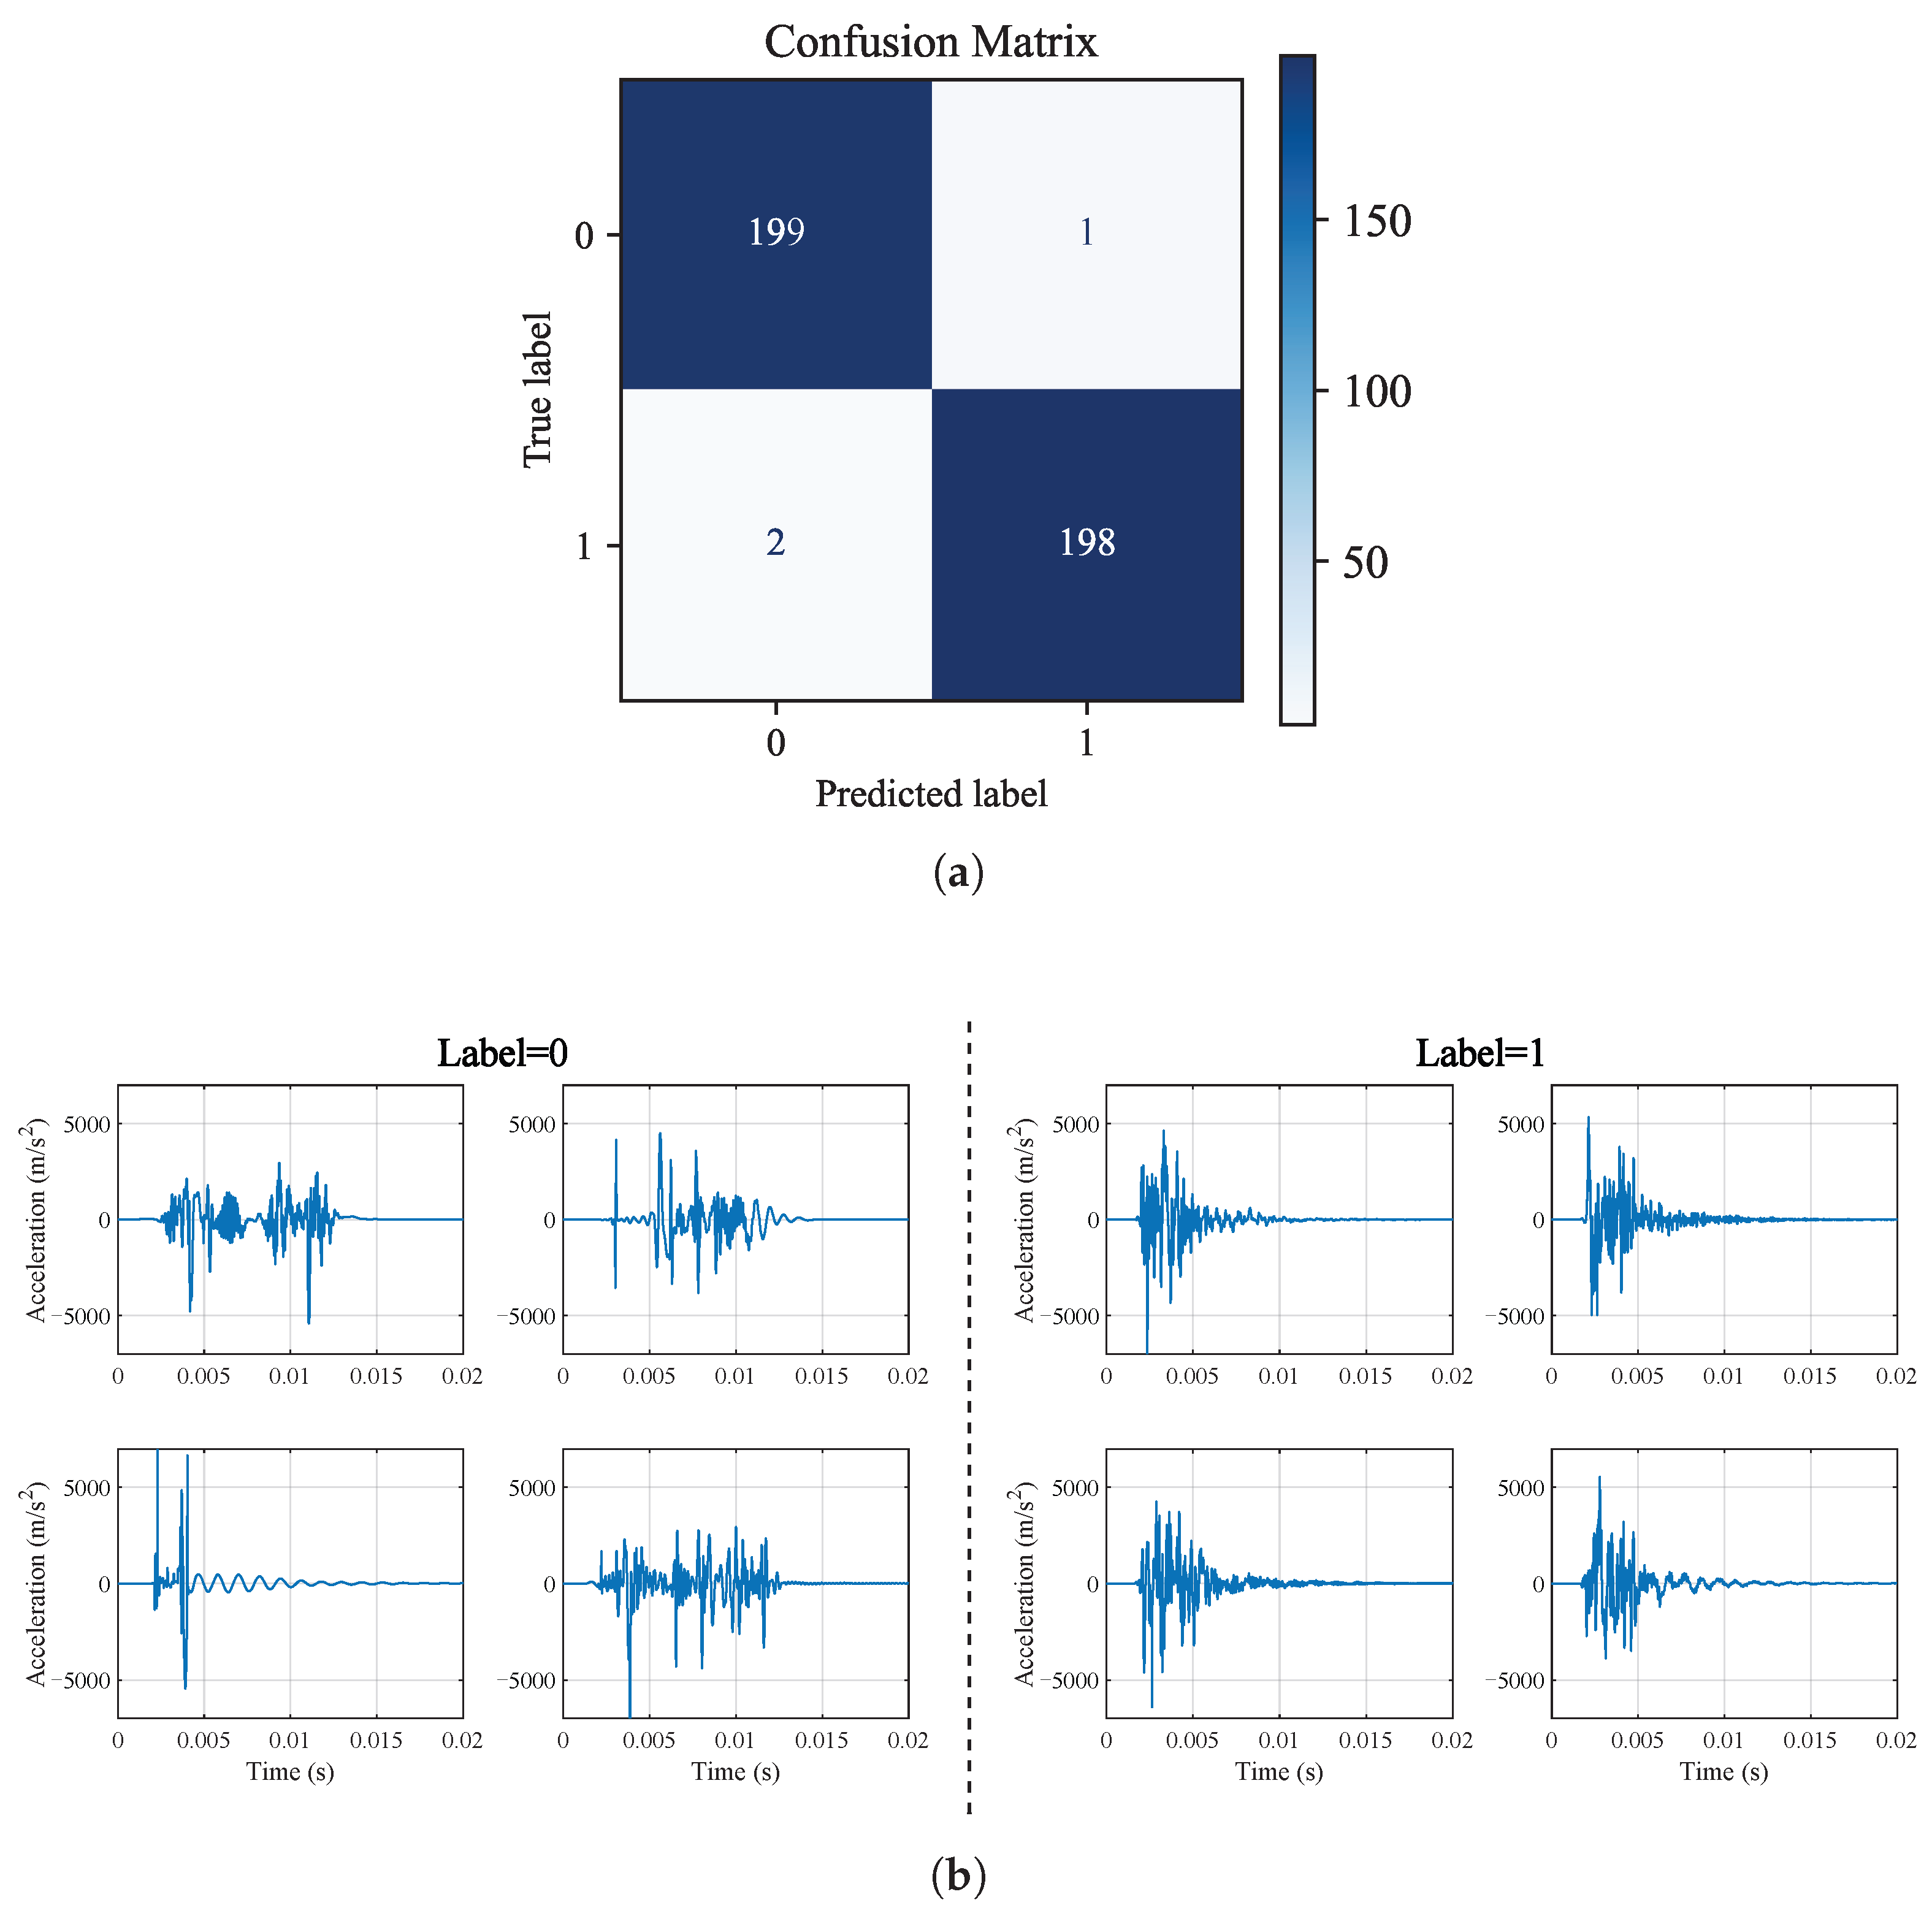
A shock signal screener based on the ResNet50 deep learning architecture is employed. Estimation on the test set demonstrates that the model achieves 99% precision and recall for both shock and non-shock signals, with the confusion matrix in Figure 6a confirming this performance. As illustrated in Figure 6b, labels 0 and 1 correspond to two distinct classes of time-domain waveforms. Signals labeled as 1 are identified as shock signals, whereas those labeled as 0 are designated as non-shock signals. With a shock signal screener, anomalous shock signals can be detected automatically, precisely and rapidly.
Figure 6.
Results of shock signal screening by ResNet50: (a) Confusion matrix of the ResNet50 classifier. (b) Representative acceleration time-histories for invalid (Label = 0) and valid (Label = 1) shock signals.
3.3. Results of Shock Signal Subset Construction
3.3.1. Subset S Based on Time-Domain Features
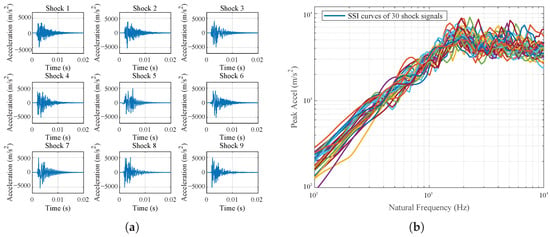
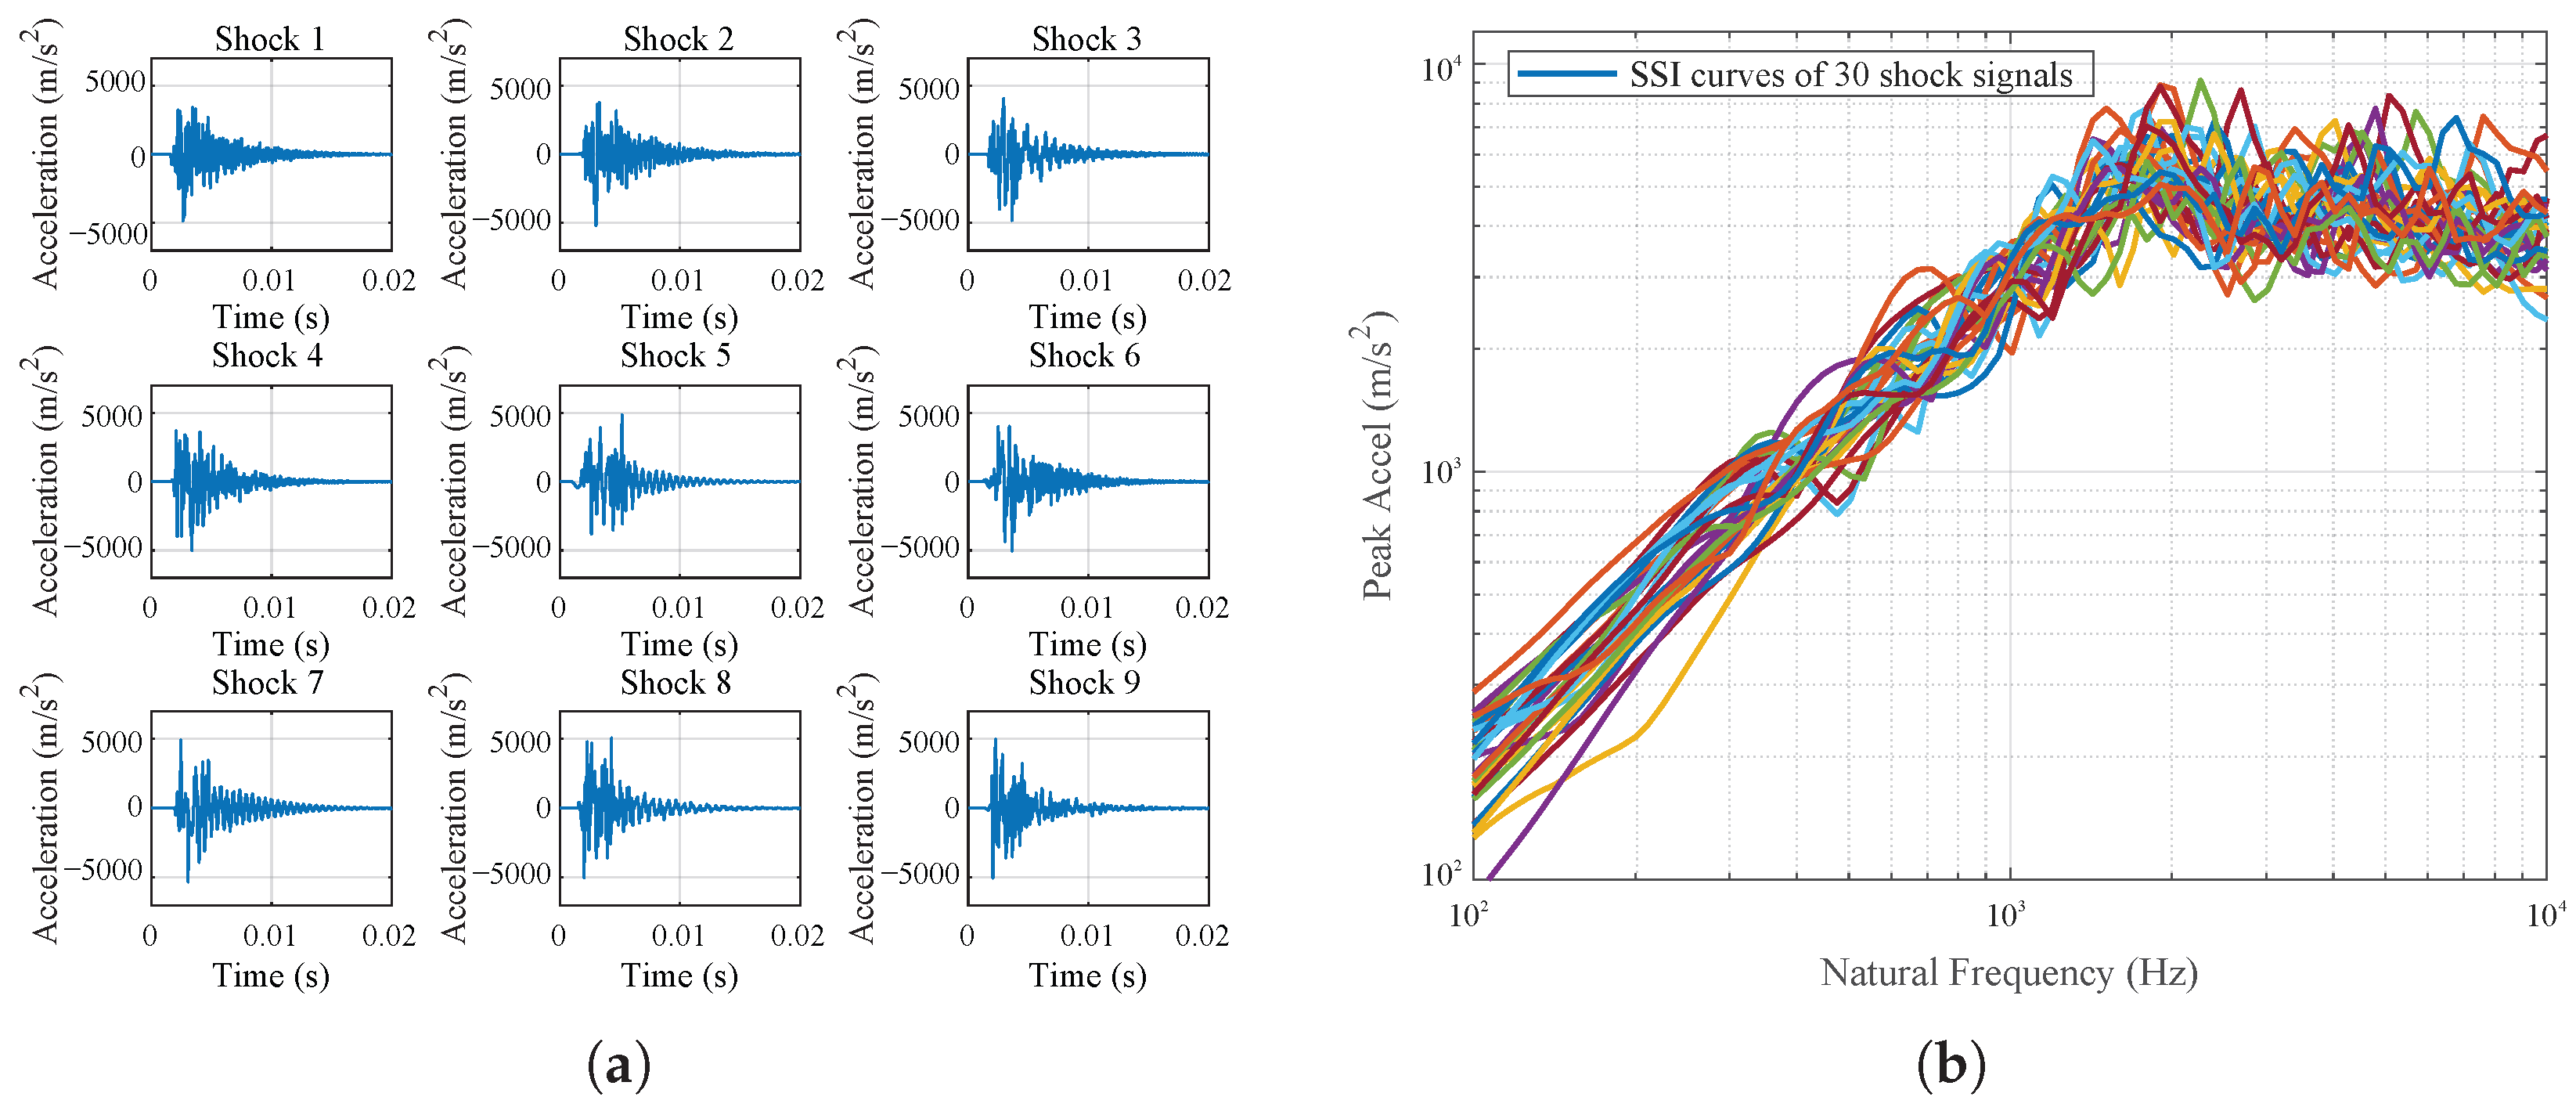
To quantify how the temporal features of shock signals govern structural response dispersion, this study extracts signals with similar temporal features to construct subset S. The reference effective duration () is 9 ms. The reference amplitude () is . The maximum allowable relative error is e is set to 10%. This restricts the signals in subset S to an effective duration range of 8 ms to 10 ms and an amplitude range of to . The selection of the tolerance e = 10% balances subset size with signal consistency. In the sensitivity analysis conducted with tolerance levels of 5%, 10%, and 20%, the 5% tolerance retains only approximately 15 signals, which provides insufficient statistical reliability. The 20% tolerance, although yielding approximately 120 signals, leads to a marked degradation in time-domain consistency and excessive dispersion in the SSI curves of the resulting subset M. With the 10% tolerance, approximately 30 signals are obtained, ensuring statistical comparability. Therefore, 10% represents a reasonable tolerance that balances sample size and signal consistency in this study. Figure 7a displays the time-histories of example shock signals in subset S. It can be seen that these signals have nearly identical time-domain features, including both effective duration and amplitude. The SSI curves of all shock signals in subset S are presented in Figure 7b.
Figure 7.
Illustration of subset S satisfying SRS and temporal feature criteria: (a) Time-histories of example shock signals. (b) SSI distributions.
3.3.2. The Extraction Results of Subset M Based on the SSI Features
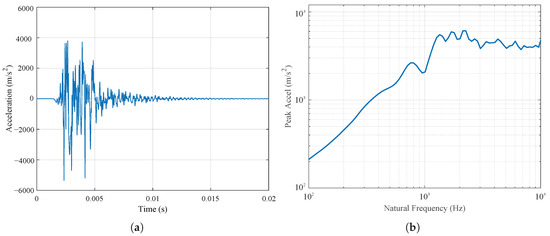
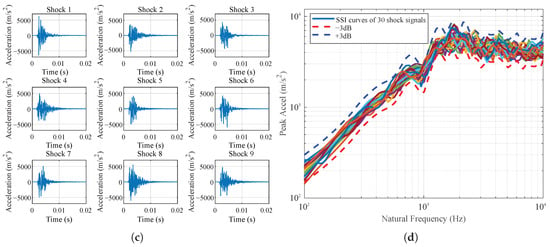
Signals exhibiting similar SSI features are extracted to form subset M. The SSI of a randomly selected signal from the universal set U, whose time-history and SSI are illustrated in Figure 8a and Figure 8b, respectively, is used as the reference SSI. The signal subset satisfying the SSI-similarity criterion is subsequently extracted. Setting the allowable error , defined in Equation (15), to 1.3 dB, subset M also contains 30 shock signals. The SSI tolerance = 1.3 dB is not arbitrarily chosen but is determined in a data-driven manner to ensure that subset M has a comparable size to subset S. Specifically, after the 10% time-domain tolerance is established, the 30 signals from the universal set U whose SSI curves are closest to the reference SSI curve are selected, and the maximum RMSE value among these 30 signals—i.e., 1.3 dB—is adopted as the SSI tolerance boundary. This procedure ensures that both subsets S and M contain 30 signals, thereby providing a balanced basis for subsequent statistical comparisons. Figure 8c displays example acceleration time-histories of shock signals in subset M, and Figure 8d presents the SSI distribution of all 30 shock signals in M. SSI curves of subset M are within the tolerance range of the reference .
Figure 8.
Illustration of subset M satisfying SRS and SSI criteria: (a) Reference time-domain waveform. (b) Reference spectrum. (c) Time-histories of example shock signals. (d) SSI distributions.
3.4. Batch Finite Element Simulation Results and Response Analysis
FEM simulations are conducted using 1000 synthesized shock signals from the universal set U, as well as feature-based subsets derived from it, as the input excitation. Table 3 summarizes the structural dimensions, material properties, and measurement locations for the three structural models. Three plate models (aluminum and PCB, with varying sizes and resonance frequencies) and two measurement points (edge and center) are used to estimate response variability and spatial effects under shock excitation. This table lists the first-order natural frequencies of the test plates. In the numerical simulations, the boundary conditions of the plates are defined by applying fixed constraints at four specific points on their bottom surfaces. These points correspond to the excitation locations used in the response analysis. To ensure computational accuracy within the target frequency domain of up to 10 kHz, a mesh convergence verification is performed: the mesh is progressively refined until the relative error in the calculated highest-order natural frequency of interest falls below 2%, thereby confirming that the model has converged across this entire frequency range. This comprehensive setup allows the proposed methodology to be validated across diverse structural configurations and measurement locations.
Table 3.
Batch simulation matrix and measurement arrangement.
Structural damage has traditionally been estimated through stress response. However, acceleration response is equally critical in equipment response analysis. Its importance lies in ensuring safety in applications such as aviation (e.g., overload), and in identifying failure modes associated with functional failure. Moreover, guided by the principle of the MIL-STD-810H standard ([32], p. 516.8-5) that a material’s response acceleration is the primary variable for characterizing shock effects, this study includes both stress and acceleration response analysis.
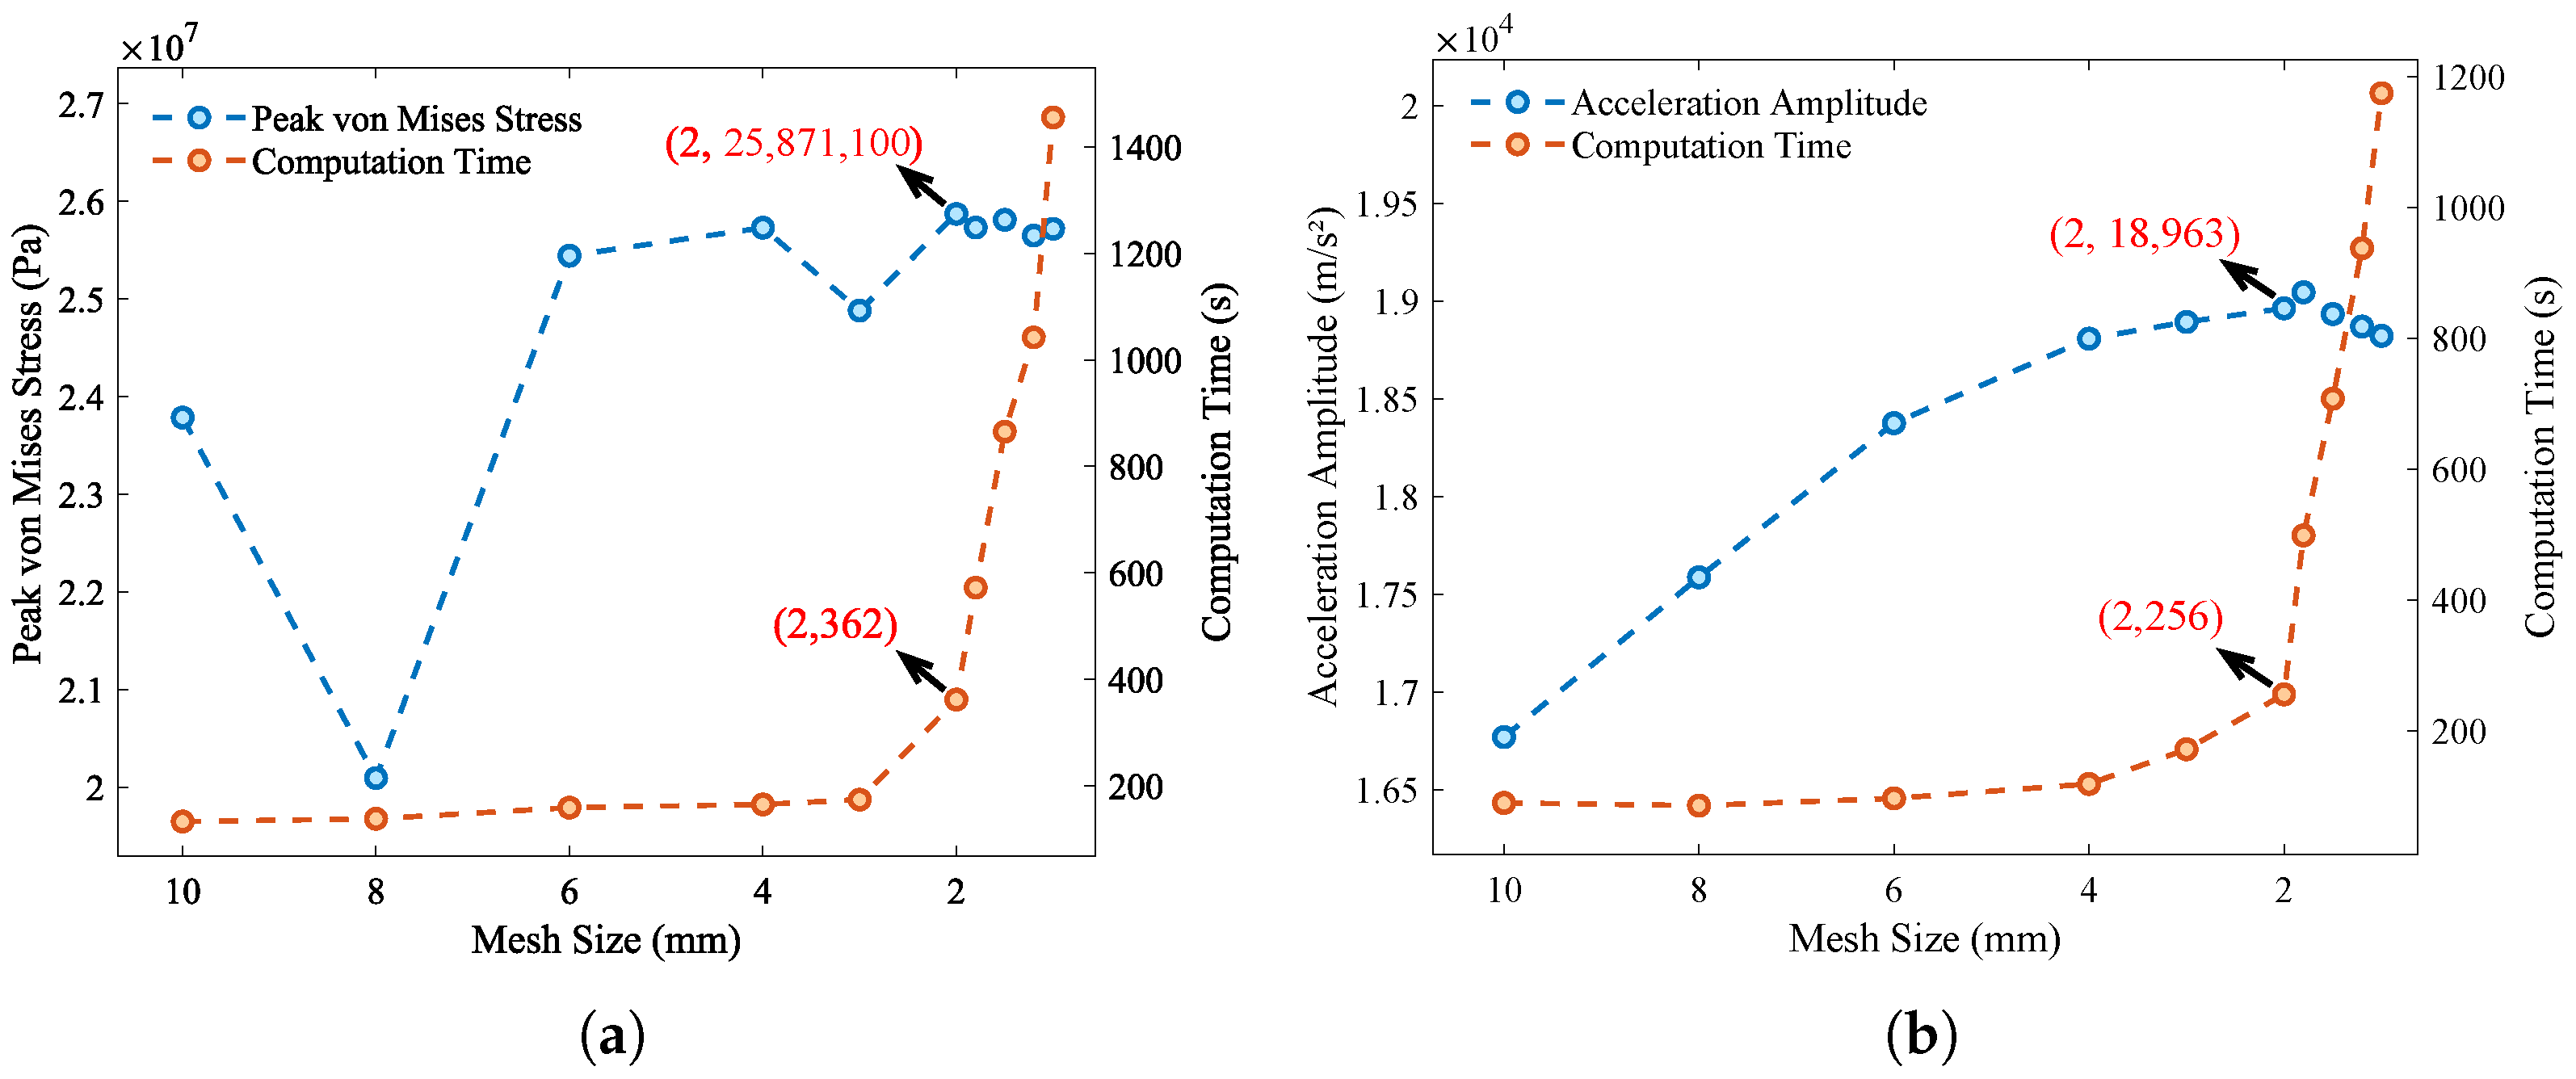
To ensure the reliability of the simulation, a systematic mesh convergence study is conducted using element sizes of 8 mm, 4 mm, and 2 mm. The corresponding peak acceleration amplitudes are 17,587.58, 18,808.49, and 18,963.75, respectively. The Grid Convergence Index (GCI) based on Richardson extrapolation is calculated to quantify the discretization error. The convergence ratio confirms monotonic convergence, and the observed order of convergence is consistent with second-order accuracy. The GCI for the 2 mm mesh is 0.15%, corresponding to an absolute discretization error band of approximately (95% CI: ). The consistency coefficient indicates that the solutions are well within the asymptotic convergence range. It should be noted that the non-monotonic behavior of the peak von Mises stress at mesh sizes of 3 mm and 8 mm, as observed in Figure 9, is attributed to local element distortion arising from the swept meshing strategy at these specific element sizes. Nevertheless, the GCI-based analysis confirms that the 2 mm mesh provides sufficient accuracy for the present analysis. Meanwhile, the computational time increases sharply when the element size is reduced below 2 mm. Therefore, an element size of 2 mm is adopted in this study to balance accuracy and computational efficiency, and the numerical discretization error is negligible compared to the observed response variations between the different signal subsets.
Figure 9.
Convergence and computational time of structural shock response calculations with different mesh sizes: (a) Peak von Mises stress. (b) Acceleration amplitude.
3.4.1. Structural Response Excited by Shocks in Universal Set U
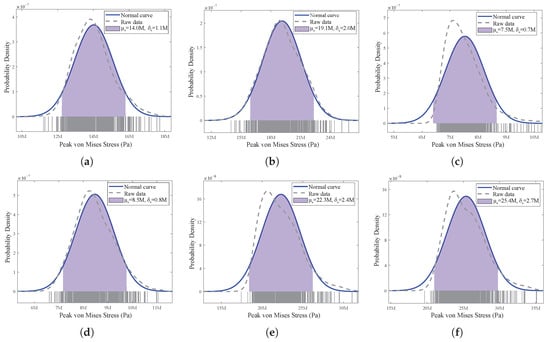
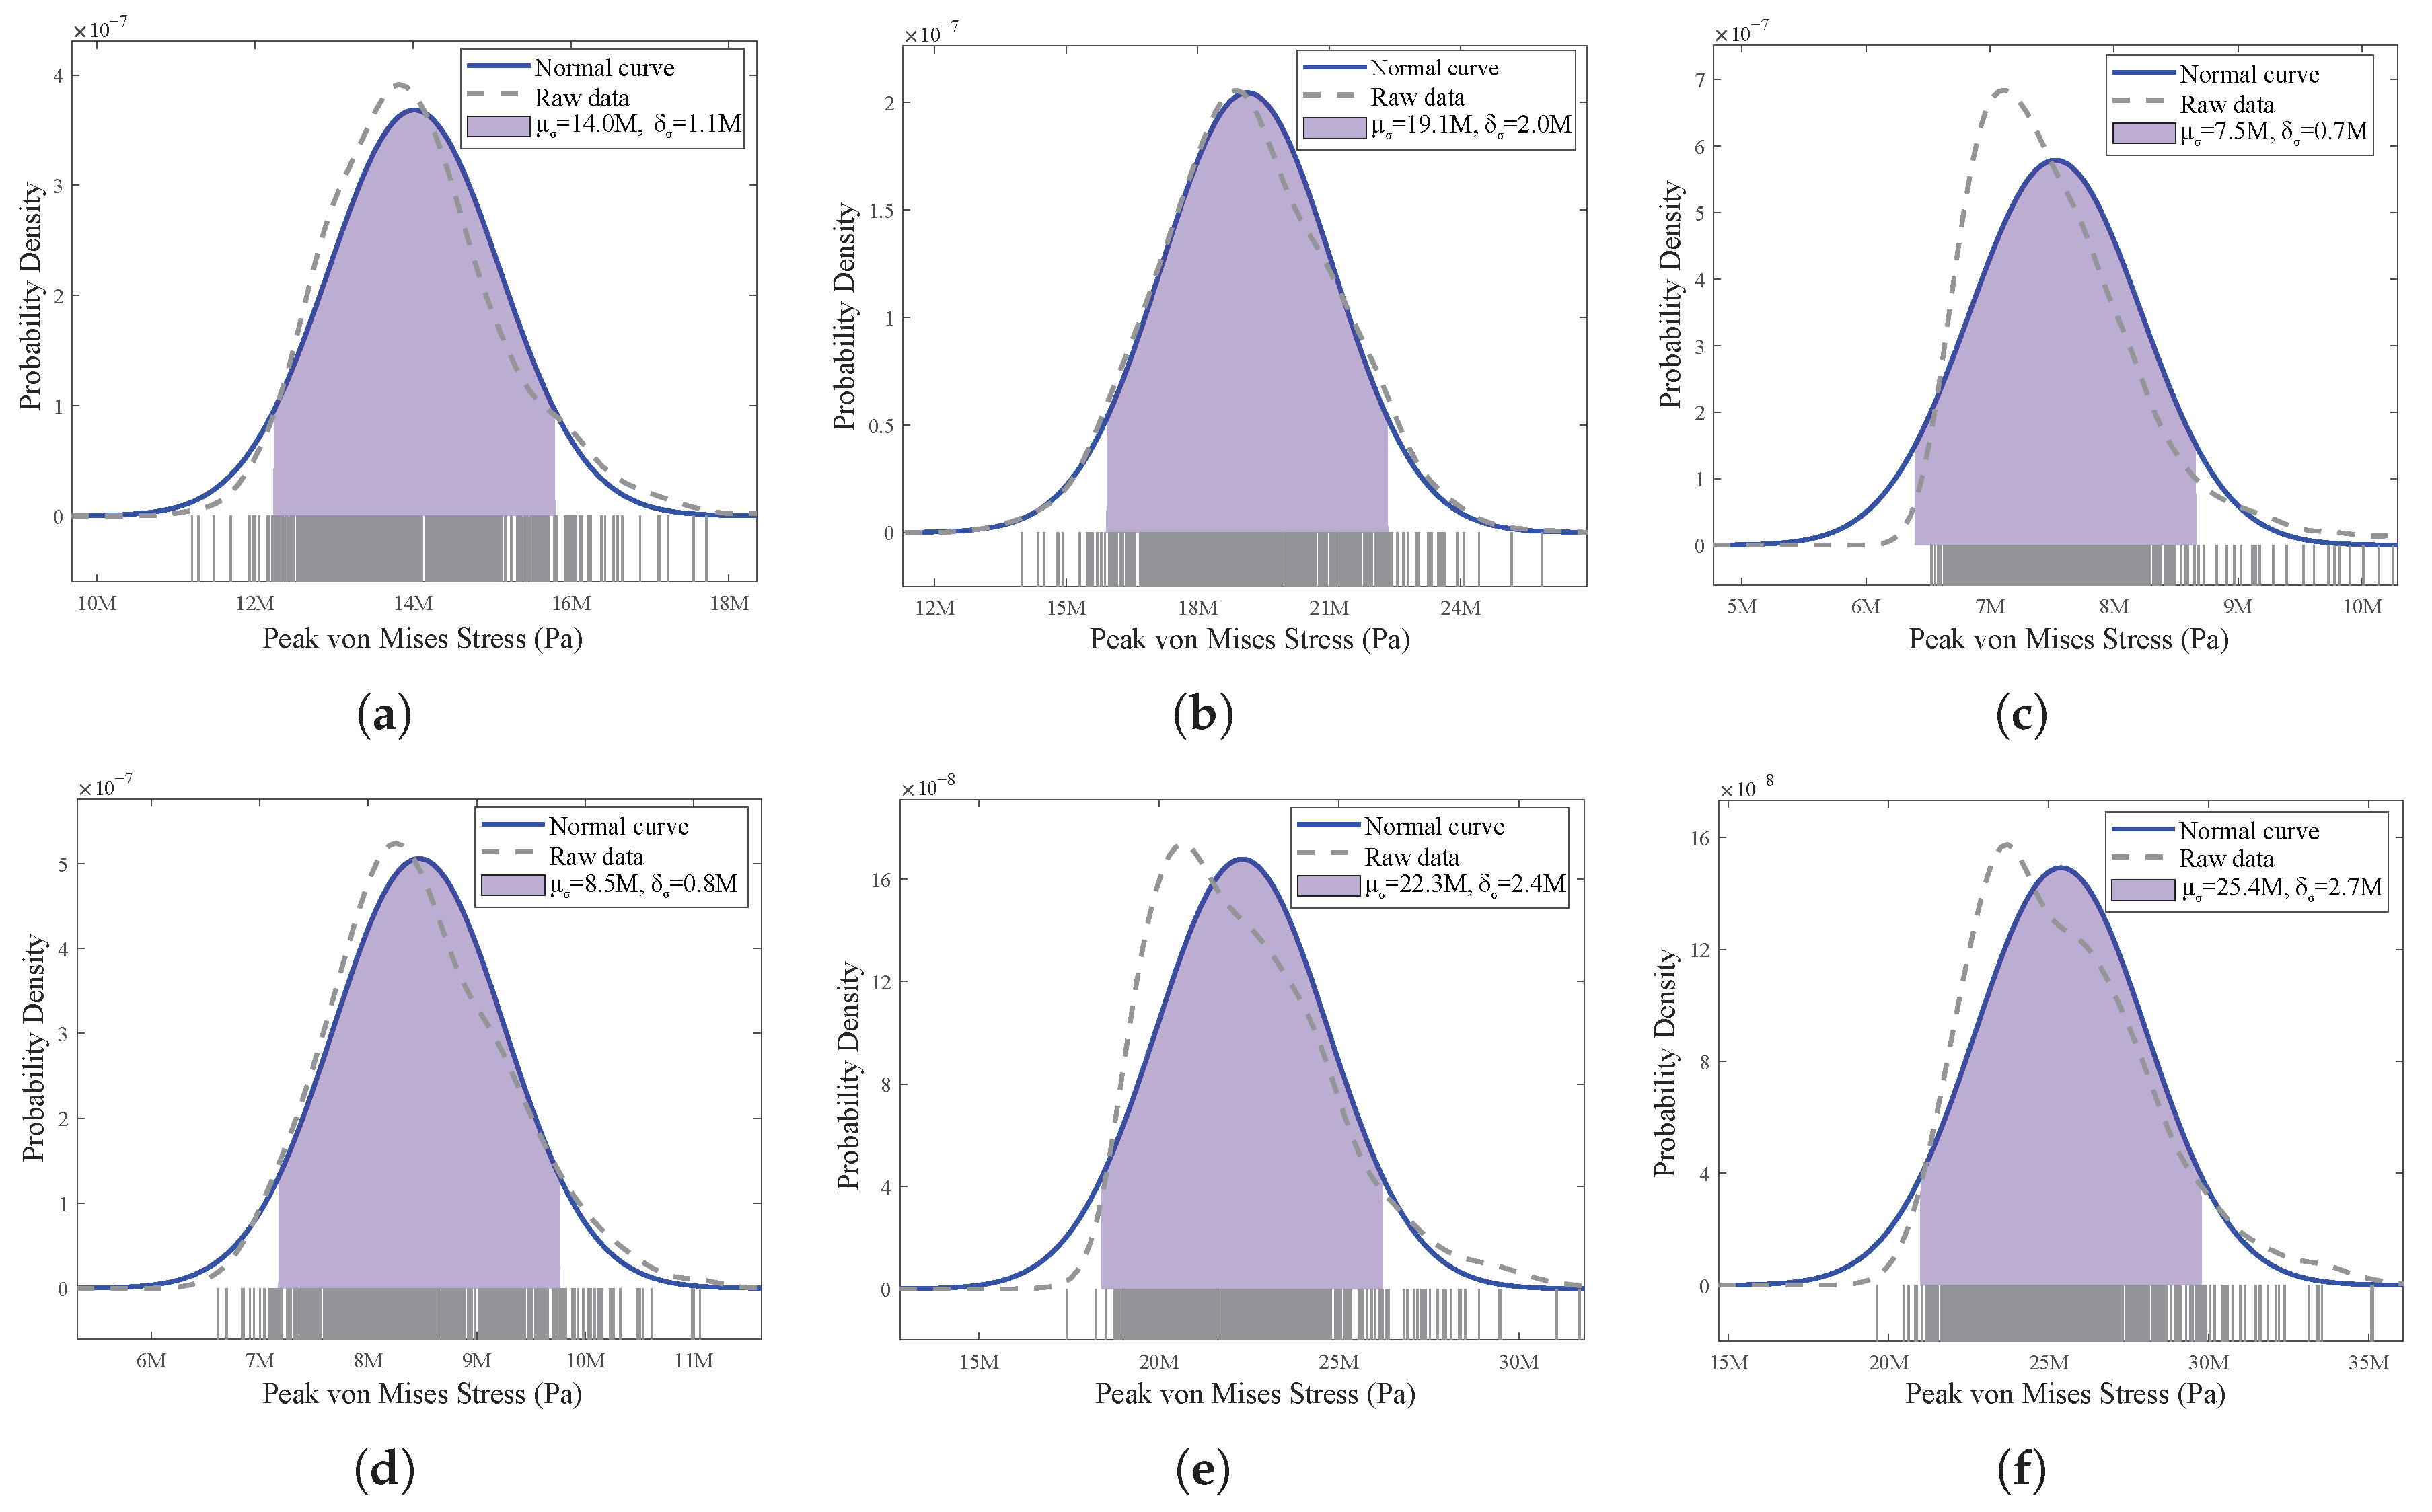
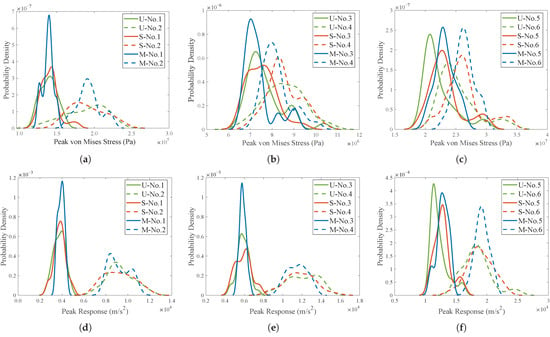
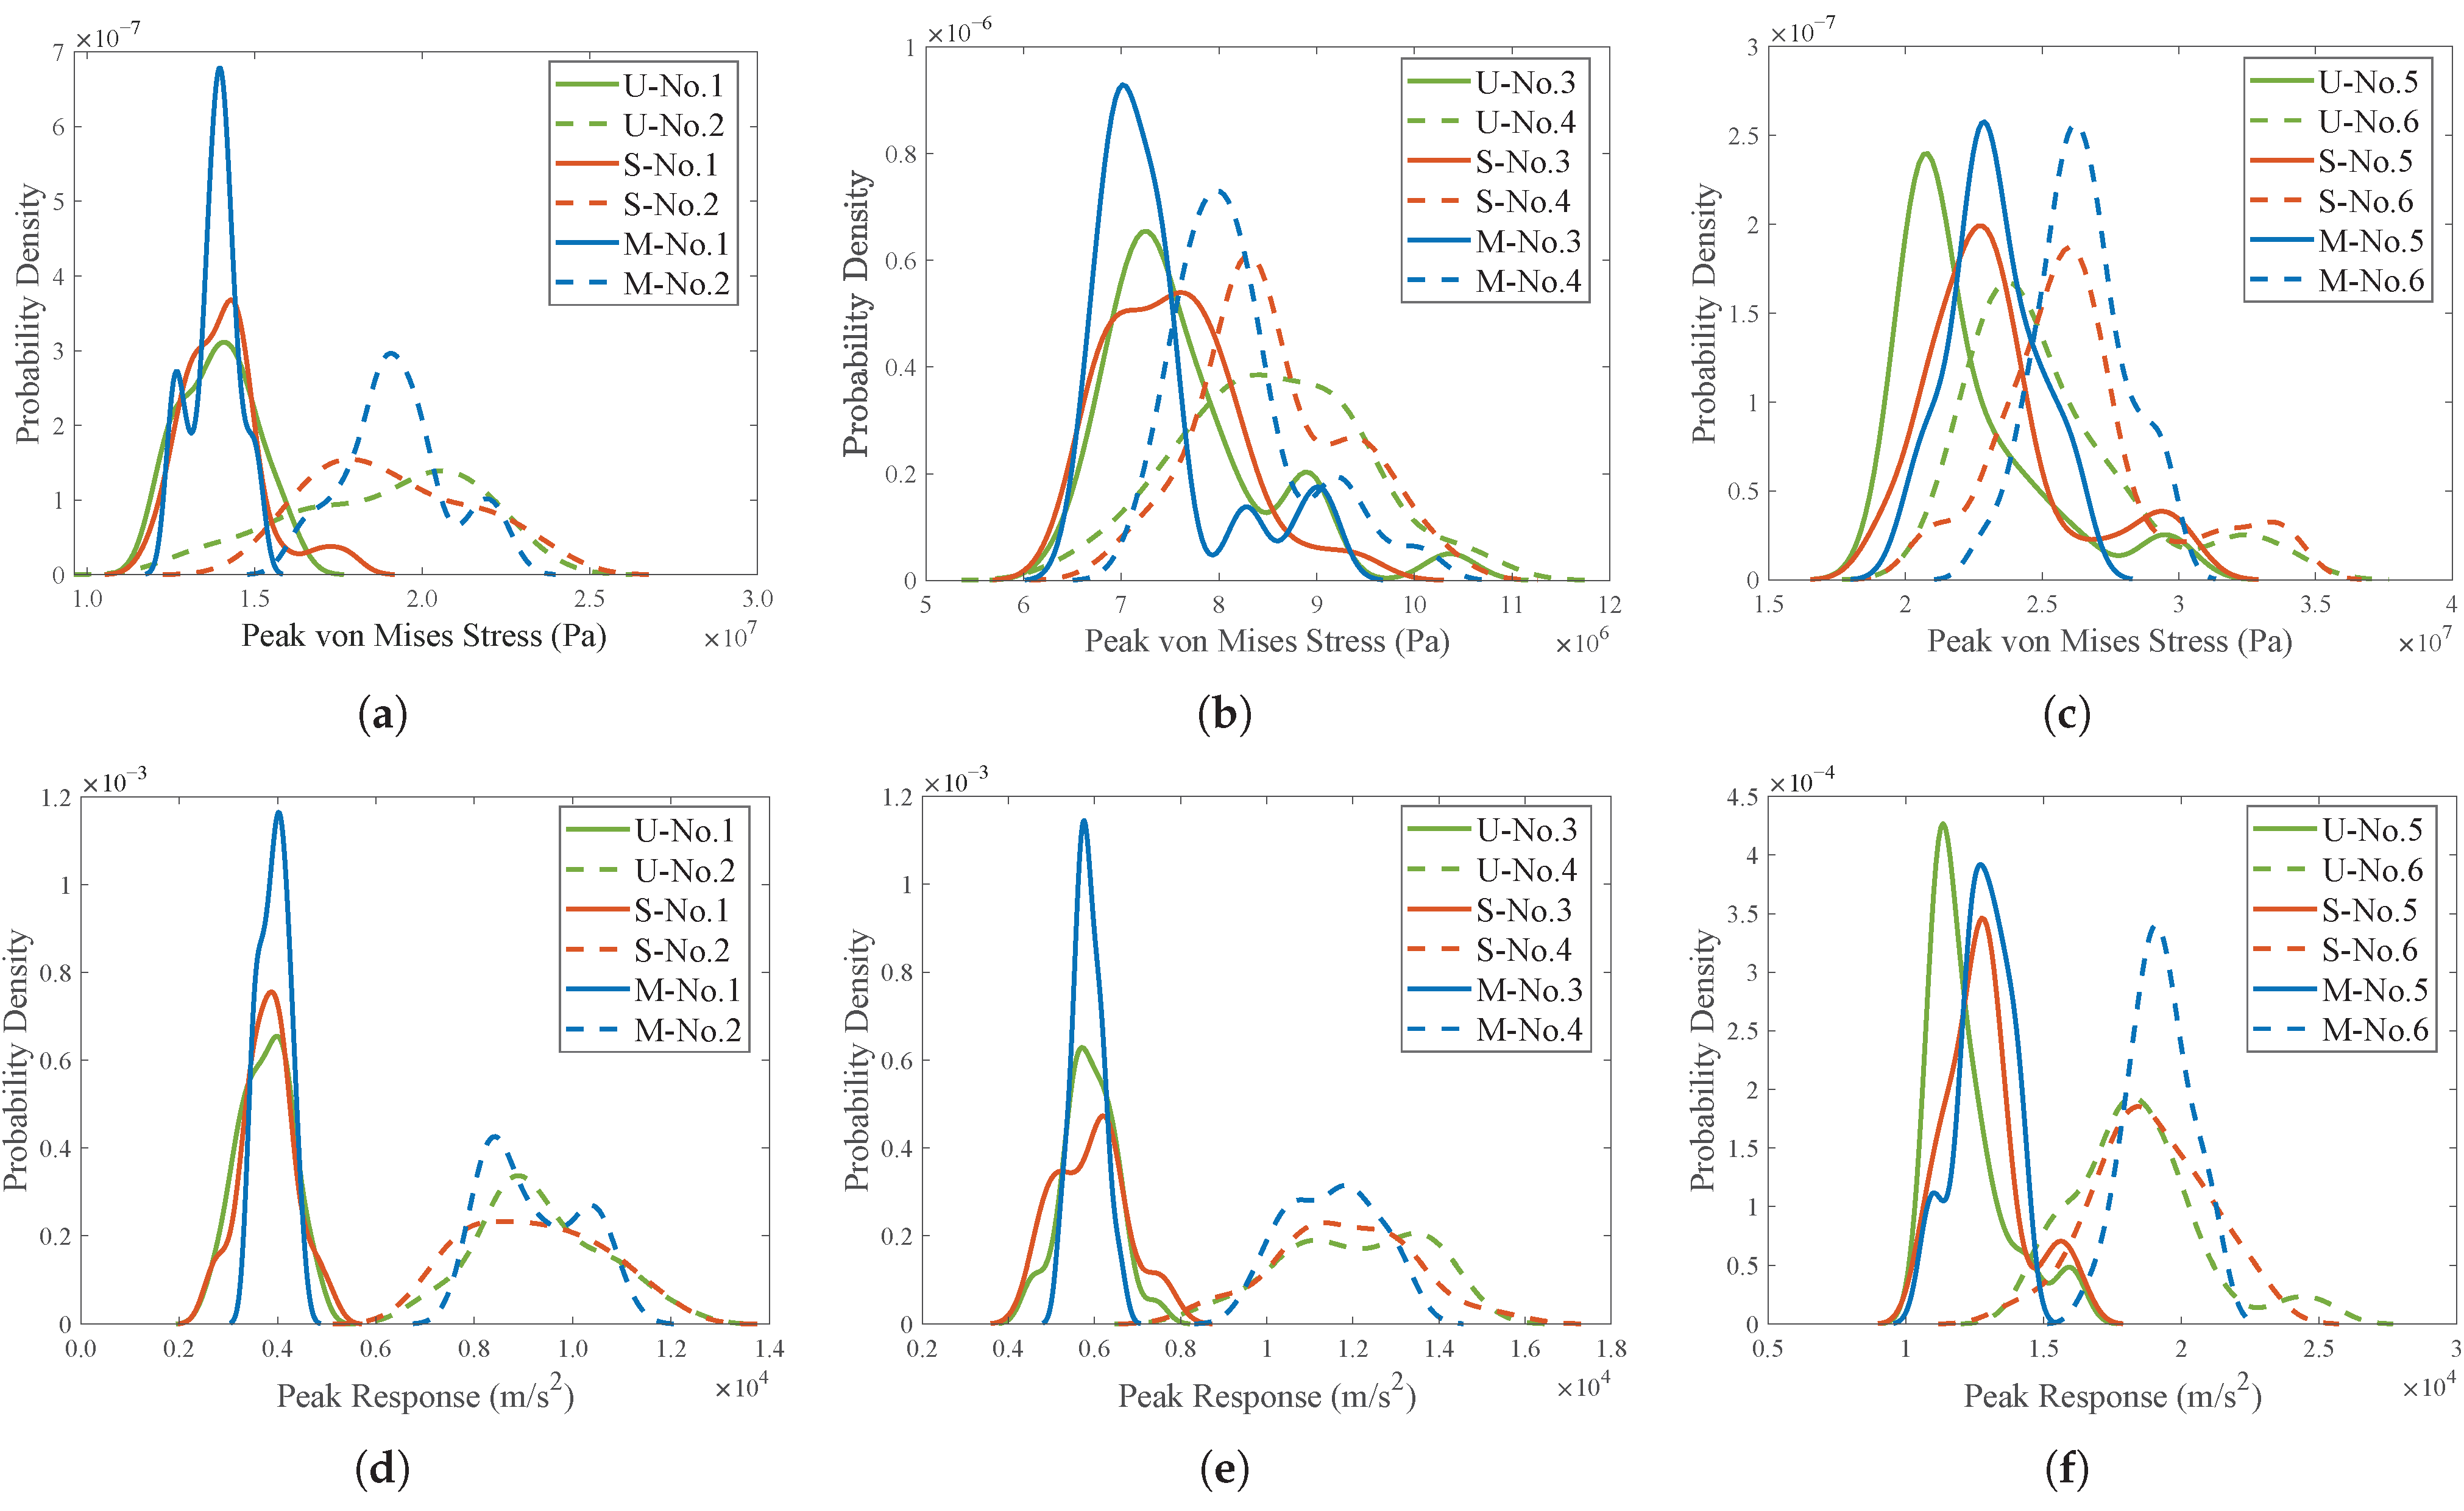
To quantify the dispersion of structural response, a statistical analysis is performed. The 1000 shock signals from the universal set U are used as inputs to excite the three structures. Figure 10 shows both the Kernel Density Estimation (KDE) curves of the peak von Mises stress response at each measurement point and the corresponding theoretical normal distribution curves calculated from the sample mean and standard deviation. The high consistency between the KDE and the theoretical curve indicates that the peak von Mises stress response at each measurement point follows a normal distribution across diverse shock excitations even with almost identical SRS. Within the same structure, the central locations (Nos. 2, 4, and 6) consistently exhibit both higher mean values and higher standard deviations of peak von Mises stress than edge locations (Nos. 1, 3, and 5). Moreover, the stress response of the PCB is significantly lower than that of the aluminum plate.
Figure 10.
Statistical distribution of the structural peak von Mises stress: (a) No. 1. (b) No. 2. (c) No. 3. (d) No. 4. (e) No. 5. (f) No. 6.
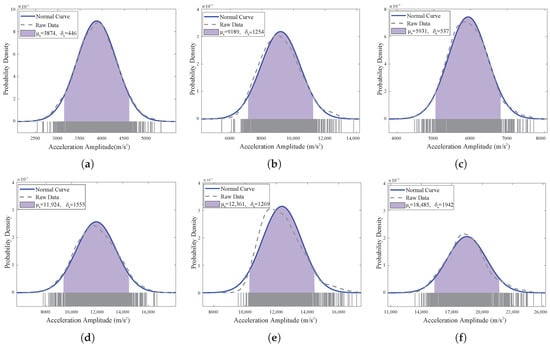
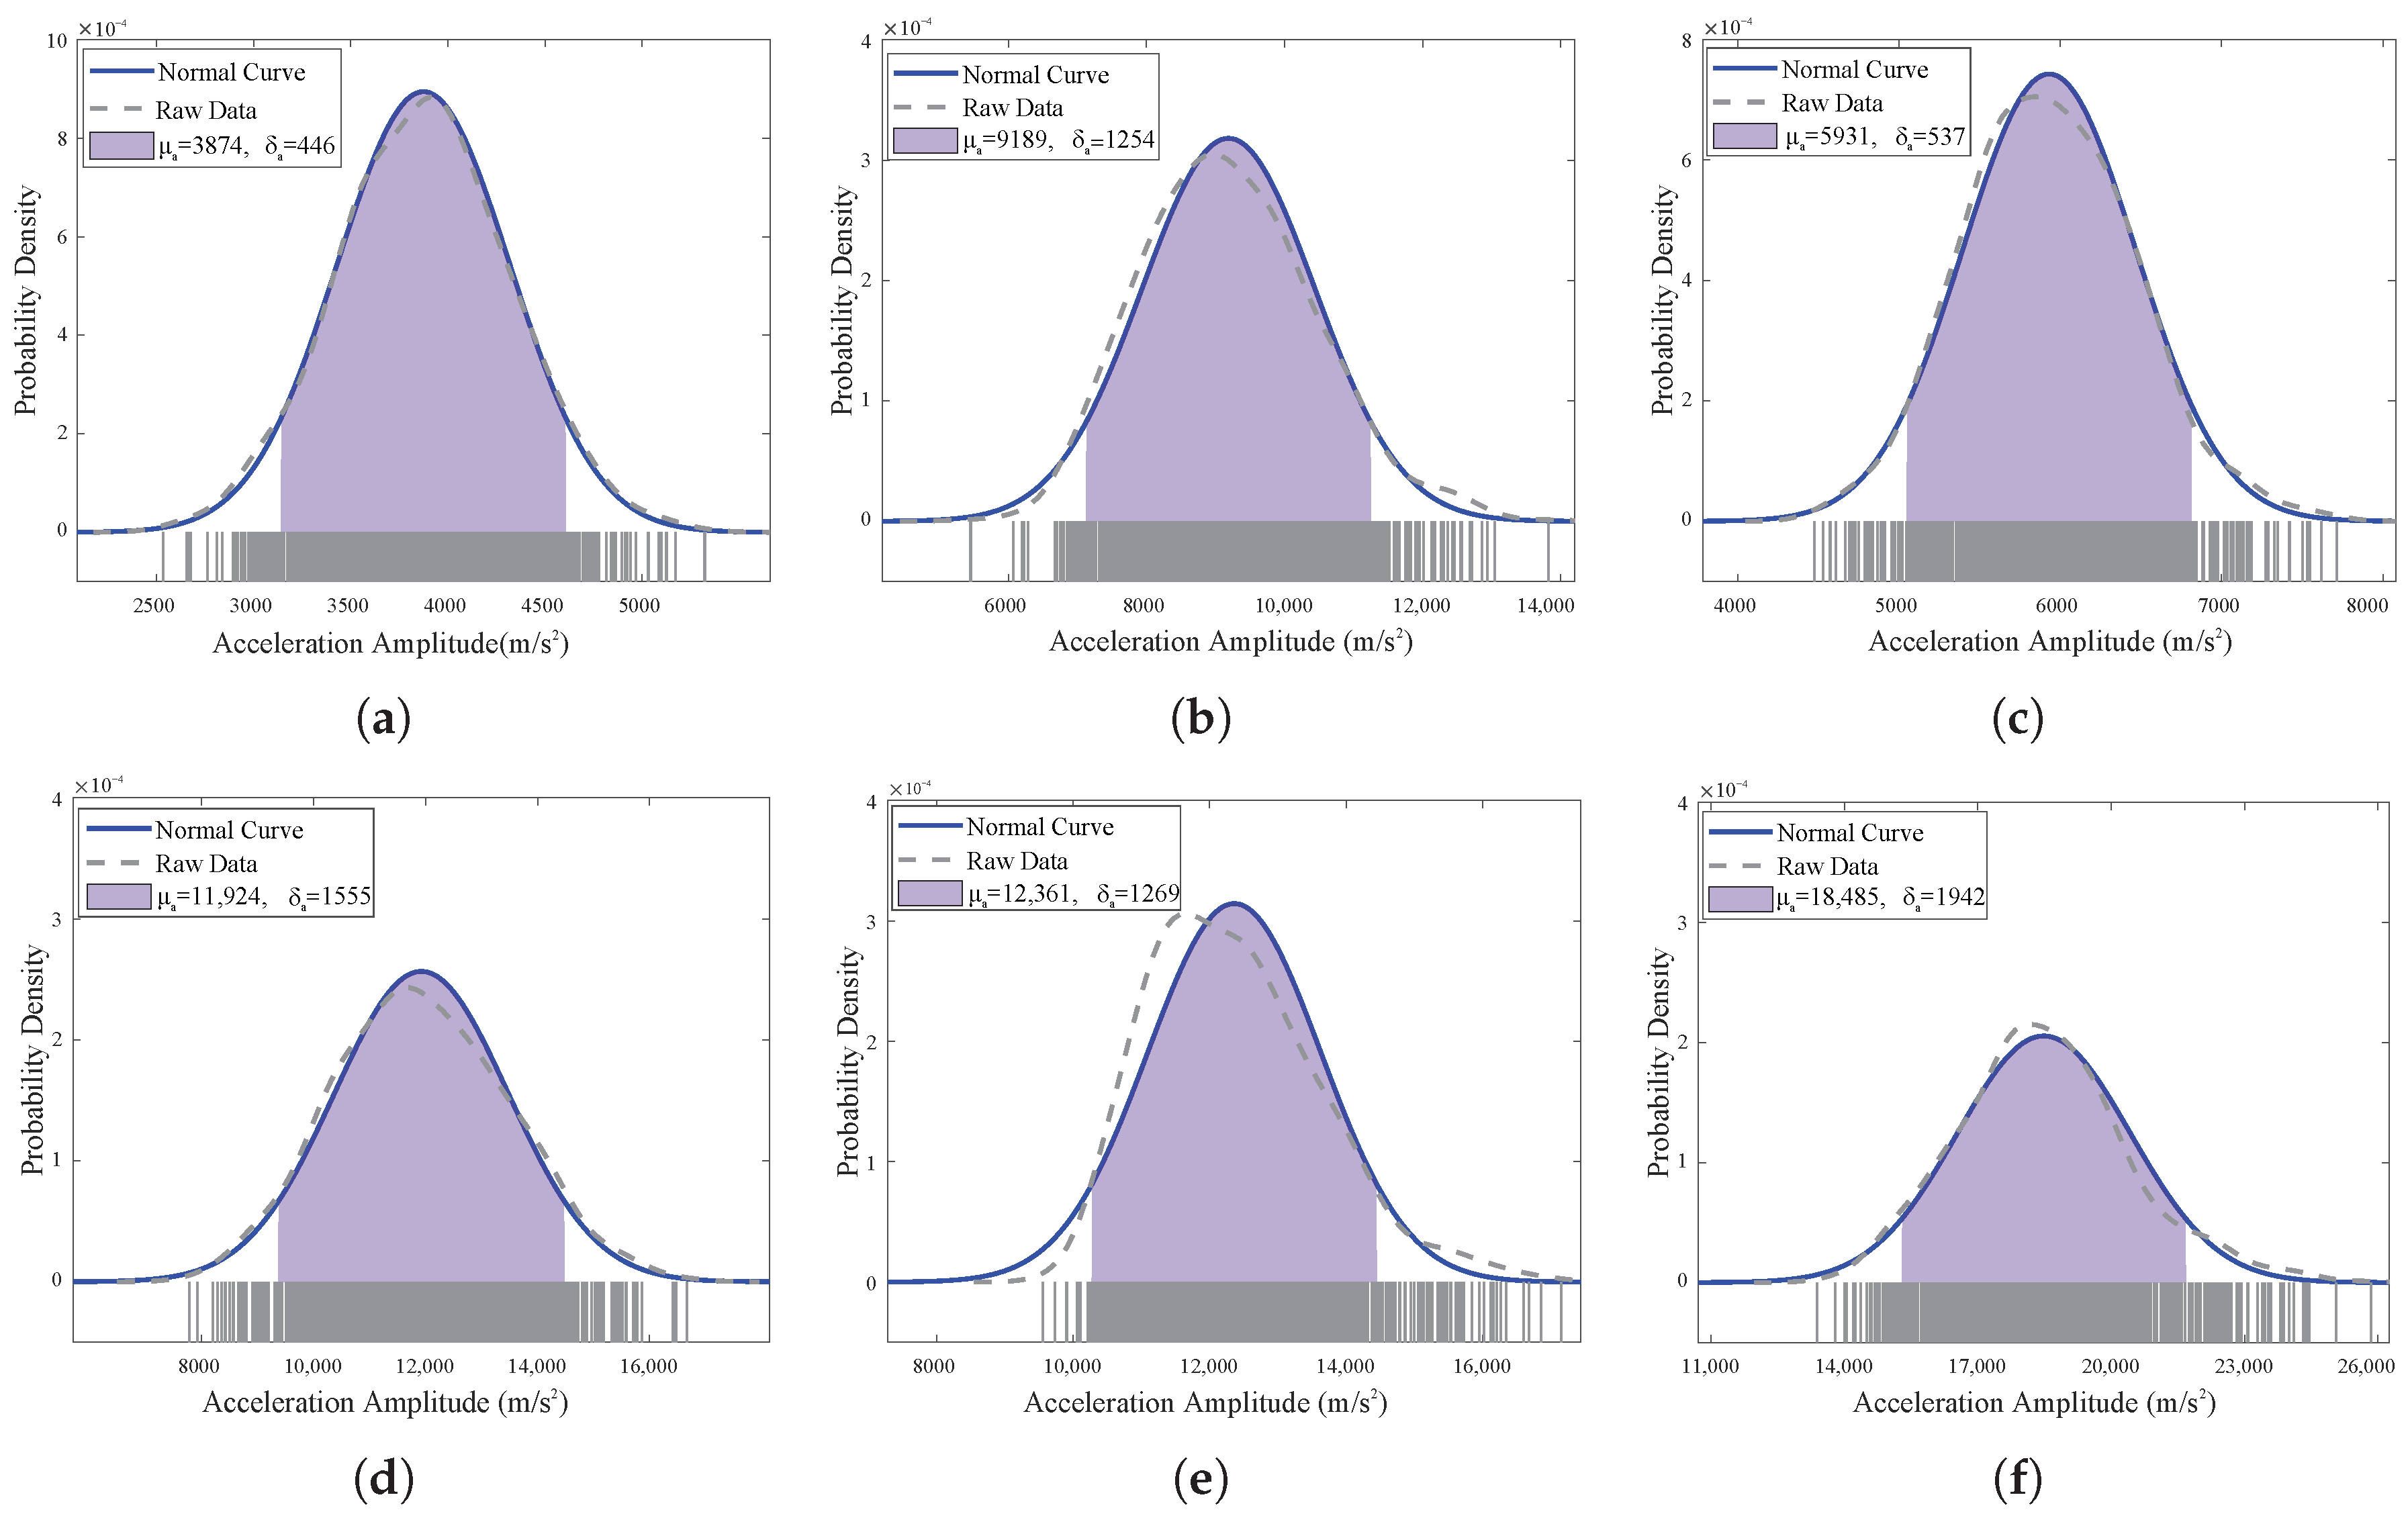
Figure 11 shows the KDE curves of the acceleration response amplitudes at each measurement point, demonstrating that the acceleration response amplitudes at each point also follow a normal distribution. The measurement points at plate center (Nos. 2, 4, and 6) exhibit a higher overall response level than the points on edges (Nos. 1, 3, and 5). Within the same structure, the response at the central points is approximately twice that at the edge points. Central measurement points show higher standard deviations and broader distributions, indicating greater response variability than edge points.
Figure 11.
Statistical distribution of the structural acceleration response amplitudes: (a) No. 1. (b) No. 2. (c) No. 3. (d) No. 4. (e) No. 5. (f) No. 6.
This study employs the 90% probability intervals of the distributions for structural peak von Mises stress and acceleration amplitude responses to quantify their dispersion levels, which are derived from Equation (18). Table 4 presents the 90% probability interval bounds, dispersion level (in dB), and standard deviation for the peak von Mises stress response and acceleration amplitude at each measurement point. Under the excitation of 1000 shock signals with similar SRS, the mean dispersion levels of the peak von Mises stress response and the acceleration amplitude response across the measurement points are 2.77 dB and 3.28 dB, respectively.
Table 4.
Statistical characteristics of structural peak von Mises stress and acceleration response amplitude.
3.4.2. Dispersion-Level Analysis of Structural Response Across Subsets S and M
When extracting subsets S and M, only a small number of shock signals in the universal set U satisfy the corresponding selection criteria, typically resulting in about 30 signals per subset. Therefore, to ensure consistency in statistical comparisons, a small subset of 30 shock signals is also randomly selected from the universal set U as a benchmark in this subsection. Figure 12 shows the distributions of peak von Mises stress and acceleration amplitude responses at each measurement point for the three subsets. Across all structures and locations, the shapes of the KDE curves are primarily unimodal, with only minor deviations from ideal symmetry. This general bell-shaped appearance suggests approximately normal-like response distributions. However, due to the relatively small sample size (30) in each subset, some curves exhibit slight skewness or irregularities, which are typical statistical effects arising from random sampling fluctuations.
Figure 12.
KDE curves of responses for three structures: Peak von Mises stress of the Large Aluminum Plate (a), PCB (b) and Small Aluminum Plate (c). Acceleration amplitude of the Large Aluminum Plate (d), PCB (e) and Small Aluminum Plate (f). Green/orange/blue lines correspond to subsets U/S/M, and solid/dashed lines to locations A/B.
Due to the limited sample size of each subset (30 data points), the Box–Cox transformation is applied to each set of response data to better approximate normality. The 90% probability interval is then computed in the transformed space and inverse-transformed to the original scale using Equations (19) and (20), yielding the dispersion level in dB, which characterizes the dispersion and randomness of the structural response.
For the baseline, a subset of 30 SRS-similar signals from the universal set U is extracted. The 90% probability intervals and dispersion levels of the structural peak von Mises stress responses are summarized in Table 5 (subset U). This subset yields a mean dispersion level of 3.09 dB across all measurement points, which is higher than the mean calculated for the full 1000-signal set. This increase is mainly due to the statistical fluctuations inherent in small sample sizes: with fewer data points, the calculated mean and standard deviation are more susceptible to random variation, which can lead to broader probability intervals and thus a higher dispersion level.
Table 5.
Statistical summary of stress response dispersion levels across measurement points from three subsets.
To examine the influence of shock signal time-domain features (subset S) on response distribution, the peak von Mises stress responses for each sample are analyzed, and their 90% probability interval bounds and dispersion level are calculated. As shown in Table 5 (subset S), dispersion level across the six measurement points ranges from 2.32 to 3.46 dB (mean: 2.85 dB), indicating significant dispersion in the simulated responses and poor test equivalence. These results indicate that for shock signals with a total duration of 20 ms, constraining their time-domain features (effective duration and amplitude) has only a limited effect on the dispersion of structural responses. In other words, equivalence of shock excitations cannot be fully guaranteed by the time-domain features of the excitation signals.
For subset M, which includes shock signals with similar dual-spectrum features, Table 5 shows that both dispersion level and standard deviations are markedly reduced compared to those from the subset U and subset S. This indicates that employing dual-spectrum criteria effectively reduces the dispersion of simulated responses, thereby improving test equivalence. The dispersion level narrows to 1.48–2.62 dB (mean: 2.07 dB), reflecting a 33% reduction in variability compared to the 3.09 dB mean from traditional SRS-based criteria. These findings demonstrate that the dual-spectrum criteria, integrating SRS and SSI, substantially improve the consistency of simulated responses. The test equivalence of shock excitation can be further enhanced by aligning the SSI curves to a standard stricter than the current tolerance used for subset M.
Table 6 shows the 90% probability intervals and dispersion levels calculated from the structural acceleration amplitude response for each subset. The results are consistent with the peak von Mises stress response analysis presented in Table 5. Across all measurement points, the mean dispersion levels for subsets U, S, and M are 3.61 dB, 3.72 dB, and 2.09 dB, respectively. The mean dispersion level of 2.09 dB for subset M represents a 42% reduction compared to the mean of 3.61 dB for subset U, which is defined using traditional SRS-based criteria. The results also confirm that the dual-spectrum criteria, integrating SRS and SSI, significantly improve the consistency of simulated responses, thereby enhancing test equivalence.
Table 6.
Statistical summary of acceleration response dispersion levels across measurement points from three subsets.
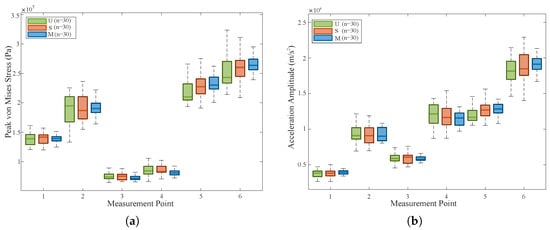
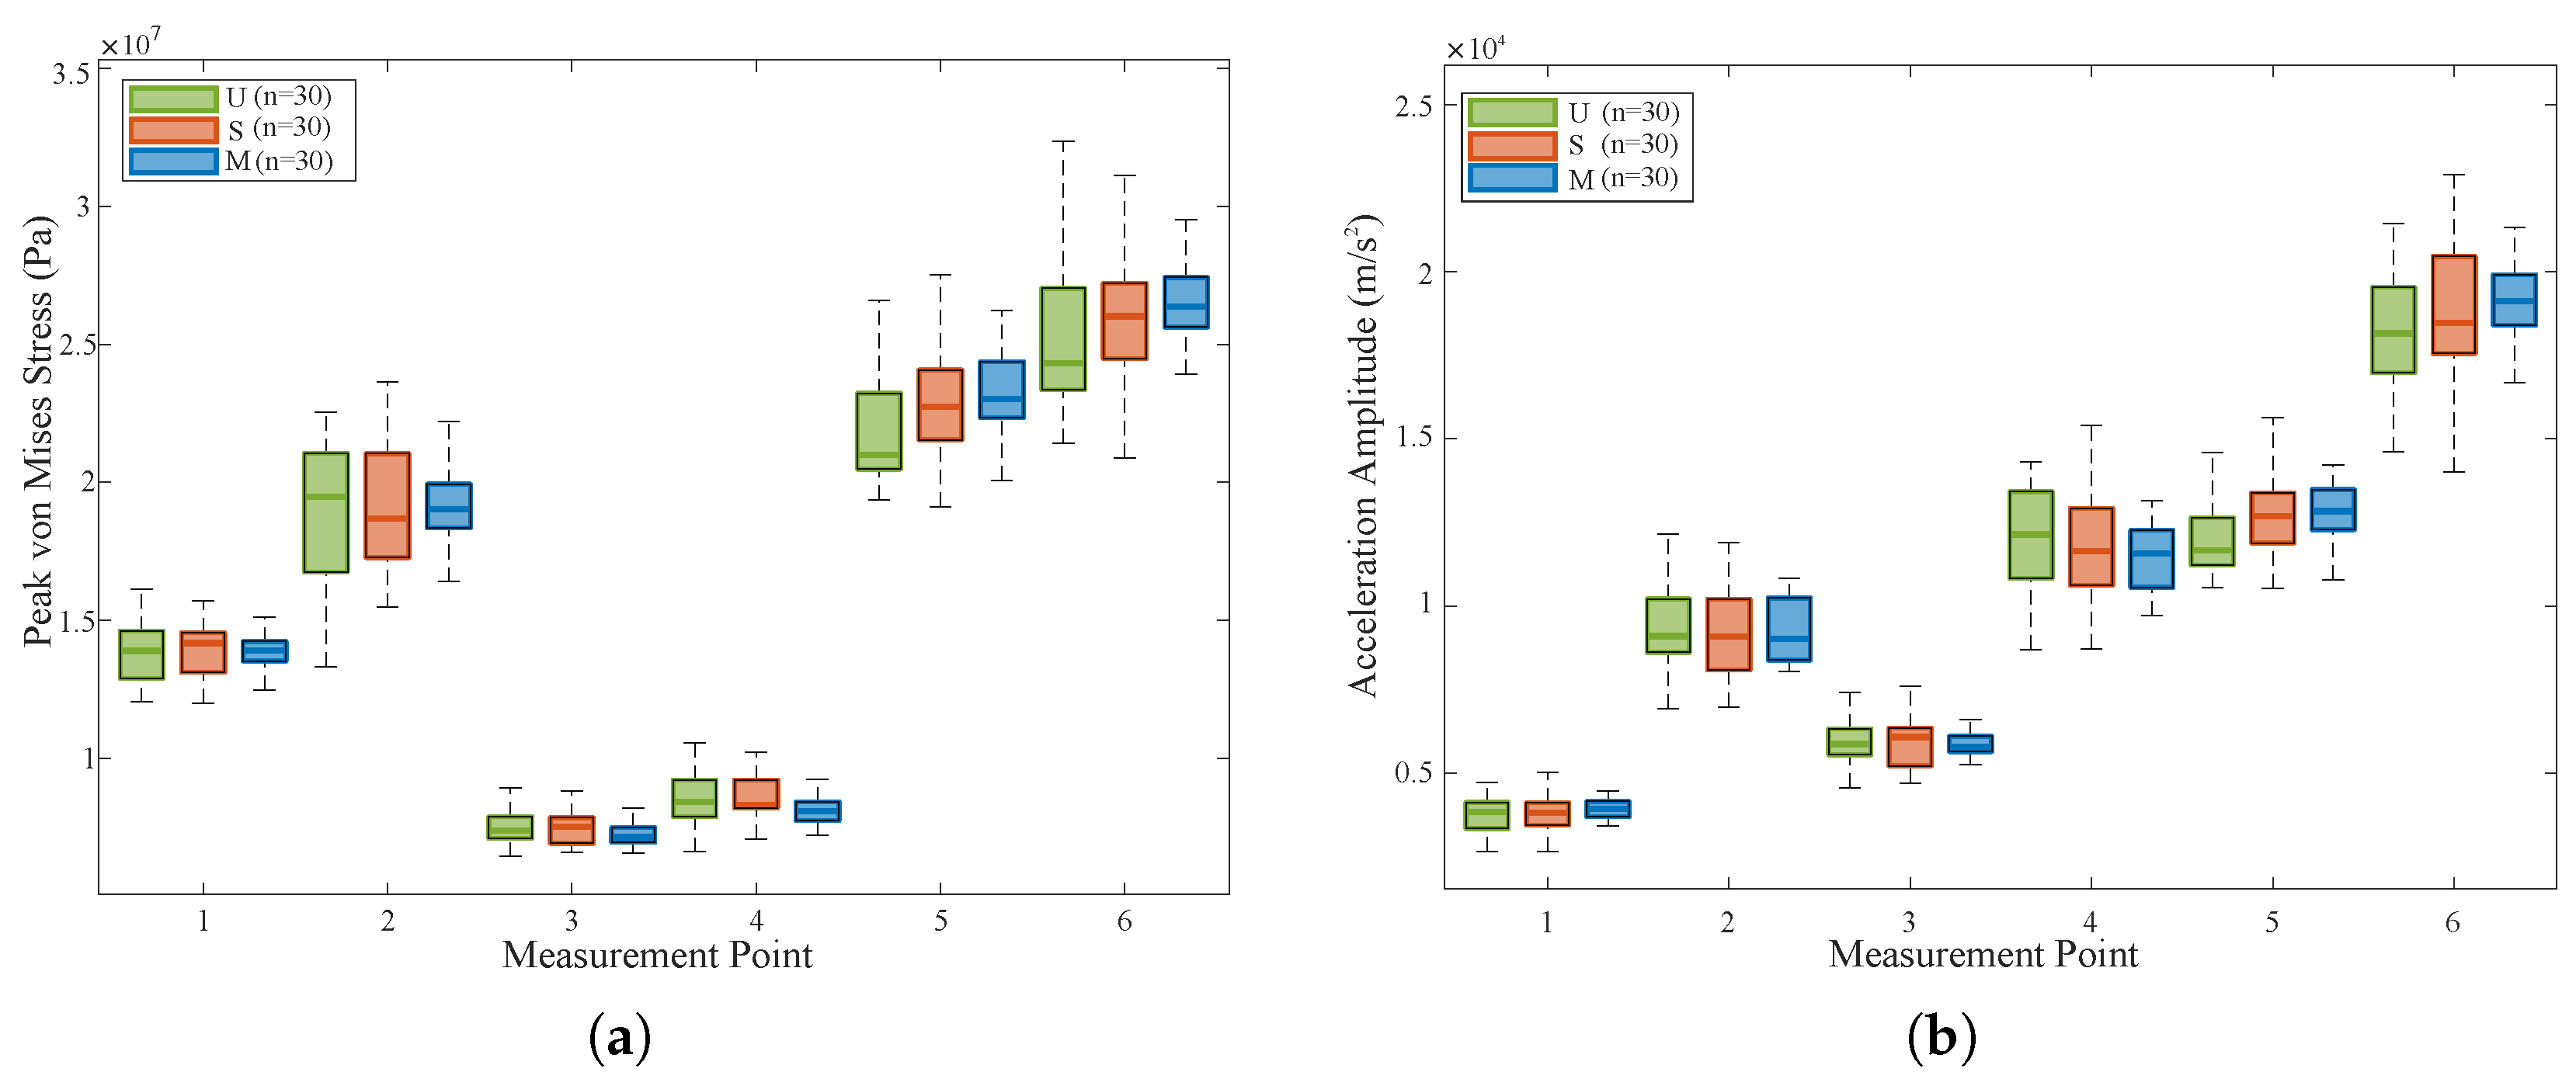
Figure 13a and Figure 13b quantify, respectively, the dispersion of the peak von Mises stresses and acceleration amplitudes at six measurement points for the three different signal subsets. Comparative analysis reveals that when the structure is subjected to shock loads from the dual-spectrum matched subset M, the distribution of structural responses exhibits a distinct convergence trend. In shock engineering, the dispersion of responses directly dictates the reliability of test equivalence. The convergence of the simulated response distribution demonstrates that, for the same target shock environment, the dual-spectrum matching method can significantly improve the consistency of structural responses, resulting in more concentrated predictions. This substantially reduces the risk of under-testing, thereby achieving higher equivalence in practical applications. Consequently, this convergence phenomenon serves as direct evidence for the superior robustness of the dual-spectrum method in test equivalence.
Figure 13.
Comparison of peak von Mises stress and acceleration amplitude distributions at six measurement points among three subsets: (a) Peak von Mises stress. (b) Acceleration amplitude.
3.4.3. Statistical Significance Assessment via Bootstrap Resampling
To assess whether the observed reductions in response dispersion are statistically significant or merely due to random sampling fluctuations, a resampling-based significance test is employed. For the random subset U, 30 signals are randomly drawn from the remaining 940 signals without replacement in each of 1000 independent replications. For the fixed subsets S and M, Bootstrap samples are generated by resampling with replacement from their respective 30 signals, also repeated 1000 times. These procedures construct the empirical distribution of the dispersion metric L for each subset. Table 7 summarizes the mean dispersion levels and the associated 95% confidence intervals for each subset. The significance of differences between subsets is evaluated by the proportion of Bootstrap replications in which the observed difference is reversed, which serves as the p for each comparison.
Table 7.
The 95% Bootstrap confidence intervals for the mean dispersion L of each subset.
Table 8 and Table 9 summarize the Bootstrap results for stress and acceleration responses, respectively. For the stress response, subset M exhibits significantly lower dispersion than subset U, with a mean reduction of 0.60 dB (95% CI: dB; ). In contrast, the difference between subset S and subset U is not statistically significant (), confirming that constraining temporal features (effective duration and amplitude) does not systematically improve test equivalence. For the acceleration response, the results are consistent. Subset M shows significantly lower dispersion than subset U (mean reduction: 1.03 dB; 95% CI: dB; ). No significant difference is found between subset S and subset U (). These Bootstrap results confirm that the reduction in response dispersion achieved by the SRS-SSI dual-spectrum criteria is robust and statistically significant, whereas the constraints on temporal features do not provide a meaningful improvement in test equivalence.
Table 8.
Bootstrap significance test results for stress response.
Table 9.
Bootstrap significance test results for acceleration response.
4. Conclusions
This article aimed to establish a more accurate and robust method for analyzing test equivalence in pyroshock environments, thereby addressing the limitations of conventional SRS methods. The main conclusions are as follows:
- The conventional SRS-based standard has inherent limitations. Although shock signals share identical SRS, structural responses exhibit significant variability, with peak von Mises stress and acceleration amplitude dispersing 2.77 dB and 3.28 dB on average, a range comparable to standard safety margins. This demonstrates substantial, normally distributed dispersion, indicating that SRS consistency alone provides limited equivalence between the simulated test and the actual shock environment in terms of damage potential. Thus, relying solely on SRS is insufficient for achieving precise and optimal test equivalence.
- Current shock test standards emphasize matching time-domain features (such as effective duration and amplitude), given their perceived role in shock-induced failure. However, the results of this study reveal that millisecond-level differences in effective duration have a minimal impact.
- The dual-spectrum (SRS-SSI) method reduces the structural response stress and acceleration dispersion by 33% and 42%, lowering the mean values to 2.07 dB and 2.09 dB, respectively. Bootstrap significance testing further confirms that these reductions are highly statistically significant ( for M vs. U), whereas constraining temporal features (effective duration and amplitude) yields no significant improvement over random selection ( for S vs. U in both responses). The improved method thus enhances test equivalence compared to the conventional single-SRS method, providing a more reliable criterion for equipment qualification.
- The proposed workflow—signal synthesis, screening, feature extraction, scripted finite element simulation, and statistical analysis—enables efficient large-scale, data-driven equivalence analysis between actual environments and simulated tests. This methodology provides a quantitative basis for refining shock test specifications: it reduces response uncertainty from a level that could potentially consume a substantial portion of the design margin to a more controllable and predictable range, thereby offering a more reliable experimental foundation for the qualification and certification of aerospace equipment.
- It should be noted that the present study is based on the assumption of linear elasticity, which serves as a reasonable starting point for shock equivalence investigations. For structures with complex geometric features—such as stiffened panels or box-type structures—or those exhibiting nonlinear effects (e.g., gaps, friction, or contact nonlinearities), the response mechanisms are considerably more complex, and the applicability of the conclusions drawn herein warrants further validation. These aspects have been identified as valuable directions for future research.
Author Contributions
Conceptualization, Methodology, Investigation, Validation, Data Curation, Writing—Original Draft Preparation, J.H.; Project Administration, Funding Acquisition, M.Z.; Conceptualization, Investigation, P.X. and Y.L.; Writing—Review and Editing, Supervision, Project Administration, Funding Acquisition, Y.Y. All authors have read and agreed to the published version of the manuscript.
Funding
This research was supported by the National Natural Science Foundation of China (Nos. 12302487 and U2241274), the Suzhou Leading Talents Program for Innovation and Entrepreneurship, China (No. ZXL2023160), and the Basic Research Program of Taicang, China (No. TC2023JC07).
Institutional Review Board Statement
Not applicable.
Informed Consent Statement
Not applicable.
Data Availability Statement
Some or all data that support the findings of this study are available from the corresponding author upon reasonable request.
Conflicts of Interest
The authors declare no conflicts of interest.
Abbreviations
The following abbreviations are used in this manuscript:
| FEM | Finite Element Method |
| SRS | Shock Response Spectrum |
| GA | Genetic Algorithm |
| MDOF | Multi-Degree-of-Freedom |
| SSI | Shock Severity Infimum |
| RMS | Root Mean Square |
| SDOF | Single-Degree-of-Freedom |
| SVD | Singular Value Decomposition |
| RMSE | Root Mean Square Error |
| Probability Density Function | |
| KDE | Kernel Density Estimation |
References
- Wang, X.; Qi, Y.; Li, Z.; Qin, Z.; Yu, T.; Ding, J.; Chu, F. A Comparative Study of DWT and EEMD Methods for Validation and Correction of Pyroshock Data. J. Aerosp. Eng. 2022, 35, 04022061. [Google Scholar] [CrossRef] [Scilit]
- Choi, S.; Kwon, S.; Lee, S.-E.; Moon, M.-A. Shock Response of Precision Linear Shaped Charge in a Multistage Rocket System. Int. J. Aeronaut. Space Sci. 2022, 24, 92–104. [Google Scholar] [CrossRef] [Scilit]
- ECSS-E-HB-32-25A; Space Engineering: Mechanical Shock Design and Veriffcation Handbook, 1st ed. European Cooperation for Space Standardization (ECSS): Noordwijk, The Netherlands, 2015.
- Zhao, H.; Ding, J.; Zhu, W.; Sun, Y.; Liu, Y. Shock response prediction of the typical structure in spacecraft based on the hybrid modeling techniques. Aerosp. Sci. Technol. 2019, 89, 460–467. [Google Scholar] [CrossRef] [Scilit]
- Lee, J.; Hwang, D.-H.; Jang, J.-K.; Kim, D.-J.; Lee, Y.; Lee, J.-R.; Han, J.-H. Pyroshock Prediction of Ridge-Cut Explosive Bolts Using Hydrocodes. Shock Vib. 2016, 2016, 1218767. [Google Scholar] [CrossRef] [Scilit]
- Kim, Y.-W.; Jang, J.-K.; Lee, J.-R. Pyroshock Acceleration Field Reconstruction in Temporal and Spectral Domains Based on Laser Shock Scanning and Iterative Decomposition and Synthesis Considering Stop Band Effects. Shock Vib. 2017, 2017, 8351791. [Google Scholar] [CrossRef] [Scilit]
- Kim, Y.-W.; Jang, J.-K.; Lee, J.-R.; Gim, H.-S.; Green, I. Hybrid Method of Modal Analysis and Laser Shock Scanning to Visualize the Pyroshock Propagation in a Tension Joint. Shock Vib. 2019, 2019, 4389595. [Google Scholar] [CrossRef] [Scilit]
- Hwang, D.-H.; Park, H.-S.; Han, J.-H. Development of a miniature point source pyroshock simulator. J. Sound. Vib. 2020, 481, 115438. [Google Scholar] [CrossRef] [Scilit]
- Lee, J.; Hwang, D.-H.; Han, J.-H. Study on pyroshock propagation through plates with joints and washers. Aerosp. Sci. Technol. 2018, 79, 441–458. [Google Scholar] [CrossRef] [Scilit]
- Kim, B.-S.; Lee, J. Development of Impact Test Device for Pyroshock Simulation Using Impact Analysis. Aerospace 2022, 9, 407. [Google Scholar] [CrossRef] [Scilit]
- Viale, L.; Daga, A.P.; Fasana, A.; Garibaldi, L. On pyroshock tests for aerospace equipment qualification: A comprehensive parametric model for the simulation and the design of pyroshock test facilities. Int. J. Impact Eng. 2023, 180, 104697. [Google Scholar] [CrossRef] [Scilit]
- Zhao, H.; Liu, W.; Ding, J.; Sun, Y.; Li, X.; Liu, Y. Numerical study on separation shock characteristics of pyrotechnic separation nuts. Acta Astronaut. 2018, 151, 893–903. [Google Scholar] [CrossRef] [Scilit]
- Wang, X.; Qin, Z.; Ding, J.; Chu, F. Finite element modeling and pyroshock response analysis of separation nuts. Aerosp. Sci. Technol. 2017, 68, 380–390. [Google Scholar] [CrossRef] [Scilit]
- Zhao, H.; Hao, Z.; Liu, W.; Ding, J.; Sun, Y.; Zhang, Q.; Liu, Y. The shock environment prediction of satellite in the process of satellite-rocket separation. Acta Astronaut. 2019, 159, 112–122. [Google Scholar] [CrossRef] [Scilit]
- Yan, H.; Qin, Z.; Chu, F.; Zhang, W.; Yang, Z.; Ming, A.; Wang, X. Dynamic Response of Aluminum Honeycomb Panels to High-Frequency Laser Shock Excitations. J. Spacecr. Rocket. 2020, 57, 198–201. [Google Scholar] [CrossRef] [Scilit]
- Wang, X.; Liu, W.; Ding, J.; Sun, Y.; Dang, Y. Pyroshock Response Prediction of Spacecraft Structure in Wide Frequency Domain Based on Acceleration FRF. Aerospace 2022, 9, 54. [Google Scholar] [CrossRef] [Scilit]
- Hemez, F.M.; Doebling, S.W. From Shock Response Spectrum to Temporal Moments and Vice-Versa. In Proceedings of the 21st SEM International Modal Analysis Conference (IMAC-XXI), Kissimmee, FL, USA, 3–6 February 2003. [Google Scholar]
- Hale, M.T.; Adhami, R. Time-Frequency Analysis of Shock Data with Application to Shock Response Spectrum Waveform Synthesis. In IEEE Proceedings of the SOUTHEASTCON’91; IEEE: Piscataway, NJ, USA, 1991; pp. 213–217. [Google Scholar]
- NASA/TM-2008-215253; An Alternative Method of Specifying Shock Test Criteria. National Aeronautics and Space Administration (NASA): Washington, DC, USA, 2008.
- Soize, C. Information Theory for Generation of Accelerograms Associated with Shock Response Spectra. Comput.-Aided Civ. Infrastruct. Eng. 2010, 25, 334–347. [Google Scholar] [CrossRef] [Scilit]
- Hwang, J.H.-J.; Duran, A. Stochastic shock response spectrum decomposition method based on probabilistic definitions of temporal peak acceleration, spectral energy, and phase lag distributions of mechanical impact pyrotechnic shock test data. Mech. Syst. Sig. Process. 2016, 76, 424–440. [Google Scholar] [CrossRef] [Scilit]
- Chong, S.Y.; Lee, J.R.; Kong, C.W. Shock Response Spectra Reconstruction of Pointwise Explosive-Induced Pyroshock Based on Signal Processing of Laser Shocks. Shock Vib. 2014, 2014, 695836. [Google Scholar] [CrossRef] [Scilit]
- Brake, M.R. An inverse shock response spectrum. Mech. Syst. Sig. Process. 2011, 25, 2654–2672. [Google Scholar] [CrossRef] [Scilit]
- Alexander, J.E. A New Method to Synthesize a Shock Response Spectrum Compatible Base Acceleration to Improve Multi-Degree of Freedom System Response. Ph.D. Thesis, University of Minnesota, Minneapolis, MN, USA, November 2015. [Google Scholar]
- Monti, R.; Gasbarri, P. Dynamic load synthesis for shock numerical simulation in space structure design. Acta Astronaut. 2017, 137, 222–231. [Google Scholar] [CrossRef] [Scilit]
- Liu, J.; Yang, L.; Zhang, X.; Yan, R.; Chen, X.; Castejón, C. Intelligent Time-Domain Parameters Matching for Shock Response Spectrum and Its Experimental Validation in Active Vibration Control Systems. Shock Vib. 2019, 2019, 2920845. [Google Scholar] [CrossRef] [Scilit]
- Sun, W.; Huang, Y.; Chen, H. An Improved Adaptive Genetic Algorithm for Optimizing Pyroshock Acceleration Synthesis. IEEE Access 2019, 7, 132682–132693. [Google Scholar] [CrossRef] [Scilit]
- Yan, Y.; Li, Q.M. A general shock waveform and characterisation method. Mech. Syst. Sig. Process. 2020, 136, 106508. [Google Scholar] [CrossRef] [Scilit]
- Song, W.; Wang, R.; Lin, P.; Liu, M.; Wu, J.; Zhang, B.; Gu, Y.; Xie, P. Research on Optimal Algorithm for Time-domain Synthesis of Shock Response Spectrum Based on Continuous Second Derivative. Environ. Earth Sci. 2021, 632, 032039. [Google Scholar] [CrossRef] [Scilit]
- Yan, Y.; Li, Q.M. A pyroshock signal characterization method based on shock-waveform dictionary. Int. J. Mech. Sci. 2023, 249, 108251. [Google Scholar] [CrossRef] [Scilit]
- NASA-STD-7003A; Pyroshock Test Criteria. National Aeronautics and Space Administration (NASA): Washington, DC, USA, 2011.
- MIL-STD-810H; Department of Defense Test Method Standard: Environmental Engineering Considerations and Laboratory Tests, Method 516.8: Shock. United States Department of Defense: Washington, DC, USA, 2019.
- Sisemore, C.; Babuška, V. The Science and Engineering of Mechanical Shock, 3rd ed.; Springer Nature: Cham, Switzerland, 2020. [Google Scholar]
- Lalanne, C. Mechanical Shock, 2nd ed.; ISTE Ltd.: London, UK; John Wiley & Sons, Inc.: Hoboken, NJ, USA, 2009. [Google Scholar]
- García-Pérez, A.; Sorribes-Palmer, F.; Alonso, G.; Ravanbakhsh, A. Overview and application of FEM methods for shock analysis in space instruments. Aerosp. Sci. Technol. 2018, 80, 572–586. [Google Scholar] [CrossRef] [Scilit]
- Li, B.W.; Li, Q.M. Damage boundary of structural components under shock environment. Int. J. Impact Eng. 2018, 118, 67–77. [Google Scholar] [CrossRef] [Scilit]
- Zhang, Z.; Xu, Z.; Shao, X.; Li, Y.; Li, B. Damage boundary of piezoresistive pressure sensor under shock environment. Acta Astronaut. 2022, 192, 328–340. [Google Scholar] [CrossRef] [Scilit]
- Hou, D.; Li, Q.M. Damage boundaries on shock response spectrum based on an elastic single-degree-of-freedom structural model. Int. J. Impact Eng. 2023, 173, 104435. [Google Scholar] [CrossRef] [Scilit]
- Hou, D.; Li, Q.M. Extension of the shock damage bounds to general shock loads. Int. J. Impact Eng. 2025, 204, 105387. [Google Scholar] [CrossRef] [Scilit]
- Yang, C.; Li, Q.M. Dual damage criteria in a crash stop. Int. J. Mech. Sci. 2020, 183, 105732. [Google Scholar] [CrossRef] [Scilit]
- Dang, Y.; Sun, Y.; Hao, Z.; Zhang, Q.; Liu, W.; Yang, C. Shock fatigue damage failure boundary study of BGA solder joints based on shock response spectrum. Int. J. Fatigue 2024, 182, 108214. [Google Scholar] [CrossRef] [Scilit]
- Yan, Y.; Li, Q.M. Metric of shock severity. Proc. R. Soc. A Math. Phys. Eng. Sci. 2020, 476, 20190694. [Google Scholar] [CrossRef] [Scilit]
- Alexander, J.E. The Shock Response Spectrum—A Primer. In Proceedings of the IMAC-XXVII: Conference on Structural Dynamics, Orlando, FL, USA, 9–12 February 2009; pp. 6–15. [Google Scholar]
- Nasr, M.; Brzostowski, K.; Obuchowicz, R.; Abd El-Samie, F.E.; Piórkowski, A. Comparative analysis of noise estimation methods in computed tomography images: Histogram analysis, L2 norm, SSIM, and CNN-based classification with ResNet50. Digit. Signal Process. 2025, 166, 105242. [Google Scholar] [CrossRef] [Scilit]
- Inani, H.; Mehta, V.; Bhavsar, D.; Gupta, R.K.; Jain, A.; Akhtar, Z. AI-enabled dental caries detection using transfer learning and gradient-based class activation mapping. J. Ambient Intell. Humaniz. Comput. 2024, 15, 3009–3033. [Google Scholar] [CrossRef] [Scilit]
- Qin, J.; Wang, J.; Follmann, D. Bootstrap Box-Cox Transformation Likelihood Ratio Confidence Intervals for the Median in Small Sample Problems. Stat. Biosci. 2025, 18, 271–287. [Google Scholar] [CrossRef] [Scilit]

Disclaimer/Publisher’s Note: The statements, opinions and data contained in all publications are solely those of the individual author(s) and contributor(s) and not of MDPI and/or the editor(s). MDPI and/or the editor(s) disclaim responsibility for any injury to people or property resulting from any ideas, methods, instructions or products referred to in the content. |
© 2026 by the authors. Licensee MDPI, Basel, Switzerland. This article is an open access article distributed under the terms and conditions of the Creative Commons Attribution (CC BY) license.