


Abstract
This study presents the results of a detailed investigation of earthquake focal zones in Eastern Kazakhstan using modern methodologies for determining focal parameters and focal mechanisms. The stress regime and the elastic stress field of the Earth’s crust were analyzed based on seismic events recorded during the period 1990–2020. An information base was established for the investigation of regional deformation conditions using earthquake focal mechanism catalogs and data acquired from the regional seismological monitoring network. The installation of new seismic stations along the perimeter of Kazakhstan has enabled a more detailed investigation of seismicity in Eastern Kazakhstan and an assessment of the stress–strain state of the deep layers of the Earth’s crust in the region and adjacent territories. An electronic database of stress tensor parameters and seismotectonic deformation increments was developed using the method of cataclastic analysis of seismic data implemented in the STRESS seismic software package. The stress–strain state of the Earth’s crust was analyzed based on the spatial distribution of stress tensor parameters and seismotectonic strain increments. Zones characterized by contrasting stress regimes were identified, along the boundaries of which strong earthquake sources are most likely to occur. Analysis of the orientations of the principal stress axes indicates a reset-type stress regime.
1. Introduction
The Eastern Kazakhstan Region (EKR) is one of the largest industrial, energy, logistics, and cultural regions of the Republic of Kazakhstan (RK). The region hosts well-developed non-ferrous metallurgy, automotive and instrumentation engineering, mining, energy production, construction, timber and woodworking, as well as light and food industries. Eastern Kazakhstan also contains the largest metallogenic province in Central Asia—the Altai metallogenic province (Ore Altai)—whose subsurface resources include significant reserves of mercury, silver, tungsten, tin, zinc, lead, gold, and rare metals [1,2,3,4,5,6,7]. The foothill plains of the Ore Altai Mountains are the most favorable areas for diverse economic activities; however, following the strong Zaisan earthquake of 1990, these areas were classified as zones of high seismic hazard [8,9,10,11,12,13].
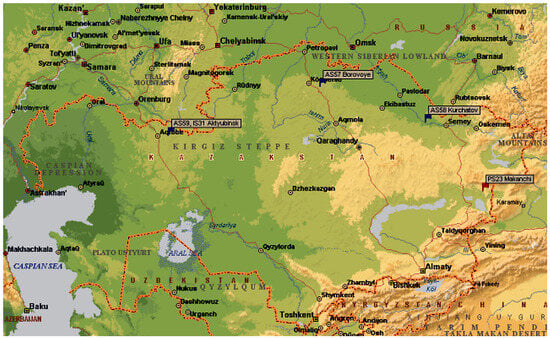
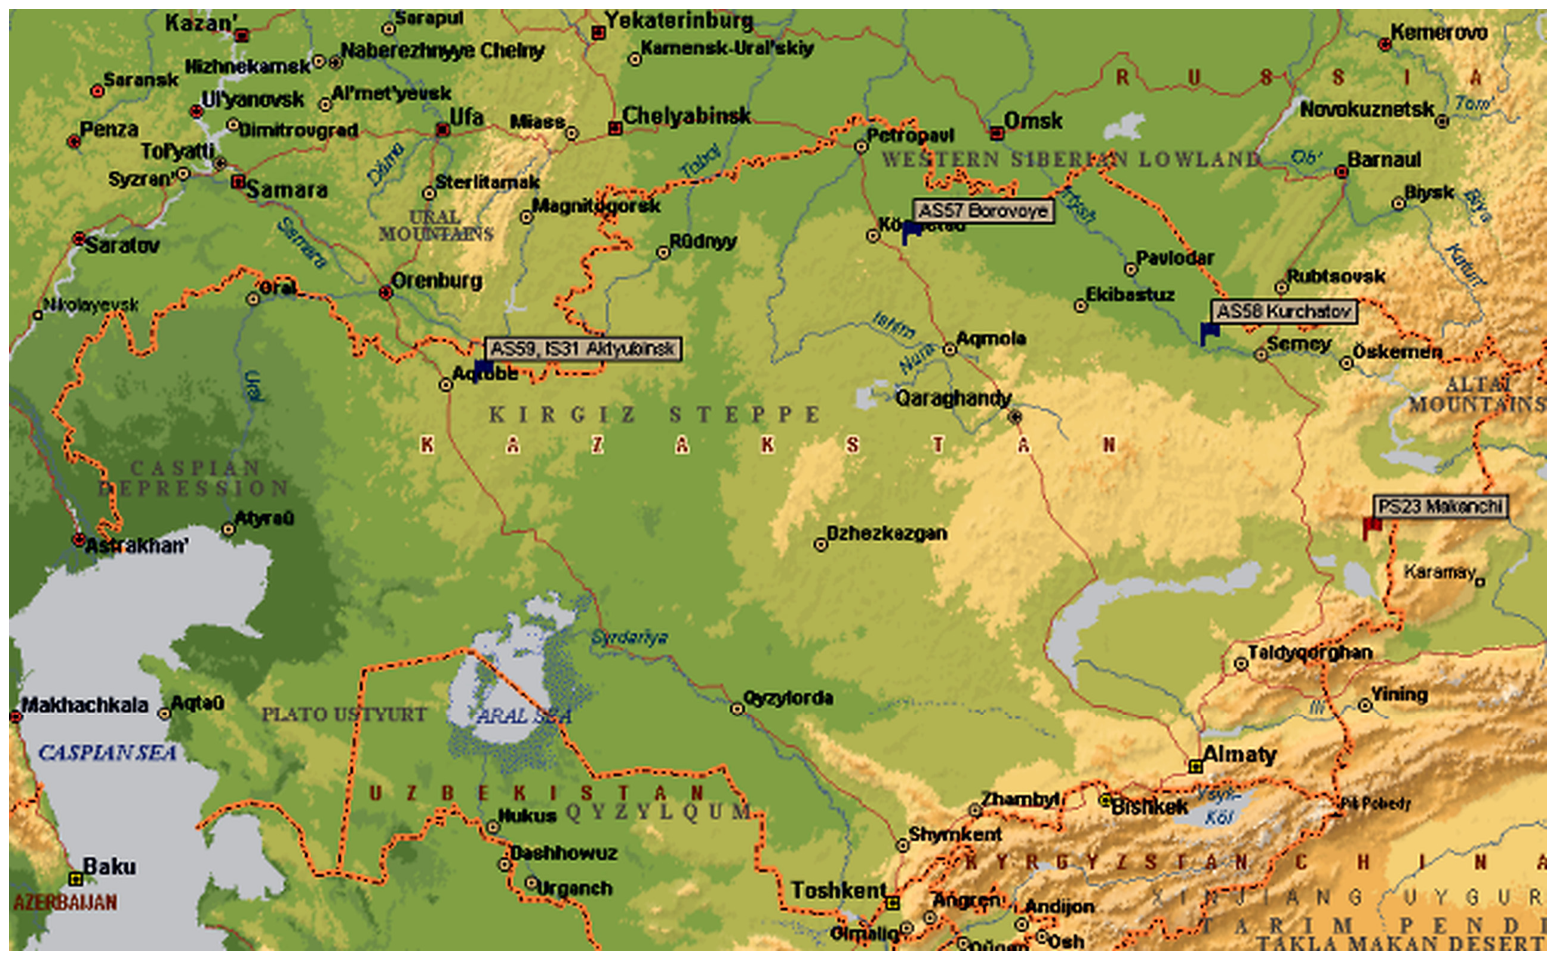
Until the 1990s, it was widely believed that active natural seismicity within the territory of the RK was confined to the southern and southeastern regions, primarily in the mountainous areas of the Northern Tien Shan and Dzungaria [14,15,16,17]. This perception was largely influenced by the dense seismic station network operating in these regions. From a seismological perspective, Eastern Kazakhstan remained largely uncharacterized until recently. Following the strong Zaisan earthquake of 1990 (Table 1), the Seismological Experimental-Methodical Expedition (SOME) of the Ministry of Emergency Situations of the RK established an additional regional seismic network, “Zaisan,” equipped with modern digital stations of a new generation. These stations were integrated into international seismological monitoring systems and became operational under the supervision of the Institute of Geophysical Research of the National Nuclear Center of the RK (IGI NNC RK) (Figure 1) [18,19,20,21].
Table 1.
Seismological parameters of the main shock and strongest aftershocks of the 1990 Zaisan earthquake (compiled from Nurmagambetov et al. [12].
Figure 1.
Seismic stations of the International Monitoring System in Kazakhstan.
The earthquake focal mechanism (EFM) is one of the most important parameters characterizing a seismic event. In modern seismology, it is associated with the sudden displacement of rock masses accompanied by the propagation of seismic waves along zones of mechanical weakness in the deeper layers of the Earth’s crust. Detailed analysis of EFMs provides information on the spatial orientation of the principal stress axes, the geometry of possible rupture planes, and the sense of motion within the earthquake source [22].
EFM analysis is based on experimental observations of seismic waves generated by both strong and weak earthquakes. These observations are used to determine key source parameters, including the spatial orientation of the two nodal planes, strike azimuths, dip angles, slip vector orientations, and the positions of the orthogonal principal stress axes [23].
Long-term studies of earthquake focal mechanisms have led to the development of methods for determining fault displacement types and their corresponding focal mechanism stereograms. The first motions of seismic waves recorded on seismograms exhibit opposite polarities that follow systematic patterns and depend on the spatial distribution of seismic stations relative to the earthquake epicenter. Based on the distribution of first-motion polarities, regions of compression and dilatation are identified within the framework of the double-couple model, separated by nodal lines. These nodal lines divide the focal sphere into four quadrants, such that adjacent quadrants are characterized by opposite polarities of seismic wave arrivals, whereas diagonally opposite quadrants exhibit the same polarity [24]. As a result, two possible rupture planes are identified within the earthquake source. In addition to the nodal planes, the focal mechanism defines the orientation of the principal compressive and tensile stress axes responsible for fault motion. These stress axes are characterized by their azimuths and by the angles of plunge relative to the horizontal plane [25].
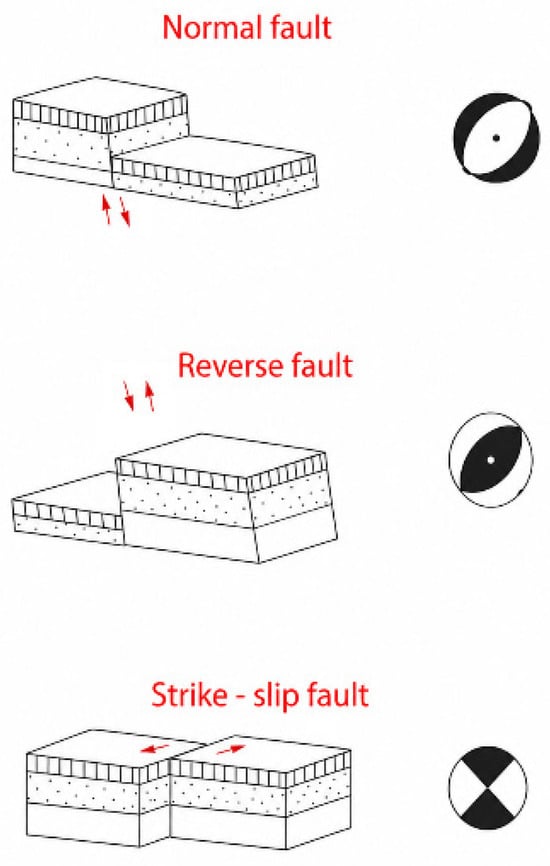
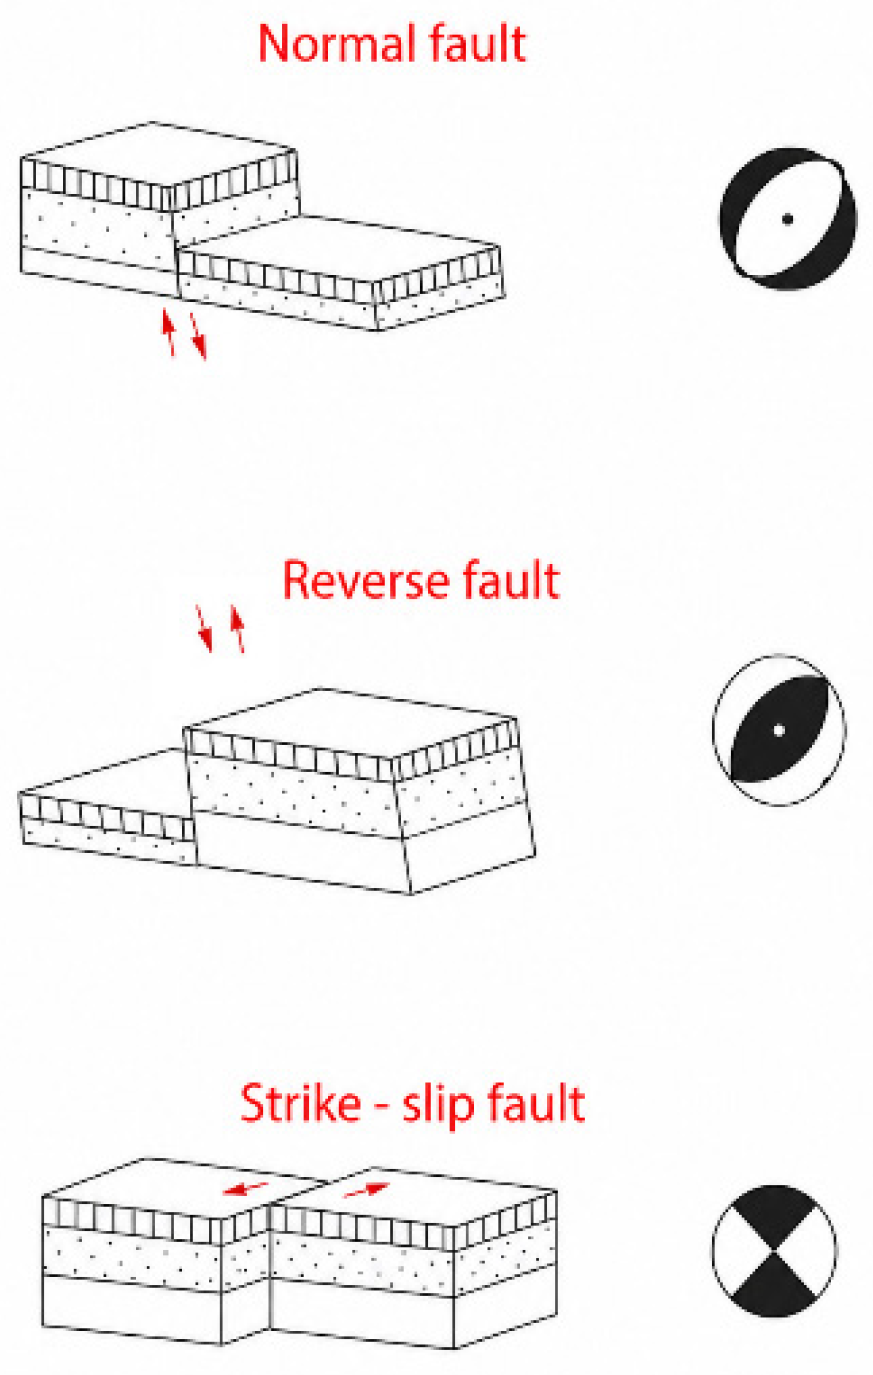
Depending on the orientation of the principal stress axes, several stress regimes of the Earth’s crust can be distinguished. Horizontal tension combined with vertical compression corresponds to a tensional regime; a predominantly horizontal orientation of both principal stress axes characterizes a shear regime; and vertical tension combined with horizontal compression defines a compressional regime. In the first case, the dominant type of fault displacement is normal faulting, in the second case strike-slip faulting, and in the third case thrust (reverse) faulting (Figure 2) [11,26].
Figure 2.
Focal mechanism stereograms and the corresponding main fault displacement types. Red arrows indicate the direction of relative block movement along the fault.
The results of EFM determinations are presented in international-format catalogs [27], which form the basis for the SEISMO database used for further analysis. Catalogs of focal mechanisms for earthquakes with an energy class of K > 9.5 are published in the yearbook Earthquakes of Northern Eurasia [28].
The installation of new seismic stations along the perimeter of the territory of Kazakhstan has enabled a more detailed assessment of seismicity and of the stress–strain state (SSS) of the deep layers of the Earth’s crust in Eastern Kazakhstan and adjacent regions [20,21,29].
The stress regime and the elastic stress field of the Earth’s crust in Eastern Kazakhstan were investigated based on an analysis of seismic events that occurred in the study area during the period 1990–2020. Based on the analysis of more than 100 seismic events, the feasibility of using focal mechanism data to characterize the nature of seismic sources and to establish additional criteria for seismic hazard assessment in a relatively densely populated region with a high concentration of industrial facilities was evaluated.
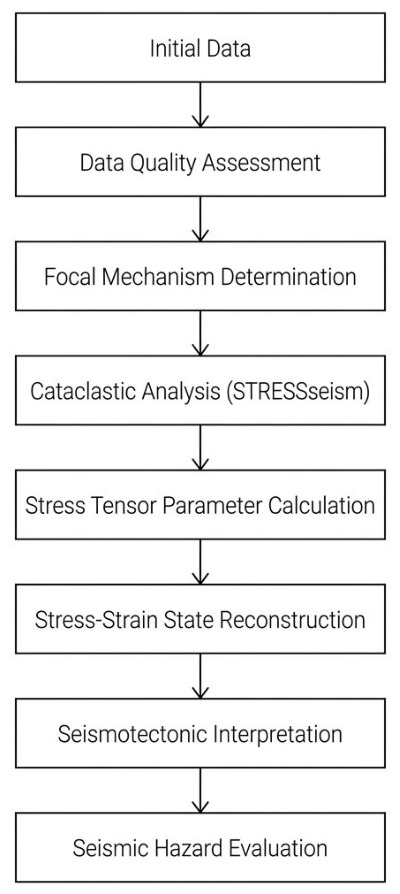
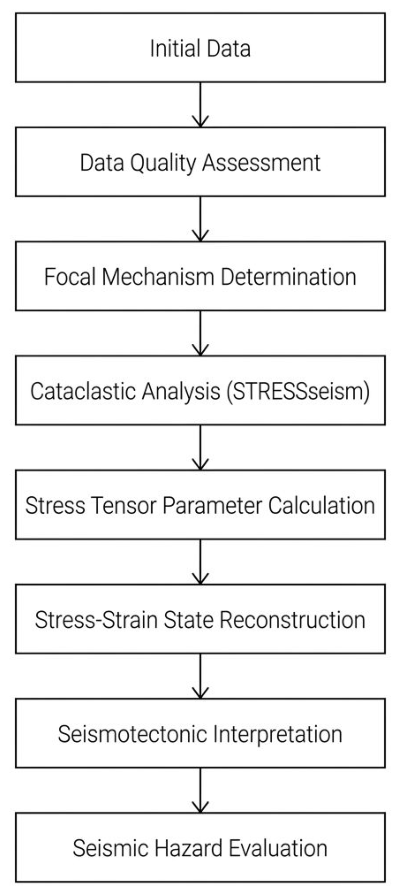
The overall sequence of the research and the methodology applied are presented in Figure 3.
Figure 3.
General workflow for the study of earthquake focal mechanisms and the reconstruction of the stress–strain state of the Earth’s crust in Eastern Kazakhstan.
2. Materials and Methods
To compile a consolidated catalog of earthquake focal mechanisms in international formats and notation, bulletins, catalogs, and published literature on focal mechanisms in the EKR were collected and analyzed. Primary sources included regional focal mechanism catalogs from Kazakhstan, Kyrgyzstan, and China, as well as focal mechanism parameters published in specialized annual publications [18,23]. In addition, catalog data on centroid moment tensor (CMT) solutions produced by international seismological centers and available through the Global CMT Project and the U.S. Geological Survey National Earthquake Information Center were used [30].
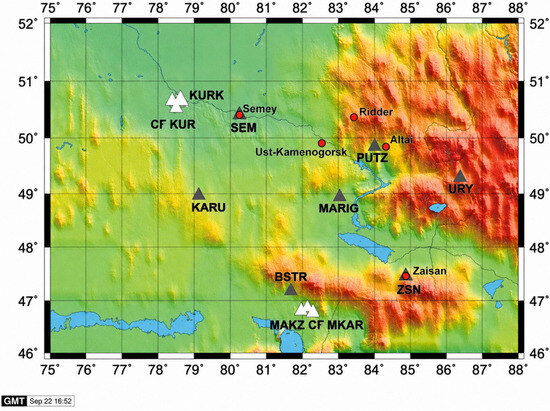
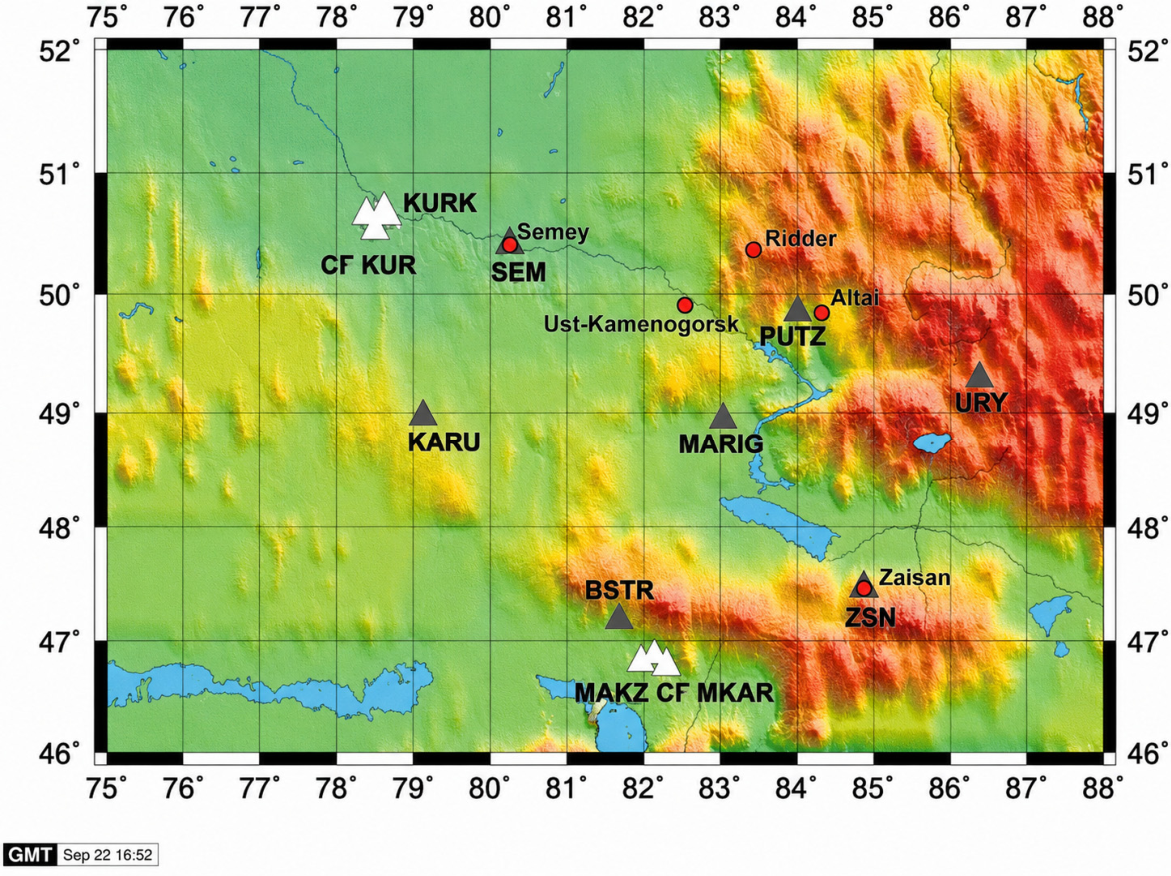
Continuous seismic monitoring in seismically active areas of Southern and Eastern Kazakhstan has been conducted for several decades by seismic stations operated within the network of the Seismological Experimental and Methodological Expedition of the RK, as well as by stations of the Institute of Geophysical Research of the National Nuclear Center of the RK (Figure 4).
Figure 4.
Map showing the locations of modern digital seismic stations in Eastern Kazakhstan. White triangles indicate stations of the IGI NNC RK; gray triangles denote stations of the Seismological Experimental and Methodological Expedition (SOME) of the Ministry of Education and Science of the Republic of Kazakhstan; red circles represent populated areas. The color background represents topographic elevation.
The digital seismic station network of the IGI NNC RK has been developed over recent decades. The primary objectives of this network are the monitoring of nuclear tests and the detection of earthquakes worldwide. IGI NNC RK seismic stations are characterized by favorable conditions for seismic signal recording, owing to the low ambient seismic noise at their locations and the deployment of specialized instrumentation installed in boreholes. Data exchange is conducted between the data processing centers of SOME and IGI, including information on first-arrival polarities from earthquake records as well as the results of EFM determinations. Focal mechanisms of relatively strong earthquakes with energy class K ≥ 9, which provide more reliable information on the SSS of the Earth’s crust, are routinely determined at the IGI Data Center. However, previous studies have demonstrated that statistical analyses of weak seismic events can also yield robust constraints on the characteristics of the SSS [25]. Such data are particularly informative in areas lacking strong earthquakes; therefore, seismic events spanning the full range of energy classes were incorporated into the present study [12,24].
Despite the relatively limited number of focal mechanism solutions, the compiled dataset covers the principal seismically active zones of Eastern Kazakhstan and is representative for regional-scale reconstruction of the stress–strain state. The obtained results reflect the first-order characteristics of the stress regime and are consistent with the major tectonic features of the region [28].
Determination of earthquake source mechanisms was performed using source modeling within the framework of dislocation theory, following the standard method of A.V. Vvedenskaya. This approach allows the determination of nodal planes and first-motion vectors in a stereographic projection of a unit-radius sphere. In Vvedenskaya’s model, the seismic source is represented as a double dipole without net moment, with tangential stress release occurring along two possible slip directions. The intermediate stress responsible for shear strain is assumed to be zero.
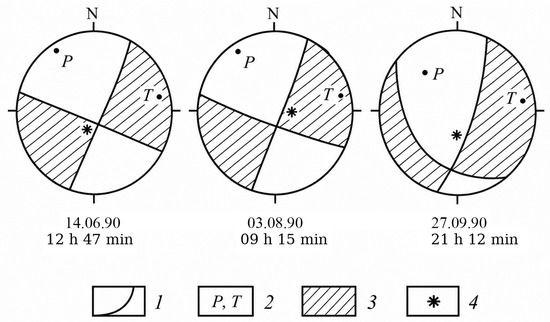
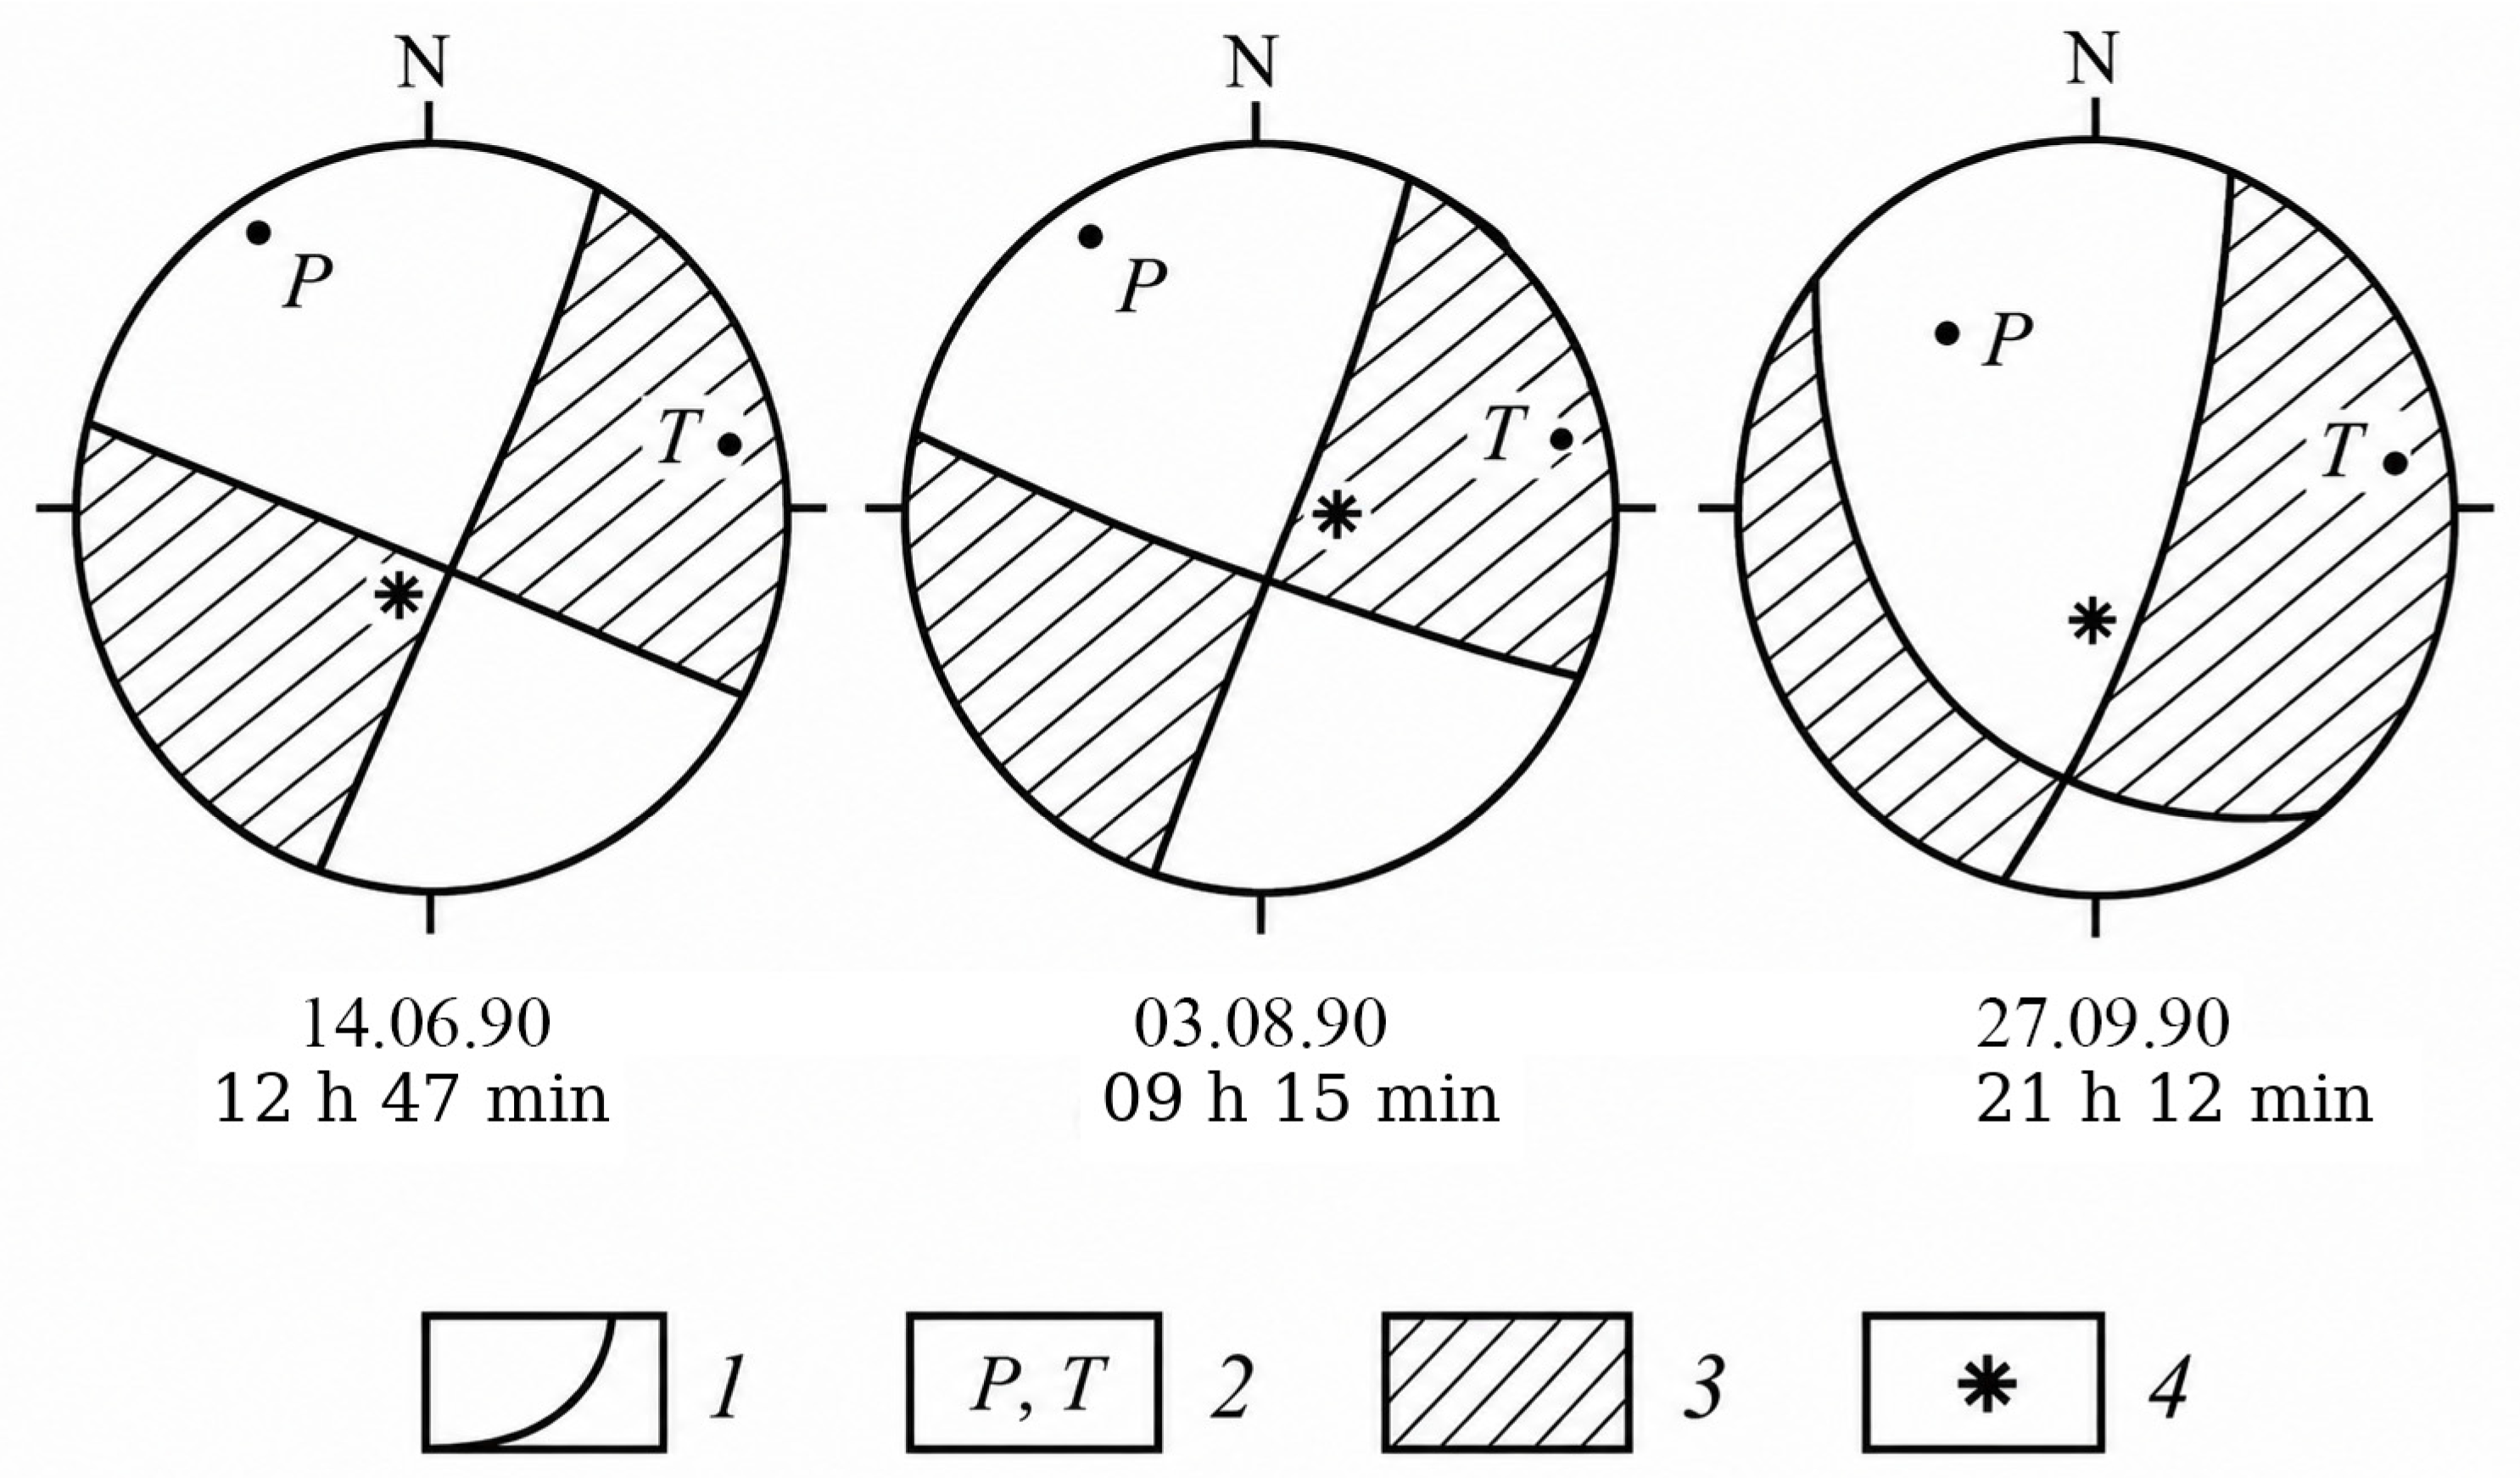
The fields of primary (P-) wave motions reflect the initial rupture displacement; however, they do not capture the entire evolution of rupture propagation. Consequently, extrapolation of first-motion data to the full rupture plane is an assumption. This assumption is supported by observations from classical earthquakes, which show that the orientation of displacements recorded during the initial rupture stage is generally maintained throughout the rupture process [31]. Seismic data typically yield two equally probable orientations for the rupture plane. To select the most likely solution, additional geological or seismological information is incorporated (Figure 5) [12].
Figure 5.
Graphical representation of the focal mechanism of the 1996 Zaisan earthquake, based on [12]. 1: Nodal lines of P-waves; 2: principal stress axes: compressive (P) and tensile (T); 3. regions of compressional first motions; 4. projections of the earthquake source.
The stress conditions in the deep layers of the Earth’s crust, where earthquake foci are generated in the EKR, were investigated using the cataclastic analysis of fault-slip displacements (MKA) method developed by Yu. L. Rebetsky [31]. This approach was applied to obtain EFM data for the reconstruction and analysis of seismotectonic processes in the region. The method allows determination of the principal stress directions (minimum, maximum, and intermediate), evaluation of the type and degree of deformation in the Earth’s crust, and analysis of the relationship between crustal deformation, stress distribution, and regional seismic activity [25,32].
Traditionally, reconstruction of stresses and deformations at earthquake sources is performed using three main groups of methods: structural analysis, dislocation analysis, and quasi-plastic analysis. This classification is based on the principles employed to transition from structural–kinematic data on faults and fractures to the parameters of the corresponding stress tensors [25,33,34]. In structural analysis, this transition relies on the regularities of fracture mechanics, whereas in dislocation analysis it is based on the Batdorf–Budiansky hypothesis of intracrystalline slip [35], which underpinned the early development of plasticity theory. Quasi-plastic methods, in turn, are founded on the principles of modern plasticity theory. The terms quasi-plastic flow and quasi-plastic deformation refer to the accumulation of residual, irreversible deformations that arise from structures within crystalline rocks, including displacements along fractures and cracks, at scales much larger than the size of individual grains or crystals.
Structural analysis methods determine only the orientation of the principal axes of the stress tensor based on structural–kinematic fracture data (SKFD), whereas dislocation and quasi-plastic analysis methods additionally compute the Lode–Nadai coefficient, which characterizes the shape of the stress tensor or seismotectonic strain tensor [36,37]. KFD capture the spatial orientation of shear fracture planes and slip directions for geological data, and nodal planes for seismological earthquake source data. During deformation, a portion of elastic strain is converted into irreversible (residual) deformation, causing dissipation of seismic wave energy during propagation through the Earth. This energy loss reduces wave amplitudes and occurs due to internal friction and interactions between seismic waves and the surrounding material, which convert mechanical energy into thermal energy. Dissipation is an intrinsic aspect of seismic processes and plays a fundamental role in studies of the Earth’s structure [34].
The selection of the cataclastic analysis of fault-slip displacements (MKA) for the EKR is justified by its direct linkage between geological processes (deformation and stresses) and observed seismological phenomena (earthquakes). The method enables the simultaneous and parallel calculation of stress tensor parameters and seismotectonic deformation increments (STD) [38,39]. A key feature of MKA is its ability to determine not only the orientation of the principal stress axes but also the relative magnitudes of the all-round effective pressure (tectonic pressure minus fluid pressure) and the maximum tangential stresses.
The application of the cataclastic analysis method made it possible to move beyond the interpretation of individual earthquake focal mechanisms and reconstruct the regional stress–strain state of the Earth’s crust. As a result, spatial distributions of stress tensor parameters, effective pressure, shear stresses, and increments of seismotectonic deformation were obtained, providing a basis for analyzing the present-day geodynamic conditions of Eastern Kazakhstan.
The MKA methodology is implemented in the STRESS seismological software package (custom non-commercial software; no official version number is available), developed by Y. L. Rebetsky, Institute of Physics of the Earth, Russian Academy of Sciences, Moscow, Russia, and kindly provided by the author. The approach involves creating a homogeneous sample of structural–kinematic fracture data (SKFD), which prevents the calculation of the seismotectonic deformation (STD) tensor during periods of abrupt deformation-phase changes and eliminates the possibility of obtaining zero total strain. Incorporating the latest developments in the field, the method enables determination of both the STD tensor parameters and the full stress tensor at depth in the Earth’s crust in their natural state [40]. This capability is particularly important, as crustal stresses are directly linked to fracture processes and provide a comprehensive characterization of the current stage of deformation.
Using the STRESS seism software environment developed by Yu. L. Rebetsky for analyzing the SSS from earthquake focal mechanisms, it was established that an input file containing the main earthquake parameters and focal mechanism data must be created in a strictly defined format prior to calculations. Consequently, the focal mechanism catalog was adapted for use in the STRESS seism program. Earthquake energy characteristics were represented by mb and Mw magnitudes [41,42,43]. Where necessary, these magnitudes were recalculated using previously established correlation relationships to provide the energy parameters required for the input file. Following Rebetsky’s recommendations, the depth for calculating SSS parameters was chosen as the midpoint of the seismogenic layer. In the EKR, the seismogenic depth ranges from 5 to 30–40 km; based on this range, seismotectonic stress and deformation parameters were calculated at a depth of 20 km [44].
The choice of the average depth is motivated by the need to obtain a generalized characterization of the stress–strain state of the study region. Within the framework of the cataclastic analysis method, the use of the average depth of the seismically active volume is a widely accepted approach for reconstructing first-order regional stress-state parameters. This approach minimizes the influence of local depth variations among individual earthquake hypocenters and ensures the comparability of the obtained results across the entire study area.
The resulting focal mechanism catalogs contain all information in accordance with international formats and designations, requiring no additional conversion. However, the STRESS seism input file does not utilize all EFM parameters; information on the nodal planes is sufficient for the calculations. For each nodal plane, the focal mechanism data include the strike azimuth, dip angle, and relative slip vectors.
For the EKR, all necessary recalculations were performed, and an input *.mek file was generated, containing earthquake parameters for the period 1990–2020. This *.mek file was subsequently used for the calculation of SSS parameters in the STRESS seism software [31]. A fundamental requirement for determining stress tensor parameters and seismotectonic strain increments within the MKA framework is a steady-state deformation mode, in which stresses are assumed to be stable. Based on this requirement, appropriate time intervals were selected through preliminary analysis of the EFM catalog [25]. Consequently, calculations of stress tensor parameters and STD increments for the EKR were performed for the period 1990–2020, following the Zaisan earthquake of 1990 [45].
Analysis of the focal mechanisms of individual earthquakes indicates that the deformation environment during the study period can be considered established [25]. The spatial averaging window for reconstructing SSS parameters was defined according to the settings of the STRESS.map control file. The optimal set of STRESS.map parameter values, determined through testing of six scenarios, is summarized in Table 2.
Table 2.
Parameters of spatial averaging for reconstruction of the SSS in the EKR.
The selection of spatial averaging parameters was carried out through systematic testing of several calculation schemes that differed in the minimum and maximum number of events included in the dataset, the coefficients of the elastic unloading domain, and the radius of spatial averaging. The optimal parameter set was chosen based on its ability to produce a stable spatial distribution of stress–strain state parameters while maintaining sufficient representativeness of the input data. As a result, the parameter combination that provided the most robust and consistent reconstruction results across the study area was selected for further analysis.
It should be noted that the spatial distribution of stress–strain state parameters was derived from the spatial averaging of earthquake focal mechanisms within quasi-homogeneous domains. The reliability of the reconstructed parameters depends on the representativeness of the initial dataset and the density of focal mechanism solutions throughout the study region. Therefore, the resulting maps should be interpreted as reflecting the first-order regional patterns of the stress state rather than detailed local-scale variations.
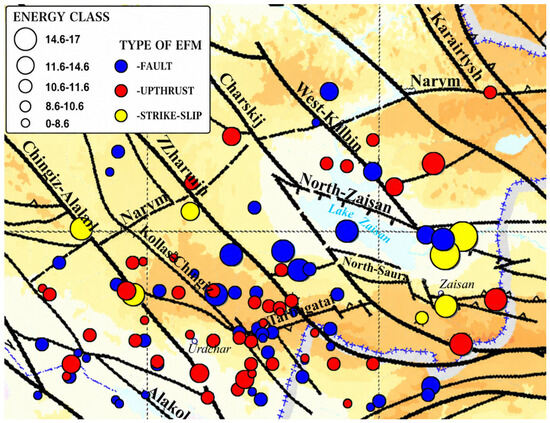
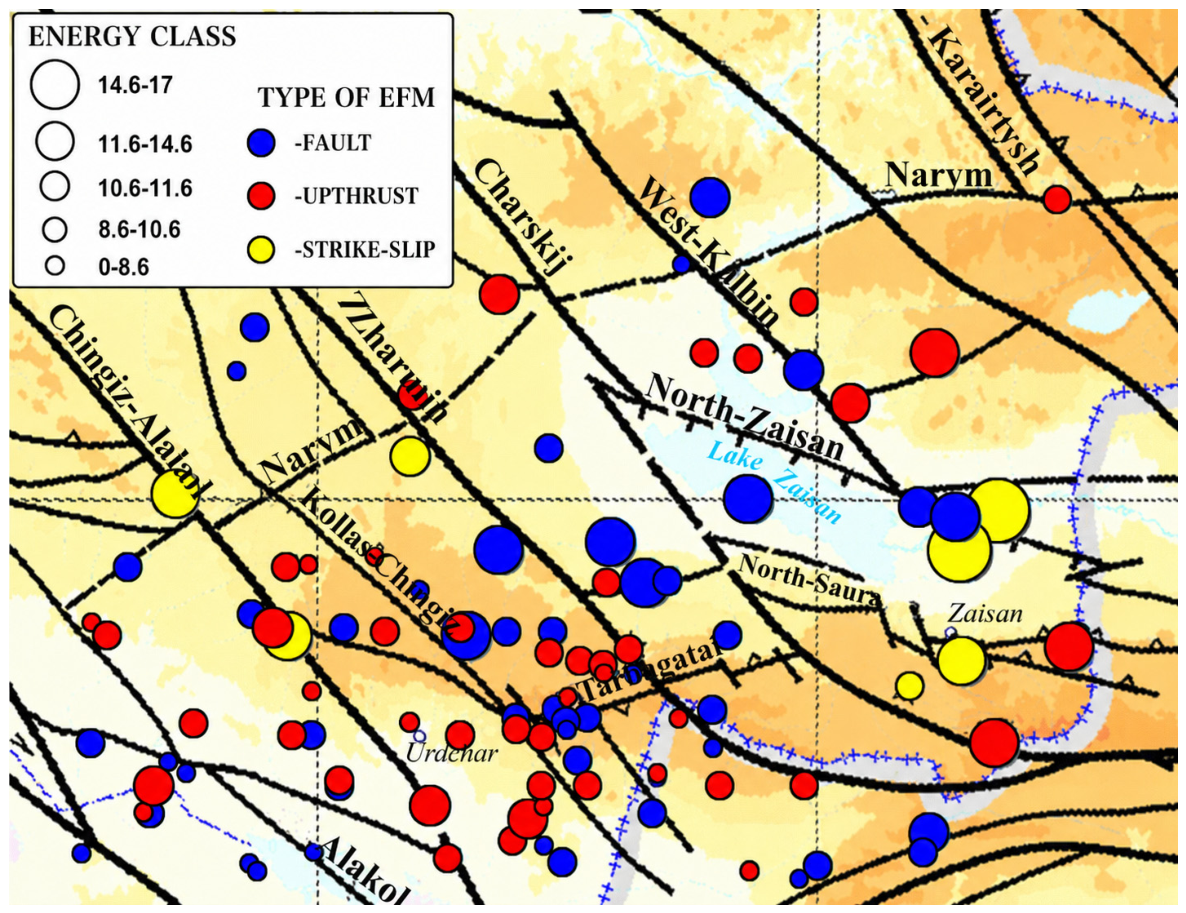
Considering the representativeness of the cataloged focal mechanisms of individual earthquakes in the region, calculations of the stress tensor parameters and STD increments were performed for a 40-km-thick layer of the Earth’s crust in the area south of the Narym thrust (Figure 6).
Figure 6.
Epicenters of earthquakes with determined focal mechanisms in the EKR for the period 1990–2020.
Given the relatively limited representativeness of the input data, the following values were selected as optimal (see Table 2): Mmin = 4 and Mmax = 10, representing the minimum and maximum number of events in a homogeneous sample, respectively; A1 = 30, A2 = 100, and Rmax = 100. The spatial computation grid resolution was 0.1° × 0.1°. The calculations resulted in a set of parameter tables and graphical outputs.
Due to the relatively low representativeness of the initial data, the optimal spatial averaging parameters were set as follows (see Table 2): Mmin = 4, Mmax = 10, A1 = 30, A2 = 100, Rmax = 100, with a calculation step of 0.1 × 0.1 by area. Parameter tables and graphical outputs were generated based on the calculation results.
In the first stage, homogeneous samples of earthquake focal mechanisms (HSFM) were formed. Subsequently, the possible orientations of the principal stress axes and the actual stress state were determined, corresponding to the configuration of HSFM that provides the most efficient release of internal elastic energy. This procedure yielded the components of the stress tensor, including the orientation of the three principal stress axes (azimuth: AZ; plunge angle: PL) and the stress tensor shape coefficient (MU).
The second stage of the calculations involved plotting points on a Mohr diagram [25] to characterize the stress vector on fault surfaces, specifically the shear stress (τ) and normal stress (σn), based on the homogeneous sample. The output is a text file containing the parameters of the average stress tensor for each quasi-homogeneously deforming domain over the entire study period. For each center of a quasi-homogeneous domain, the following parameters were obtained: the orientations of the three principal stress axes (azimuth: AZ; plunge angle: PL); the type of stress field (Is); the stress tensor shape coefficient (MU); relative values of effective pressure (Pef), maximum shear stress (τmax), fluid pressure (Pfl), and lithostatic pressure (Plt); and a coefficient characterizing conditions for high-intensity deformation (Cdl) (Firooze et al., 2024) [46].
Based on these calculations, an electronic research database of the stress–strain characteristics of the Earth’s crust in the EKR was created, encompassing 163 earthquakes. The database includes the main SSS parameters: orientations of the principal stress axes, stress tensor type, and relative values of effective pressure, fluid pressure, lithostatic pressure, and tangential stresses [47]. The following data are presented: (1) tabular text files and (2) MapInfo format.
This database provides a robust informational and programmatic foundation for the study of the SSS of the Earth’s crust in the EKR.
3. Results
Data from the electronic research database of stress tensor parameters and STD increments were subsequently used to analyze the characteristics of the SSS of the Earth’s crust in the EKR.
Using the STRESS seism system, diagrams were generated to visualize parameter values at each calculation node, with values represented as points on a color scale. A methodology was developed to create spatial distribution maps of the calculated parameters in the form of isolines using SURFER software.
Maps were constructed for the following SSS parameters:
- Orientations of the principal stress axes (compression and tension);
- Parameters characterizing the stress tensor type and the tensor of STD increments;
- Relative values of effective and fluid pressures;
- Tangential stresses.
The results are presented in two formats:
- Tabular form in MapInfo format;
- Raster images in the Gauss–Krueger projection, Pulkovo, 1942, Zone 13.
The resulting schemes and maps were integrated with a map of seismically active faults after being entered into the database as raster images in the Gauss–Krueger projection [48,49].
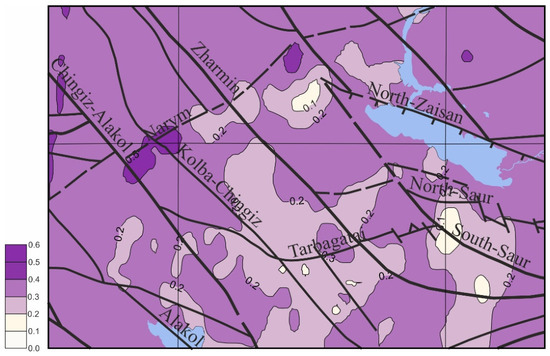
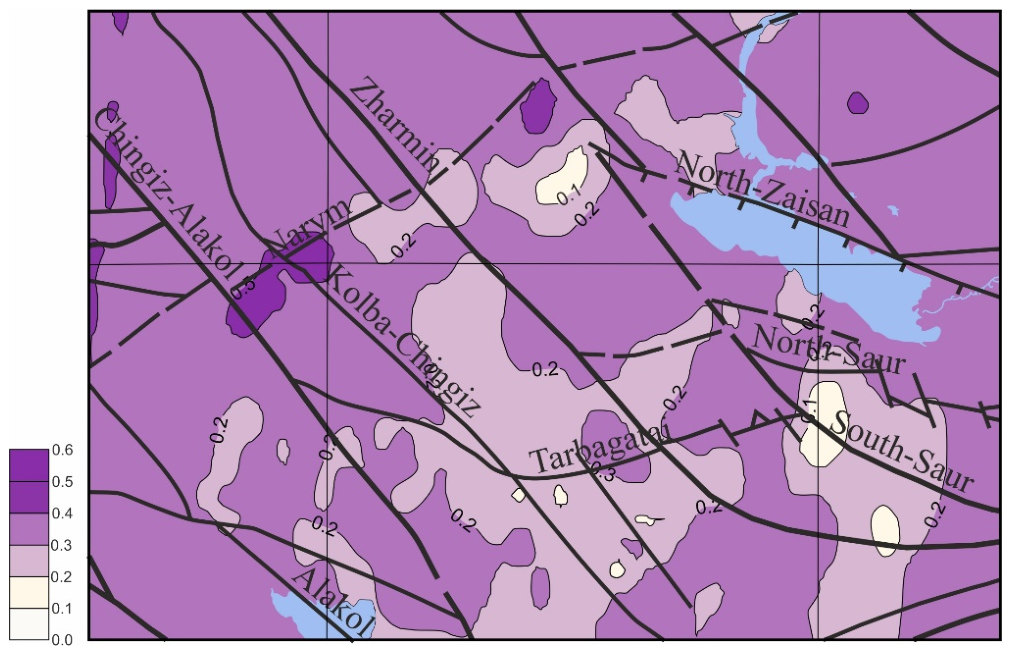
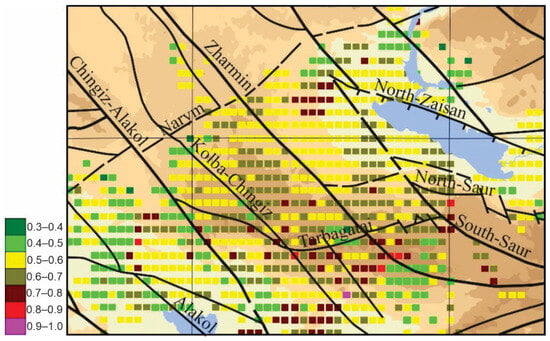
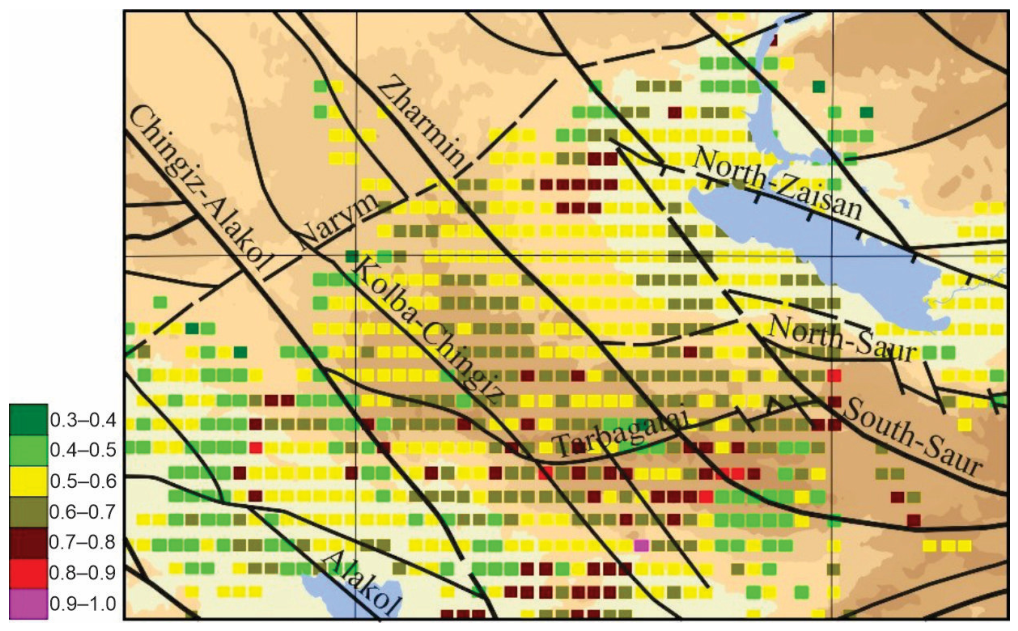
The intensity of the deformation process was assessed using the deformation process intensity coefficient (Cdl). A significant portion of the study area is characterized by Cdl > 0.2, indicating relatively high deformation intensity. Zones of low deformation intensity were observed in the southern part of the region, particularly between the Kalbo–Chingiz and Zharman faults, as well as south of the North–Saur fault (Figure 7).
Figure 7.
Spatial distribution of the Cdl coefficient, indicating zones of high-intensity deformation in the EKR. The color scale represents the magnitude of the Cdl coefficient: lighter shades correspond to lower parameter values, whereas dark purple shades indicate higher values. Blue areas indicate water bodies, including lakes and rivers.
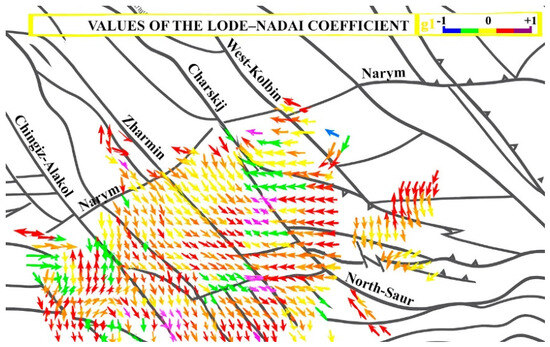
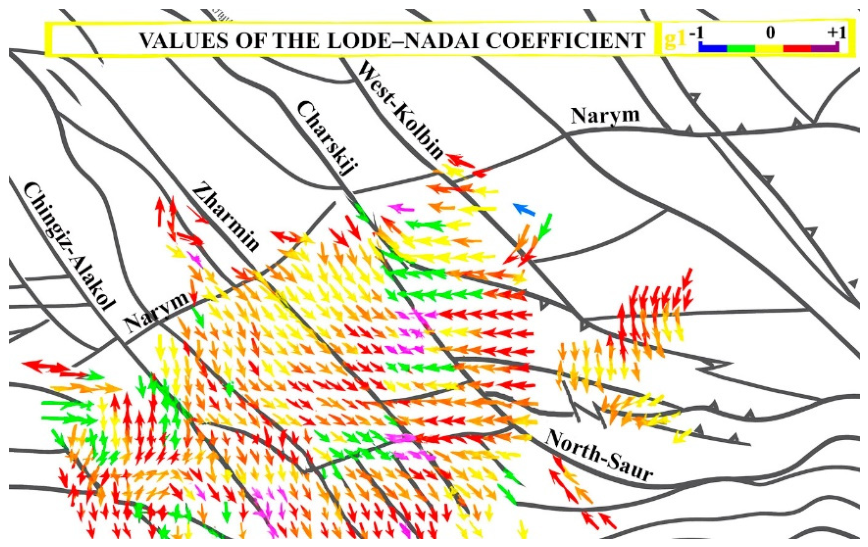
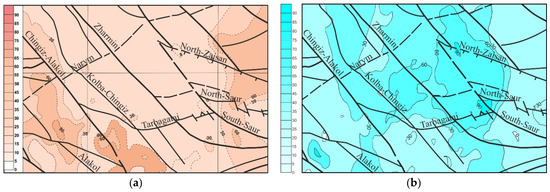
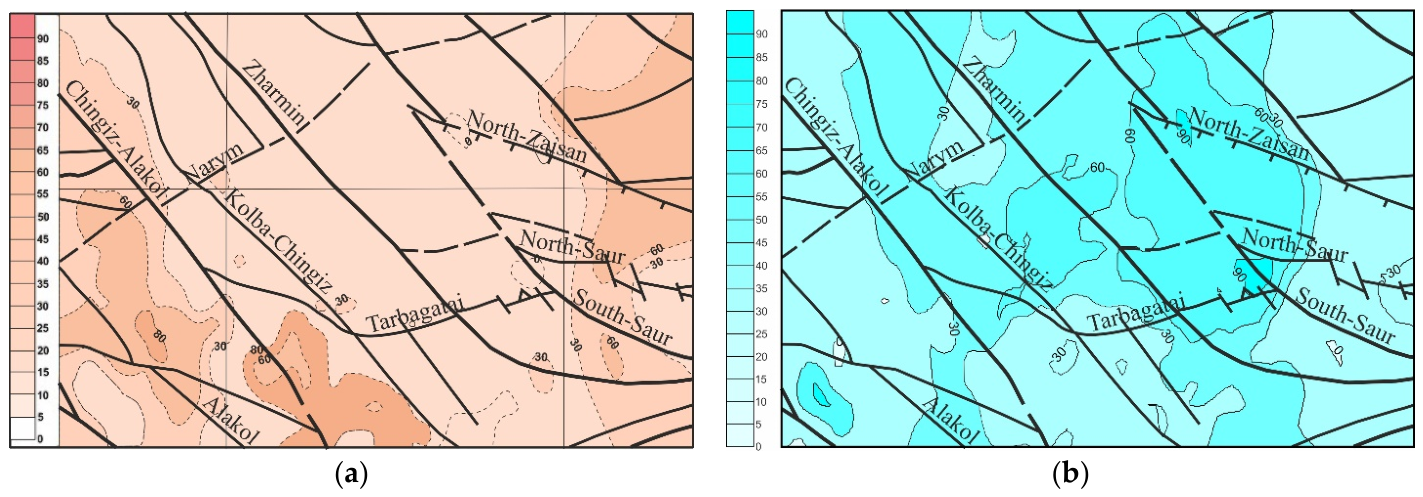
Analysis of the principal stress axes revealed that most of the central part of the study area—between the Tarbagatay and Narym Northeast faults, and the Chingiz–Alakol and West Kalbinsk shear faults—is characterized by near-vertical (>60°) dip angles of the compressive stress axis (Figure 8 and Figure 9a) and near-horizontal (<30°) dip angles of the tensile stress axis, indicating a reset type of stress state in this region.
Figure 8.
Vector representation of the maximum compressive stress axes and corresponding stress tensor types (values of the Lode−Nadai coefficient) in the EKR. The color of each point at a calculation node indicates the type of stress tensor: yellow−shear, blue−uniaxial tension, red−uniaxial compression.
Figure 9.
Plunge angles of principal stress axes: (a) Compressive stress axis; (b) Tensile stress axis. The color scales correspond to the plunge angles of the principal stress axes, expressed in degrees.
In this study, a normal-faulting stress regime is defined as an orientation of the principal stress axes in which the maximum compressive stress axis is subvertical, while the extensional axis is subhorizontal. It should be noted that this parameter characterizes the stress regime and does not contradict the distribution of stress tensor types determined using the Lode–Nadai coefficient. Therefore, the identified zones of uniaxial compression and localized shear deformation reflect specific features of the spatial distribution of stress tensor parameters and do not preclude the predominance of a normal-faulting regime at the regional scale.
The surrounding areas exhibit contrasting stress characteristics, with near-horizontal plunge angles of the compressive stress axis and near-vertical plunge angles of the tensile stress axis, producing predominantly reverse-type stress states, and locally, strike-slip regimes (Figure 9b).
A notable feature of the region is the variability in the orientation of the horizontal compression axis (Figure 8). Southwest of the Chingiz–Alakol fault, the compression direction shifts from sublatitudinal to submeridional azimuths; between the Chingiz–Alakol and South–Saur faults, northwest azimuths dominate; near the North–Saur fault, the azimuths are northeast, and further north, they return to submeridional.
The stress tensor type in the study area is predominantly uniaxial compression, interspersed with strike-slip zones across the territory (Figure 8).
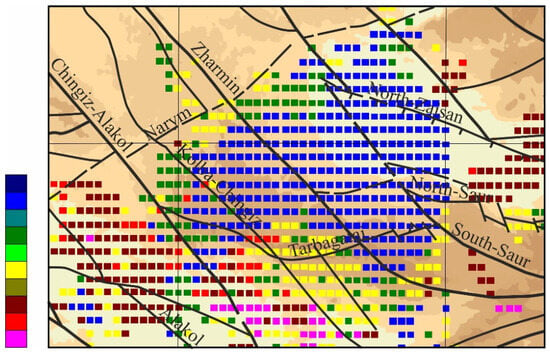
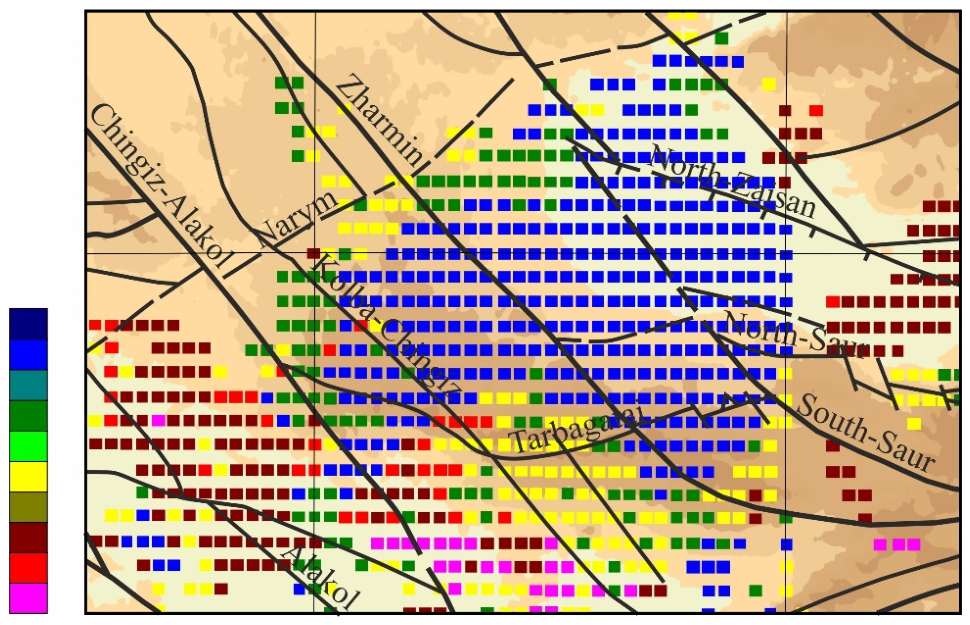
Examination of tangential stresses indicates a low intensity and relatively uniform distribution of both effective and fluid pressures throughout the region (Figure 10).
Figure 10.
Spatial distribution of stress state types in the EKR. The color of each point at a calculation node represents the type of stress state: blue shades—normal fault regime, red shades—reverse fault regime, light green and yellow shades—strike-slip regime; transitional colors indicate intermediate states between dumping and shear, or between shaking and shear.
The area between the Tarbagatay and Narym Northeast faults, and the Chingiz–Alakol and West–Kalba faults, is characterized by minimal deformation intensity. The τ/Pef ratio, representing the relative magnitude of shear stress to effective pressure, ranges from 0.6 to 0.7 in this region (Figure 11).
Figure 11.
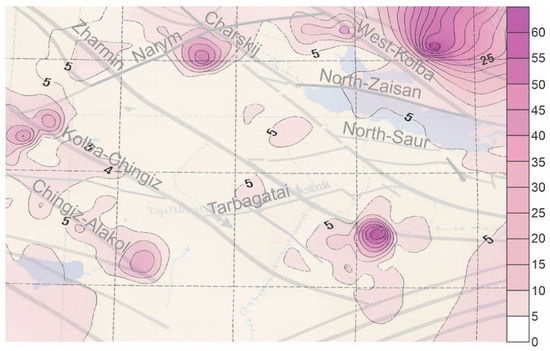
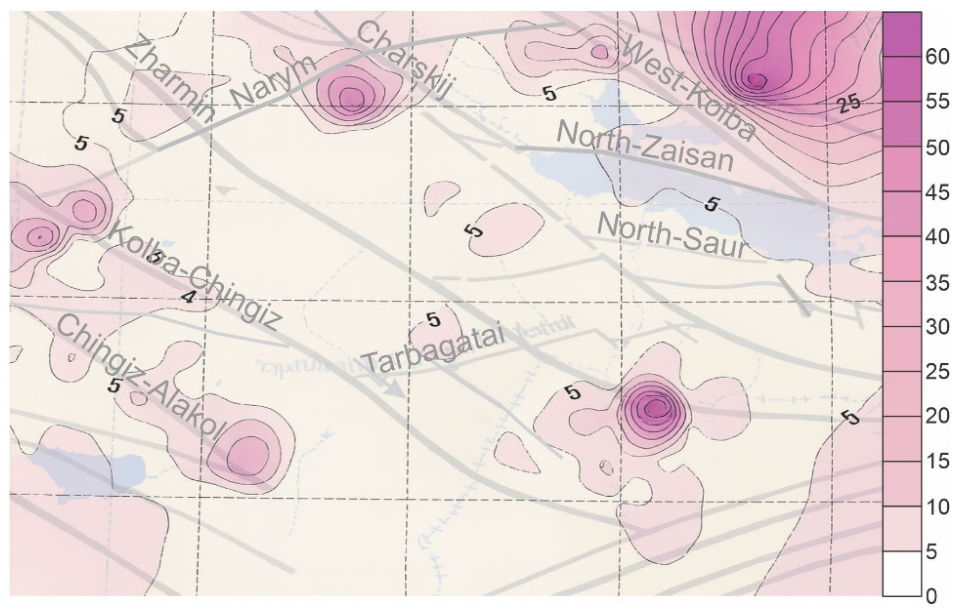
Spatial distribution of the relative magnitude of tangential stress. The color scale represents the relative magnitude of shear stress: lower values correspond to lighter shades, whereas higher values are indicated by dark pink shades.
Amid generally low stress activity, two small high-gradient zones are apparent: one at the intersection of the Alakol and Narym faults, and the other along the Zharman fault. Most areas with elevated shear stress gradients are adjacent to regions where the τ/Pef ratio increases to 0.8.
Comparison with earthquake epicenters from 2015–2020 indicates that the highest epicenter density coincides with areas of elevated τ/Pef values (0.6–0.8). This observation is consistent with experimental evidence that reduced confining pressure facilitates fault rupture (Figure 12).
Figure 12.
Spatial distribution of the τ/Pef ratio (tangential stress to effective pressure).
The identified features of the stress–strain state may be related to the present-day geodynamic processes of Eastern Kazakhstan, which are controlled by the interaction of major tectonic structures within Central Asia. The obtained results allow for an interpretation in which the Zaisan Basin exhibits a tendency toward relative subsidence, whereas the surrounding mountain ranges are characterized by relative uplift. This pattern is consistent with the concept of differential vertical movements of crustal blocks within reactivated fault zones. It should be noted that a detailed quantitative assessment of contemporary vertical motions using GPS and InSAR data was beyond the scope of the present study and would require a separate analysis based on specialized geodetic observations.
In recent years, machine learning methods, including deep neural networks and EPM–DCNN-type models, have been increasingly applied to seismicity analysis and earthquake forecasting. These approaches have demonstrated high efficiency in identifying spatiotemporal patterns of seismic processes and in solving forecasting-related problems. However, their application requires large training datasets and is primarily focused on the prediction of seismic events. In contrast, the approach employed in the present study is based on the analysis of earthquake focal mechanisms and the method of cataclastic analysis, which enables the direct reconstruction of the stress–strain state of the Earth’s crust and provides a basis for the geodynamic interpretation of ongoing tectonic processes. Therefore, machine learning techniques and seismotectonic analysis should be regarded as complementary tools for investigating seismically active regions.
4. Discussion
The study demonstrates that the SSS of rocks in the deep layers of the Earth’s crust in the EKR is characterized by two contrasting types, spatially confined by geological boundaries. The observed deformation patterns indicate subsidence of crustal rocks within the Zaysan Basin and its surrounding areas, and uplift in the adjacent ridge zones.
The obtained results are consistent [23], who also identified two contrasting stress regimes within Eastern Kazakhstan associated with subsidence in the Zaisan Basin and uplift of the surrounding mountainous regions. However, the present study extends these findings through a detailed analysis of the spatial distribution of stress tensor parameters, effective pressure, shear stresses, and seismotectonic strain increments. This additional analysis has provided a more refined characterization of the contemporary stress–strain state of the study area.
The results indicate that the region’s current geodynamics reflects features of neo-tectonic activity. A key outcome is the identification of zones with contrasting stress states, as the boundaries of these zones are the most likely sites for the formation of strong earthquake foci. On the southeastern boundary of such zones, conditions identified within the MKA framework suggest a heightened seismic hazard, characterized by sharp stress gradients along active fault zones and low confining stresses in adjacent high-gradient areas. However, it should be noted that these high-gradient zones are spatially limited. The absence of more extensive high-gradient areas may be attributed to the low intensity of fluid migration, which plays a significant role in the structural transformation of crustal rocks.
5. Conclusions
The development of an electronic database containing calculated stress tensor parameters and STD increments in a unified format enables comprehensive analysis of the SSS in conjunction with geological, geophysical, geodetic, satellite, and seismological data. This approach allows the SSS parameters to be directly related to the specific geological, geophysical, and topographic conditions of the study area, facilitating a better understanding of the relationship between seismotectonic deformations and the geological–tectonic framework governing their development.
The study results provide a basis for long-term forecasting of earthquake hazard along fault zones in the southern EKR. To improve the reliability of such forecasts, it is necessary to enhance the representativeness of EFM data by increasing the density of the seismic station network. Currently, the limited spatial coverage of stations constrains the timely detection of changes in the stress state of the deep crustal horizons.
Author Contributions
Conceptualization, A.I., S.I. and K.T.; methodology, A.I., S.I. and K.T.; software, R.G., Z.D. and B.A.; validation, S.I., K.T. and B.A.; formal analysis, S.D., R.G. and K.T.; investigation, A.I. and S.D.; resources, R.G., Z.D. and B.A.; data curation, S.I., S.D. and Z.D.; writing—original draft preparation, A.I., S.I., S.D., R.G., Z.D. and K.T.; writing—review and editing, S.I., B.A. and K.T.; visualization, S.D., R.G. and B.A.; supervision, A.I. and S.I.; project administration, A.I.; funding acquisition, A.I. and S.D. All authors have read and agreed to the published version of the manuscript.
Funding
This research is funded by the Committee of Science of the Ministry of Science and Higher Education of the Republic of Kazakhstan (Grant No. BR24992763). The research was also carried out within the framework of the project “Assessment of the Seismogeodynamic State of the Almaty Agglomeration Based on Monitoring of Seismic, Geophysical, and Hydrogeochemical Parameters”, implemented with the support of the Akimat of Almaty.
Institutional Review Board Statement
Not applicable.
Informed Consent Statement
Not applicable.
Data Availability Statement
The original contributions presented in this study are included in the article. Further inquiries can be directed to the corresponding authors.
Conflicts of Interest
The authors declare no conflicts of interest.
References
- Statistics Department of East Kazakhstan Region. East Kazakhstan in Figures 2013: A Brief Collection; Statistics Department of East Kazakhstan Region: Ust-Kamenogorsk, Kazakhstan, 2014; 142p.
- Statistics Department of East Kazakhstan Region. Gross National Product of VKO for 2013: Brief Compendium; Statistics Department of East Kazakhstan Region: Ust-Kamenogorsk, Kazakhstan, 2013; 95p.
- Ikonnikov, A. Potential of East Kazakhstan. Cent. Asia Mag. 2012, 21–24, 79–82. [Google Scholar]
- Oitseva, T.; Serikbayev, D.; Mizernaya, M.; Oitseva, T.; Mizernaya, A.M.; Kuzmina, P.O. Prospects of the Medvedko-Akhmetkinsky ore field for rare metal lithium mineralization (East Kazakhstan). In Proceedings of the 23rd International Multidisciplinary Scientific GeoConference SGEM, Albena, Bulgaria, 3–9 July 2023. [Google Scholar]
- Amralinova, B.; Agaliyeva, B.; Lozynskyi, V.; Frolova, O.; Rysbekov, K.; Mataibaeva, I.; Mizernaya, M. Rare-Metal Mineralization in Salt Lakes and the Linkage with Composition of Granites: Evidence from Burabay Rock Mass (Eastern Kazakhstan). Water 2023, 15, 1386. [Google Scholar] [CrossRef] [Scilit]
- D’yachkov, B.A.; Bissatova, A.Y.; Mizernaya, M.A.; Khromykh, S.V.; Oitseva, T.A.; Kuzmina, O.N.; Zimanovskaya, N.A.; Aitbayeva, S.S. Mineralogical Tracers of Gold and Rare-Metal Mineralization in Eastern Kazakhstan. Minerals 2021, 11, 253. [Google Scholar] [CrossRef] [Scilit]
- Dyachkov, B.A.; Aitbayeva, S.S.; Mizernaya, M.A.; Amralinova, B.B.; Bissatova, A.E. New data on non-traditional types of East Kazakhstan rare metal ore. Nauk. Visnyk Natsionalnoho Hirnychoho Universytetu 2020, 4, 11–16. [Google Scholar] [CrossRef] [Scilit]
- Omirserikov, M.S.; Duczmal-Czernikiewicz, A.; Isaeva, L.D.; Asubaeva, S.K. Forecasting resources of rare metal deposits based on the analysis of ore-controlling factors. News Natl. Acad. Sci. Repub. Kazakhstan Ser. Geol. Tech. Sci. 2017, 3, 35–43. [Google Scholar]
- Togizov, K.S.; Zholtayev, G.; Isaeva, L.D. The role of three-dimensional models of deposit and thermodynamic conditions of its formation at selecting and evaluating resources of perspective sites. News Natl. Acad. Sci. Repub. Kazakhstan 2019, 5, 169–176. [Google Scholar] [CrossRef] [Scilit]
- Ragdanova, A.; Mataibayeva, I.; Frolova, O.; Agaliyeva, B.; Dolgopolova, A.; Togizov, K. Structural-formational zones with porphyry copper mineralization—A promising mineral resource base for copper in Eastern Kazakhstan. Min. Miner. Depos. 2025, 19, 107–120. [Google Scholar] [CrossRef] [Scilit]
- Vvedenskaya, A.V. Investigation of Stresses and Ruptures in Earthquake Foci Using Dislocation Theor; Nauka: Moscow, Russia, 1969; pp. 47–66. [Google Scholar]
- Nurmagambetov, A.; Sydykov, A.; Timush, A.V.; Khaidarov, M.S.; Vlasova, A.A.; Mikhailova, N.N.; Sabitov, M.M.; Umirzakova, A.; Gapich, V.A. Zaisan Earthquake on June 14, 1990. In Proceedings of the Earthquakes in the USSR in 1990; GS RAS: Moscow, Russia, 1996; pp. 54–60. [Google Scholar]
- Mikhailova, A.I.; Nedelkov, E.N.; Sokolova, E.N. On Seismic Events in Low-Active and Aseismic Regions of Kazakhstan. In Proceedings of the Modern Geodynamics, Deep Structure and Seismicity of Platform Territories and Adjacent Regions; “Nauchnaya Kniga” Publishing and Printing Center: Voronezh, Russia, 2001. [Google Scholar]
- Abdrakhmatov, K. Central Asia Earthquake Catalog 1991–2005. In Final Technical Report for ISTC Project No. KR-1176: Seismic Risk Assessment in Central Asia; International Science and Technology Center (ISTC): Astana, Kazakhstan, 2009; pp. 19–36. [Google Scholar]
- Kurskeev, A.K.; Timush, A.V.; Sydykov, A.S.; Shatsilov, V.I. General Seismic Zoning of the Territory of Kazakhstan/OSR Map of Kazakhstan; Explanatory Note; Institute of Seismology: Alma-Ata, Kazakhstan, 2003; 84p. [Google Scholar]
- Starovoit, O.E. (Ed.) Earthquakes in Northern Eurasia: Annual Collection; Geophysical Survey of the Russian Academy of Sciences: Obninsk, Russia, 2009; 434p. [Google Scholar]
- Malovichko, A.A.; Petrova, N.V.; Kadirov, F.A.; Etirmishli, G.D.; Ferrari, G.; Mackey, K.G.; Storchak, D.A.; Abdrakhmatov, K.E.; Aronov, A.G.; Vinogradov, Y.A.; et al. (Eds.) Catalog of earthquakes in Central Asia for 2016–2017. In Earthquakes of Northern Eurasia, 2016–2017; Appendix on CD-ROM; Federal Research Center Unified Geophysical Service of the Russian Academy of Sciences: Obninsk, Russia, 2017. [Google Scholar]
- International Seismological Centre (ISC). ISC Bulletin 2016–2017; ISC: Thatcham, UK, 2015; Available online: https://www.isc.ac.uk/iscbulletin/search/bulletin (accessed on 15 May 2026).
- USGS National Earthquake Information Center. Available online: https://earthexplorer.usgs.gov/ (accessed on 15 May 2026).
- Dosaybekova, S.K.; Dalebaeva, J.A.; Dosymbekova, Z.B.; Zhunusova, J.K. Analysis of the results of observations by the permanent seismic monitoring network of Kazakhstan. In Proceedings of the Earthquake Forecast, Seismic Hazard and Seismic Risk Assessment in Central Asia; XI Kazakhstan-Chinese International Symposium; National Scientific Center for Seismological Observations and Research: Almaty, Kazakhstan, 2023; pp. 150–155. [Google Scholar]
- Gashimov, R.A.; Shiman, D.V.; Eskendirov, D.A. Comprehensive field seismological studies and prospects for expanding the seismological network of the Republic of Kazakhstan. In Proceedings of the Earthquake Forecast, Seismic Hazard and Seismic Risk Assessment in Central Asia; XI Kazakhstan-Chinese International Symposium; National Scientific Center for Seismological Observations and Research: Almaty, Kazakhstan, 2023; pp. 306–309. [Google Scholar]
- Suetsugu, D. Source Mechanism; IISEE: Tsukuba, Japan, 1998; 103p. [Google Scholar]
- Poleshko, N.N.; Aristova, I.L.; Mikhailova, N.N. Stress State of the Earth’s Crust in Eastern Kazakhstan from Earthquake Focal Mechanism Data. Bull. NNC RK 2017, 2, 64–70. [Google Scholar]
- Mikhailova, N.N.; Aristova, I. Magnitude and energy parameterization of earthquakes in practice of earthquakes processing in Kazakhstan. In Proceedings of the Abstracts of the Second European Conference on Earthquake Engineering and Seismology, Istanbul, Turkey, 24–29 August 2014; 2066p. [Google Scholar]
- Rebetsky, Y.L. Tectonophysical Methods for Studying Natural Stresses from Seismological Data. Mod. Tectonophys. 2015, 2, 3–46. [Google Scholar]
- Modern Tectonophysics. Methods and Results. In Materials of the Fourth Youth Tectonophysical School-Seminar; IFZ: Moscow, Russia, 2015; Volume 2, 152p.
- Nakamura, M. Determination of focal mechanism solution using initial motion polarity of P and S waves. Phys. Earth Planet. Inter. 2002, 130, 17–29. [Google Scholar] [CrossRef] [Scilit]
- Bloch, W.; Yuan, X.; Schneider, F.M. The 2015–2017 Pamir earthquake sequence. Geophys. J. Int. 2023, 233, 641–664. [Google Scholar] [CrossRef] [Scilit]
- Poleshko, N.N.; Dossaibekova, S.; Uzbekov, A.N. Seismotectonic Setting of Eastern Kazakhstan Based on Focal Mechanism Studies. Bull. Kazn. 2017, 5, 30–39. [Google Scholar]
- Global CMT Project. Available online: https://www.globalcmt.org/CMTsearch.html (accessed on 19 May 2026).
- Rebetsky, Y.L. Methods of Tectonic Stress Reconstruction and Seismotectonic Deformation Based on Modern Plasticity Theory. Dokl. Earth Sci. 1999, 365, 392–395. [Google Scholar]
- Issagaliyeva, A.K.; Istekova, S.A.; Aliakbar, M.M. Geophysical data complex interpretation techniques. News Acad. Sci. RK 2021, 5, 61–67. [Google Scholar] [CrossRef] [Scilit]
- Rebetsky, Y.L. Tectonic Stresses and Strength of Rock Massifs; Science: Moscow, Russia, 2007; 406p. [Google Scholar]
- Rebetsky, Y.L.; Polets, A.Y.; Kuchay, O.A.; Sycheva, N.A. The stress state of seismic areas of Central and Eastern Asia. In Moment Tensor Solutions—A Useful Tool for Seismotectonics; D’Amico, S., Ed.; Springer: Berlin/Heidelberg, Germany, 2018; pp. 519–556. [Google Scholar] [CrossRef] [Scilit]
- Batdorf, S.B.; Budiansky, B. Mathematical Theory of Plasticity Based on the Slip Concept. In Proceedings of the First U.S. National Congress of Applied Mechanics; American Society of Mechanical Engineers (ASME): New York, NY, USA, 1952; pp. 759–769. [Google Scholar]
- Tsai, V.C.; Thompson, S.C.; Abdrakhmatov, K. Probing the upper end. Tectonics 2022, 41, e2022TC007300. [Google Scholar] [CrossRef] [Scilit]
- Huang, G.C.D.; Roecker, S.W.; Levin, V. Dynamics. Geophys. J. Int. 2017, 208, 561–576. [Google Scholar] [CrossRef] [Scilit]
- Huang, J.; Song, Z.; Huang, C.; Liang, Q. Lode Angle-Dependent Fracture Mechanisms in Brittle Rock Under 3D Stress Conditions. Appl. Sci. 2023, 15, 10200. [Google Scholar] [CrossRef] [Scilit]
- Voronina, E.V. Mekhanika Ochaga Zemletryaseniya [Mechanics of the Earthquake Source]; Special Course; Faculty of Physics, Lomonosov Moscow State University: Moscow, Russia, 2004; 92p. [Google Scholar]
- Kufner, S.-K.; Schurr, B.; Ratschbacher, L. Seismotectonics. Tectonics 2018, 37, 3877–3905. [Google Scholar] [CrossRef] [Scilit]
- Poggi, V.; Selvadurai, P.; Meghraoui, M.; Khairullin, R. Harmonizing seismicity information in Central Asian countries: Earthquake catalogue and active faults. Nat. Hazards Earth Syst. Sci. 2024, 24, 2597–2617. [Google Scholar] [CrossRef] [Scilit]
- Nouri, A.; Rahimi, B.; Vavryčuk, V.; Ghaemi, F. Tectonic stress. Int. Geol. Rev. 2024, 66, 3075–3092. [Google Scholar] [CrossRef] [Scilit]
- Pang, G.; Wang, Q.; Zhang, P. Stress evolution. J. Geodyn. 2022, 150, 101939. [Google Scholar] [CrossRef] [Scilit]
- Timush, A.V. Seismotectonics of the Lithosphere of Kazakhstan; Luxe Media Group: Almaty, Kazakhstan, 2011; pp. 398–399. [Google Scholar] [CrossRef] [Scilit]
- Starovoit, O.E. (Ed.) Seismological Bulletin for 2016–2017; GS RAS: Obninsk, Russia, 2016. [Google Scholar]
- Firooze, Z.; Taran, S.; Asaadi, N.; Safari, H. Relationships of Earthquake Moment Magnitude with Body and Surface Waves Using MCMC Approach. arXiv 2024. [Google Scholar] [CrossRef] [Scilit]
- Vassilyev, I.; Mendakulov, Z.; Zhumabayev, B.; Kozin, I.; Beloslyudtsev, O.; Dossaibekova, S. Improving the quality of magnetograms. Appl. Sci. 2025, 15, 10129. [Google Scholar] [CrossRef] [Scilit]
- Allen, M.; Vincent, S.; Brouet, Y. Active deformation in Central Asia from geodetic and seismological data. Nat. Geosci. 2019, 12, 180–187. [Google Scholar]
- Kangarli, T.N.; Kadirov, F.A.; Yetirmishli, G.J. Recent geodynamics. Geodyn. Tectonophys. 2018, 9, 1099–1126. [Google Scholar] [CrossRef] [Scilit]

Disclaimer/Publisher’s Note: The statements, opinions and data contained in all publications are solely those of the individual author(s) and contributor(s) and not of MDPI and/or the editor(s). MDPI and/or the editor(s) disclaim responsibility for any injury to people or property resulting from any ideas, methods, instructions or products referred to in the content. |
© 2026 by the authors. Licensee MDPI, Basel, Switzerland. This article is an open access article distributed under the terms and conditions of the Creative Commons Attribution (CC BY) license.