


Abstract
Drying of Californian red worms (CRW) (Eisenia foetida) was optimized using the refractance window (RW) method. Response surface methodology was used to evaluate the effects of drying temperature (65–85 °C) and mass per unit area (W/A) (0.256–0.367 g/cm2) g/cm2) on the response variables related to the meal’s protein quality and drying parameters. The response variables were digestibility (D), sulfhydryl bonds (SH), protein digestibility-corrected amino acid score (PDCAAS), final moisture content (FMC), and the water effective diffusion coefficient (Deff). The results showed that as temperature increases, Deff also increases, while FMC decreases. Conversely, as the W/A ratio increases, SH increases, FMC increases, and Deff decreases. Furthermore, the optimization of the obtained models yielded values for water temperature (79.9 °C) and W/A (0.367 g/cm2), as well as predicted values for the response variables D (96.87%), FMC (4.12%), Deff (1.041 × 10⁻¹⁰ m2/s), SH (19.11 μmol/g protein), and PDCAAS (0.459); with a desirability of 0.734. The experimental values obtained for optimal conditions were D: 97.14%, FMC: 6.8%, Deff: 6. × 10−11 m2/s, SH: 14.84 μmol/g protein, and PDCAAS: 0.780. This drying method proved optimal and efficient for dehydrating Californian red worm meat, as it preserves the protein quality of the worm meal while ensuring appropriate drying conditions.
1. Introduction
More than 1.05 billion tons of food were discarded worldwide in 2022. In addition, once food is processed, large amounts of waste from inedible parts are produced, which must also be discarded [1]. The food groups that produce most waste are roots, fruits, vegetables, and oilseeds (40–50%); they generate waste such as peels, seeds, stems, bagasse, cobs, leaves, bran, and pomace from oil extraction, among others. These are followed by fish (35%), cereals (30%), and meat and dairy products (20%) [2]. This situation causes environmental pollution and makes it necessary to find alternatives for the use of this organic material. In this context, the concept of circular economy appears as a waste reuse strategy in which waste is consumed within production processes, thereby reducing its volume [2].
A circular economy strategy is vermiculture, in which various species of earthworms are used to convert organic waste into worm protein and agricultural inputs [3]. One of the most used species for this purpose is the Californian red worm (CRW) (Eisenia foetida) since, thanks to its morphological and physiological characteristics, it has the ability to feed on organic matter such as manure, compost, and vegetable and fruit waste [4]. This species consumes up to 60% of its body weight, and an average of 10,000 worms can produce up to 2 kg of castings per day [5]. Furthermore, its meat has excellent nutritional characteristics, with a protein content of over 60% [6]. This makes it a nutritional alternative for both animals and humans that surpasses foods such as soy, which contains 37–38% protein [3]. The flour meat from CRW has been used in arepa [7], instant drink [8], and broiler chickens’ diets [9]. However, its use of human food is very incipient, which make necessary to conduct more research in that sense [10].
On the other hand, once the worms are produced, they must be separated from the breeding substrate and subjected to preservation processes that prevent their deterioration and loss of nutritional characteristics [11]. The most widely used method for preserving worm meat is dehydration, which makes it possible to preserve physicochemical characteristics and eliminate microbiological risks in the product [12]. There are several dehydration methods available for industrial use, including convection drying in ovens and drying tunnels, solar drying, osmotic dehydration, microwave dehydration, and freeze-drying [13]. Another technique used for food dehydration is the Refractance Window (RW) technique, a novel fourth-generation drying method that offers excellent retention of color, flavor, and nutrients, while the product temperature remains relatively low—below 70 °C [14]. This drying technology is primarily used for products such as fruits, eggs, herbs, spices, and vegetables [15]. Recent studies have examined RW drying of high-protein foods such as milk [16], salmon and beef [17], and fish silage [18], among others. It uses hot water (below 95 °C) at atmospheric pressure to transfer thermal energy into the material disposed of in a polyethylene terephthalate (PET) film called Mylar® or other transparent material that transmits infrared radiation in contact with the hot water [19]. Water transmits heat energy within itself by the three heat-transfer mechanisms: conduction, convection, and radiation. The thermal energy of the water is transmitted to the food through the plastic film by conduction and radiation, and moisture is carried by the air flowing over the food [19]. This technology produces superior dehydrated foods because of its ability to create a “window” that allows the passage of infrared energy for drying at relatively low temperatures. It also has the specific ability to regulate the drying of the material. While the moisture is removed by evaporation, the window is “closed”, and because the plastic sheet is a poor conductor of heat, the heat damage is minimized [19]. Some advantages of the RW method are the retention of nutritional properties due to moderate temperatures, rapid drying, and low operating cost [20]. RW™ drying is limited by the need for a large drying surface, frequent cleaning, and moderate operating temperatures (below the boiling point of water) to prevent bubble formation. It must be unsuitable for sugar-rich materials due to their stickiness, and its efficiency decreases with thick samples where radiant heat transfer is limited, resulting in a conduction-dominated process [19].
The thermal energy of the water is transferred through a transparent polyethylene terephthalate (PET) film called Mylar® that transmits infrared radiation [19]. This drying technology is primarily used for products such as fruits, eggs, herbs, spices, and vegetables [15]. Recent studies have examined RW drying of high-protein foods such as milk [16], salmon and beef [17], and fish silage [18], among others. However, there are no literature reports about drying of Californian red worms by RW.
While being heated, proteins may be denatured due to changes in their conformation and because hydrophobic regions become more exposed, leading to the unfolding of the molecule [21]. These alterations can affect the nutritional and functional properties of proteins and occur as a result of the time and temperature of heat treatment, most often at temperatures above 70 °C [22]. For this reason, the effect of thermal treatments on protein quality must be considered. Protein quality is defined as the amount of essential amino acids present in food in a quantity equal to or greater than that established for each amino acid in a reference protein [23]. Statistical methods are appropriate tools for evaluating the effect of these types of process variables on the protein quality of a given food [24]. The objective of this study was to evaluate, in RW drying of Californian red worms (CRW), the effect of temperature and mass per unit area (W/A) on the protein quality of the meal and the most important drying parameters. The quality parameters selected here were digestibility (D), sulfhydryl groups (SH), and protein digestibility-corrected amino acid score (PDCAAS), while the drying parameters were final moisture content (FMC) and the water effective diffusion coefficient (Deff).
2. Materials and Methods
2.1. Worm Management
Approximately 20 kg of substrate containing Californian red worms (CRW) was obtained from a commercial supplier in the municipality of Tenjo (Tenjo Cundinamarca, Colombia). The worms were manually separated from the substrate to obtain approximately 2 kg of live worms. They were then cleaned and placed in a 2% sodium bicarbonate solution to purge them. Subsequently, they were left in a 7% saline solution for one hour for euthanasia and finally rinsed with water to remove excess salt.
2.2. Laboratory Reagents
The laboratory reagents used in each of the tests were primarily purchased from Sigma-Aldrich (St. Louis, MO, USA): hydrochloric acid (HCl) 37% (CAS No. 7647010), sulfuric acid (H2SO4) 97% (CAS No. 7664939), o-phthalaldehyde (OPA) (CAS No. 643798), Fmoc (CAS No. 28920-43-6), and the enzymes alpha-amylase (CAS No. 9000-90-2), trypsin (CAS No. 9002-07-7), and 5,5′-dithiobis-(2-nitrobenzoic acid) (DTNB) (CAS No. 69-78-3). Other products used here were analytical grade and obtained from Merck (Darmstadt, Germany).
2.3. Refractance Window Drying
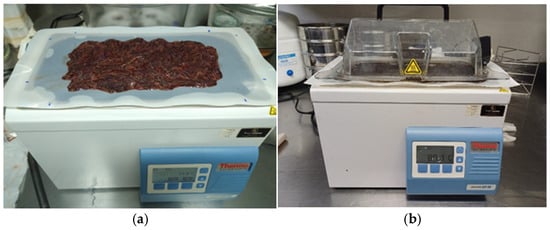
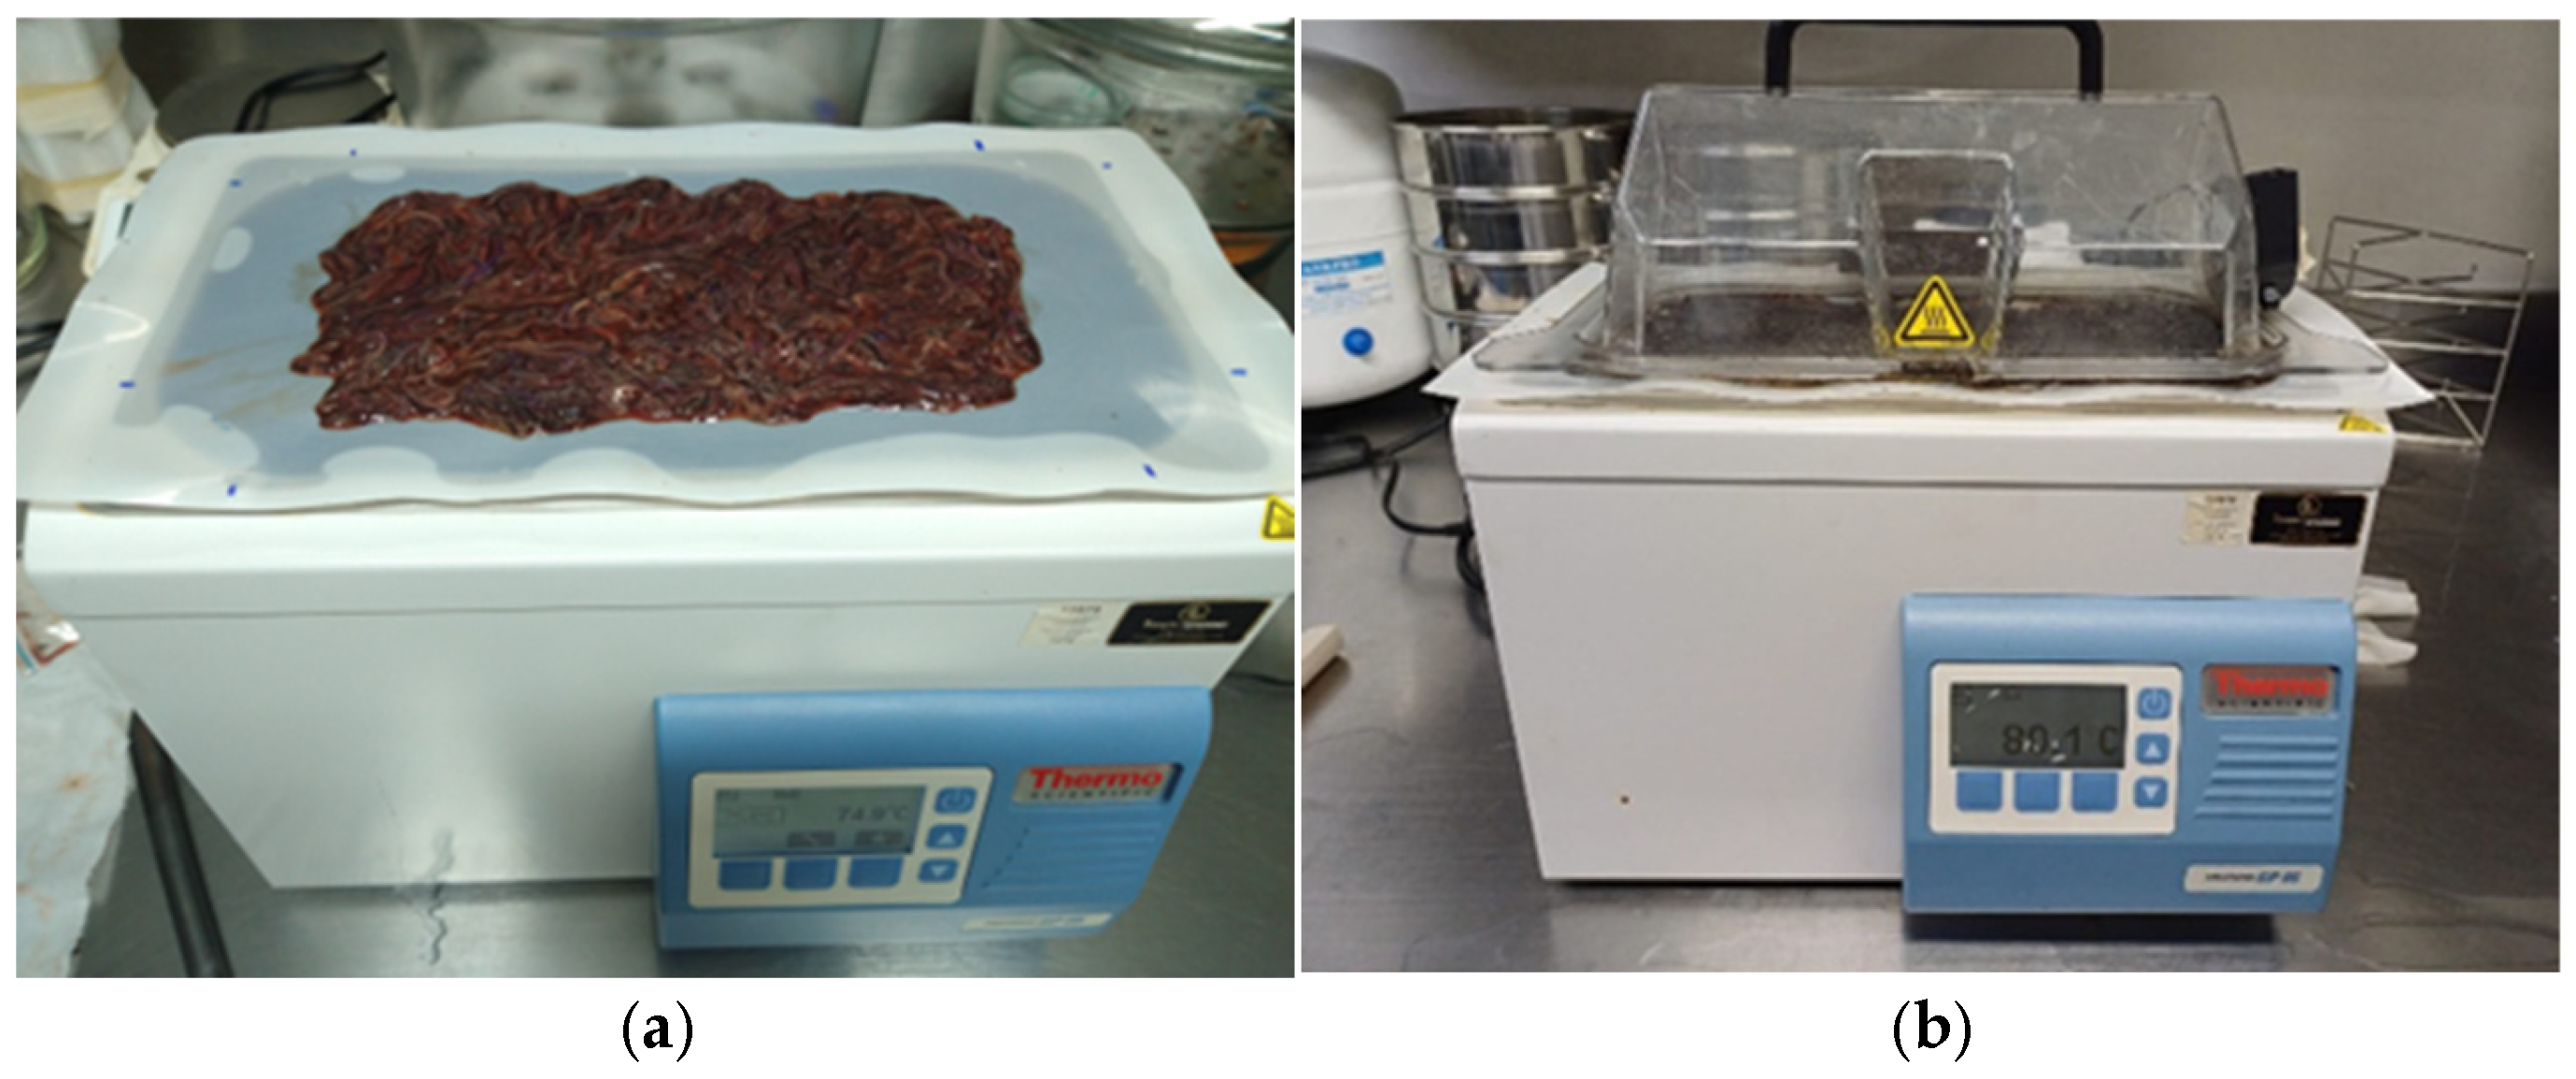
The CRW was dried using the Refractance Window technique in a 5-L Laboratory-scale thermostatic bath TSGP05 (Thermo Scientific, Waltham, MA, USA) (Figure 1), at an atmospheric pressure of 640 mmHg for 3 h per experimental run. This hydro-dryer was filled with tap water. The bath temperature (T) was kept between 65 °C and 85 °C. The water surface was covered with a sheet of a material commercially known as Mylar® (polyethylene terephthalate, DuPont Teijin Films, Hopewell, VA, USA), which is transparent to infrared radiation [25]. Thin samples with mass per unit area (W/A) between 0.272 and 0.350 g/cm2 were placed on this sheet. The amount of sample dried was determined based on the size of the hydro-dryer and the contact area between the film and the water. The bath temperatures were set according to a literature review showing that proteins are heat-sensitive and can be affected by temperatures above 70 °C [26]. The hydro-dryer has a lid with an air extractor to enable the circulation and extraction of steam from the sample into the environment.
Figure 1.
RW hydro-drying equipment: (a) Worm arrangement prior to drying and (b) Setup with air extractor.
2.4. Worm Meal
To obtain CRW meal after RW drying, the dry sample was scraped off the sheet with a spatula and processed in a blade mill (NutriBullet, Los Angeles, CA, USA) for 2 min. It was then passed through ASTM #40 mesh sieves, adjusting it to particle sizes < 425 μm. This size is required by the food industry for applications such as breadmaking, pasta production, and animal feed pellets, among others [27].
2.5. Bromatological Characterization
Proximate analysis of raw CRW and CRW meals was performed in accordance with AOAC guidelines [27]. Moisture content was determined according to AOAC method 930.15 by drying the sample in a convection oven PR305225M (Thermo Scientific, Waltham, MA, USA) at 105 °C for 8 h. Protein content was determined according to AOAC method 954.01, i.e., the Kjeldahl procedure, using a heating DK 12 (Velp Scientifica, Usmate Velate, Italy). Total ash content was determined according to AOAC method 942.05 by heating the samples to 550 °C in a muffle furnace D8 (Terrigen, Medellín, Colombia). Additionally, the ethereal extract (lipid content) was determined according to AOAC method 920.39, using a StarFish Soxhlet extractor (Radleys, Saffron Walden, UK) with petroleum ether as the solvent. The final moisture content (FMC) corresponds to the wet basis moisture content from the proximate analysis of CRW meal.
2.6. Digestibility (%D)
The protocol based on digestive enzymes proposed by Minekus et al. [28] was used. 5 g of sample was weighed on an analytical balance TXB2201L (Shimadzu, Kyoto, Japan) and then added to a 50-mL tube in triplicate. For the oral phase, 5 mL of simulated oral fluid (SOF) was added, and the mixture was incubated for 5 min at 37 °C in a benchtop orbital shaker Model 4320 (Thermo Scientific, Waltham, MA, USA). For the gastric phase, 10 mL of simulated gastric fluid (SGF) containing pepsin at pH < 3 was added to the solution resulting from the oral phase. This mixture was incubated for 2 h at 37 °C on the same orbital shaker at 55 rpm. Finally, 20 mL of simulated intestinal fluid (SIF) containing pancreatin and bile extract at pH 7 was added, and the mixture was incubated for 2 h at 37 °C with agitation. Equation (1) was used to calculate the digestibility percentage. It determines the difference between the amount of nitrogen ingested and the amount of nitrogen present in the final undigested substrate.
where D is digestibility (%), N is the nitrogen content (%) in the original sample before digestion, and B is the nitrogen content (%) in the final sample after digestion.
2.7. Effective Diffusion Coefficient (Deff)
To calculate the effective diffusion coefficient (Deff), Fick’s second law in one dimension was used as a starting point, according to Equation (2). Applying Crank’s analytical solution [29] yields Equation (3). For this purpose, the following assumptions were made: the geometry is that of an infinite flat plate, the initial moisture distribution is uniform, the resistance to mass transfer is negligible, and there is no material shrinkage during drying [24]. Drying experiments were conducted in triplicate, and the results were expressed as experimental curves of the dimensionless moisture ratio (MR) versus time (t).
where, X is the moisture content on a dry basis (g water/g dry solid), t is the time (s), z is the spatial dimension (m), and Deff is the water diffusion coefficient ,
where MR is the dimensionless moisture ratio on a dry basis: , where is the moisture content at any time, is the initial moisture content, and is the equilibrium moisture content, all expressed in g water/g dry solid, n is the number of terms in the sum, l is the sample thickness (m), and Fo is the Fourier number: .
2.8. Sulfhydryl Bonds (SH)
The sulfhydryl (SH) groups in the samples were determined with Ellman, (1959) method [30], as described by Yin et al. [31]. Ellman’s reagent was prepared by dissolving 4 mg of DTNB reagent (Sigma-Aldrich, St. Louis, MO, USA) in 1 mL of Tris-glycine buffer (0.086 M Tris, 0.09 M glycine, 4 mM EDTA, pH 8.0). Total SH contents for the proteins were obtained by suspending 15 mg of protein samples in 5.0 mL of Tris-glycine buffer. Next, 50 μL of Ellman’s reagent was added. The resulting suspensions were incubated for 1 h at room temperature (25 ± 1 °C), with occasional agitation on a shaker (Model 4320, Thermo Scientific, Waltham, MA, USA), and then centrifuged at 11,000 rpm for 10 min. The absorbance of the supernatant was determined at 412 nm using the buffer solution as a blank in a Varioskan LUX reader (Thermo Scientific, Vantaa, Finland). SH content was calculated using the molar extinction coefficient (ε) of 2-nitro-5-thiobenzoate (NTB) at 412 nm, 13,600 (), and expressed as μmol/g of protein (Equation (4)).
where A is the absorbance at 412 nm, is the molar extinction coefficient (), L is the cuvette length (cm), and C is the SH concentration .
2.9. Amino Acid Composition
Amino acid composition was determined using reverse-phase HPLC, following the methodology described by Gomez et al. [32]. Acid hydrolysis of the samples was performed with 6N HCl + 1% phenol at 95 °C for 16 h before injection into the instrument. The amino acids were analyzed on an UltiMate 3000 HPLC system with a UV-VIS detector featuring a diode array detector (Thermo Dionex, Sunnyvale, CA, USA), equipped with a Zorbax Eclipse AAA C18 column (4.6 mm × 75 mm × 3.5 μm particle size) and a Zorbax Eclipse AAA precolumn (4.6 mm × 12.5 mm × 5 μm), a gradient mobile phase (water, methanol, acetonitrile), and NaH2PO4 buffer at pH 8.2. The operating temperature was 40 °C, and the flow rate was 2 mL/min. Derivatization was performed using o-phthalaldehyde (OPA) and 9-fluorenyl methoxycarbonyl chloride (Fmoc). Primary amino acids were detected at 338 nm and secondary amino acids at 262 nm. The calibration curve was constructed using a mixture of amino acid standards ranging from 0.2 to 0.5 μmol/mL (Sigma-Aldrich, St. Louis, MO, USA).
2.10. Protein Digestibility-Corrected Amino Acid Score (PDCAAS)
To calculate the PDCAAS, Equation (5) was first used to determine the limiting amino acid present in the protein under analysis. The presence of the essential amino acids obtained from the amino acid composition analysis was considered, all relative to the reference protein [33]. Next, the PDCAAS was calculated using Equation (6), considering the digestibility (D) of the protein under analysis, determined using Equation (1).
The amino acid reference patterns for children, older children, adolescents, and adults recommended by the FAO [33] were used as reference proteins.
3. Experimental Design and Statistical Analysis
A factorial central composite experimental design was used with 12 experimental runs, 4 center points, and 2 axial points. This kind of design is key to applying Response Surface Methodology. It is useful to optimization processes because it uses less experiment number than a factorial design of three levels, permit evaluating the process curvature through their axial and star points, the same way permit to measure variability and repeatability of process through their central points. Two factors were considered: bath temperature (T), i.e., 65–85 °C, and mass per unit area (W/A), i.e., 0.256–0.367 g/cm2. Five response variables were determined: digestibility (D), sulfhydryl bonds (SH), amino acid score (PDCAAS), effective diffusion coefficient (Deff), and final moisture content (FMC) on wet basis. The temperature was selected as factor due to its effect on the quality of protein, which is the main objective in this study, while the mass per unit area affects the heat transfer into the product. Table 1 summarizes the results for each response variable across all experimental runs. The factor effects and coefficient values estimated in the model were determined using analysis of variance (ANOVA), for which the p-value was considered at a 95% confidence level. Design-Expert 11.1.2.0 software (Stat-Ease, Minneapolis, MN, USA) was used to generate and analyze data, and to optimize the experimental design. For the latter, the response variables D, SH, PDCAAS, and Deff were maximized, and FMC was minimized.
Table 1.
Matrix of the composite central factorial experimental design.
4. Results and Discussion
Table 2 presents the bromatological characterization of the CRW before drying with the RW method.
Table 2.
Proximate analysis of the raw CRW.
Table 3 presents the aminograms for each experimental run, which served as the basis for calculating PDCAAS.
Table 3.
Amino acid composition of the twelve experimental runs.
4.1. Effect of Factors on Response Variables in CRW Drying
Table 4 shows the results of the analysis of variance for each response variable, including only significant terms (p-value < 0.05) and those required to maintain the design hierarchy (lower-order terms with p-values > 0.05 but included in a higher-order term). Likewise, the lack of fit and R2, adjusted R2, predicted R2 and adeq precision are shown for each of the obtained models. Table 4 shows that, in all models, the lack of fit was not significant, while R2 had acceptable values in all cases. Despite the R2, adjusted R2, predicted R2 not being very high, all models are significant, and the Adeq precision as secondary checking tool is higher than 4 in all models, which indicates that the noise-signal ratio requirement is complemented [34]. Thus, indicates that the factors can adequately explain the responses and that the models are useful for navigating the range of the factors under study. The temperature factor had a significant effect on the variables: FMC and Deff, while W/A had a significant effect on the variables FMC, Deff, and SH, with a single significant interaction between the factors, on SH. The temperature factor also presented two quadratic effects on digestibility (D) and PDCAAS, indicating that extreme points exist within the studied ranges.
Table 4.
Analysis of variance ANOVA.
Based on the ANOVA (p < 0.05), polynomial models were defined for each response variable, as detailed in Table 5. The latter shows that the models for D and PDCAAS have a quadratic term for temperature that has the opposite sign to the linear term of the same factor, indicating that there is an extreme point in these responses. Conversely, although FMC includes a quadratic term for temperature, this term has the same negative sign as the linear term. Therefore, it is not associated with an extreme point but rather with a sustained downward trend. On the other hand, the interaction between factors is just significant in SH answer, in which both factors have synergistic effects.
Table 5.
Mathematical models of the response variables.
4.2. Effect on Digestibility
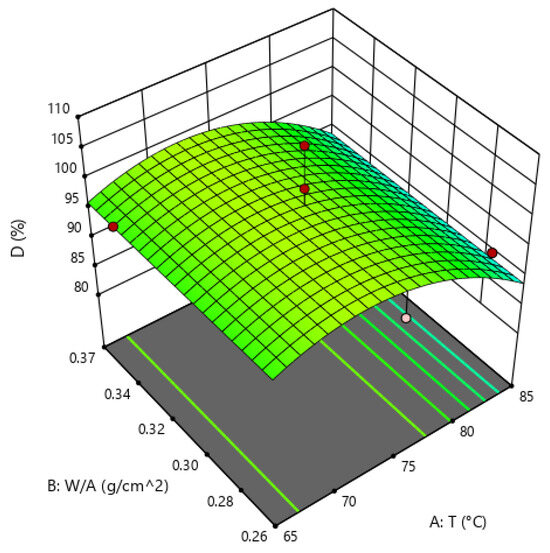
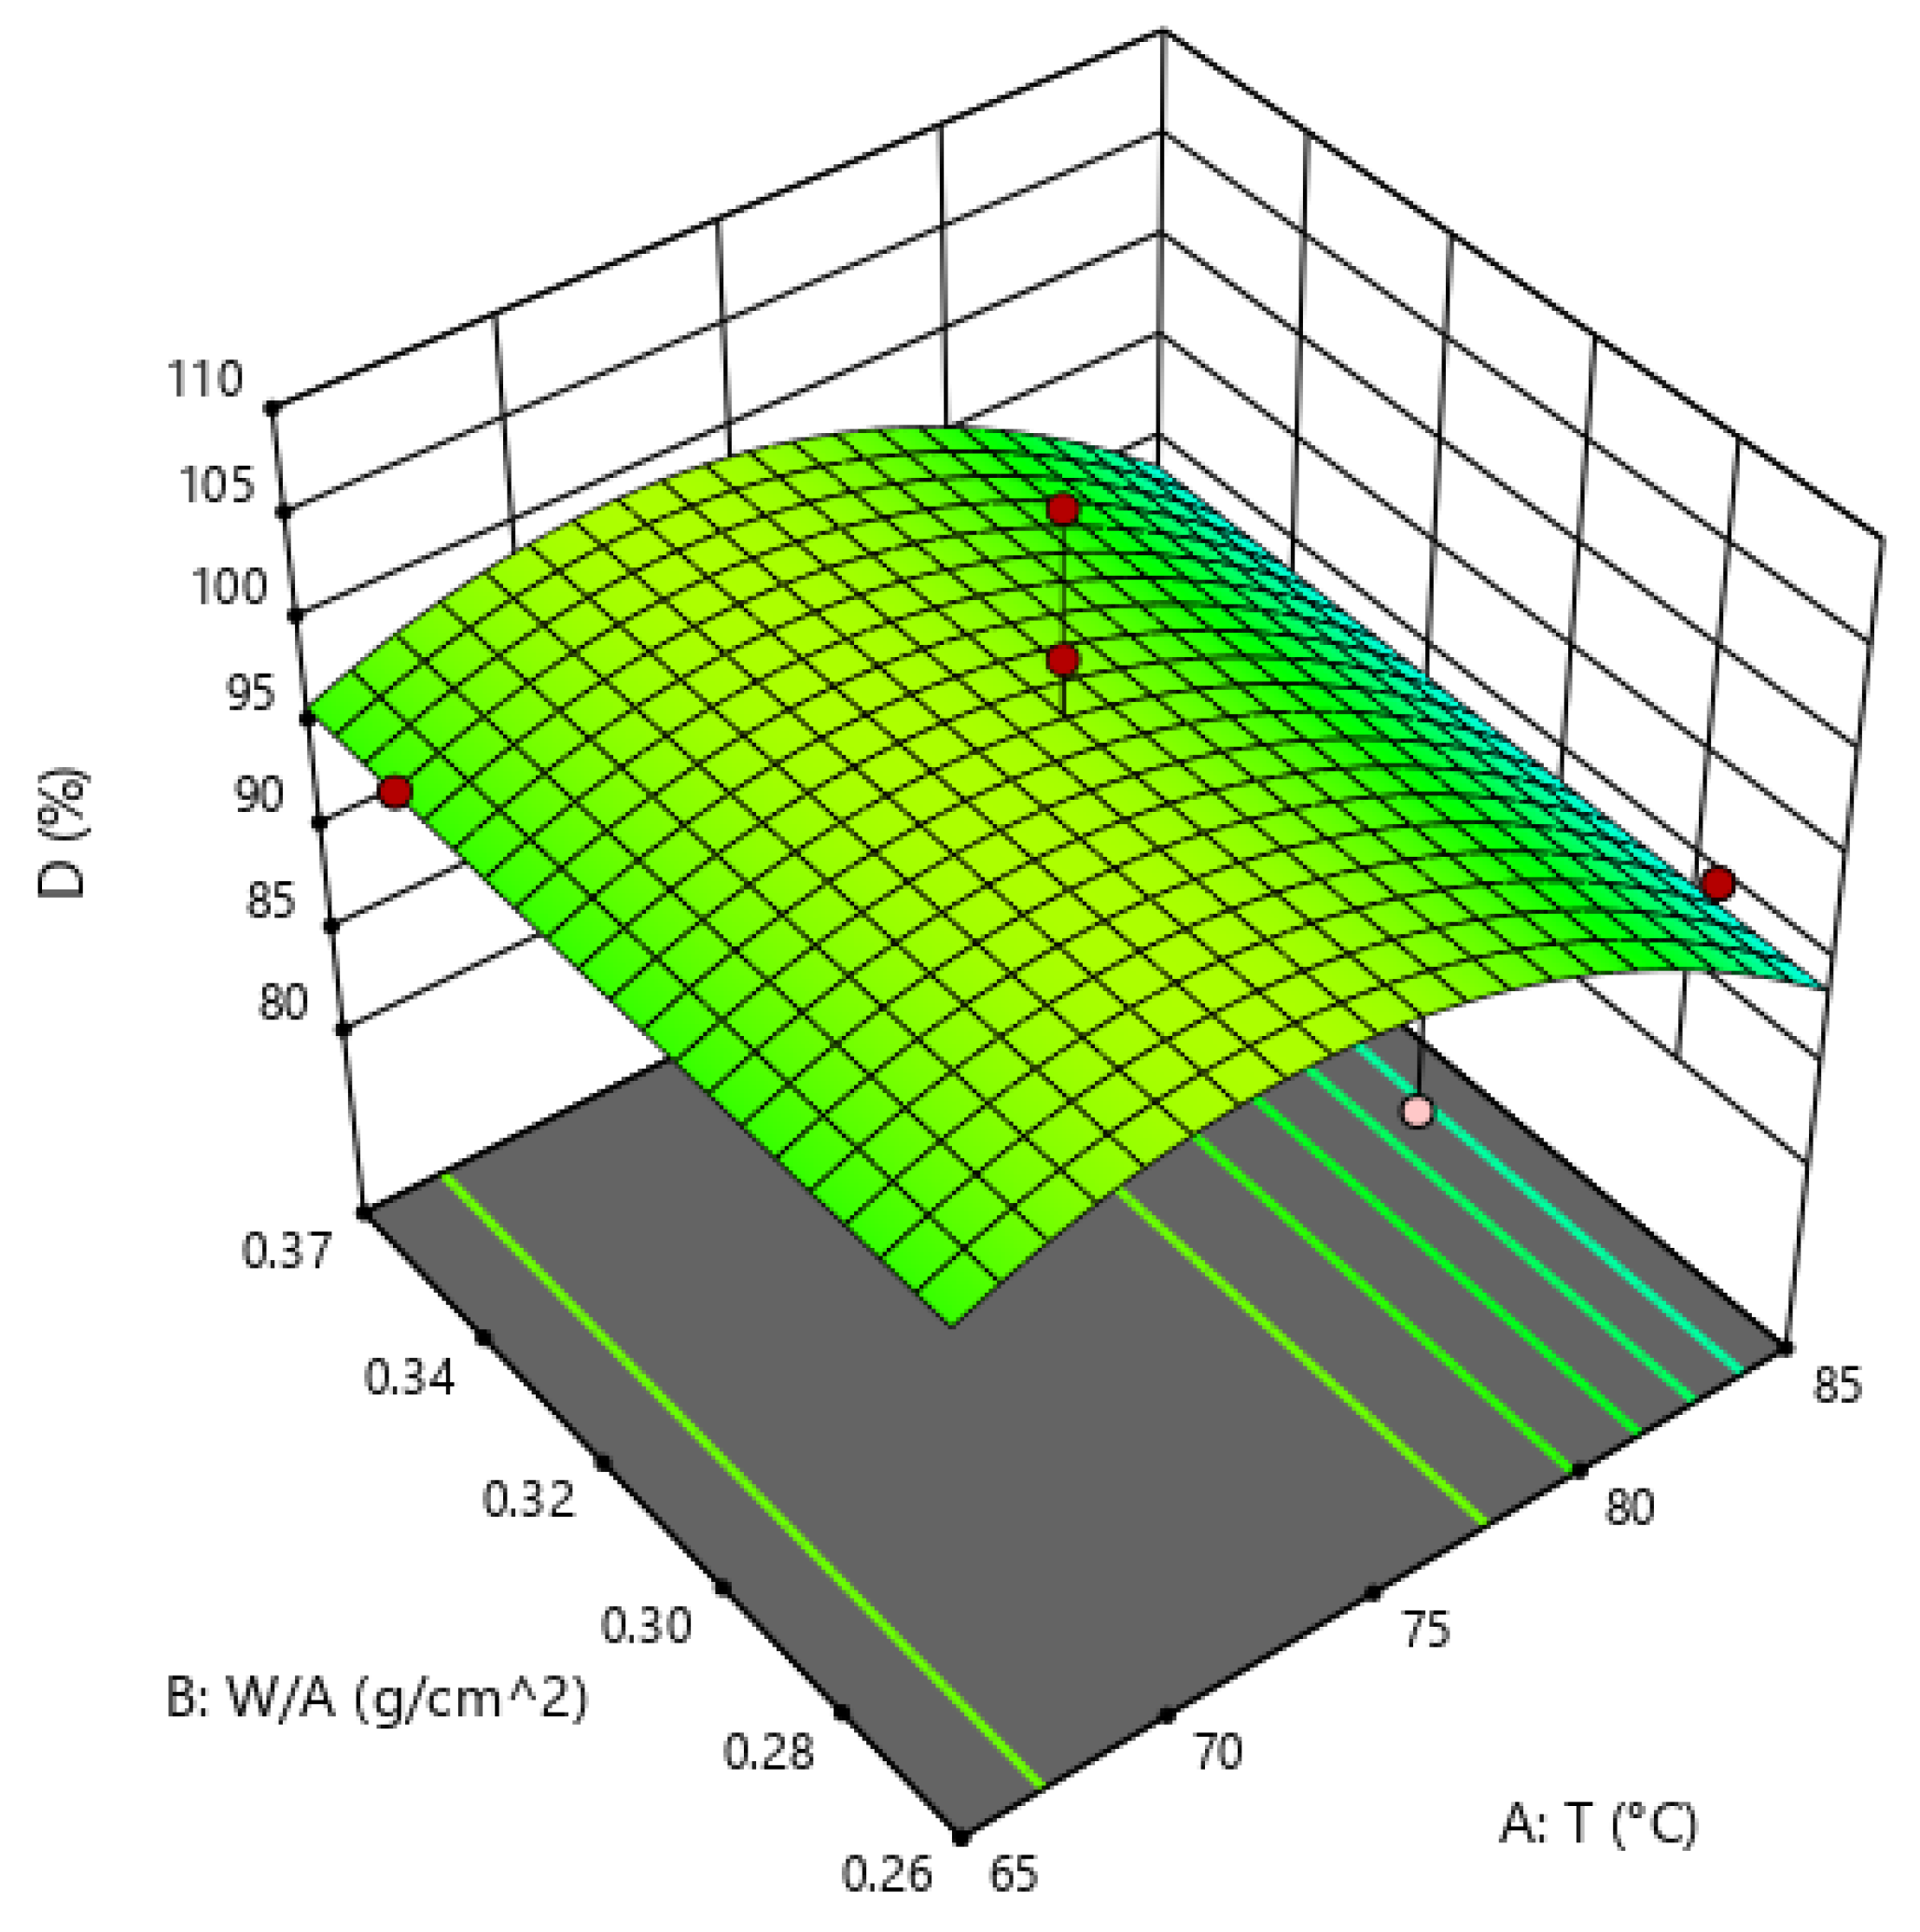
Figure 2 presents the response surface describing digestibility behavior as a function of the factors. It can be observed that as temperature increases, digestibility also increases. However, it begins to decrease as temperatures exceed 75 °C. This behavior may occur because, as temperature increases, the protein surface changes as the protein unfolds, thereby exposing a greater number of sites susceptible to hydrolysis, which would increase digestibility up to around 70 °C [35]. However, above this temperature, protein denaturation may occur, which involves the breakdown of its three-dimensional structure. In some cases, this may benefit how digestive enzymes interact with it, but in others, it may hinder it, affecting its ability to be digested and absorbed [36]. Particularly, the relationship between protein digestibility and temperature is very important because the digestibility is associated with protein bio accessibility, amino acids bioavailability, and the digestion rate, which determines the uptake of the intake amino acids [36].
Figure 2.
Effect of factors on Digestibility (D).
The values in Table 1 are in the same order of magnitude as those obtained by Rodríguez [37], who reported digestibility values of 85.7% for fish meal, and those of Ayala-Rodríguez et al. [38], who obtained 94.15% digestibility for fava bean (Vicia faba L.) flour.
4.3. Effect on Effective Diffusivity Coefficient (Deff)
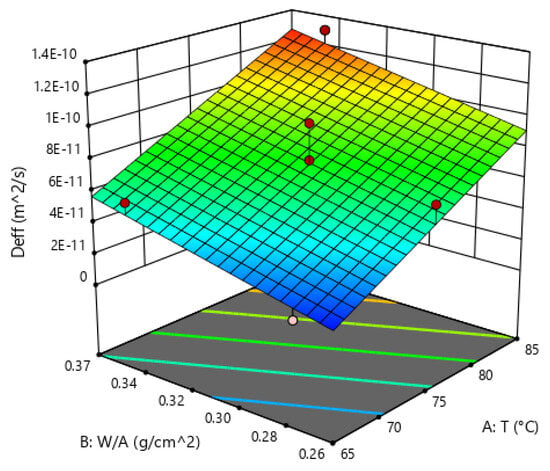
Figure 3 shows the behavior of Deff as a function of the factors. It can be seen that Deff increases with temperature, which is consistent with temperature promoting mass transfer. The values obtained range from 1.903 × 10⁻¹¹ to 1.304 × 10⁻¹⁰ m2/s, which fall within the order of magnitude for food drying. Likewise, Franco et al. [17] performed RW drying at 95 °C, and their Deff values for salmon, meat, and apple were 2.96 × 10⁻¹⁰ m2/s, 8.86 × 10⁻⁹ m2/s, and 14.3 × 10⁻¹⁰ m2/s, respectively. Similarly, Ortiz-Jerez et al. [24] dried pumpkin seeds using the RW method and found a Deff of 9.60 × 10⁻¹⁰ m2/s. These Deff values also match those of protein-rich foods dried by other methods under different conditions, such as beef dried by thin-layer convection, as reported by Mewa et al. [39], who found values ranging from 4.234 × 10⁻¹¹ to 5.590 × 10⁻¹⁰ m2/s. Furthermore, they also match those obtained after drying fruits and vegetables, as in the case of Gonzales et al. [40], who reported values between 7.75 × 10⁻¹⁰ and 2.027 × 10⁻⁹ m2/s for the RW drying of pineapple. The increase in Deff with rising temperatures has also been reported by Ochoa-Martínez et al. [14] for the RW drying of mango slices. This phenomenon was explained by the reduced shrinkage of the sample and greater porosity when dried at temperatures < 100 °C, making it easier for water to diffuse and consequently resulting in a higher Deff [41].
Figure 3.
Effect of factors on the effective diffusion coefficient (Deff).
4.4. Effect on Final Moisture Content (FMC)
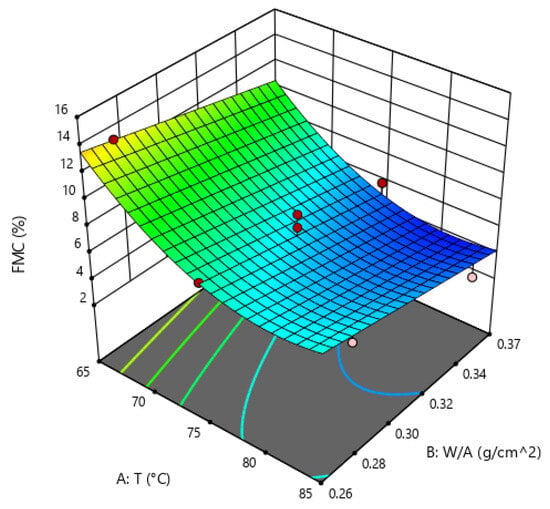
Figure 4 presents the behavior of final moisture content (FMC) on a dry basis, showing that as temperature increases, moisture content decreases. This is because the temperature rise promotes heat transfer via both conduction and convection through the Mylar® sheet, thereby accelerating the evaporation of water molecules—primarily from free water—from the food surface [42]. On the other hand, at low temperatures, the sample exhibits a high percentage of moisture, exceeding that reported for dehydrated products such as flour. This may be due to less kinetic energy being transferred through the Mylar® to the water in the food, and to the formation of a gel layer on top of the samples to be dried, which traps the water and prevents moisture release—a phenomenon known as cementation [43]. This has occurred in the RW drying of the chicuro plant (Stangea rhizantha), with final moisture content values of 9.5% (db) reported by Perez et al. [44], and in the drying of kiwi slices, with a final moisture content of 13% (db) [45].
Figure 4.
Effect of factors on final moisture content (FMC).
Additionally, the final moisture content increases with a higher W/A ratio because mass and heat transfer depend on the surface-to-volume ratio; as the W/A ratio increases, the surface-to-volume ratio decreases, delaying moisture loss [45].
RW drying has also been implemented for samples of different thicknesses. For example, Ochoa-Martínez et al. [14] dried 1- and 2-mm-thick mango slices at 90 °C and demonstrated that thickness has a significant effect on the sample’s moisture content, as the 1-mm slices reached a moisture content of 0.02 kg water/kg dry matter in 30 min, whereas a drying time of 60 min was required to achieve the same moisture content in the 2-mm slices.
4.5. Effect on Free Sulfhydryl (SH) Bonds
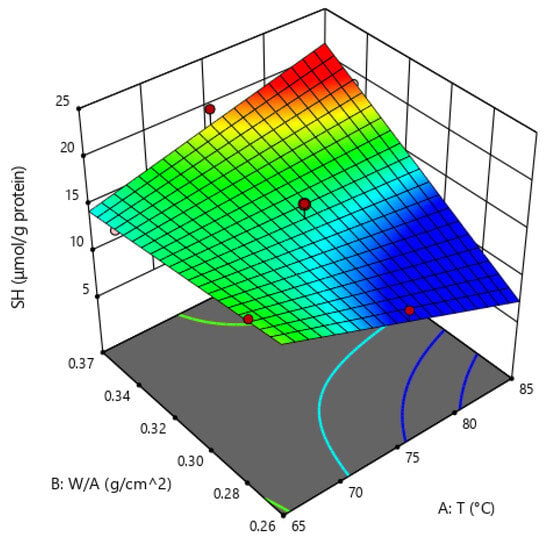
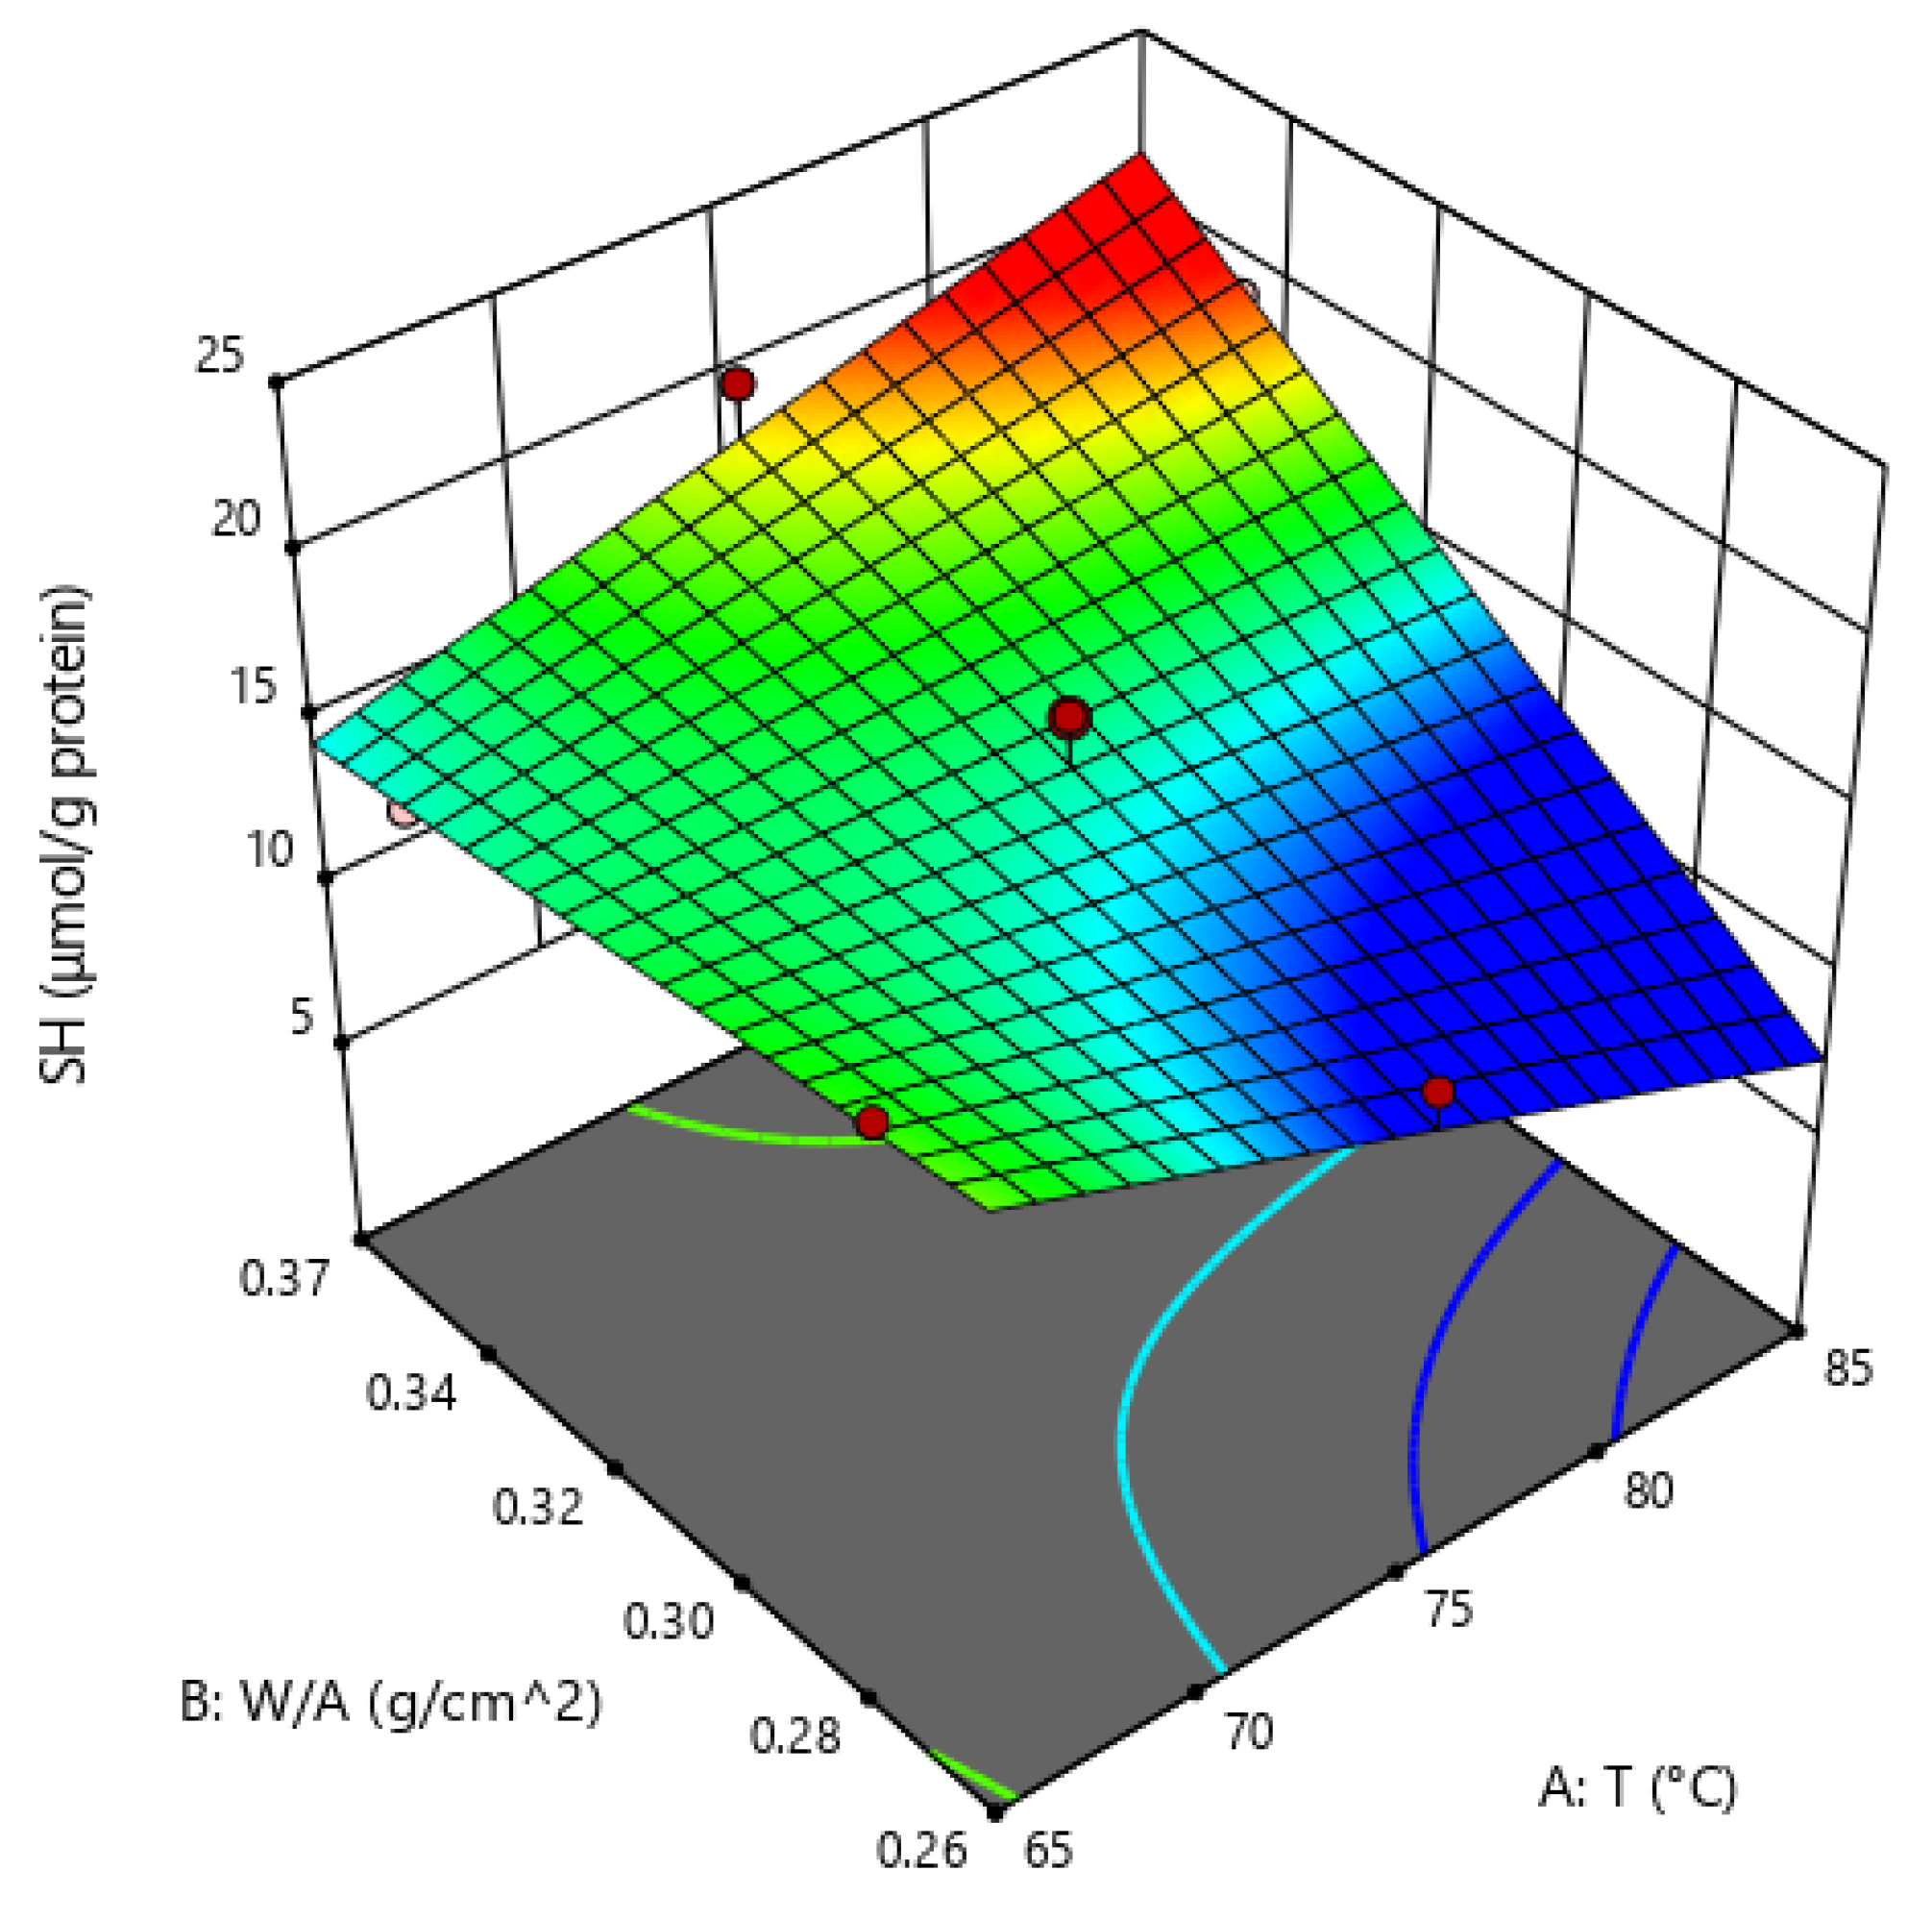
Figure 5 shows how SH increases with temperature. This may be due to the unfolding of proteins with hydrophobic groups during cooking processes, which causes these groups to be exposed [21]. This unfolding begins between 67.5 °C and 75 °C and becomes irreversible at higher temperatures (75–90 °C), resulting in the exposure of thiol groups [46]. This kind of process can produce some coagulation type in some food systems. In the present study, SH groups were obtained in the range from 12.74 to 19.57 μmol/g of protein. These values are similar to those reported by Cerda [47] for quinoa flour: an average of 18.5 μmol/g of protein. Furthermore, Ormando et al. [48] studied the effect of high hydrostatic pressure on amylases by determining sulfhydryl bonds. They reported that an increase in the temperature of the pressurization medium causes protein unfolding, which is reflected in an increase in free SH groups, with average values of 2.5 μmol/g protein.
Figure 5.
Effect of factors on Sulfhydryl Bonds.
4.6. Effect on the Protein-Digestibility Corrected Amino Acid Score (PDCAAS)
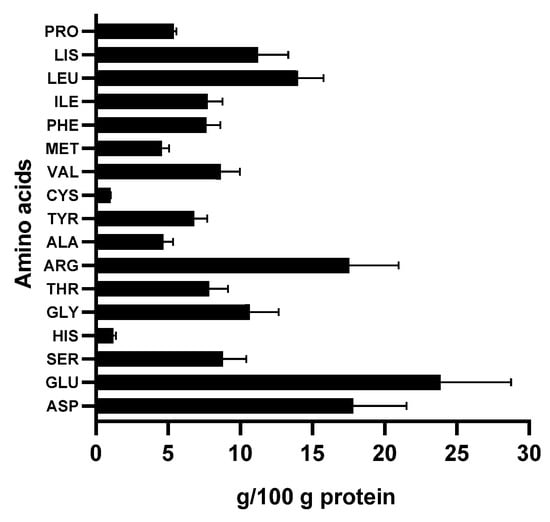
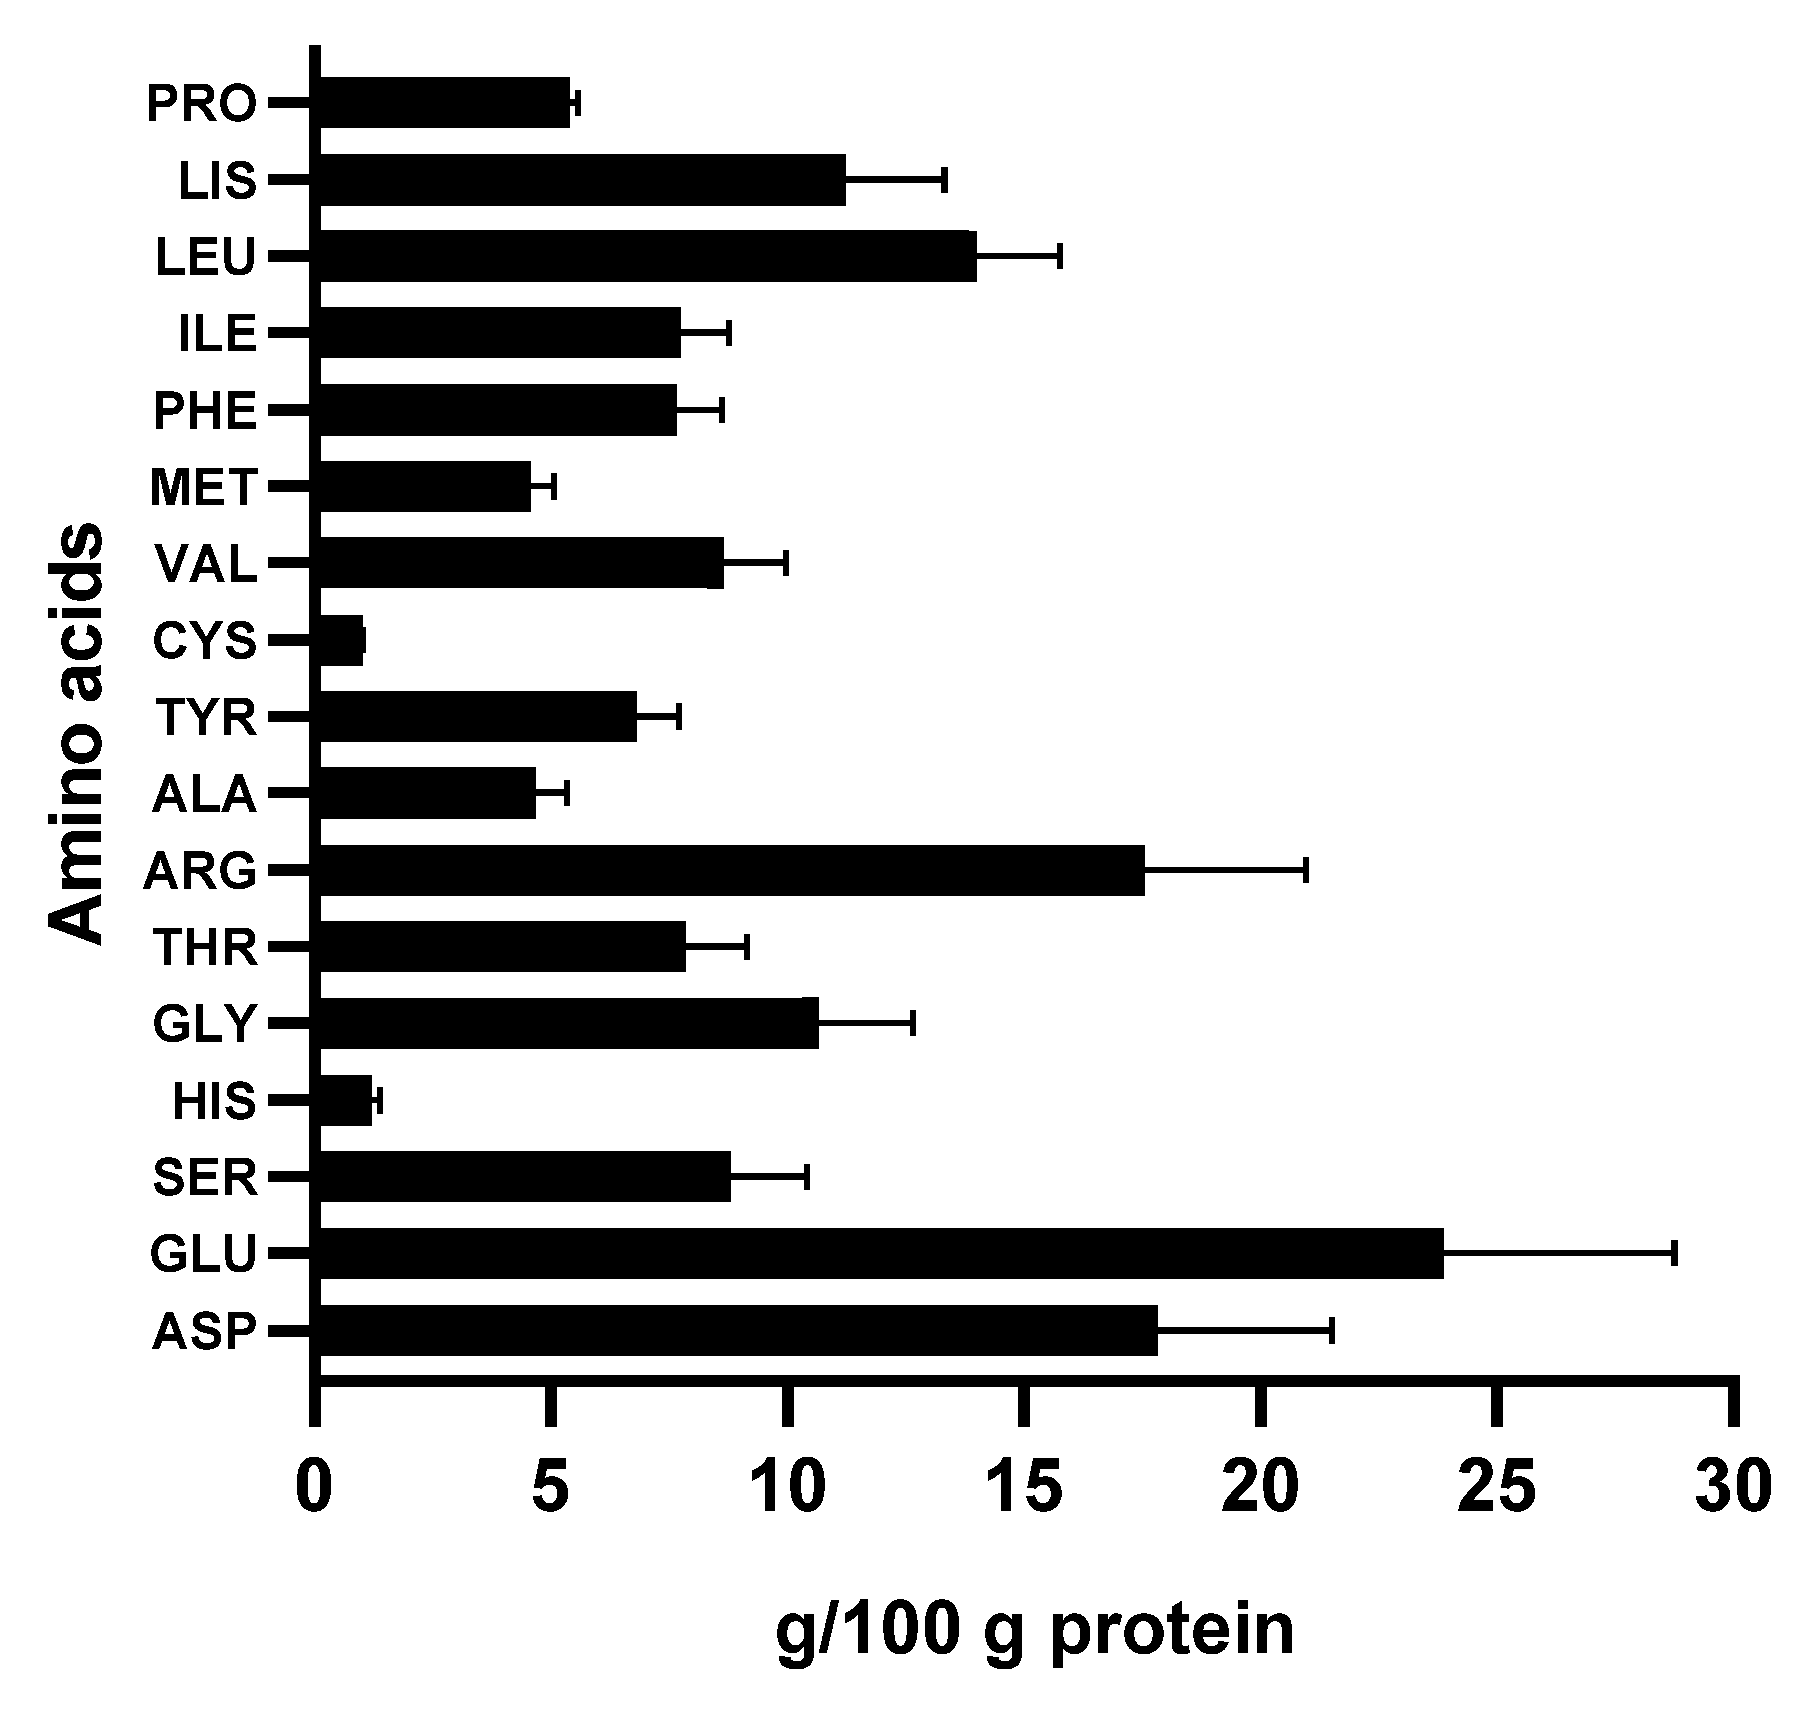
To analyze the effect of the factors on PDCAAS, it was necessary to perform a preliminary amino acid analysis of the sample dried by RW under optimal conditions. Figure 6 shows the amino acid composition of the optimized CRW meal, in which the most abundant amino acids were Glu, Asp, and Arg, with values of 23.87, 17.83, and 17.55 g/100 g protein, respectively. Essential amino acids such as Ile, Leu, Lys, Phe, Thr, Val, and Arg were found in good quantities. These results can be compared with those obtained by Vielma et al. [49], who studied the amino acid composition of CRW meal obtained by freeze-drying. They found high levels of Glu, Asp, Gly, and Leu with values of 9, 7.1, 5.7, and 16.6 (%w/w), respectively. Additionally, other authors such as Ovalles et al. [50] have found interesting amino acid compositions in the meal made from different earthworm species like Eisenia andrei, which was produced by tray drying with air recirculation at temperatures of 30, 40, and 45 °C. The amino acids with the highest reported concentrations included Glu, Asp, and Arg at 14, 9.3, and 8 g/100 g protein, respectively. Both studies show a similar order of quantified amino acid concentrations. However, the concentration values reported in this study are higher.
Figure 6.
Amino acid composition of CRW flour.
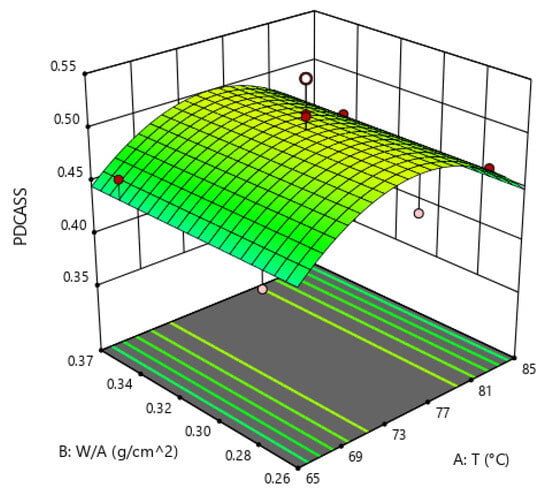
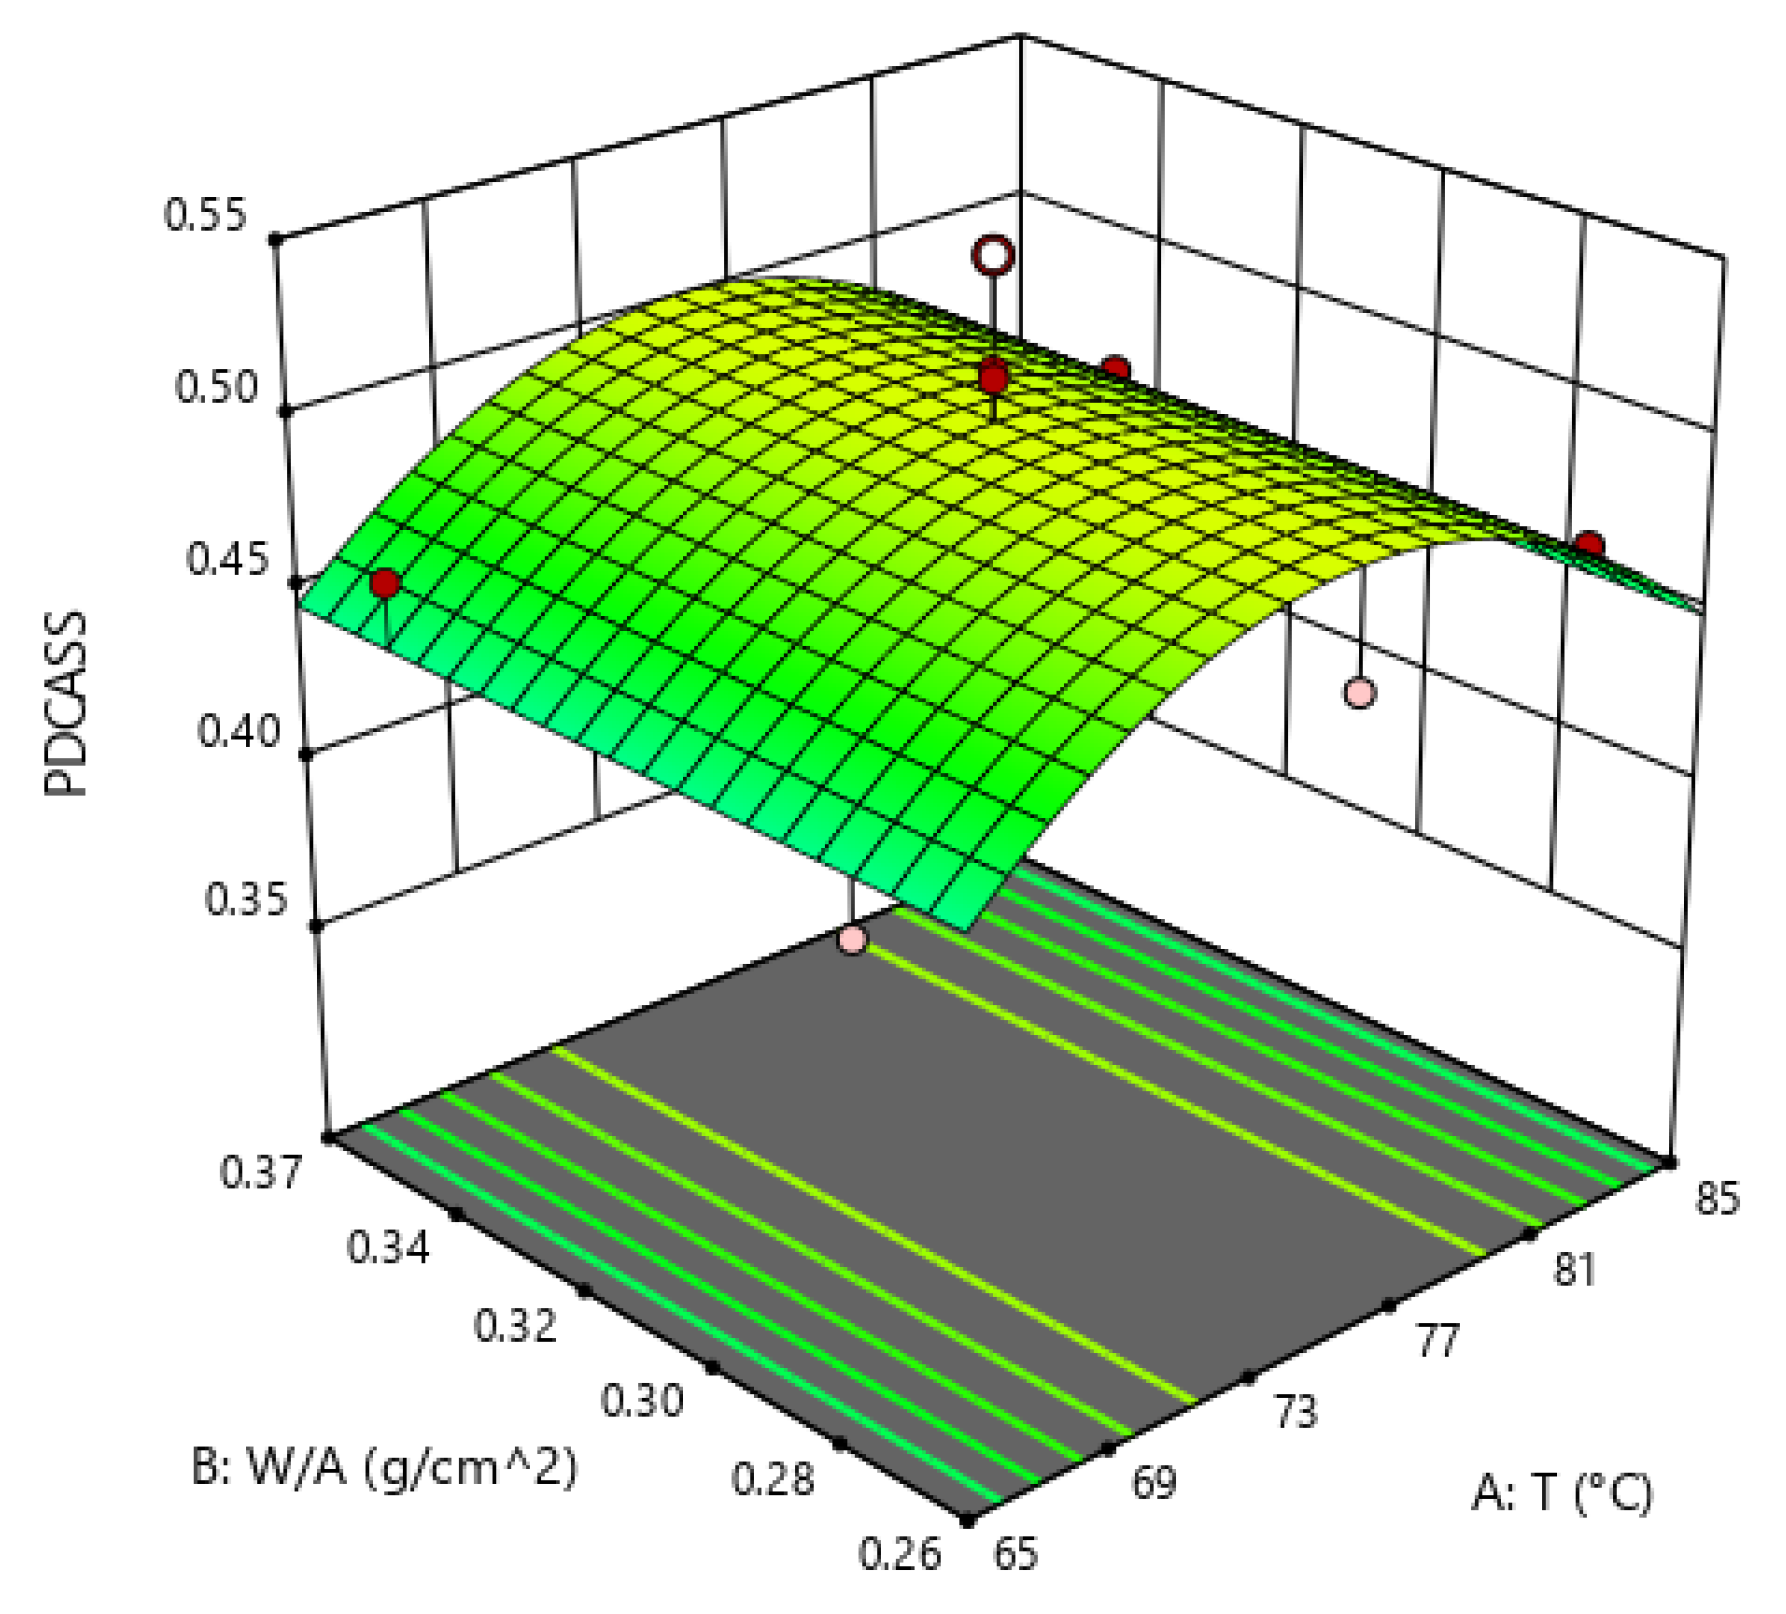
The effect of the factors on PDCAAS is shown in Figure 7. The latter illustrates the effect of temperature with a peak near 75 °C (consistent with the ANOVA results), which has a significant second-order effect. This is likely because proteins begin to denature above 70 °C [26].
Figure 7.
Effect of the factors on the PDCASS.
The PDCAAS values obtained in this study ranged from 0.388 to 0.548. It was observed that PDCAAS values increase as temperature rises; however, when temperatures exceed 80 °C, these values begin to decrease. Meanwhile, the W/A ratio (g/cm2) did not affect the PDCAAS. These values are similar to those reported by Mamani [51], who studied a mixture of meals and protein sources, including quinoa flour, and obtained a PDCAAS of 0.45. Furthermore, Morris et al. [52] studied the protein quality of the biomass of the Chlorella vulgaris 87-1 strain dehydrated by spray drying. Its PDCAAS value was 0.64, and its limiting amino acids were also cysteine (Cys) and the sulfur-containing amino acids (Met + Cys). On the other hand, PDCAAS values of 0.90 have also been reported for rice bran [53].
4.7. Optimization of CRW Drying Conditions by RW Method
The models obtained from the ANOVA were optimized to maximize response variables and thus obtain a meal with the highest possible protein quality using the RW drying process. Table 6 shows the results of the optimization process, both those predicted by the models and the experimental results obtained under optimal conditions. Despite experimental results of answers obtained under optimum conditions are not too close to answer predicted (Table 6), is clear the relationship between the proximity predicted-experimental answer and the R2 obtained for each answer and at general sense the answers are in the magnitude order of the predicted values, for that reason it is possible to affirm that Response surface methodology is an useful tool to simulate and optimize this process. Besides, these optimal conditions favor kinetic variables such as Deff and FMC, without compromising protein quality variables such as D, SH, and PDCAAS, and most protein quality values achieved experimentally were higher than those predicted.
Table 6.
Comparison of predicted optimal values and experimental results.
With a desirability of 73%, a higher-than-predicted digestibility of 97.14% was obtained. This is a positive finding for the study, as it exceeds the results reported by Ayala-Rodríguez et al. [38] (94.15%) and Rodríguez [37] (85.7%). The FMC was higher than predicted, at 6.80%. This value falls within the range reported for meals, which, using wheat flour as a reference, should be less than 15% [54]. The effective diffusion coefficient, Deff, is within the range reported for food drying, with a value of 6.090 × 10⁻¹¹ m2/s. Finally, a value of 14.84 μmol/g protein was obtained for SH, which is close to that obtained by Cerda [47], who reported 18.50 μmol/g for quinoa flour. The experimental PDCAAS value obtained (0.780) was higher than the predicted estimate and also exceeded those reported for other food sources, such as lentils (0.52) and quinoa flour (0.45), as documented by Bejosano & Corke [55] and Cerda [47], respectively.
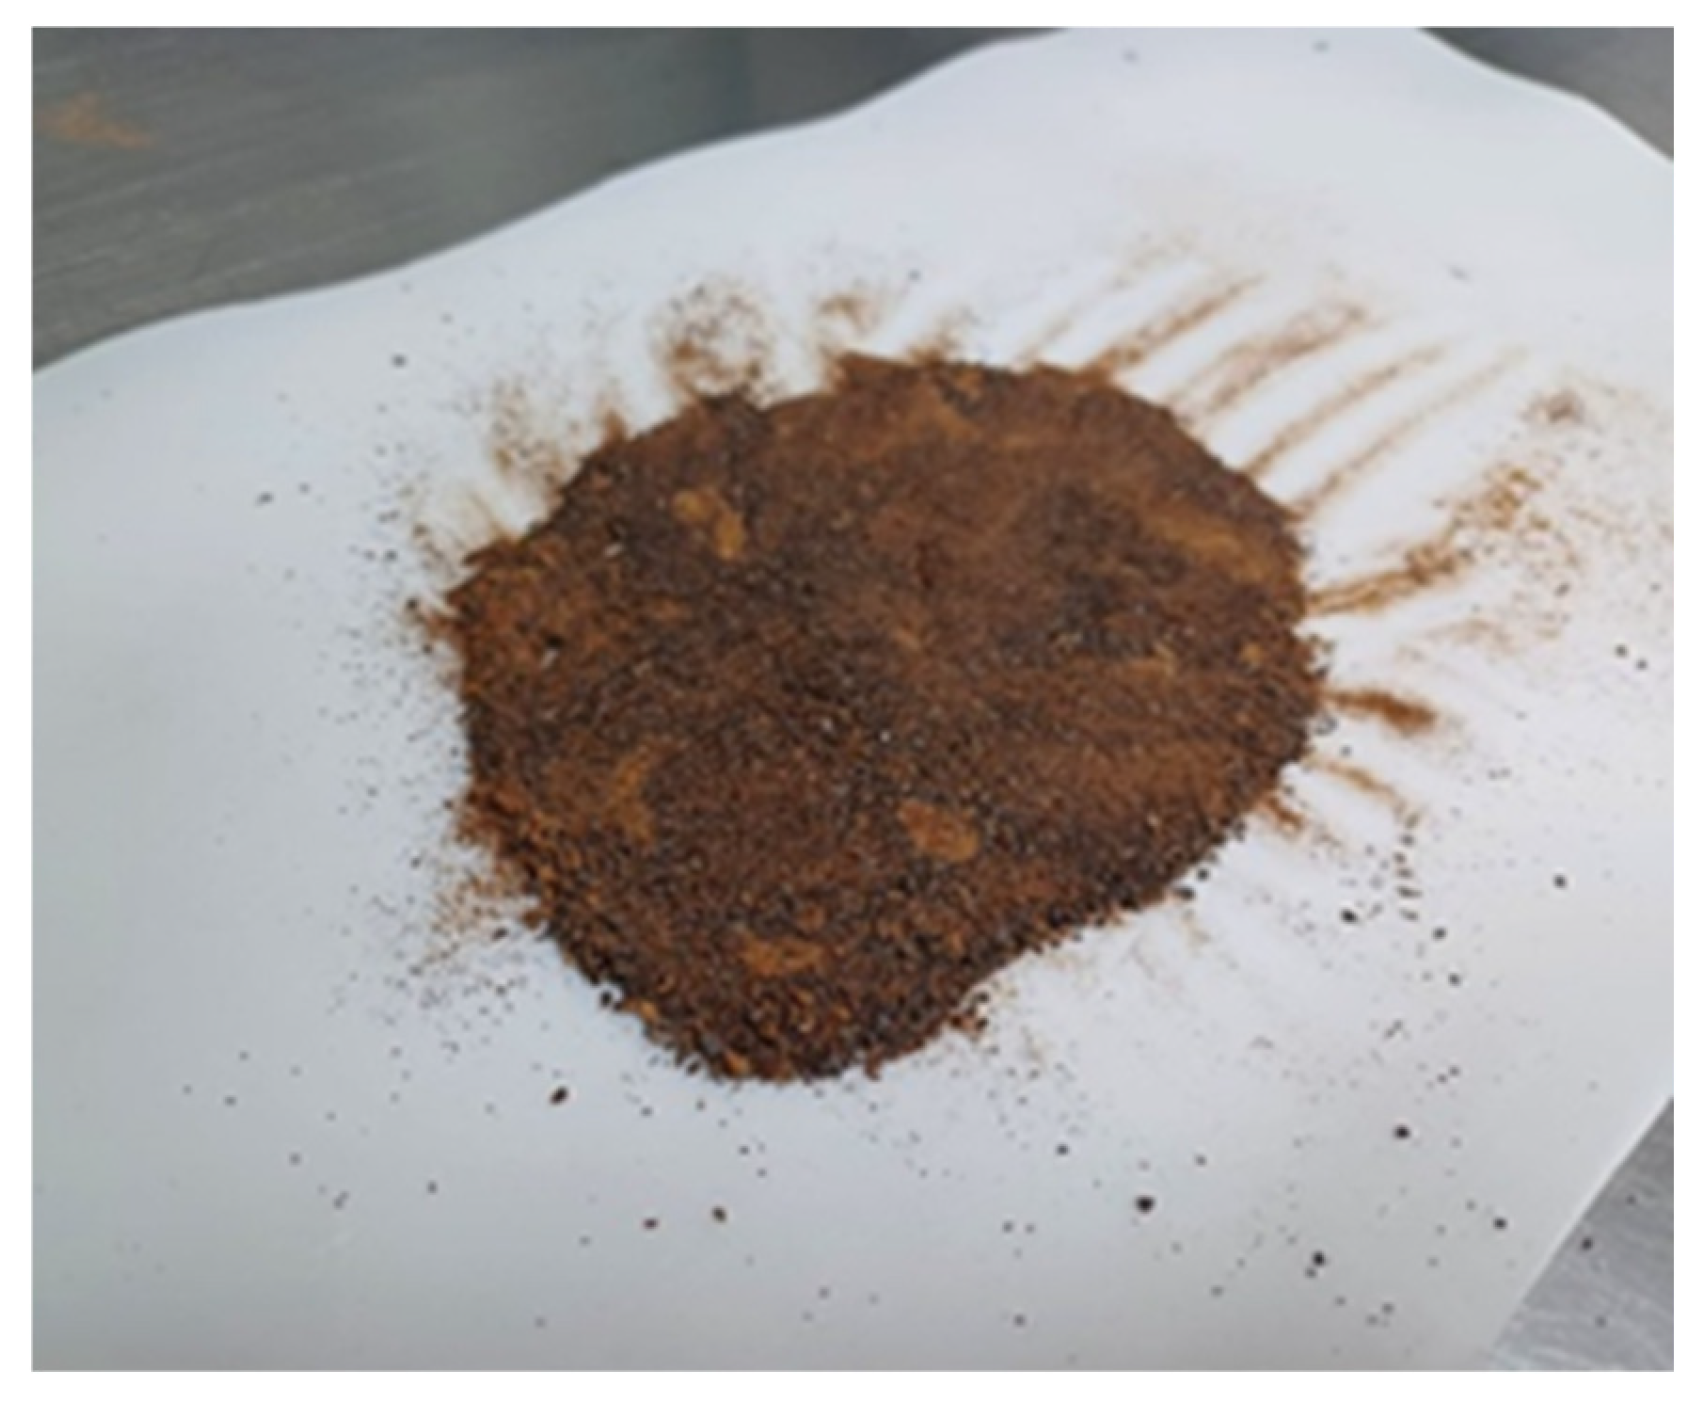
On the other hand, Figure 8 shows the flour obtained under optimum conditions, while in Table 7, the bromatological results of this are shown. These results are in the same range as those of Alcívar et al. [11], who worked with CRW in a drier tray with air circulation to 60 °C. However, differences were observed in the obtained results within the same system at 90 °C, where the protein content was 23.38%. On the other hand, Suárez et al. [56], who worked with tunnel, oven, microwave, and sun dryers, obtained CRW flour with protein contents similar to those reported in this study.
Figure 8.
Flour obtained under optimum conditions.
Table 7.
Bromatological composition of CRW flour.
It is important to consider that the stability and shelf life of high-protein flours are influenced not only by moisture content but more critically by water activity (aw), which regulates chemical, enzymatic, and microbial reactions. Although drying is widely used for preservation, products with similar moisture levels may show different stability depending on aw [14,20], and residual water can promote degradation during storage [21]. Additionally, drying may induce structural changes in proteins, affecting digestibility and functionality through denaturation, aggregation, and oxidation [30,31,35]. Reactions such as Maillard browning can further reduce essential amino acid availability, decreasing protein quality as measured by PDCAAS [22,33]. Therefore, future studies should evaluate the relationship between final moisture content, water activity, and protein quality indicators during RW drying of CRW to enable a more accurate assessment of the stability and shelf-life of the resulting flour.
5. Conclusions
Water temperature and W/A significantly affect the most important variables in the RW drying of CRW (Eisenia fetida), with temperature being the most relevant factor. The kinetic variables final moisture content (FMC) and effective diffusion coefficient (Deff) can be maximized at a temperature of 79.9 °C and a sample load of 0.367 g/cm2 without negatively affecting variables associated with protein quality, such as digestibility (D), sulfhydryl bonds (SH), and PDCAAS. Above this limit, the digestibility (D) and PDCAAS of protein are negatively affected, indicating that extreme points exist within the ranges studied for these variables, which are the most important aspects of the protein quality. Response Surface Methodology is a useful tool to optimize the RW process under these study conditions.
Author Contributions
V.A.S.-U.: Conceptualization, Sample Collection, Formal Analysis, Drafting and Original Draft, Methodology, Data Curation, Statistical Analysis, Validation. M.J.O.-J.: Methodology, Supervision, Review, and Editing. J.E.Z.M.: Methodology, Supervision, Review, and Editing. All authors have read and agreed to the published version of the manuscript.
Funding
The authors are grateful for the financial support provided by Comité para el Desarrollo de la Investigación en la Universidad de Antioquia (CODI) through sustainability program and MINCIENCIAS through the convening for strengthening knowledge on institutions of public superior education. (Project Code 1115-890 82040).
Institutional Review Board Statement
Not applicable.
Informed Consent Statement
Not applicable.
Data Availability Statement
The original contributions presented in the study are included in the article, further inquiries can be directed to the corresponding author.
Acknowledgments
The authors would like to thank the Universidad de Antioquia and MINCIENCIAS through the call for the strengthening of knowledge in public higher education institutions (Project Code 1115-890 82040) for funding this project.
Conflicts of Interest
The authors declare no conflict of interest.
Abbreviations
CRW: Californian red worm; RW: Refractance window; W/A: mass per unit area; D: Digestibility; SH: Sulfhydryl bonds; PDCAAS: Protein digestibility-corrected amino acid score; FMC: Final moisture content; Deff: Effective diffusion coefficient; HPLC: High-performance liquid chromatography, AA: Amino acids; ASP: Aspartic acid; GLU: Glutamic acid; SER: Serine; HIS: Histidine; GLY: Glycine; THR: Threonine; ARG: Arginine; ALA: Alanine; TYR: Tyrosine; CYS: Cysteine; VAL: Valine; MET: Methionine; PHE: Phenylalanine; ILE: Isoleucine; LYS: Lysine; PRO: Proline.
References
- United Nations Environment Programme. Think Eat Save: Tracking Progress to Halve Global Food Waste. 2024. Available online: https://www.unep.org/resources/publication/food-waste-index-report-2024 (accessed on 26 May 2026).
- Salazar, N.J.; Enriquez Valencia, S.; Zuñiga Martinez, B.S.; González Aguilar, G. Residuos agroindustriales como fuente de nutrientes y compuestos fenólicos. Epistemus 2023, 17, 60–69. [Google Scholar] [CrossRef] [Scilit]
- González, D.; Gomez, J.A.; Martinez, A.; Sotelo, M.J. Proyecto pedagógico para buenas practicas ecológicas para la conservación de nuestro planeta, en la granja experimental cica, Cimitarra—Santander. CITECSA 2019, 11, 9. [Google Scholar]
- Vodounnou, D.S.J.V.; Kpogue, D.N.S.; Tossavi, C.E.; Mennsah, G.A.; Fiogbe, E.D. Effect of animal waste and vegetable compost on production and growth of earthworm (Eisenia fetida) during vermiculture. Int. J. Recycl. Org. Waste Agric. 2016, 5, 87–92. [Google Scholar] [CrossRef] [Scilit]
- Castiblanco, V.; Liceth, Y.; Pineda, S.; Enrique, D.; Álvaro, C.P. Lombricultura como tratamiento de residuos sólidos orgánicos en Colombia. Semilleros 2014, 1, 95–104. [Google Scholar]
- Gaviria, Y.S.; Zapata, J.E. Optimization and scale up of the enzymatic hydrolysis of Californian red worm protein (Eisenia foetida). Heliyon 2023, 9, e16165. [Google Scholar] [CrossRef] [Scilit]
- Cayot, N.; Cayot, P.; Bou-Maroun, E.; Laboure, H.; Abad, R.B.; Pernin, K.; Medina, A.L. Physico-chemical characterisation of a non-conventional food protein source from earthworms and sensory impact in arepas. Int. J. Food Sci. Technol. 2009, 44, 2303–2313. [Google Scholar] [CrossRef] [Scilit]
- Luengas, G.N. Bebida Instantánea a Base de la Harina de Lombriz Roja Californiana (Eisenia foetida) Protein Max. Bachelor’s Thesis, Corporación Tecnológica de Bogotá, Bogotá, Cundinamarca, 2015. Available online: https://repository.udca.edu.co/handle/11158/4869 (accessed on 26 May 2026).
- Zambrano, E.M.M. Importancia del Uso de la Harina de Lombriz en la Alimentación de Pollos de Engorde. Bachelor’s Thesis, Universiti Teknologi Brunei, Babahoyo, Brunei, 2023. Available online: https://dspace.utb.edu.ec/bitstream/handle/49000/15298/E-UTB-FACIAG-MVZ-000152.pdf?sequence=1 (accessed on 26 May 2026).
- Da Rosa, L.O.; Abreu, S.M.; Dias, Á.R.G. Las lombrices de tierra como fuente alternativa de proteínas para el consumo humano: Valor nutricional, sostenibilidad, procesamiento y consideraciones de seguridad: Una revisión sistemática. Bioresour. Technol. Rep. 2025, 33, 102494. [Google Scholar]
- Alcívar, U.; Dueñas, A.; Sacon, E.; Bravo, L.; Villanueva, G. Influencia de los tipos de secado para la obtención de harina de Lombriz Roja a escala piloto. Tecnol. Quím. 2016, 36, 225–236. [Google Scholar]
- Mediani, A.; Hamezah, H.S.; Jam, F.A.; Mahadi, N.F.; Chan, S.X.Y.; Rohani, E.R.; Che Lah, N.H.; Azlan, U.K.; Khairul Annuar, N.A.; Azman, N.A.F.; et al. A comprehensive review of drying meat products and the associated effects and changes. Front. Nutr. 2022, 9, 1057366. [Google Scholar] [CrossRef] [Scilit]
- Ochoa, E.; Ornelas, J.; Ruiz, S.; Ibarra, V.; Pérez, J.D.; Juan, G.A. Tecnología de deshidratación para la preservación de tomate (Lycopersicon esculentum Mill.). Biotecnia 2012, 15, 39–46. [Google Scholar]
- Ochoa-Martínez, C.I.; Quintero, P.T.; Ayala, A.A.; Ortiz, M.J. Drying characteristics of mango slices using the Refractance WindowTM technique. J. Food Eng. 2012, 109, 69–75. [Google Scholar] [CrossRef] [Scilit]
- Ortiz-Jerez, M.J.; Serna, Y.; Zapata, J.E. Kinetics of conductive hydro-drying of pumpkin (Cucurbita moschata) pulp. Heliyon 2024, 10, e36982. [Google Scholar] [CrossRef] [Scilit] [PubMed]
- Hilphy, A.R.; Ali, H.I.; Al-IEssa, S.A.; Lorenzo, J.M.; Barba, F.J.; Gavahian, M. Optimization of process variables on physicochemical properties of milk during an innovative refractance window concentration. J. Food Process. Preserv. 2020, 44, e14782. [Google Scholar] [CrossRef] [Scilit]
- Franco, S.; Jaques, A.; Pinto, M.; Fardella, M.; Valencia, P.; Núñez, H. Dehydration of salmon (Atlantic salmon), beef, and apple (Granny smith) using Refractance windowTM: Effect on diffusion behavior, texture, and color changes. Innov. Food Sci. Emerg. Technol. 2019, 52, 8–16. [Google Scholar] [CrossRef] [Scilit]
- Van ‘t Land, M.; Raes, K. Refractance window drying of fish silage—An initial investigation into the effects of physicochemical properties on drying efficiency and nutritional quality. LWT 2019, 102, 71–74. [Google Scholar] [CrossRef] [Scilit]
- Ortiz-Jerez, M.J.; Gulati, T.; Datta, A.K.; Ochoa-Martinez, C.I. Quantitative understanding of Refractance WindowTM drying. Food Bioprod. Process. 2015, 95, 237–253. [Google Scholar] [CrossRef] [Scilit]
- Mahanti, N.K.; Chakraborty, S.K.; Sudhakar, A.; Verma, D.K.; Shankar, S.; Thakur, M. Refractance WindowTM-Drying vs. other drying methods and effect of different process parameters on quality of foods: A comprehensive review of trends and technological developments. Future Foods 2021, 3, 100024. [Google Scholar] [CrossRef] [Scilit]
- Lupano, C.E. Modificaciones de Componentes de los Alimentos: Cambios Químicos y Bioquímicos por Procesamiento y Almacenamiento, 1st ed.; Universidad Nacional de La Plata: La Plata, Argentina, 2013; pp. 12–13. Available online: www.editorial.unlp.edu.ar (accessed on 26 May 2026).
- Quitral, V.; Abugoch, L.; Vinagre, J.; Larraín, M.A. Efecto de tratamientos térmicos sobre el contenido de lisina disponible en carne de jaiba mora (Homalaspis plana). Soc. Latinoam. Nutr. 2001, 51, 382–385. [Google Scholar]
- Morales-Herrejón, Y.G.; Márquez-Benavides, L.; Herrera-Camacho, J.; Cortés-Penagos, C.d.J.; Yahuaca-Juárez, B. Harina de lenteja como fuente alternativa de proteínas. Rev. Mex. De Cienc. Agríc. 2025, 16, e3696. [Google Scholar] [CrossRef] [Scilit]
- Reyes, G.; Corzo, O.; Bracho, N. Optimización de la deshidratación osmótica de sardina mediante la metodología de superficies de respuesta. Rev. Cient. 2005, 15, 377–384. [Google Scholar]
- Ortiz-Jerez, M.J.; Franco, A.; Zapata, J.E. Drying kinetics and sensory characteristics of dehydrated pumpkin seeds (Cucurbita moschata) obtained by refractance window drying. Heliyon 2022, 8, e10947. [Google Scholar] [CrossRef] [Scilit]
- Duque-Estrada, P.; Markussen, B.; Schutyser, M.; van der Goot, A.J.; Sørensen, J.C.; Markedal, K.E.; Lametsch, R.; Petersen, I.L. Effects of high-temperature treatment on in vitro protein digestibility and protein profiles of pea ingredients obtained from wet and dry fractionation. Food Chem. 2026, 514, 149181. [Google Scholar] [CrossRef] [Scilit]
- Cunniff, P.; Washington, D. Official methods of analysis of AOAC International. J. AOAC Int. 1997, 80, 127A–128A. [Google Scholar]
- Minekus, M.; Alminger, M.; Alvito, P.; Ballance, S.A. Standardised static in vitro digestion method suitable for food-an international consensus. Food Funct. 2014, 5, 1113–1124. [Google Scholar] [CrossRef] [Scilit] [PubMed]
- Crank, J. The Mathematics of Diffusion, 2nd ed.; Oxford University Press: London, UK, 1975; pp. 69–88. [Google Scholar]
- Ellman, G.L. Tissue Sulfhydryl Groups. Arch. Biochem. Biophys. 1959, 82, 70–77. [Google Scholar] [CrossRef] [Scilit]
- Yin, S.W.; Tang, C.H.; Wen, Q.B.; Yang, X.Q.; Li, L. Functional properties and in vitro trypsin digestibility of red kidney bean (Phaseolus vulgaris L.) protein isolate: Effect of high-pressure treatment. Food Chem. 2008, 110, 938–945. [Google Scholar] [CrossRef] [Scilit]
- Gómez, L.J.; Gómez, N.A.; Zapata, J.E.; López, G.; Cilla, A.; Alegría, A. In-vitro antioxidant capacity and cytoprotective/cytotoxic effects upon Caco-2 cells of red tilapia (Oreochromis spp.) viscera hydrolysates. Food Res. Int. 2019, 120, 52–61. [Google Scholar] [CrossRef] [Scilit] [PubMed]
- FAO. Dietary Protein Quality Evaluation in Human Nutrition; FAO: Rome, Italy, 2013; Available online: https://www.fao.org/ag/humannutrition/35978-02317b979a686a57aa4593304ffc17f06.pdf (accessed on 26 May 2026).
- Portilha-Cunha, M.F.; Malcata, F.X.; Reis, P.J.; Macedo, A.C. Towards a starter culture of Lactobacillus plantarum AFS13: Assessment of more relevant effects for in vitro production and preservation thereof, via fractional factorial design methodology. LWT 2020, 133, 110119. [Google Scholar] [CrossRef] [Scilit]
- Carrillo, W. Digestibilidad de las proteínas alergénicas. Quím. Viva 2014, 13, 109–122. [Google Scholar]
- Orlien, V.; Aalaei, K.; Poojary, M.M.; Nielsen, D.S.; Ahrné, L.; Carrascal, J.R. Effect of processing on in vitro digestibility (IVPD) of food proteins. Crit. Rev. Food Sci. Nutr. 2023, 63, 2790–2839. [Google Scholar] [CrossRef] [Scilit] [PubMed]
- Rodríguez, M. Estudio de la Hidrólisis Proteica de los Insectos. Ph.D. Thesis, Universidad de Almería, Almeria, Spain, 2024. Available online: https://dialnet.unirioja.es/servlet/dctes?codigo=364483 (accessed on 26 May 2026).
- Ayala, V.A.; López, A.A.; López, L.M.; González, B.E.; Vázquez, J.A. Nutritional quality of protein flours of fava bean (Vicia faba L.) and in vitro digestibility and bioaccesibility. Food Chem. X 2022, 14, 100303. [Google Scholar] [CrossRef] [Scilit] [PubMed]
- Mewa, E.A.; Okoth, M.W.; Kunyanga, C.N.; Rugiri, M.N. Drying modelling, moisture diffusivity and sensory quality of thin layer dried beef. Curr. Res. Nutr. Food Sci. 2018, 6, 552–565. [Google Scholar] [CrossRef] [Scilit]
- Gonzales, L.V.; Arroyo, A.M.; Polania, A.M.; Tobar, A.; Ayala, A.A.; Díaz, A. Obtención de “Snacks” de piña (Ananas comosus) mediante las técnicas combinadas de Ventana de Refractancia y Fritura con Aire Caliente. Biotecnol. Sect. Agropecu. Agroind. 2021, 20, 165–178. [Google Scholar] [CrossRef] [Scilit]
- Salcedo, M.J.; Mercado, J.L.; Vanegas, M.; Fernández, A.; Vertel, M.L. Cinética de secado de la yuca (Manihot esculenta Crantz) variedad CORPOICA M-tai en función de la temperatura y de la velocidad de aire. Rev. Ion 2014, 27, 29–42. [Google Scholar]
- Soto, Y.A. Estudio del Secado de Physalis Peruviana Linnaeus por Ventana de Refractancia y Comparación con Secado Convectivo y Convectivo Asistido con Radiación Infrarroja. Master’s Thesis, Universidad de Chile, Santiago, Chile, 2022. [Google Scholar]
- Gulati, T.; Datta, A.K. Mechanistic understanding of case-hardening and texture development during drying of food materials. J. Food Eng. 2015, 166, 119–138. [Google Scholar] [CrossRef] [Scilit]
- Perez, I. Influencia del Secado por Aire Caliente y Ventanas Refractantes en las Propiedades Funcionales, Composición Fisicoquímica y Color de la Harina de Chicuro (Stangea rhizanta). Bachelor’s Thesis, Universidad Nacional de Huancavelica, Huancavelica, Peru, 2022. [Google Scholar]
- Jafari, S.M.; Azizi, D.; Mirzaei, H.; Dehnad, D. Comparing Quality Characteristics of Oven-Dried and Refractance Window-Dried Kiwifruits. J. Food Process. Preserv. 2016, 40, 362–372. [Google Scholar] [CrossRef] [Scilit]
- Hamm, R.; Hofmann, K. Cambios en los grupos sulfhidrilo y disulfuro en proteína carnica durante su cocción. Nature 1965, 207, 1269–1271. [Google Scholar]
- Cerda, L. Estudio de las Propiedades Funcionales de Proteínas de las Harinas de Maíz (Zea mays), Cebada (Hordeum vulgare), Quinua (Chenopodium quinoa), Papa (Solanum tuberosum), Trigo (Triticum aestivum) Nacional e Importado Para Orientar su uso en Panificación y Pastas. Bachelor’s Thesis, Universidad técnica de Ambato, Ambato, Ecuador, 2010. [Google Scholar]
- Ormando, P.; Vranic, M.L.; Guidi, S.; Ambrosi, V. Efecto de la alta presión hidrostática en la exposición de contenido de sulfhidrilos libres en amilasa fúngica. Innotec 2018, 15, 50–55. [Google Scholar] [CrossRef] [Scilit]
- Vielma, R.; Ovalles, J.; Leon, A.; Medina, A. Valor nutritivo de la harina de lombriz (Eisenia foetida) como fuente de aminoácidos y su estimación cuantitativa mediante cromatografia en fase reversa (HPLC) y derivatización precolumna con o-ftalaldehído (OPA). ARS Pharm. 2003, 44, 43–58. Available online: http://hdl.handle.net/10481/28227 (accessed on 25 May 2026).
- Ovalles, J.; Medina, A.; Márquez, E.; Rial, L. Efecto del proceso de secado de la lombriz de tierra (Eisenia andrei) sobre el perfil aminoacídico de la harina determinado por cromatografía (clae). Saber 2017, 29, 486–494. [Google Scholar]
- Mamani, D.E. Efecto de la Cocción por Extrusión Sobre las Características Fisicoquímicas, Sensoriales y Calidad Proteica de una Mezcla Alimenticia a Partir de la Carne de Alpaca (Vicugna pacos), Quinua (Chenopodium quinoa Willd.), Maíz (Zea mays L.) Y Tarwi (Lupinus mutabilis Sweet). Bachelor’s Thesis, Universidad Nacional de Juliaca, Juliaca, Peru, 2024. [Google Scholar]
- Morris, H.J.; Carrillo, O.; Bermúdez, R.C. Enfoque integral en la utilización de métodos químicos de evaluación de la calidad proteica. Rev. Cub. Salud Publica 2003, 29, 42–47. [Google Scholar]
- Han, S.W.; Chee, K.M.; Cho, S.J. Nutritional quality of rice bran protein in comparison to animal and vegetable protein. Food Chem. 2015, 172, 766–769. [Google Scholar] [CrossRef] [Scilit] [PubMed]
- Codex Standard 152-1985; Norma Codex Para la Harina de Trigo. FAO: Rome, Italy, 1985.
- Bejosano, F.P.; Corke, H. Protein Quality Evaluation of Amaranthus Wholemeal Flours and Protein Concentrates. J. Sci. Food Agric. 1998, 76, 100–106. [Google Scholar] [CrossRef]
- Suárez, H.L.; Barrera, Z.R.; Forero, A.F. Evaluación de alternativas de secado en el proceso de elaboración de harina de lombriz. Cienc. Tecnol. Agropecu. 2016, 17, 55–71. [Google Scholar]

Disclaimer/Publisher’s Note: The statements, opinions and data contained in all publications are solely those of the individual author(s) and contributor(s) and not of MDPI and/or the editor(s). MDPI and/or the editor(s) disclaim responsibility for any injury to people or property resulting from any ideas, methods, instructions or products referred to in the content. |
© 2026 by the authors. Licensee MDPI, Basel, Switzerland. This article is an open access article distributed under the terms and conditions of the Creative Commons Attribution (CC BY) license.