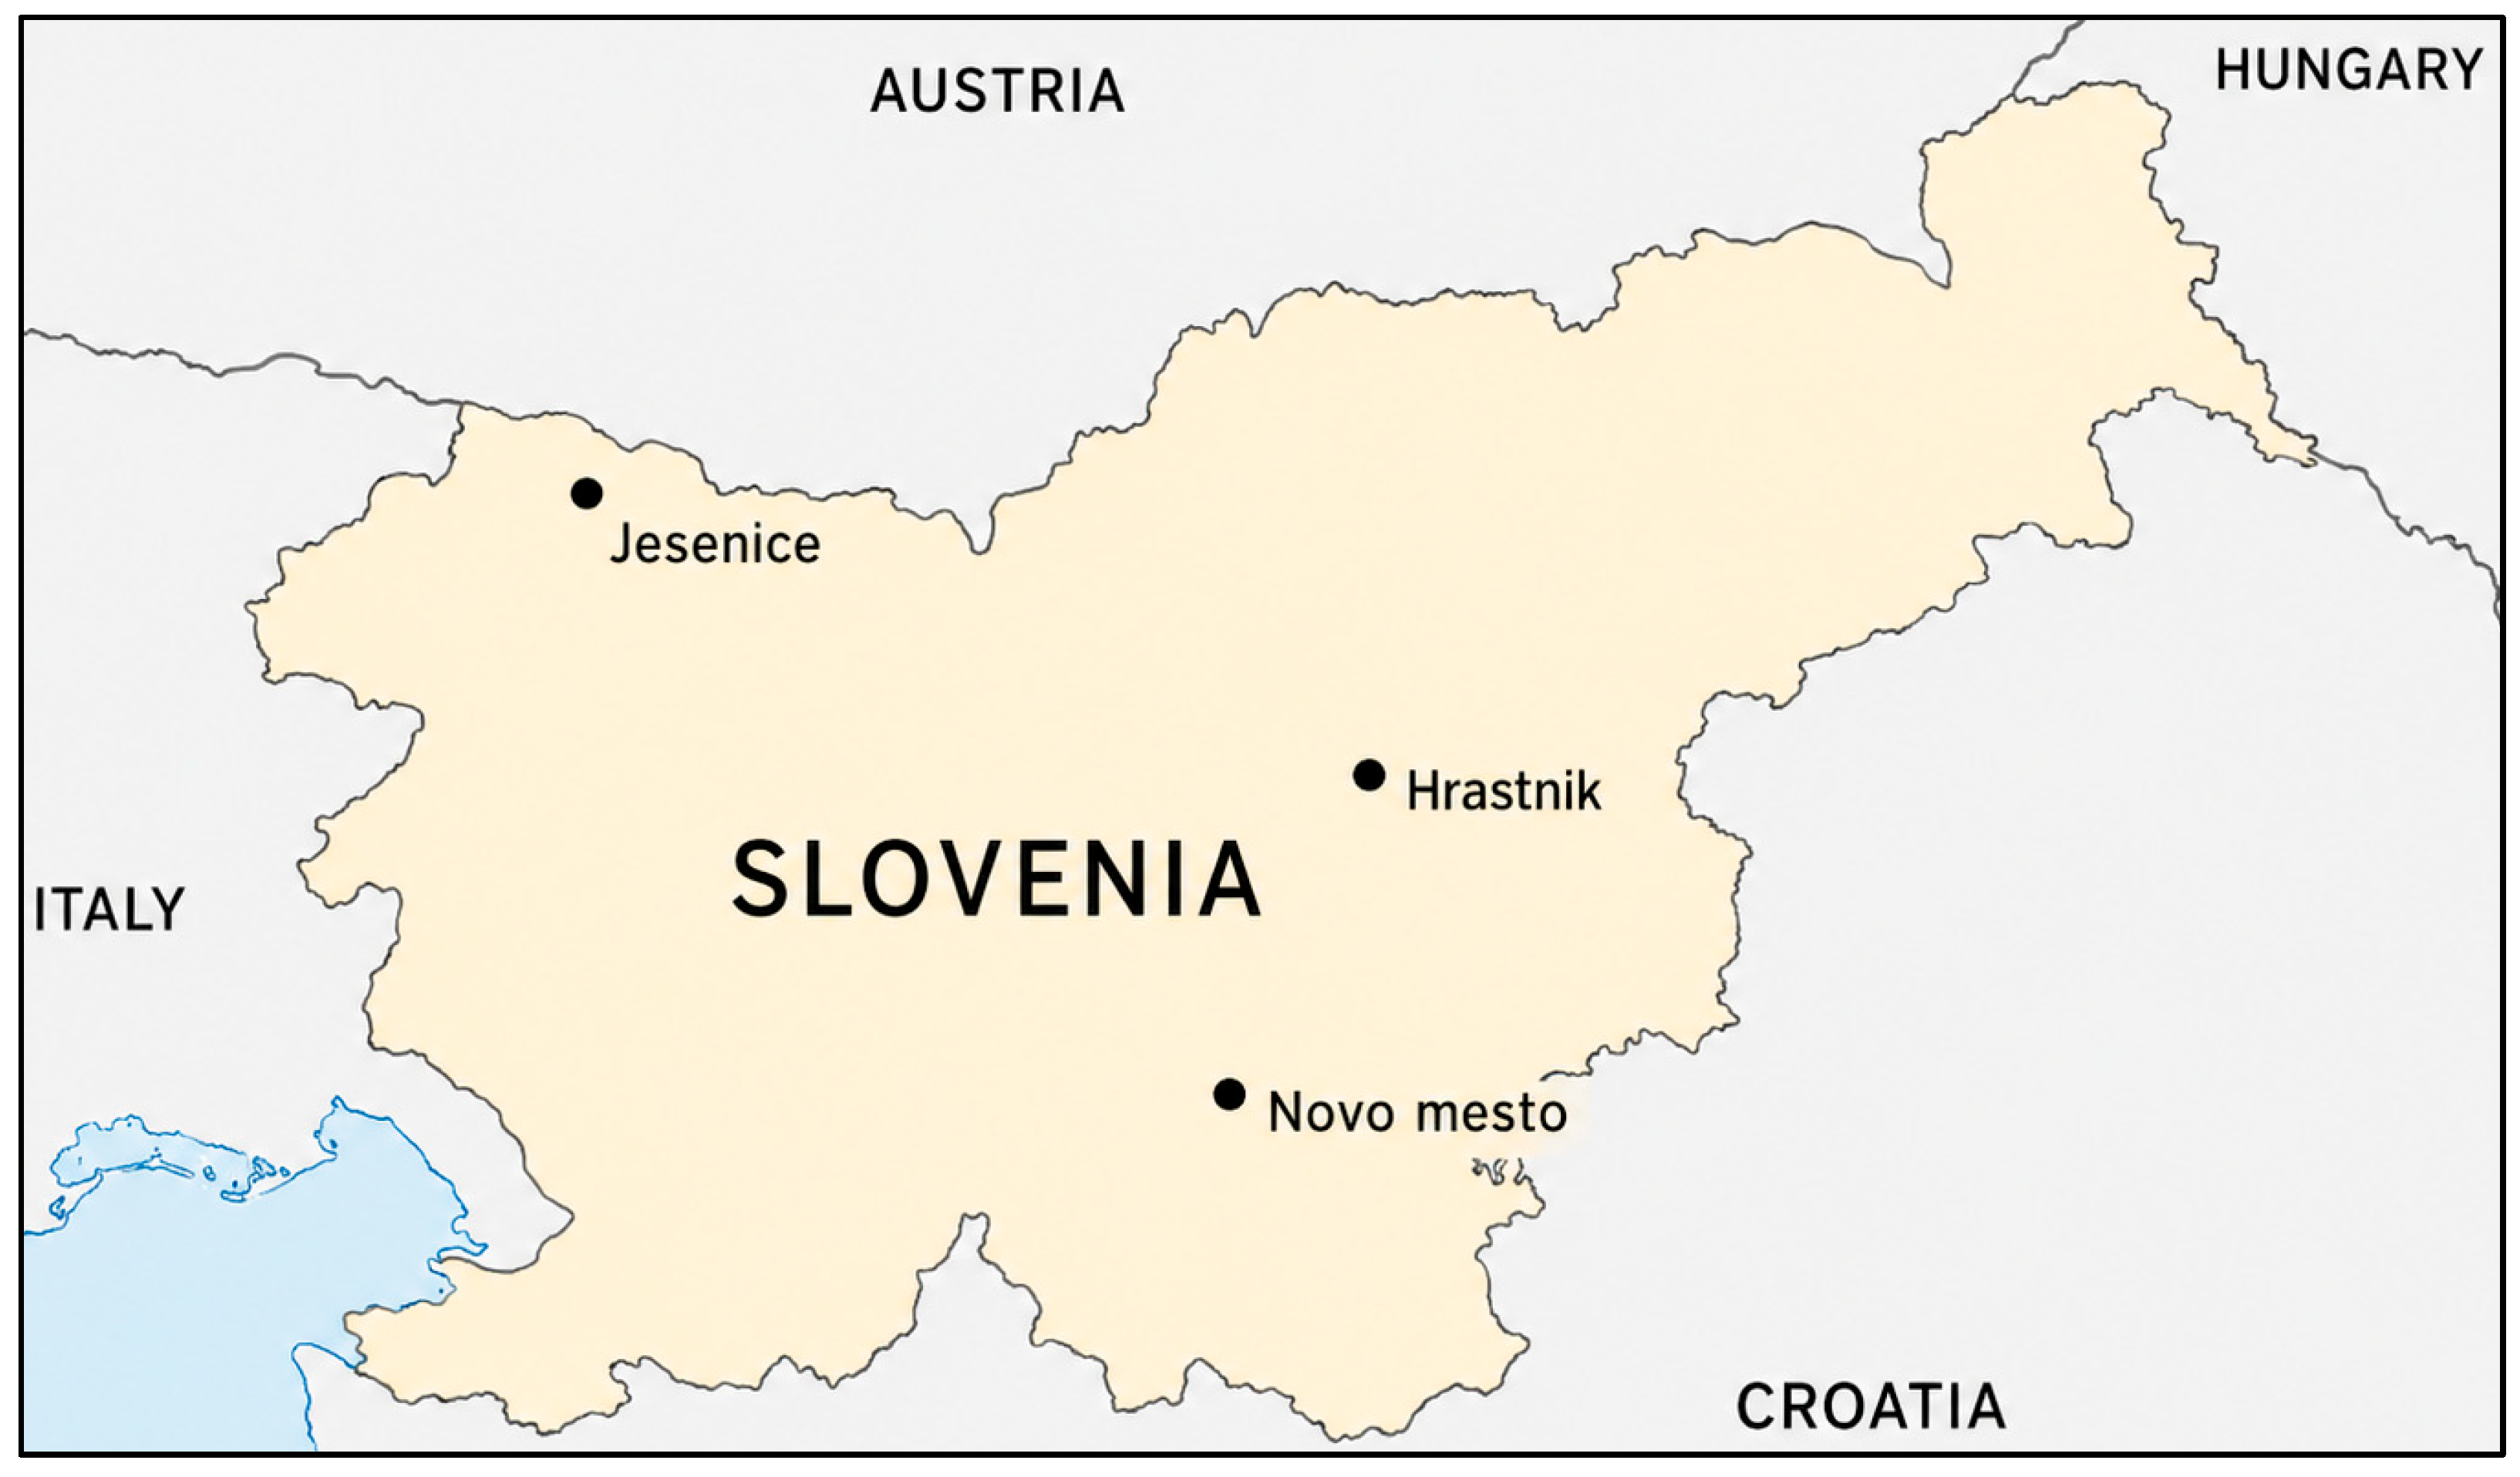
This section presents the findings in a structured sequence. First, descriptive statistics are used to show average PM2.5 and PM10 concentrations, extreme observations and location-specific patterns. Second, threshold-based peak detection identifies short-term exceedance episodes and their timing. Third, correlation analysis examines the relationship between relative humidity and particulate matter. The section then provides a qualitative comparison of municipal PM profiles and, finally, additional normalized indicators that support the comparison of relative variability, peak intensity and fine-particle dominance.
4.1. Descriptive Statistics
The descriptive results show clear differences among the three municipalities. Novo mesto recorded the highest average PM2.5 and PM10 concentrations, indicating a more persistent particulate matter burden during the monitored period. Hrastnik had lower average values but still experienced a pronounced short-term episode. Jesenice showed the lowest average concentrations, yet individual peaks reached very high values. These findings confirm that average concentrations alone are insufficient for understanding holiday-period exposure.
The timing of the highest values further indicates that PM episodes were structured rather than random. Most PM2.5 and PM10 peaks occurred during late-night and early-morning hours, which is consistent with the expected timing of holiday activities and reduced nocturnal dispersion. At the same time, several important evening peaks were also observed, especially in Hrastnik and Jesenice. This pattern suggests that local conditions and short-term activities may have influenced PM dynamics differently across the three municipalities.
4.1.1. Novo Mesto
In Novo mesto, the average PM
2.5 concentration was 19.94 µg/m
3 and the average PM
10 concentration was 21.84 µg/m
3, with standard deviations of 15.44 and 17.05, respectively. The average relative humidity during the observed period was 70.81% (SD = 6.14). The highest PM
2.5 and PM
10 values were recorded at the same time, on 9 January 2026 at 22:47:20, when PM
2.5 reached 109 µg/m
3 and PM
10 reached 122 µg/m
3.
Table 1 and
Table 2 present the ten highest PM
2.5 and PM
10 observations.
Table 1 shows that the highest PM
2.5 values in Novo mesto were concentrated mainly in early to mid-January 2026, particularly during late-night and early-morning hours. Several peak observations coincided with relatively high humidity, but this association should be interpreted cautiously because humidity was only one of several possible influencing factors.
Table 2 confirms that the highest PM
10 observations in Novo mesto occurred at the same times as the highest PM
2.5 values, with the maximum PM
10 concentration of 122 µg/m
3 recorded at 22:47:20 on 9 January 2026. This parallel behaviour suggests that fine and inhalable particle fractions increased simultaneously during the main late-night pollution episode.
The lowest PM
2.5 and PM
10 values in Novo mesto occurred at the same observation times, which is consistent with the close relationship between the two particle fractions.
Table 3 shows that several observations reached 0 µg/m
3, especially on 24 December 2025 and again around midday on 2 and 3 January 2026.
The zero or near-zero observations indicate short intervals of very low measured particulate matter. However, these lows occurred at different times of day and under varying RH% values, so they should not be interpreted as evidence of a single explanatory mechanism. Rather, they illustrate the marked short-term variability of PM levels during the monitoring period.
CO
2 was also monitored in the Novo mesto area. From 24 December 2025 to 14 January 2026, the average CO
2 concentration was approximately 386.72 ppm, with a median of 383 ppm. The lowest recorded value was 295 ppm on 12 January 2026, while the highest value was 491 ppm on 31 December 2025.
Table 4 and
Table 5 show the ten lowest and ten highest CO
2 observations.
Table 4 shows that the lowest CO
2 concentrations occurred on different dates and times across the monitoring period, with the minimum value of 295 ppm recorded on 12 January 2026. These values provide the lower boundary of the observed CO
2 variability, but they should not be interpreted together with PM minima because CO
2 and PM were measured at different locations.
Table 5 indicates that the highest CO
2 values occurred mainly around the end of December, including 30 and 31 December 2025. These observations may reflect holiday-period activity, but they cannot be directly linked to PM
2.5 and PM
10 peaks because CO
2 and PM were measured at different locations. For this reason, CO
2 results are treated as contextual information rather than as direct evidence of particulate matter sources.
Because CO2 and particulate matter were not measured at the same location, no direct temporal or spatial linkage between CO2 concentrations and PM2.5/PM10 peaks can be inferred from these data.
4.1.2. Hrastnik
In Hrastnik, the average PM2.5 concentration was 13.86 µg/m3 and the average PM10 concentration was 15.12 µg/m3, with standard deviations of 11.04 and 12.23, respectively. These averages were lower than those observed in Novo mesto, while the close difference between PM2.5 and PM10 again indicates that fine particles represented a large share of inhalable particulate matter. The average RH% was 67.60% (SD = 9.83). The highest PM2.5 and PM10 values occurred on 10 January 2026 at 18:06:28, when PM2.5 reached 128 µg/m3 and PM10 reached 146 µg/m3.
Table 6 shows that the highest PM
2.5 episode in Hrastnik reached 128 µg/m
3 on 10 January 2026 at 18:06:28, substantially above the average of 13.86 µg/m
3. Most other high PM
2.5 values occurred during late-night or early-morning hours, indicating a predominantly nocturnal peak pattern with one pronounced evening outlier.
Table 7 confirms that the highest PM
10 observations in Hrastnik largely coincided with the highest PM
2.5 observations. Most high values occurred during late-night or early-morning hours, particularly on 28 and 30 December 2025, but the absolute maximum occurred in the evening on 10 January 2026. This indicates a generally nocturnal peak pattern with one strong evening episode.
Relative humidity during the highest Hrastnik observations was relatively stable, mostly around the low 70% range. In contrast, the lowest PM observations in
Table 8 and
Table 9 occurred under more varied RH% conditions. This again suggests that humidity alone cannot explain the observed PM pattern.
Table 8 indicates that the lowest PM
2.5 values in Hrastnik were concentrated on 24 and 25 December 2025, when several observations reached 0 µg/m
3. This clustering suggests a short period of very low fine-particle concentrations at the beginning of the monitoring interval, before later holiday-period peaks emerged.
Table 9 shows that the lowest PM
10 values in Hrastnik were tightly clustered on 24 and 25 December 2025, similar to the pattern seen for PM
2.5. These low values occurred mainly between the evening and early-night hours. They may reflect temporary reductions in local activity or favourable short-term dispersion conditions, but the available data do not allow a firm source-based explanation.
4.1.3. Jesenice
Jesenice showed the lowest average particulate matter concentrations among the three municipalities. The average PM
2.5 concentration was 7.86 µg/m
3 (SD = 10.95), while the average PM
10 concentration was 8.44 µg/m
3 (SD = 11.71). Despite these low averages, the municipality recorded very high short-term peaks. This contrast makes Jesenice an important case for distinguishing between average pollution burden and episodic exposure risk.
Table 10 presents the ten highest PM
2.5 and PM
10 observations.
Table 10 shows that the highest PM
2.5 and PM
10 values in Jesenice were closely aligned. The absolute maximum occurred on 29 December 2025 at 18:10:24, when PM
2.5 reached 133 µg/m
3 and PM
10 reached 143 µg/m
3. Additional high values were observed around the New Year period and during the first week of January. This pattern indicates that, although average PM concentrations were comparatively low, short-term exposure episodes could still be substantial.
The average RH% in Jesenice was 67.20%, which was close to the average value observed in Hrastnik and slightly lower than in Novo mesto. Some high PM observations occurred under RH% values close to the seasonal average, while others occurred under lower or higher humidity conditions. This reinforces the need to interpret humidity as one contextual factor rather than as a sufficient explanation for PM variability.
Appendix A presents the lowest PM
2.5 and PM
10 observations for Jesenice. Unlike Novo mesto and Hrastnik, Jesenice included a larger number of zero observations: 37 for PM
2.5 and 30 for PM
10. These values suggest that the monitored location experienced several periods with very low measured particulate matter, especially around late-night hours between 27 and 29 December and again on 6 and 7 January.
Taken together, the Jesenice results point to a low-baseline/high-peak profile. For much of the monitoring period, particulate matter concentrations remained low, but individual episodes produced marked short-term increases. This finding is important because it shows that locations with lower average PM levels may still experience relevant short-term exposure risks during holiday periods.
4.2. Threshold-Based Peak Detection
Threshold-based peak detection was applied using the mean + 2SD criterion for PM
2.5 and PM
10 at each location. This approach identified observations that substantially exceeded local baseline variability. As shown in
Table 11, Novo mesto had the highest thresholds for both PM
2.5 (50.81 µg/m
3) and PM
10 (55.94 µg/m
3), as well as the largest number of threshold exceedances.
Table 11 shows that Novo mesto had the highest threshold values and the largest number of observations above the PM
2.5 and PM
10 thresholds. Hrastnik followed, while Jesenice had the lowest thresholds and fewer exceedances, indicating clear differences in exceedance frequency and baseline-adjusted variability across the three municipalities.
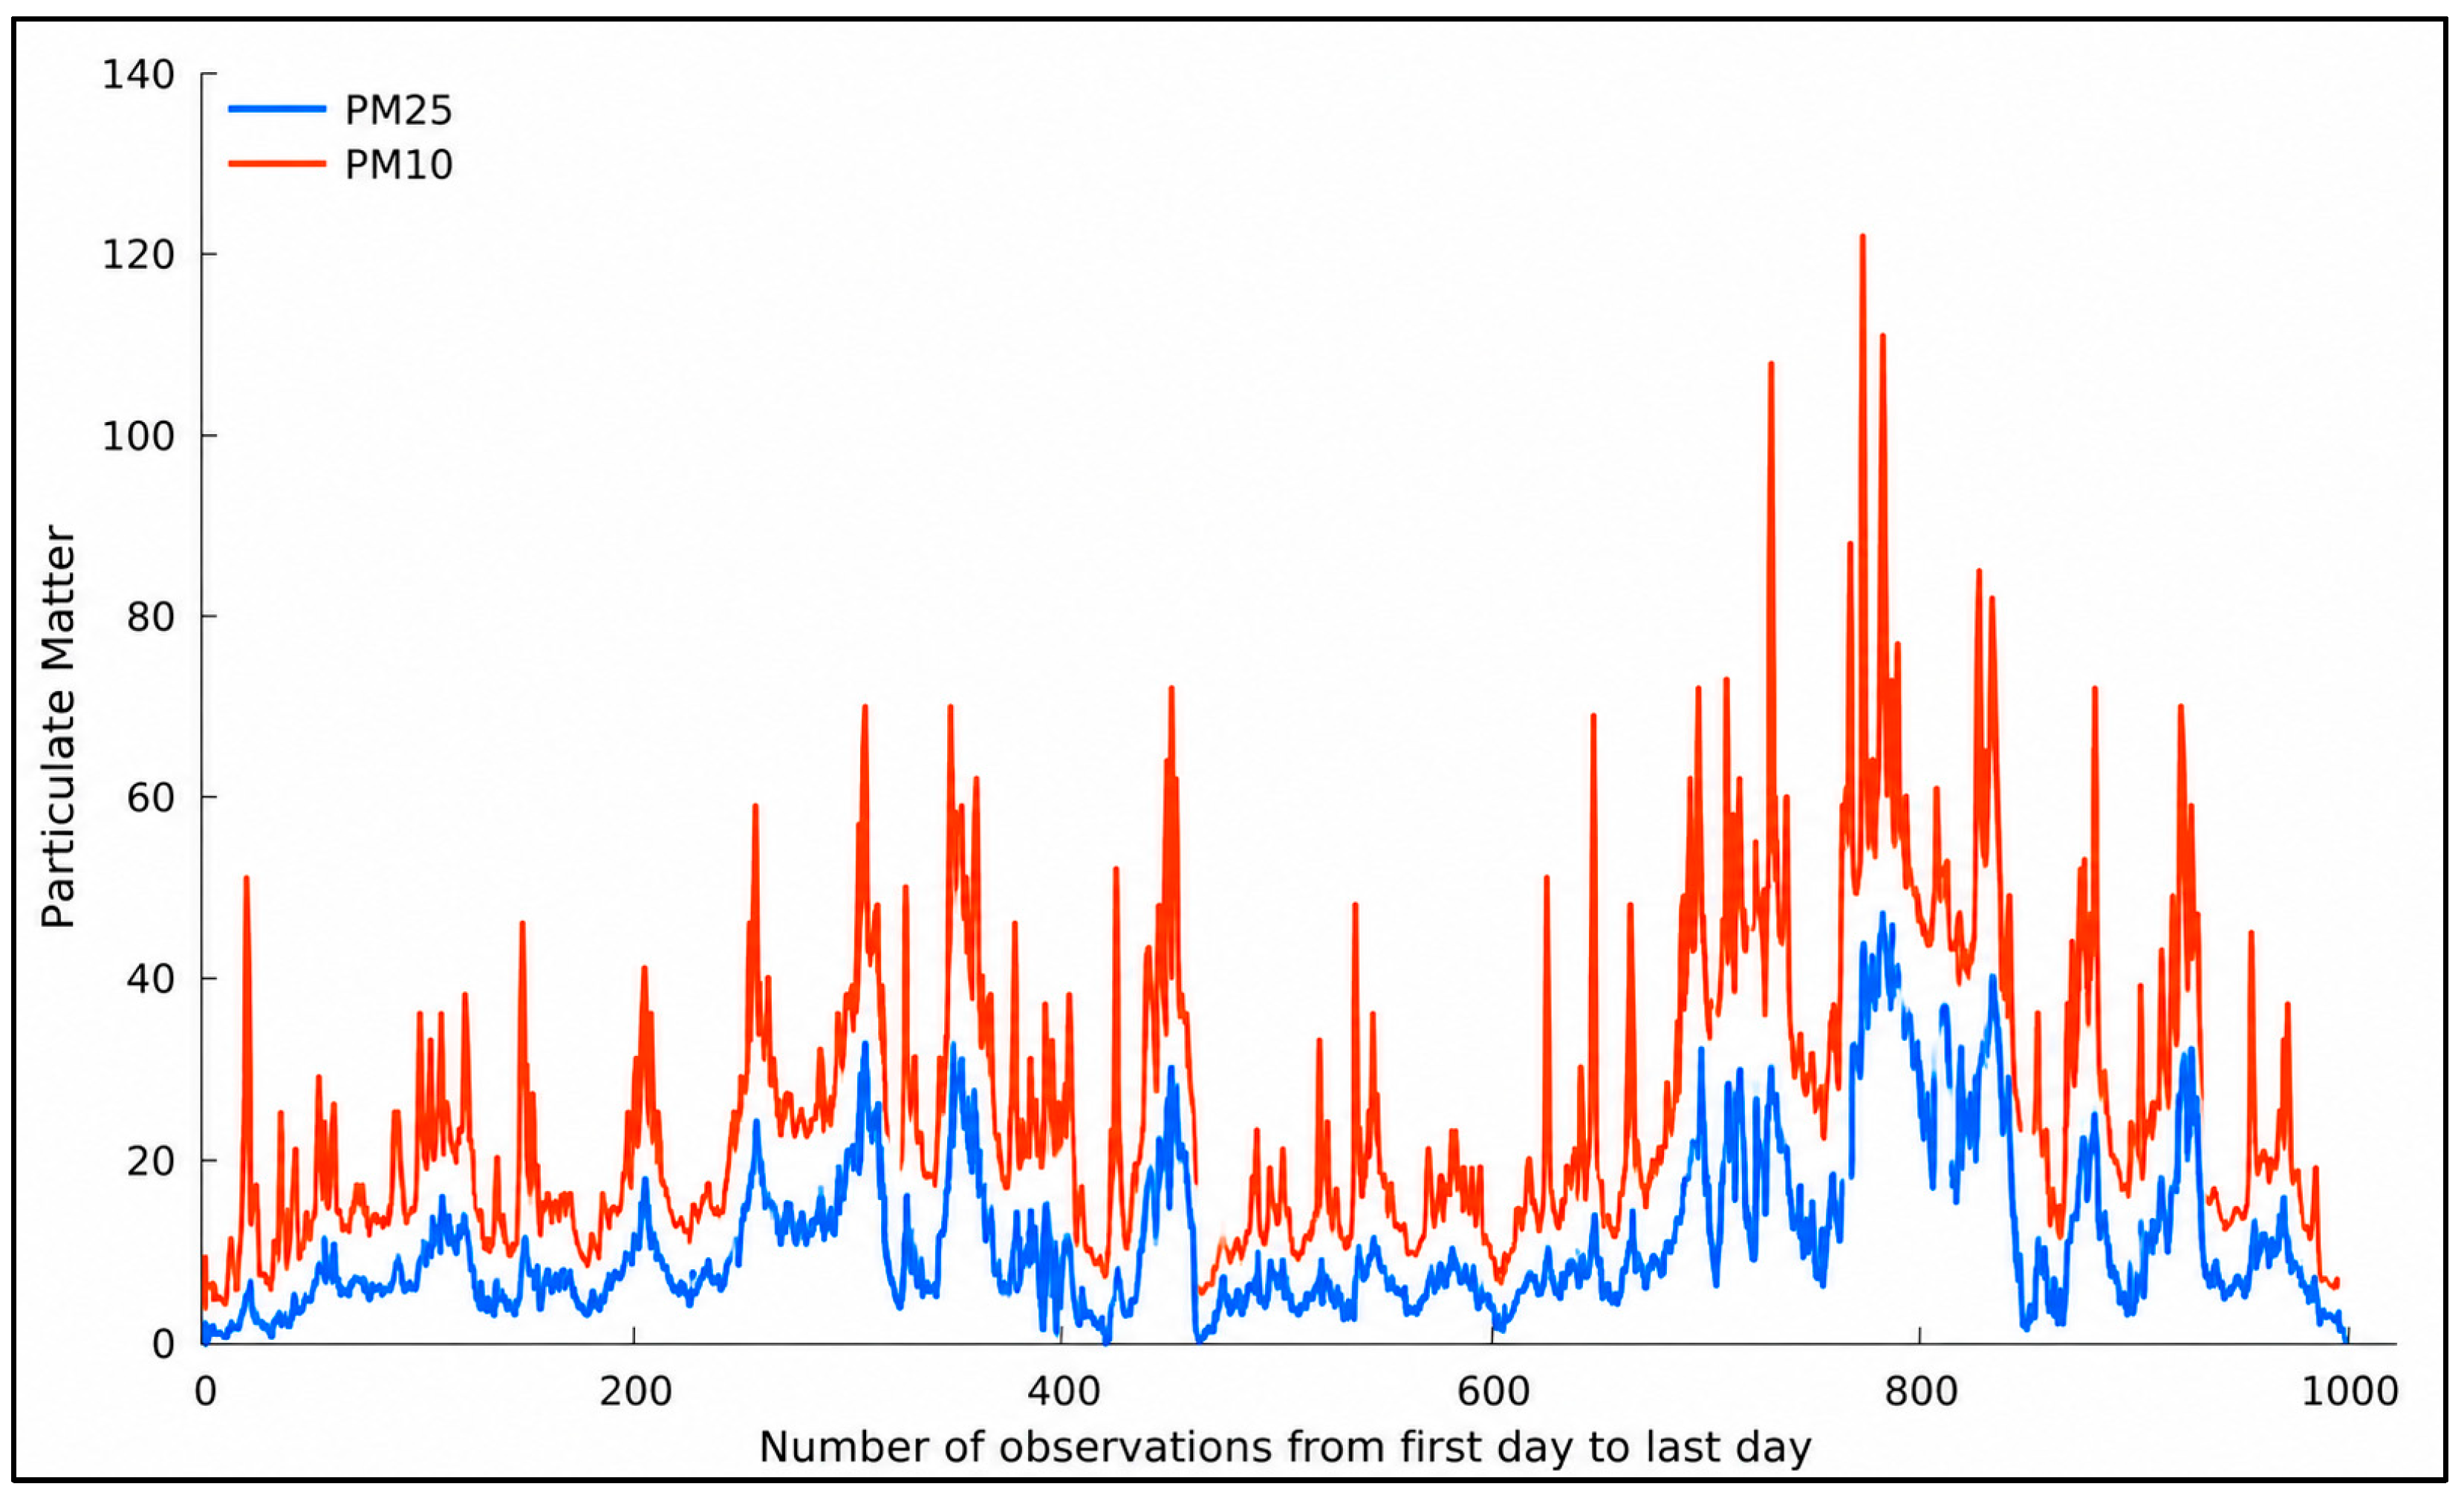
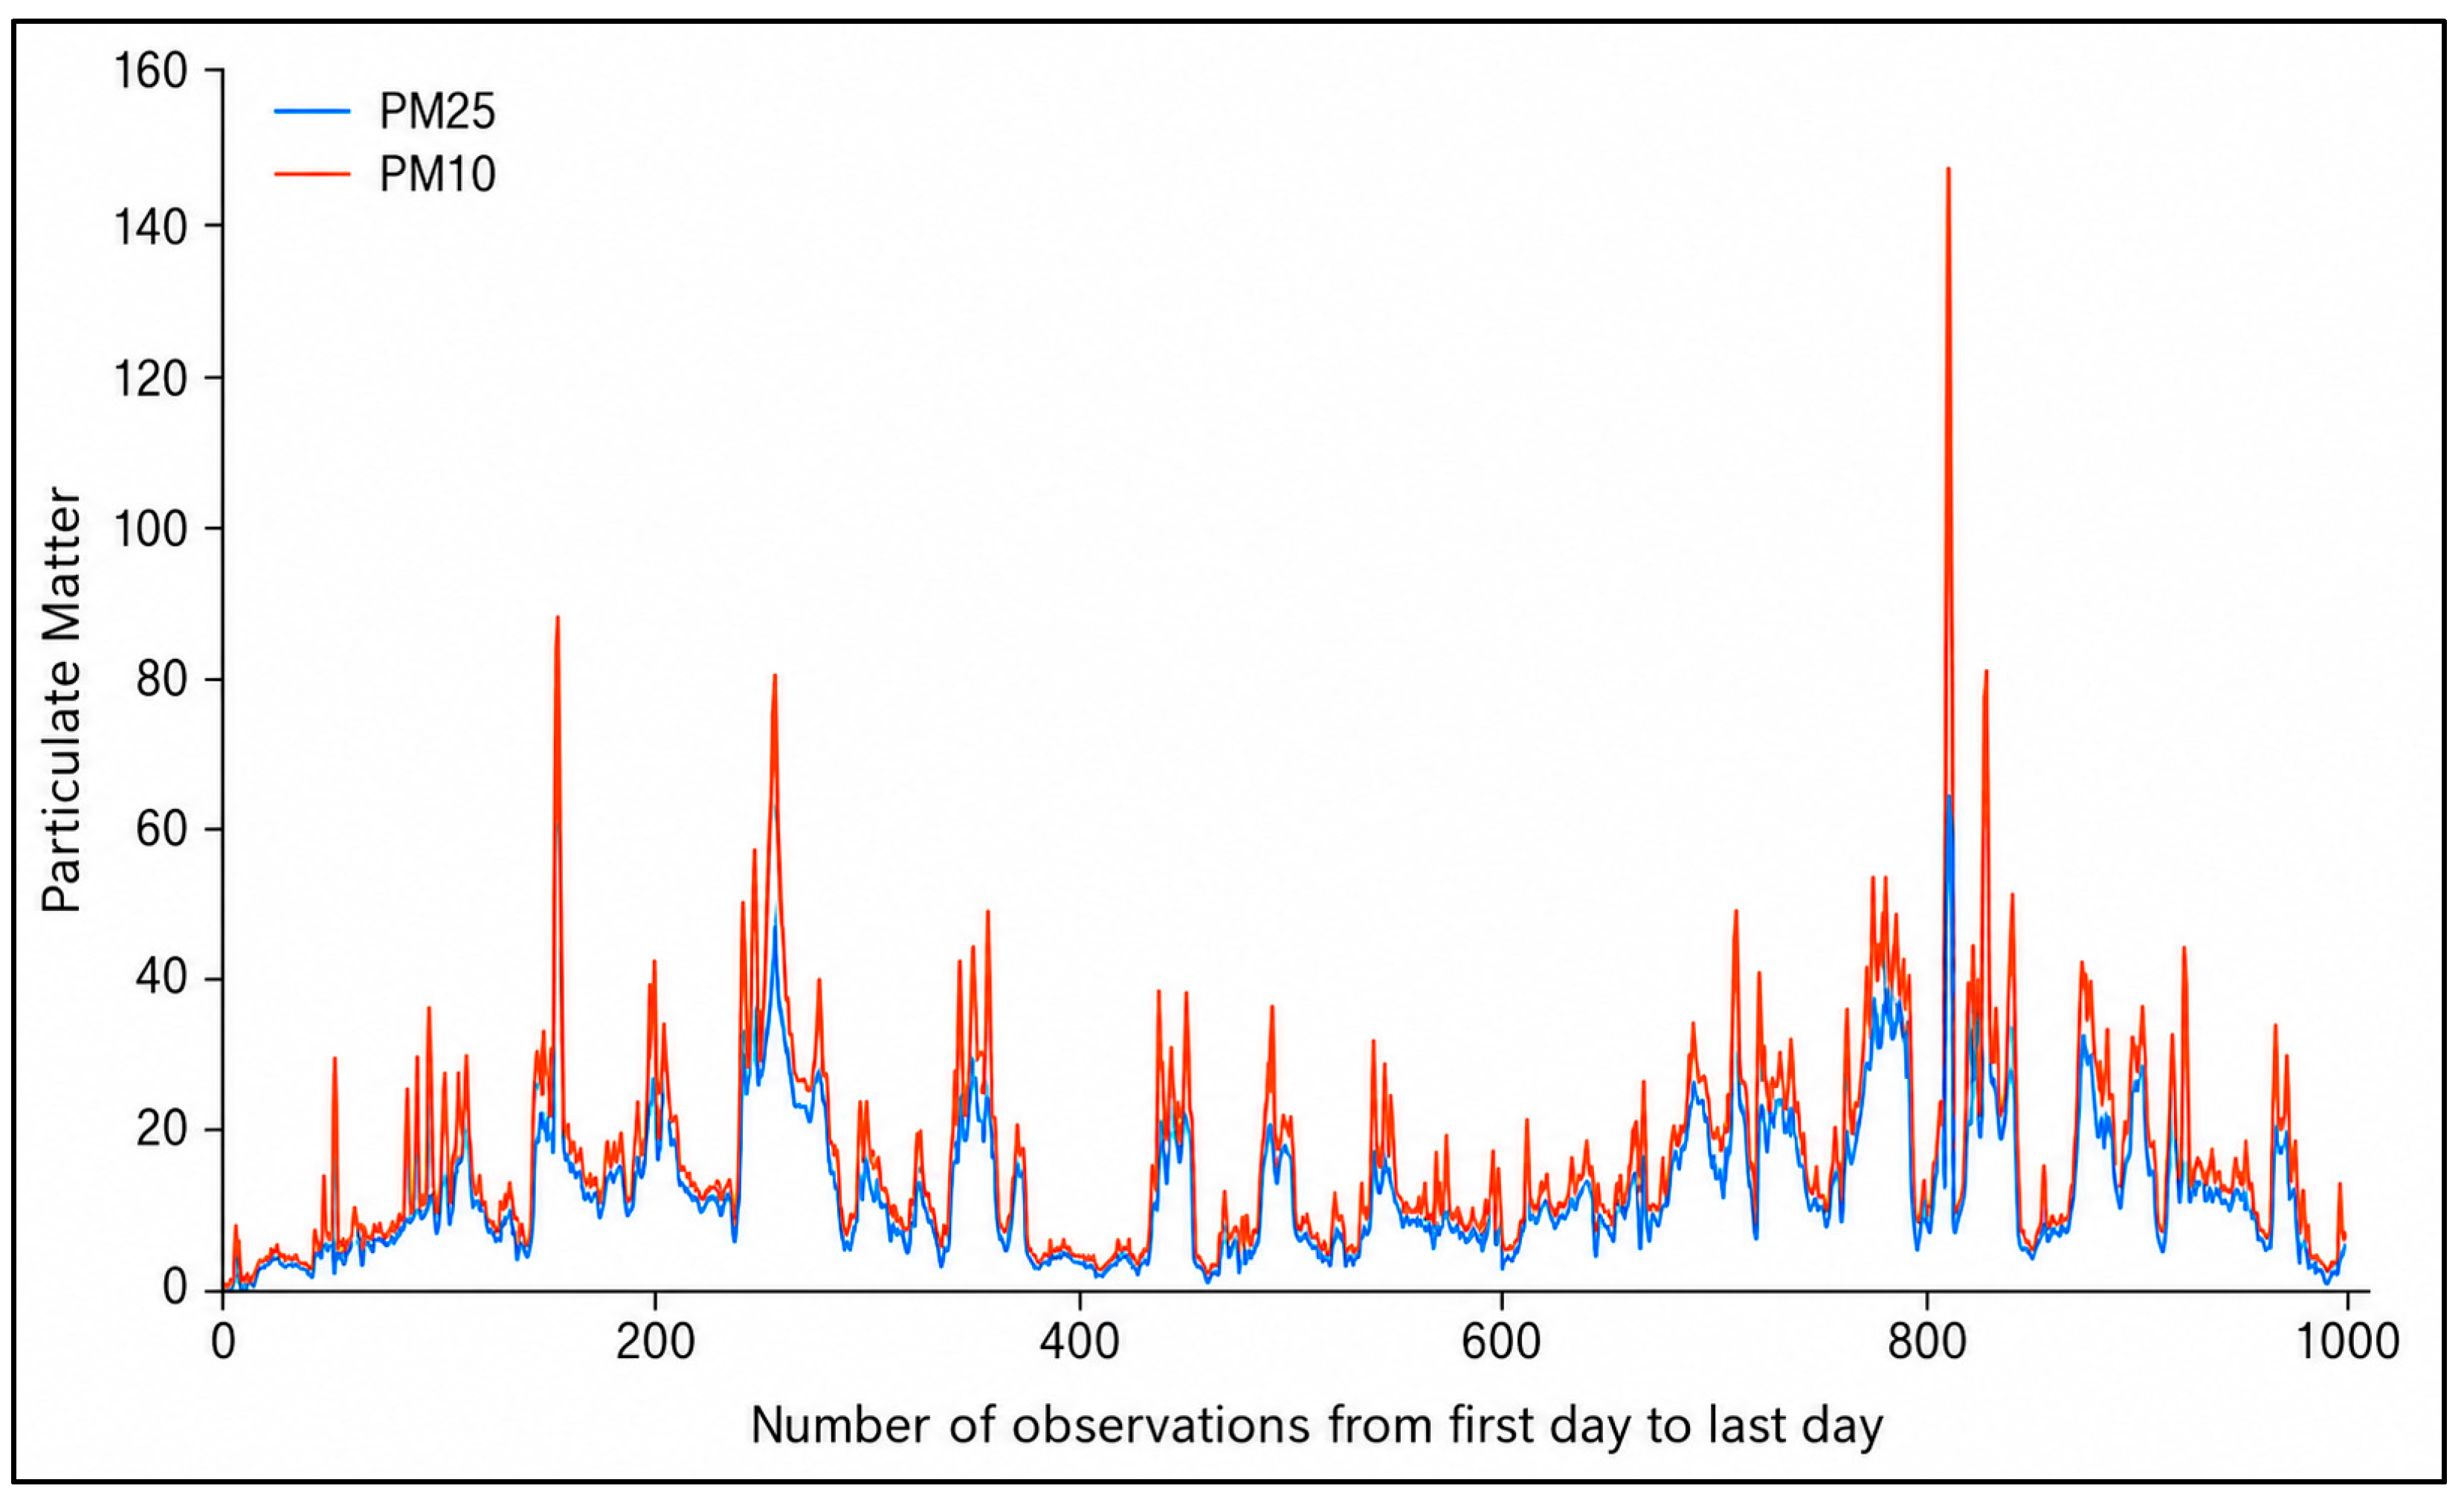
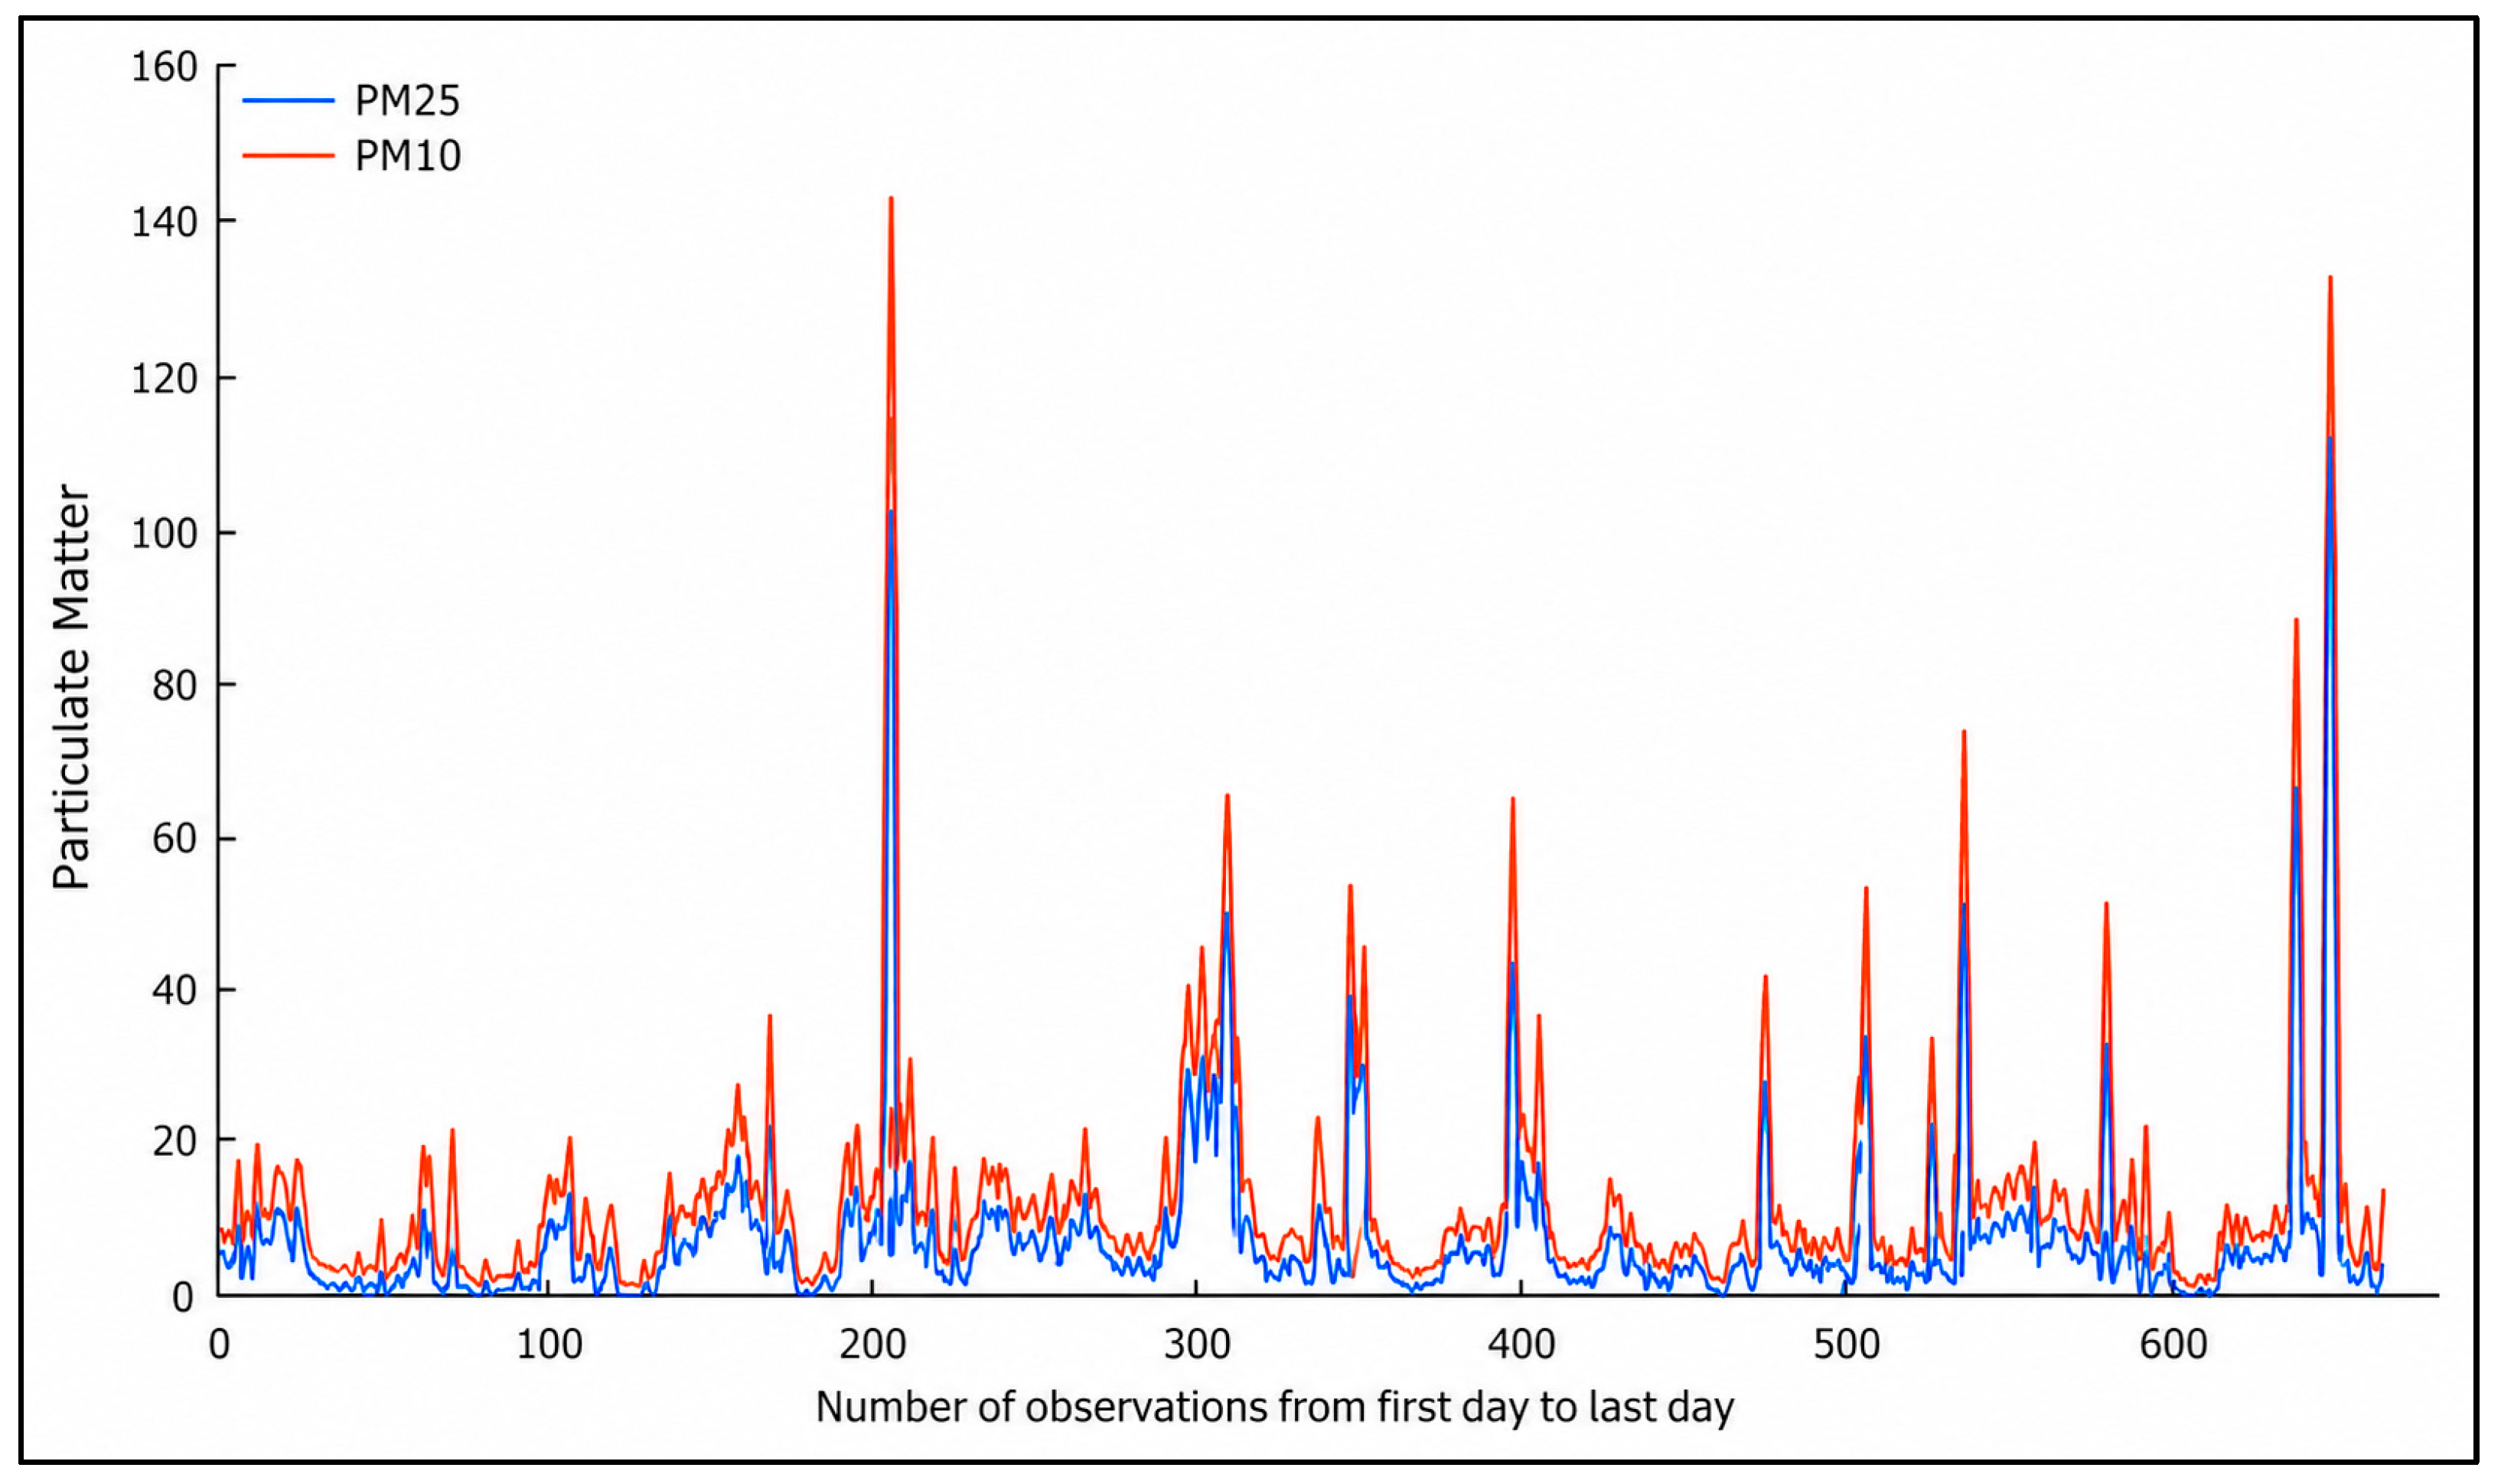
Figure 2,
Figure 3 and
Figure 4 illustrate the temporal distribution of PM
2.5 and PM
10 peaks in the three municipalities. Although the two particle fractions followed similar patterns, PM
2.5 values remained below PM
10 values, as expected. Their close movement during many peak episodes suggests that fine particles formed a substantial part of total inhalable particulate matter. In Novo mesto, the largest peak occurred at 22:47:20, and most exceedances were concentrated during late-night and early-morning hours: 36 of 52 PM
2.5 peaks and 39 of 53 PM
10 peaks occurred in this period.
In Hrastnik, the calculated thresholds were 35.93 µg/m
3 for PM
2.5 and 39.58 µg/m
3 for PM
10.
Figure 3 shows fewer exceedance episodes than in Novo mesto, but one very pronounced evening peak at 18:06:28. Nevertheless, the overall temporal pattern remained predominantly nocturnal: 33 of 43 PM
2.5 peaks and 34 of 39 PM
10 peaks occurred during the late-night/early-morning interval.
In Jesenice, the thresholds were lower, at 29.75 µg/m
3 for PM
2.5 and 31.87 µg/m
3 for PM
10, reflecting the lower average concentrations at this location.
Figure 4 shows a more dispersed temporal pattern than in Novo mesto and Hrastnik. The two largest peaks occurred in the evening and shortly after midnight, while the exceedances were distributed across all three time intervals: 8 in the late-night/early-morning period, 7 during the daytime, and 9 in the evening. This distribution suggests that peak timing in Jesenice was less closely tied to the late-night pattern observed in the other two municipalities.
Although most PM2.5 and PM10 peaks were concentrated during late-night and early-morning hours, the absolute maximum values in Hrastnik and Jesenice occurred in the evening, at 18:06 and 18:10, respectively. These deviations suggest that not all peak pollution episodes followed the typical midnight-related New Year pattern. A possible explanation is that localised evening activities, early celebrations, residential heating, traffic-related emissions, or specific short-term local conditions contributed to these peaks. However, because the present study did not include direct observations of fireworks use, traffic intensity, residential heating activity, wind speed, or local event records, these evening peaks cannot be attributed to a specific source with certainty. Sensor anomalies also cannot be fully excluded, although the simultaneous increase in both PM2.5 and PM10 suggests that these observations may reflect real short-term pollution episodes rather than isolated measurement noise. Future studies should combine particulate matter monitoring with meteorological data, local activity logs, and source-specific tracers to better explain such deviations.
4.3. Correlation Analysis
The relationship between PM
2.5/PM
10 and relative humidity (RH%) was examined separately for each municipality using Pearson correlation coefficients (
Table 12). The purpose of this analysis was to assess whether higher humidity coincided with higher particulate matter concentrations during the monitored period.
The correlations between relative humidity and particulate matter were weak to negligible in all three municipalities. The highest values were observed in Hrastnik, at approximately 0.10 for both PM2.5 and PM10, while the lowest values were observed in Jesenice, at approximately 0.04. These results indicate that RH% alone explained very little of the observed PM variability. Other factors, including emissions, local activity patterns and meteorological dispersion conditions, were therefore likely important.
4.4. Qualitative Comparative Results Across the Three Municipalities
This subsection provides a structured qualitative comparison of the observed quantitative monitoring patterns (
Table 13). It does not represent a separate interview-, survey- or ethnography-based qualitative study. Instead, the purpose is to describe how the municipalities differed in their overall PM profiles, including average burden, peak behaviour, temporal distribution and local environmental context. This comparison helps translate the numerical findings into location-specific air-quality profiles.
Novo mesto represents the most persistent particulate matter profile among the three observed municipalities. The results show that Novo mesto had the highest average PM2.5 and PM10 concentrations and the largest number of observations above the threshold. Qualitatively, this indicates that air-quality deterioration in Novo mesto was not limited to one isolated event, but appeared as repeated short-term increases during the monitoring campaign. This pattern may reflect the combined influence of the urban setting, traffic-related activity, holiday mobility, residential heating, fireworks use, and local winter dispersion conditions. However, these explanations remain contextual because direct data on traffic intensity, heating activity, wind speed, wind direction, atmospheric stability, and chemical composition of particles were not available.
Hrastnik showed a different qualitative profile. Although its average PM2.5 and PM10 concentrations were lower than those observed in Novo mesto, the municipality recorded a very pronounced short-term peak. This suggests that Hrastnik was less characterised by persistent particulate matter burden and more by episodic deterioration of air quality. In practical terms, this means that the general pollution level may remain moderate for much of the observed period, while individual events can produce substantial short-term exposure. The industrial background of Hrastnik, local settlement structure, residential heating, and restricted winter dispersion conditions may have contributed to this pattern. Nevertheless, the present data do not allow a clear distinction between fireworks-related emissions, industrial influence, traffic activity, heating emissions, and meteorological accumulation.
Jesenice displayed the most contrasting profile. It had the lowest average PM2.5 and PM10 concentrations, but also the highest absolute PM peak values among the three municipalities. This is an important qualitative finding because it shows that average concentrations alone may underestimate short-term exposure risk. Jesenice can therefore be interpreted as a low-baseline but high-peak vulnerability location. The air was comparatively less burdened during much of the observed period, yet individual episodes reached very high values. This suggests that air-quality assessment during festive periods should not rely only on mean concentrations, but should also consider maximum values, exceedance intensity, and the timing of pollution episodes.
The comparison also shows that the municipalities differed not only in the magnitude of PM2.5 and PM10 concentrations, but also in the type of pollution dynamics. Novo mesto showed recurrent and more persistent short-term variability; Hrastnik showed a more episodic profile with a strong isolated deterioration; and Jesenice showed lower baseline concentrations but greater vulnerability to sharp short-term peaks. These qualitative differences are relevant for local air-quality management. In Novo mesto, measures should focus on reducing repeated short-term increases and cumulative holiday-period exposure. In Hrastnik, priority should be given to identifying and preventing specific high-intensity episodes. In Jesenice, monitoring strategies should not rely only on average values, because occasional peaks may still represent relevant short-term exposure risks.
These qualitative comparative results support H3 by demonstrating that the three municipalities differed not only in average PM2.5 and PM10 levels, but also in their overall pollution profiles. They also support a cautious interpretation of H5, because the observed patterns are more consistent with a multi-source winter holiday context than with a single-source explanation. However, because detailed meteorological parameters, traffic counts, residential heating data, and chemical source markers were not available, these findings should be interpreted as descriptive and exploratory rather than as definitive source attribution.
4.5. Additional Comparative Indicators of PM Variability
To strengthen the comparison across municipalities and to test H6, three normalized descriptive indicators were calculated from the reported means, standard deviations and maximum values (
Table 14). The coefficient of variation describes variability relative to the mean, the peak-to-mean ratio shows the intensity of the highest episode compared with the average level, and the PM
2.5/PM
10 ratio indicates the dominance of fine particles within the inhalable particulate fraction.
The additional indicators support H6 and clarify how the municipalities differed beyond their average PM concentrations. Novo mesto had the highest average PM2.5 and PM10 concentrations, but lower relative variability and lower peak-to-mean ratios than Hrastnik and Jesenice. Jesenice had the highest CV values and peak-to-mean ratios, showing that its low average PM levels were accompanied by the strongest relative episodic increases. Hrastnik occupied an intermediate position. Across all three municipalities, the mean PM2.5/PM10 ratio remained high (0.91–0.93), confirming the dominance of fine particles during the observed period.




 ,
,