1. Introduction
Granular fertilizers play a critical role in improving crop productivity and maintaining soil fertility by supplying essential nutrients required for plant growth [
1]. However, inaccurate fertilizer application can reduce nutrient use efficiency, increase production costs, and contribute to environmental problems such as soil degradation and water contamination. To address these challenges, variable-rate technology (VRT), as a core component of precision agriculture (PA), has been widely adopted to enable site-specific fertilizer application based on spatial variability in soil and crop requirements [
2,
3]. VRT systems operate using map- or sensor-based strategies that dynamically adjust fertilizer application rates in real time, thereby improving nutrient use efficiency and supporting sustainable agricultural production [
4,
5].
Previous studies on granular fertilizer flow rate sensing systems can generally be classified according to their sensing principles, including optical, impact-based, weight-based, microwave, and infrared sensing methods. Optical sensing systems have been widely used due to their rapid response and non-contact operation. For example, Al-Mallahi and Kataoka [
6] developed an optical seed flow sensor based on infrared beam discontinuity, while Swisher et al. [
7] used a laser–photodiode system to monitor fertilizer flow inside pneumatic conveying tubes. Despite their effectiveness, optical systems are often sensitive to dust accumulation, particle shape variation, and environmental interference.
Weight-based sensing systems have also been investigated for fertilizer flow monitoring. Yu et al. [
8] developed a weight-based system integrated with filtering techniques to improve dynamic measurement stability during field operation. Although weight-based systems provide relatively accurate measurements, they often require complex signal-processing procedures and vibration compensation methods. Recent advances in smart sensor calibration techniques have also demonstrated the potential of data-driven and virtual-sample-based approaches to improve sensor reliability, calibration efficiency, and measurement stability in engineering monitoring systems [
9].
Other sensing technologies, including microwave, infrared, and piezoelectric systems, have shown promising performance in monitoring granular materials. However, many of these approaches involve relatively high implementation costs, complex calibration procedures, or reduced durability under practical operating conditions. In addition, Liu et al. [
10] developed an impact-count-based sensing unit for estimating seed flow using a microcontroller system, while Mirzakhaninafchi et al. [
11] designed a map-based variable-rate fertilizer applicator integrated with optical sensing and servo-motor control mechanisms. Although these systems demonstrated acceptable measurement performance, their structural complexity and sensitivity to operating conditions may limit their practical applicability in low-cost agricultural applications.
In general, previous studies have shown the possibility of monitoring the flow of granular fertilizer in real time using various sensing techniques; however, limitations related to structural complexity, environmental sensitivity, implementation cost, and practicality under agricultural operating conditions have still not been adequately addressed.
Despite the significant advancements achieved in the development of VRA systems, one critical component, the flow rate sensor, is still under continuous efforts for improvement. This sensor plays a vital role as the main feedback mechanism that provides real-time data to the control system, allowing for dynamic adjustment of fertilizer discharge rates. It also serves as a key data source for generating actual application rate maps and system performance evaluation. Many existing sensors rely on complex mechanical or electronic principles, which significantly increase system costs and limit their accessibility for small-scale farmers or resource-limited environments. Some other sensors suffer from delayed response times or reduced accuracy under variable field conditions.
Simulation-based design is essential for developing accurate and robust measurement and operating systems in agricultural machinery, as it enables performance prediction under different operating conditions, unlike traditional systems that rely solely on expensive and time-consuming physical prototypes. Finite Element Analysis (FEA), Multi-Body Dynamics (MBD), and the Discrete Element Method (DEM) are among the most common engineering simulation techniques, each suited for different physics: FEA for structural/thermal, MBD for rigid-body motion, and the DEM for granular materials. Therefore, the DEM is widely used to simulate particle flows in various types of equipment at the individual particle scale and as an overall process, making it highly relevant for fertilizer flow analysis [
12]. In this regard, the DEM has been widely applied to analyze the behavior of granular materials in agricultural machinery, especially in fertilizer metering and unloading operations, as it effectively simulates particle motion, contact interactions, and flow characteristics within fertilizer delivery systems, making it a reliable tool for assessing machine performance [
13]. This approach allows researchers to simulate particle interactions, predict distribution patterns and evaluate structural parameters of fertilizer spreaders before field testing. Yang et al. [
14] demonstrated the applicability of the DEM in modeling fertilizer spreading performance in VRA centrifugal spreaders. The DEM was also employed by Zhang et al. [
15] to analyze flow fluctuations in screw-type distributors and identify optimum operational parameters for a stable discharge. Recent advances in simulation-based agricultural engineering have further highlighted the importance of DEM-coupled modeling approaches and intelligent sensing technologies for improving the design, optimization, and operational reliability of agricultural machinery and precision application systems [
16,
17,
18].
Despite the significant advances in fertilizer flow sensing technologies, a major challenge remains in developing a simple, affordable, and reliable real-time sensing system suitable for mechanical seeders. Many current sensing systems rely on complex optical or electronic architectures, advanced filtering algorithms, or highly controlled operating conditions, which may limit their practicality in field environments. Furthermore, insufficient attention has been given to integrating simulation-guided structural optimization with low-cost sensing architectures for monitoring the flow of granular fertilizer.
Therefore, the novelty of the present study lies in the development of a DEM-guided impact-based sensing system that combines structural and implementation simplicity and reliable real-time fertilizer flow rate measurement. The proposed approach integrates numerical optimization of sensor geometry with a load-cell-based impact sensing mechanism to improve measurement stability and applicability for variable-rate fertilizer application systems. Accordingly, this study aims to (1) design and fabricate a load-cell-based sensing module capable of accurately measuring the mass flow rate of granular fertilizers in seed drills, (2) conduct numerical simulations and analyze the performance of the developed sensor under different operational and material conditions, and (3) evaluate the sensor’s performance through laboratory tests to verify its accuracy and reliability.
2. Materials and Methods
2.1. Design of the Fertilizer Flow Rate Sensing System
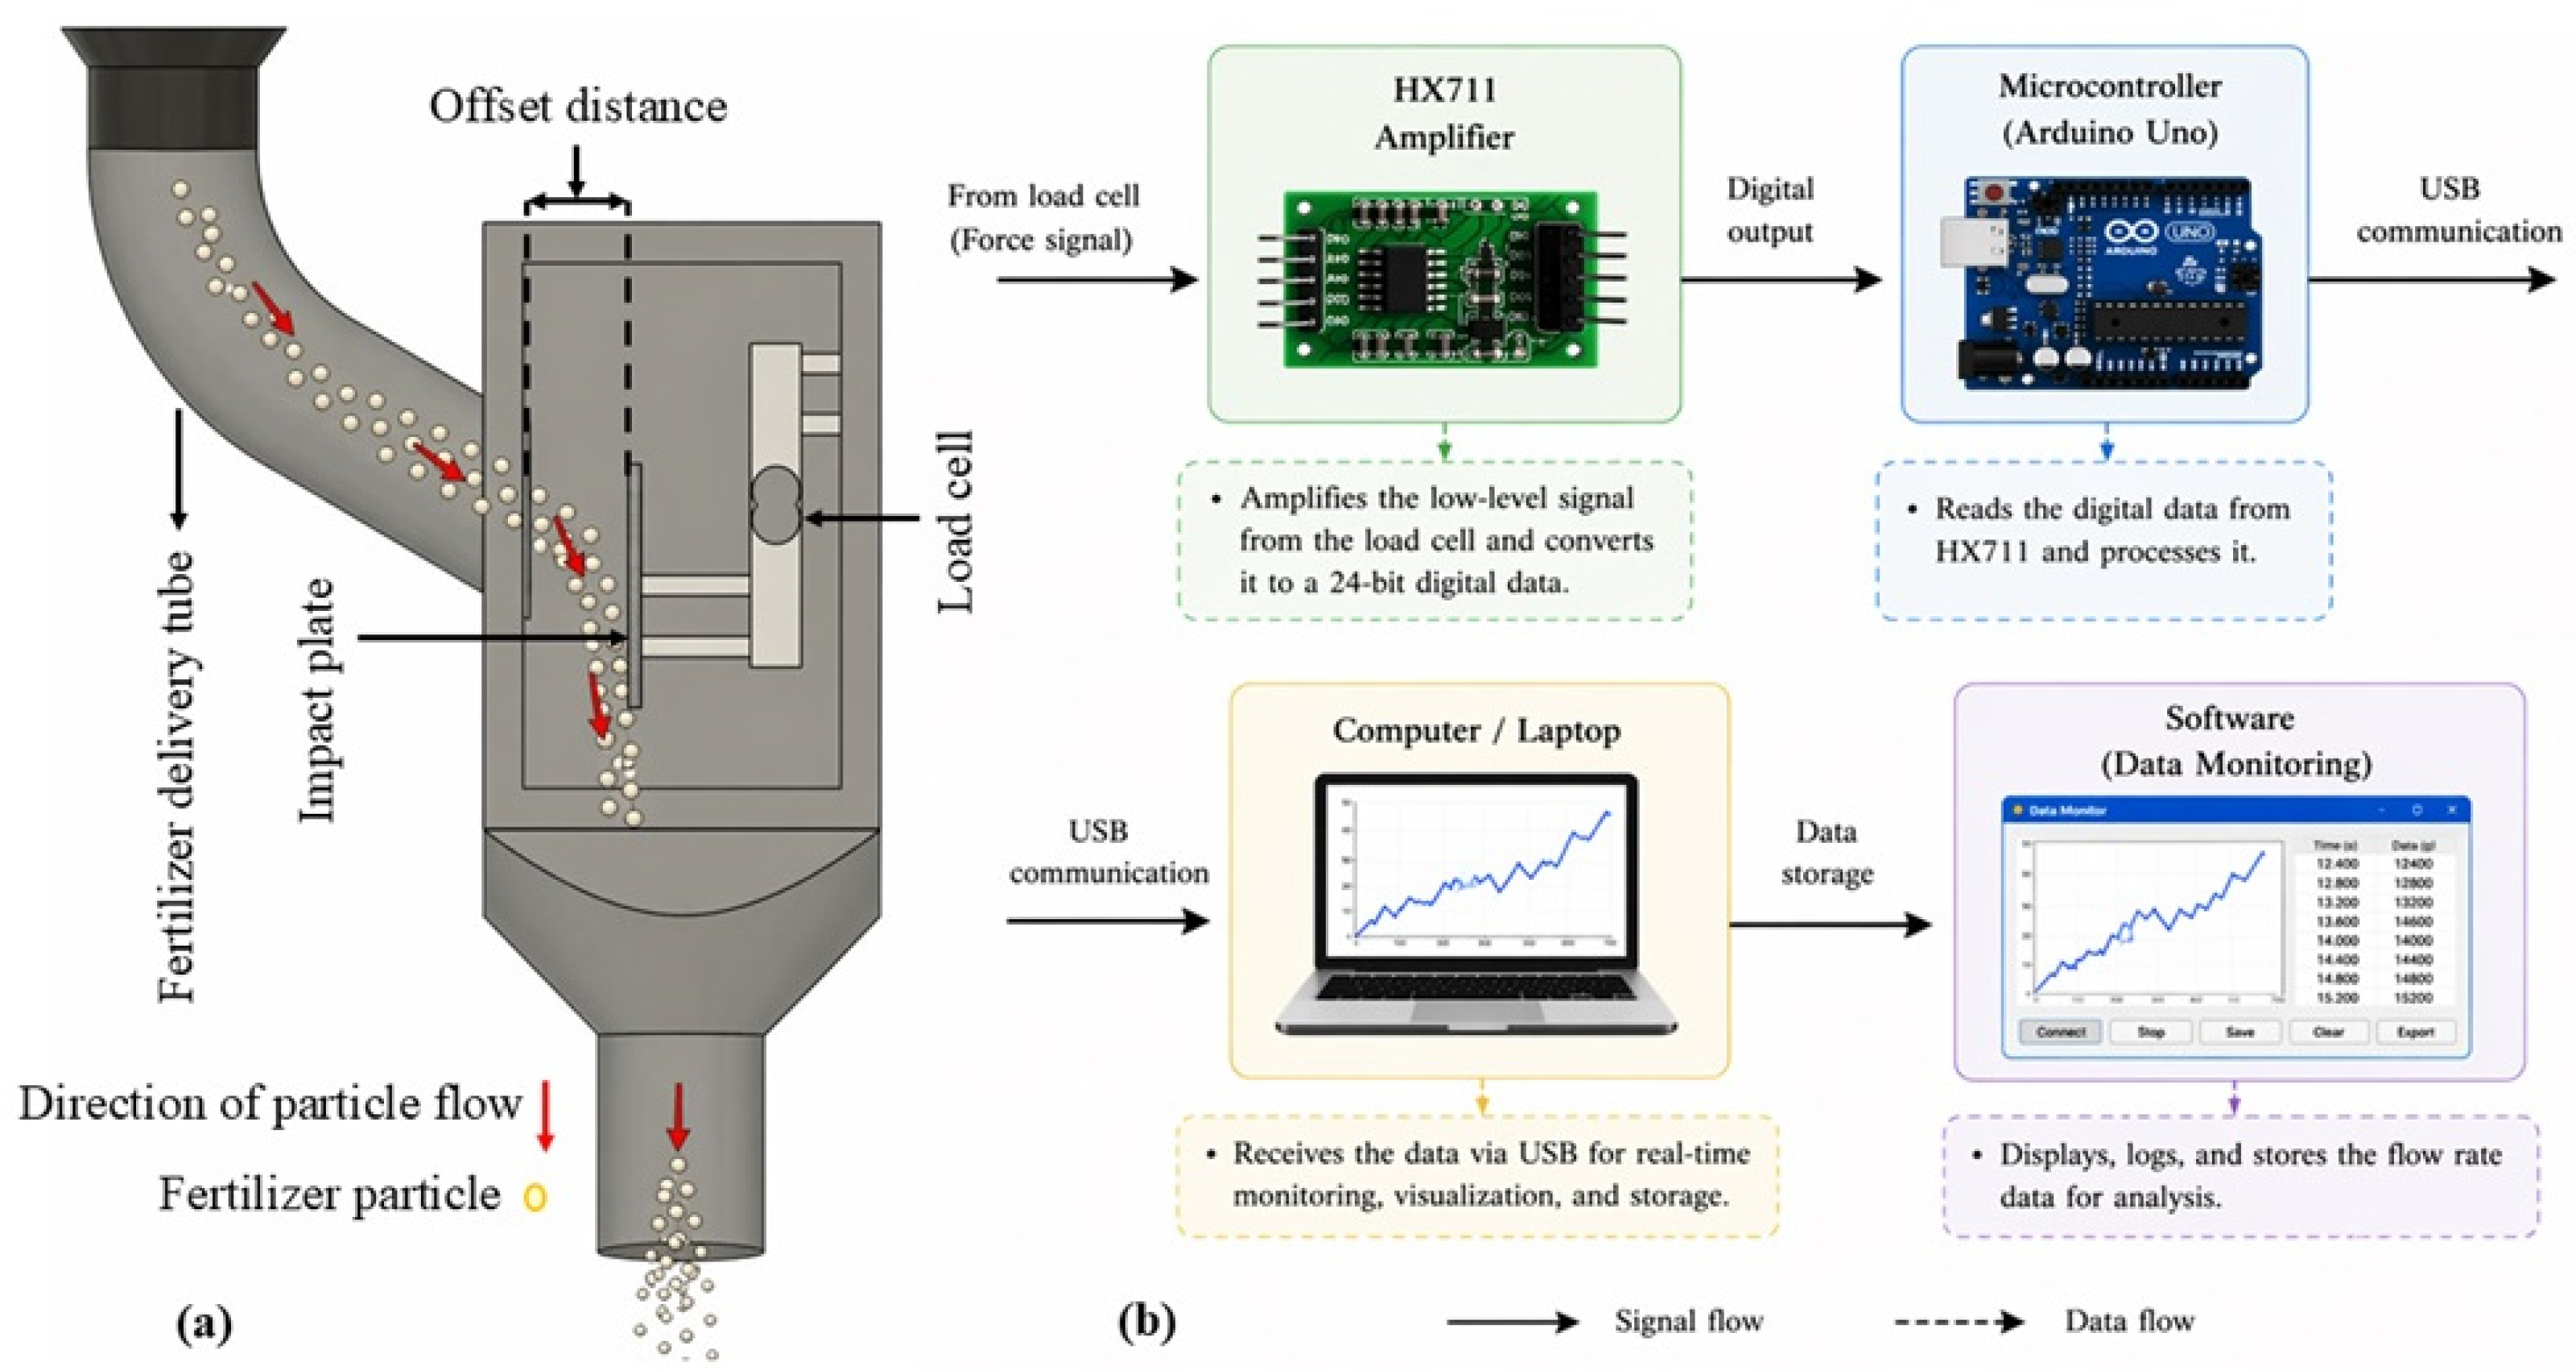
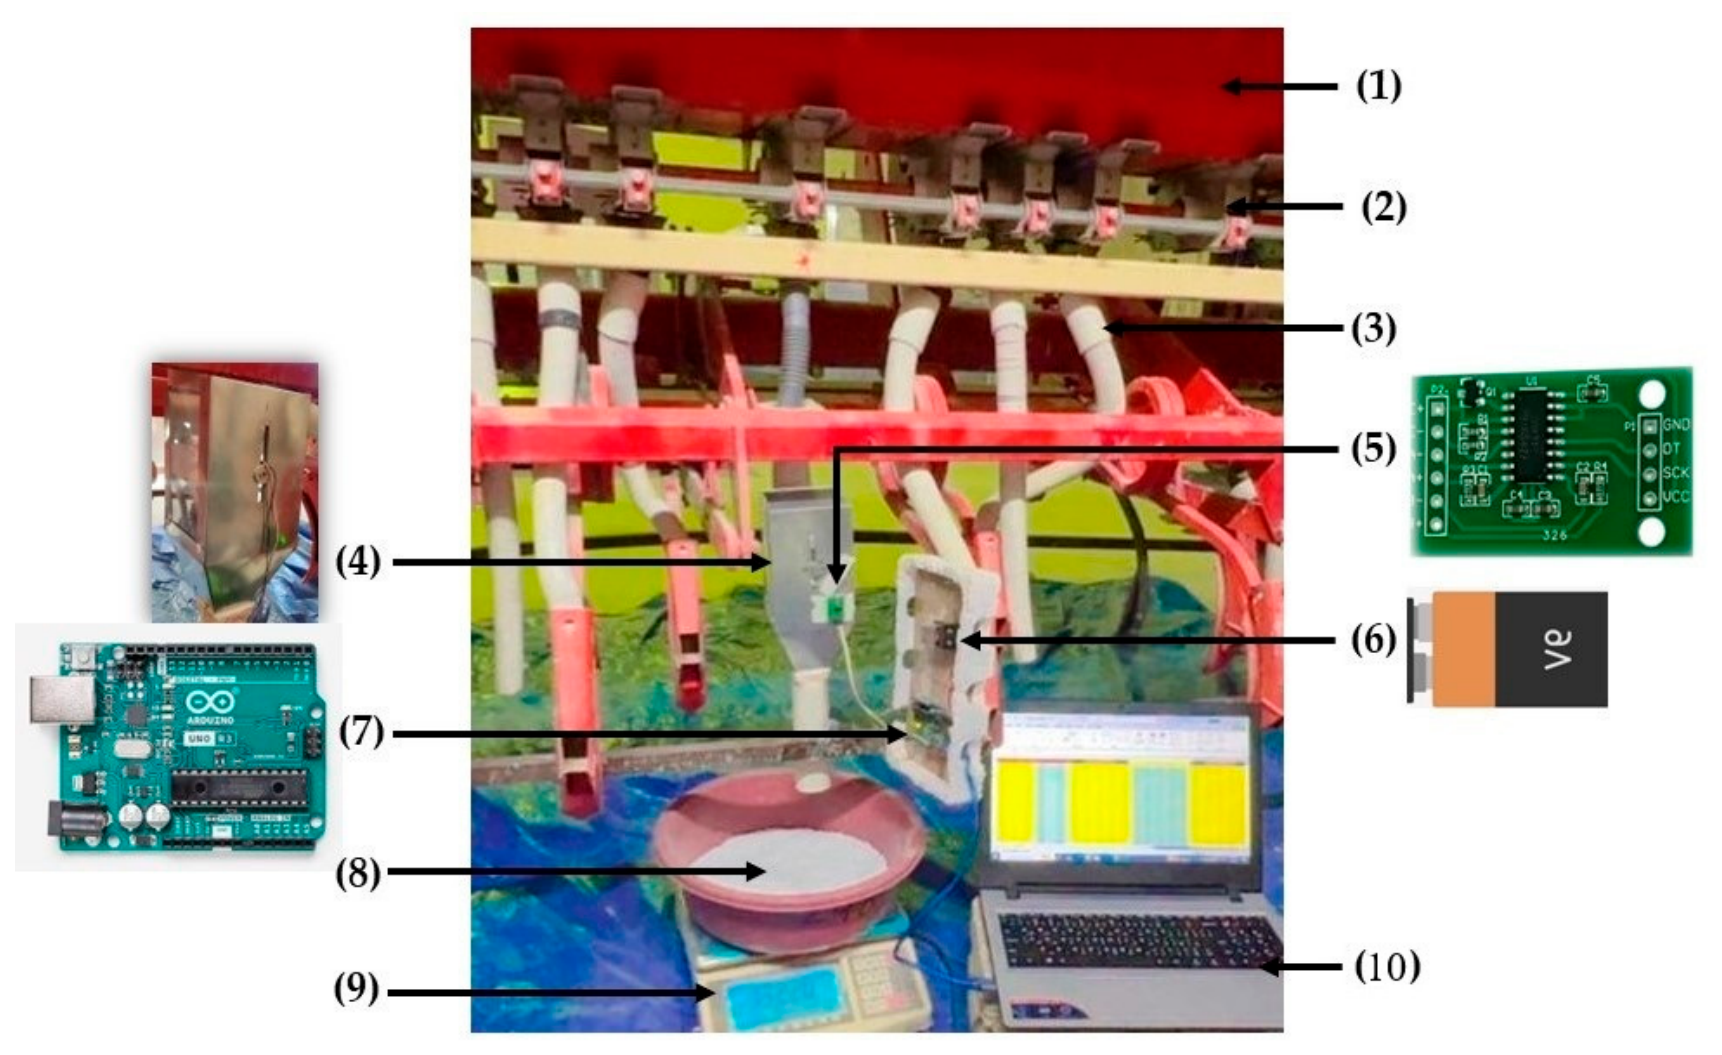
To monitor and measure the real-time flow rate of granular fertilizers in seed drills, a sensor unit was designed using cost-effective and reliable components. The system was developed based on an impact-based measurement principle, in which the momentum of falling fertilizer particles is converted into a measurable force signal using a load cell. The overall structure of the sensing system consists of two major subsystems (
Figure 1): (a) an impact-based sensing mechanism (fertilizer delivery unit, impact plate, and a load cell), and (b) a data acquisition and processing module.
The fertilizer granules are discharged from the metering device and conveyed through a vertical delivery tube. Upon exiting the tube, the granules fall freely due to gravity and strike a rigid impact plate mounted on the load cell. The resulting impact force is proportional to the fertilizer mass flow rate and is continuously monitored as an electrical signal, which is subsequently converted into fertilizer flow rate measurements.
The impact plate was rigidly mounted perpendicular to the flow direction of fertilizer granules and vertically aligned with the load cell axis (90° orientation) to ensure stable particle impact, consistent force transfer, and minimal particle scattering during operation. Since the offset distance between the fertilizer tube outlet and the impact plate is a critical geometric parameter affecting particle impact uniformity and signal stability, it was optimized using DEM simulation, as described in the following sections.
The sensing and acquisition system, which enables precision measurement of dynamic impact forces, consists of an Arduino Uno R3 microcontroller, a 1.0 kg load cell, and an HX711 signal amplifier. The amplified signal is transmitted to a laptop for real-time data acquisition, processing, and storage. Signal conditioning procedures, including filtering and noise reduction, were implemented to improve measurement accuracy and stability.
2.1.1. Microcontroller Unit (Arduino Uno R3)
The Arduino Uno served as the main control unit in the developed sensing module, which was mainly a microcontroller board based on the ATmega328 chip. The board included 14 digital I/O pins and 6 analog inputs, a 16 MHz ceramic resonator, a USB connection, a power jack, an ICSP header and a reset button. It operated at 5 V and was powered via USB or an external power source. The Arduino collected digital signals from the HX711 module, processed them, and calculated the fertilizer flow rate in grams per second.
2.1.2. Load Cell Sensor
A 1.0 kg strain gauge load cell (Model: YZC-133) was used to measure the instantaneous mass of fertilizer granules. The load cell operated based on deformation-induced changes in resistance and used a Wheatstone bridge configuration with four strain gauges. According to the manufacturer’s specifications, the load cell had a rated output sensitivity of 1.0 ± 0.15 mV/V, allowing the low-voltage analog signal generated by fertilizer particle impact forces to be amplified and digitized through the HX711 signal-conditioning module prior to processing within the Arduino-based acquisition system. The load cell, constructed from aluminum alloy, offered high accuracy with key features such as 0.05% full-scale (FS) non-linearity, hysteresis, repeatability and an acceleration of 0.1% FS over a 30 min period. It had an Ingress Protection rating of IP65, an input impedance of 1130 ± 10 Ω, and supported up to 150% of its rated capacity.
2.1.3. Load Cell Amplifier
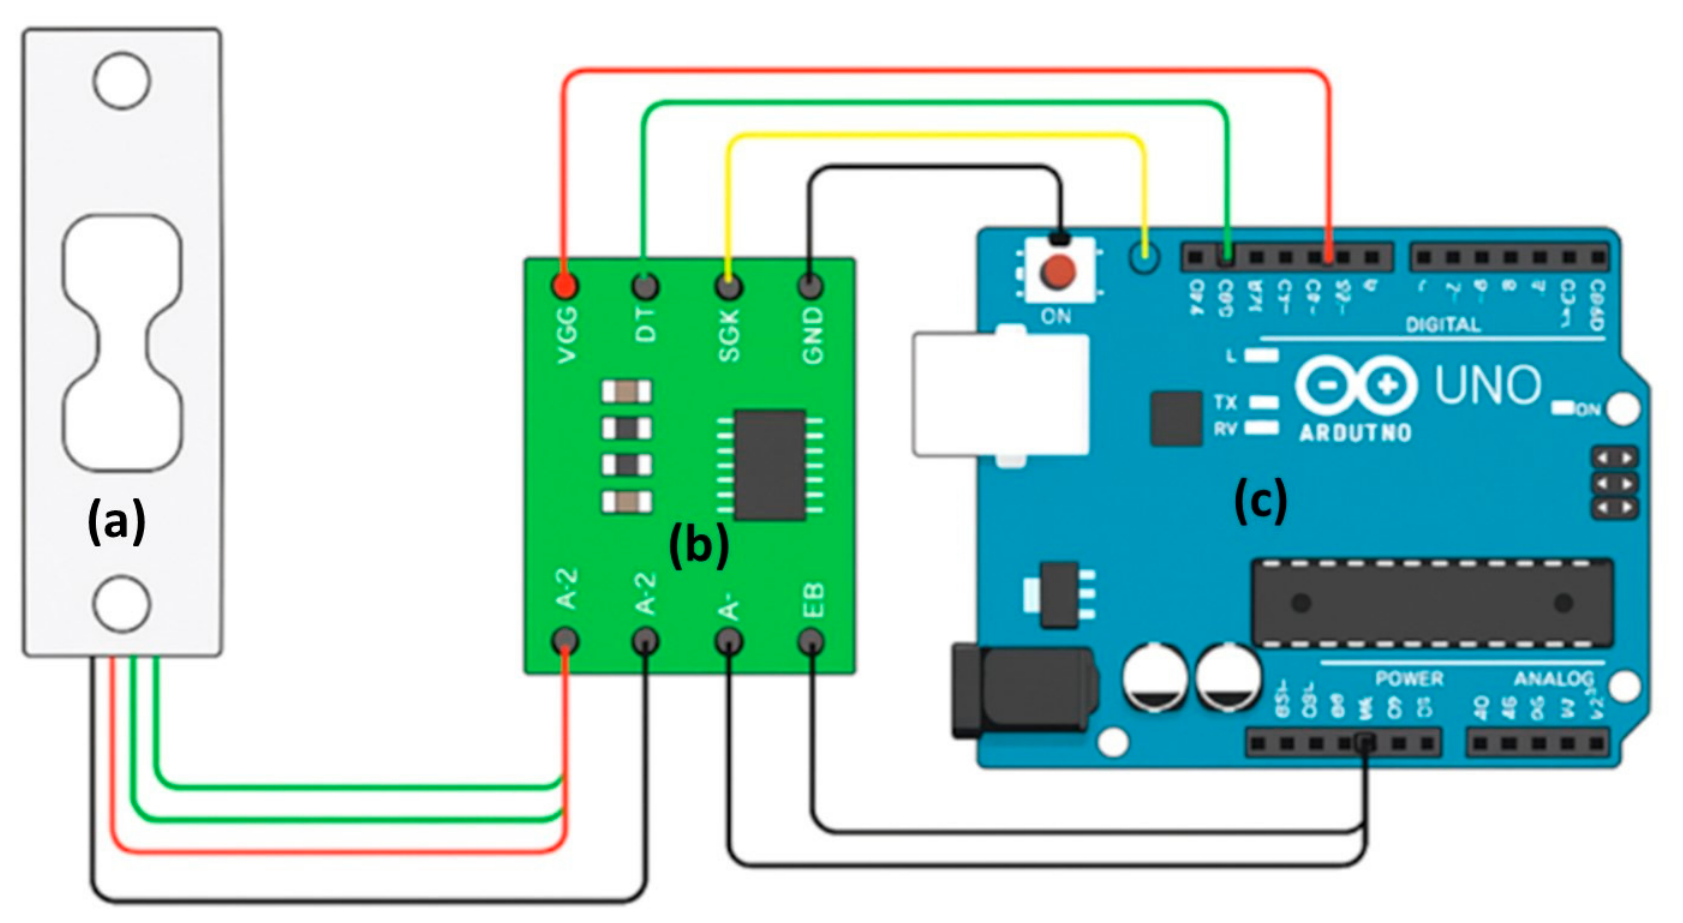
The load cell amplifier (model: HX711), a 24-bit analog-to-digital converter module, was specifically designed for weighing scale applications. It amplified the low-voltage analog signal from the load cell and converted it into a high-resolution digital signal. Communication between the HX711 and Arduino was via two digital pins (DT and SCK). The color-coded wires corresponded to standard load cell signal connections, namely, red (E+), black (E−), white (A+), green (A−) and yellow (shield).
2.1.4. Impact Plate
The impact plate is a key mechanical element of the developed fertilizer flow rate sensing system, designed to receive fertilizer granules discharged from the flow tube and transfer the resulting impact force to the load cell. The plate was fabricated from iron with a thickness of 3 mm and a circular diameter of 60 mm and rigidly mounted on the free end of the load cell. The impact plate was positioned perpendicular to the flow direction of fertilizer granules to ensure consistent particle impact and stable force transfer to the load cell during operation. During operation, the falling fertilizer granules strike the plate surface, generating an impact force proportional to the instantaneous mass flow rate. This force is directly transmitted to the load cell and converted into an electrical signal, which is continuously processed to produce real-time fertilizer flow rate measurements.
2.1.5. Data Display Unit
A laptop computer, running the Arduino IDE, was used to display system data and perform calibration. It provided a real-time display of load cell readings and the calculated flow rates, enabling accurate monitoring and calibration. The software’s serial communication interface was utilized to display, store and debug data, providing an integrated platform for real-time monitoring and analysis.
2.1.6. System Wiring and Signal Processing
The analog output signal from the load cell was amplified and digitized using the HX711 load cell amplifier module interfaced with an Arduino Uno microcontroller through two digital input pins (DT and SCK). The Arduino was programmed to continuously read digital weight data at fixed time intervals (sampling frequency) and process the signal to calculate real-time weight changes. Data collection was performed at a constant sampling rate suitable for monitoring continuous fertilizer discharge behavior under laboratory conditions. To minimize random signal fluctuations and improve measurement stability, the recorded sensor readings were processed using averaging and calibration procedures before being converted to fertilizer flow rate values using the developed empirical calibration models.
The system was then calibrated using certified reference weights to determine the appropriate gain and offset values for the HX711 module. These parameters were integrated into the Arduino code to ensure accurate weight measurement, providing a compact, cost-effective, and accurate framework for real-time measurement of granular fertilizer flow rates.
Figure 2 illustrates the system’s wiring diagram and signal flow.
2.1.7. Data Logging and Software Interface
To enable data logging and facilitate system interaction, the sensor system was integrated into a laptop computer using the Arduino Integrated Development Environment (IDE), a programming platform that includes a text editor, a message zone, a text console, a function toolbar and a series of menus. It facilitated direct communication with hardware boards and enabled code uploading. The Arduino Uno board was connected to the laptop via USB, enabling continuous communication through a serial interface. This system allowed the display of sensor output data, including instantaneous weight, which was saved using appropriate data logging scripts.
2.2. Structural Design of the Developed Sensor Prototype
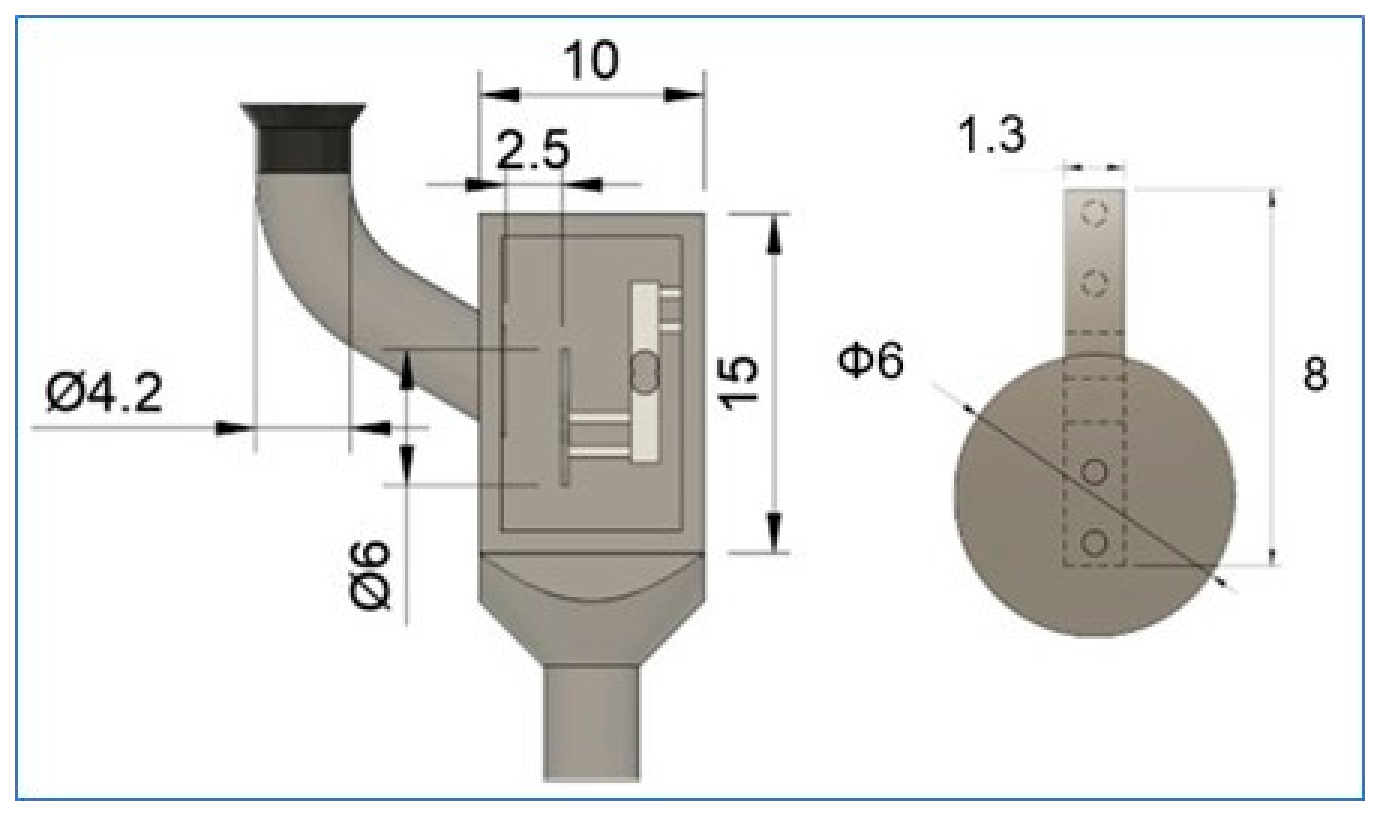
The prototype of the fertilizer flow rate sensing system (
Figure 3) consists of an impact plate mounted on a load cell, featuring a 60 mm diameter iron contact surface to receive the falling granules. The outer casing of the prototype was designed with a rectangular top section (150 × 100 mm) and a pyramid-shaped bottom section that terminates in a circular outlet to direct the fertilizer towards the impact plate. The fertilizer flow tube, which connects the fertilizer tank to the fertilizer flow rate sensing system, is made of iron with a diameter of 42 mm and a 60° angle of inclination. This angle was chosen because it falls within the recommended range (45–65°) for achieving stable and continuous granular flow in impact-based solid flow measurement systems [
19]. This geometry ensures consistent flow of fertilizer granules to the sensor plate and enhances measurement reliability.
The impact-based flow measurement technology was adopted to determine the fertilizer mass flow rate, as it is one of the most common methods for measuring solid flow. The fertilizer granules are directed through a feed tube towards a flat impact plate mounted on a load cell. Upon impact, the resulting force causes a measurable deflection in the load cell, generating an electrical signal proportional to the applied force and, consequently, to the fertilizer flow rate. The output voltage is then converted to a mass flow value using a suitable calibration equation.
2.3. Characteristics of the Test Fertilizers
The fertilizer granules used in this study were represented as spherical elements in the DEM simulation, with their physical and contact properties defined based on combinations of experimental measurements, data from the literature, and calibration procedures. Key measurable physical properties, including granules’ mean diameter and bulk density, were experimentally determined for the fertilizer samples used in this study to ensure consistency between simulation inputs and laboratory conditions. The size of the fertilizer granules was determined using a standard sieve analysis method, and the average granule diameter for both urea and NPK fertilizers was found to be about 3.5 mm. Bulk density was measured using a graduated cylinder method under controlled laboratory conditions. Other material properties, such as Poisson’s ratio and shear modulus, were adopted from previously published and validated DEM studies involving similar fertilizer materials, specifically for urea [
14] and NPK fertilizer [
20]. The selected values fall within commonly reported ranges for granular fertilizers and were used to ensure realistic representation of particle mechanical behavior. The contact interaction parameters required for the DEM simulation, including restitution and friction coefficients (static, dynamic, and rolling), are difficult to measure directly at the particle scale. Therefore, initial parameter values were adopted from previously published and experimentally validated DEM studies involving urea and NPK fertilizers [
14,
20]. Subsequently, a limited qualitative calibration was performed by adjusting selected contact parameters within physically realistic ranges until the simulated fertilizer discharge behavior reasonably matched the experimentally observed flow characteristics under similar operating conditions. Final DEM simulations were conducted using calibrated contact-parameter values selected from the physically realistic ranges reported in previous studies and summarized in
Table 1 and
Table 2. The final simulations were performed using particle–particle restitution coefficients of 0.11 for urea and 0.44 for NPK fertilizer, static friction coefficients of 0.32 and 0.70, and rolling friction coefficients of 0.04 and 0.07, respectively. These calibrated parameter combinations were adopted based on their ability to provide stable discharge behavior and reasonable agreement with experimentally observed fertilizer flow characteristics. Formal sensitivity analysis of DEM parameters was beyond the scope of the present study.
The complete set of material and contact parameters used in the DEM simulation is presented in
Table 1 and
Table 2, including a clear indication of their source and determination method (experimental measurement, the literature, or calibration).
2.4. Simulation Experiments
2.4.1. Discrete Element Method (DEM) Simulation
This study used Discrete Element Method (DEM) simulation to identify the optimum offset distance between the fertilizer tube outlet and the impact plate of the fertilizer flow rate measuring sensor by modeling the flow of both urea and NPK fertilizers, taking into account their different characteristics and flow behaviors. The sensor’s performance was then verified through laboratory experiments using urea fertilizer by comparing the actual and the sensor-measured flow rates.
The fertilizer discharge process was analyzed using the Altair EDEM® 2024.1, Version: 10.1.10 (Altair Engineering Inc., Troy, MI, USA), a high-performance DEM software program for bulk material simulation. The simulation engineering replicated the fertilizer discharge unit of a mechanical seed drill (SOLA TRISEM 294/R ESP), where all components were modeled in the Autodesk Fusion 360 (Autodesk Inc., San Francisco, CA, USA) software and imported into EDEM in STEP format (a common file format used to store and transfer 2D and 3D engineering models, parts, and design data) to ensure geometric accuracy. The DEM simulation was primarily used in this study as a design-support and geometric optimization tool to compare the relative performance of different offset distances between the fertilizer outlet and the impact plate. Therefore, the simulation aimed not to reproduce the complete particle-scale dynamics of fertilizer flow, but rather to identify the configuration that provides the most stable and continuous discharge behavior. Accordingly, the validation strategy focused mainly on the overall flow behavior, discharge continuity, particle trajectory consistency, and impact stability within the sensing chamber. More advanced particle-scale validation measures, such as impact-force time series and contact-frequency analysis, were considered beyond the scope of the current study and are recommended for future investigations.
2.4.2. DEM-Based Simulation Procedure
The simulation conditions were configured to match laboratory operating parameters, with the fertilizer discharged by gravity. In this study, the term “operating speeds” refers to two parameters: (i) the forward (ground) speed of the seed drill, which was varied within the range of 4–12 km h−1, including the most commonly adopted field operating speed for fertilization (8 km h−1), and (ii) the rotational speed of the fertilizer metering shaft, which was set at two levels (20.85 and 44.00 rpm) corresponding to different fertilizer discharge settings, namely positions 25 and 50 of the fertilizer adjustment lever. The primary output derived from the DEM simulation was the fertilizer mass flow rate, which was used to guide the selection of the optimum offset distance of the impact plate above the load cell that ensures precise capture of the generated fertilizer flow.
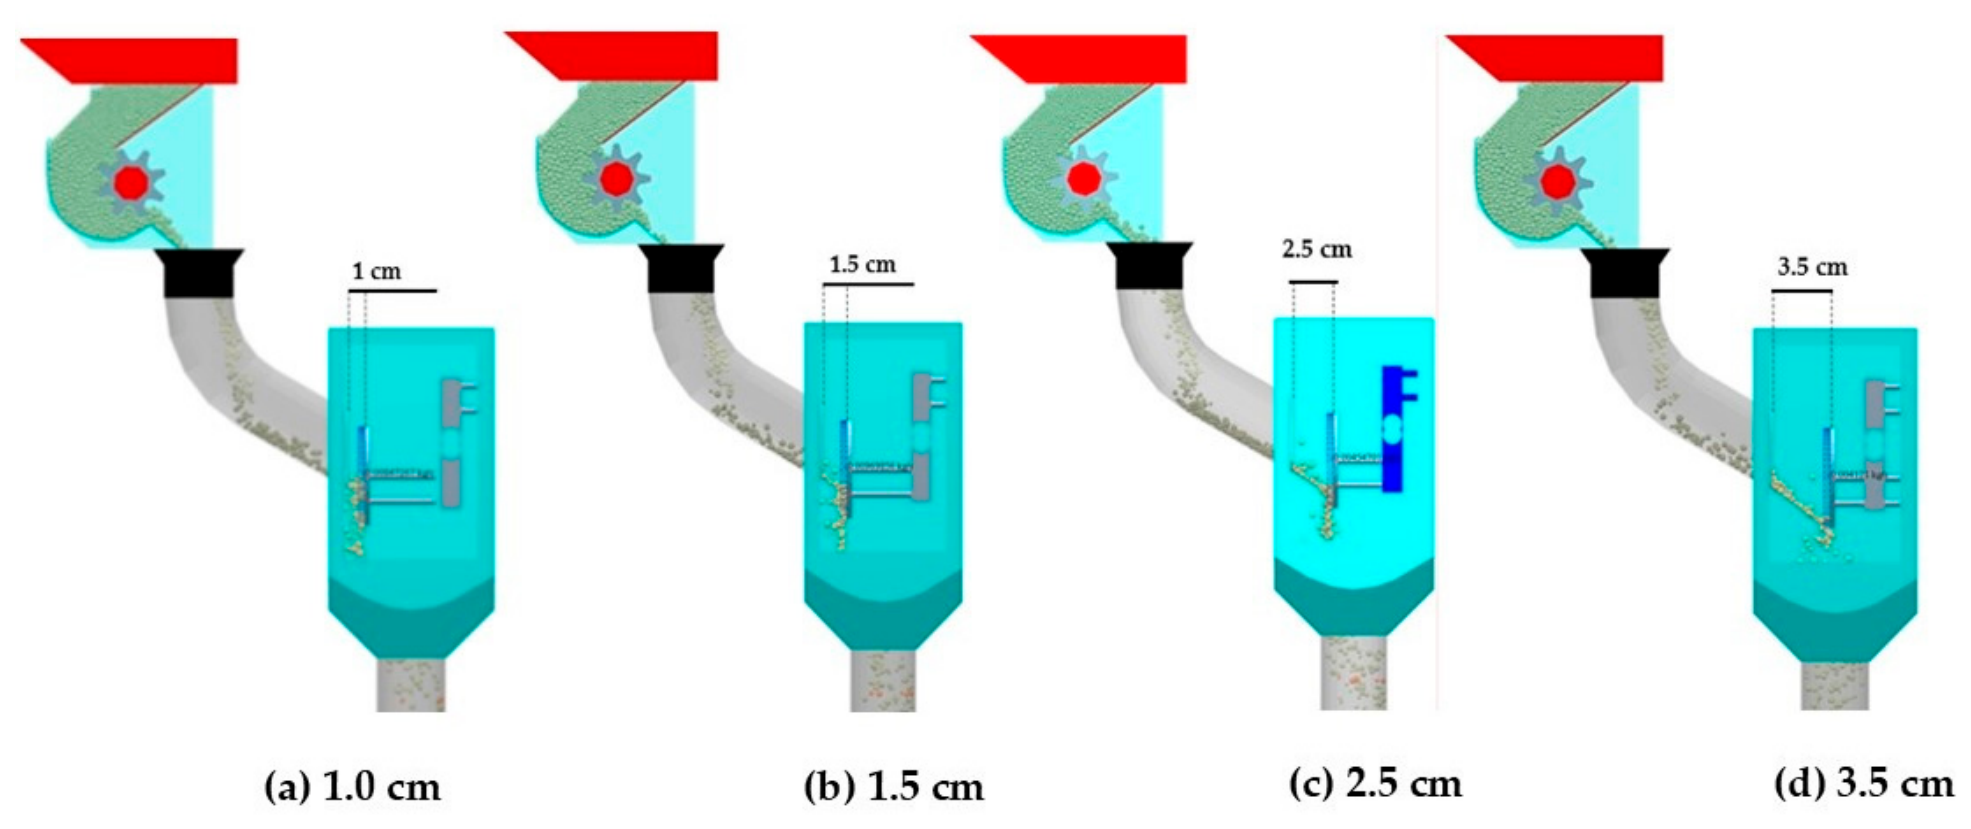
The present study specifically focused on optimizing the offset distance between the fertilizer outlet and the impact plate because preliminary observations indicated that this geometric parameter had the strongest influence on particle-impact stability and discharge consistency within the sensing chamber. Other structural parameters, including the impact-plate inclination angle, plate material, and fertilizer-tube geometry, were maintained constant during the present investigation to reduce experimental complexity and isolate the effect of offset distance on sensing performance. To determine the optimum offset distance between the fertilizer outlet and the impact plate, four offset distances (1.0, 1.5, 2.5, and 3.5 cm) were evaluated (
Figure 4) at the seed drill’s operating speed (8 km h
−1) and two rotation speeds of the fertilizer metering shaft (20.85 and 44.00 rpm), which represent positions 25 and 50 of the fertilizer rate adjustment lever of the experimental seed drill. Simulations were performed for both urea and NPK fertilizers to account for differences in material properties and flow behavior. These two fertilizer types were intentionally selected because they represent commonly used granular fertilizers with different density and discharge characteristics, thereby providing a practical basis for evaluating the adaptability of the developed sensing system under varying granular flow conditions.
Figure 4 presents DEM simulation snapshots illustrating the influence of offset distance on fertilizer particle flow behavior. At shorter distances (1.0 and 1.5 cm), particles exhibit less stable impact conditions due to limited travel distance, leading to irregular contact with the impact plate. Conversely, at larger distances (3.5 cm), particle dispersion increases, which reduces impact consistency. The intermediate distance of 2.5 cm provides a more uniform particle trajectory and stable impact behavior, supporting its selection as the optimal configuration.
2.4.3. DEM Representation of the Developed Flow Rate Sensor Assembly
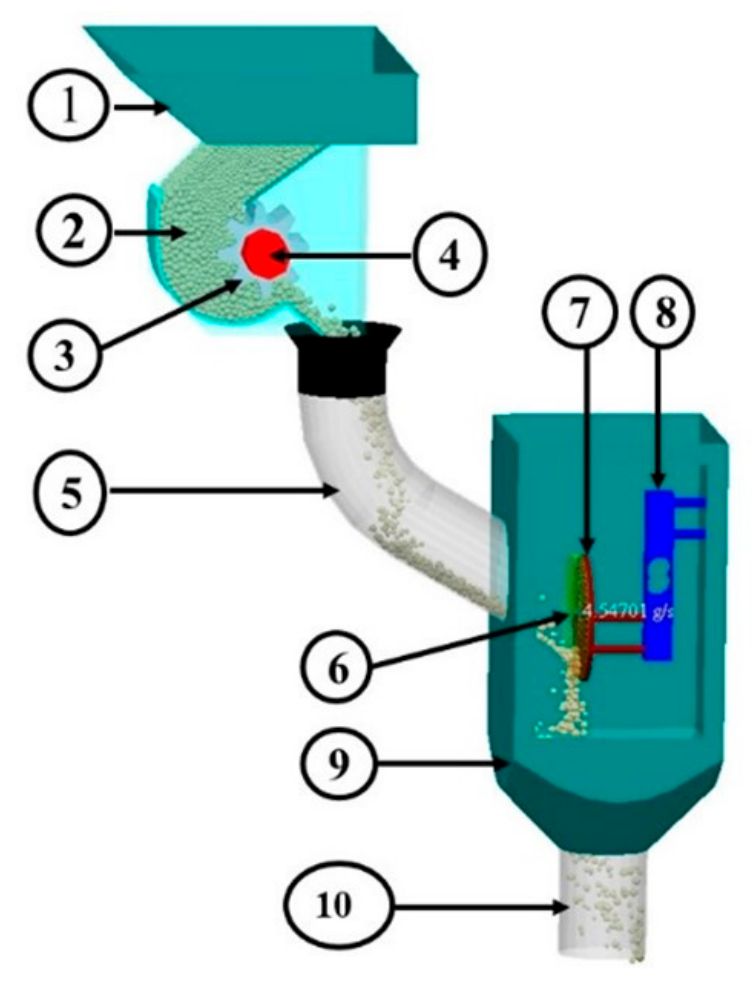
The developed flow rate sensor assembly was modeled in the EDEM-DEM software to capture the fertilizer discharge through the metering and conveying paths, and to characterize particle–sensor interaction within the sensing chamber (
Figure 5). The mechanism for measuring fertilizer flow rate depends on directing granular materials through the discharge tube toward the sensing area of the developed impact-based sensor, where the particles collide with an impact plate mounted on the load cell. The resulting reaction force provides the physical basis for the principle of collusion-based solid flow measurement. Within this simulation framework, the geometry was used to extract the mass flow signal and to support selection of the tube-to-impact-plate spacing. The 2.5 cm offset distance was retained for subsequent laboratory analyses because it ensured stable detectability (zero non-detections) and improved reliability compared with larger offsets (refer to the Results Section).
2.5. Laboratory Experiments
2.5.1. The Experimental Platform
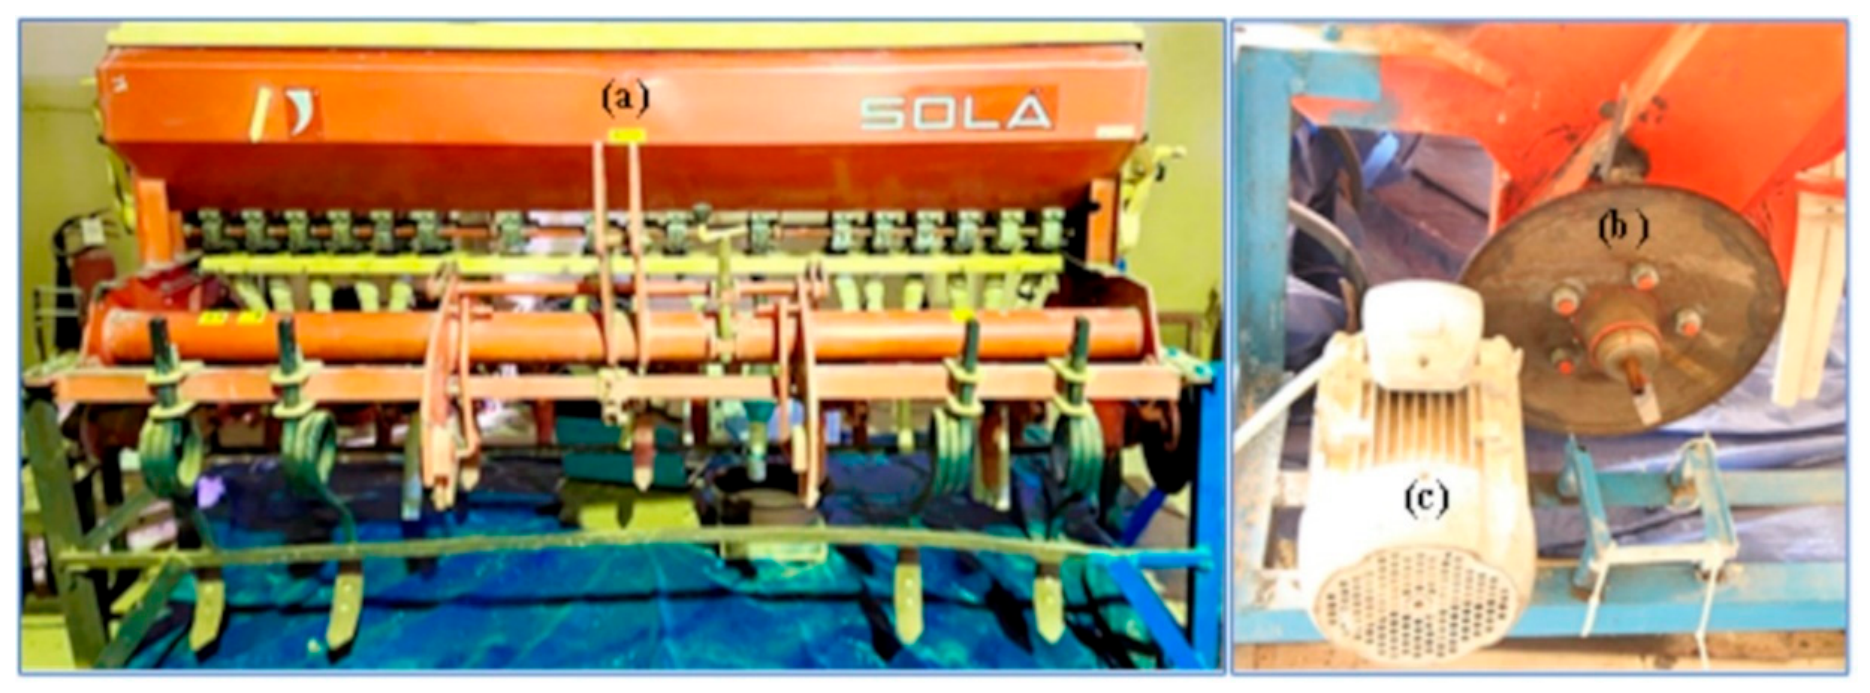
The fertilizer application unit in a mechanical seed drill (SOLA TRISEM 294/R ESP, Model: 37193 TIPO250) was utilized as a test platform (
Figure 6a). The seed drill was designed such that the fertilizer flow rate could be manually adjusted by changing the position of the fertilizer flow adjustment lever. The ground wheel of the experimental platform was replaced by a driven gear (
Figure 6b) attached to a multi-speed electric motor (
Figure 6c) to apply variable speeds to the fertilizer metering shaft. All laboratory experiments, calibration procedures, and sensor performance evaluation tests conducted in this study were repeated three times, and the mean values were used for subsequent statistical analysis.
2.5.2. Calibration of the Experimental Platform Components
Forward/Ground Speed
The forward speed was calibrated in the laboratory using a digital tachometer (model: ERM-3770 77 × 35 DIN Size), which measures the number of revolutions per minute (rpm) of the experimental platform wheel drive shaft. The experimental platform forward speed in km h
−1 was then calculated using Equation (1). The forward speeds used in this study ranged from 4 to 12 km h
−1, which is believed, based on previous studies, to cover most of the speeds used in granular fertilizer application by seed drills. The specific speed values used in this study included 4, 6, 8, 10 and 12 km h
−1.
where V is the applicator forward speed (km h
−1), R is the applicator shaft speed (rpm) and P is the perimeter of the ground wheel (m).
Fertilizer Rate Adjustment Lever
To precisely determine the actual fertilizer rate at each of the ten positions of the fertilizer rate adjusting lever, the adjustment lever of the experimental platform was calibrated manually at all the tested forward speeds. The calibration test was repeated three times, and the fertilizer flow rate was determined in g s−1.
2.5.3. Setup and Evaluation of the Sensor System
The developed fertilizer flow rate sensor was integrated into the experimental platform for laboratory calibration under different forward speeds and different positions of the fertilizer rate adjusting lever. One of the outlet gates of the fertilizer distribution units was selected, and the developed sensor was mounted directly beneath the selected outlet (
Figure 7).
2.6. Development of a Sensor Calibration Model for Measuring the Fertilizer Flow Rate
To determine the best relationship between the actual fertilizer flow rate and that measured by the developed sensor, experiments were conducted at ten different fertilizer discharge adjustment lever settings and five selected forward speeds (4, 6, 8, 10, and 12 km h−1). For each lever position and forward speed, the actual and sensor-measured fertilizer flow rate observations were repeated three times, and the mean flow rates (g s−1) were determined. All reported experimental results represent the mean values of three replicates obtained under each operating condition. Variability among repeated measurements was evaluated using coefficient-of-variation analysis and analysis of variance to assess the repeatability and measurement stability of the developed sensing system. Calibration results showed high linear correlations between actual and sensor-measured fertilizer flow rates at all five tested forward speeds, with R2 values of 0.9981, 0.9988, 0.9989, 0.9919 and 0.9957 obtained at speeds of 4, 6, 8, 10 and 12 km h−1, respectively.
To more accurately evaluate the performance of the developed sensor, two calibration models were selected and implemented within the sensor’s programming code. The first calibration model represented the most accurate individual correlation among the five speed-specific models. The best-fit equation was recorded at a forward speed of 8 km h
−1, represented by Equation (2) with R
2 value of 0.9989. This equation was considered to be the optimum model during the performance evaluation experiments of the developed sensor. It should be noted that the calibration equations developed in this study represent empirical relationships between the processed sensor output signal and the gravimetrically measured fertilizer flow rate rather than direct physical equivalence between impact force and fertilizer mass. The load cell signal was first amplified and digitized through the HX711 module and subsequently processed within the Arduino-based acquisition system using calibration scaling factors and signal-conditioning procedures. Therefore, the regression coefficients primarily reflect the characteristics of the electronic amplification and signal conversion process in addition to the mechanical impact response of the sensing system.
where y is the processed sensor output after amplification and calibration scaling, and x is the gravimetrically measured fertilizer flow rate (g s
−1).
The second calibration model was generated using the regression line derived from the average values of the actual and sensor-measured fertilizer flow rates, which represented the averaged data across all speeds and lever positions. This model was considered as the average model and was implemented in the second code of the sensor system represented by Equation (3) with an R
2 value of 0.9983.
These two models provided a basis for evaluating the sensor’s performance in both optimized and generalized calibration settings. The subsequent tests, however, were conducted using both the optimum and average models to compare the accuracy and reliability of the developed sensing system.
2.7. Accuracy Assessment of the Developed System
In order to verify the accuracy of the developed sensor in the laboratory, the experimental platform was set to work at different fertilizer outlet openings and five forward speeds, namely 4, 6, 8, 10 and 12 km h
−1. The accuracy of the developed fertilizer flow rate measuring sensor was evaluated under each of the tested forward speeds; the mean absolute percentage error (MAPE) was also evaluated (Equations (4) and (5)) as described in [
21]. In addition, the root mean square error (RMSE) statistical indicator was calculated, according to Equation (6), to further assess the performance of the developed fertilizer flow rate sensor.
where Q
m and Q
a are the sensor-measured and the actual fertilizer flow rates (g s
−1), respectively, and i and n are the order number and number of observations at each forward speed.
3. Results
3.1. Simulation Results: Offset Distance
Simulation was used, as a design optimization tool, to determine the optimum offset distance (i.e., the distance between the fertilizer tube outlet and the impact plate of the fertilizer flow rate measuring sensor). Dynamic data were collected at specific operating conditions for the experimental seed drill (i.e., fertilizer flow rate lever setting to positions 25 and 50) and four offset distances (1.0, 1.5, 2.5, and 3.5 cm), using NPK and urea fertilizers. The optimum offset distance was determined using detectability and repeatability under the intended fertilizer flow rate lever position setting at a forward speed of 8.0 km h
−1, a commonly used speed for seed drills equipped with a fertilizer application unit. The descriptive statistics of the collected simulation results are summarized in
Table 3, which provides a brief overview of main simulation outcomes.
Descriptive statistics for fertilizer flow rate at four offset distances (1.0, 1.5, 2.5, and 3.5 cm) revealed clear differences in the discharge behavior between NPK and urea fertilizers. For NPK, the highest mean flow rate occurred at an offset distance of 1.0 cm (5.096 g s−1), followed by slight decreases at 1.5 cm (4.322 g s−1) and 2.5 cm (4.742 g s−1). Flow rates at these three offsets showed relatively low variability, with coefficients of variation (CV) ranging from 8.22% to 13.19%, indicating stable and consistent discharge. In contrast, an offset distance of 3.5 cm produced a much lower mean flow rate (2.292 g s−1) and exhibited extreme variability (CV = 94.57%). The lowest recorded value at this offset distance was 0.000 g s−1, indicating complete flow stoppage in some trials. This suggests that the flow of the NPK fertilizer becomes highly unstable and unreliable when the offset distance is increased to 3.5 cm. In contrast, the urea fertilizer displayed a different response pattern, with the mean flow rates increasing with the offset distances from 5.039 g s−1 at 1.0 cm to 5.456 g s−1 at 1.5 cm, reaching the highest value at 2.5 cm (7.247 g s−1). Variability at these offsets was low (CV = 5.71–12.46%), indicating consistent flow performance. The relatively low variability observed among repeated measurements further confirms the repeatability and stability of the developed sensing system under the investigated laboratory operating conditions. However, at 3.5 cm, the mean flow rate decreased to 5.149 g s−1, accompanied by a moderate increase in variability (CV = 24.72%). Although urea flow was less stable at 3.5 cm than at smaller offsets, it maintained efficient flow across all offset distances, unlike NPK fertilizer.
The simulation results demonstrated that fertilizer flow behavior varied according to the offset distance; however, the relationship was not strictly monotonic for all fertilizer types and operating conditions. The intermediate offset distance (2.5 cm) provided more stable discharge behavior, improved impact consistency, and reduced particle flow interruption compared with the other tested configurations. Therefore, the optimum offset distance was selected primarily based on discharge stability and sensing consistency rather than maximum flow rate magnitude alone.
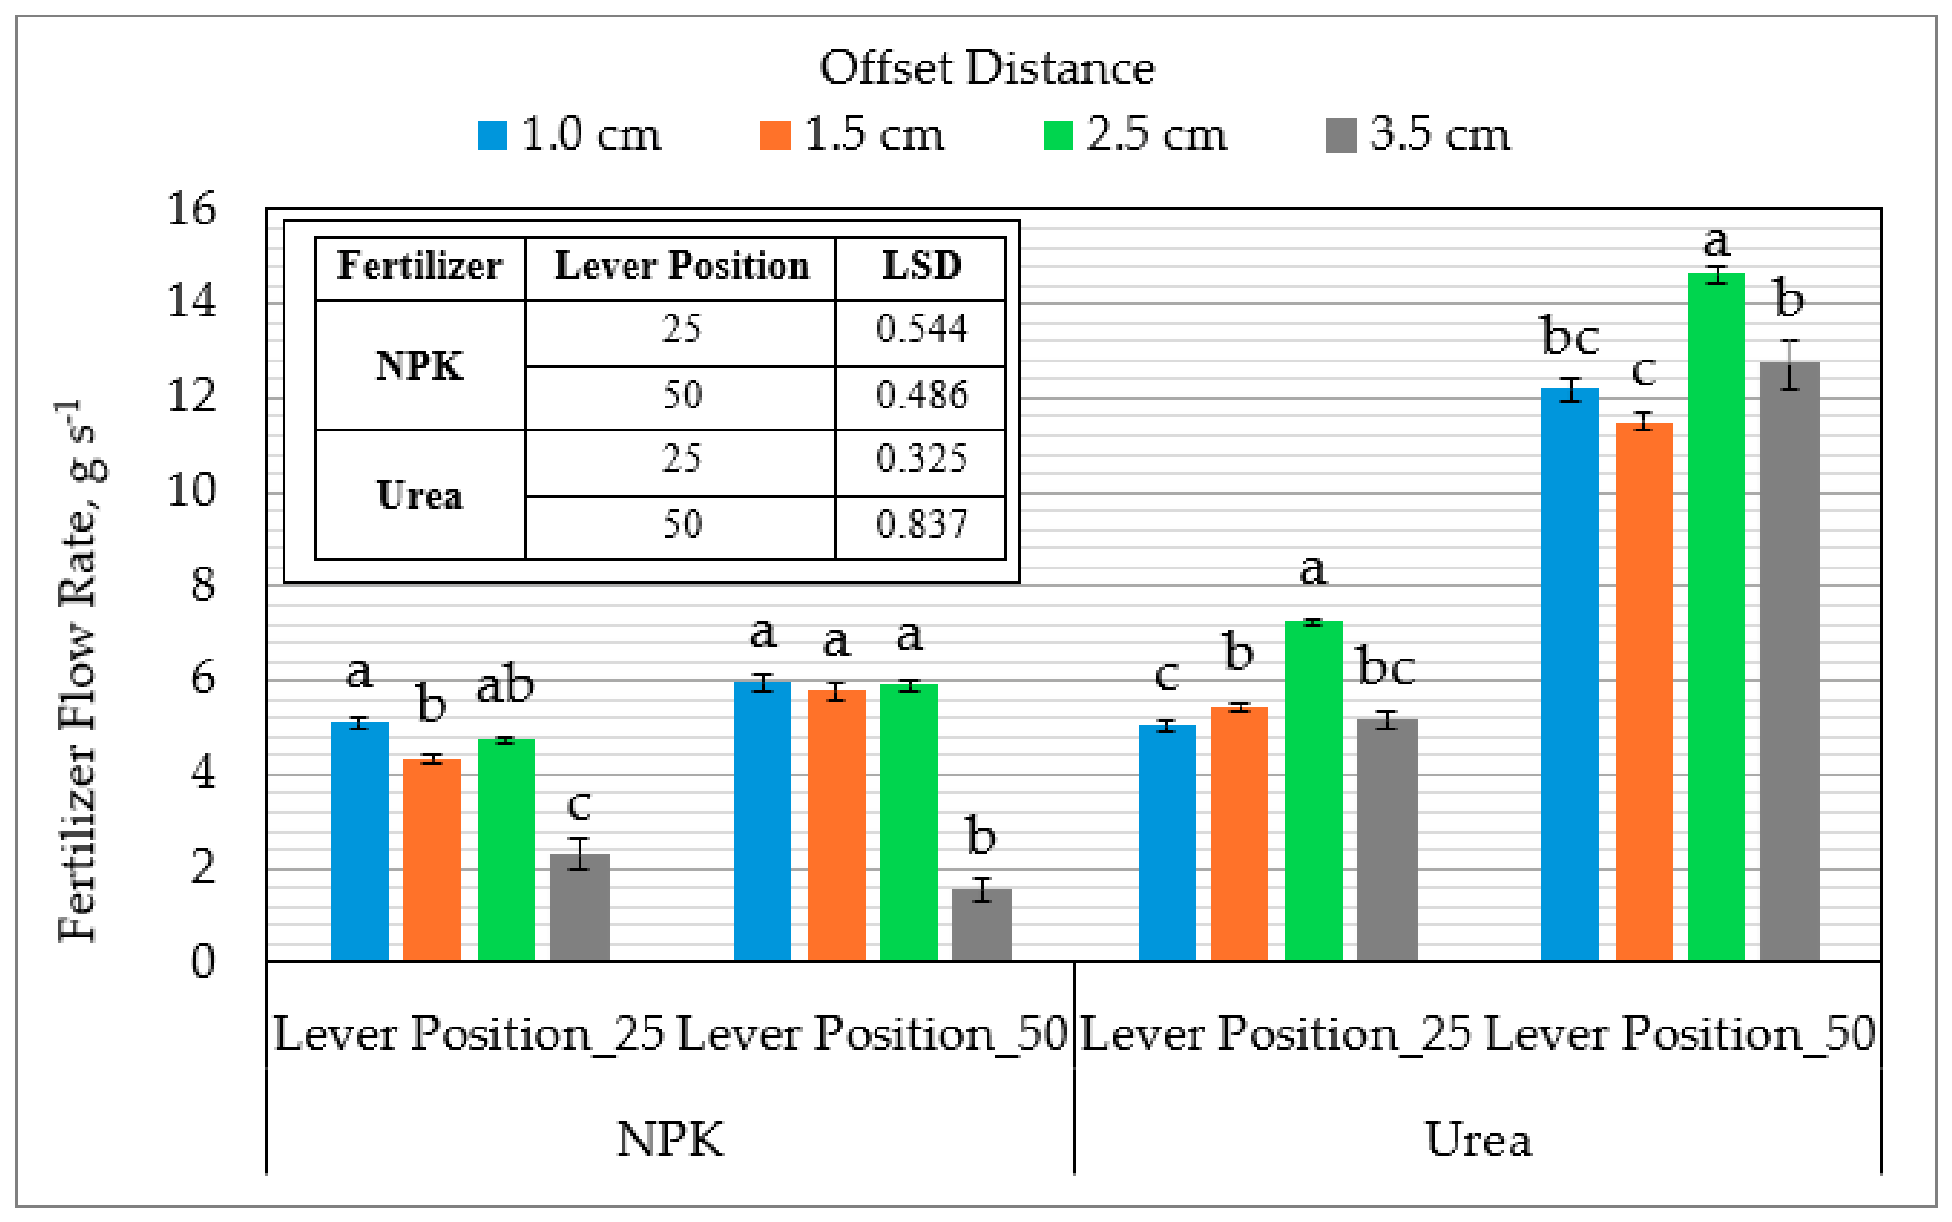
Analysis of variance (ANOVA) was conducted to evaluate the impact of offset distance on the fertilizer flow rate at different positions of the fertilizer flow control lever for two types of fertilizers: NPK and urea. The results are summarized in
Figure 8, which presents the mean flow rates (g s
−1) across four offset distances (1.0, 1.5, 2.5, and 3.5 cm) and two lever positions (25 and 50), with statistical groups indicated by letter annotations and Least Significant Difference (LSD) values provided for each treatment combination.
For the NPK fertilizer, the flow rate response varied according to both lever position and offset distance, with statistically significant differences observed among several treatment combinations. At lever position 25, the flow rates ranged from approximately 1.5 to 2.5 g s−1, with an LSD of 0.544. Treatments with different offset distances were statistically distinguishable (p < 0.0001), as indicated by distinct groupings (a, ab, b, and c). On the other hand, lever position 50 further amplified the flow rates with significant differences between offset distances (p < 0.0001), reaching values above 3.0 g s−1, with an LSD of 0.486. The statistical groupings (a, ab, bc, and c) suggest a clear gradient in flow rate response to increasing offset distance, with minimal overlap between treatments. The urea fertilizer, however, exhibited lower overall flow rates compared to NPK, where at lever position 25, the flow rates varied between 0.8 and 1.5 g s−1, with an LSD of 0.325. The statistical groupings (a, ab, b, and c) indicate statistically significant differences among offset distances (p < 0.001), with the smallest LSD value reflecting high sensitivity to treatment effects. In contrast, lever position 50 increased the flow rates to a range of approximately 1.5 to 2.5 g s−1, with significant differences between offset distances (p = 0.0037). Although the LSD was higher (0.837), indicating greater variability or reduced precision, groupings (a, ab, bc, and c) again showed a progressive increase in the flow rate with offset distance, with more overlap than observed for NPK. Overall, the results indicate a strong interaction between the fertilizer type and offset distance, affecting the flow rate stability. Urea exhibited superior consistency and higher flow rate, particularly at an offset distance of 2.5 cm, while NPK performance deteriorated sharply at greater offsets. These results highlight the importance of selecting appropriate offset settings tailored to fertilizer type to ensure uniform application. For both fertilizers, 2.5 cm appears to be the optimum offset distance for consistent flow rates, although the NPK fertilizer may require smaller offsets for higher delivery rates.
3.2. Laboratory Results
To experimentally validate the DEM-guided sensor configuration and assess the practical performance of the developed sensing system, laboratory calibration and performance evaluation experiments were conducted under controlled testing conditions using different fertilizer discharge settings and forward speeds.
3.2.1. Performance Evaluation of the Developed Sensing System
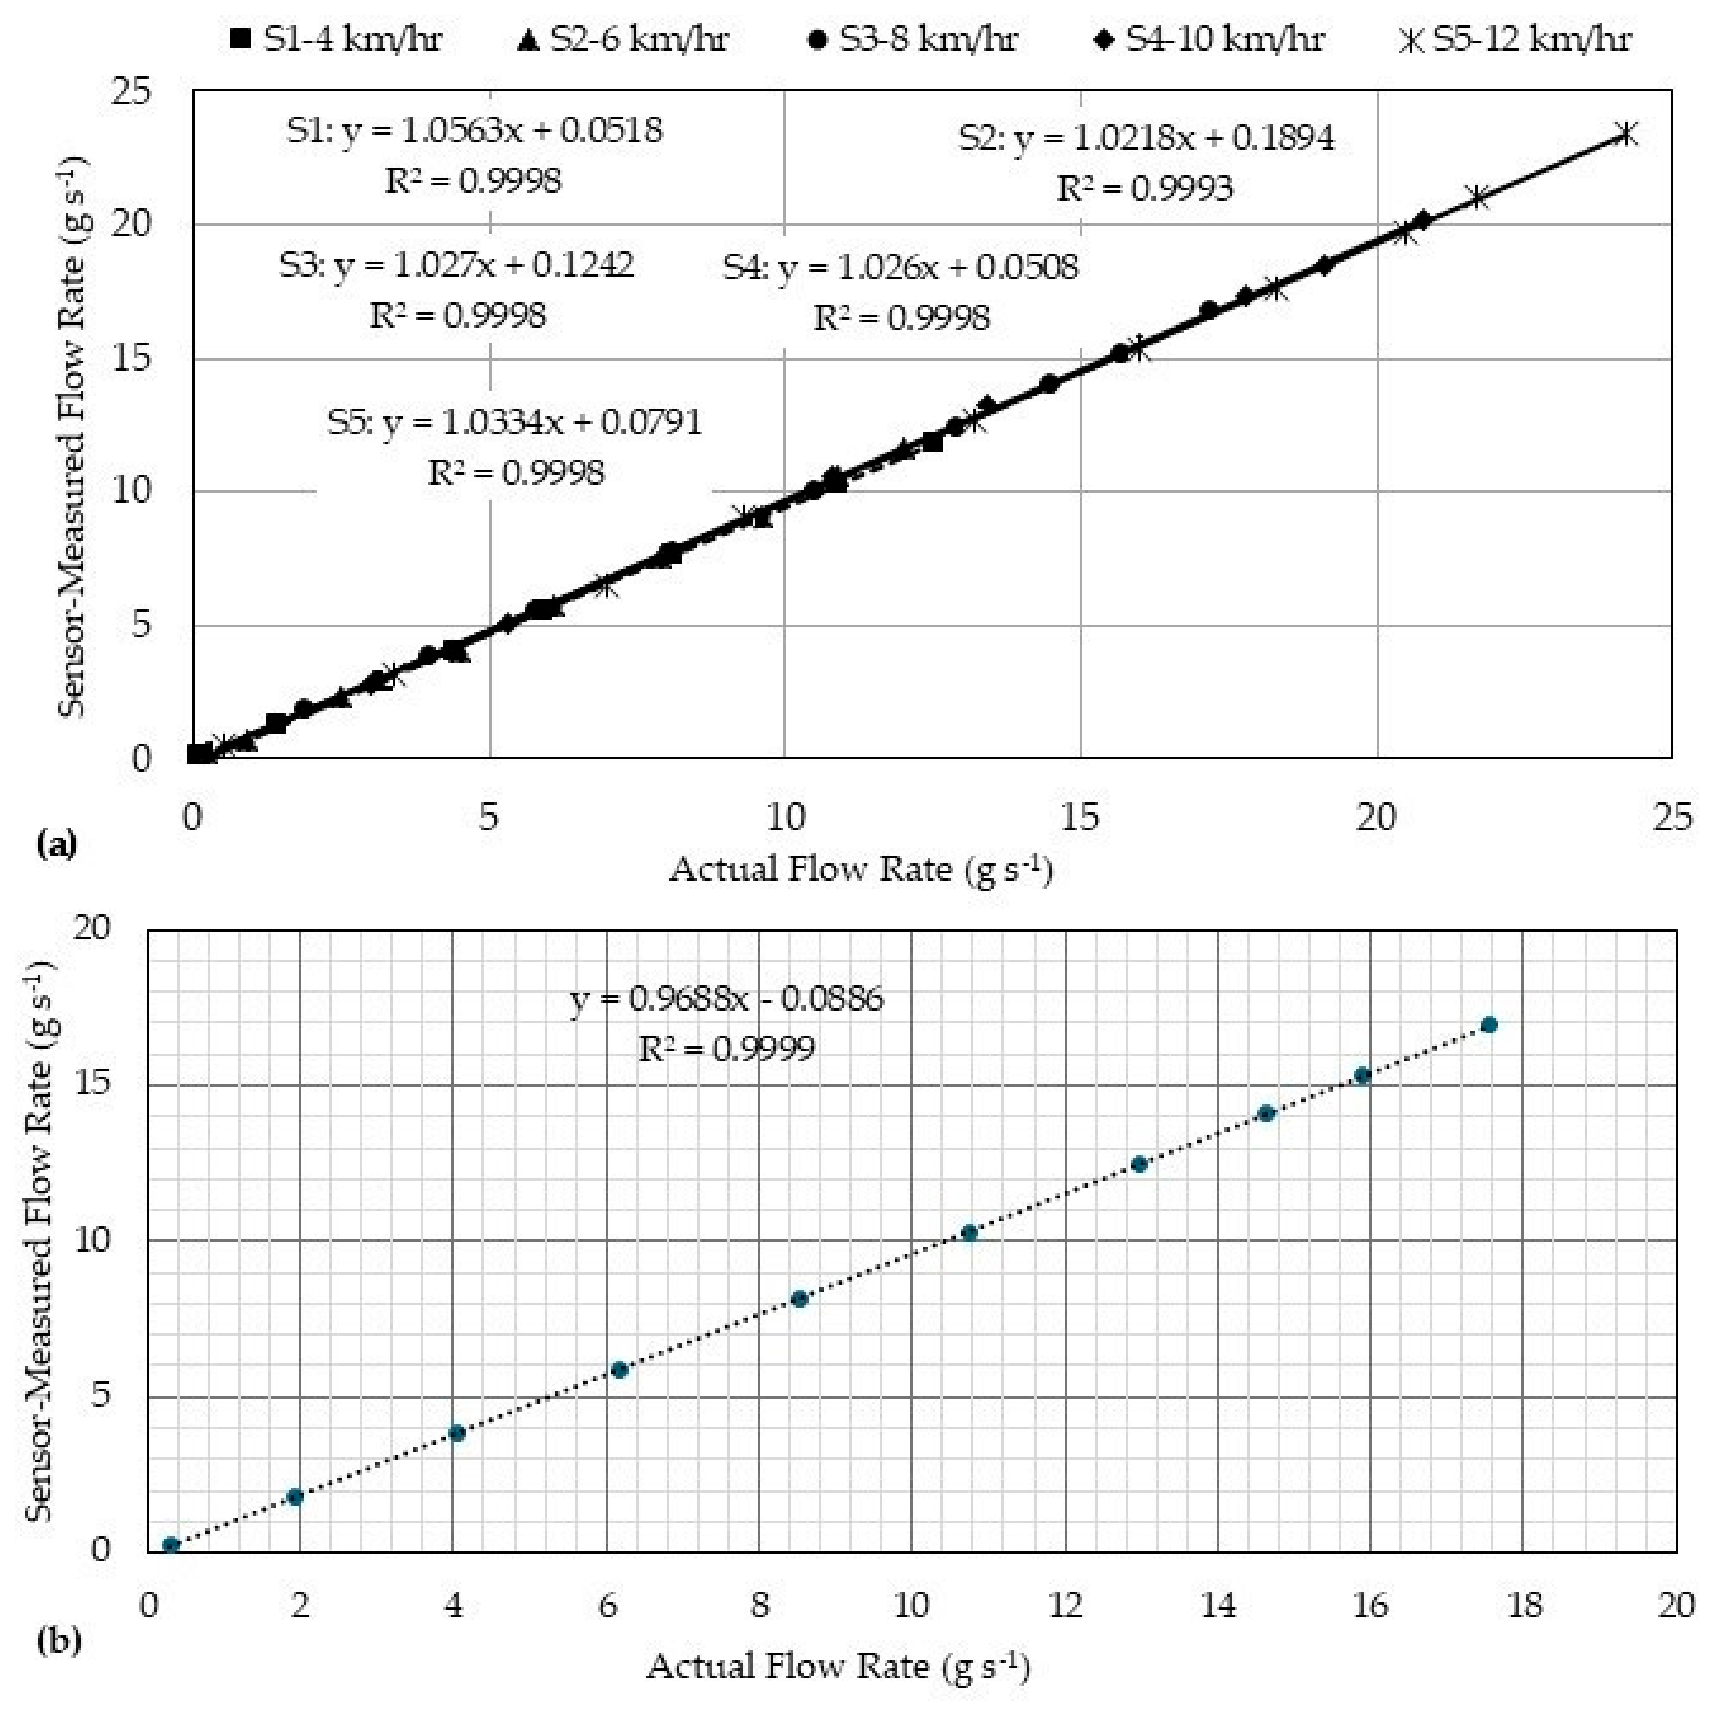
The developed fertilizer flow rate measuring sensor was assessed using both the optimum and the average calibration models. The optimum model provided highly reliable calibration results for the developed sensor, as indicated by the regression plots for all speeds (
Figure 9a) that demonstrated very strong linearity between the sensor-measured and the actual fertilizer flow rates, with R
2 values ranging from 0.9993 to 0.9998. Furthermore, the aggregated results for all test speeds (
Figure 9b) produced an R
2 value of 0.9999, which strengthened the results, proving the accuracy and consistency of the model.
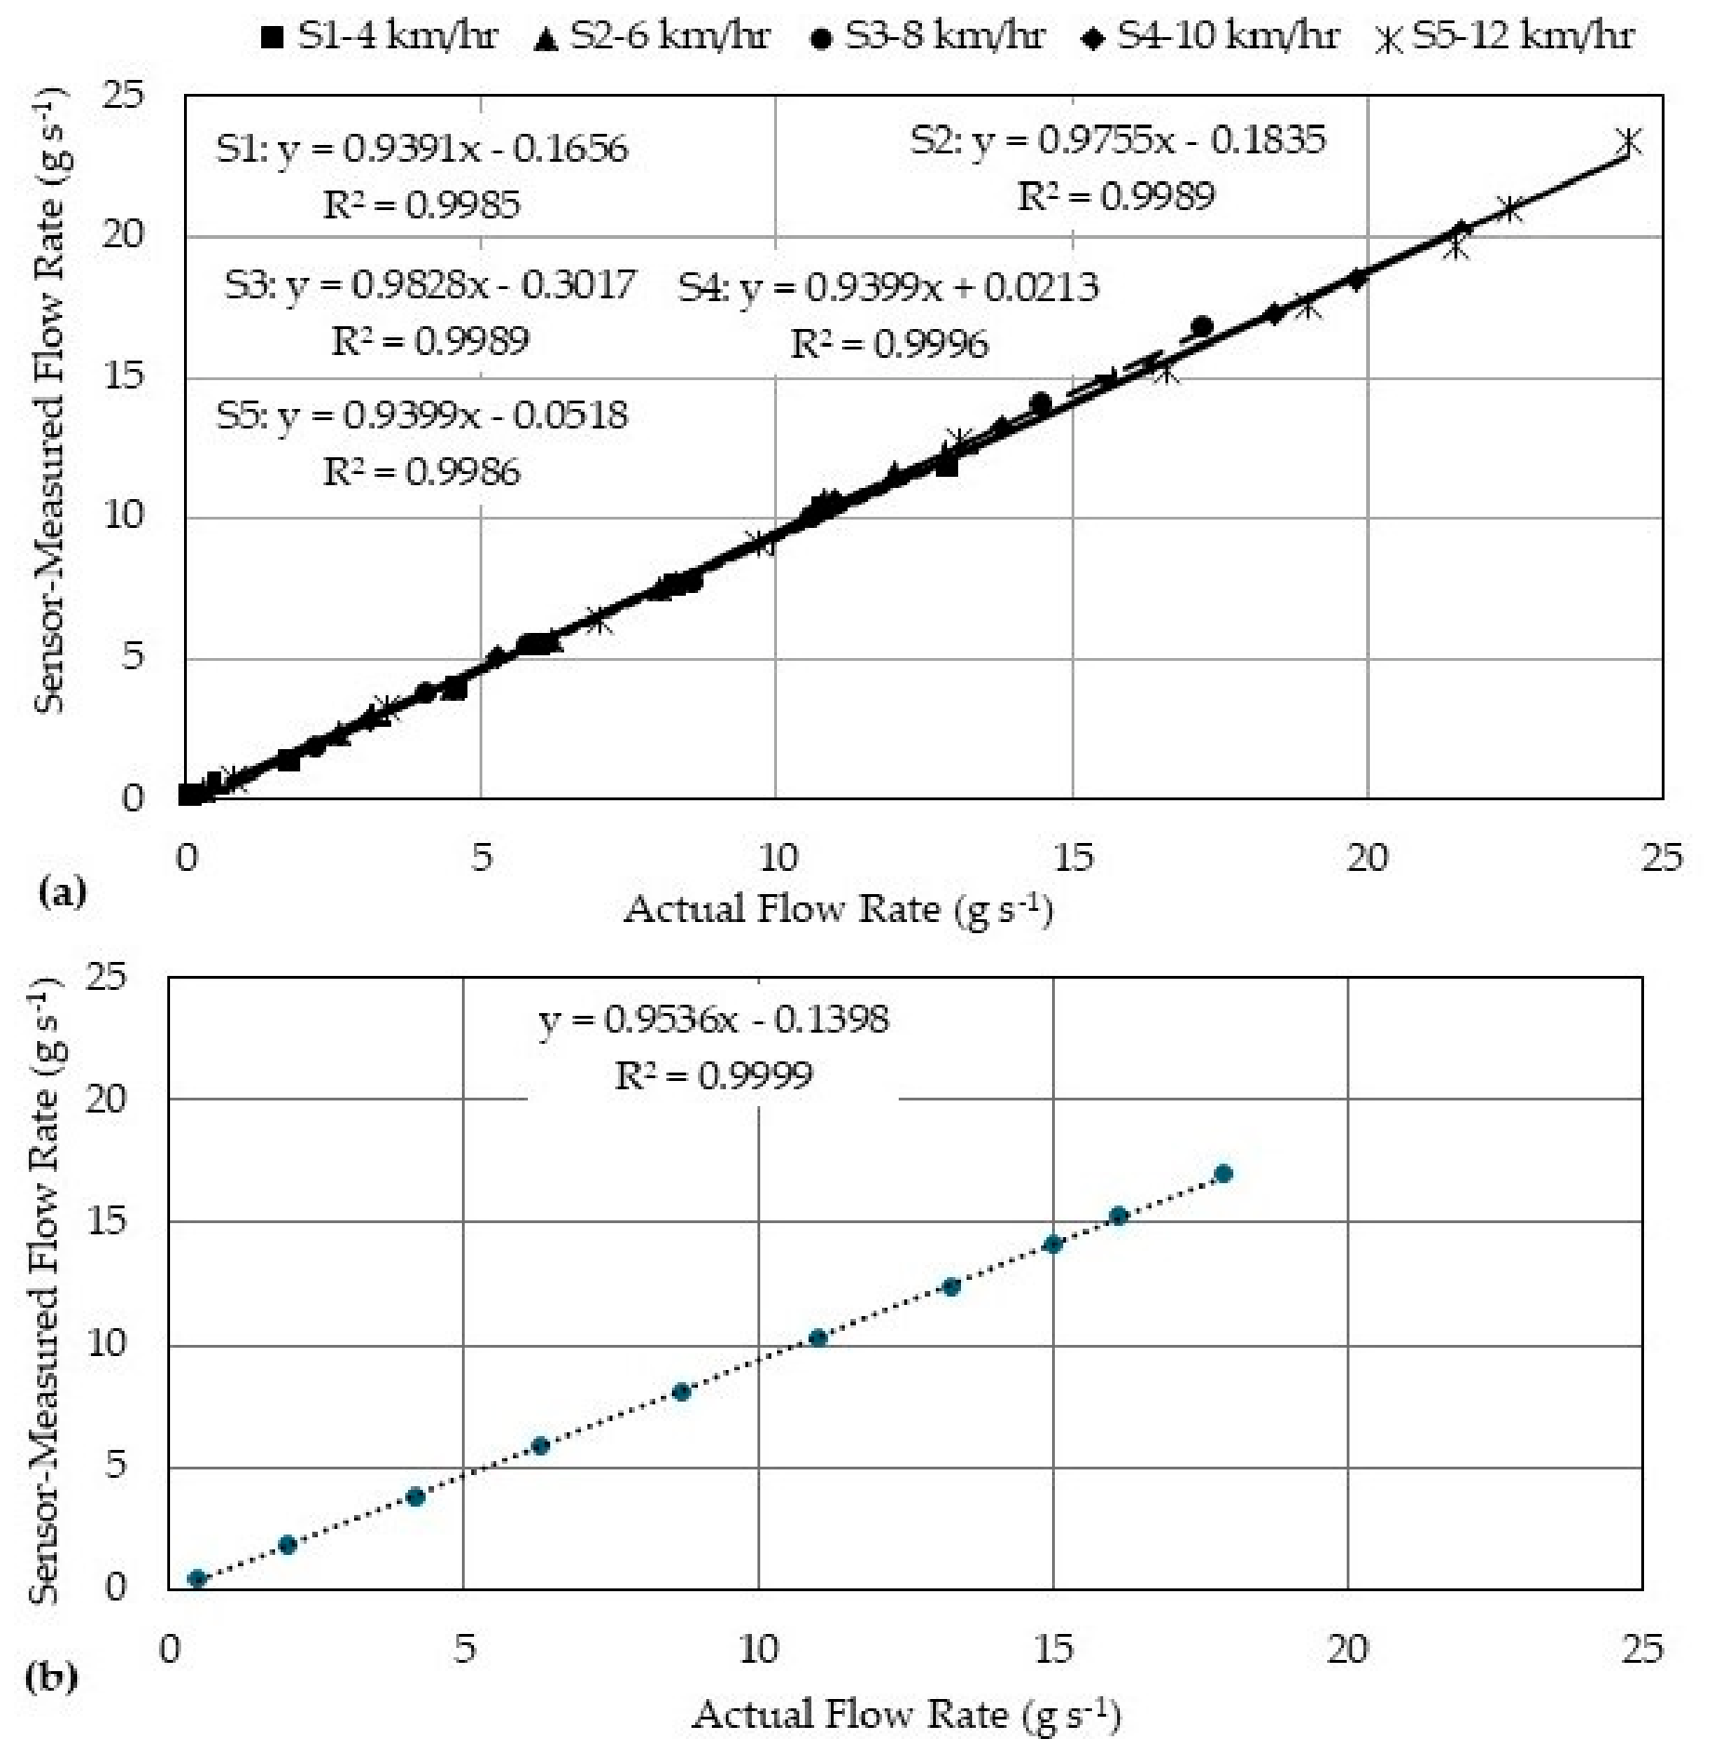
The average model represents a generalized calibration based on the combined results of all lever positions and ground speeds. However, the regression plots (
Figure 10a) also showed a high degree of linearity between the sensor-measured and actual fertilizer flow rate under all speeds, with R
2 values ranged between 0.9985 and 0.9996. The aggregated results (
Figure 10b) also showed an R
2 value of 0.9999, indicating stability of the sensor performance. The reported calibration equations represent empirical relationships between the sensor output and the actual fertilizer flow rate rather than direct physical equivalence. The numerical values of the regression coefficients were influenced by the combined effects of load cell sensitivity, HX711 amplification gain, analog-to-digital conversion scaling, and signal-conditioning procedures implemented within the Arduino-based acquisition system. During the calibration process, the Arduino-based acquisition system initially converted the amplified sensor signal into mass values expressed in grams. These mass readings were subsequently transformed into fertilizer flow rate values (g s
−1) by dividing the measured fertilizer mass by the corresponding discharge time interval, thereby enabling practical real-time flow rate estimation and improving model reproducibility. This model is more flexible and may be more practical for real-time applications under field conditions, where ground speed and/or operating conditions are expected to change frequently.
3.2.2. Performance Validation of the Developed Granular Fertilizer Flow Rate Sensor
To assess the performance of the developed fertilizer flow rate sensing system, a 5 × 4 factorial experiment (five positions of the fertilizer flow rate adjusting lever and four forward speeds of the experimental seed drill) was analyzed separately for three datasets, namely the actual, sensor-measured, and simulated fertilizer flow rates. ANOVA results (
Table 4) indicated that the lever position, forward speed, and their interaction (lever position × forward speed) significantly affected the flow rate in all three datasets (
p < 0.0001).
Across the main effects, lever position produced a strictly ordered and statistically distinct increase in flow rate in all datasets (all five means different), consistent with the expected rise in flow rate output as the feed-shaft rotational speed increased. Forward speed also produced four statistically distinct mean levels for both actual and measured flow rate, demonstrating that the developed sensor preserved sensitivity to operational changes in machine travel speed. In contrast, simulation outputs separated the lowest forward speed (6 km h−1) from the remaining speeds, while the means at 8, 10 and 12 km h−1 were not significantly different, suggesting reduced sensitivity of the simulation model to forward speed relative to the experimental datasets.
3.3. Accuracy Assessment of the Developed Sensing System
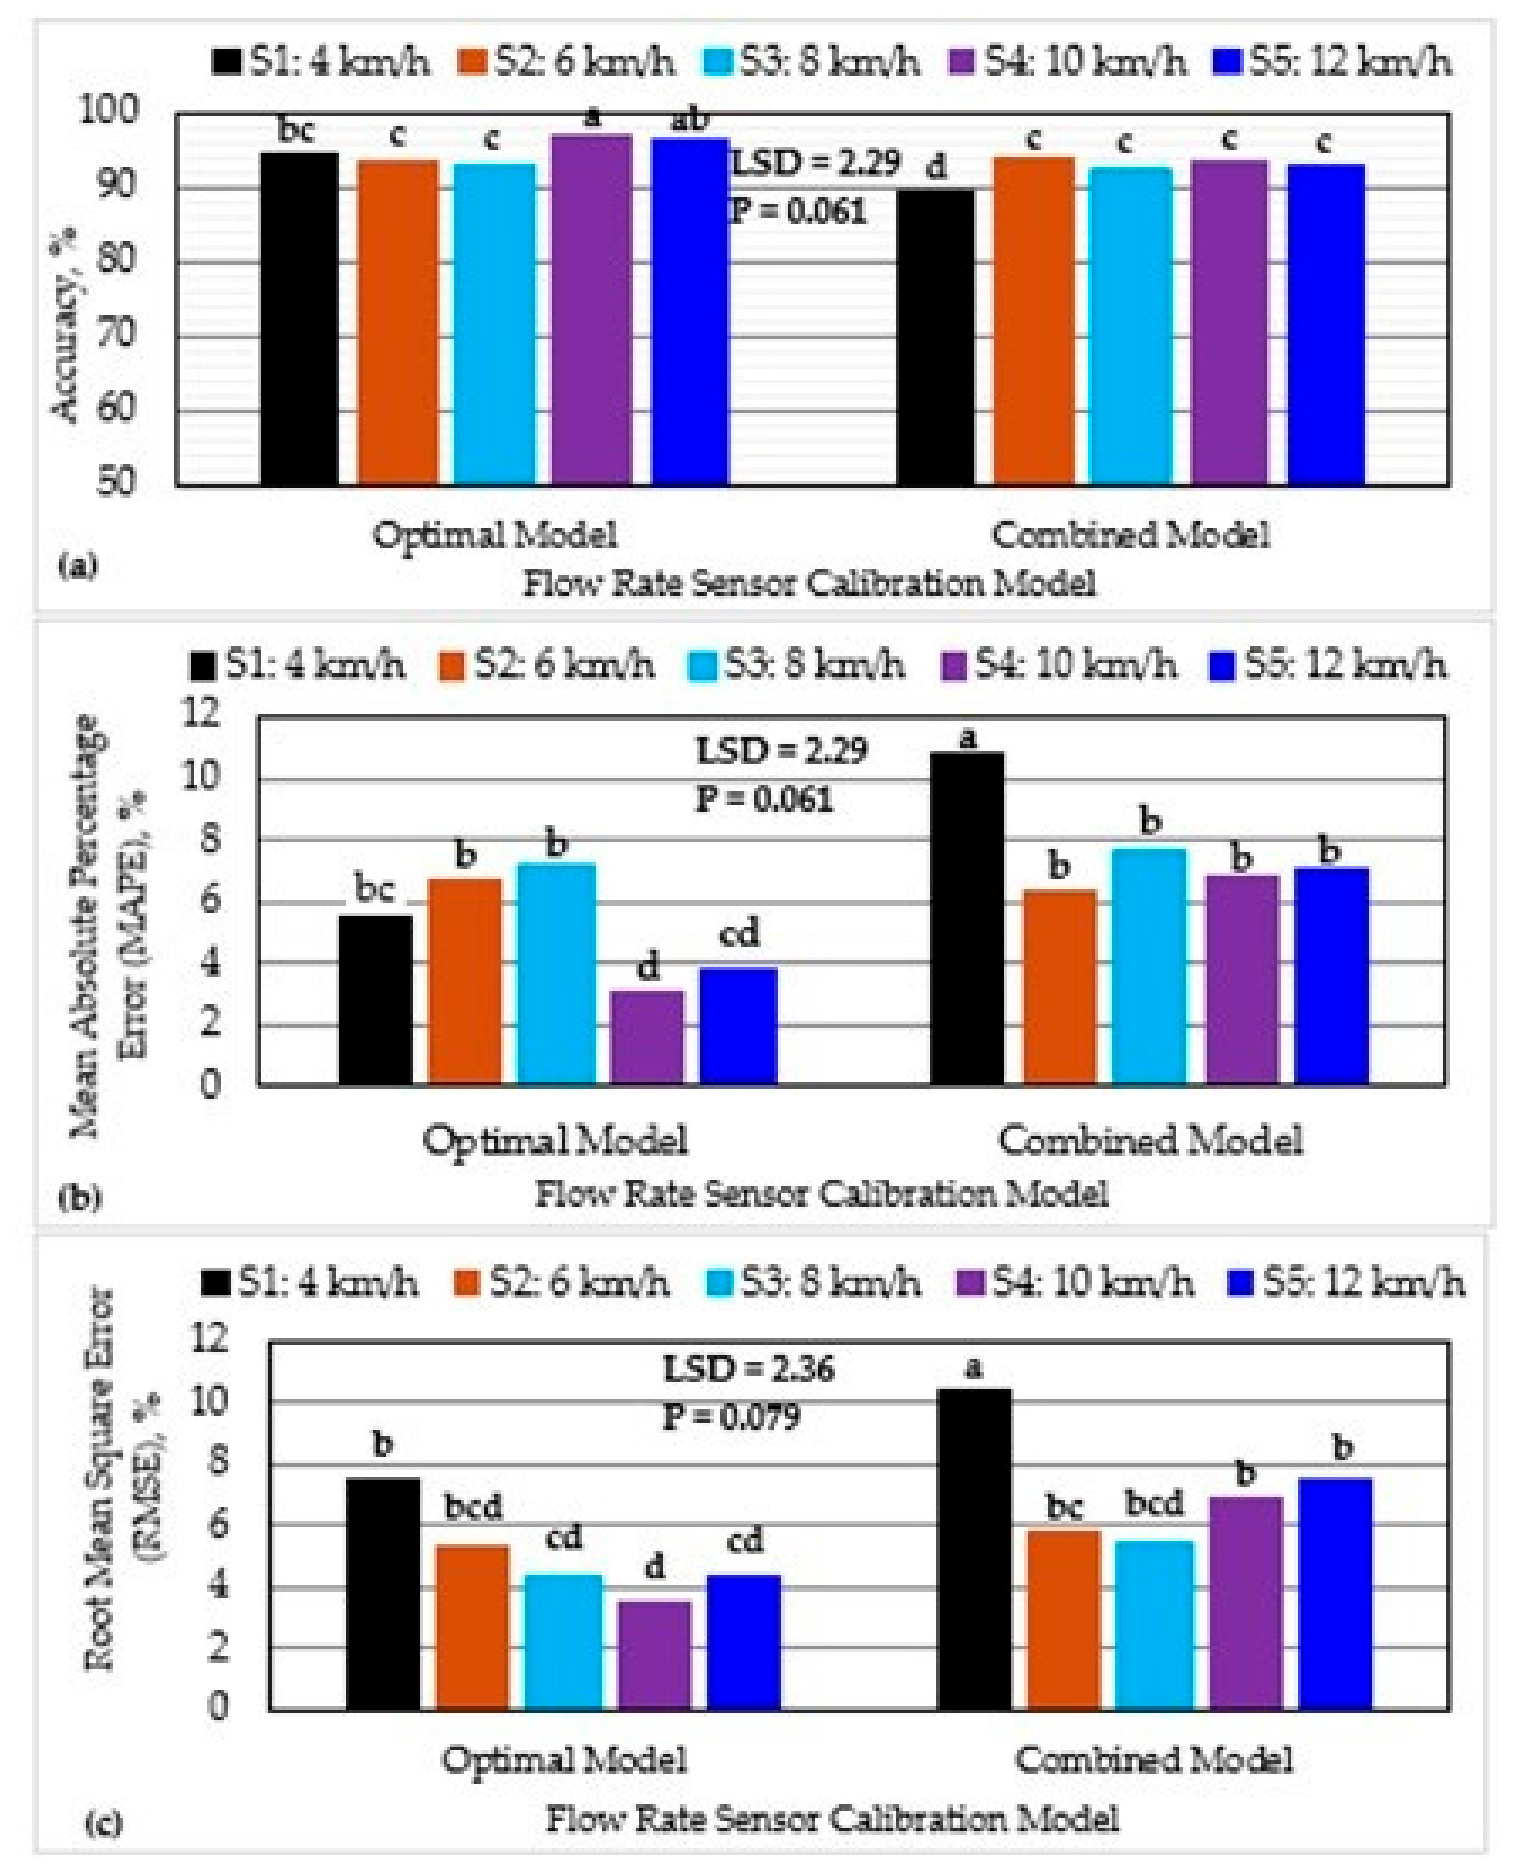
The calibration results of the developed system, using both the optimum and the average models, were subjected to accuracy assessment based on the overall accuracy percentage, the MAPE and the RMSE. The calibration results demonstrated a very strong linear relationship between the sensor output and the actual fertilizer flow rate, as reflected by the high coefficients of determination (R
2). However, the measurement accuracy of the developed sensing system was independently evaluated using MAPE, RMSE, and overall relative error indicators. The results presented in
Figure 11 indicate that the developed sensor achieved relatively low prediction errors under all tested operating conditions, with the optimum calibration model providing lower MAPE and RMSE values compared with the average calibration model.
Although both calibration models exhibited similarly high correlation coefficients, the optimum model demonstrated superior predictive accuracy, indicating that a high R2 value alone does not necessarily imply minimum measurement error. Overall, the developed sensing system showed stable and reliable fertilizer flow rate measurement performance across different operating speeds and fertilizer discharge conditions.
4. Discussion
The DEM-based simulation results demonstrated that the geometric configuration of the sensing system plays a critical role in stabilizing fertilizer particle trajectories and improving impact consistency on the sensing plate. The observed influence of offset distance can be explained by the balance between particle concentration and dispersion during free-fall motion. At shorter offset distances, fertilizer particles have limited travel distance before impact, which may lead to irregular impact distribution and unstable force transfer. Conversely, excessive offset distances increase particle dispersion and reduce impact concentration, thereby decreasing signal stability and measurement consistency. This behavior can be attributed to the dynamic interaction between particle momentum, impact distribution uniformity, and force-transfer stability on the sensing plate, which collectively govern the quality and consistency of the measured sensor signal.
The intermediate offset distance (2.5 cm) provided more uniform particle-impact behavior and smoother fertilizer discharge compared with the other tested configurations. Similar observations have been reported in previous DEM-based granular flow studies, where optimized discharge geometry contributed to improved flow regularity and more consistent particle-impact behavior [
22,
23,
24,
25,
26]. These findings confirm the importance of geometric optimization in impact-based sensing systems and support the applicability of DEM simulation as an effective engineering design tool for fertilizer flow monitoring systems.
Although the DEM simulation provided useful support for geometric optimization and relative comparison of offset-distance configurations, the present validation primarily focused on discharge continuity, impact stability, and overall flow behavior rather than detailed particle-scale dynamics such as particle trajectory tracking, contact-frequency analysis, or impact-force temporal validation. Therefore, the DEM framework should be interpreted primarily as a design-support and optimization tool under controlled laboratory operating conditions.
To validate the simulation predictions experimentally, the performance of the developed sensor was evaluated under laboratory conditions using a 5 × 4 factorial design, with the position of the fertilizer adjusting lever (five positions) and machine forward speed (four speeds) as the main factors. The laboratory validation experiments confirmed that the developed sensing system remained responsive to variations in fertilizer discharge settings and machine operating speed. The observed response behavior indicated stable sensor sensitivity under different operating conditions. The observed response behavior reflects the ability of the impact-based sensing mechanism to maintain consistent force detection despite changes in fertilizer discharge intensity and metering-shaft rotational speed. Similar response trends have been reported in previous studies on granular fertilizer metering systems, where variations in feed-shaft rotational speed directly influenced particle discharge behavior and flow rate stability [
27,
28]. In contrast, simulation outputs showed reduced discrimination between higher forward speeds, with only the lowest speed (6 km h
−1) being distinguished from the others. In general, the measured dataset closely followed the trends observed in the actual flow rate, while the simulated dataset exhibited higher dispersion, as reflected in the larger coefficient of variation (CV = 10.25%), consistent with reported DEM-based fertilizer flow studies [
23].
The results of this study showed that the developed impact-based sensor is capable of accurately measuring the flow rate of granular fertilizers in seed drills. The performance evaluation results demonstrated that the developed sensing system achieved both strong correlation with the experimentally measured fertilizer flow rates and relatively low prediction errors under laboratory conditions. While the high coefficients of determination indicate excellent linear consistency between measured and actual flow rate trends, the MAPE and RMSE values provide a more direct assessment of the predictive accuracy and practical measurement performance of the developed sensor.
These results are consistent with several previous studies that used different sensing techniques to measure the flow of granular fertilizers in crop planting machines. For example, Swisher et al. [
7] developed an optical sensor for measuring seed and fertilizer flow rates. They noted a clear linear relationship between the sensor output and the actual mass flow rate. However, their system was highly sensitive to variations in size and shape of fertilizer granules, requiring individual calibration for each fertilizer type. In contrast, the sensor developed in this study was designed to reduce the impact of particle density, size and volume on the accuracy of fertilizer flow rate measurement, indicating greater adaptability to different fertilizer types. Han et al. [
29] applied a microwave Doppler-based approach to measure the fertilizer discharge rate in planting machines and achieved a non-linear error of 5.43%, which is comparable to the accuracy obtained in this study. Another study by Haitao et al. [
30] revealed a mean relative error of 2.62% and an R
2 value of 0.998 when using a weighing sensing system with advanced filtering and processing techniques. These results demonstrate that advanced signal-processing procedures can improve sensing accuracy; however, the simplified impact-based design employed in the present study provided competitive measurement performance with reduced system complexity. In addition, Al-Mallahi and Kataoka [
31] used a fiber-optic sensor with multiple linear regression modeling to estimate seed mass flow, achieving an overall error of 5.3%. Their optical system performed well; however, it required regression-based calibration and was affected by flow rate variations. In comparison, the impact-based design in this study achieved a similar accuracy with a simpler structure and less sensitivity to fertilizer rate variations, thus enhancing its suitability for monitoring fertilizer applications. Nevertheless, the present evaluation was conducted under controlled laboratory conditions, and additional investigations under realistic field environments involving vibration, machine tilting, and variable soil conditions are still required to fully assess the operational robustness of the developed sensing system. Under practical field operating conditions, external disturbances such as machine vibration, transient shocks, and machine tilting may introduce additional fluctuations in the load cell response and affect the stability of the measured impact force signal. Therefore, future vibration-controlled and field-validation experiments are recommended to further evaluate the robustness and operational reliability of the developed sensing system under realistic agricultural environments.
Jiang et al. [
32] reported similar results, developing an infrared-based granular flow rate measuring sensor and achieved an accuracy of over 93% and R
2 values as high as 0.9999. Similarly, Karimi et al. [
33] conducted a comparative evaluation of non-contact optical sensors, including light-dependent resistors (LDRs), infrared (IR), and laser diodes (LDs), and found that the IR-based sensor exhibited the strongest linear correlation with seed mass flow (R
2 value of 0.87). Despite some challenges, such as seed interference and partial detection at high flow rates, their results highlighted the suitability of infrared sensing for continuous monitoring. In addition, Tola et al. [
34] developed a sensor for measuring the real-time flow rate of granular fertilizer in a planter, integrated into a fertilizer rate control system using an incremental encoder, with an error of ±5%. Ranjbari et al. [
35] also presented a piezoelectric sensor that achieved strong correlations (R
2 values greater than 0.93) under both static and dynamic vibration conditions. Collectively, these studies confirm the feasibility of accurate and real-time monitoring of granular fertilizer flow rates using various sensing techniques, despite the limitations associated with DEM parameter uncertainty and controlled experimental conditions. Although several fertilizer flow sensing technologies have been previously reported in the literature, the contribution of the present study extends beyond the use of a simple load cell sensing principle. The proposed system combines DEM-guided structural optimization with a simple impact-based sensing architecture specifically designed for mechanical seed drill applications.
From a practical implementation perspective, the proposed sensing system also offers several operational advantages for agricultural applications. The simplified structural configuration and limited number of electronic components may reduce maintenance complexity and facilitate system integration within conventional mechanical seed drills. In addition, the impact-based sensing principle is expected to be less sensitive to dust accumulation and optical obstruction compared with optical sensing systems commonly used in granular flow monitoring. Nevertheless, long-term durability evaluation and field-scale assessment under continuous agricultural operation are still required to further investigate sensor robustness, wear resistance, and maintenance requirements under practical field conditions. In addition, prolonged exposure to continuous fertilizer particle impacts may contribute to mechanical fatigue, calibration drift, and sensitivity variation in the sensing components over time. Therefore, future long-duration operational studies are recommended to evaluate the long-term durability and calibration stability of the developed sensing system. Overall, the obtained results demonstrate that the developed DEM-guided impact-based sensing system can provide a simple and reliable approach for granular fertilizer flow rate monitoring in precision agriculture applications.