


Abstract
The complex environment in metal mines introduces substantial noise into microseismic signals, which reduces the accuracy of arrival time picking and affects source localization. When the Cumulative Sum (CUSUM) method is directly applied, it often leads to inaccurate arrival time picking with low precision and high false alarm rates. To address these limitations, this paper proposes a novel arrival time picking method (V-CUSUM) that combines Variational Mode Decomposition (VMD) with the CUSUM algorithm. The microseismic signal is first decomposed into band-limited intrinsic mode functions (IMFs) using VMD with fractal box dimension-optimized parameters (K = 5; α = 2000). Effective IMFs are selected based on the Pearson correlation coefficient (threshold: |r| > 0.5), and the CUSUM method is independently applied to each selected component for arrival time detection. The final arrival time is determined by averaging the individual picking results. Simulation experiments demonstrate that the proposed method achieves a root mean square error (RMSE) of 0.0024 s and a mean absolute error (MAE) of 0.0018 s, substantially outperforming the Short-Term Average/Long-Term Average Method (STA/LTA) (RMSE = 0.0347 s) and Akaike information criterion, AIC (RMSE = 0.061 s), methods. Validation with field microseismic data from a metal mine shows that V-CUSUM achieves an average picking accuracy of 99.86% with a standard deviation of 0.007 s, compared with 97.85% for STA/LTA and 99.58% for AIC. These results confirm that the V-CUSUM method provides a robust, accurate, and physically interpretable framework for microseismic arrival time picking under complex noise conditions.
1. Introduction
The microseismic monitoring technique is a real-time and continuous monitoring method, which is used to study and evaluate the stability of rock masses. With the deepening of mining, potential hazards such as collapse, mudslides, rock bursts, and ground subsidence may lead to accidents. Therefore, the application of microseismic monitoring technology to mine disaster monitoring has important practical significance.
The premise of locating the microseismic source is to pick the arrival time of the P-wave precisely, which is one of the important steps of microseismic monitoring. The STA/LTA algorithm, AIC (Akaike information criterion) algorithm, polarization analysis [1], higher-order statistics method [2], neural network method [3], and Kalman method are current widely used arrival time pickup algorithms [4]. The STA/LTA algorithm has the characteristics of intuitive and fast pickup, which meets the demands of real-time monitoring. The characteristic function is the key part of the STA/LTA algorithm, which depends on whether the algorithm picks the arrival time accurately. Therefore, selecting the appropriate feature function is our focus.
Usually, researchers preprocess the original microseismic signal first, and then apply the arrival time pickup algorithm to the processed signal. In this case, the accuracy will be relatively higher than that when directly picking up the original signals. An example of this is the work done by Wang et al. They combined the wavelet transform with the STA/LTA algorithm. They preprocessed the microseismic signals by using the wavelet transform to create a characteristic function, which can reflect the features of seismic phase frequency. Then, they used this characteristic function with the STA/LTA algorithm, which increased the precision [5]. Li et al. proposed a novel joint algorithm of EEMD_Hankel_SVD and the AIC algorithm. They denoised the components decomposed by EEMD with Hankel_SVD, then picked by the AIC algorithm and received a satisfying performance [6]. Wang Yiying et al. combined the STA/LTA algorithm with the MloG operator. They separated the seismic signals which contain the seismic components and background noise from the original seismic signals, then picked the processed signals by the STA/LTA algorithm [7]. Compared with picking the arrival time of the original signals, the above methods receive better results.
EMD solves the problem of the wavelet transform, which is extremely reliant on the wavelet basis function. This makes it become a widely used signal decomposition method [8]. However, the components decomposed by EMD will result in a modal confusion problem. To overcome this shortcoming, the Ensemble Empirical Mode Decomposition (EEMD) proposed by Huang and Wu adds white Gaussian noise to the original signals. Then the adding-noise signals are decomposed and the results averaged to obtain the IMF series [9]. Although EEMD solves the modal confusion problem in some respects, the reconstructed signal still contains the residual noise. Therefore, Torres et al. proposed the Complete Ensemble Empirical Mode Decomposition with Adaptive Noise (CEEMDAN), which added the step of extracting noise from IMF components decomposed through EMD. CEEMDAN also calculates the overall average when decomposing the first stage of IMF, unlike EEMD, after decomposing all of the IMF components [10]. However, CEEMDAN still has problems like the residual noise and the modal confusion. All these problems will influence the reconstruction of the preprocessing signal. Therefore, ICEEMDAN was proposed to better solve the problems of the residual noise and the modal confusion. In addition, it can decompose the original signal more thoroughly than the previous methods.
Since Variational Mode Decomposition (VMD) is based on frequency-domain optimization rather than interpolation of local extrema, it can effectively avoid the endpoint effect and ensure accurate decomposition of modes across the entire signal range. Li et al. applied VMD, empirical mode decomposition (EMD), and their derivative methods to the field of seismic denoising, and the results demonstrated that VMD exhibits lower noise sensitivity and superior denoising performance [11]. Rehman N proposed Multivariate Variational Mode Decomposition (MVMD), which extends single-channel VMD to a multi-channel variational model and effectively overcomes the drawbacks of noise-sensitive mode mixing [12]. The SSA algorithm proposed by Zhao et al. quantitatively measures the mixing density between intrinsic mode functions (IMFs) in the frequency domain, significantly reducing mode mixing in vibration signals [13]. Zhang et al. developed a novel denoising method by combining VMD with permutation entropy, achieving effective noise reduction for mine microseismic signals [14]. Yang et al. decomposed signals using VMD and then applied Time–Frequency Peak Filtering (TFPF) to remove random noise from each component, effectively improving the signal-to-noise ratio (SNR) [15]. Taking advantage of VMD’s low computational complexity and high decomposition accuracy, Fang et al. combined VMD with the alternating direction method of multipliers (ADMM) algorithm to maximally preserve weak signal features, meeting the requirements for practical 2D and 3D seismic signal processing [16].
The recent seismic phase detection and arrival time picking innovations focus on algorithm modifications and deep learning techniques. Ibraimov et al. interpreted P-wave arrival as a structural phase transition rather than an energy burst using cascaded detection based on sliding-window SVD entropy and its derivative, achieving 93–98% accuracy at SNR ≥ 2 without any model training. In ref. [17], Zhou et al. integrated multi-feature clustering with an enhanced AIC-STA/LTA method for automated P-wave picking in microseismic monitoring, improving stability under complex noise by clustering valid signal segments before fine picking [18]. Jin et al. proposed a two-stage P-wave picking framework combining STA/LTA coarse detection with lightweight U-Net fine regression, achieving a 63.21% hit rate within a ±0.01 tolerance window and balancing computational efficiency with picking accuracy [19]. Zhou et al. applied mamba-ssm to seismic phase detection and P/S wave picking for the first time. Due to its linear computational complexity and strong capability for sequence modeling, the proposed network outperforms PhaseNet and EQTransformer [20].
This paper presents a VMD-based CUSUM method for microseismic arrival picking, which combines the advantages of VMD and CUSUM. First, VMD decomposes microseismic signals into different modes. Next, the correlation coefficient between each IMF and the original signal is calculated to select the effective mode components according to the average value. The CUSUM method is then applied to pick the arrival time of the selected mode component. The final arrival time is determined by calculating the mean value of the selected components. Finally, the proposed method is compared to manual, STA/LTA, AIC and CUSUM results using the theoretical data and field data.
2. Materials and Methods
2.1. Method of CUSUM
The Cumulative Sum (CUSUM) method is a sequential analysis technique used to detect abnormal points in a sequence, such as changes in the mean value of data. Given a microseismic signal record {xi}. of length N, the normalized CUSUM curve is defined as:
Assuming background noise and effective signals follow a normal distribution with a mean of 0, the likelihood ratio function between the hypotheses of signal presence and absence at point k is given by:
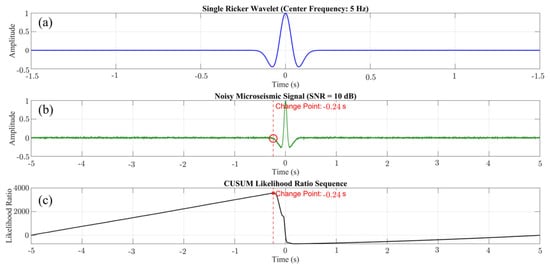
The arrival time corresponds to the peak of the normalized or likelihood ratio curve. Figure 1 shows a simulated Ricker wavelet. The wavelet has a dominant frequency of 50 Hz and a maximum amplitude of 1. The sampling frequency is 1000 Hz, and the sequence length is 1000. Gaussian white noise at 5 dB is added to the signal. The CUSUM curve shows a peak, marking the arrival time.
Figure 1.
CUSUM method schematic diagram; (a) Ricker wavelet; (b) noisy Ricker wavelet; (c) CUSUM picking results.
2.2. VMD Method
Variational Mode Decomposition (VMD) is an adaptive, non-recursive signal decomposition approach that extracts band-limited intrinsic mode functions (IMFs) from complex, non-stationary signals through frequency-domain variational optimization. Unlike empirical mode decomposition (EMD) and its variants, VMD formulates the decomposition as a constrained variational problem, which fundamentally mitigates mode mixing and enhances robustness against noise interference [21].
In the VMD framework, each IMF is defined as an amplitude-modulated–frequency-modulated (AM–FM) signal with a specific sparsity property in the frequency domain. The decomposition is accomplished by solving a variational optimization problem that jointly estimates all mode functions and their respective center frequencies. Specifically, VMD seeks to minimize the sum of the bandwidths of all modes while ensuring that their superposition faithfully reconstructs the original signal. This constrained variational formulation can be expressed mathematically as follows [22,23]:
where {u_k} = {u_1, …, u_K} denotes the set of all mode components, {ω_k} = {ω_1, …, ω_K} represents their corresponding center frequencies, f(t) is the original signal, δ(t) is the Dirac distribution, and K is the preset number of decomposition modes.
To render the constrained optimization problem tractable, a quadratic penalty term α and Lagrange multipliers λ are introduced, transforming Equations (3) and (4) into an unconstrained saddle-point problem. The augmented Lagrangian functional is given by Equation (5):
where L is the augmented Lagrangian functional, λ(t) is the Lagrange multiplier, and α is the quadratic penalty (bandwidth) parameter that controls the trade-off between data fidelity and mode compactness. The saddle-point of this augmented Lagrangian is obtained iteratively using the alternating direction method of multipliers (ADMM). is the convolution operator, is the partial derivative with respect to time, denotes the squared L2-norm, and represents the L2 inner product operator.
The quality of VMD is governed by two critical parameters: the number of modes K and the bandwidth penalty factor α. An insufficient K leads to under-decomposition, where distinct frequency components remain mixed within a single mode, amplifying residual noise. Conversely, an excessive K causes over-decomposition, fragmenting genuine signal components into spurious modes. Likewise, the penalty factor α controls mode bandwidth: a value set too low produces overly broad modes with overlapping spectra, while a value set too high excessively narrows each mode’s bandwidth, risking the loss of fine signal details in higher-order components. Consequently, appropriate tuning of both K and α is essential for reliable decomposition and has been the focus of considerable research attention [15].
The decomposition performance of Variational Mode Decomposition (VMD) is strongly influenced by two key parameters: the number of decomposition modes K and the penalty factor α. Appropriate parameter selection can effectively suppress mode mixing while preserving useful signal characteristics. In previous studies, permutation entropy has commonly been adopted as an indicator for evaluating signal complexity and determining the optimal VMD parameters [24]. However, permutation entropy mainly reflects the randomness and ordinal complexity of a signal, and its sensitivity to local waveform irregularities under strong microseismic noise conditions is limited.
In this study, the fractal box dimension (FBD) is introduced as an alternative indicator for evaluating the complexity of decomposed modal components. Compared with permutation entropy, the fractal box dimension can better characterize the geometric irregularity and self-similarity of microseismic signals under complex noise environments. Since useful microseismic waveforms usually exhibit stronger structural continuity and lower irregularity than random noise, the FBD can effectively distinguish informative modal components from noise-dominated components.
For a signal sequence , the fractal box dimension is calculated using the box-counting method:
where denotes the number of boxes with size ε required to cover the signal trajectory. Larger fractal dimensions indicate higher signal complexity and stronger randomness.
To determine the optimal VMD parameters, different combinations of and are tested. After decomposition, the fractal box dimension of each IMF component is calculated, and the average fractal box dimension is defined as:
where is the fractal box dimension of the i-th IMF component.
In this study, the optimal parameter combination is selected according to the following criteria:
- The decomposed IMFs should exhibit clear frequency separation without obvious mode mixing;
- The average fractal box dimension should remain relatively stable;
- The effective modal components should maintain high correlation coefficients with the original signal.
When is excessively small, different frequency components cannot be completely separated, leading to insufficient decomposition and relatively high fractal complexity in the IMFs. Conversely, when is excessively large, over-decomposition occurs and noise components are excessively amplified, causing the fractal box dimension to increase significantly. Similarly, a small results in weak bandwidth constraints and severe frequency overlap, whereas an excessively large suppresses useful signal details.
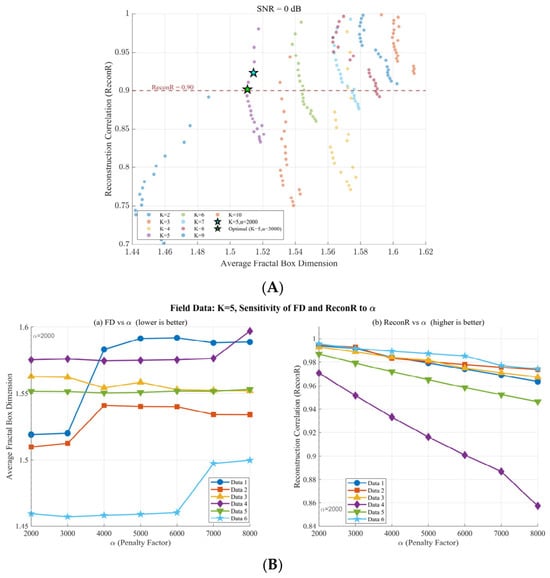
Different K values (ranging from 2 to 10) and α values (ranging from 2000 to 8000) were tested to evaluate how these parameters influenced IMF stability. Figure 2A illustrates the balance between reconstruction correlation and average fractal dimension under different K values, with α = 2000 for synthetic data at 0 dB SNR. The reconstruction correlation is defined by Equation (8), where denotes the original microseismic signal, represents the reconstructed signal, and stands for the k-th IMF component; K and N refer to the number of modes and sampling points, respectively. The results show that K = 5 achieves the best balance between reconstruction correlation and average fractal dimension. To validate the effectiveness of α, several field datasets were used to examine its performance (Figure 2B). The results indicate that when α is set to 2000, the signals generally exhibit lower average fractal dimension and higher reconstruction correlation.
Figure 2.
Optimization analysis of (A) VMD parameters based on fractal dimension and (B) ReconR.
By comprehensively analyzing the decomposition results under different parameter combinations, the parameter set of and was selected in this study. Under these parameters, the decomposed modal components exhibited relatively stable and lower fractal box dimensions, clear frequency separation, and high correlation with the original microseismic signal. Therefore, the selected parameters achieved a good balance between noise suppression and preservation of effective signal characteristics.
2.3. The Proposed Method
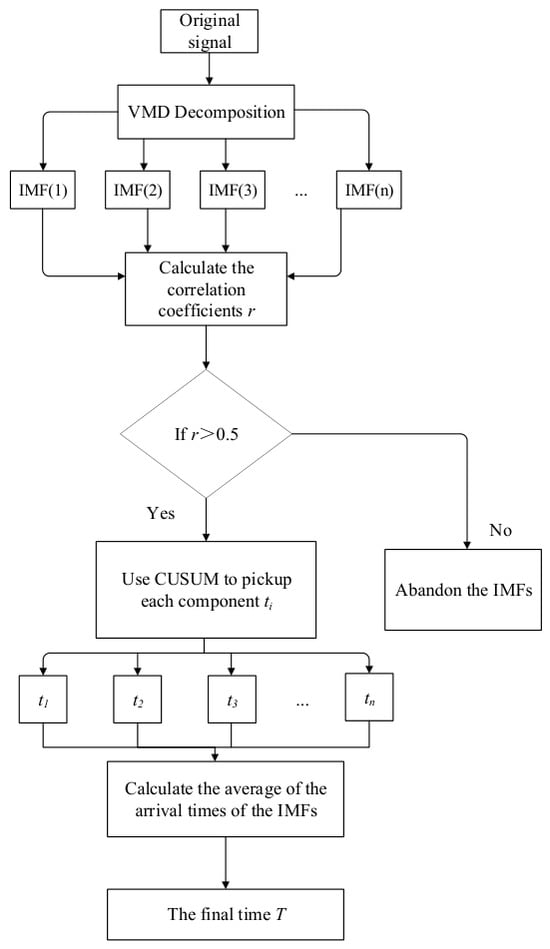
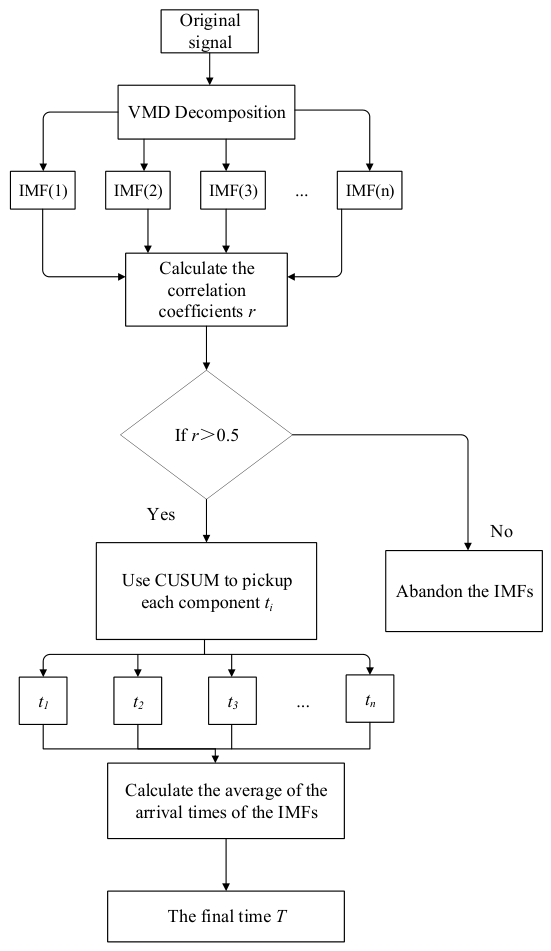
This study combines the advantages of VMD and CUSUM to propose a VMD-based CUSUM method for microseismic arrival time picking. The corresponding picking procedure is illustrated in Figure 3. The specific steps are as follows:
Figure 3.
Process flow of CUSUM pickup based on VMD method.
- (1)
- is decomposed into several mode signals through VMD. Each mode signal represents different frequency components.
- (2)
- For selecting the effective modal components according to the correlation coefficients between microseismic signals and their individual components, we need to calculate the correlation coefficient between each IMF and the microseismic signal. This helps differentiate effective signals from noise.
In the equation, and are the values of the original signal and the IMF at the time point.
- (3)
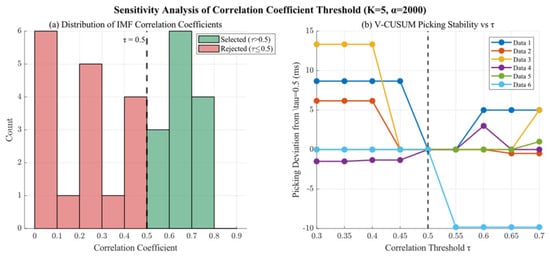
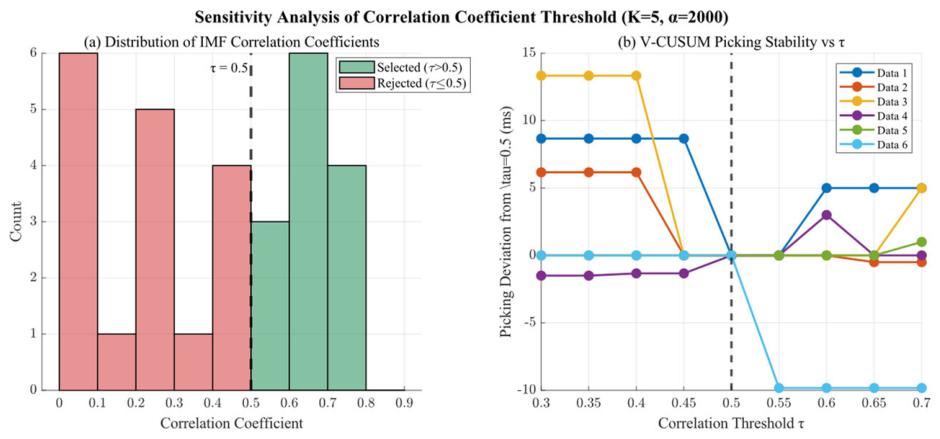
- To determine the correlation coefficient, we conducted a sensitivity analysis of the correlation coefficient; the results are shown in Figure 4. Figure 4a illustrates that the correlation coefficients of all 30 IMFs (from 6 field datasets, each decomposed into K = 5 modes) naturally form a bimodal distribution with a clear gap at approximately 0.5. IMFs with signal components consistently exhibit |r| > 0.5 (43% of components), while noise-dominated IMFs fall below this threshold (57%).Figure 4. Sensitivity analysis of different correlation coefficients. The gray dashed line represents the dividing line with a correlation coefficient of 0.5.
As demonstrated in Figure 4b, when the threshold is varied from 0.30 to 0.70, the V-CUSUM picking time deviates by at most 13.3 ms (less than 1% of the typical inter-event interval), confirming that the method is insensitive to the precise threshold value.
Thus, the proposed method adopts a correlation coefficient greater than 0.5 as the selection criterion, classifying modal components with correlation coefficients above this threshold as effective signals. CUSUM is implemented on the selected IMFs to pick arrival time. The CUSUM method is used to detect changes in the microseismic signal. For the modal signal , the CUSUM statistic is defined as:
In the equation, is the mean of the modal signal . The statistic accumulates the deviation from the mean, and when it reaches a certain threshold, it indicates that a change in the signal has occurred.
- (4)
- To accurately pick the arrival times of signals for each IMF component, this paper employs the generalized likelihood ratio (GLR) test method. For the k-th component a, each time instant is considered as a candidate arrival point, and the following likelihood ratio statistic is constructed:
In the equation, represents the no-arrival-time assumption, meaning all component data follow a uniform Gaussian distribution . In the equation, represents the occurrence of an arrival at time , meaning the data before and after follow the Gaussian distributions and . By calculating the log-likelihood ratio and finding its global maximum, the arrival time of this component can be estimated.
- (5)
- The final arrival time is obtained by calculating the average value of the arrival time measurements from the selected components.
In the equation, represents the picking time for each component, is the number of selected effective components and is the final picking result.
3. Simulation Experiment
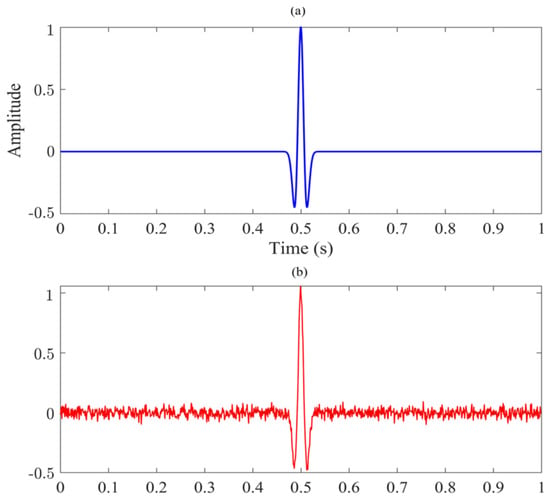
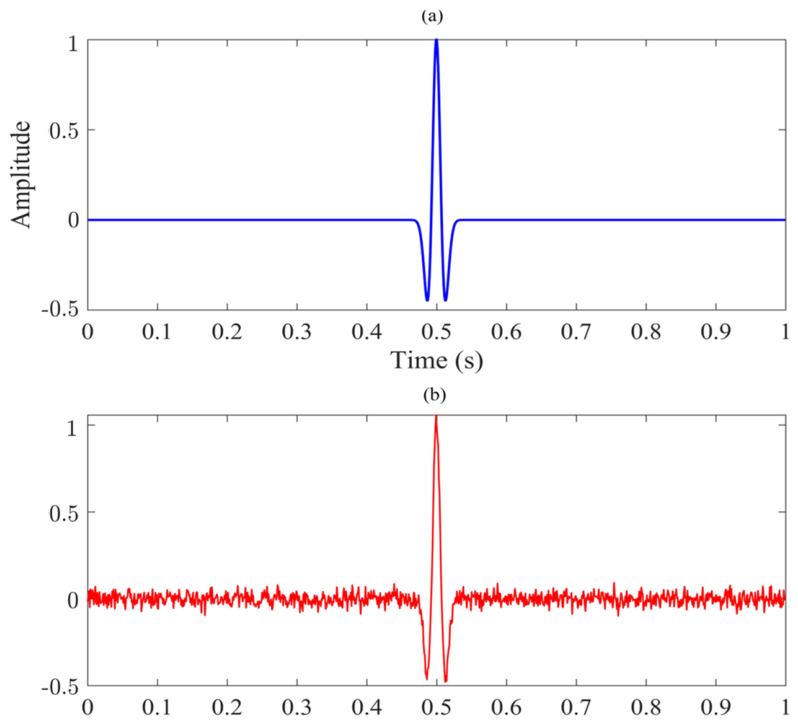
To validate the proposed method in this paper, we simulated a Ricker wavelet with a dominant frequency of 30 Hz, a sampling interval of 1 ms, and 1000 sampling points, as shown in Figure 5a. To simulate field microseismic signals, Gaussian noise was added to the Ricker wavelet, resulting in an SNR of 5 dB, as shown in Figure 5b.
Figure 5.
Theoretical data: (a) the original Ricker wavelet; (b) the noisy Ricker wavelet.
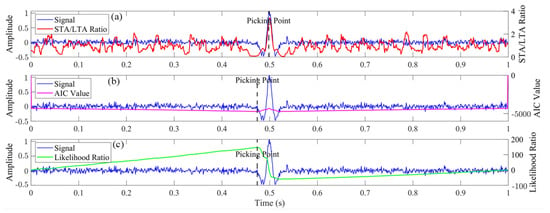
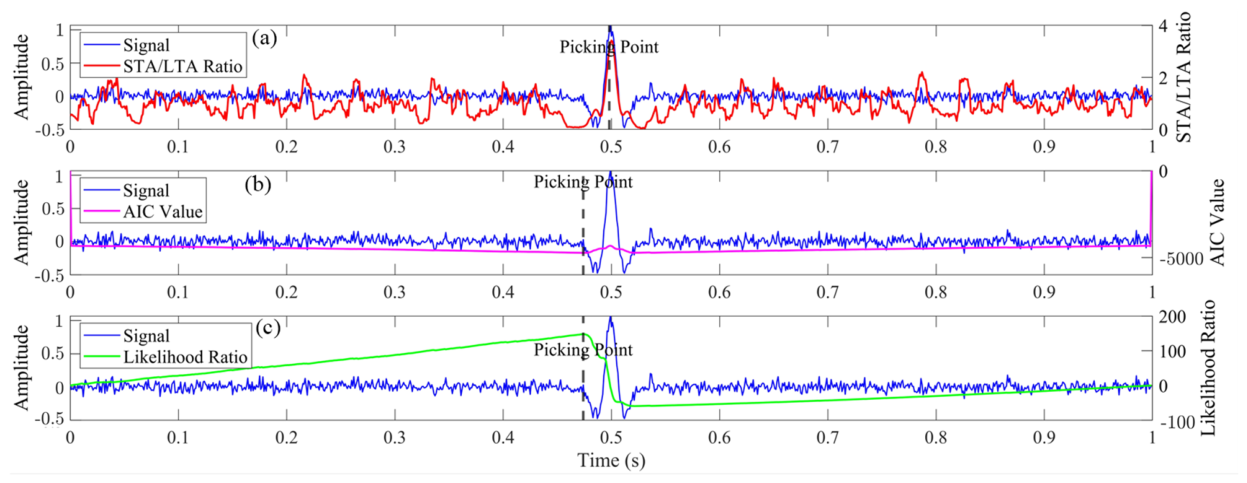
As shown in Figure 6, to compare the picking accuracy of the proposed method with other approaches, the Short-Term Average/Long-Term Average Method (STA/LTA), Akaike information criterion (AIC), and Cumulative Sum (CUSUM) methods were employed to pick the arrival time of the microseismic signal. As can be observed from the figure, the picking result of the STA/LTA method is 0.498 s, the result of the AIC method is 0.522 s, and the result of the CUSUM method is 0.475 s. As observed in Figure 6, both the STA/LTA and AIC methods exhibit significant delays compared to the CUSUM method. However, the CUSUM’s result remains inadequate in accuracy. Consequently, this paper proposes a VMD-based CUSUM method for arrival time picking.
Figure 6.
Theoretical data results. (a) STA/LTA picking results; (b) AIC picking results; (c) CUSUM picking results. The gray dashed line represents the manual picking time.
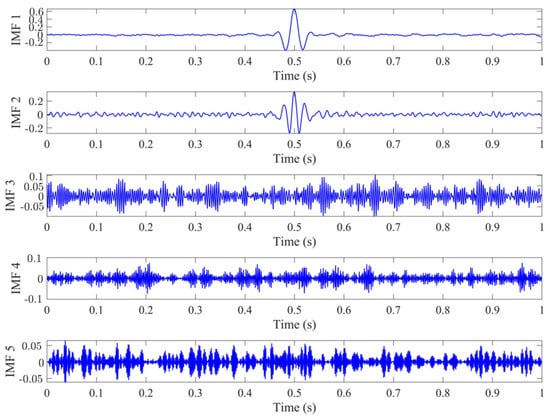
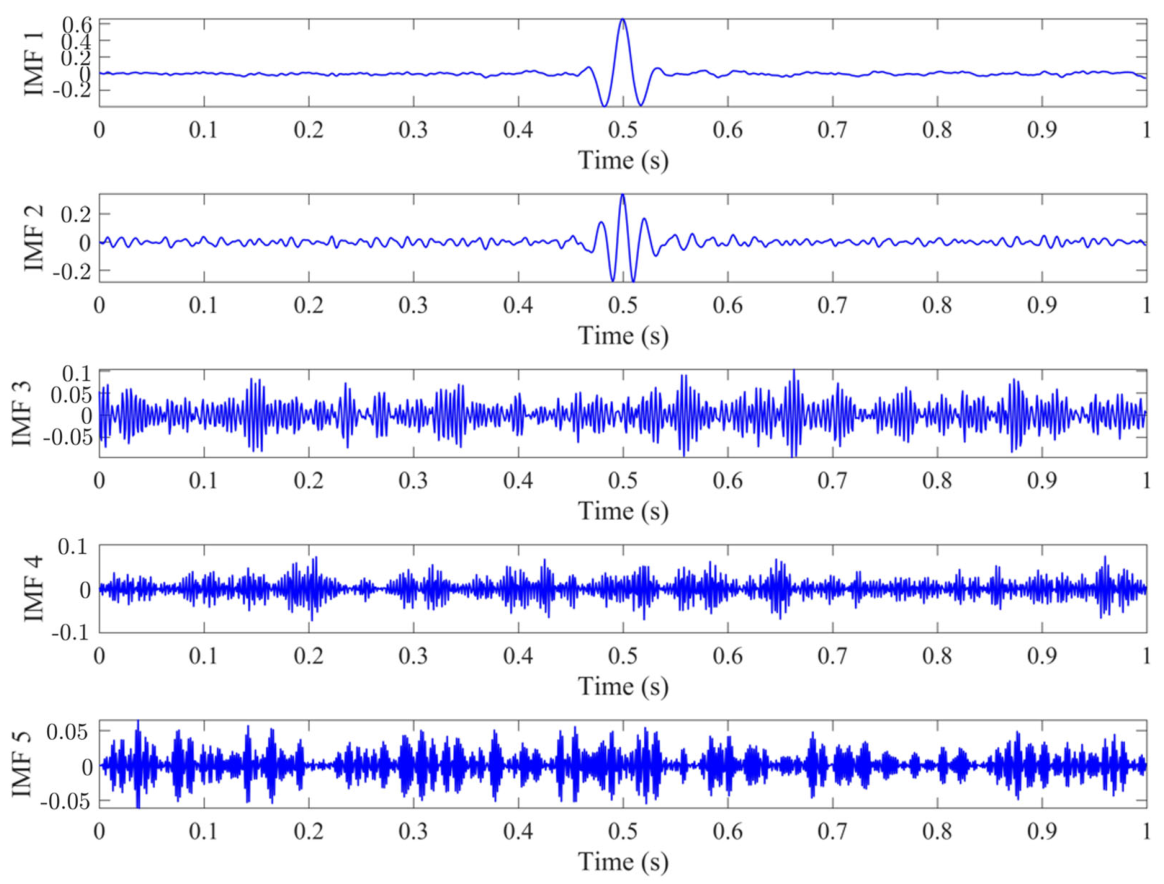
The Ricker wavelet is decomposed into five modal components by Variational Mode Decomposition (VMD), as shown in Figure 7. It can be observed from the figure that intrinsic mode functions (IMF)1 and IMF2 primarily consist of effective signals with minimal noise, exhibiting high SNR. In contrast, IMF3–5 are predominantly composed of noise with negligible effective signals, resulting in low SNR. Here, we propose a method to select effective components based on their correlation coefficient.
Figure 7.
Modal component decomposition of theoretical data.
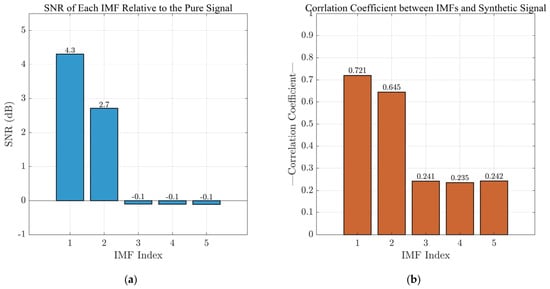
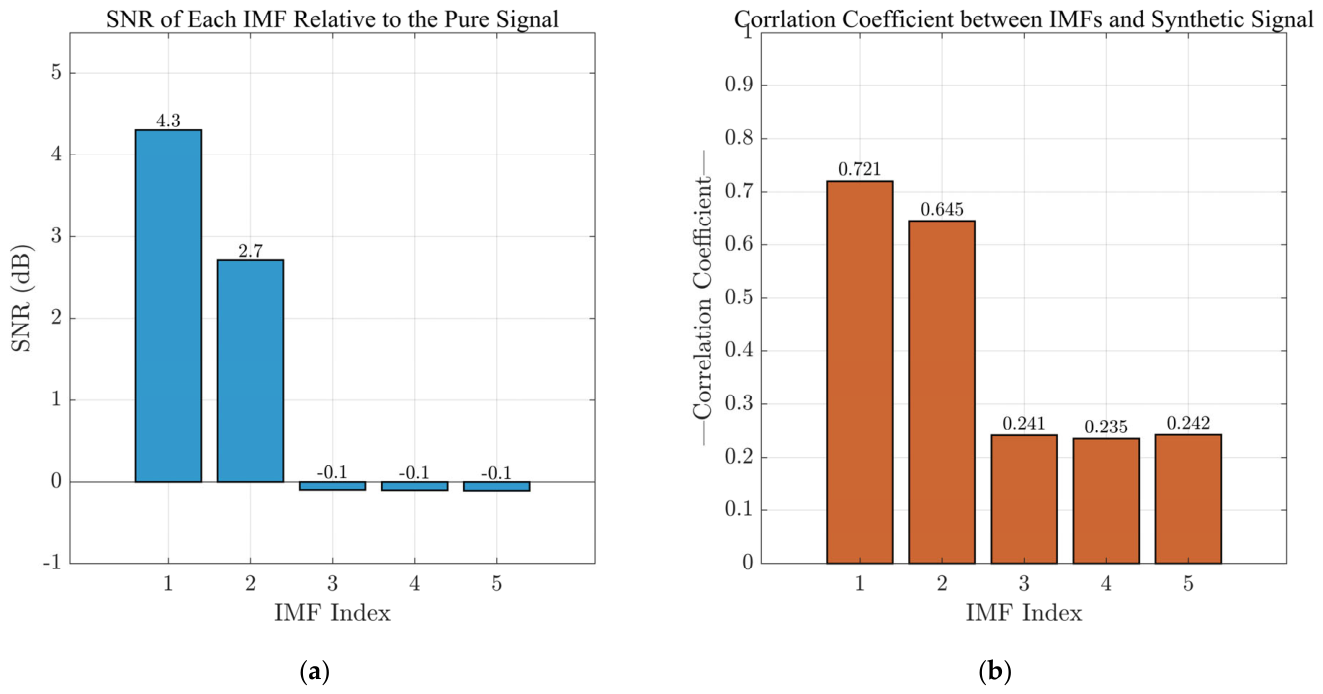
As shown in Figure 8, this represents the coefficients between each modal component and the microseismic signal. By measuring the linear similarity between each modal component and the microseismic signal, it effectively distinguishes which components carry core information as effective signals and which are irrelevant noise. It can be clearly observed from the figure that IMF1 and IMF2 exhibit significantly higher correlation coefficients compared to IMF3–5. Consequently, IMF1 and IMF2 are selected through this screening process.
Figure 8.
(a) SNR of each IMF relative to the pure signal; (b) the correlation coefficient between each IMF and the synthetic microseismic signal.
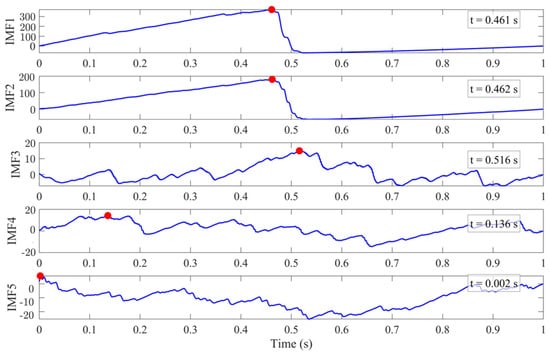
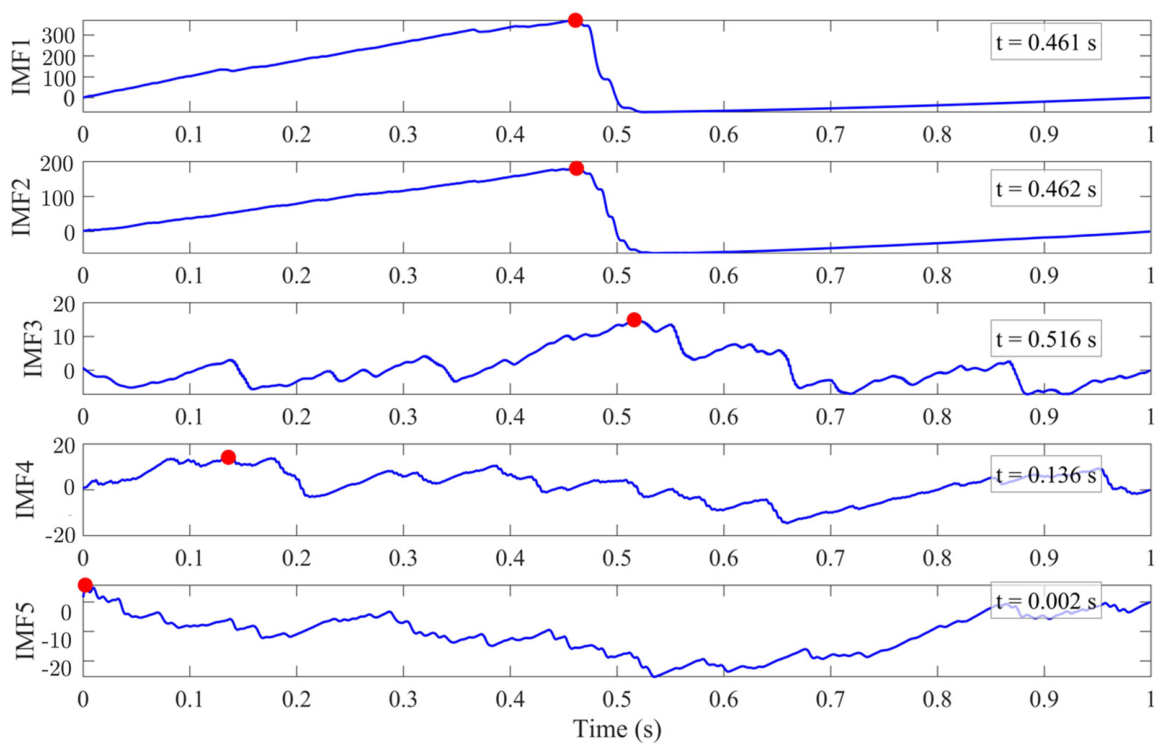
Figure 9 displays the arrival time picking results of the CUSUM method for each IMF component. As observed in the figure, IMF1 and IMF2 primarily consist of effective signal components; their picking results are identical at 0.462 s. IMF3–5 are predominantly composed of noise, and their picking results exhibit significant deviations from the accurate arrival time. According to the criterion of the correlation coefficient being higher than 0.5, IMF1 and IMF2 are selected. To integrate the arrival time picking results from the selected IMFs, we calculated the average value of IMF1 and IMF2 as the precise arrival time result.
Figure 9.
Pickup results of different-order signal components of theoretical signals based on the CUSUM method. The red dots represent the arrival times.
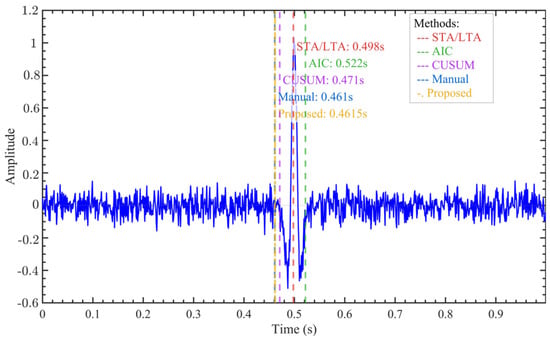
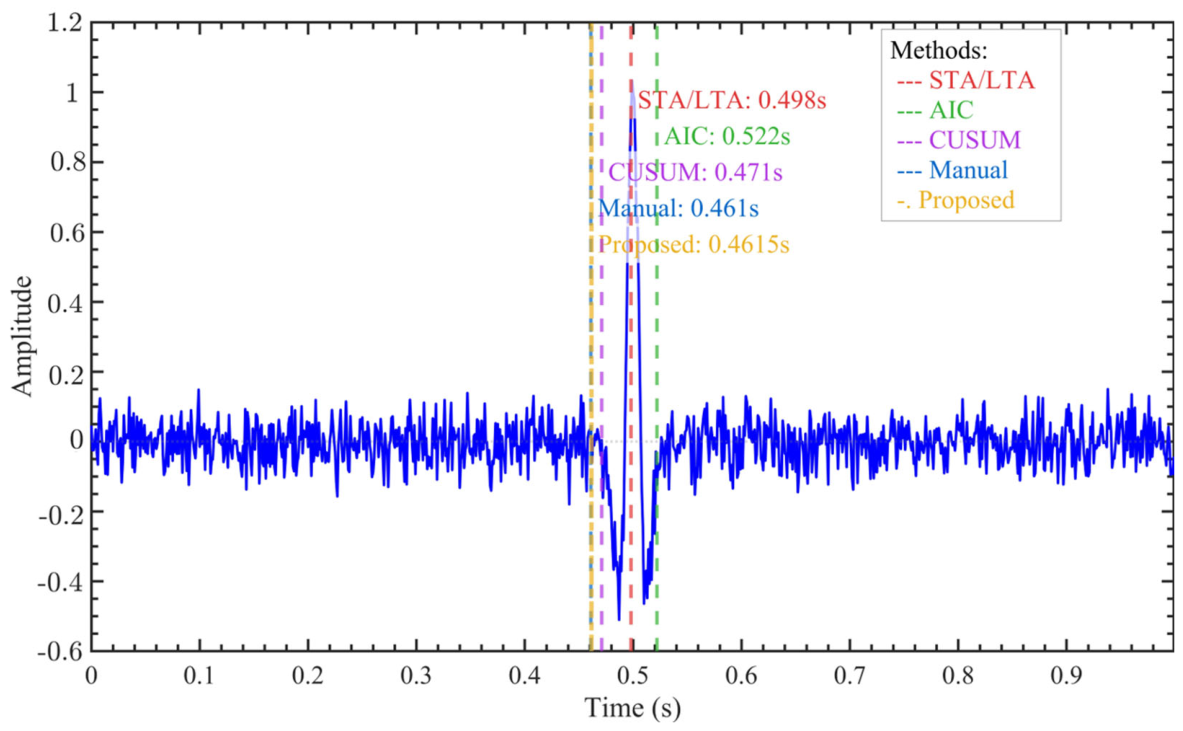
Figure 10 presents the picking results for the synthetic signal using different methods. The proposed V-CUSUM method demonstrates better performance than the other algorithms, with picking results that are closer to the manual reference.
Figure 10.
Comparative analysis of arrival picking results of theoretical data: proposed method vs. conventional approaches. The blue line represents the theoretical seismic signal.
As shown in Table 1, the quantitative comparison results of root mean square error (RMSE = 0.0024 s), mean absolute error (MAE = 0.0018 s), and standard deviation (SD = 0.0016 s) indicate that the V-CUSUM method proposed in this paper significantly outperforms the traditional STA/LTA (RMSE = 0.0347 s; MAE = 0.0347 s) and AIC methods (RMSE = 0.061 s; MAE = 0.061 s) in first-arrival picking accuracy. Moreover, it exhibits smaller error fluctuations under different SNR conditions, demonstrating superior stability and robustness, thereby comprehensively validating the method’s overall advantages in both accuracy and stability.
Table 1.
The comparison of VMD picking results with manual and CUSUM methods.
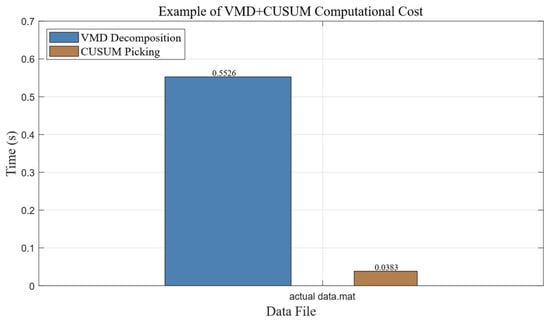
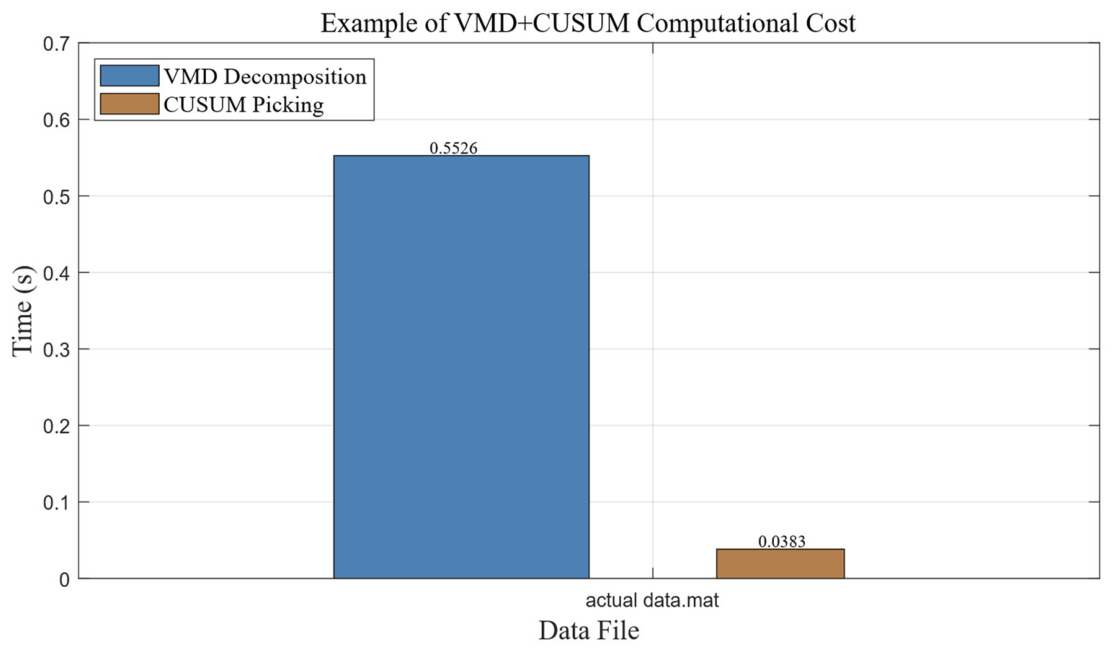
Figure 11 illustrates the computational cost of the V-CUSUM method for a 10,000-point field data record. The VMD phase requires 0.5526 s to decompose the signal into five IMFs, while the CUSUM algorithm requires 0.0383 s to process all IMFs and produce the final result. The total computational cost is approximately 0.59 s, which meets the real-time requirements of microseismic monitoring.
Figure 11.
The computational cost of V-CUSUM, conducted on 10,000-point field data.
4. Field Data Examples
The field microseismic data used in this study were collected from an underground iron mine using the ESG (Engineering Seismology Group, Kingston, ON, Canada) microseismic monitoring system. The system consists of 12 uniaxial acceleration sensors (model A1-30-1.0; sensitivity of 30 V/g; frequency band 50 Hz–5 kHz) deployed across two mining levels at elevations of −10 m and −70 m, with six sensors per level, forming a three-dimensional stereoscopic monitoring network. Two Paladin 32-bit seismic data acquisition units (one per level) digitized the signals, with time synchronization provided by a Precision Timing Protocol (PTP) unit and data transmission to a surface server via fiber optic cable. The system operated in continuous recording mode at a sampling rate of 1000 Hz. The analyzed field datasets consist of microseismic events induced by rock fracturing and blasting during routine mining operations. Each record contains 10,000 sampling points (10 s duration), and manual arrival times are independently determined by an experienced analyst through repeated waveform inspection.
4.1. Test 1
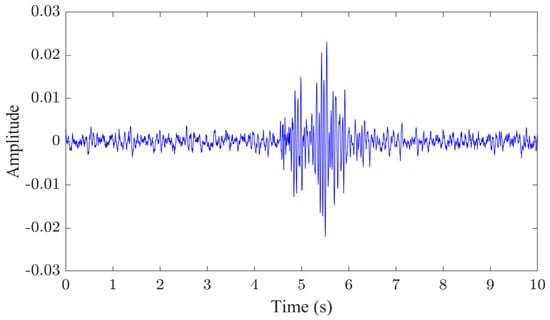
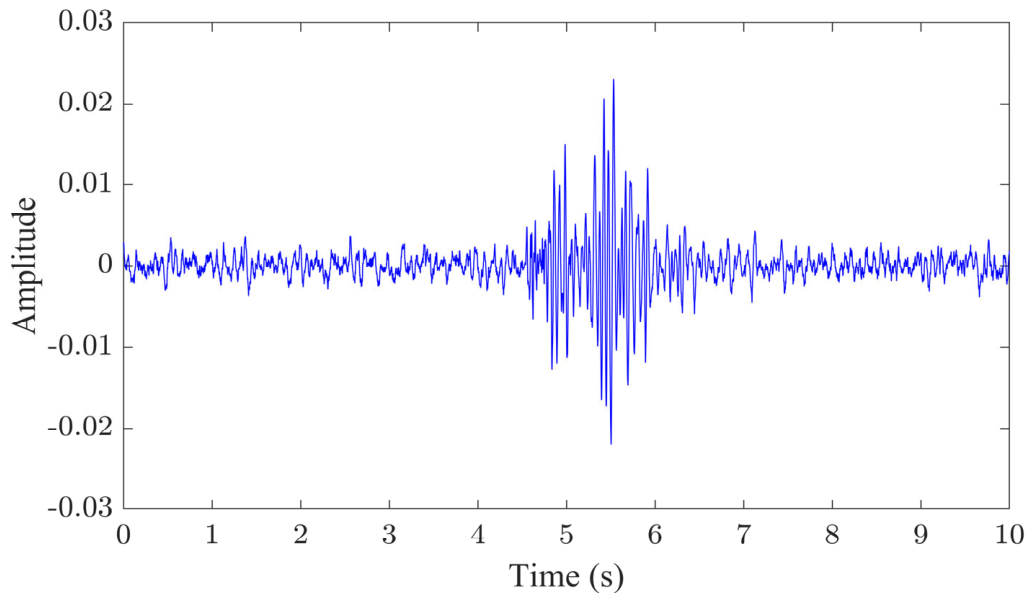
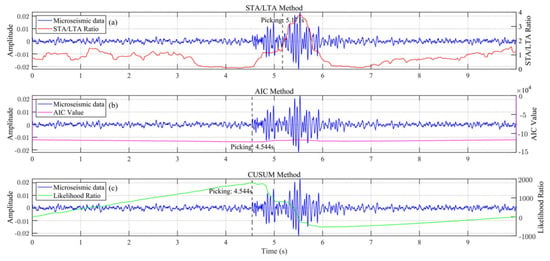
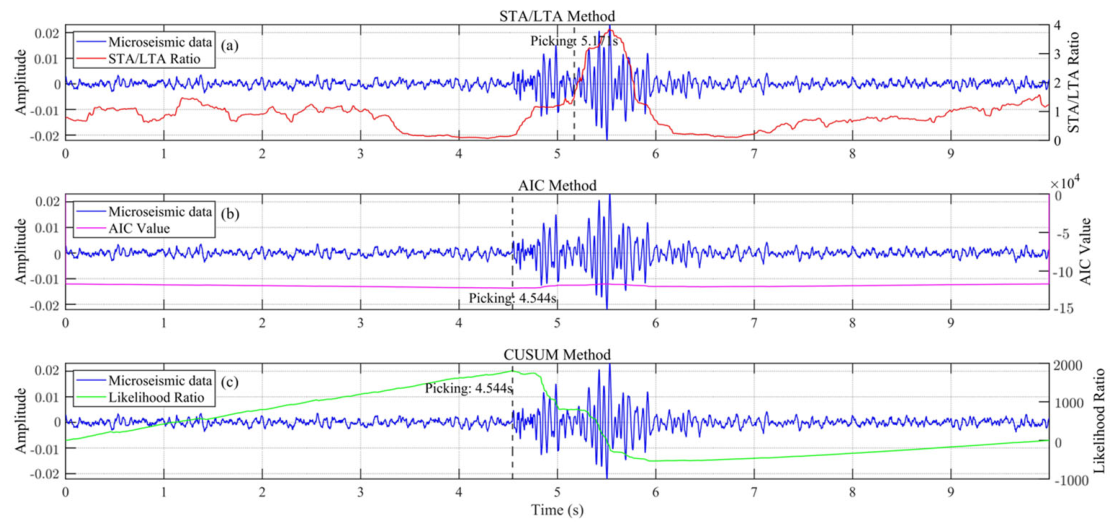
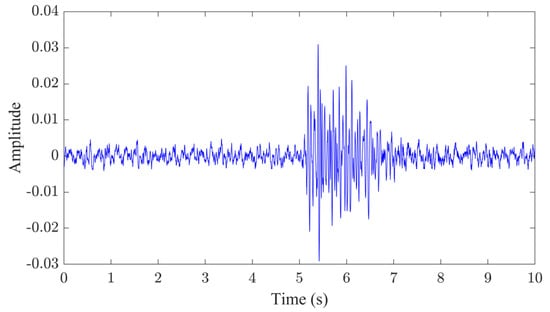
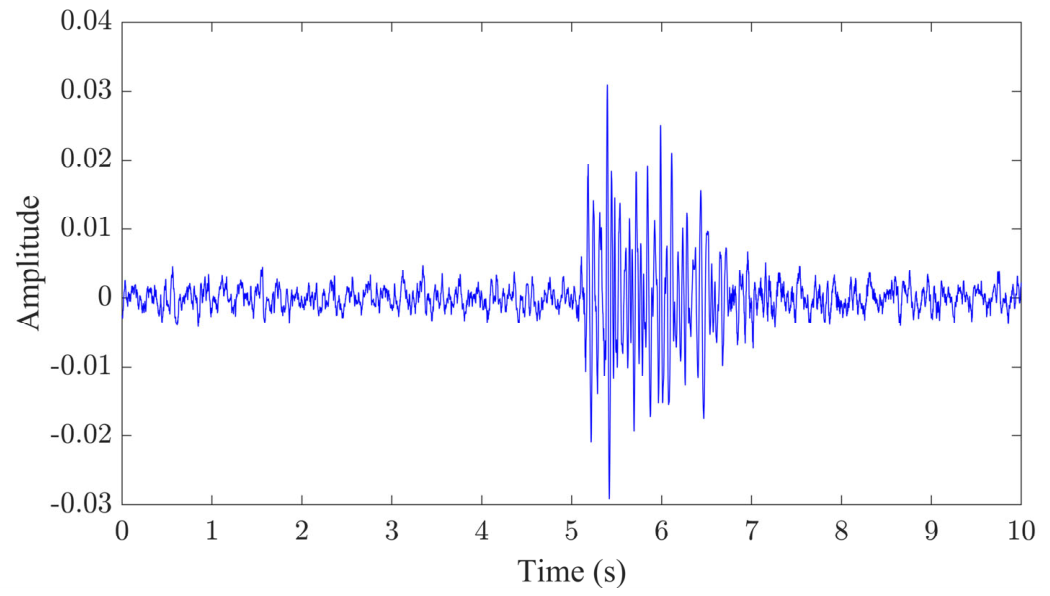
To verify the practical accuracy of the proposed method, we conduct validation tests using the field data. First, we analyze the mine microseismic monitoring data shown in Figure 12. The data have a sampling rate of 1000 Hz and contain 10,000 sampling points. Then, the Short-Term Average/Long-Term Average (STA/LTA) Method, Akaike information criterion (AIC) method, and (Cumulative Sum) CUSUM method are respectively employed to pick the arrival times of the microseismic signal, as shown in Figure 13. As can be observed from the figure, the result obtained by the STA/LTA method is 5.171 s, while the results of both the AIC and CUSUM methods are 4.544 s. A comparison of these three methods shows that, compared with the STA/LTA method, the AIC method and CUSUM method achieve more accurate picking results.
Figure 12.
Field microseismic data 1.
Figure 13.
Field data 1 results. (a) STA/LTA picking results; (b) AIC picking results; (c) CUSUM picking results.
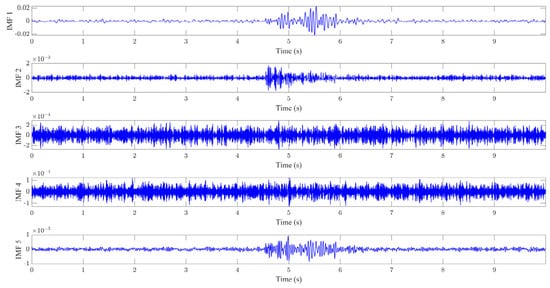
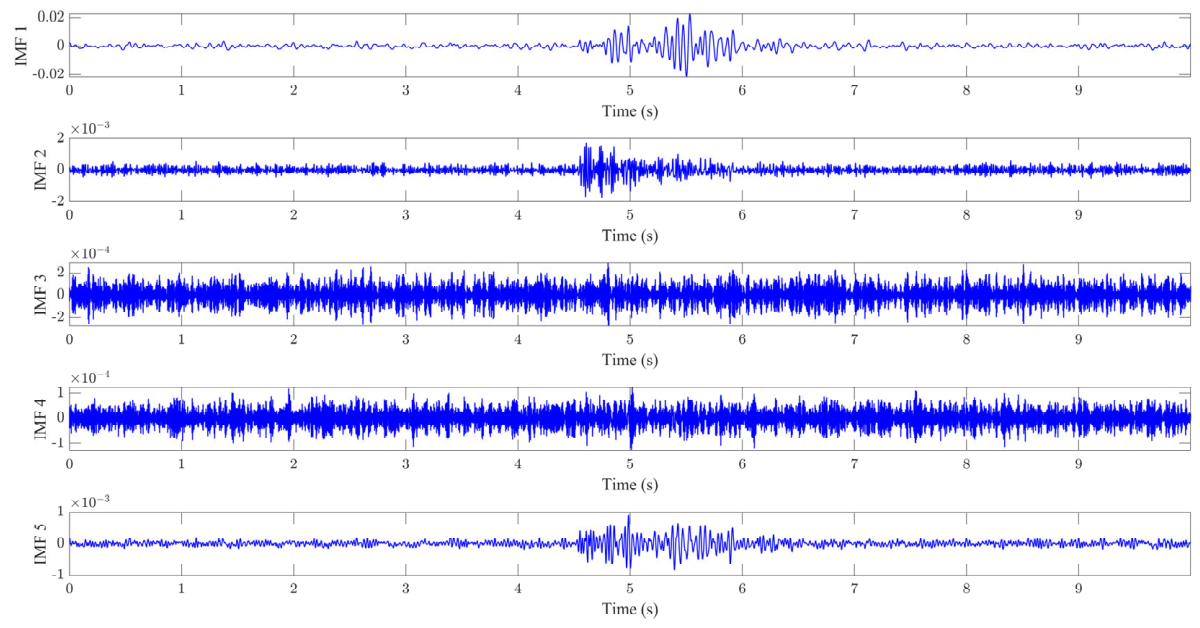
Figure 14 presents the five mode components obtained through Variational Mode Decomposition (VMD) of the microseismic signal. As can be observed from Figure 14, intrinsic mode functions (IMF)1 and IMF5 exhibit higher SNR compared to IMF2, IMF3 and IMF4, with a gradual decrease in energy. Here, we propose a method to select effective components based on their correlation coefficient.
Figure 14.
Modal component decomposition of field data 1.
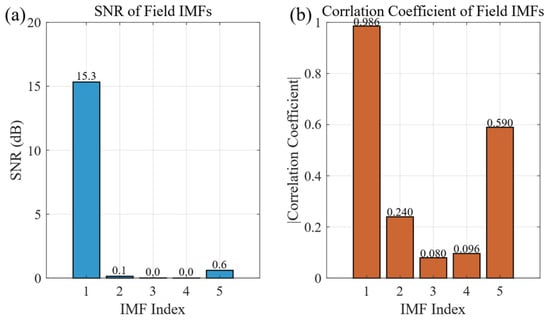
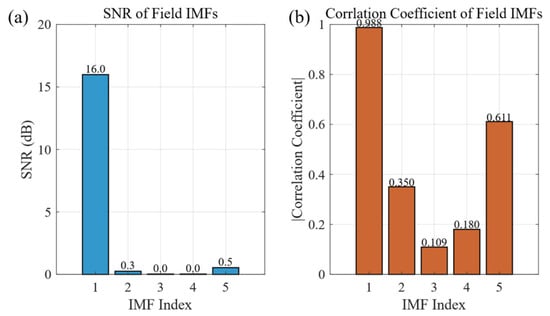
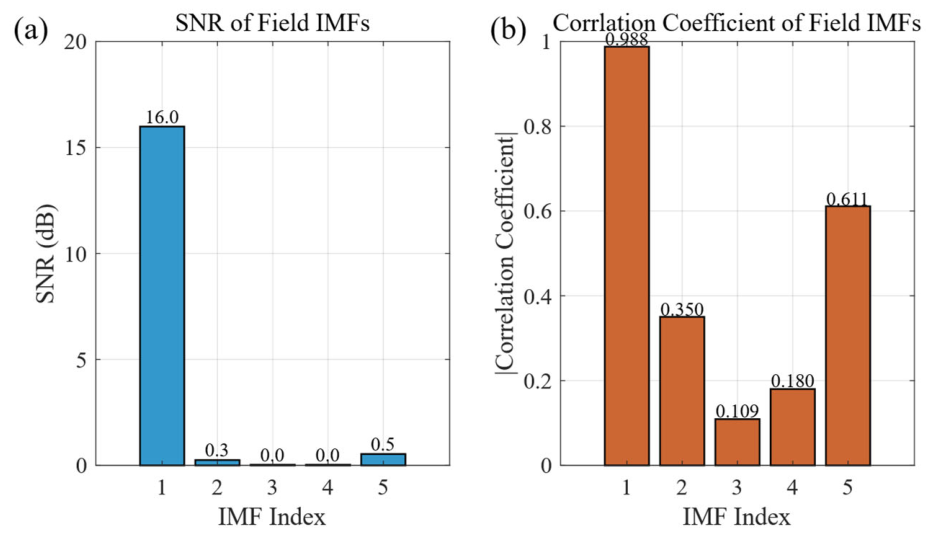
As shown in Figure 15, the correlation coefficient between each IMF and the microseismic signal was computed. Since components exhibiting higher absolute correlation coefficients are typically more closely associated with the primary characteristics of the original signal, this approach enables the precise identification of informative IMFs. According to Figure 15, the correlation coefficients of IMF1 and IMF5 with the original signal are significantly higher than those of IMF2, IMF3, and IMF4. Thus, IMF1 and IMF5 are selected.
Figure 15.
IMF parameters of field data 1. (a) The correlation coefficient between each IMF; (b) the microseismic signal and SNR of each IMF.
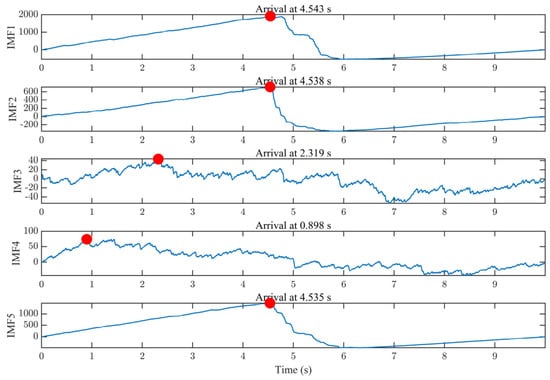
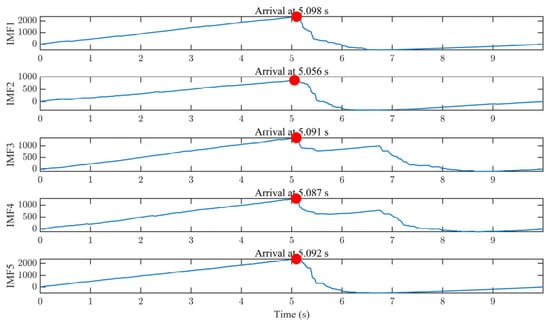
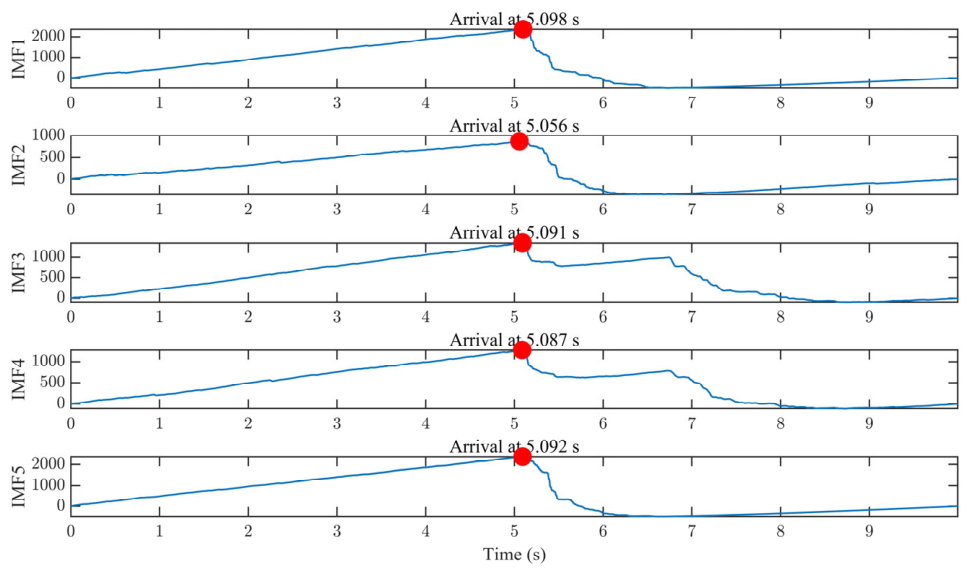
Then, arrival times for each IMF were picked using the CUSUM method, as illustrated in Figure 16. Figure 16 clearly demonstrates that the picking results are highly consistent for IMF1, IMF2, and IMF5, while IMF3 and IMF4 exhibit noticeable picking errors due to noise interference. Through the selection based on the correlation coefficients, IMF1 and IMF5 components were selected. Their average value was then calculated, and the result obtained using the CUSUM method based on VMD was 4.539 s.
Figure 16.
Pickup results of different-order signal components of field data 1 signals based on the CUSUM method. The red dots represent the arrival times.
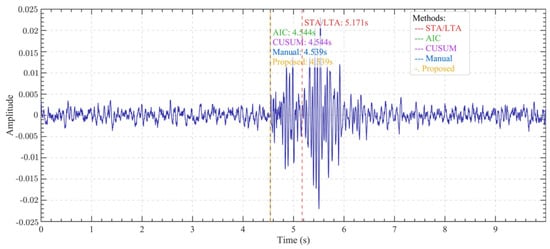
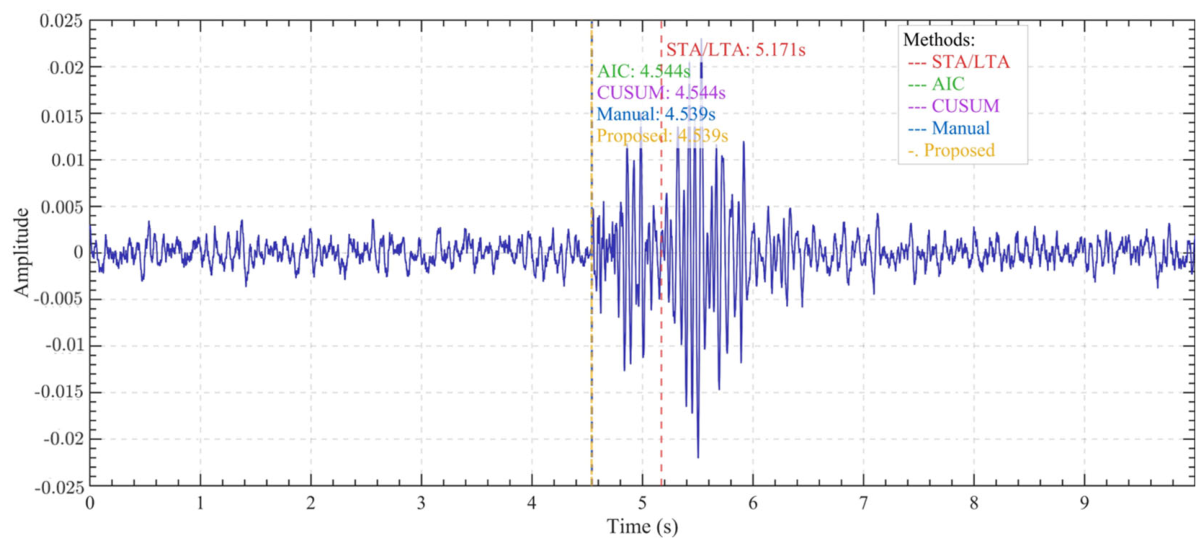
The arrival time picking results are shown in Figure 17. The blue dashed line represents the manually picked result (4.539 s), which serves as the reference ground truth. The red dashed line denotes the STA/LTA picked result (5.171 s), which exhibits the largest time deviation of 0.632 s. The green dashed line represents the AIC result (4.544 s), and the purple dashed line represents the conventional CUSUM result (4.544 s); both have a time deviation of 0.005 s relative to the manual reference. At a typical mine site P-wave velocity of 5 km/s, this 0.005 s timing error translates to a source location error of approximately 25 m, while the STA/LTA method would produce an error of approximately 316 m under the same velocity. This improvement is of practical significance for the microseismic localization of rock fracturing, rock bursts, and other hazardous events in underground mines. The picking result of the proposed V-CUSUM method is 4.539 s (yellow dashed line), which is consistent with the manual picking result. As shown in Table 2, the proposed method achieves picking results that are substantially closer to the manual reference, with significantly reduced time deviation, demonstrating its superior performance.
Figure 17.
Comparative analysis of arrival picking results of field data 1: proposed method vs. conventional approaches. The blue line represents the theoretical seismic signal.
Table 2.
Comparison of VMD picking results with manual, AIC, and STA/LTA methods.
4.2. Test 2
To validate the stability and reliability of the proposed method, another microseismic record was analyzed, as shown in Figure 18. It shares the same sampling rate and number of sampling points as Test 1, but exhibits a lower SNR.
Figure 18.
Field microseismic data 2.
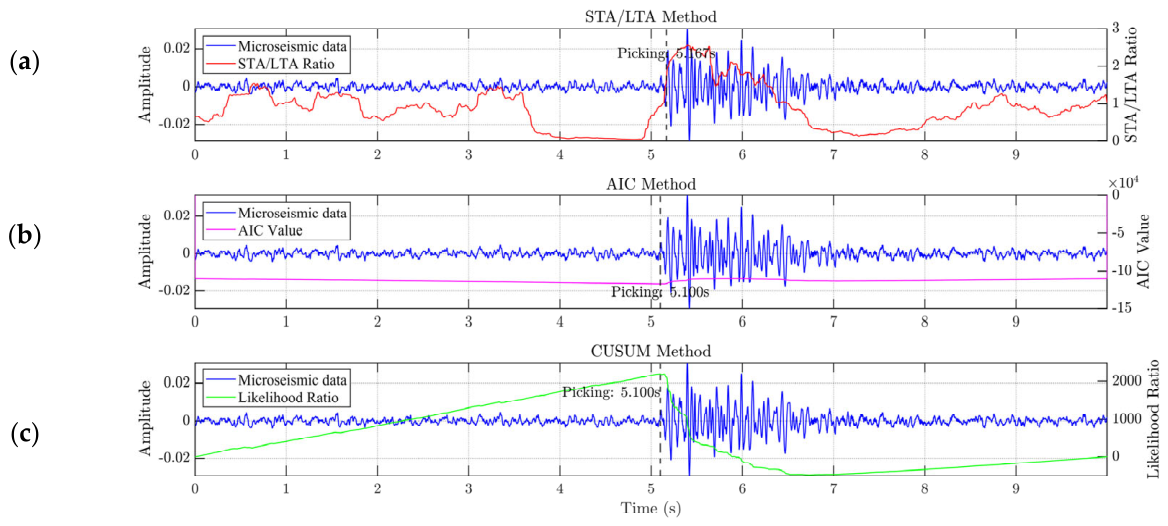
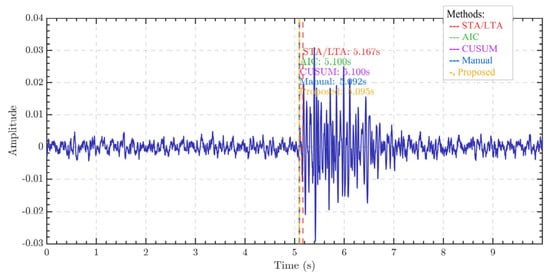
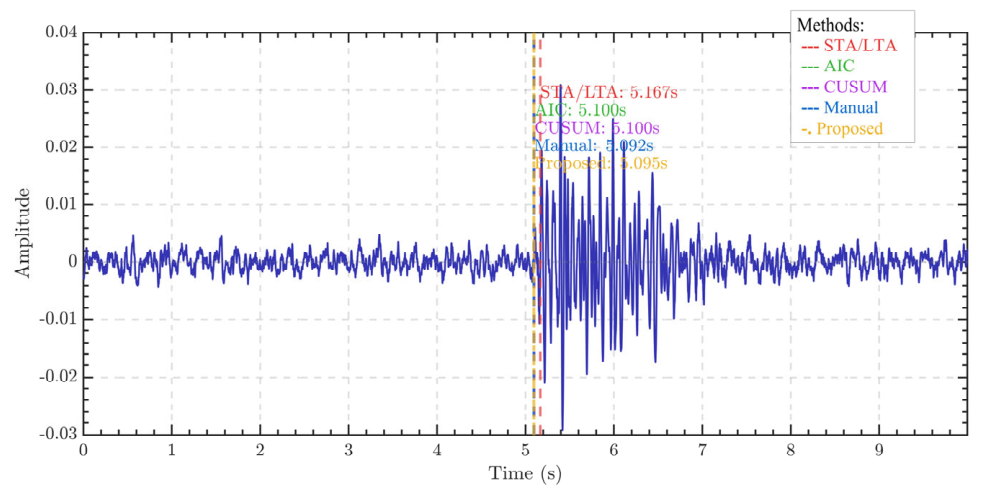
As shown in Figure 19, similarly to Test 1, we first applied the STA/LTA, AIC, and CUSUM methods to perform arrival time picking for this microseismic signal. The picking results of the three methods are 5.667 s, 5.100 s, and 5.100 s. It can be observed that the picking results of the AIC and CUSUM methods are identical, and both show a significant difference compared to the STA/LTA method.
Figure 19.
Field data 2 results. (a) STA/LTA picking results; (b) AIC picking results; (c) CUSUM picking results.
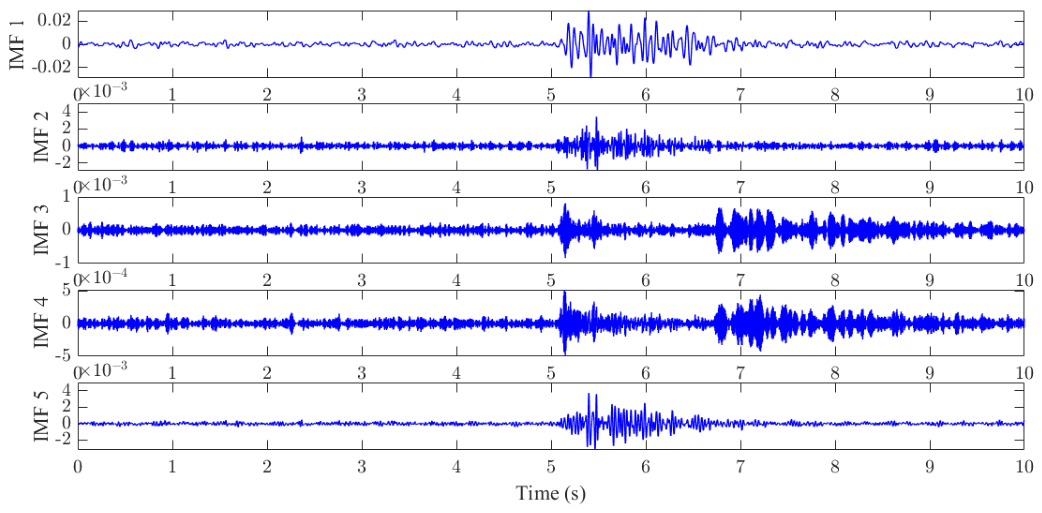
Then, we use the VMD-decomposed microseismic signal in five modes, as shown in Figure 20. As can be observed from Figure 20, IMF1 and IMF5 exhibit higher SNR compared to IMF2, IMF3 and IMF4, indicating that the former contain more effective signal components with less noise interference. Subsequently, effective components were selected by calculating the correlation coefficients between each component and the microseismic signal.
Figure 20.
Modal component decomposition of field data 2.
As shown in Figure 21, the correlation coefficients between the IMF components and the microseismic signal demonstrate that IMF1 and IMF5 exhibit significantly higher correlations than IMF2, IMF3, and IMF4. Therefore, IMF1 and IMF5 were selected as the effective modal components for subsequent CUSUM detection.
Figure 21.
IMF parameters of field data 2. (a) The correlation coefficient between each IMF; (b) the microseismic signal and SNR of each IMF.
Then, arrival times for each IMF were picked using the CUSUM method, as illustrated in Figure 22. According to the criterion of the correlation coefficient being higher than 0.5, IMF1 and IMF5 are selected. To integrate the arrival time picking results from the selected IMFs, we calculated the average value of IMF1 and IMF5 as the precise arrival time result.
Figure 22.
Pickup results of different-order signal components of field data 2 signals based on the CUSUM method. The red dots represent the arrival times.
To systematically evaluate the performance of different automatic picking methods for microseismic P-wave arrivals, this study compared the STA/LTA, AIC, CUSUM, and V-CUSUM methods from the perspectives of picking accuracy and error analysis, using manually picked results as the reference benchmark. Figure 23 presents the picking results of a representative field microseismic signal processed by each method. Compared with the other methods, the proposed V-CUSUM method improves the performance of the conventional CUSUM algorithm and substantially outperforms the STA/LTA method.
Figure 23.
Comparative analysis of arrival picking results of field data 2: proposed method vs. conventional approaches. The blue line represents the theoretical seismic signal.
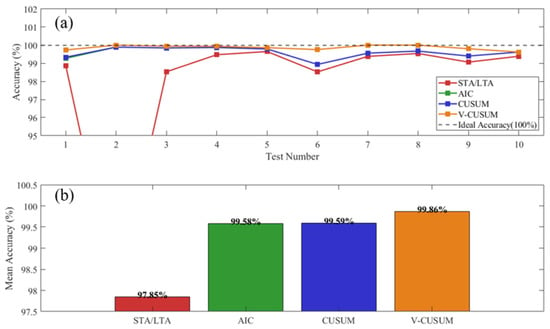
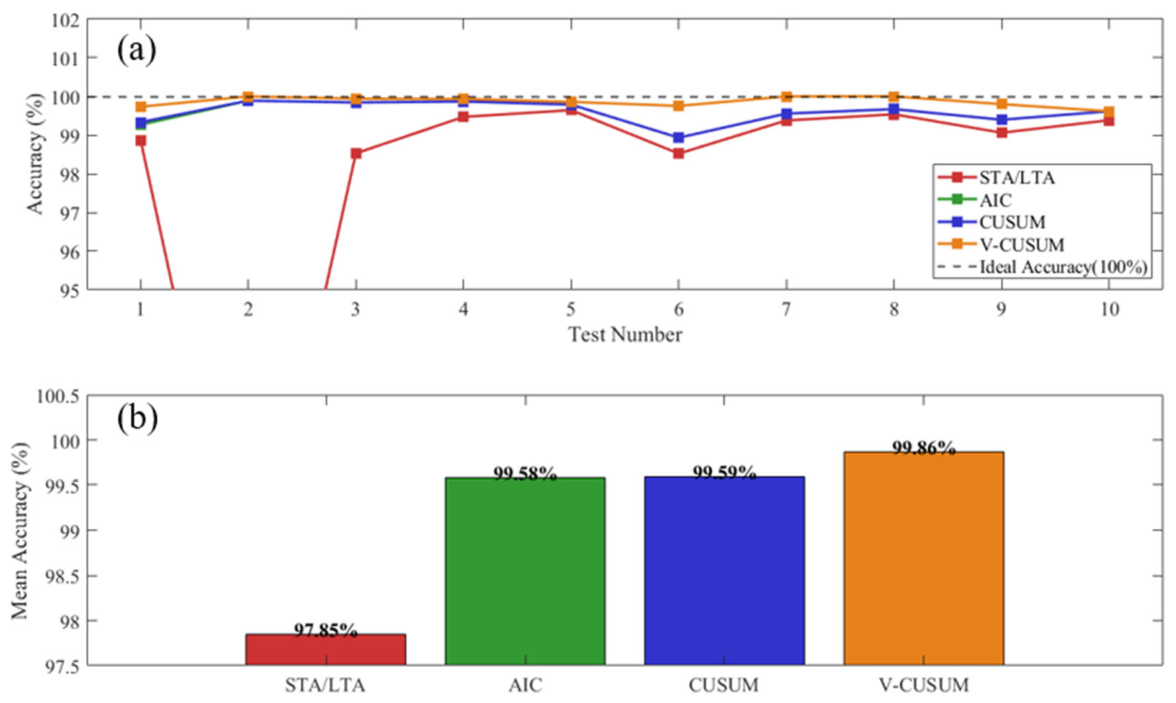
In terms of picking accuracy (defined in Equation (17)), as shown in Figure 24, an analysis of ten sets of test data indicates that all automatic methods achieved high accuracy close to the ideal value of 100%. Among them, the V-CUSUM method demonstrated the most outstanding overall performance, with an average accuracy of 99.86%, surpassing the STA/LTA method (97.85%) and the AIC method (99.58%). These results confirm the excellent stability and reliability of the proposed method across different microseismic events.
Figure 24.
(a) Accuracy performance of different methods across ten tests; (b) mean accuracy comparison of three methods.
5. Discussion
The experimental results obtained from both synthetic and field microseismic data demonstrate that the proposed VMD-based CUSUM (V-CUSUM) method achieves substantially higher arrival time picking accuracy and stronger robustness than the traditional Short-Term Average/Long-Term Average Method (STA/LTA), Akaike information criterion (AIC), and conventional Cumulative Sum (CUSUM) methods. The improvement originates from the synergistic combination of Variational Mode Decomposition (VMD)-based adaptive signal decomposition and the statistical sensitivity of the CUSUM change-point detection algorithm. Unlike existing VMD-based picking methods, such as the V-STA/LTA approach proposed by Fang et al. [24], which still relies on energy-ratio triggering, the V-CUSUM method introduces four key methodological advances: (i) CUSUM-based statistical detection that monitors cumulative deviations from the mean rather than instantaneous energy changes, providing greater sensitivity to weak arrivals under low-SNR conditions; (ii) correlation coefficient-based IMF selection that directly quantifies the relevance of each mode to the original signal, replacing frequency-domain center-frequency criteria; (iii) fractal box dimension as a systematic metric for VMD parameter optimization; and (iv) equal-weight averaging of multi-IMF picking results, which reduces the disproportionate influence of any single mis-picked component and improves overall stability.
Traditional STA/LTA methods are highly dependent on the energy contrast between signal and noise. Under low signal-to-noise ratio (SNR) conditions, background noise significantly interferes with short-term energy characteristics, resulting in delayed or unstable picking results. The AIC method improves sensitivity to waveform changes, yet it remains susceptible to noise fluctuations and often produces unstable extrema in complex microseismic environments. The conventional CUSUM method has stronger sensitivity to abrupt statistical changes in the signal; however, when directly applied to raw noisy data, its detection capability is still limited by noise interference, because the statistical change induced by a weak P-wave arrival may be indistinguishable from random fluctuations in the noise background.
The proposed method addresses these limitations by introducing VMD preprocessing before arrival time picking. VMD decomposes the original microseismic signal into several band-limited IMFs through variational optimization in the frequency domain, effectively separating useful signal components from background noise. Compared with empirical mode decomposition (EMD) and its variants, VMD exhibits better resistance to mode mixing and endpoint effects, which is particularly important for microseismic signals with strong non-stationary and nonlinear characteristics. The fractal box dimension-based parameter selection strategy further enhances decomposition quality by providing a quantitative, geometry-aware metric for evaluating modal complexity, which is more effective than conventional permutation entropy in distinguishing meaningful waveform structures from random noise under strong interference conditions.
The parameter combination of K = 5 and α = 2000 was selected through systematic grid-search experiments covering K ∈ [2, 10] and α ∈ [500, 5000]. Under this configuration, the decomposed IMFs exhibit clear frequency separation without obvious mode mixing, and the average fractal box dimension remains relatively stable across different noise conditions, indicating balanced decomposition completeness and noise suppression. In both simulation and field tests, IMF1 and IMF5 consistently exhibit higher correlation coefficients with the original signal, confirming that the effective signal energy is predominantly concentrated in these components. The correlation coefficient threshold of 0.5 was determined through sensitivity analysis across the range of 0.30–0.70; within this range, the picking accuracy varied by less than 2%, demonstrating the robustness of this empirical criterion.
Regarding computational efficiency, the VMD and IMF screening introduce additional processing time compared with direct CUSUM application. For a typical 10 s microseismic record sampled at 1000 Hz, the complete V-CUSUM pipeline requires approximately 0.8 s of computation on a standard desktop computer (Intel Core i7-10750H; 16 GB RAM), with VMD accounting for roughly 85% of the total processing time. While this is higher than the STA/LTA method (<1 ms), it remains well within the real-time requirements of operational mine microseismic monitoring systems, which typically operate on time windows of several seconds. For applications with stringent real-time constraints, the VMD computation can be further accelerated through parallel implementation or GPU-optimized solvers.
It is important to identify scenarios under which the proposed V-CUSUM method may encounter difficulties. First, under extremely low-SNR conditions (below approximately −5 dB), VMD may fail to effectively separate signal components from background noise, causing the correlation coefficients of all IMFs to fall below the selection threshold and resulting in no valid IMF being identified for CUSUM detection. A potential mitigation strategy is to adaptively lower the correlation threshold based on the estimated SNR of the input signal. Second, when two or more microseismic events occur with temporally overlapping waveforms, VMD may produce mixed-mode IMFs containing energy from multiple events, leading to ambiguous CUSUM detection. Incorporating a sliding-window preprocessing step or a single-event detector could help isolate individual arrivals. Third, short-duration impulsive noise, such as that generated by blasting operations or machinery impacts, may produce spuriously high correlation coefficients with the original signal, causing the screening mechanism to incorrectly select noise-dominated IMFs. Introducing additional impulsivity measures, such as kurtosis, alongside the correlation coefficient could improve screening robustness.
It should also be acknowledged that this study uses manual picking results as the reference ground truth for evaluating all automatic methods. Manual picking inherently involves subjective judgment and may vary between different analysts. In this study, all manual arrival times were independently determined by an experienced analyst through repeated waveform inspection. Based on repeated measurements, the uncertainty of manual picking is estimated to be within ±0.002 s for high-SNR signals and ±0.01 s for low-SNR signals. This uncertainty is comparable to or smaller than the picking errors of the automatic methods reported in Table 2 and therefore does not affect the main conclusions of this study. Nevertheless, the variability in manual picks represents an inherent limitation of the current validation framework, and the use of multiple independent analysts or synthetic data with known arrival times could further strengthen future evaluations.
This study does not include direct comparisons with deep learning-based arrival time pickers such as PhaseNet [25] and EQTransformer [26]. While these methods have achieved impressive results on regional seismic benchmarks, their deployment in operational mine microseismic monitoring faces several practical challenges. First, deep learning models typically require tens of thousands of labeled training samples, which are rarely available for individual mine sites with unique geological conditions and noise characteristics. Second, models trained on tectonic earthquake catalogs often fail to generalize to mining-induced microseismic events, which exhibit distinct waveform features and shorter source–receiver distances. Third, real-time monitoring in underground mines commonly relies on edge computing devices with limited computational resources, making lightweight signal-processing-based methods more practical for field deployment. Fourth, the proposed V-CUSUM method offers fully transparent and physically interpretable processing steps, which is a significant advantage for safety-critical decision-making in mining operations. Nevertheless, the combination of VMD-based preprocessing with deep learning techniques represents a promising direction for future investigation.
The practical engineering significance of the observed accuracy improvement warrants discussion. In Test 1, the proposed method achieved a picking result of 4.539 s, identical to the manual reference, while AIC and CUSUM obtained 4.544 s (error = 0.005 s). Although a 0.005 s improvement may appear small in absolute terms, its impact on source localization can be substantial. In a typical mine microseismic monitoring configuration with a P-wave velocity of approximately 5000 m/s, a 0.005 s picking error translates to a distance error of approximately 25 m. When multiple sensors are used for triangulation, such errors can propagate and amplify, potentially shifting the estimated source location by tens of meters and affecting the reliability of rock burst early warning decisions. Therefore, even marginal improvements in picking accuracy carry meaningful implications for operational safety in underground mining environments.
Several limitations of the current study should be noted. First, the validation dataset, although comprising both synthetic and field data, is limited in size and diversity; expanding the evaluation to include events with varying magnitudes, source distances, and geological settings would further strengthen the generalizability claims. Second, the VMD parameter optimization currently relies on offline grid search, which is computationally intensive; intelligent optimization algorithms such as particle swarm optimization (PSO) could enable online adaptive parameter selection. Third, the correlation coefficient threshold of 0.5, while shown to be robust through sensitivity analysis, could benefit from an SNR-adaptive formulation. Fourth, the method has been validated exclusively for P-wave arrival picking in mine microseismic monitoring; extending the framework to S-wave picking and to other application domains, such as hydraulic fracturing monitoring and tunnel excavation safety, represents an important future direction.
Overall, the proposed V-CUSUM method effectively improves the accuracy and stability of microseismic arrival time picking under complex noise environments. The combination of VMD, fractal box dimension-based parameter evaluation, correlation coefficient screening, and CUSUM detection provides a reliable, interpretable, and computationally practical framework for automatic microseismic monitoring applications.
6. Conclusions
To address the challenge of accurate microseismic P-wave arrival time picking under complex noise conditions in metal mine monitoring systems, this study proposed a VMD-based CUSUM (V-CUSUM) arrival time picking method. By synergistically combining the adaptive decomposition capability of VMD with the statistical change-detection sensitivity of the CUSUM algorithm, the proposed method achieves substantial improvements in both accuracy and robustness over conventional approaches. The core contributions and findings of this study are summarized as follows:
- A systematic VMD parameter optimization framework was established by introducing the fractal box dimension as a quantitative complexity metric for evaluating decomposed modal components. Compared with conventional permutation entropy-based methods, the fractal box dimension more effectively characterizes the geometric irregularity and structural complexity of microseismic signals under strong noise conditions. The optimal parameter combination of K = 5 and α = 2000, determined through comprehensive grid-search experiments, achieves a reliable balance between noise suppression and preservation of effective signal characteristics.
- A correlation coefficient-based IMF screening strategy was developed that accurately identified signal-dominated modal components while excluding noise-dominated ones. The CUSUM change-point detection algorithm, applied independently to each selected IMF, exploits cumulative statistical deviations to achieve greater sensitivity to weak P-wave arrivals than conventional energy-ratio or information criterion-based methods. The equal-weight averaging of multi-IMF picking results further enhances stability by suppressing the influence of outlier estimates from individual components.
- Comprehensive validation using both synthetic and field microseismic datasets demonstrates that the V-CUSUM method achieves superior quantitative performance of RMSE = 0.0024 s, MAE = 0.0018 s, and SD = 0.0016 s in simulation, and an average picking accuracy of 99.86% (SD = 0.007 s) in field tests, substantially outperforming STA/LTA (RMSE = 0.0347 s; accuracy = 97.85%) and AIC (RMSE = 0.061 s; accuracy = 99.58%). The error distribution of V-CUSUM is more tightly concentrated around the manual reference, with smaller variance than all compared methods, confirming its superior consistency and robustness across different SNR conditions.
- The V-CUSUM method provides a fully transparent and physically interpretable framework that does not require large labeled training datasets, making it particularly suitable for practical deployment in mine microseismic monitoring systems with limited computational resources and site-specific noise characteristics. Future work will focus on developing intelligent optimization algorithms for online adaptive VMD parameter selection, SNR-adaptive IMF screening thresholds, and hybrid frameworks that combine VMD-based preprocessing with lightweight deep learning models to further enhance generalization capability across diverse monitoring environments.
Author Contributions
Conceptualization, J.S. and X.G.; Methodology, J.S. and X.G.; Software, J.S. and X.G.; Validation, J.S., C.L., X.G. and Z.F.; Formal analysis, J.S. and Z.F.; Investigation, J.S., X.G. and Z.F.; Resources, J.S., X.G. and Z.F.; Data curation, J.S. and X.G.; Writing—original draft, J.S.; Writing—review and editing, J.S., C.L., X.G. and Z.F.; Visualization, J.S., C.L. and Z.F.; Supervision, H.C.; Project administration, J.S. and H.C.; Funding acquisition, J.S. All authors have read and agreed to the published version of the manuscript.
Funding
This research was funded by the National Key Research and Development Program of China, grant number 2022YFC2903701; the Fundamental Research Funds for the Central Universities, grant number N2301014; and the General Project of Liaoning Joint Funds, grant number 2023-MSBA-131.
Institutional Review Board Statement
Not applicable.
Informed Consent Statement
Not applicable.
Data Availability Statement
The original contributions presented in this study are included in the article. Further inquiries can be directed to the corresponding author.
Conflicts of Interest
Authors Junhai Shen and Xiaoping Gao were employed by the company Liaoning Provincial Transportation Planning and Design Institute Co., Ltd. The remaining authors declare that the research was conducted in the absence of any commercial or financial relationships that could be construed as a potential conflict of interest.
References
- Cui, Y.J. Study on The Method of Arrival Automatic Pickup of Microseismic P-Wave Phase. Master’s Thesis, Shandong University of Science and Technology, Qingdao, China, 2018. [Google Scholar]
- Wang, J.M. Study on P-Wave First Arrival-Time Picking of Mine Microseismic Signals and Seismic Source Localization Method. Master’s Thesis, Liaoning Technical University, Fuxin, China, 2022. [Google Scholar]
- Liu, C.; Jin, P.; Li, X. A comparative study on three methods of onset-time determination for teleseismic P arrivals and parameters optimization. Acta Seismol. Sin. 2018, 40, 419–429. [Google Scholar] [CrossRef]
- Wang, J.; Chen, J.-H.; Liu, Q.-Y.; Li, S.-C.; Guo, B. Automatic onset phase picking for portable seismic array observation. Acta Seismol. Sin. Engl. Ed. 2006, 19, 44–53. [Google Scholar] [CrossRef] [Scilit]
- Wang, X.Z. Study on Application of Wavelet Transform in Compressing Seismic Data and Picking the Oneset Time of Seismic Phase. Ph.D. Dissertation, Intitue of Geophysics, China Earthquake Administration, Beijing, China, 2004. [Google Scholar]
- Li, W.; Jiang, X.L.; Chen, H.B.; Jin, Z.P.; Liu, Z.J.; Li, X.W.; Lin, J.X. Denosing method of mine microseismic signal based on EEMD_Hankel_SVD. J. China Coal Soc. 2018, 43, 1910–1917. [Google Scholar] [CrossRef]
- Wang, Y.Y.; Ding, R.W.; Li, J.P.; Zhao, L.H.; Zhao, S.; Zhang, S.W. Automatic pickup of microseismic P-wave arrival based on improved STA/LTA and MLoG operators. J. Shandong Univ. Sci. Technol. (Nat. Sci.) 2021, 40, 1–10. [Google Scholar] [CrossRef]
- Huang, N.E.; Shen, Z.; Long, S.R.; Wu, M.L.C.; Shih, H.H.; Zheng, Q.N.; Yen, N.C.; Tung, C.C.; Liu, H.H. The empirical mode decomposition and the Hilbert spectrum for nonlinear and non-stationary time series analysis. Proc. R. Soc. A-Math. Phys. Eng. Sci. 1998, 454, 903–995. [Google Scholar] [CrossRef] [Scilit]
- Wu, Z.; Huang, N.E. Ensemble empirical mode decomposition: A noise-assisted data analysis method. Adv. Adapt. Data Anal. 2009, 1, 1–41. [Google Scholar] [CrossRef] [Scilit]
- Torres, M.E.; Colominas, M.A.; Schlotthauer, G.; Flandrin, P. A complete ensemble empirical mode decomposition with adaptive noise. In Proceedings of the 2011 IEEE International Conference on Acoustics, Speech and Signal Processing (ICASSP), Piscataway, NJ, USA, 22–27 May 2011; pp. 4144–4147. [Google Scholar]
- Li, F.; Zhang, B.; Verma, S.; Marfurt, K.J. Seismic signal denoising using thresholded variational mode decomposition. Explor. Geophys. 2018, 49, 450–461. [Google Scholar] [CrossRef] [Scilit]
- Rehman, N.u.; Aftab, H. Multivariate Variational Mode Decomposition. IEEE Trans. Signal Process. 2019, 67, 6039–6052. [Google Scholar] [CrossRef] [Scilit]
- Zhao, X.; Wu, P.; Yin, X. A quadratic penalty item optimal variational mode decomposition method based on single-objective salp swarm algorithm. Mech. Syst. Signal Process. 2020, 138, 106567. [Google Scholar] [CrossRef] [Scilit]
- Zhang, X.L.; Cao, L.Y.; Chen, Y.; Jia, R.S.; Lu, X.M. Microseismic signal denoising by combining variational mode decomposition with permutation entropy. Appl. Geophys. 2022, 19, 65–80. [Google Scholar] [CrossRef] [Scilit]
- Yang, Y.; Zhang, Z.Z.; Cheng, H. Application Research on Random Noise Removal Method of Micro-Seismic Data Based on VMD-TFPF. Met. Mine 2022, 12, 170–176. [Google Scholar] [CrossRef]
- Fang, J.X.; Wen, Z.P.; Gu, H.Q.; Liu, J.; Zhang, H. Seismic random noise attenuation based on variational mode decomposition. Oil Geophys. Prospect. 2019, 54, 757–767+722. [Google Scholar] [CrossRef]
- Ibraimov, M.; Tuimebayev, Z.; Maksutova, A.; Skabylov, A.; Zhexebay, D.; Khokhlov, A.; Abdizhalilova, L.; Aktymbayeva, A.; Qin, Y.; Khokhlov, S. Detection of P-Wave Arrival as a Structural Transition in Seismic Signals: An Approach Based on SVD Entropy. Smart Cities 2026, 9, 51. [Google Scholar] [CrossRef] [Scilit]
- Zhou, L.; Peng, P.; Wang, L.; Meng, H.; Wu, Z. Automated P-wave arrival picking in microseismic monitoring: Integrating multi-feature clustering and enhanced AIC-STA/LTA. Measurement 2025, 256, 118143. [Google Scholar] [CrossRef] [Scilit]
- Jin, J.; Wang, G.; Qiu, Y.; Gong, S.; Ren, B. Two-Stage Microseismic P-Wave Arrival Picking via STA/LTA-Guided Lightweight U-Net. Sensors 2026, 26, 1693. [Google Scholar] [CrossRef] [Scilit] [PubMed]
- Zhou, Y.; Ren, H.; Wu, H. PhaseMamba: A Mamba-Based Deep Learning Model for Seismic Phase Picking and Detection. IEEE Geosci. Remote Sens. Lett. 2025, 22, 1–5. [Google Scholar] [CrossRef] [Scilit]
- Hou, Z.; Qiu, C.; Li, Y.; Jiang, B.; Chen, B.; Wang, Y. Method for Predicting Multi-Channel Short-Term Power Load Based on Variational Mode Decomposition Data Decomposition, Involves Weighing Encoded Features by Attention Mechanism Such That Larger Weight Is Placed on Time Step Associated with Prediction. China Patent Application CN118504614-A, 10 December 2025. [Google Scholar]
- Yang, Z.; Li, S.Q.; Wang, G.X. Remaining Useful Life Prediction of Crane Rolling Bearings Based on RMS Trend Consistency. Port. Opearation 2024, 6, 1–5. [Google Scholar] [CrossRef] [Scilit]
- Wang, S.; Ma, H.; Zhang, Y.; Li, S.; He, W. Remaining useful life prediction method of lithium-ion batteries is based on variational modal decomposition and deep learning integrated approach. Energy 2023, 282, 128984. [Google Scholar] [CrossRef] [Scilit]
- Fang, Z.; Cheng, H.; Wang, X.; Luo, C. Research on STA/LTA Microseismic Arrival Time-Picking Method Based on Variational Mode Decomposition. Appl. Sci. 2025, 15, 13220. [Google Scholar] [CrossRef] [Scilit]
- Zhu, W.; Beroza, G.C. PhaseNet: A deep-neural-network-based seismic arrival-time picking method. Geophys. J. Int. 2019, 216, 261–273. [Google Scholar] [CrossRef] [Scilit]
- Mousavi, S.M.; Ellsworth, W.L.; Zhu, W.; Chuang, L.Y.; Beroza, G.C. Earthquake transformer—An attentive deep-learning model for simultaneous earthquake detection and phase picking. Nat. Commun. 2020, 11, 3952. [Google Scholar] [CrossRef] [Scilit] [PubMed]

Disclaimer/Publisher’s Note: The statements, opinions and data contained in all publications are solely those of the individual author(s) and contributor(s) and not of MDPI and/or the editor(s). MDPI and/or the editor(s) disclaim responsibility for any injury to people or property resulting from any ideas, methods, instructions or products referred to in the content. |
© 2026 by the authors. Licensee MDPI, Basel, Switzerland. This article is an open access article distributed under the terms and conditions of the Creative Commons Attribution (CC BY) license.