


Abstract
The article investigates damage in textile-reinforced rubber conveyor belts caused by impact loading. The study aims to evaluate how impact conditions and belt structural properties affect severe damage formation and to develop predictive models for identifying critical operating conditions. Damage assessment was performed using visual inspection and computed tomography (CT), with CT serving as a reference method due to its ability to detect internal defects in the load-bearing carcass. CT identified more severe damage cases than visual inspection, confirming its higher sensitivity. Experimental tests were carried out with impact heights between 0.8 and 2.6 m and impact weights from 50 to 100 kg. The results showed that impact energy is the dominant factor influencing damage formation, as higher impact heights and weights significantly increased the probability of severe damage. Belt structural characteristics also affected damage resistance, especially the thickness of the top cover, which reduced the risk of failure. To predict severe damage, Logistic Regression, Random Forest, and XGBoost models were applied, all achieving excellent performance (AUC > 0.95). Logistic Regression (AUC = 0.994) additionally enabled the estimation of damage probability and the identification of critical impact conditions. The proposed approach supports safer operating limits, risk assessment, and predictive maintenance in conveyor systems.
1. Introduction
Belt conveyors are essential systems for continuous material transport. Their reliability primarily depends on the technical condition of the conveyor belt, which is exposed during operation to mechanical stress, abrasive wear, and impacts from foreign objects. These factors lead to damage ranging from surface cracks to failure of the load-bearing carcass, representing significant safety and economic risks [1,2]. Failure of a single conveyor can disrupt the entire system and cause production losses; therefore, effective maintenance management is essential [3]. Belt damage often results from inappropriate operating conditions or poor technical condition of the equipment [4]. In rubber–textile belts, damage caused by material impact at transfer points is dominant, and its extent depends on the absorbed energy influenced by belt construction, drop height, and material weight [5,6]. The nature of the damage is also affected by the belt type, material properties, and operating conditions [7], while its location may indicate unsuitable operating conditions [2,8].
Undetected damage represents a significant risk of failure and economic losses; therefore, predictive maintenance based on condition monitoring is increasingly used, enabling early identification of degradation and optimisation of maintenance strategies [9,10]. The integration of diagnostics with reliability models reduces unplanned downtime and increases system reliability [11], while accurate assessment of internal damage is crucial. In this context, analytical approaches and artificial intelligence methods are increasingly applied to support decision-making and reduce costs [3].
Traditional assessment is based on visual inspection, which is subjective and time-consuming; therefore, non-contact methods are being developed. However, their effectiveness depends on data quality and may be limited by noise and reduced visibility under harsh conditions [12,13]. Fault detection increasingly relies on machine vision and deep learning approaches, including CNN and YOLO architectures [14,15]. Alternative approaches include laser scanning [16], robotic systems [17], and non-destructive methods such as ultrasonic, magnetic, and infrared measurements [18], including systems such as DiagBelt [19] and sensor-based approaches [20]. Additional methods involve virtual reality [21], CenterNet models [22], FCSA-YOLOv10 [23], multimodal approaches [24], and X-ray image analysis [25], with a comprehensive review provided in [26].
However, these methods often focus on surface damage and do not provide sufficient information about the condition of the load-bearing carcass. Textile belts are composite materials whose degradation depends on fiber orientation, interface quality, and internal defects. Their analysis involves dynamic mechanical analysis (DMA), scanning electron microscopy (SEM), and nanoindentation [27], while ultrasonic and vibration-based methods also show potential [28]. Internal damage may occur without visible surface manifestations; therefore, X-ray, ultrasonic, magnetic, and terahertz techniques are employed [26].
X-ray computed tomography (CT) enables detailed analysis of the internal structure of composites, including fiber orientation [29], defects [30], and deformations [31], while industrial CT allows quantitative evaluation according to VDI/VDE 2630 [32]. In conveyor belt diagnostics, CT has been used to identify anomalies and carcass defects [33,34,35]. Machine learning is increasingly applied to process experimental data and identify nonlinear relationships between loading, belt construction, and damage [36,37]. These approaches are used in component diagnostics [38], digital twins [39], and real-time anomaly detection [40]. Ensemble algorithms such as Random Forest and XGBoost are applied for damage classification [41,42,43,44], degradation prediction [45], property analysis [46,47], and fault identification [48,49].
Despite significant progress in conveyor belt damage diagnostics, most existing approaches still focus on surface defects detected by visual or sensor-based methods, which provide limited information about the internal condition of the load-bearing carcass critical for belt failure. As a result, the relationship between impact loading, belt construction, and damage probability remains insufficiently explored, and severe damage probability or critical operating conditions are typically not quantified. This study addresses these gaps by integrating experimental impact testing, computed tomography (CT) as a ground-truth reference, and machine learning, using CT-based labels to train models that both classify damage and quantify its probability while capturing internal defects not observable through standard visual inspection. The aim of this paper is to experimentally analyze conveyor belt damage caused by impact loading, compare visual and CT-based evaluation, quantify the influence of loading parameters and belt construction on the occurrence of severe damage, and identify critical impact heights and weights associated with increased damage risk. The resulting dataset is used to develop predictive models (logistic regression, Random Forest, XGBoost) that estimate damage probability, support the definition of safe operating limits, and provide a basis for risk-informed decision-making in conveyor belt maintenance.
2. Materials and Methods
2.1. Tested Conveyor Belts
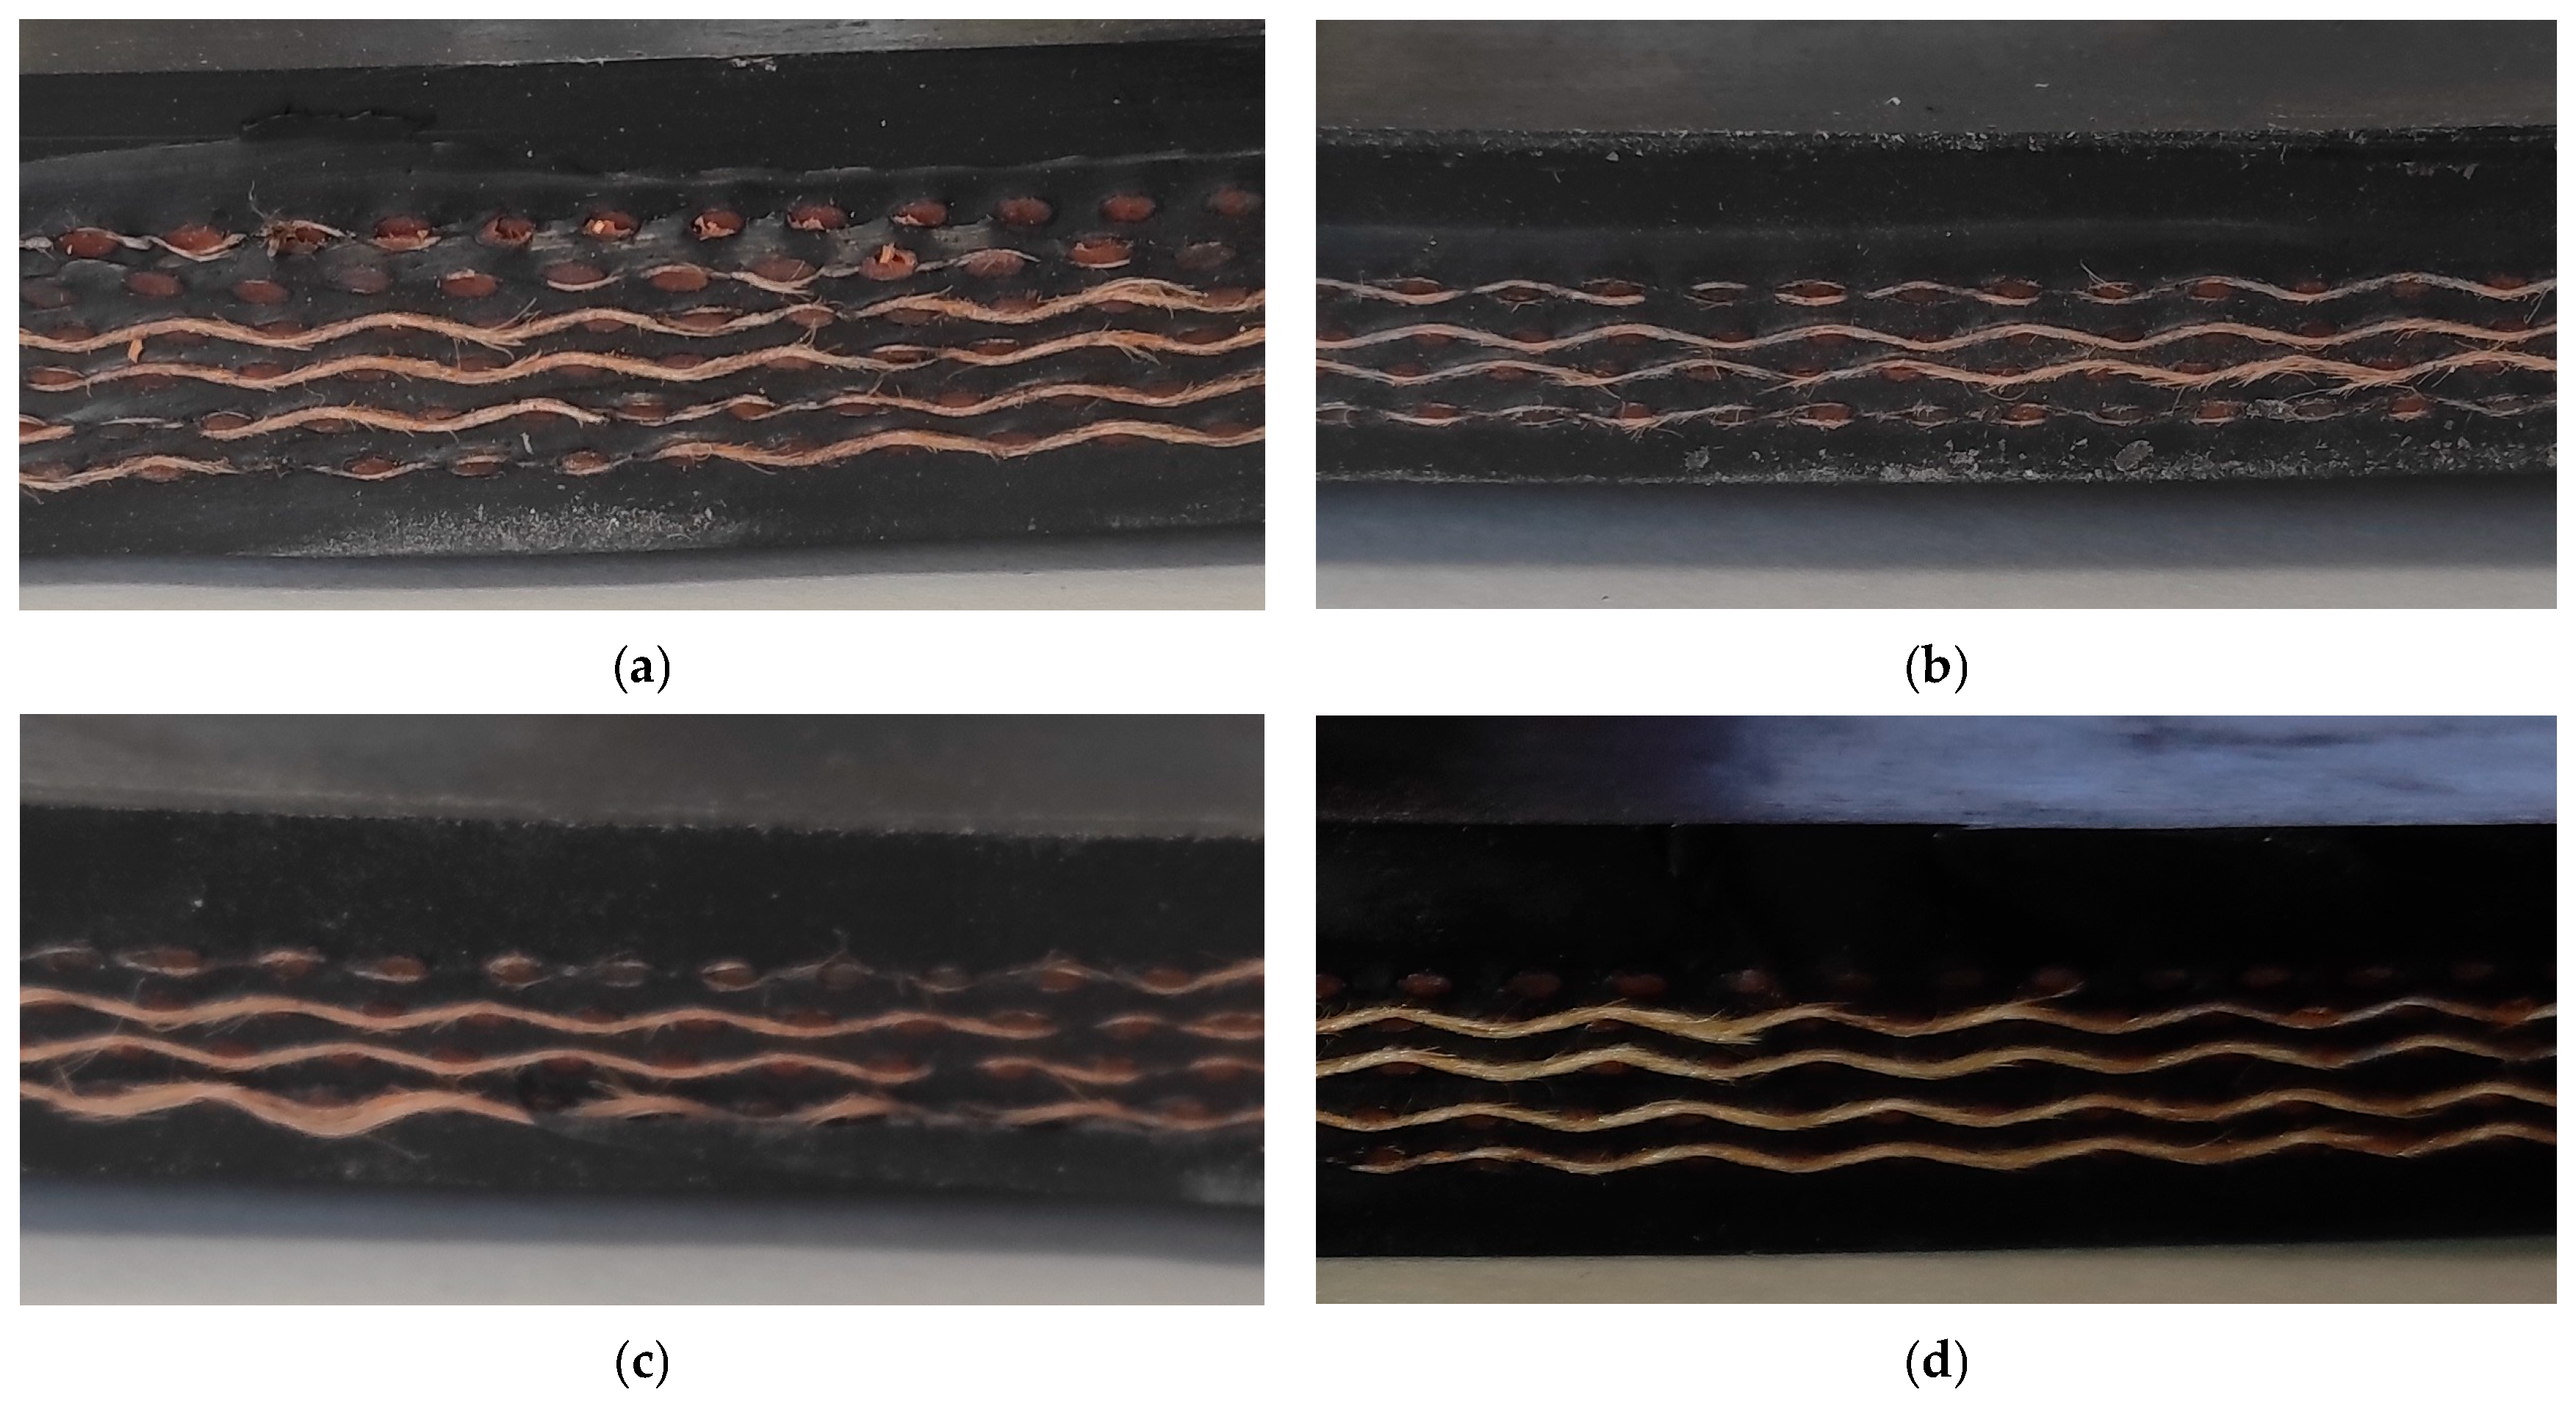
Four types of rubber–textile conveyor belts were used in the experimental investigation. Their basic parameters are summarized in Table 1. All belts belong to the P 1000 class and have the same nominal tensile strength; they differ only in the number of additional textile plies in the carcass and the thickness of the top cover rubber layer.
Table 1.
Conveyor belt types used in the study.
Designation of conveyor belt type:
- P denotes a polyamide textile carcass;
- 1000 represents the nominal tensile strength (N/mm), i.e., 1000 N per 1 mm of belt width;
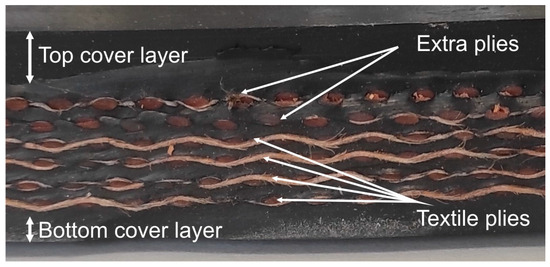
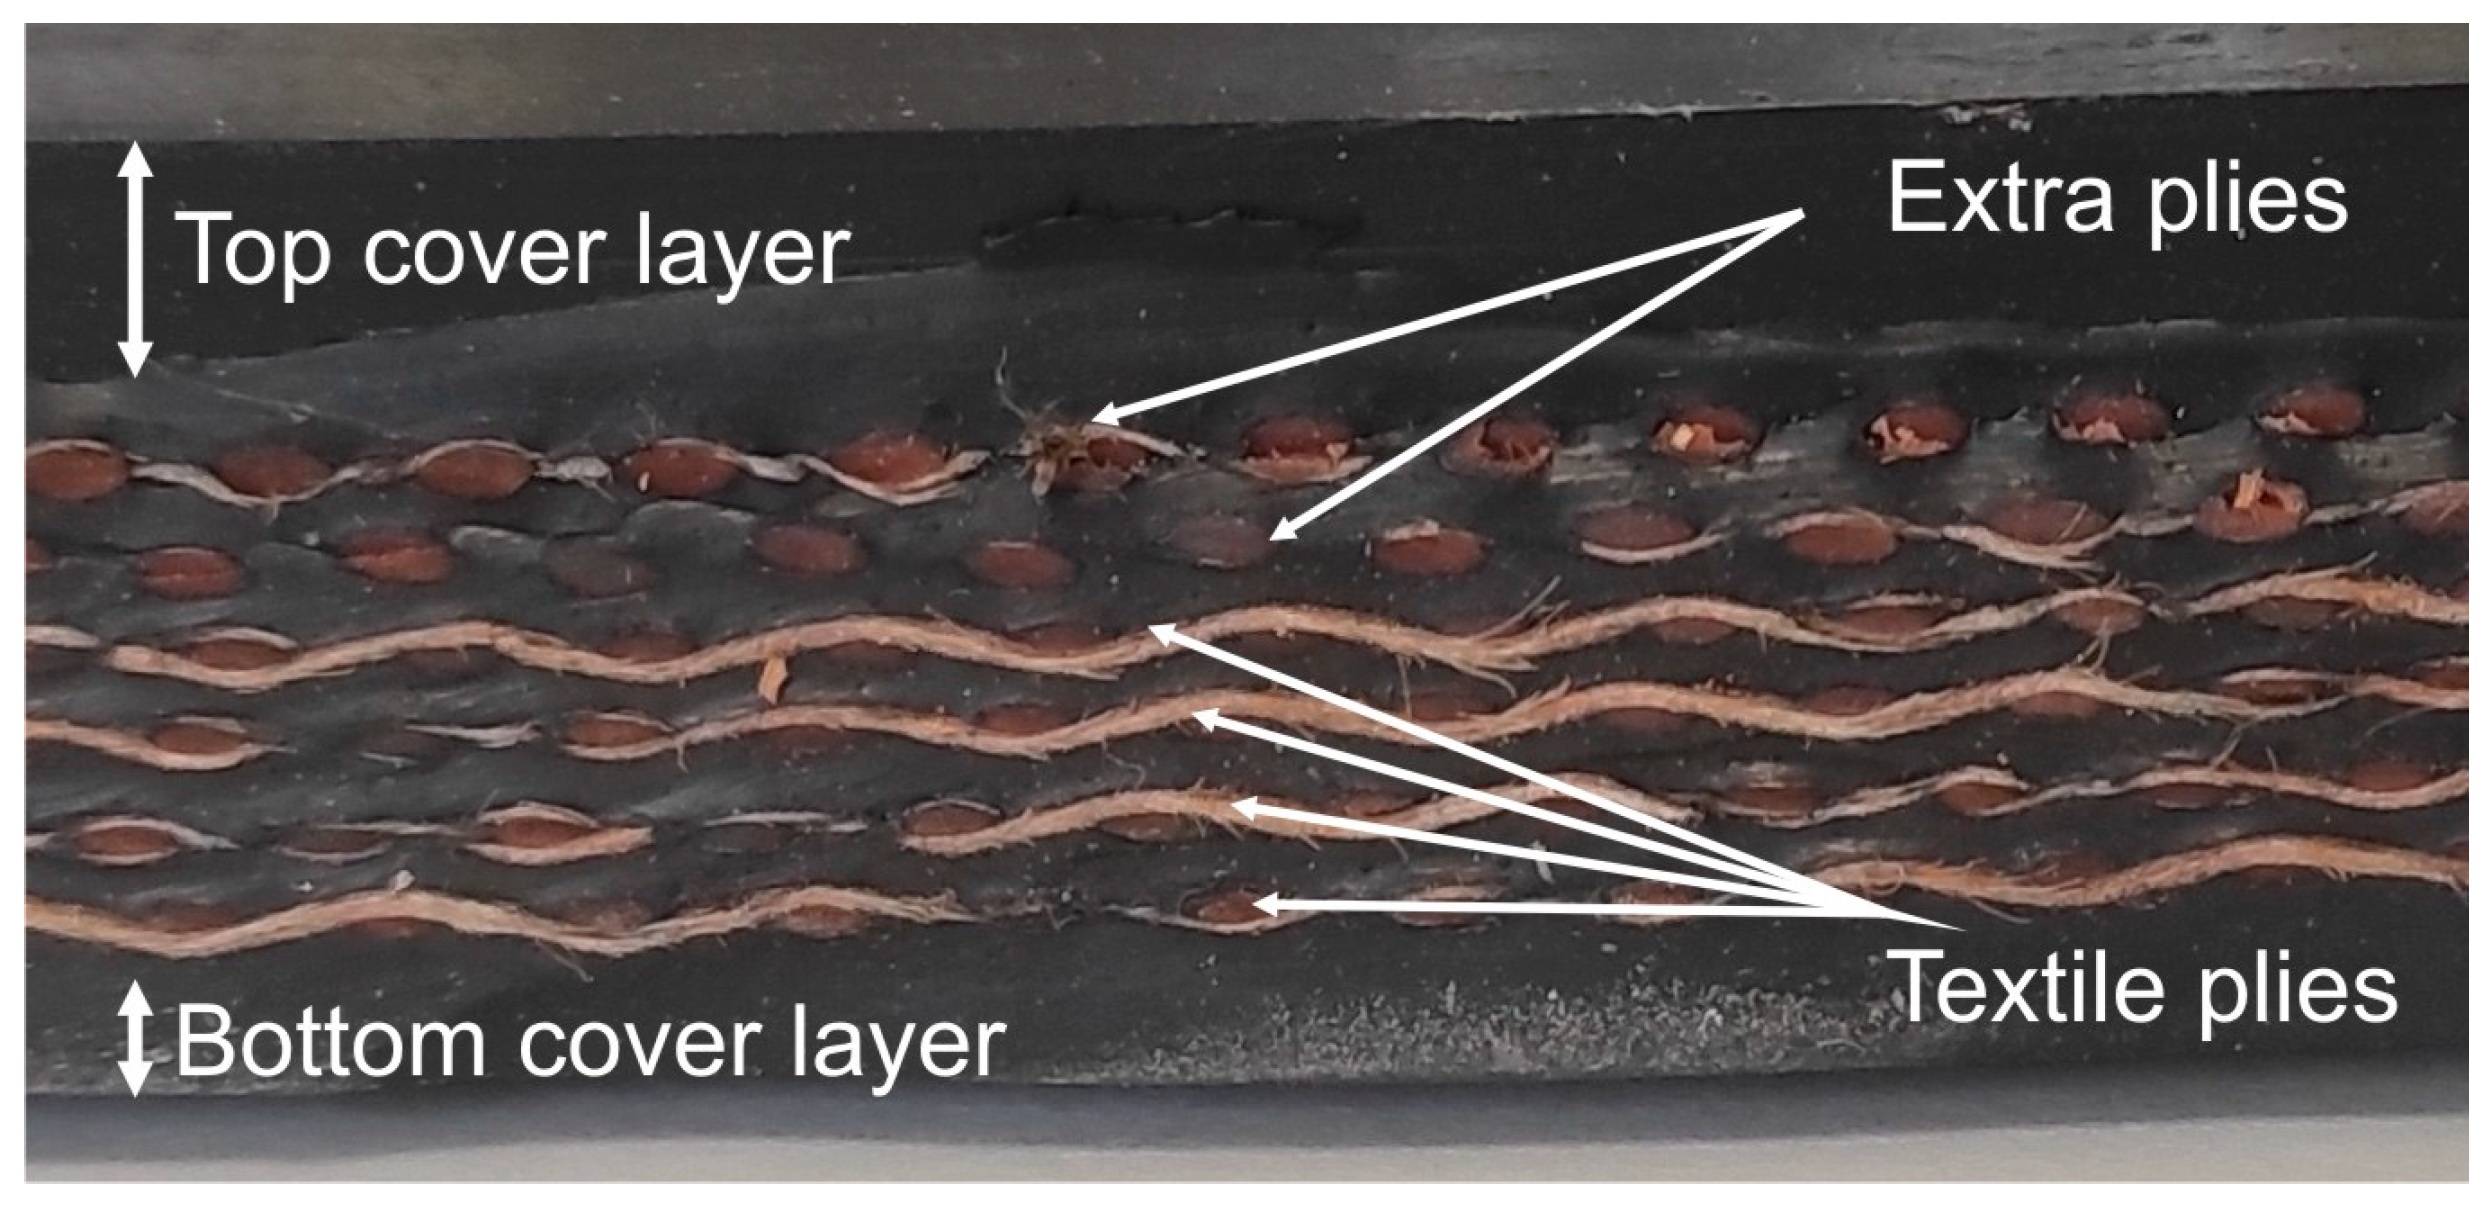
- 4 + 2 indicates the number of carcass layers (four basic textile plies and two additional plies) (Figure 1);
- 5 + 2 represents the thickness of the rubber cover layers (top and bottom cover) in millimetres;
- A denotes the quality class of the rubber compound (standard abrasion-resistant grade according to STN/ISO for moderate operating conditions).
Figure 1.
Internal structure of the conveyor belt.
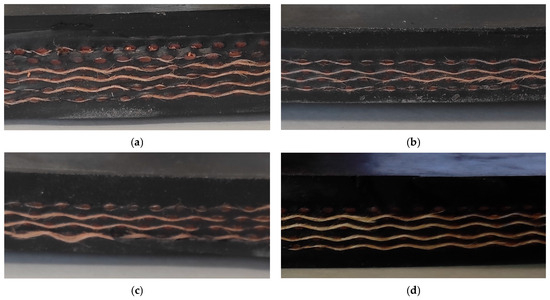
All tested belts are rubber–textile belts with identical tensile strength and four polyamide plies; they differ only in the number of reinforcement plies or the thickness of the top cover layer (Figure 2).
Figure 2.
Conveyor belts used in the study. (a) P 1000/4 + 2; 5 + 2 A; (b) P 1000/4 + 1; 5 + 2 A; (c) P 1000/4; 5 + 2 A; (d) P 1000/4; 6 + 2 A.
2.2. Damage Classification and Assessment Methods
During material impact, damage may occur up to complete penetration of all belt layers. The resistance of the belt depends on its ability to absorb impact energy; exceeding this capacity leads to severe damage. Damage typically manifests on the top cover (scratches, punctures, perforations) and on the bottom cover (cracks, bulging), and may affect the carcass, thereby reducing reliability. For the purpose of analysis, the tested samples were classified into two categories based on the resulting damage level (Table 2). A more detailed classification of damage types is provided in [7]. The category non-severe damage (D0) represents damage that does not require immediate removal of the conveyor belt from operation. In contrast, severe damage (D1) represents damage that may lead to partial or complete failure of the belt.
Table 2.
Classification of samples according to the degree of damage.
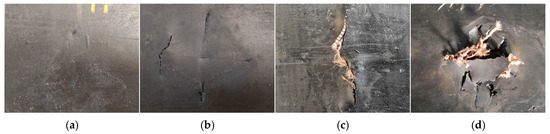
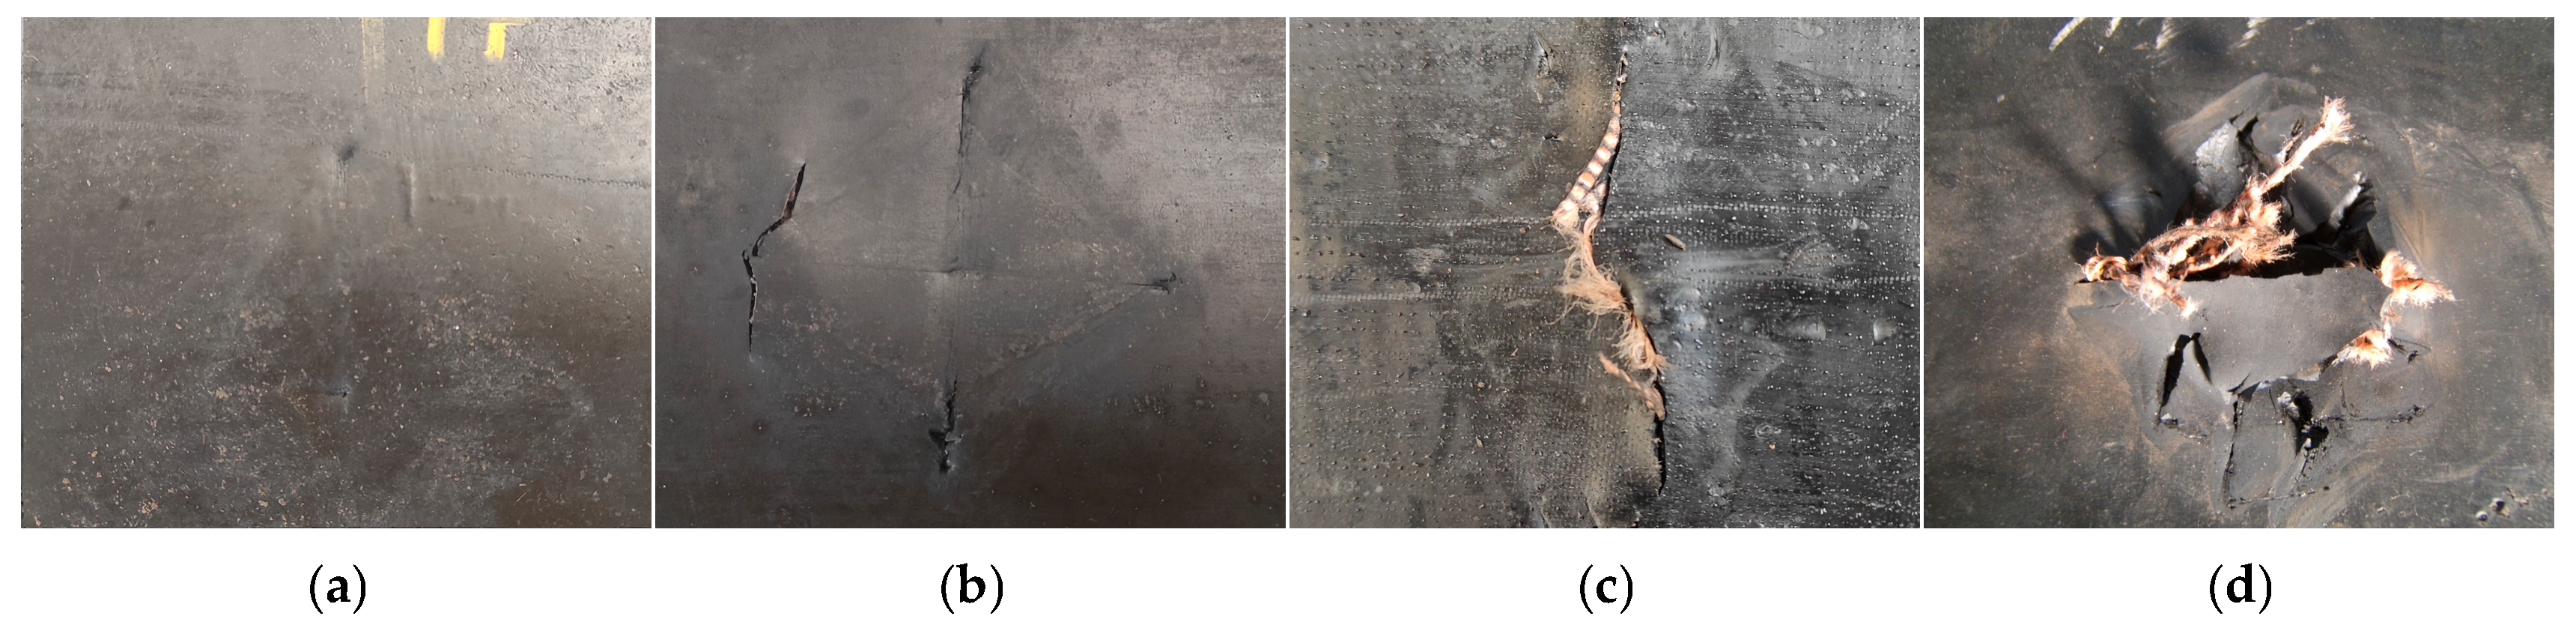
Examples of damage observed during the experiments are shown in Figure 3.
Figure 3.
Examples of damage. (a) Non-severe damage; (b) crack in the top cover layer; (c) complete damage of the top cover layer; (d) belt puncture.
The degree of damage to the conveyor belt was evaluated within the experimental investigation using two complementary methods: visual damage assessment (DamageVis) and assessment using computed tomography (DamageCT).
- Visual assessment (DamageVis)—visual inspection of the surface (top/bottom cover, visible carcass defects), commonly used in practice.
- Computed tomography assessment (DamageCT)—computed tomography used as a reference method, enabling the detection of internal damage. CT images of the examined samples were acquired using a SOMATOM go. The top device manufactured by Siemens Healthineers.
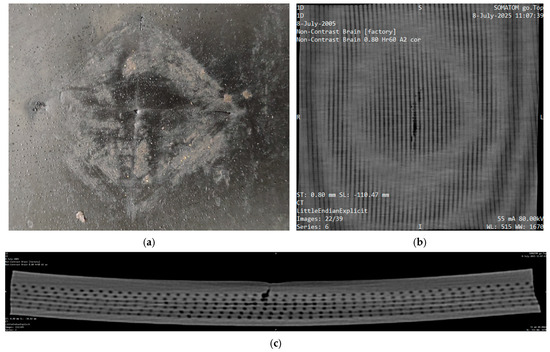
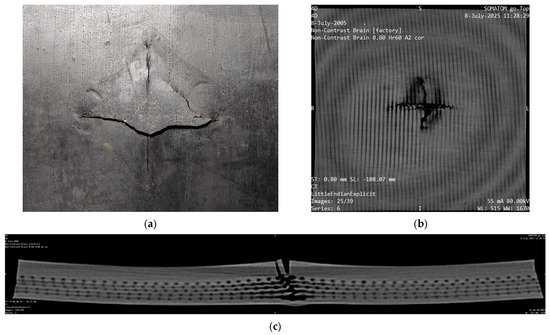
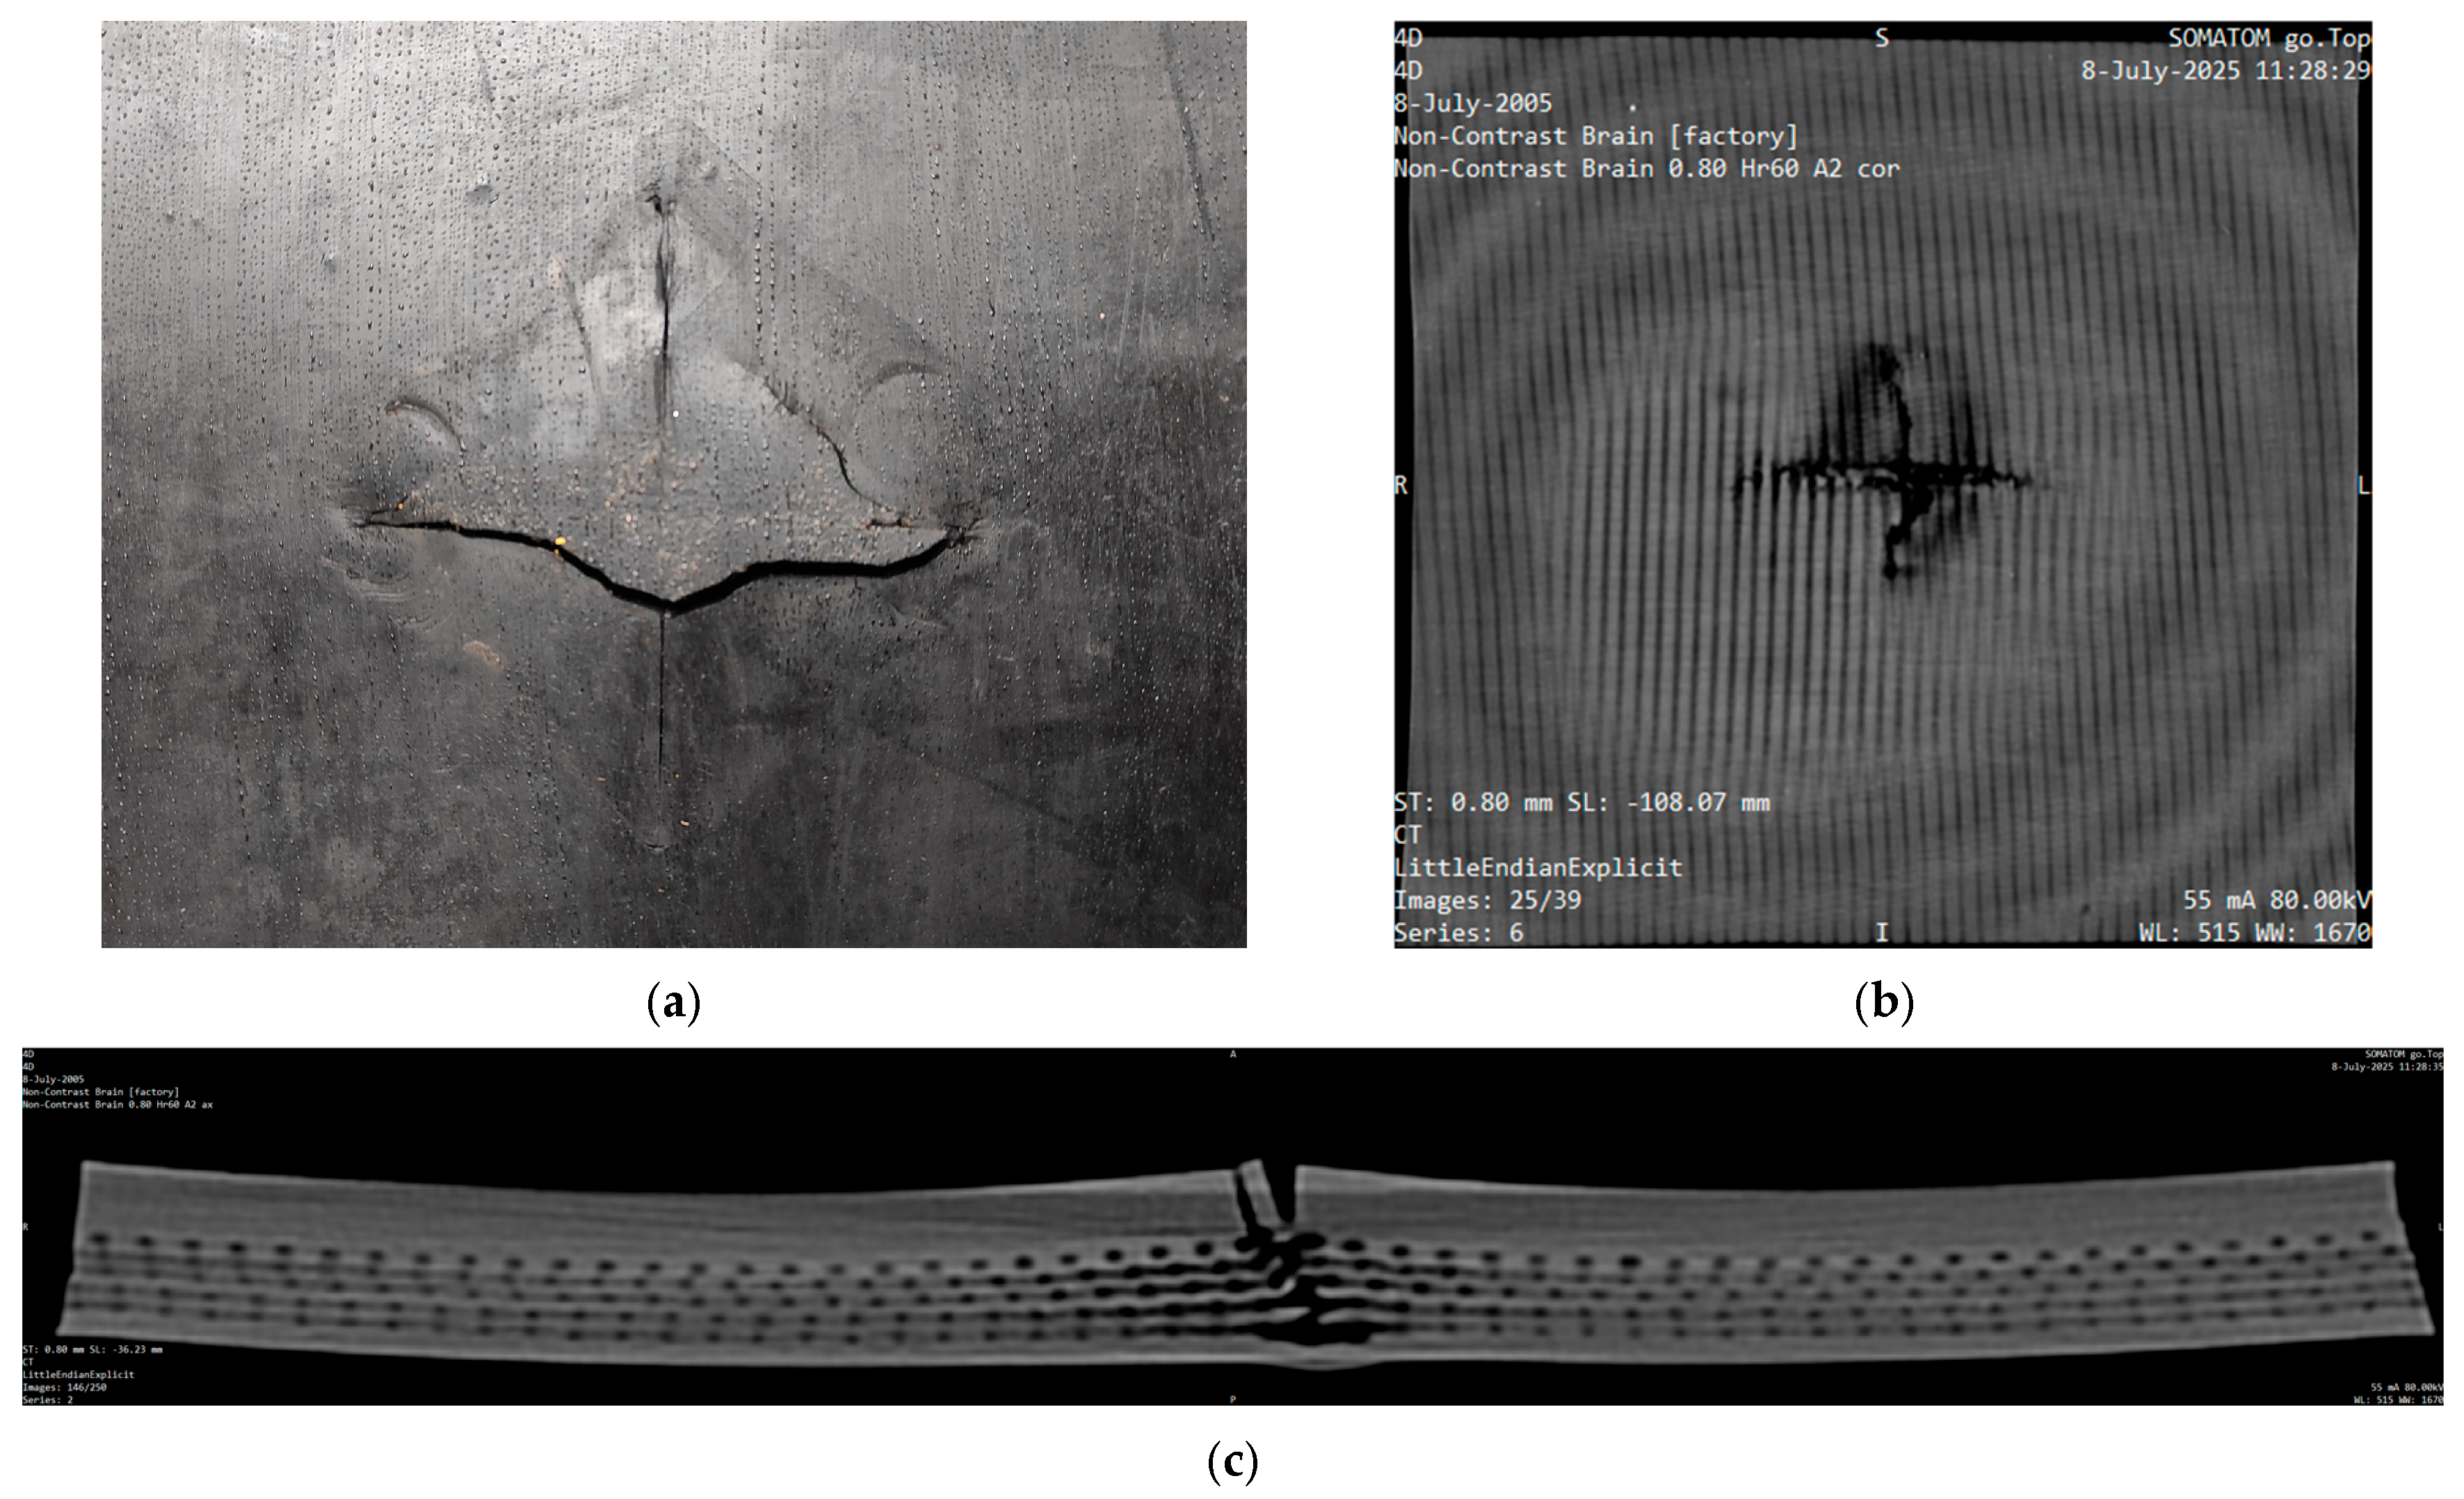
Figure 4 shows a visual and CT view of a belt without severe damage, illustrating the difference between surface visual assessment and imaging of the internal belt structure using CT.
Figure 4.
Comparison of damage visualization methods. (a) Visual view of the damage; (b) CT view; (c) CT cross-section of the conveyor belt.
2.3. Methods of Experimental Research
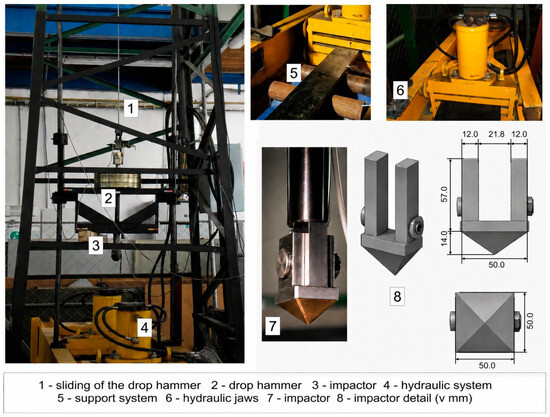
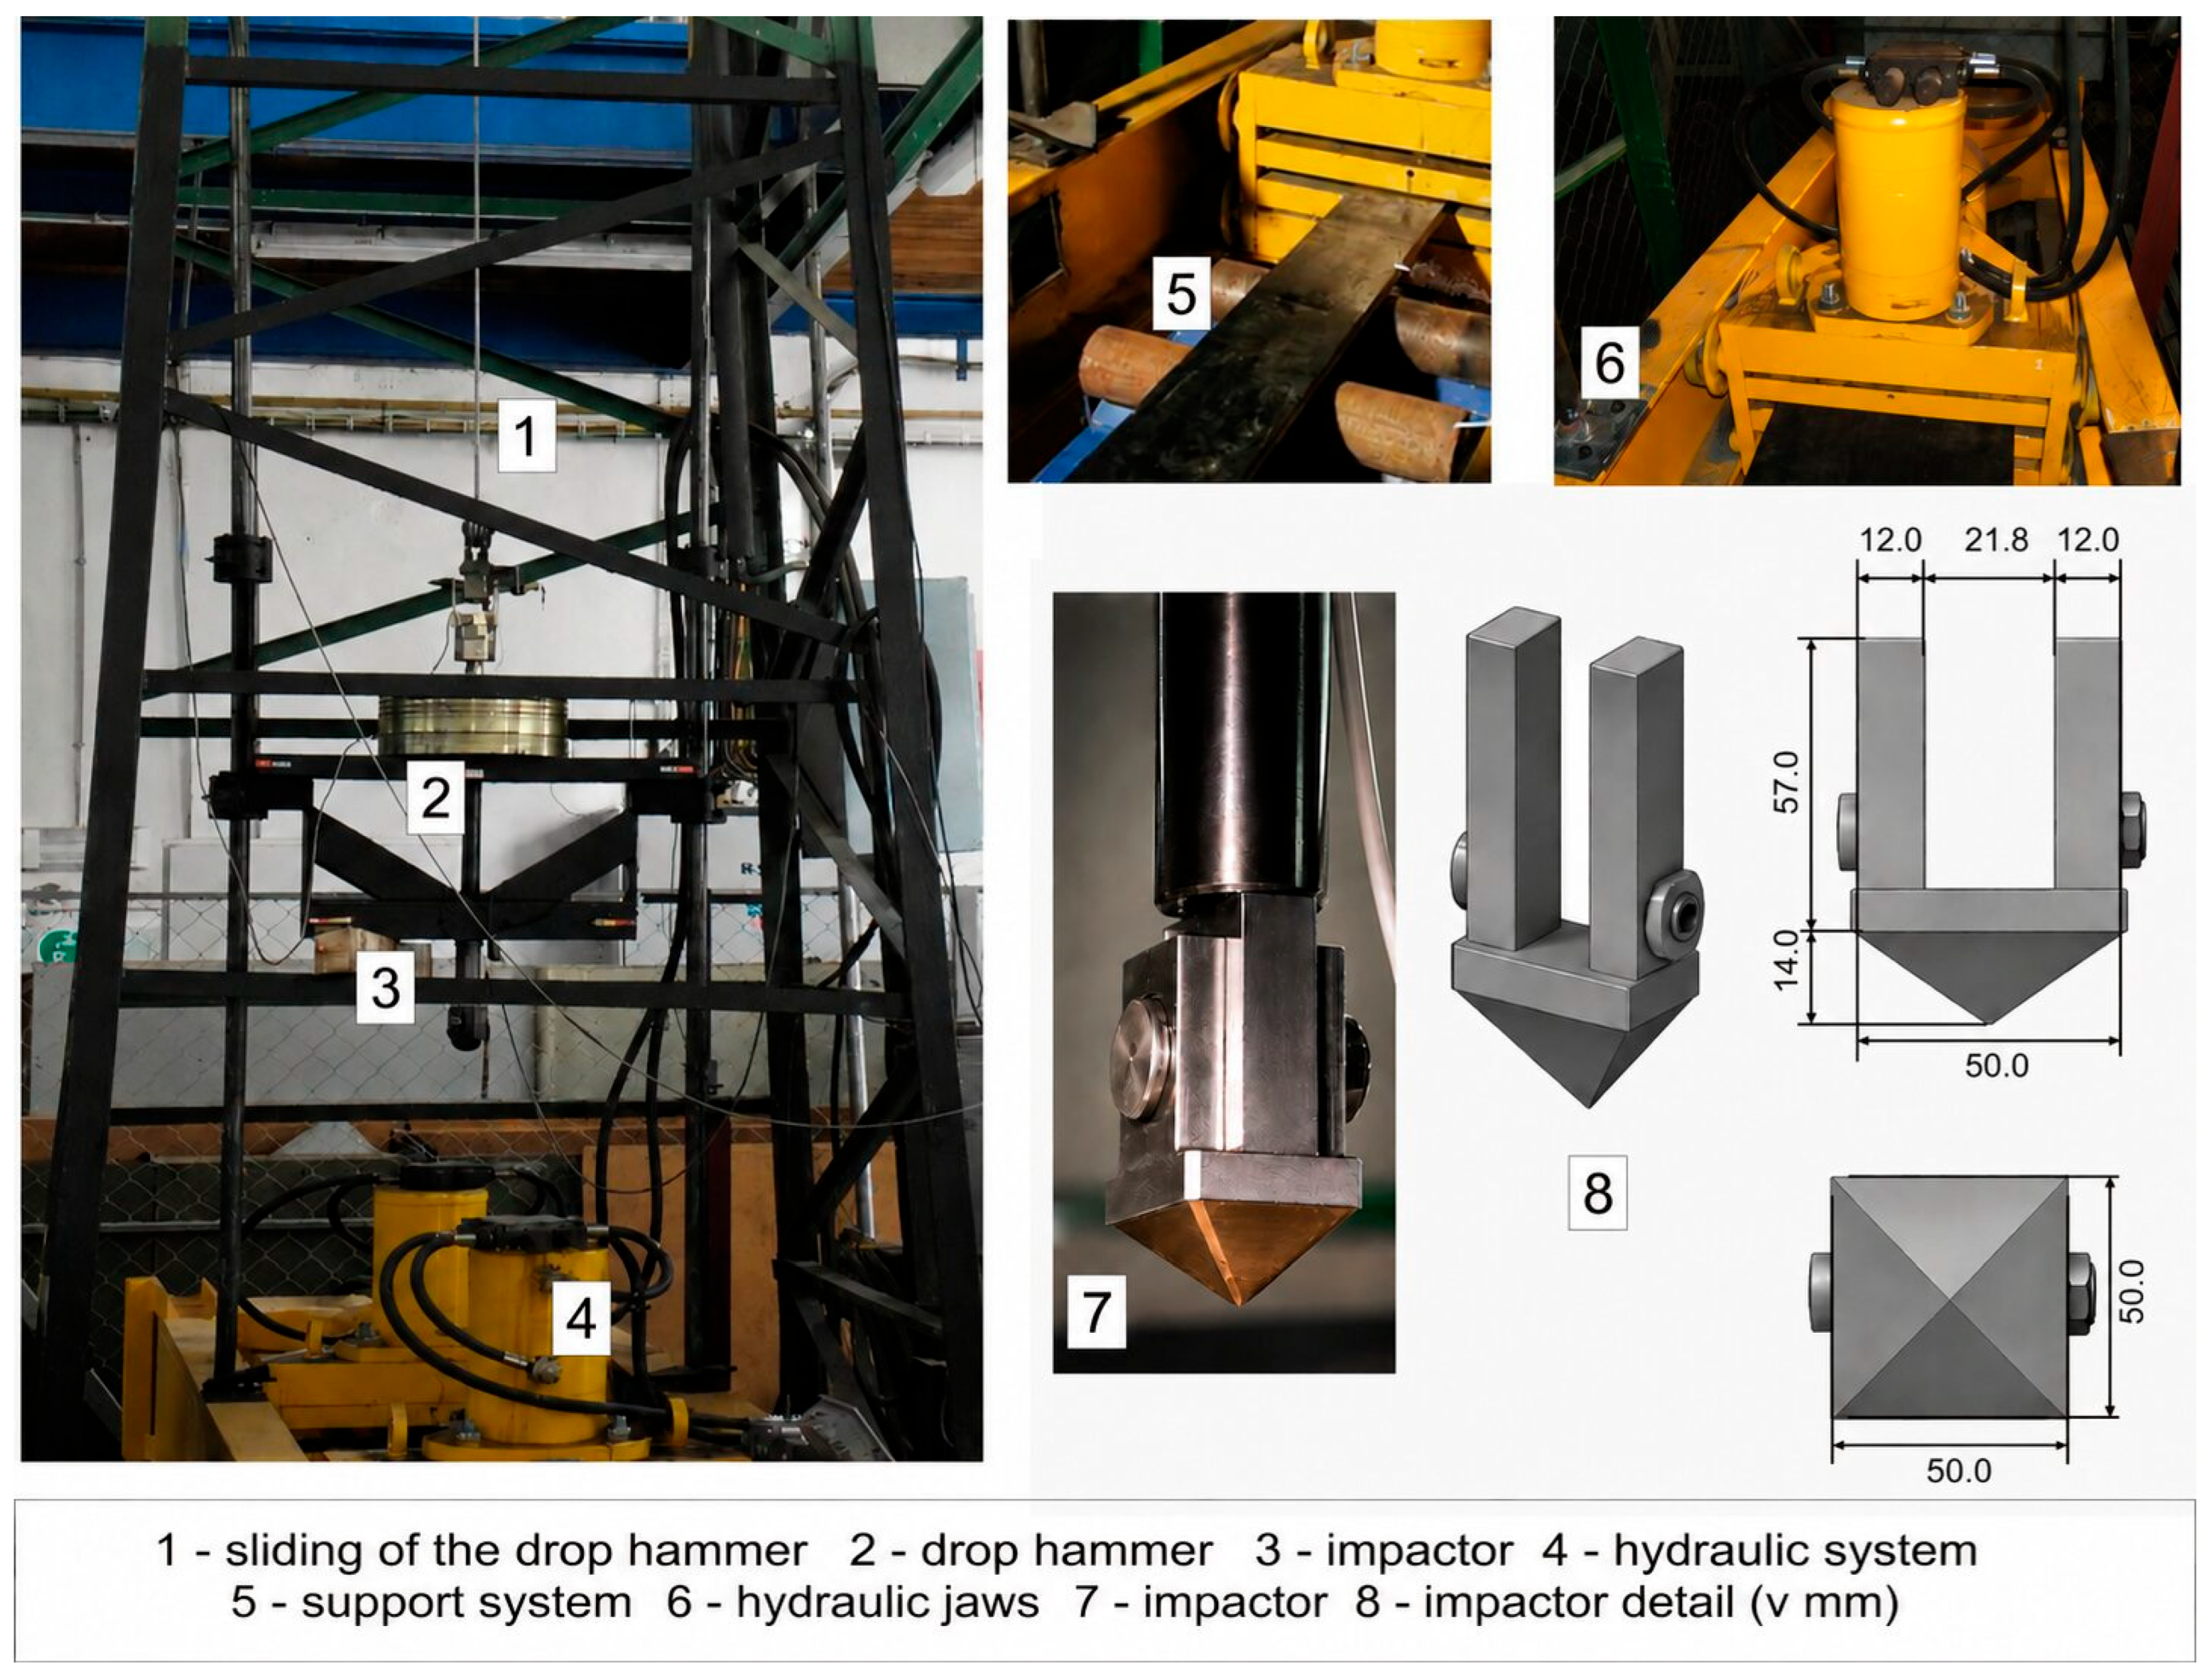
The experimental investigation was carried out using a test device shown in Figure 5, designed to simulate the impact of material on a conveyor belt. It is a drop-weight testing device in which a weight falls from a defined height onto a test specimen clamped on a testing table. The weight of the impactor is adjustable in the range of 50–300 kg, and the impact energy is varied by a combination of drop height and weight; the lower part of the impactor is equipped with interchangeable impactors. In all experiments, a steel pyramid-shaped impactor was used to ensure consistent material properties and impact geometry throughout the test campaign. The impactor was fitted with a pyramidal steel tip designed to concentrate the impact force onto a small contact area, thereby reproducing critical impact-loading conditions commonly encountered in industrial conveyor systems (Figure 5). The test specimen is clamped between hydraulic jaws, pre-tensioned by a force corresponding to approximately one-tenth of the nominal tensile strength of the belt and subsequently loaded by the falling impactor. After each test, the extent of damage is visually evaluated and the relevant measured variables are recorded for further analysis of the relationships between input parameters and damage level.
Figure 5.
Test device.
From a physical perspective, the severity of impact loading is primarily governed by the potential energy of the falling impactor, which can be approximated by E = mgh, where E is the potential energy (J), m is the impactor weight (kg), g is the gravitational acceleration, and h is the impact height (m). Consequently, both impact height and impactor weight directly influence the energy transferred to the conveyor belt during impact. For this reason, Height and Weight were selected as the primary input variables in the predictive models. The experimental design enabled the systematic evaluation of the influence of these loading parameters, together with belt structural characteristics, on the occurrence of severe damage.
Preparation of test specimens was performed from sampled rubber–textile conveyor belts in accordance with applicable standards. From each sample, test specimens with dimensions of 1400 × 200 mm were cut from regions evenly distributed across the belt width, maintaining a minimum distance of 100 mm from the edges. The experimental procedure was identical for all tests. The specimen was placed on a support system consisting of two steel rollers (diameter 80 mm, centre distance 160 mm) and tensioned with a force of 20 kN. The support configuration and impact conditions were selected to represent typical loading conditions encountered at conveyor belt transfer points in industrial practice. The impactor with a pyramidal tip was dropped between the rollers at weights of 50–100 kg and impact heights of 0.8–2.6 m (step 0.2 m). After each impact, the damage was visually assessed and assigned to the corresponding measurement; in the case of belt perforation, no further impact tests were performed on the given specimen.
2.4. Predictive Modelling and Model Evaluation
Three approaches were used to develop predictive models of conveyor belt damage: logistic regression, Random Forest, and XGBoost. These methods enable analysis of the relationship between operating conditions and the probability of severe damage occurrence. Logistic regression models the probability of severe damage based on selected input variables; model significance was verified using the likelihood ratio test, and parameter significance was assessed using the Wald test. Random Forest and XGBoost, as ensemble methods, were used to capture nonlinear relationships and interactions between variables, as well as to determine the relative importance of input features. These methods were selected to include an interpretable linear model (logistic regression) and two widely used tree-based ensemble methods capable of capturing nonlinear relationships and interactions between the input variables. The aim of this study was not to provide an exhaustive benchmark of all available classification algorithms (e.g., SVM, LightGBM), but rather to demonstrate the feasibility of constructing practically applicable predictive models for estimating the probability of severe belt damage.
The models were trained on a training dataset, while class imbalance was addressed using the ROSE method. Subsequently, the models were evaluated on an independent test dataset with the original class distribution preserved. Model performance was assessed using accuracy, precision, sensitivity (recall), F1-score, area under the ROC curve (ROC-AUC), and Cohen’s kappa coefficient. Particular emphasis was placed on sensitivity, as misclassification of severe damage as non-severe represents a critical failure from the perspective of operational safety. The analysis of experimental data and development of predictive models were performed in the R environment (version 4.4.3) using the libraries caret, randomForest, xgboost, ROSE, and dplyr.
3. Results
This chapter presents the results of the impact tests and the analysis of damage occurrence in rubber–textile conveyor belts. The experimental tests were carried out with the aim of:
- Analyze the occurrence of damage levels in conveyor belts (Section 3.1);
- Define the input and output variables of the study (Section 3.2);
- Develop and evaluate predictive models (Section 3.3);
- Predict the probability of severe damage and identify critical impact conditions (Section 3.4).
3.1. Evaluation and Analysis of Damage Occurrence
The degree of conveyor belt damage at the impact location was evaluated using two independent methods: visual assessment and computed tomography (CT)-based evaluation. The corresponding output variables, DamageVis (visual assessment) and DamageCT (CT-based evaluation), were defined as binary variables, where a value of 0 represents non-severe damage (D0) and a value of 1 represents severe damage (D1) (Table 3 and Table 4). Both methods were applied to 240 samples (60 from each belt type).
Table 3.
Results of experimental testing (damage type/conveyor belt type)—DamageVis.
Table 4.
Results of experimental testing (damage type/conveyor belt type)—DamageCT.
Based on visual assessment, 197 samples (82.1%) were identified as non-severe damage (DamageVis = 0) and 43 samples (17.9%) as severe damage (DamageVis = 1). The highest occurrence of severe damage was observed for belt type CB3 (33.3%), followed by CB2 (25.0%). In contrast, CB1 and CB4 exhibited a lower proportion of severe damage (5.0% and 8.3%, respectively).
The results of damage evaluation based on CT (DamageCT) are presented in Table 4. Out of 240 analysed samples, 166 samples (69.2%) were classified as non-severe damage (DamageCT = 0) and 74 samples (30.8%) as severe damage (DamageCT = 1). The highest occurrence of severe damage was observed for belt types CB2 and CB3, where the proportion of damaged samples reached 43.3%, while CB1 and CB4 exhibited lower proportions (20.0% and 16.7%, respectively). Compared to visual assessment, the CT-based method identified a higher number of severe damage cases across all belt types.
A direct comparison of both assessment methods is shown in Table 5. Of the 197 samples visually classified as non-severe damage (DamageVis = 0), 166 samples (84.3%) were also confirmed by CT (DamageCT = 0). All samples visually identified as severe damage (DamageVis = 1) were also confirmed by CT (DamageCT = 1). However, 31 samples (15.7%) were classified as severe damage by CT (DamageCT = 1), although they did not show clear signs of severe damage during visual inspection. These cases indicate the limited sensitivity of visual assessment in identifying less apparent or internal damage of the load-bearing carcass. The agreement between the methods was κ = 0.66 (substantial agreement), while CT detected more severe cases than visual assessment, indicating its higher sensitivity. Differences were mainly observed at higher impact heights and weights and also depended on the belt type.
Table 5.
Comparison of damage assessment methods.
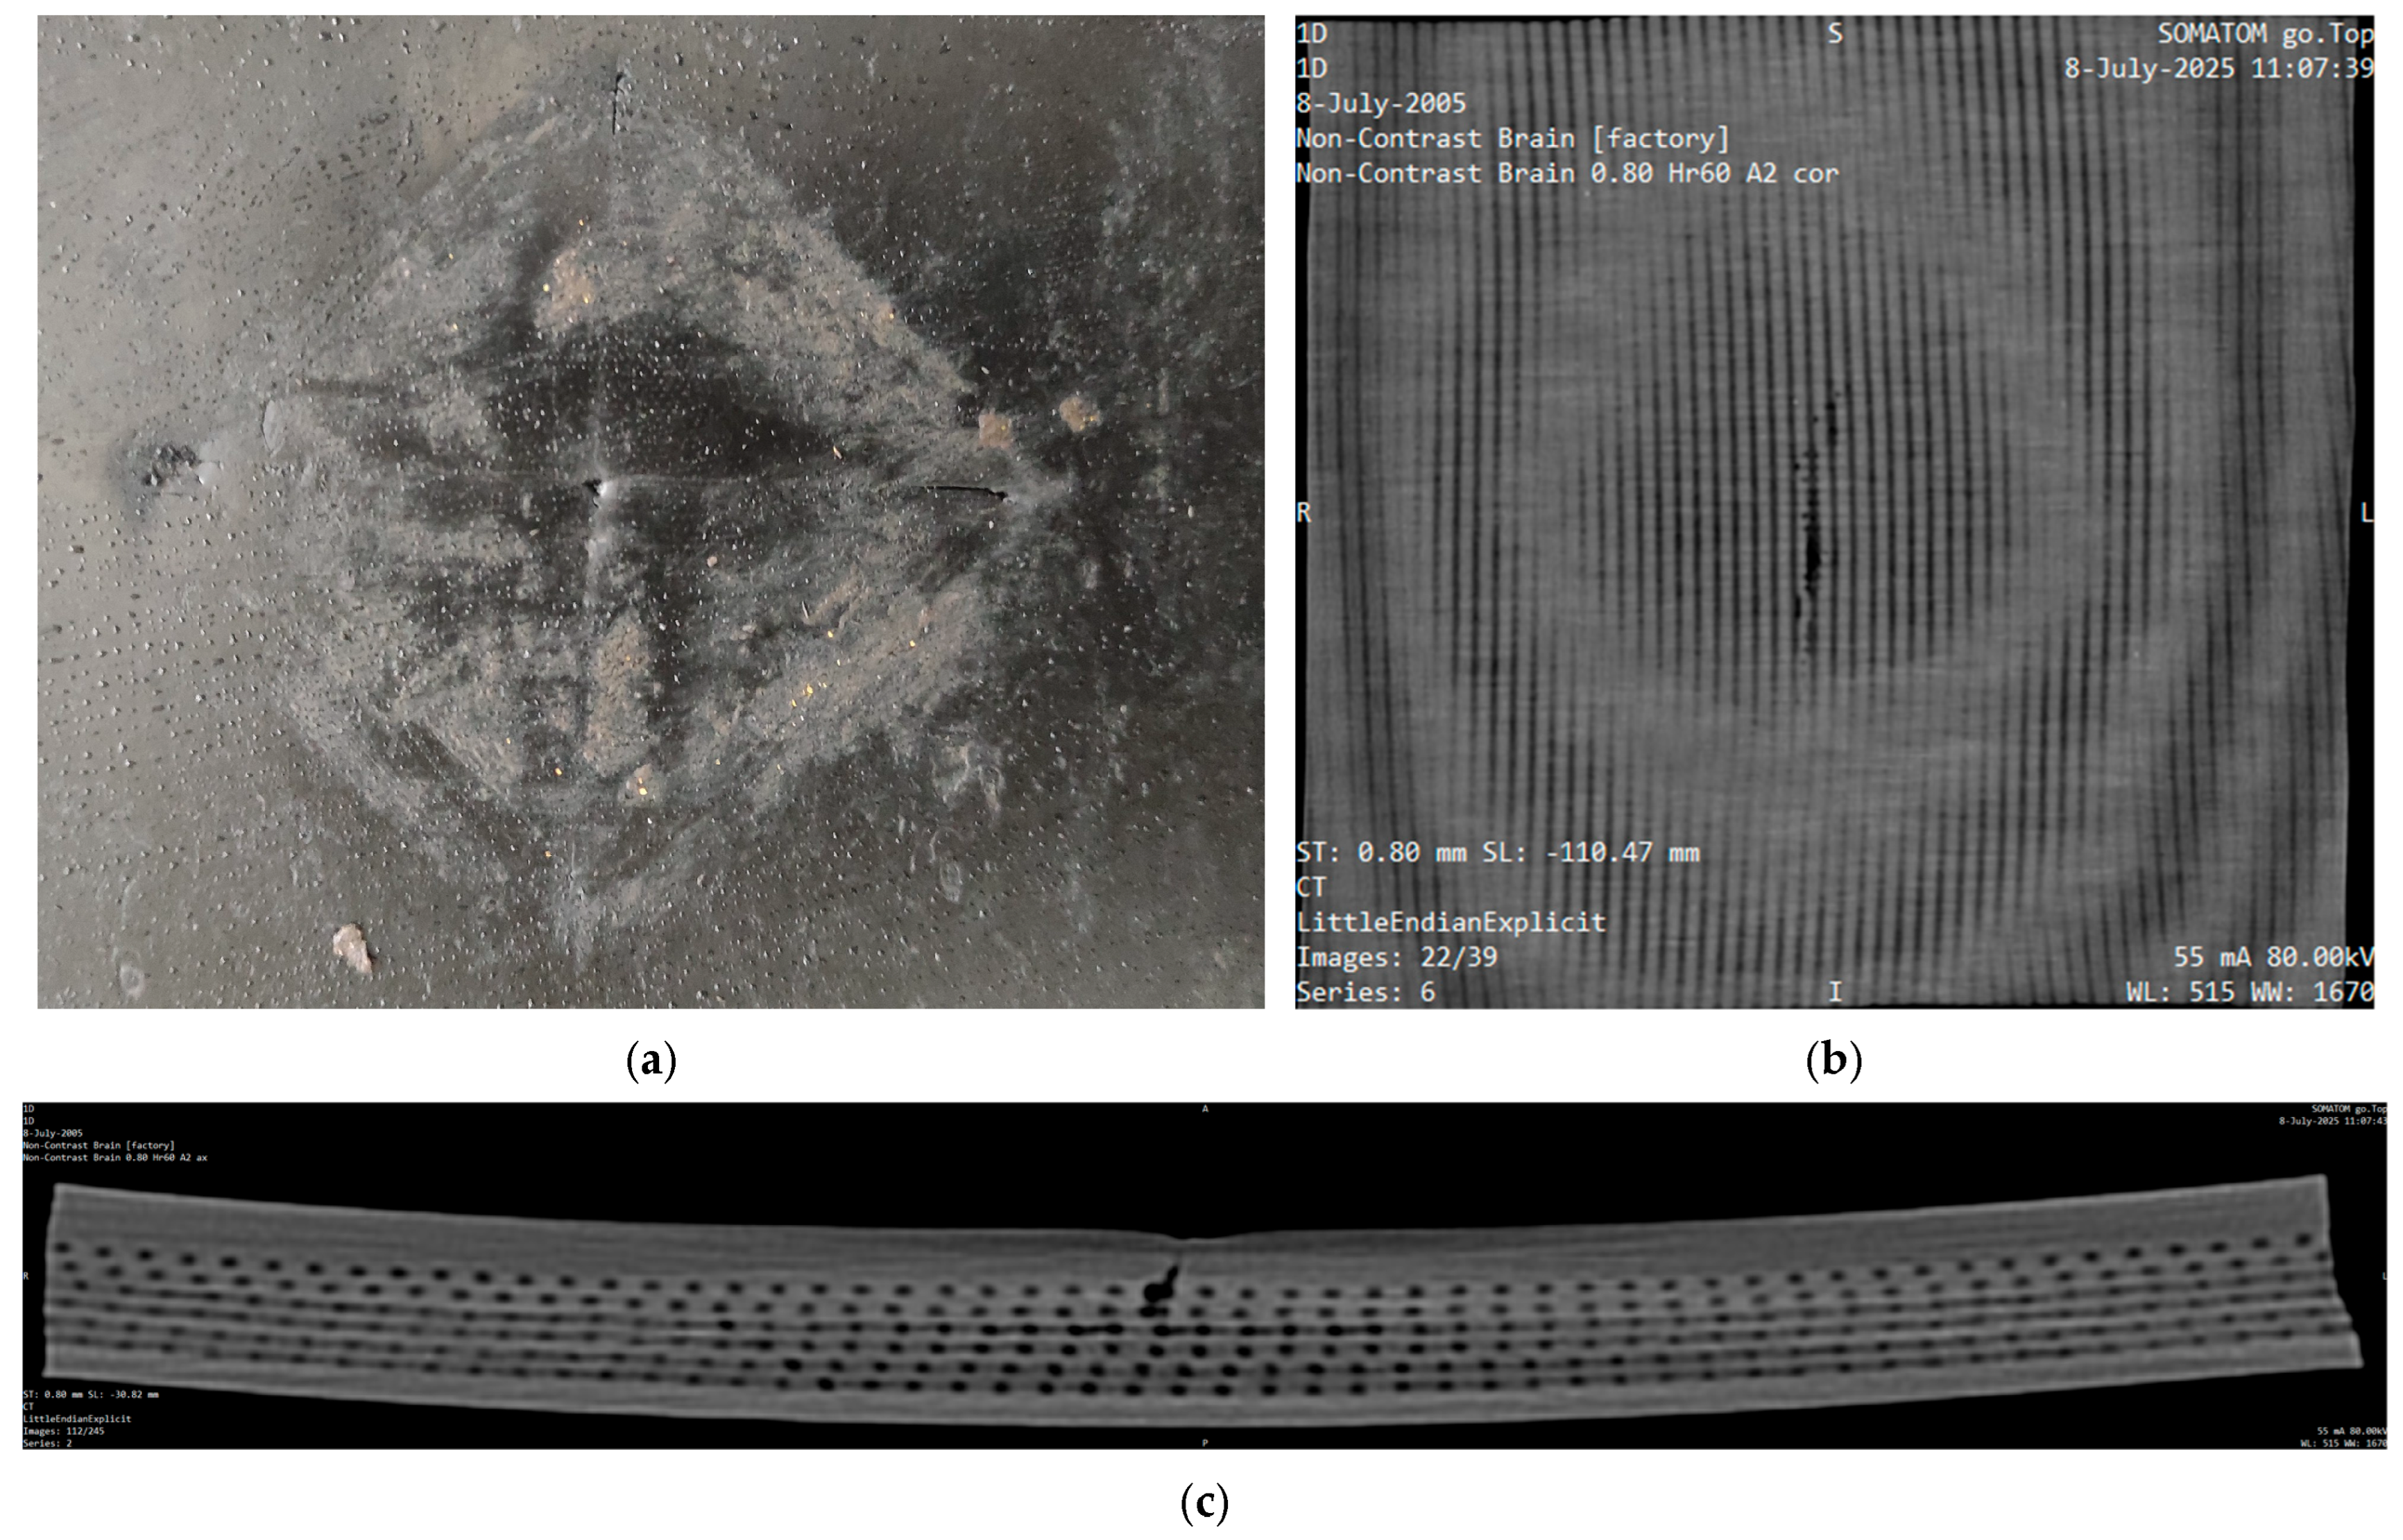
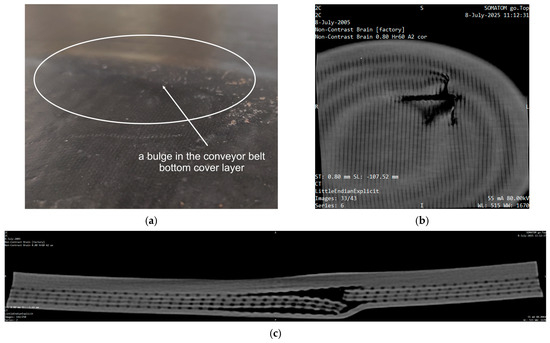
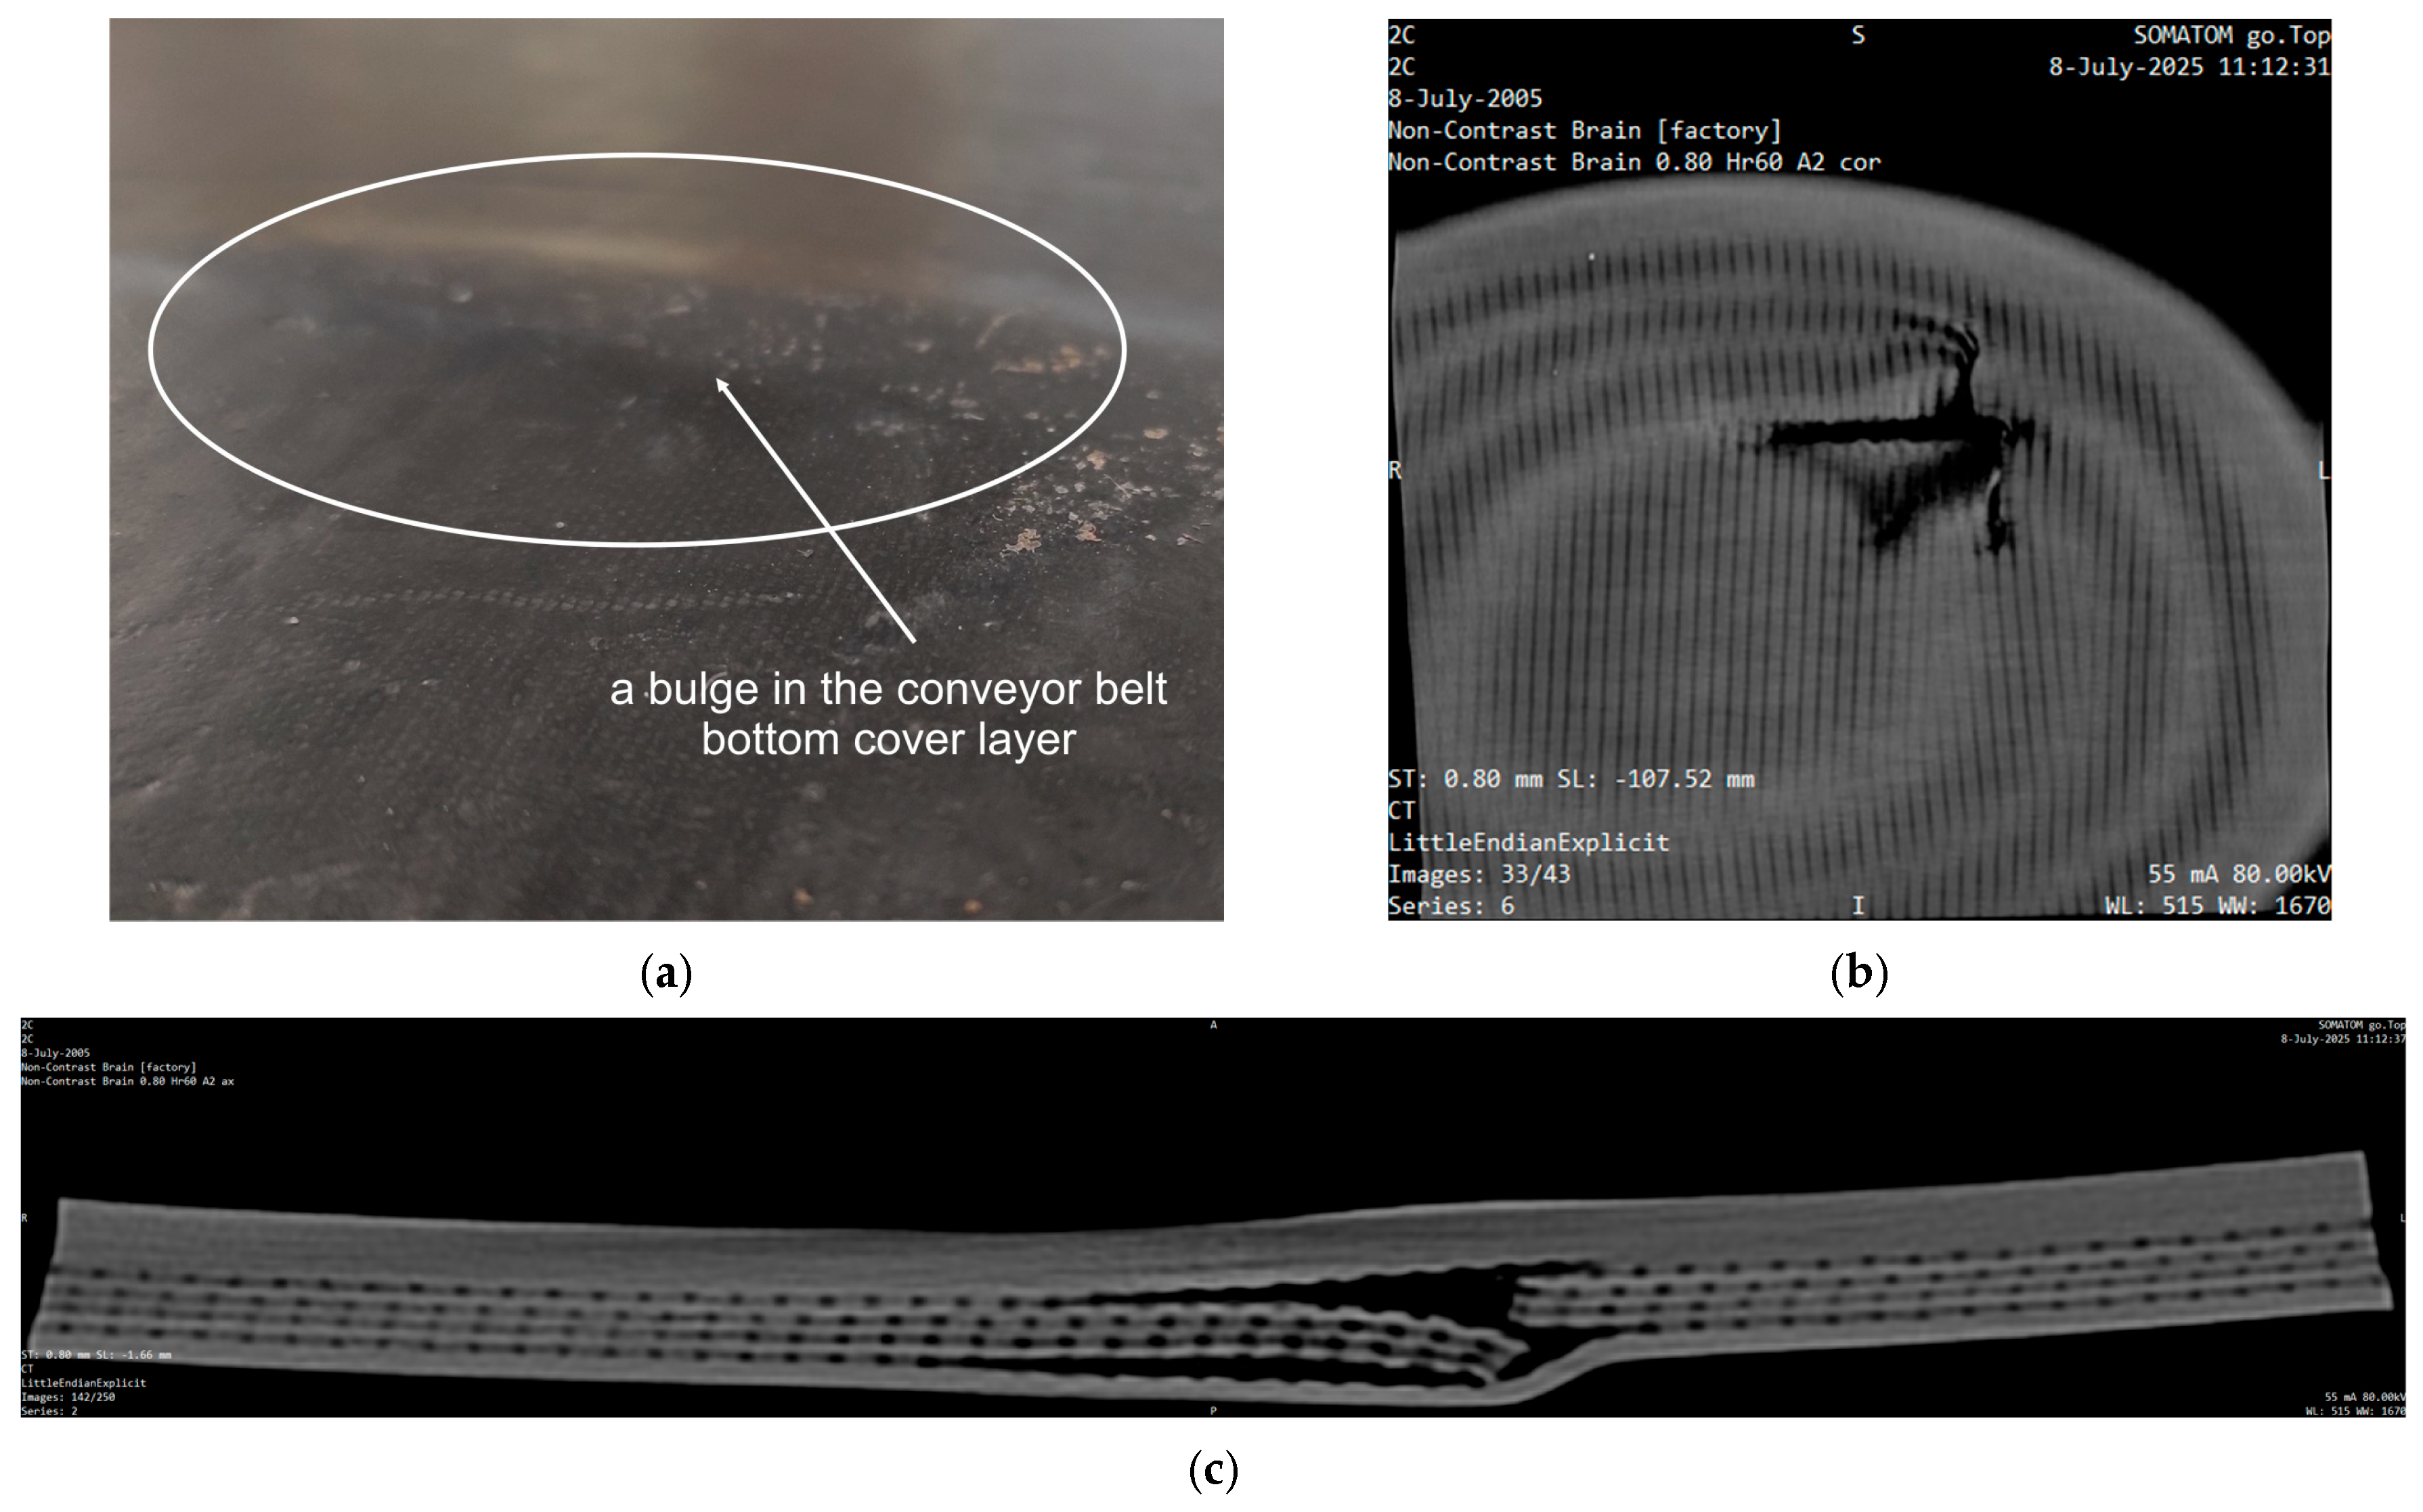
Differences between visual damage assessment and CT-based evaluation are illustrated in Figure 6 and Figure 7. The figures document cases where visual inspection (Figure 6a and Figure 7a) classified the damage as non-severe (DamageVis = 0), while computed tomography (Figure 6c and Figure 7c) revealed internal damage of the load-bearing carcass, classified as severe damage (DamageCT = 1).
Figure 6.
Damage to the conveyor belt. (a) Visual view of damage; (b) CT view; (c) CT cross-section of the conveyor belt.
Figure 7.
Damage to the conveyor belt. (a) Visual view of the bottom cover (visible bulging); (b) CT view; (c) CT cross-section of the conveyor belt.
The results indicate that visual assessment has a limited ability to identify internal damage in conveyor belts. Although all samples classified as severe damage by the visual method were also confirmed by CT, a significant proportion of samples were identified as severely damaged by CT despite the absence of visible surface damage. This discrepancy highlights the risk of underestimating the actual technical condition of the belt when relying solely on visual inspection and underscores the importance of using more accurate diagnostic or predictive tools.
3.2. Selection and Characterization of Input Variables
The aim of the study is to quantify the influence of impact loading and structural parameters on conveyor belt damage caused by material impact. The target output variable was defined as DamageCT, since CT-based evaluation provides a more objective assessment of the actual damage level, including internal defects of the load-bearing carcass. The input variables were divided according to their nature into impact loading parameters and structural parameters of the conveyor belt. The primary input variables describing impact loading were defined as follows:
- Height (m)—the impact height from which the impactor with a defined tip is released onto the conveyor belt sample. The variable ranged from 0.8 m to 2.6 m with a step of 0.2 m.
- Weight (kg)—the weight of the falling impactor, ranging from 50 kg to 100 kg with a step of 10 kg.
In the initial analysis, the conveyor belt type (Type) was also considered as an input variable. However, since it does not allow direct physical interpretation, it was replaced by fundamental structural characteristics. The nominal tensile strength (P 1000) and the bottom cover thickness (2 mm) were identical for all tested belts and were therefore excluded from the model. The following structural parameters were used as input variables:
- PliesExtra—number of additional textile plies; values: 0, 1, or 2.
- TopCover (mm)—thickness of the top rubber cover layer; values: 5 mm or 6 mm.
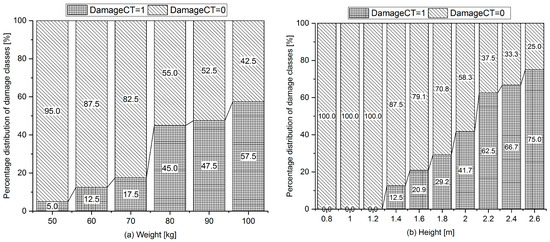
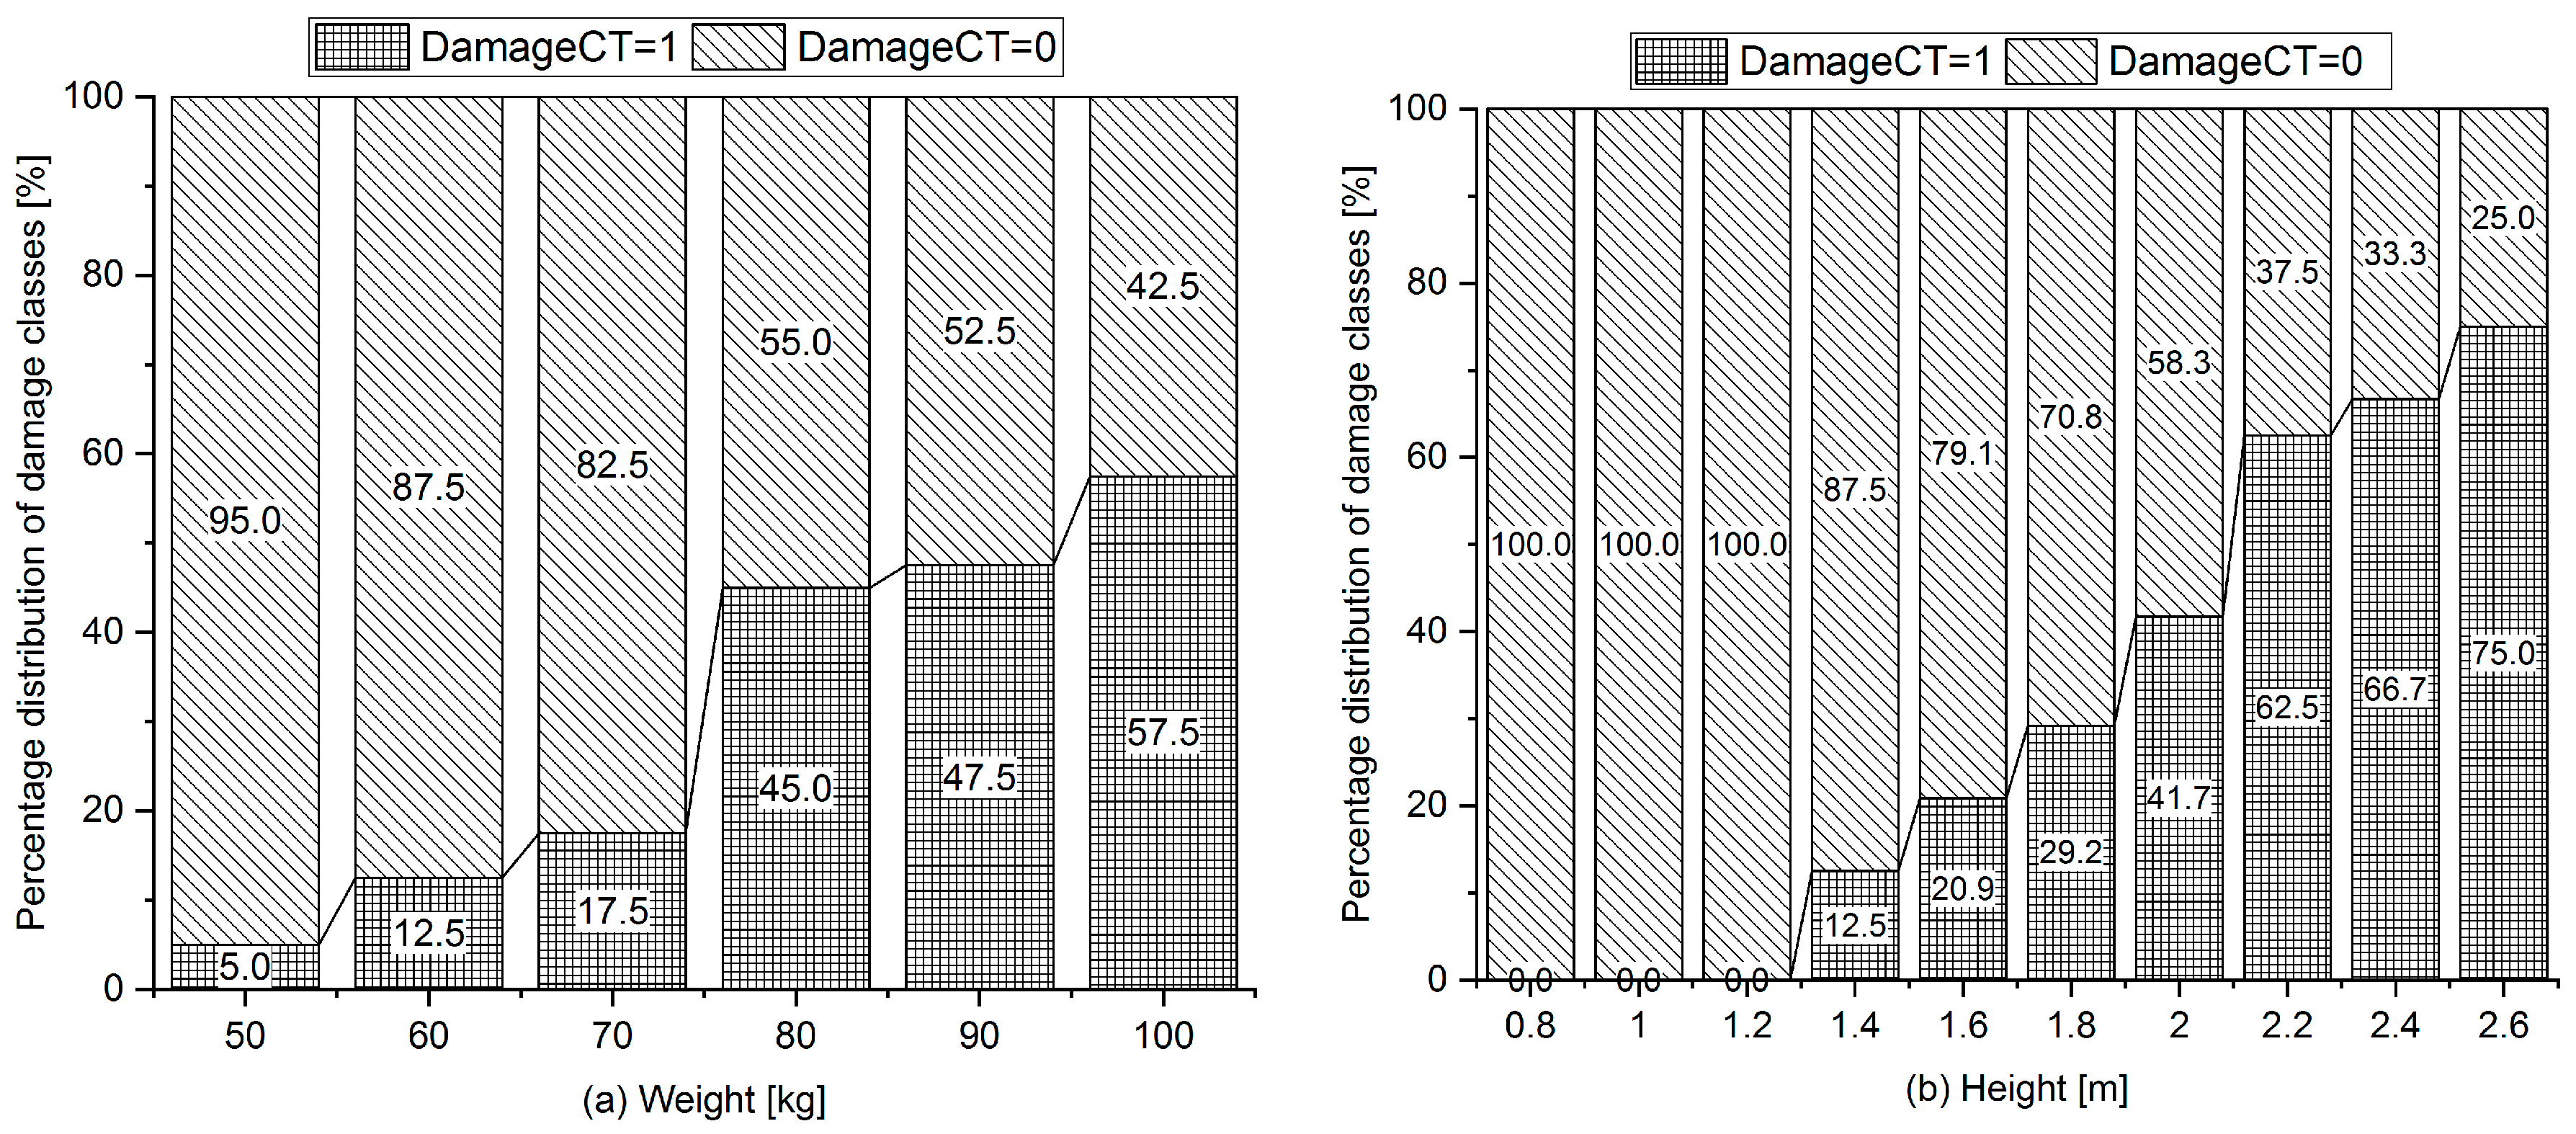
The analysis of severe damage occurrence (DamageCT) as a function of impact loading parameters is presented in Figure 8 and Figure 9.
Figure 8.
Percentage distribution of damage classes (DamageCT) depending on (a) weight and (b) impact height.
Figure 9.
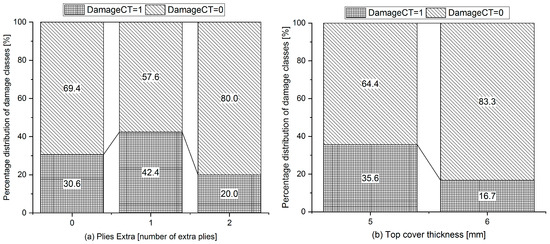
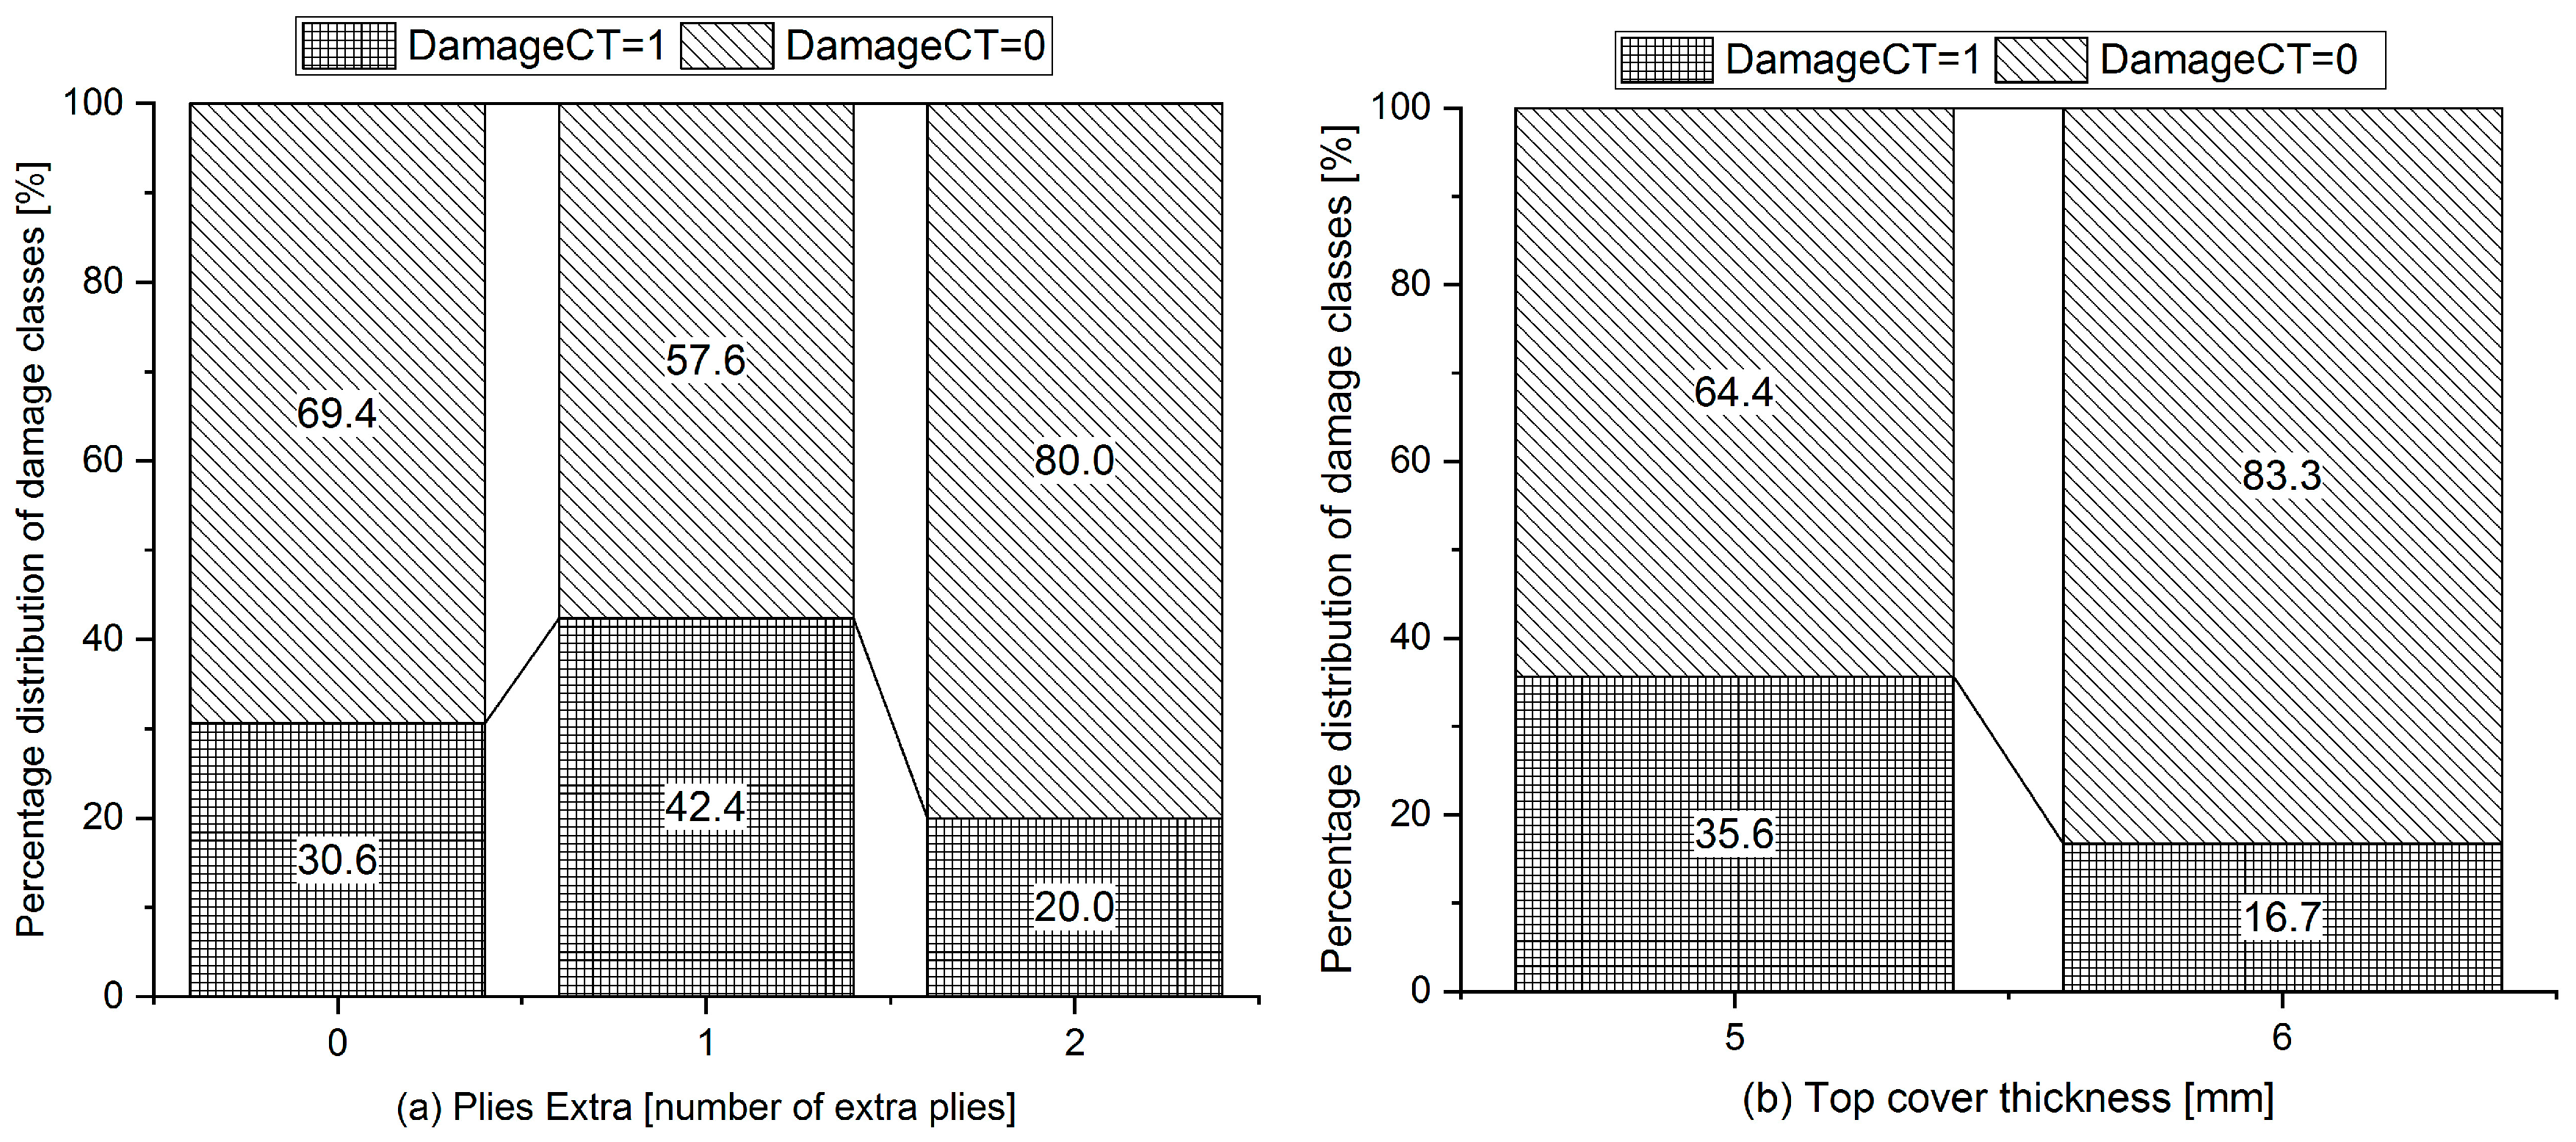
Percentage distribution of damage classes (DamageCT) depending on (a) number of extra plies (PliesExtra) and (b) top cover thickness (TopCover).
The results show that increasing impact height and impactor weight leads to an increase in the percentage of severe damage (DamageCT = 1) across all analysed samples. Impact loading has a dominant influence (Figure 8).
- Weight of the falling impactor (Weight): With increasing weight, the proportion of severe damage increases significantly. At the lowest weight (50 kg), the occurrence of severe damage was minimal (≈5%), whereas at the highest weight (100 kg), the proportion of damaged samples reached approximately 57.5%. This trend confirms the effect of impact energy, which increases the stress on the load-bearing carcass with increasing weight (Figure 8a).
- Impact height (Height): With increasing impact height, a systematic increase in the proportion of severe damage detected by CT is observed. While no severe damage was recorded at low heights (up to approximately 1.2 m), a significant increase occurs at higher levels; for example, at a height of 2.6 m, the proportion of damaged samples reaches approximately 75% (Figure 8b).
The results also indicate a synergistic effect of weight and impact height, as their combined increase leads to a sharp rise in the occurrence of severe damage. This confirms that impact energy is the decisive factor.
Structural parameters (PliesExtra, TopCover) act as modifiers of the impact resistance of the conveyor belt, and their protective effect can be quantified through the percentage distribution of damage classes (DamageCT) (Figure 9).
- Number of extra plies (PliesExtra): The resistance increases nonlinearly. The use of one additional ply did not lead to the expected reduction in severe damage occurrence (CT). In contrast, the use of two additional plies resulted in a significant decrease in the occurrence of class D1 to 20.00%, likely due to a more uniform redistribution of stress among the layers (Figure 9a).
- Top cover thickness (TopCover): Increasing the thickness by 1 mm (from 5 to 6 mm) proved to be a key factor in impact energy absorption. CT evaluation showed a reduction in severe damage occurrence by more than half (from 35.56% to 16.67%). The thicker rubber layer more effectively distributes contact stresses, thereby protecting the load-bearing carcass from critical tensile loading during impact (Figure 9b).
The final set of input and output variables used for machine learning modelling is presented in Table 6.
Table 6.
Input and output variables used for machine learning modelling.
The variables defined in this way represent the fundamental physical and structural factors influencing the magnitude and distribution of impact energy within the conveyor belt structure. Their combination makes it possible not only to quantify the effect of individual parameters on damage formation but also to develop predictive models capable of estimating the probability of severe damage occurrence, which is essential for reliability assessment and the implementation of predictive maintenance in conveyor systems.
3.3. Predictive Modelling
The objective of the modelling was to identify the relationship between impact loading parameters, structural characteristics of the conveyor belt, and the probability of severe damage occurrence. Particular emphasis was placed on the ability of the models not only to correctly classify damage but also to quantitatively estimate its probability, enabling their use in determining critical operating conditions. The relationships between the input variables and the target variable DamageCT were analysed using logistic regression, Random Forest, and XGBoost.
The full dataset comprised 240 samples (60 per belt type), with 166 cases (69.2%) labelled as non-severe damage (D0) and 74 cases (30.8%) as severe damage (D1) according to CT-based evaluation, which reflects the minority nature of severe damage in the experiment. The experimental data were randomly split in an approximate ratio of 70:30 into a training dataset (169 samples) and a test dataset (71 samples), while preserving the original class distribution. The training dataset was used for model development, and the test dataset for independent evaluation. Model performance was evaluated using several metrics, with particular emphasis on sensitivity, since misclassification of severe damage as non-severe represents a critical failure from the perspective of operational safety.
Since the severe damage class (D1) was underrepresented compared to the non-severe damage class (D0, 69.2%), the training dataset was balanced using the ROSE method, resulting in class proportions of approximately 46.2% (D1) and 53.8% (D0). For the training dataset, the ROSE method was applied to balance the classes of the damage variable (DamageCT). A synthetic balanced training set (train_bal) with 200 samples and an approximately equal representation of both classes (p = 0.5) was generated. The target size of 200 samples was chosen to moderately increase the number of severe damage cases while remaining close to the original training set size (169 observations), thereby avoiding an unrealistic inflation of the data. A fixed random seed (seed = 123) was used to ensure reproducibility of the procedure. All models were trained on the balanced training dataset and subsequently evaluated on the original test dataset with the real class distribution preserved. This design, with model training on a rebalanced training set and evaluation on an independent test set with the original class distribution, was chosen to obtain more robust performance estimates and to reduce the risk of overfitting given the limited number of severe damage cases.
3.3.1. Logistic Regression Model
The logistic regression model was used to estimate the probability of severe conveyor belt damage (DamageCT) based on the input variables Height, Weight, PliesExtra, and TopCover. The equation of the best-performing logistic model, developed on the training dataset, is given as:
where is intercept, , , , are the model coefficients, and P(Y = 1) represents the probability of severe damage occurrence. Estimates of the coefficients and odds ratios are presented in Table 7.
Table 7.
Parameter estimates of the logistic regression model (α = 0.05).
The logistic regression model (Equation (1)) explains approximately 74% of the variability in the DamageCT variable (Nagelkerke R2 = 0.740), confirming the high explanatory power of the selected input parameters. All variables were statistically significant according to the Wald test at the significance level α = 0.05. Impact height represents the most influential risk factor. The odds ratio exp(4.175) ≈ 65.07 indicates that even a small increase in impact height significantly increases the probability of severe damage. Weight also has a positive effect, with exp(0.111) ≈ 1.12, indicating approximately a 1.12-fold increase in the odds of damage for each 1 kg increase in weight. Structural parameters exhibit a protective effect. The number of additional plies (PliesExtra) has a negative coefficient, with exp(−0.933) ≈ 0.393, indicating a substantial reduction in damage probability with increasing number of plies. Similarly, the top cover thickness (TopCover) shows a strong protective effect. The value exp(−2.423) ≈ 0.089 suggests that increasing the thickness significantly reduces the probability of severe conveyor belt damage.
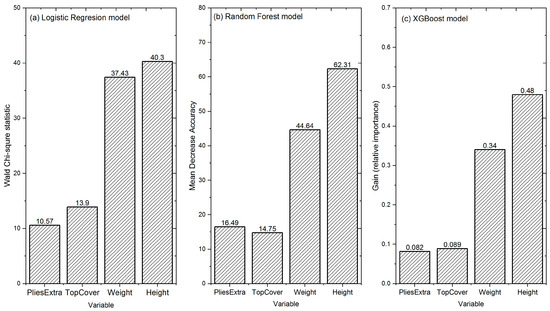
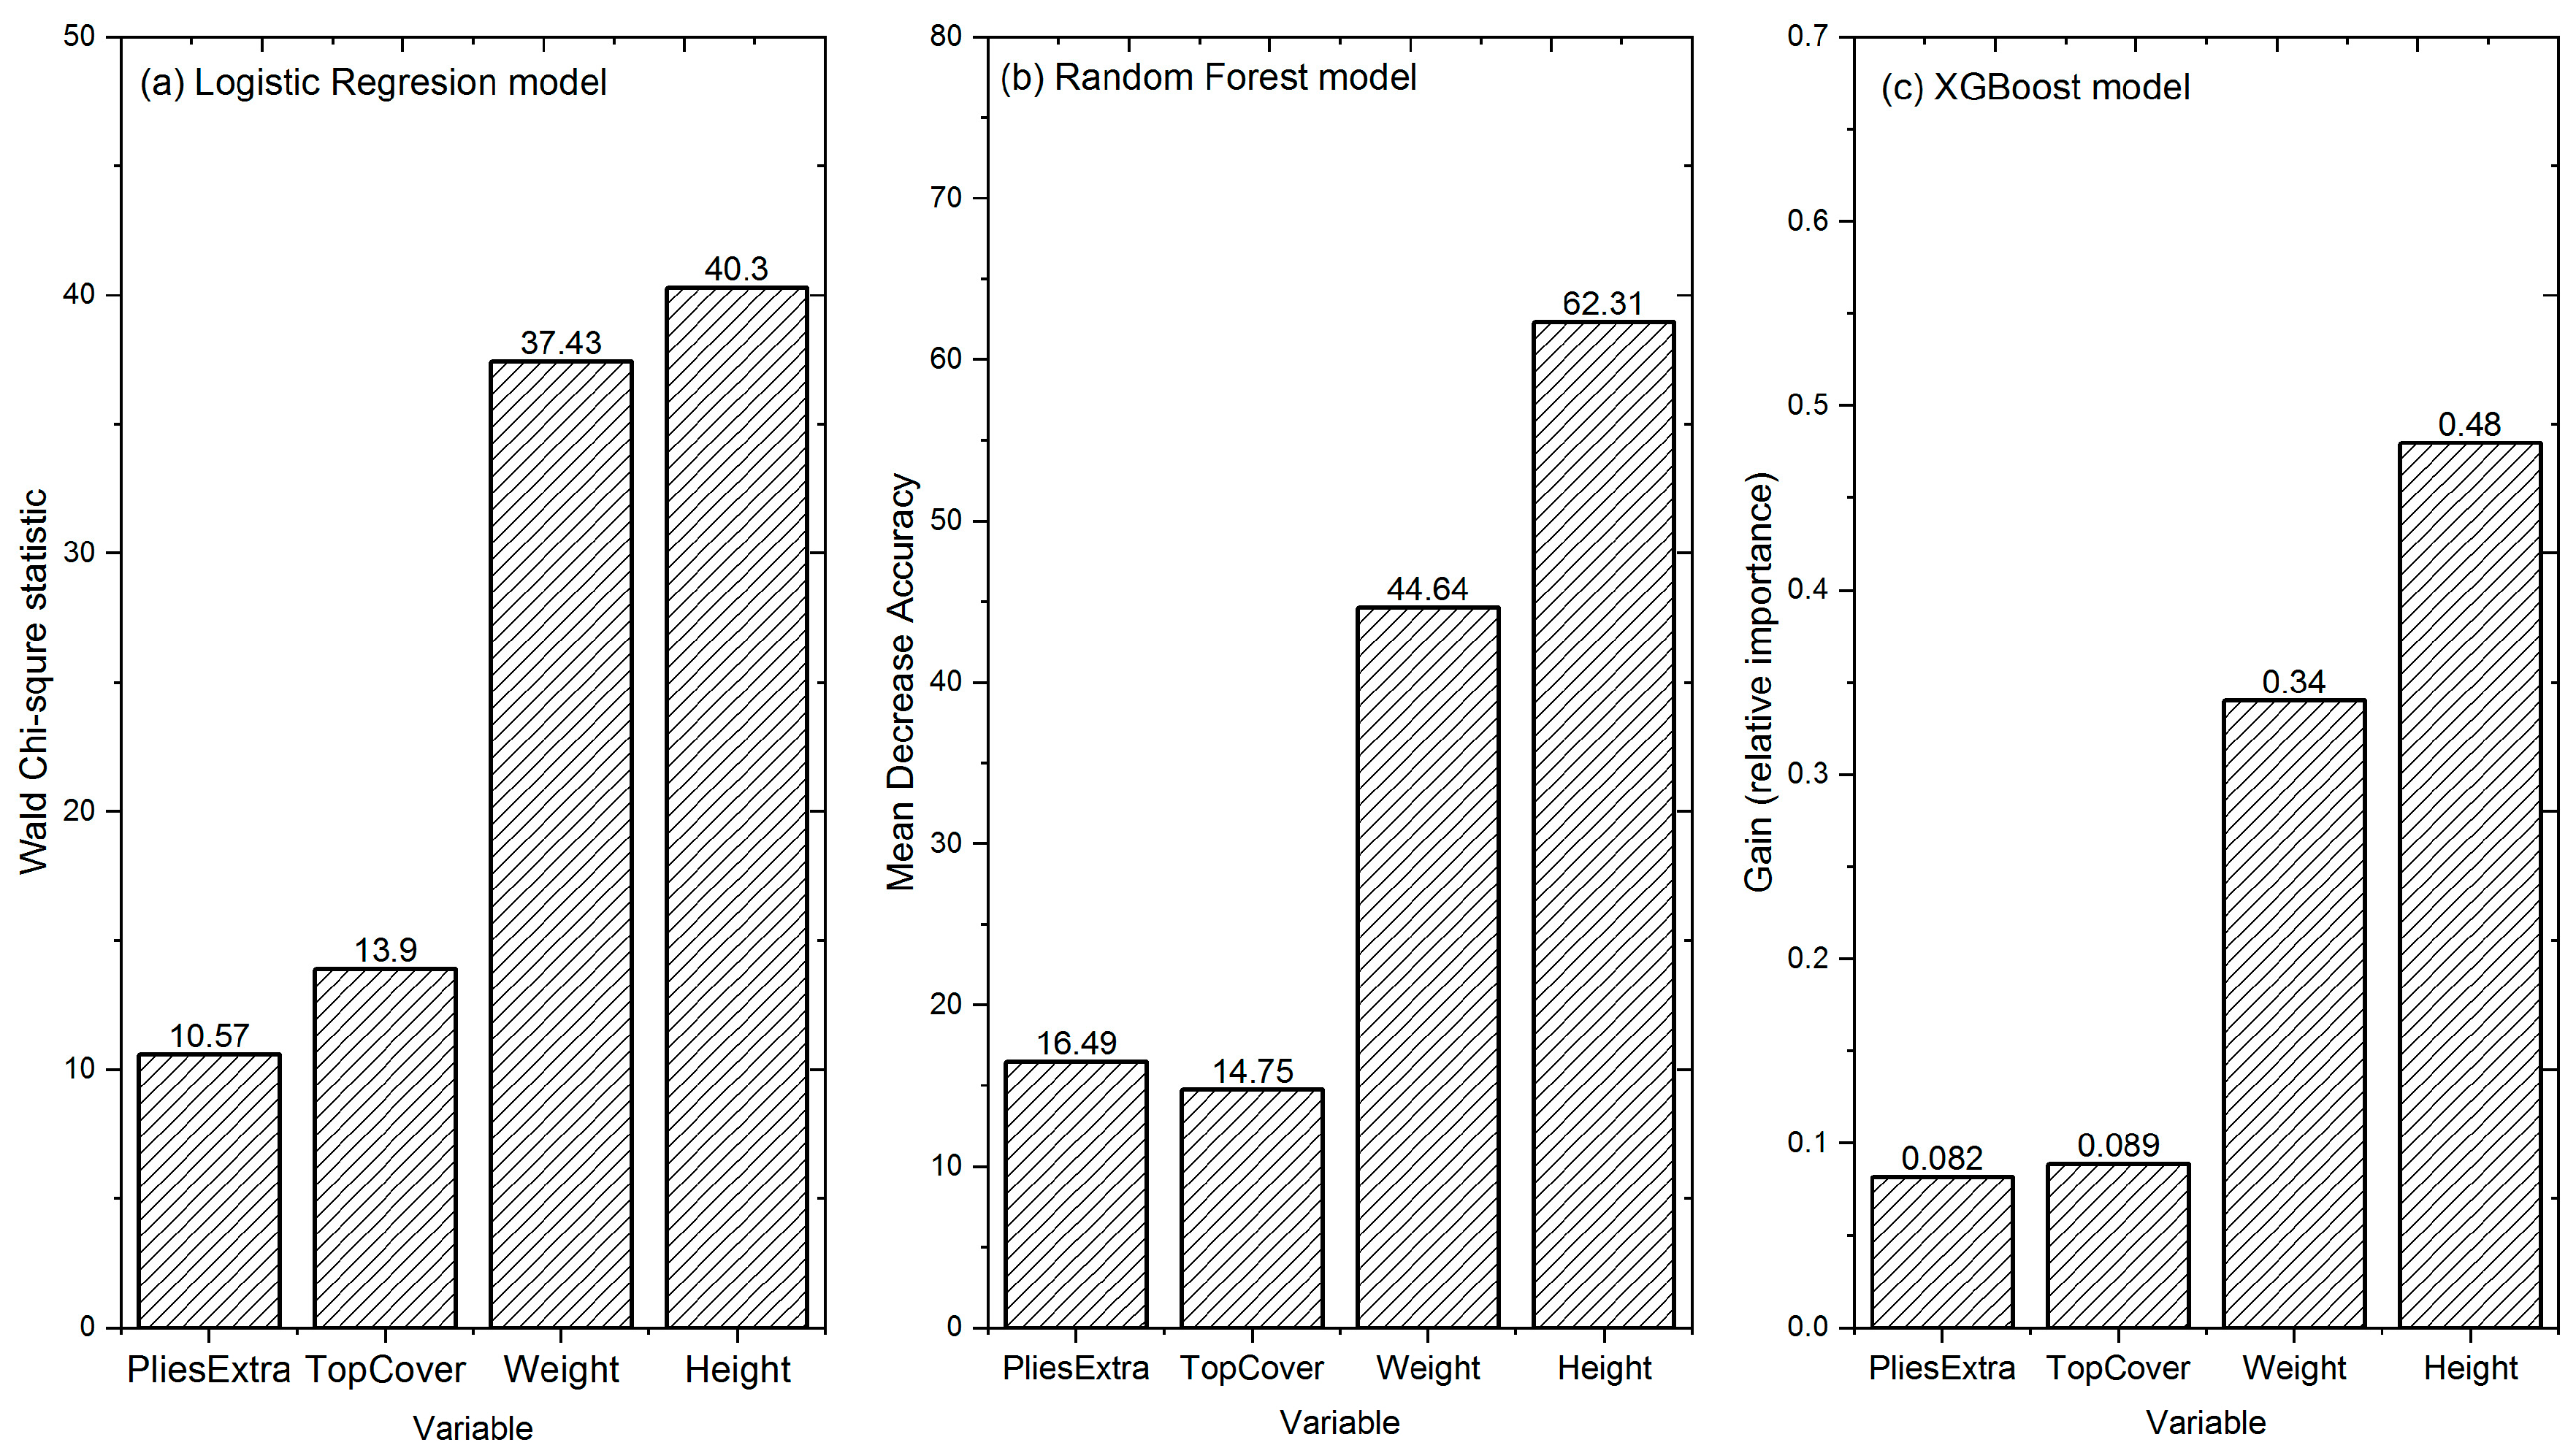
The relative importance based on the Wald Chi-Square statistic (Figure 10a) shows that variables related to impact energy (Height, Wald Chi-Square = 40.30; Weight, Wald Chi-Square = 37.43) have a dominant influence, while TopCover (Wald Chi-Square = 13.90) and PliesExtra (Wald Chi-Square = 10.57) have a secondary, although still statistically significant, effect.
Figure 10.
Variable importance (a) Logistic regression model, (b) Random Forest model, (c) XGBoost model.
The results of logistic regression confirm that impact energy, defined by the combination of impact height and weight, plays a decisive role in damage formation, while the structural parameters of the belt act as modifiers of this energy. This finding provides a physically interpretable basis for the subsequent prediction of critical operating conditions.
3.3.2. Random Forest Model
Hyperparameter optimisation was performed exclusively on the training dataset using repeated cross-validation. The area under the ROC curve (ROC-AUC) was used as the optimisation criterion since the target variable was imbalanced and reliable identification of severe damage was considered more important than overall classification accuracy. For the Random Forest model, the parameter mtry (number of variables randomly selected at each split) was tuned over the range 1–4, the number of trees (ntree) over the range 300–1000, and the minimum node size (nodesize) was tested for values 1, 3, 5, and 10. The final model was selected as a compromise between maximising ROC-AUC and ensuring model stability, with the optimal setting mtry = 3, ntree = 500, and nodesize = 5.
The analysis of input variable importance in the Random Forest model confirmed that the key factor influencing conveyor belt damage is impact height (MeanDecreaseAccuracy = 62.31), followed by weight (44.64). The variables PliesExtra (16.49) and TopCover (14.75) showed a lower, yet still significant, influence on classification, confirming their secondary role compared to parameters related to impact energy (Figure 10b).
3.3.3. XGBoost Model
The XGBoost model was employed to model the relationship between the input variables and the probability of severe conveyor belt damage. The target variable was defined as DamageCT, and the model hyperparameters were optimised using five-fold cross-validation. The area under the receiver operating characteristic curve (ROC–AUC) was used as the optimisation criterion due to the imbalanced nature of the dataset and the importance of correctly identifying severe damage cases.
The hyperparameter search was performed over the following ranges: max_depth = 2–6, eta = 0.01–0.10, min_child_weight = 1–5, subsample = 0.6–1.0, colsample_bytree = 0.6–1.0, gamma = 0–0.5, lambda = 0.5–2, and alpha = 0–0.5. The optimal combination of hyperparameters was selected from a predefined grid of candidate values based on the highest cross-validated ROC–AUC. The optimal number of boosting iterations was determined using the maximum value of test_auc_mean obtained during the cross-validation procedure. The final XGBoost model was trained using the following hyperparameter settings: max_depth = 2, eta = 0.03, min_child_weight = 3, subsample = 0.8, colsample_bytree = 0.8, gamma = 0.2, lambda = 1, and alpha = 0.2.
The importance of input variables in the XGBoost model was evaluated using the Gain metric, which represents the contribution of each variable to reducing model error. The most important factor was impact height (Gain = 0.485), followed by weight (Gain = 0.343). The variables TopCover (Gain = 0.089) and PliesExtra (Gain = 0.082) showed a significantly lower, yet still relevant, influence on the model outcome. The results confirm that parameters related to impact energy play a dominant role, while the structural characteristics of the belt have a secondary effect. The graphical representation of input variable importance is shown in Figure 10c.
The results of both ensemble models (Random Forest and XGBoost) are consistent with those of logistic regression and confirm that impact height and weight are the dominant factors influencing severe conveyor belt damage. The consistent ranking of variable importance across models increases the reliability of the identified relationships.
3.3.4. Model Comparison
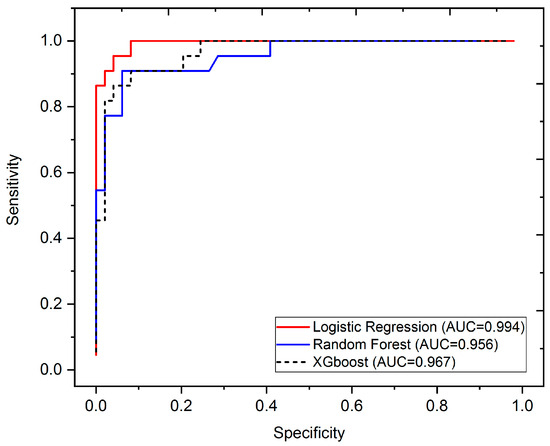
The comparison of classification model performance (Table 8, Figure 11) showed that the best results were achieved by logistic regression, which reached the highest ROC-AUC value (0.994), as well as the highest classification accuracy (95.8%) and Cohen’s kappa coefficient (κ = 0.902). The model also demonstrated high sensitivity (0.955) and specificity (0.959), confirming its strong ability to correctly identify severe damage cases while maintaining a low rate of misclassification.
Table 8.
Performance metrics of classification models (DamageCT).
Figure 11.
ROC curves of the evaluated classification models.
The Random Forest model achieved slightly lower performance, with a classification accuracy of 93.0% and a ROC-AUC of 0.956. The model sensitivity was 0.909 and specificity 0.939, with an F1-score of 0.889.
The XGBoost model achieved an accuracy of 91.6% and a ROC-AUC of 0.967. Its sensitivity was comparable to Random Forest (0.909), while specificity was slightly lower (0.918). The F1-score reached 0.870 and Cohen’s kappa coefficient 0.807.
All models achieved high ROC-AUC values (>0.95), confirming their very good discriminative ability to distinguish between conveyor belt damage classes. The ROC curves of the individual models are shown in Figure 12. The best performance was achieved by logistic regression (AUC = 0.994), followed by XGBoost (AUC = 0.967) and Random Forest (AUC = 0.956).
Figure 12.
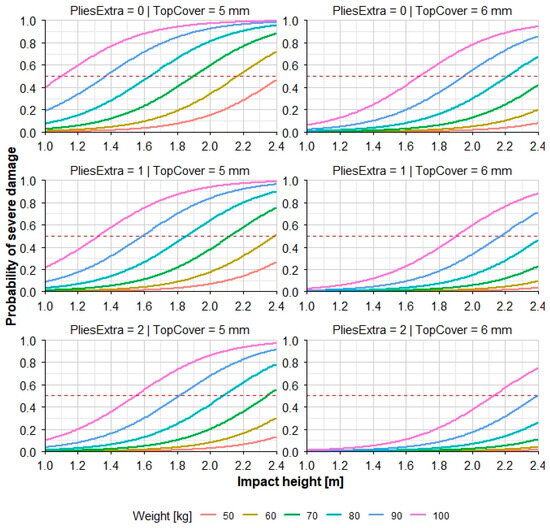
Predicted probability (Equation (2)) of severe damage as a function of impact height.
Confusion matrices (Table 9) summarize the classification performance of the models on the test dataset. The logistic regression model achieved the best results, correctly classifying 47 out of 49 non-severe damage cases (D0) and 21 out of 22 severe damage cases (D1), with a minimal number of errors (1 false negative and 2 false positives).
Table 9.
Confusion matrix (test dataset, DamageCT).
The Random Forest model showed a slightly higher number of misclassifications, specifically 2 false negatives and 3 false positives. The XGBoost model achieved comparable performance, but with the highest number of false positives (4 cases) and 2 false negatives. From a practical perspective, all three models are suitable for applications in reliability and maintenance, as they achieve high sensitivity and very good discriminative performance (ROC-AUC > 0.95), thereby minimizing the risk of failing to detect severe conveyor belt damage.
The logistic regression model appears to be the most suitable, as in addition to high accuracy, it also enables direct interpretability and determination of critical thresholds for predictive maintenance.
3.4. Prediction of Damage Probability and Critical Conditions
This section represents a key outcome of the study, as it enables the transition from damage classification to its quantitative prediction in terms of probability, as well as the determination of critical operating conditions.
Logistic regression enables direct interpretation of model results in terms of the probability of severe conveyor belt damage. Based on the estimated parameters, predicted probabilities were calculated for different combinations of input variables (Height, Weight, TopCover, PliesExtra), allowing quantification of damage risk. The logistic model (Equation (1)) transforms a linear combination of input variables into the interval ⟨0,1⟩ using the logistic function according to the following relationship:
where P(Y = 1) represents the probability of severe conveyor belt damage occurrence. To identify critical operating conditions, impact heights corresponding to different probability levels of damage were determined. The critical impact height was defined as the height at which the predicted probability reaches a specified level P(Y = 1). A reference threshold of P(Y = 1) = 0.5 was considered, representing the transition between low and high damage risk. For a more detailed interpretation, additional probability levels were analysed: P(Y = 1) = 0.10 (low risk), P(Y = 1) = 0.25 (moderate risk), and P(Y = 1) = 0.75 (high damage risk).
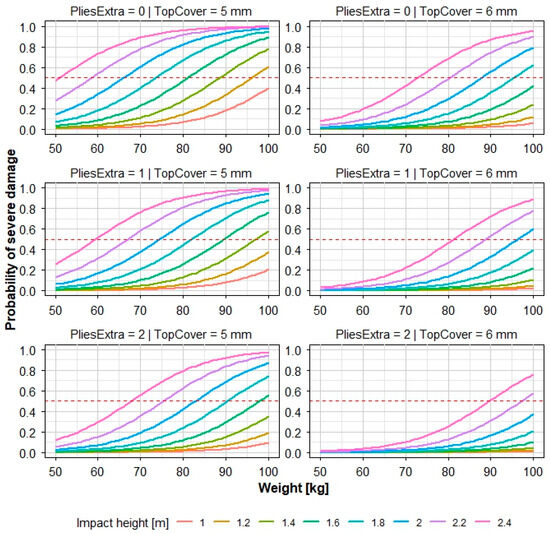
Figure 12 illustrates the predicted probability of severe damage as a function of impact height for different combinations of weight and structural parameters. Individual panels represent combinations of the number of extra plies (PliesExtra) and top cover thickness (TopCover), while the colored curves correspond to different weight values. The dashed lines indicate probability levels of P(Y = 1) = 0.25, P(Y = 1) = 0.50 and 0.75. The prediction curves show a nonlinear increase in the probability of severe damage with increasing impact height. At heights of approximately 1.0 to 1.5 m, the risk remains low; however, it increases sharply at higher values, particularly for higher weight. For higher weight, critical probability levels are reached at lower impact heights.
Structural parameters shift the prediction curves toward higher impact heights. Increasing the number of extra plies (PliesExtra) and the thickness of the top cover layer (TopCover) enhances the resistance of the belt to impact loading.
The highest risk is associated with the combination of high weight and minimal structural protection (PliesExtra = 0, TopCover = 5 mm), where an increased risk of severe damage occurs already at low impact heights. In contrast, the configuration PliesExtra = 2 and TopCover = 6 mm shifts the critical values toward significantly higher impact heights. The difference between these configurations indicates that appropriate structural optimisation can shift the critical impact height by more than 1 m and substantially reduce the risk of damage.
Table 10 presents the calculated predicted impact heights for two extreme scenarios: the most critical configuration (PliesExtra = 0, TopCover = 5) and the most resistant configuration (PliesExtra = 2, TopCover = 6). The value P(Y = 1) = 0.50 represents the reference critical impact height, separating the region of relatively safe operation from the region of increased risk of severe damage.
Table 10.
Predicted impact heights.
The results (Table 10, Figure 13) indicate that the critical impact height strongly depends on weight. With increasing weight, the critical height decreases systematically, highlighting the dominant effect of impact energy on conveyor belt damage. For the most critical configuration (PliesExtra = 0, TopCover = 5), the critical impact height at the reference probability P(Y = 1) = 0.50 ranges approximately from 2.43 m (50 kg) to 1.10 m (100 kg). In contrast, for the most resistant configuration (PliesExtra = 2, TopCover = 6), the critical height ranges from approximately 3.45 m to 2.13 m depending on weight.
Figure 13.
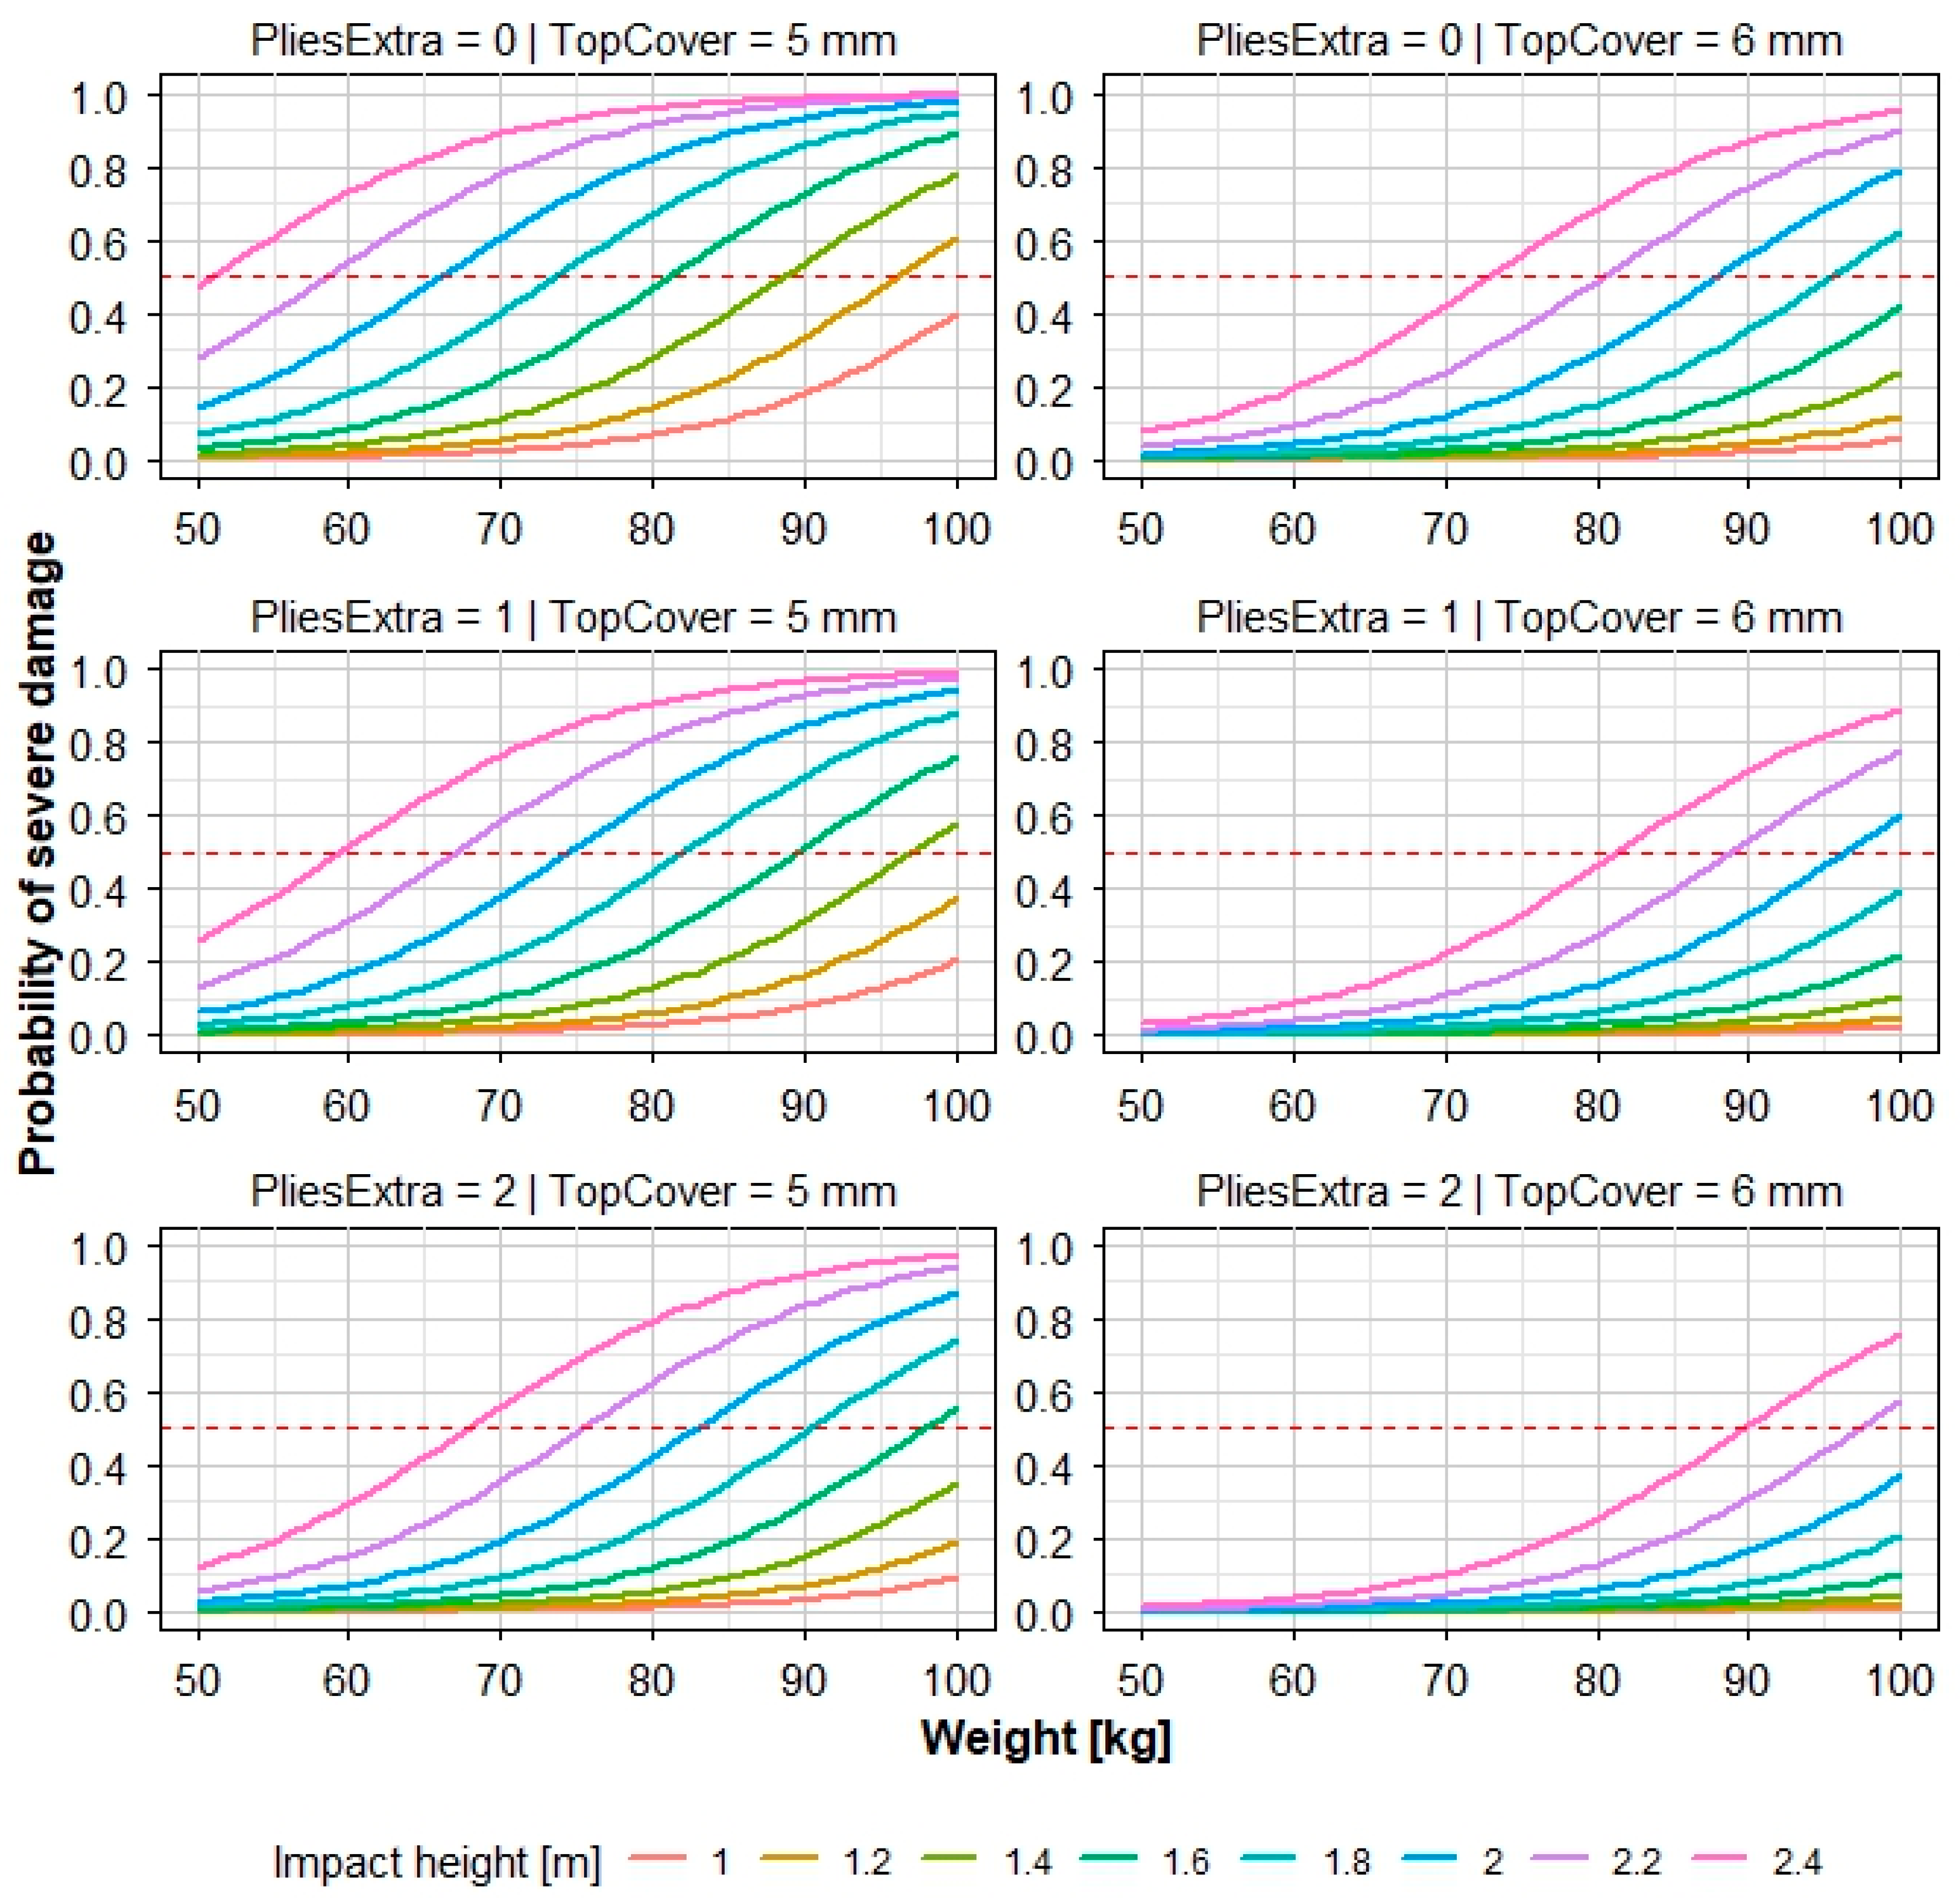
Predicted probability (Equation (2)) of severe damage as a function of weight.
Similarly, it is possible to predict the weight at which the probability of severe damage exceeds 0.5. With increasing impact height, the critical weight decreases, confirming the dominant influence of impact energy. At higher impact heights (≥2.0 m), a high risk occurs already at lower weight values, whereas at lower heights, significantly higher weight is required.
Structural parameters have a significant effect: a higher number of plies and greater top cover thickness increase the critical weight and overall impact resistance. Figure 13 shows that the combination of high impact height and weight sharply increases the probability of damage, while structural optimisation can effectively reduce this risk.
Table 11 presents the predicted weight values for extreme scenarios: the most critical configuration (PliesExtra = 0, TopCover = 5) and the most resistant configuration (PliesExtra = 2, TopCover = 6) at selected impact heights. The value P(Y = 1) = 0.50 represents the reference critical weight separating safe and risk operating conditions.
Table 11.
Predicted weight values.
The results presented in Table 11 allow, for a given impact height, the direct determination of the maximum permissible weight of the impacting material for a selected risk level. For example, at an impact height of 2.0 m, the critical weight for the most critical configuration (PliesExtra = 0, TopCover = 5 mm) is approximately 66 kg (P = 0.50), with higher weights leading to a significant increase in the risk of severe damage.
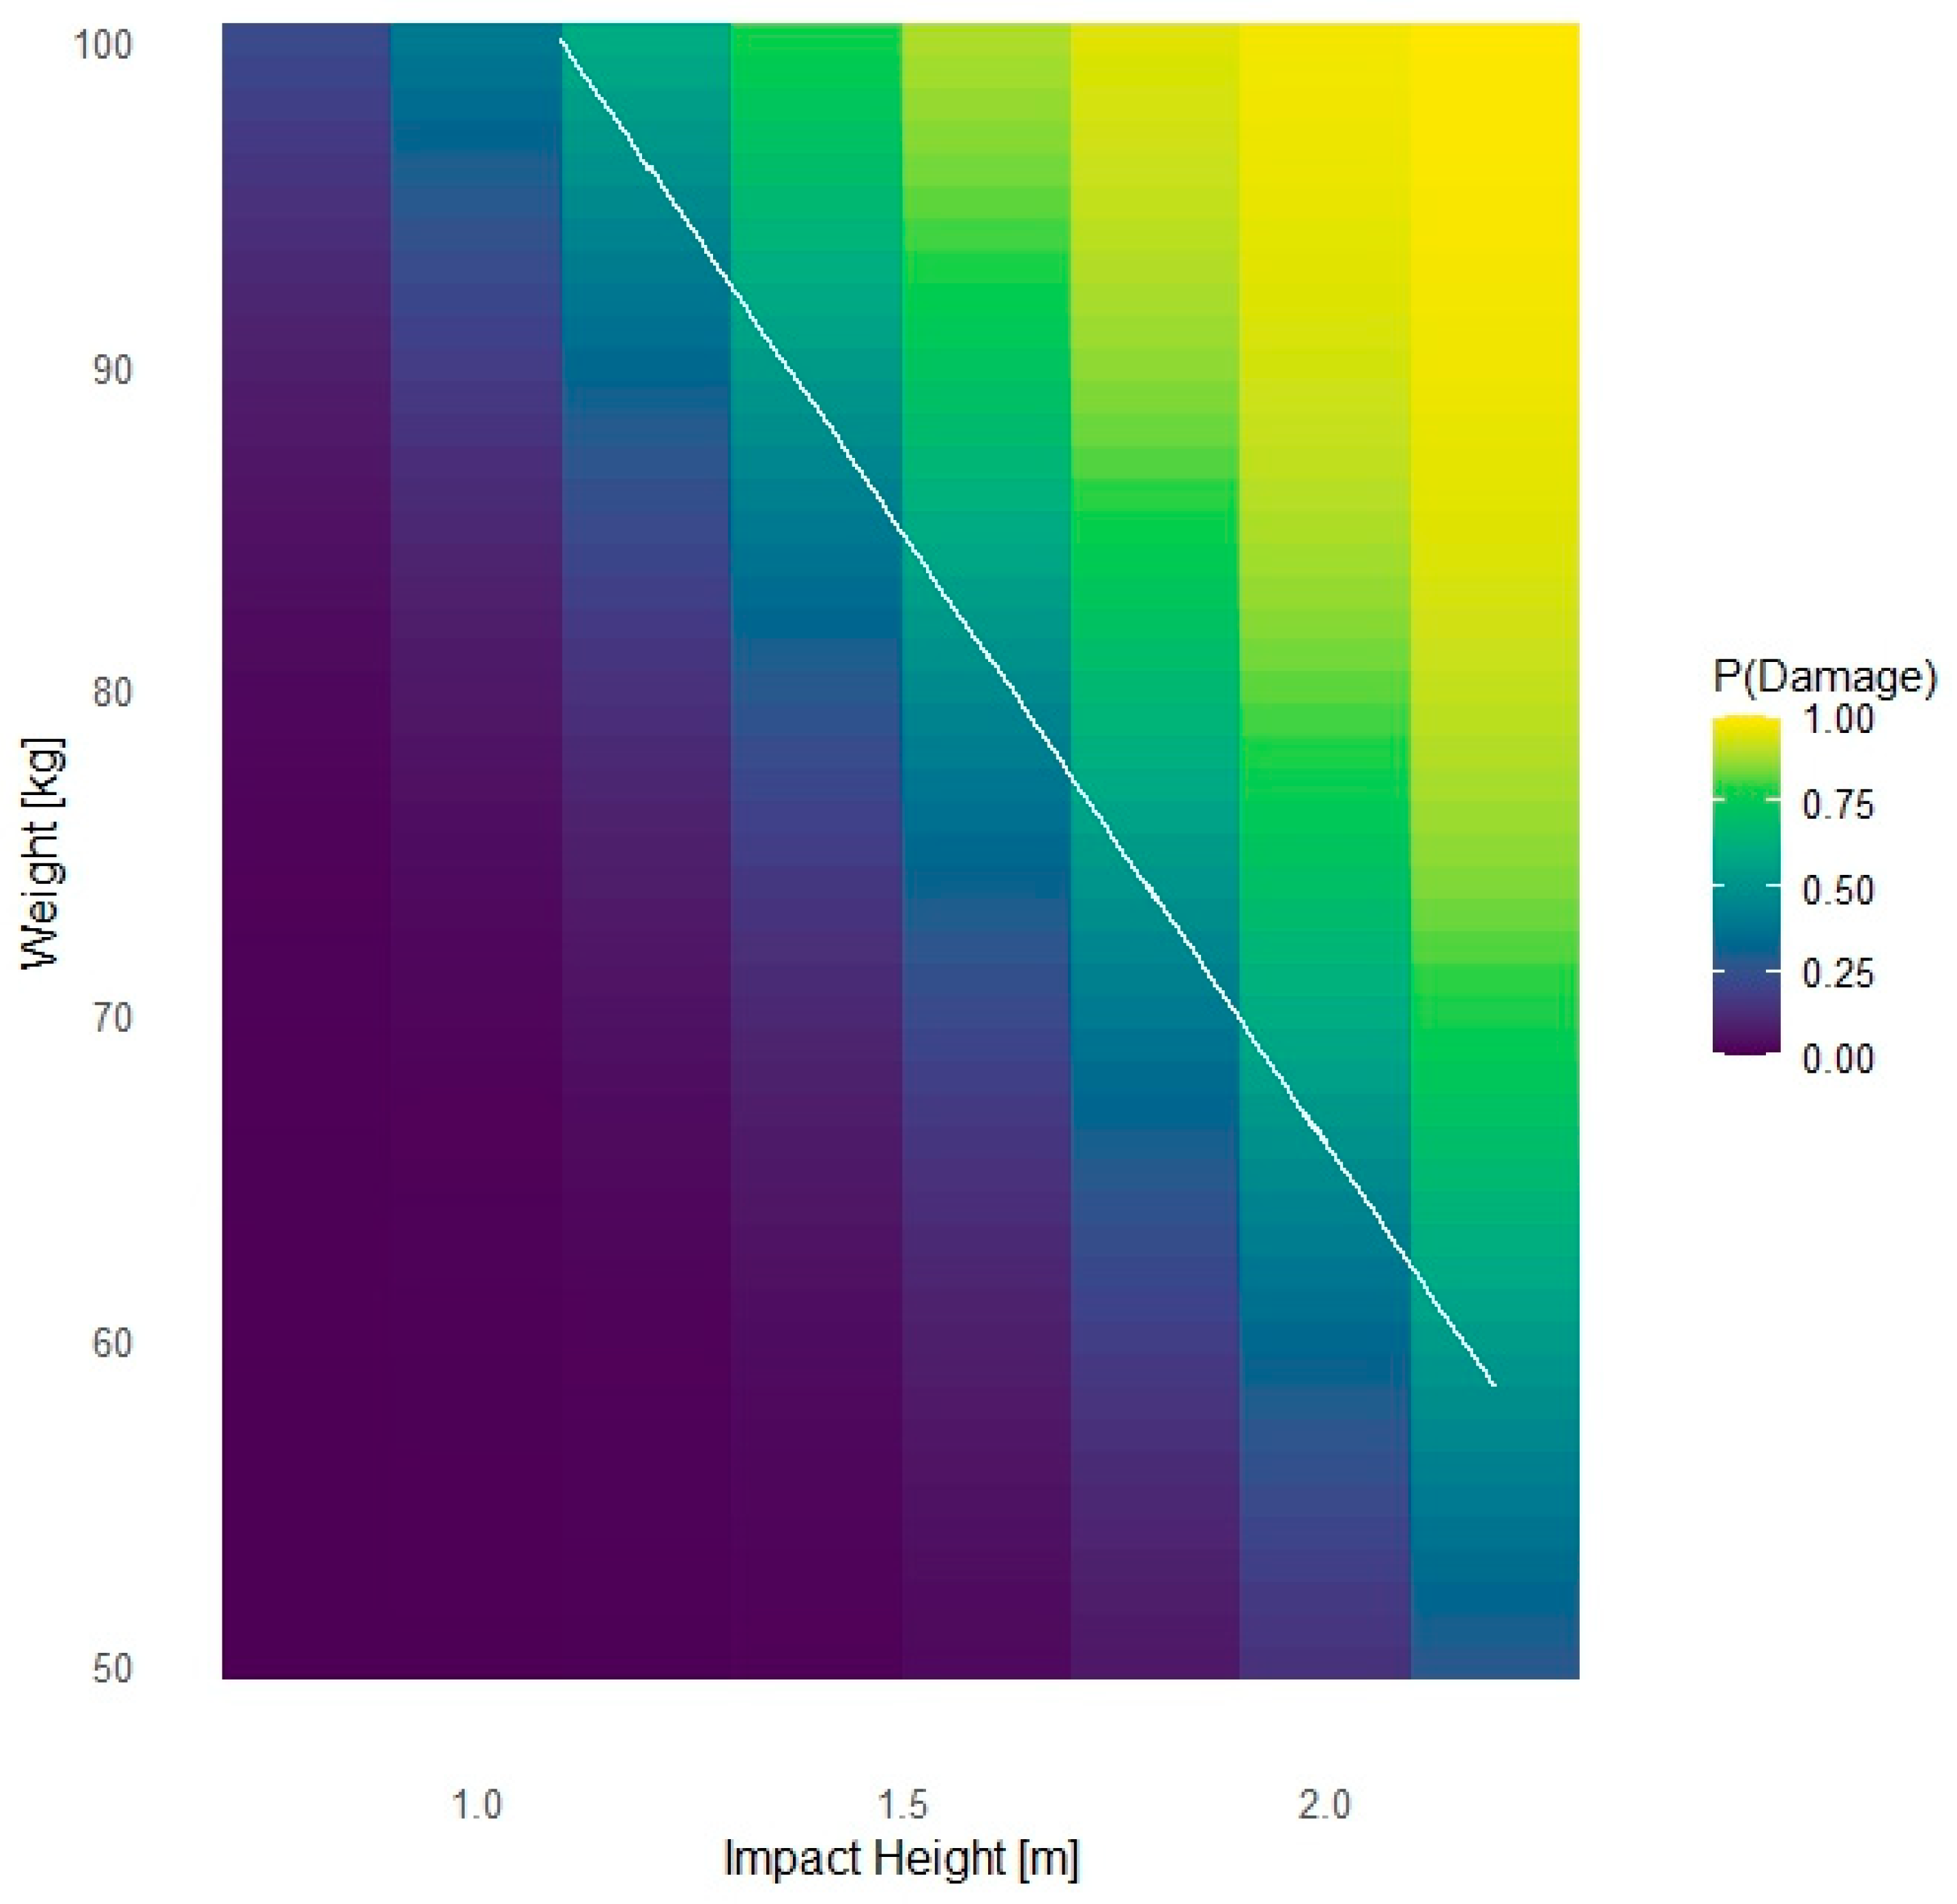
For a comprehensive interpretation of the interaction between impact height and weight, a diagram of the predicted probability of severe damage was developed (Figure 14).
Figure 14.
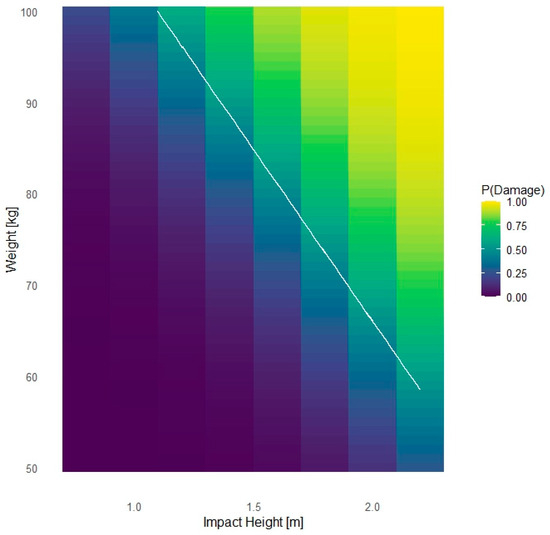
Predicted probability (Equation (2)) of severe damage as a function of impact height and the weight of the impacting body.
The results indicate a pronounced synergistic effect of these two parameters, as their simultaneous increase leads to a nonlinear rise in damage probability. Regions with a high probability of damage are observed particularly for combinations of greater impact heights and higher weights, confirming the dominant influence of impact energy on conveyor belt damage. The white line represents the critical boundary corresponding to a probability P(Damage) = 0.5, separating low- and high-risk regions. This boundary also enables the identification of critical combinations of impact height and weight at which the transition between safe and high-risk operating regimes occurs. Its trajectory shows that with increasing impact height, the critical weight required to cause severe damage decreases, further confirming the dominant role of impact energy.
3.5. Validation of Predictive Models with Respect to Visual Damage Assessment
To verify the robustness of the developed models, their predictive performance was additionally evaluated with respect to visual damage assessment (DamageVis), which represents the traditional method of conveyor belt condition evaluation. Confusion matrices capturing the relationship between model predictions and DamageVis classes are presented in Table 12.
Table 12.
Confusion matrices (test dataset, DamageVis).
The confusion matrices (Table 12) show that all models correctly identified all cases of severe damage (DamageVis = 1), achieving maximum sensitivity of 1.00. No case of severe damage was classified as non-severe. Differences between the models were mainly observed in their ability to correctly identify non-severe damage (DamageVis = 0). The logistic regression model correctly classified 48 out of 57 cases, Random Forest 49 out of 57, and XGBoost 47 out of 57, corresponding to slight differences in specificity.
The performance metrics presented in Table 13 confirm that logistic regression and Random Forest achieved identical accuracy (0.873) and specificity (0.842), while XGBoost showed slightly lower accuracy (0.859) and specificity (0.825). The values of Cohen’s kappa coefficient (0.678 for logistic regression and Random Forest, and 0.650 for XGBoost) indicate a good level of agreement between model predictions and visual assessment.
Table 13.
Performance metrics of classification models (DamageVis).
In terms of discriminative performance, all models achieved very high AUC values (0.977–0.986), indicating their excellent ability to distinguish between non-severe and severe damage. At the same time, the models classified some visually non-severe cases as severe, which resulted in lower specificity and accuracy. This effect may be explained by the fact that the models were trained on DamageCT, which is capable of detecting less apparent or early-stage internal damage that may not be identified by visual inspection. Overall, it can be concluded that all models show a high level of agreement with visual assessment, with Random Forest and logistic regression achieving slightly better performance than XGBoost. The models thus represent a reliable tool for identifying severe damage, even in comparison with traditional visual inspection methods.
4. Discussion
4.1. Significance of CT-Based Diagnostics
A key contribution of this study is the comparison between visual damage assessment and computed tomography (CT), as well as the use of CT data as a reference variable for model development. While visual inspection captures surface damage, it may underestimate the actual condition of the belt in the presence of hidden damage to the load-bearing carcass. The higher sensitivity of CT in identifying internal defects is consistent with previous studies [30,31,50]. Severe damage may exist without significant surface manifestation, increasing the risk of underestimating the belt condition [33,34].
However, CT is time-consuming and economically demanding, and therefore primarily serves as a reference (“gold standard”) tool. Models trained on DamageCT show good agreement with visual assessment (Section 3.5) and can therefore be applied even without CT availability. Their slightly conservative nature (higher number of false positives) is desirable from a safety perspective, as it minimizes the risk of overlooking critical damage. Industrial application of CT for conveyor belt inspection is further limited by the restricted availability of CT facilities, the need for specialised personnel and radiation-shielded infrastructure, as well as the relatively low inspection throughput compared to belt lengths and conveying speeds in continuous transport systems. For this reason, CT examination is typically feasible only for selected belt sections removed from operation or for detailed post-failure analyses, but not for online monitoring of the entire belt length. In this study, CT is therefore used to obtain reliable reference (ground-truth) labels of internal damage, while the developed predictive models are designed to transfer this information into a form compatible with practical maintenance constraints, where condition assessment must rely on more economical and faster diagnostic techniques and readily available operating variables.
4.2. Interpretation of the Results and Implications for Reliability and Maintenance
The results show that parameters related to impact loading, particularly impact height and weight, have a dominant influence on the occurrence of severe damage. The observed system behavior has a clear physical interpretation. The energy of the impacting body, approximated by the relationship E∼m·g·h, is the key factor governing damage formation, with impact height representing the dominant contributor to potential energy. Weight acts analogously, while structural belt parameters modify resistance to impact loading through energy absorption and redistribution mechanisms. As these variables increase, both the proportion of damage and the probability of class D1 increase, which is consistent with the role of impact energy [3,4,35] and enables quantification of risk under different operating conditions [5,7]. The protective effect of the upper cover layer thickness can be explained by the mechanical response of the rubber layer under impact loading. A thicker cover layer increases the conveyor belt’s ability to absorb and dissipate impact energy through the elastic and viscoelastic deformation of the material. At the same time, it distributes the contact force over a larger area and reduces the maximum contact stresses transmitted to the textile carcass of the belt. As a result, local stress concentrations are reduced, limiting the development of critical tensile stresses in the reinforcing plies. This leads to a lower probability of severe internal damage, which is consistent with the experimental results obtained in this study. However, it should be noted that these mechanisms were neither directly measured nor investigated through numerical analysis; rather, they are inferred from the well-established behavior of rubber materials under dynamic loading and from the experimental observations made in this study.
Structural parameters exhibit a protective effect, with the thickness of the top cover (TopCover) showing the most significant influence by reducing damage probability through improved energy absorption [34]. The effect of additional plies is primarily related to stress redistribution within the belt structure [27]. Predictive models enable the identification of critical operating conditions and the determination of boundaries between safe and high-risk regimes. Logistic regression proved to be the most suitable approach due to its high accuracy and interpretability, while also supporting predictive maintenance strategies [38,49]. From a reliability and maintenance perspective, the results enable identification of high-risk regimes, definition of operational limits, and implementation of predictive maintenance. Models trained on CT data show good agreement with visual assessment, allowing their application even without CT availability. The results provide a basis for optimizing maintenance strategies, including condition-based and predictive maintenance approaches [9,10].
For a given belt configuration, the models allow direct estimation of the maximum allowable impact height and weight for a specified target probability of damage. Determining critical impact heights and weights corresponding to a defined probability of severe damage enables the definition of safe operational limits at transfer points and the establishment of thresholds for diagnostic measurements. In practice, operators can define limits for impact height and weight at transfer points to maintain operation below an acceptable risk threshold, or adjust belt design parameters (TopCover, PliesExtra) to increase resistance to impact loading.
4.3. Limitations of the Study
The results of this study should be interpreted in light of several limitations. The experiments were conducted on a limited number of textile-reinforced conveyor belts of the same strength class; therefore, the quantitative results obtained primarily apply to the belt configurations investigated. However, the proposed methodology may also be applied to other types of conveyor belts following appropriate experimental validation.
The laboratory impact tests were performed under controlled conditions and focused on the effects of drop height, impactor weight, and selected belt design parameters. Consequently, several environmental and operational factors that may significantly influence conveyor belt degradation processes were not included in this study. These factors include, in particular, temperature variations, humidity, exposure to harsh operating conditions, material aging, abrasive wear, and changes in material mechanical properties during long-term service.
Another limitation is that the experimental design was based on single-impact loading. In real conveyor systems, belts are often subjected to repeated impacts, which may lead to cumulative damage and fatigue degradation of the material. Such mechanisms may affect both the probability of severe damage occurrence and the critical operating conditions identified in this work.
A further limitation is related to the scope of validation of the developed models. Although Logistic Regression, Random Forest, and XGBoost achieved high predictive performance on an independent test dataset, the models were developed and validated using data obtained from P1000-strength-class conveyor belts. Therefore, their direct applicability to conveyor belts with different strength classes, carcass constructions, or material compositions cannot be assumed without further experimental verification. External validation using independent datasets and additional conveyor belt types is essential to confirm the robustness and generalizability of the proposed models.
Accordingly, the presented models should be regarded as predictive tools developed for controlled impact-loading conditions. Their application in real operating environments requires consideration of additional degradation mechanisms, specific operational factors, and the results of future external validation across a broader range of conveyor belt types.
4.4. Economic Implications
From an economic perspective, the use of computed tomography (CT) for conveyor belt diagnostics offers significant advantages, but also certain limitations. Early identification of such damage can help prevent unexpected belt failures, reduce unplanned downtime, and eliminate costly emergency maintenance interventions.
On the other hand, CT-based diagnostics are associated with relatively high costs, requirements for specialized equipment, limited availability, and lower inspection throughput compared with commonly used diagnostic methods. For this reason, the direct use of CT as a routine monitoring tool in large-scale industrial conveyor systems may not always be economically feasible.
From a practical perspective, the results indicate that increasing the thickness of the top cover (TopCover) may provide a comparable or even greater protective effect than increasing the number of additional plies (PliesExtra). Optimisation of the top cover thickness thus represents a more efficient solution, as it does not require major modifications to the load-bearing carcass and is associated with lower costs. From a maintenance perspective, the comparison between visual and CT-based assessment represents an economic trade-off. Visual inspection is cost-effective but has lower sensitivity for detecting internal damage, increasing the risk of unexpected failures and downtime, the costs of which may exceed those of advanced diagnostic methods. It should be emphasized that a quantitative cost–benefit assessment was not within the scope of this study. A reliable evaluation of the trade-off between the costs of CT-based diagnostics and the potential savings resulting from failure prevention requires operation-specific data, such as conveyor dimensions, production capacity, downtime costs, maintenance strategies, inspection frequency, and the availability of CT diagnostic facilities. Therefore, future research should focus on comprehensive techno-economic analyses of predictive maintenance strategies supported by CT diagnostics under real industrial operating conditions.
4.5. Future Research Directions
Future research should focus on expanding the experimental dataset to include different types of conveyor belts and operating conditions in order to verify model generalizability. Further research should also address cumulative damage effects, repeated impact loading, and the extension of models to include additional parameters describing impact energy and material–belt interaction.
Particular attention should be devoted to external validation using independent datasets and conveyor belts with different strength classes, carcass types, and design characteristics in order to further assess the robustness and generalizability of the models. The proposed modelling framework should also be extended to incorporate environmental and operational factors, such as temperature, humidity, material aging, abrasive wear, and long-term operating conditions. Future studies should additionally address cumulative damage, repeated impact loading, and fatigue degradation, which more accurately reflect real operating environments. Considering these factors may contribute to the development of more robust predictive models capable of better representing the complex degradation processes occurring in industrial conveyor belt systems.
5. Conclusions
This study analysed impact-induced damage in textile-reinforced rubber conveyor belts using a combination of experimental impact testing, visual inspection, and computed tomography (CT). The results confirmed that impact loading parameters, particularly impact height and the weight of the impacting body, have a dominant influence on the probability of severe damage, while the structural parameters of the belt exhibit a protective effect. Increasing the thickness of the top cover led to a significant reduction in the occurrence of severe damage, whereas the effect of additional plies was mainly reflected through stress redistribution within the load-bearing carcass. Comparison of evaluation methods showed that visual inspection does not always detect internal damage revealed by CT, especially at higher levels of impact energy. Logistic regression provided accurate and well-interpretable estimates of damage probability and enabled the identification of critical combinations of impact height and weight. The proposed approach supports the definition of operational limits at transfer points and the implementation of predictive maintenance strategies, while the results suggest that increasing the thickness of the top cover may be a more effective design measure than increasing the number of plies.
Supplementary Materials
The following supporting information can be downloaded at https://www.mdpi.com/article/10.3390/app16126048/s1.
Author Contributions
Conceptualization, M.A., D.M. and A.G.; methodology, M.A. and A.G.; software, M.A.; validation, M.A. and A.G.; formal analysis, A.G. and D.M.; investigation, M.A. and A.G.; resources, A.G.; data curation, M.A.; writing—original draft preparation, M.A., A.G. and D.M.; writing—review and editing, A.G. and D.M.; visualization, M.A.; supervision, D.M.; project administration, D.M.; funding acquisition, D.M. All authors have read and agreed to the published version of the manuscript.
Funding
This research received no external funding.
Institutional Review Board Statement
Not applicable.
Informed Consent Statement
Not applicable.
Data Availability Statement
The original contributions presented in this study are included in the article/Supplementary Materials. Further inquiries can be directed to the corresponding author.
Acknowledgments
This work was financially supported by the Slovak Grant Agency under the grants APVV-18-0248, APVV-23-0342, VEGA 1/0728/24, VEGA 1/0191/24 and VEGA 1/0114/25.
Conflicts of Interest
The authors declare no conflicts of interest.
References
- Guo, X.Q.; Liu, X.H.; Zhou, H.; Stanislawski, R.; Krolczyk, G.; Li, Z.X. Belt tear detection for coal mining conveyors. Micromachines 2022, 13, 449. [Google Scholar] [CrossRef] [Scilit] [PubMed]
- Ryba, T.; Bzinkowski, D.; Siemiatkowski, Z.; Rucki, M.; Stawarz, S.; Caban, J.; Samociuk, W. Monitoring of rubber belt material performance and damage. Materials 2024, 17, 765. [Google Scholar] [CrossRef] [Scilit] [PubMed]
- Stefaniak, P.; Wodecki, J.; Zimroz, R. Maintenance Management of Mining Belt Conveyor System Based on Data Fusion and Advanced Analytics. In Advances in Technical Diagnostics, Proceedings of the 6th International Congress on Technical Diagnostics, ICTD2016, Gliwice, Poland, 12–16 September 2016; Timofiejczuk, A., Łazarz, B.E., Chaari, F., Burdzik, R., Eds.; Applied Condition Monitoring Series; Springer: Cham, Switzerland, 2018; Volume 10, pp. 465–476. [Google Scholar] [CrossRef] [Scilit]
- Bortnowski, P.; Kawalec, W.; Krol, R.; Ozdoba, M. Types and causes of damage to the conveyor belt—Review, classification and mutual relations. Eng. Fail. Anal. 2022, 140, 106520. [Google Scholar] [CrossRef] [Scilit]
- Alviari, L.P.; Anggamawarti, M.F.; Sanjiwani, Y.; Risonarta, V.Y. Classification of Impact Damage on A Rubber-Textile Conveyor Belt: A Review. Int. J. Mech. Eng. Technol. Appl. 2020, 1, 21–27. [Google Scholar] [CrossRef] [Scilit]
- Andrejiova, M.; Grincova, A.; Marasova, D. Identification with machine learning techniques of a classification model for the degree of damage to rubber-textile conveyor belts with the aim to achieve sustainability. Eng. Fail. Anal. 2021, 127, 105564. [Google Scholar] [CrossRef] [Scilit]
- Andrejiova, M.; Grincova, A.; Marasova, D.; Fedorko, G.; Molnar, V. Using logistic regression in tracing the significance of rubber-textile conveyor belt damage. Wear 2014, 318, 145–152. [Google Scholar] [CrossRef] [Scilit]
- Jurdziak, L.; Blazej, R.; Kirjanow-Blazej, A.; Rzeszowska, A. Transverse profiles of belt core damage in the analysis of the correct loading and operation of conveyors. Minerals 2023, 13, 1520. [Google Scholar] [CrossRef] [Scilit]
- Jardine, A.; Tsang, A. Maintenance, Replacement, and Reliability: Theory and Applications; CRC Press: Boca Raton, FL, USA, 2021. [Google Scholar] [CrossRef] [Scilit]
- Carvalho, T.P.; Soares, F.A.A.M.; Vita, R.; Francisco, R.D.; Basto, J.P.; Alcala, S.G.S. A systematic literature review of machine learning methods applied to predictive maintenance. Comput. Ind. Eng. 2019, 137, 106024. [Google Scholar] [CrossRef] [Scilit]
- Rumin, P.; Kotowicz, J.; Zastawna-Rumin, A. Predictive maintenance of belt conveyor idlers based on measurements, analytical calculations and decision-making algorithms. Eksploat. I Niezawodn. Maint. Reliab. 2025, 27, 202096. [Google Scholar] [CrossRef] [Scilit]
- Guo, X.Q.; Liu, X.H.; Zhang, X.; Krolczyk, G.M.; Gardoni, P.; Li, Z.X. A novel denoising approach based on improved invertible neural networks for real-time conveyor belt monitoring. IEEE Sens. J. 2023, 23, 3194–3203. [Google Scholar] [CrossRef] [Scilit]
- Yang, L.J.; Chen, G.Y.; Liu, J.H.; Guo, J.X. Wear state detection of conveyor belt in underground mine based on Retinex-YOLOv8-EfficientNet-NAM. IEEE Access 2024, 12, 25309–25324. [Google Scholar] [CrossRef] [Scilit]
- Zhang, M.C.; Jiang, K.; Cao, Y.S.; Li, M.X.; Wang, Q.B.; Li, D.; Zhang, Y. A new paradigm for intelligent status detection of belt conveyors based on deep learning. Measurement 2023, 213, 112735. [Google Scholar] [CrossRef] [Scilit]
- Li, J.; Pang, H.; Li, X.G.; Zhang, L. A segmentation network and an evaluation method for conveyor belt damage detection based on improved YOLOv11. J. Nondestruct. Eval. 2025, 44, 123. [Google Scholar] [CrossRef] [Scilit]
- Trybala, P.; Blachowski, J.; Blazej, R.; Zimroz, R. Damage detection based on 3D point cloud data processing from laser scanning of conveyor belt surface. Remote Sens. 2021, 13, 55. [Google Scholar] [CrossRef] [Scilit] [PubMed]
- Stachowiak, M.; Koperska, W.; Stefaniak, P.; Skoczylas, A.; Anufriiev, S. Procedures of detecting damage to a conveyor belt with use of an inspection legged robot for deep mine infrastructure. Minerals 2021, 11, 1040. [Google Scholar] [CrossRef] [Scilit]
- Rzeszowska, A.; Błażej, R.; Jurdziak, L. Non-Destructive Testing for Conveyor Belt Monitoring and Diagnostics: A Review. Appl. Sci. 2025, 15, 13272. [Google Scholar] [CrossRef] [Scilit]
- Blazej, R.; Jurdziak, L.; Kirjanow-Blazej, A.; Kozlowski, T. Identification of damage development in the core of steel cord belts with the diagnostic system. Sci. Rep. 2021, 11, 12349. [Google Scholar] [CrossRef] [Scilit] [PubMed]
- Blazej, R.; Jurdziak, L.; Rzeszowska, A. Sensor-Based Diagnostics for Conveyor Belt Condition Monitoring and Predictive Refurbishment. Sensors 2025, 25, 3459. [Google Scholar] [CrossRef] [Scilit] [PubMed]
- Fedorko, G. Application possibilities of virtual reality in failure analysis of conveyor belts. Eng. Fail. Anal. 2021, 128, 105615. [Google Scholar] [CrossRef] [Scilit]
- Guo, X.Q.; Liu, X.H.; Gardoni, P.; Glowacz, A.; Krolczyk, G.; Incecik, A.; Li, Z.X. Machine vision based damage detection for conveyor belt safety using fusion knowledge distillation. Alex. Eng. J. 2023, 71, 161–172. [Google Scholar] [CrossRef] [Scilit]
- Yang, L.; Wang, Y.M.; Miao, D.; Duan, X.X. Damage detection method for high-strength aramid conveyor belts. IEEE Access 2025, 13, 2671–2678. [Google Scholar] [CrossRef] [Scilit]
- Che, J.; Qiao, T.Z.; Yang, Y.; Zhang, H.T.; Pang, Y.S. Longitudinal tear detection method of conveyor belt based on audio-visual fusion. Measurement 2021, 176, 109152. [Google Scholar] [CrossRef] [Scilit]
- Wang, B.; Ding, H.; Teng, F.; Liu, H. Damage Detection of X-ray Image of Conveyor Belts with Steel Rope Cores Based on Improved FCOS Algorithm. J. Shanghai Jiaotong Univ. (Sci.) 2025, 30, 309–318. [Google Scholar] [CrossRef] [Scilit]
- Sha, L.; Zhang, W.; Zhou, J.; Peng, C.; Yu, Z. Review of Non-Destructive Testing Techniques for Conveyor Belt Damage. NDT 2025, 3, 27. [Google Scholar] [CrossRef] [Scilit]
- Valantin, C.; Lacroix, F.; Deffarges, M.P.; Morcel, J.; Hocine, N.A. Interfacial damage on fatigue-loaded textile-rubber composites. J. Appl. Polym. Sci. 2015, 132, 41346. [Google Scholar] [CrossRef] [Scilit]
- Saboktakin, A.; Vu-Khanh, T. A comparative quality assessment of textile composite using NDT and geometrical inspection techniques. Polym. Compos. 2014, 35, 1818–1825. [Google Scholar] [CrossRef] [Scilit]
- Straumit, I.; Lomov, S.V.; Wevers, M. Quantification of the internal structure and automatic generation of voxel models of textile composites from X-ray computed tomography data. Compos. Part A Appl. Sci. Manuf. 2015, 69, 150–158. [Google Scholar] [CrossRef] [Scilit]
- Bale, H.; Blacklock, M.; Begley, M.R.; Marshall, D.B.; Cox, B.N.; Ritchie, R.O. Characterizing three-dimensional textile ceramic composites using synchrotron X-ray micro-computed-tomography. J. Am. Ceram. Soc. 2012, 95, 392–402. [Google Scholar] [CrossRef] [Scilit]
- Badel, P.; Vidal-Sallé, E.; Maire, E.; Boisse, P. Simulation and Tomography Analysis of Textile Composite Reinforcement Deformation at the Mesoscopic Scale. Compos. Sci. Technol. 2008, 68, 2433–2440. [Google Scholar] [CrossRef] [Scilit]
- Kowaluk, T.; Woźniak, A. Methods for verifying the dimensional and material properties on industrial CT scanners according to VDI/VDE 2630 Blatt 1.3. In Advanced Mechatronics Solutions. Advances in Intelligent Systems and Computing; Jabłoński, R., Brezina, T., Eds.; Springer: Cham, Switzerland, 2016; Volume 393, pp. 341–346. [Google Scholar] [CrossRef] [Scilit]
- Fedorko, G.; Molnar, V.; Dovica, M.; Toth, T.; Fabianova, J.; Strohmandl, J.; Neradilova, H.; Hegedus, M.; Belusko, M. Analysis of defects in carcass of rubber–textile conveyor belts using metrotomography. J. Ind. Text. 2017, 47, 1812–1829. [Google Scholar] [CrossRef] [Scilit]
- Fedorko, G.; Molnar, V.; Marasova, D.; Grincova, A.; Dovica, M.; Zivc’k, J.; Toth, T.; Husakova, N. Failure analysis of belt conveyor damage caused by the falling material. Part II: Application of computer metrotomography. Eng. Fail. Anal. 2013, 34, 431–442. [Google Scholar] [CrossRef] [Scilit]
- Fedorko, G.; Molnar, V.; Dovica, M.; Husakova, N.; Kral’jr., J.; Ferdynus, M. The use of industrial metrotomography in the field of maintenance and reliability of rubber-textile conveyor belts in closed continuous transport systems. Eksploat. I Niezawodn. Maint. Reliab. 2016, 18, 539–543. [Google Scholar] [CrossRef] [Scilit]
- Hao, X.L.; Meng, X.J.; Zhang, Y.Q.; Xue, J.D.; Xia, J.Y. Conveyor-belt detection of conditional deep convolutional generative adversarial network. CMC Comput. Mater. Contin. 2021, 69, 2671–2685. [Google Scholar] [CrossRef] [Scilit]
- Guo, X.Q.; Liu, X.H.; Krolczyk, G.; Sulowicz, M.; Glowacz, A.; Gardoni, P.; Li, Z. Damage detection for conveyor belt surface based on conditional Cycle Generative Adversarial Network. Sensors 2022, 22, 3485. [Google Scholar] [CrossRef] [Scilit] [PubMed]
- Garcia, J.; Rios-Colque, L.; Pena, A.; Rojas, L. Condition monitoring and predictive maintenance in industrial equipment: An NLP-assisted review of Signal Processing, Hybrid Models, and Implementation Challenges. Appl. Sci. 2025, 15, 5465. [Google Scholar] [CrossRef] [Scilit]
- Pulcini, V.; Modoni, G. Machine learning-based digital twin of a conveyor belt for predictive maintenance. Int. J. Adv. Manuf. Technol. 2024, 133, 6095–6110. [Google Scholar] [CrossRef] [Scilit]
- Martinez-Rau, L.S.; Zhang, Y.; Oelmann, B.; Bader, S. On-device anomaly detection in conveyor belt operations. IEEE Open J. Instrum. Meas. 2025, 4, 2500609. [Google Scholar] [CrossRef] [Scilit]
- Kirjanów-Blazej, A.; Rzeszowska, A. Conveyor Belt Damage Detection with the Use of a Two-Layer Neural Network. Appl. Sci. 2021, 11, 5480. [Google Scholar] [CrossRef] [Scilit]
- Rzeszowska, A.; Jurdziak, L.; Blazej, R. Feasibility study of neural network-based classification of conveyor belt damage using partial DiagBelt data. Civ. Environ. Eng. Rep. 2025, 35, 0313–0325. [Google Scholar] [CrossRef] [Scilit]
- Yuan, Y.; Li, Y.C.; Gao, B.; Bai, Y.C.; Wang, M.; Wang, H.; Zhou, L.D. Conveyor belt damage detection based on machine learning. J. Comput. Methods Sci. Eng. 2025, 25, 438–454. [Google Scholar] [CrossRef] [Scilit]
- Zhang, M.C.; Zhang, Y.; Zhou, M.S.; Jiang, K.; Shi, H.; Yu, Y.; Hao, N.N. Application of lightweight convolutional neural network for damage detection of conveyor belt. Appl. Sci. 2021, 11, 7282. [Google Scholar] [CrossRef] [Scilit]
- Parmar, P.; Jurdziak, L.; Rzeszowska, A.; Burduk, A. Predictive Modeling of Conveyor Belt Deterioration in Coal Mines Using AI Techniques. Energies 2024, 17, 3497. [Google Scholar] [CrossRef] [Scilit]
- Rucki, M.; Kilikevicius, A.; Bzinkowski, D.; Ryba, T. Identification of rubber belt damages using machine learning Algorithms. Appl. Sci. 2025, 15, 10449. [Google Scholar] [CrossRef] [Scilit]
- Andrejiova, M.; Grincova, A.; Marasova, D.; Kimakova, Z. Machine Learning Methods as a Tool for Analysis and Prediction of Impact Resistance of Rubber-Textile Conveyor Belts. Appl. Sci. 2025, 15, 8511. [Google Scholar] [CrossRef] [Scilit]
- Bzinkowski, D.; Rucki, M.; Chalko, L.; Kilikevicius, A.; Matijosius, J.; Cepova, L.; Ryba, T. Application of machine learning algorithms in real-time monitoring of conveyor belt damage. Appl. Sci. 2024, 14, 10464. [Google Scholar] [CrossRef] [Scilit]
- Wu, M.; Goh, K.W.; Chaw, K.H.; Koh, Y.S.; Dares, M.; Yeong, C.F.; Su, E.L.M.; Wiliam, H.; Zhang, Y.H. An intelligent predictive maintenance system based on random forest for addressing industrial conveyor belt challenges. Front. Mech. Eng. 2024, 10, 1383202. [Google Scholar] [CrossRef] [Scilit]
- Tkac, J.; Toth, T.; Fedorko, G.; Molnar, V.; Dovica, M.; Samborski, S. Surface Evaluation of Gyroid Structures for Manufacturing Rubber–Textile Conveyor Belt Carcasses Using Micro-CT. Polymers 2024, 16, 48. [Google Scholar] [CrossRef] [Scilit] [PubMed]

Disclaimer/Publisher’s Note: The statements, opinions and data contained in all publications are solely those of the individual author(s) and contributor(s) and not of MDPI and/or the editor(s). MDPI and/or the editor(s) disclaim responsibility for any injury to people or property resulting from any ideas, methods, instructions or products referred to in the content. |
© 2026 by the authors. Licensee MDPI, Basel, Switzerland. This article is an open access article distributed under the terms and conditions of the Creative Commons Attribution (CC BY) license.