


Abstract
Reactive Ion Etching (RIE) equipment widely employs showerhead-type structures to ensure plasma and etching uniformity; however, geometric degradation of the showerhead nozzle exit during prolonged operation may alter the internal chamber environment and thereby affect process performance. In this study, the effects of showerhead nozzle exit geometric degradation on process characteristics were evaluated for a 300 mm wafer-scale RIE system using a multiphysics numerical approach. A total of 16 analysis cases were constructed according to nozzle position and nozzle exit diameter, and Computational Fluid Dynamics (CFD), electrostatic analysis, and particle tracing analysis were performed sequentially using COMSOL Multiphysics. The results showed that increasing the showerhead nozzle exit diameter decreased both the pressure and velocity at the nozzle exit, while increasing the electric potential near the nozzle exit. These changes led to different wafer-level distributions of neutral and charged species. Neutral species were mainly affected by drag-based transport under the flow field, whereas charged species were influenced by both the flow field and the electric potential distribution. Cases with below-range neutral-species distributions occurred more frequently than cases with above-range distributions, and below-range charged-species distributions were concentrated in cases with larger diameter combinations. These findings indicate that geometric degradation of the showerhead nozzle exit can influence wafer-level reactive-species distributions through coupled fluidic and electrical pathways and may contribute to process non-uniformity.
1. Introduction
Advanced semiconductor and display device fabrication relies heavily on fine patterning processes, which are critical to device performance. Such ultra-precise patterning is generally achieved through etching processes [1,2]. Among various etching methods, dry etching removes target materials through physicochemical reactions involving charged particles and neutral radicals generated in a plasma state of the process gas [3]. Reactive Ion Etching (RIE) is a representative process that enables effective control of these physicochemical etching reactions. Owing to its high anisotropy, RIE allows precise control of fine critical dimensions and is therefore regarded as one of the key technologies in advanced semiconductor manufacturing. In RIE systems, showerhead-type structures are widely employed to ensure plasma and etching uniformity [4]. The showerhead, one of the key components of the equipment, is located at the top of the chamber, where it functions both as a gas distributor and as an upper electrode.
Meanwhile, major chamber components in etching equipment, including the showerhead, focus ring, and electrodes, undergo geometric degradation under harsh and prolonged process environments despite protective coatings [5]. The geometry of internal chamber components is an important variable affecting process performance [6]. Geometric changes in these components can directly alter the flow field and electric field distribution, and such changes may eventually lead to deterioration in etching uniformity as well as reduced process reproducibility. Although geometric changes in showerhead nozzles are expected to affect process characteristics, related studies remain limited. Assessing their influence requires prior process diagnostics.
Conventional process diagnostic methods can largely be classified into two categories: sensor-based measurement and surface analysis. Representative sensor-based approaches include the Langmuir probe, which directly measures electron temperature and plasma density by inserting a probe into the plasma; the cutoff probe, which is used to measure electron density and electromagnetic response characteristics; and the ion energy analyzer, which directly measures ion energy distributions [7,8,9]. These sensors are inserted directly into the chamber to acquire signals and thus have the advantage of enabling direct measurement of physical quantities. However, the insertion of sensors itself may disturb the process by altering gas flow or discharge characteristics inside the chamber, thereby potentially distorting the process conditions [10].
Surface analysis refers to methods that directly examine the surface state and chemical composition of the substrate after processing. Representative techniques include Scanning Electron Microscopy (SEM) and X-ray Photoelectron Spectroscopy (XPS). SEM enables high-resolution observation of fine structures and etch profiles by detecting reflected and secondary electrons emitted from the sample surface. XPS provides information on elemental composition and bonding states from the energy spectrum of photoelectrons emitted from the surface. These surface analysis methods are useful because they directly reveal the structural and chemical characteristics of the processed substrate, thereby enabling diagnosis of process outcomes. However, since such analyses are performed only after the process is completed, they are inherently limited in reflecting the in-process chamber environment, resulting in insufficient understanding of the process itself [11]. Furthermore, because these approaches are mostly based on experimental data, they require substantial human and material resources to conduct repeated experiments and acquire sufficient datasets [12].
To overcome these limitations, continuous efforts have been made to numerically simulate the internal environment of semiconductor etching equipment. Numerical simulation provides a non-intrusive means of examining chamber conditions, enables quantitative analysis of physical fields that are difficult to access experimentally, and facilitates systematic evaluation of the effects of reactor parameters [13]. Computational Fluid Dynamics (CFD) based studies such as [14] have investigated the effects of showerhead and chamber geometries on gas flow distribution and pressure field formation. Likewise, electrical analysis-based studies such as [15] have examined potential distributions and ion transport characteristics under different electrode conditions and operating modes. However, most previous studies have investigated individual physical phenomena separately, such as gas-flow behavior, electric field characteristics, or particle transport, or have focused on general reactor design parameters. Consequently, limited attention has been paid to how component degradation occurring during actual equipment operation propagates sequentially through multiple physical fields and ultimately influences wafer-level reactive-species distributions.
Although CFD, electrostatic analysis, and particle transport analysis have each been applied to semiconductor etching systems, studies integrating these analyses within a single sequential-coupling framework to evaluate the effects of showerhead nozzle exit degradation remain limited. Therefore, the present study focuses on tracing the sequential influence of nozzle exit geometric degradation on the flow field, electric potential distribution, and wafer-level reactive-species transport within a unified multiphysics framework.
Therefore, this study evaluated the effects of showerhead nozzle exit geometry changes on a 300 mm wafer-scale RIE system using a multiphysics framework. The resulting changes in the flow field and electric potential distribution were first analyzed, after which the transport behaviors of neutral and charged etching species were sequentially calculated to compare their wafer-scale distributions. Unlike previous simulation studies that mainly focused on isolated physical phenomena or general reactor design variables, the present work considers nozzle exit geometry change as a practically relevant form of equipment degradation and physically traces its sequential influence on process-relevant fields and species transport. This approach provides a basis for future virtual process diagnostics and predictive maintenance of showerhead degradation.
2. Methods
2.1. Overview
Inside the chamber where the semiconductor etching process takes place, process outcomes are governed by the coupled interactions among process gas flow, electric potential distribution, and the transport and surface arrival of neutral and charged species. To physically reproduce this internal environment of semiconductor etching equipment, COMSOL Multiphysics (Version 6.3, COMSOL Inc., Burlington, MA, USA), a commercial simulation platform, was employed based on a multiphysics analysis approach.
The target system of this study was a 300 mm wafer-scale RIE system currently operated in industry. The showerhead nozzles were arranged in a circular pattern according to the showerhead radius and were divided into a total of eight groups. A three-dimensional computational domain including the showerhead and chamber was established, and a quarter-symmetry model was applied by considering both the geometric symmetry of the target structure and computational efficiency. The mesh was generated using the meshing function in COMSOL Multiphysics with three-dimensional tetrahedral elements. To ensure the numerical reliability of the analysis results, a mesh independence test was performed. Several mesh densities were examined, and the final mesh was selected when further refinement produced only negligible differences in the key variables of interest.
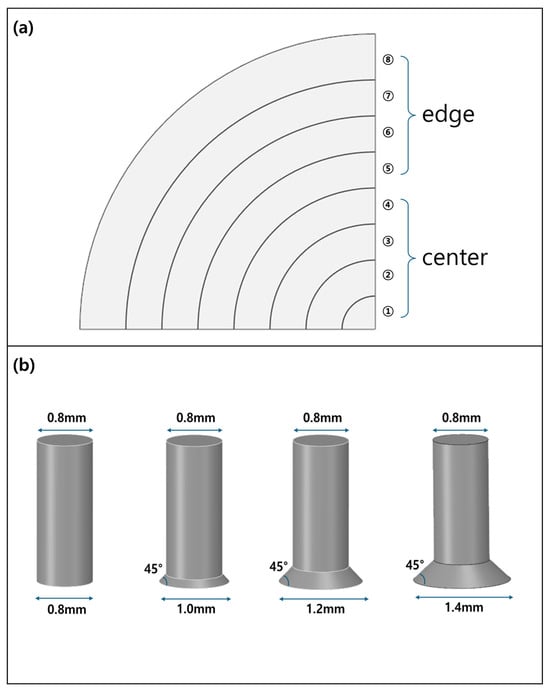
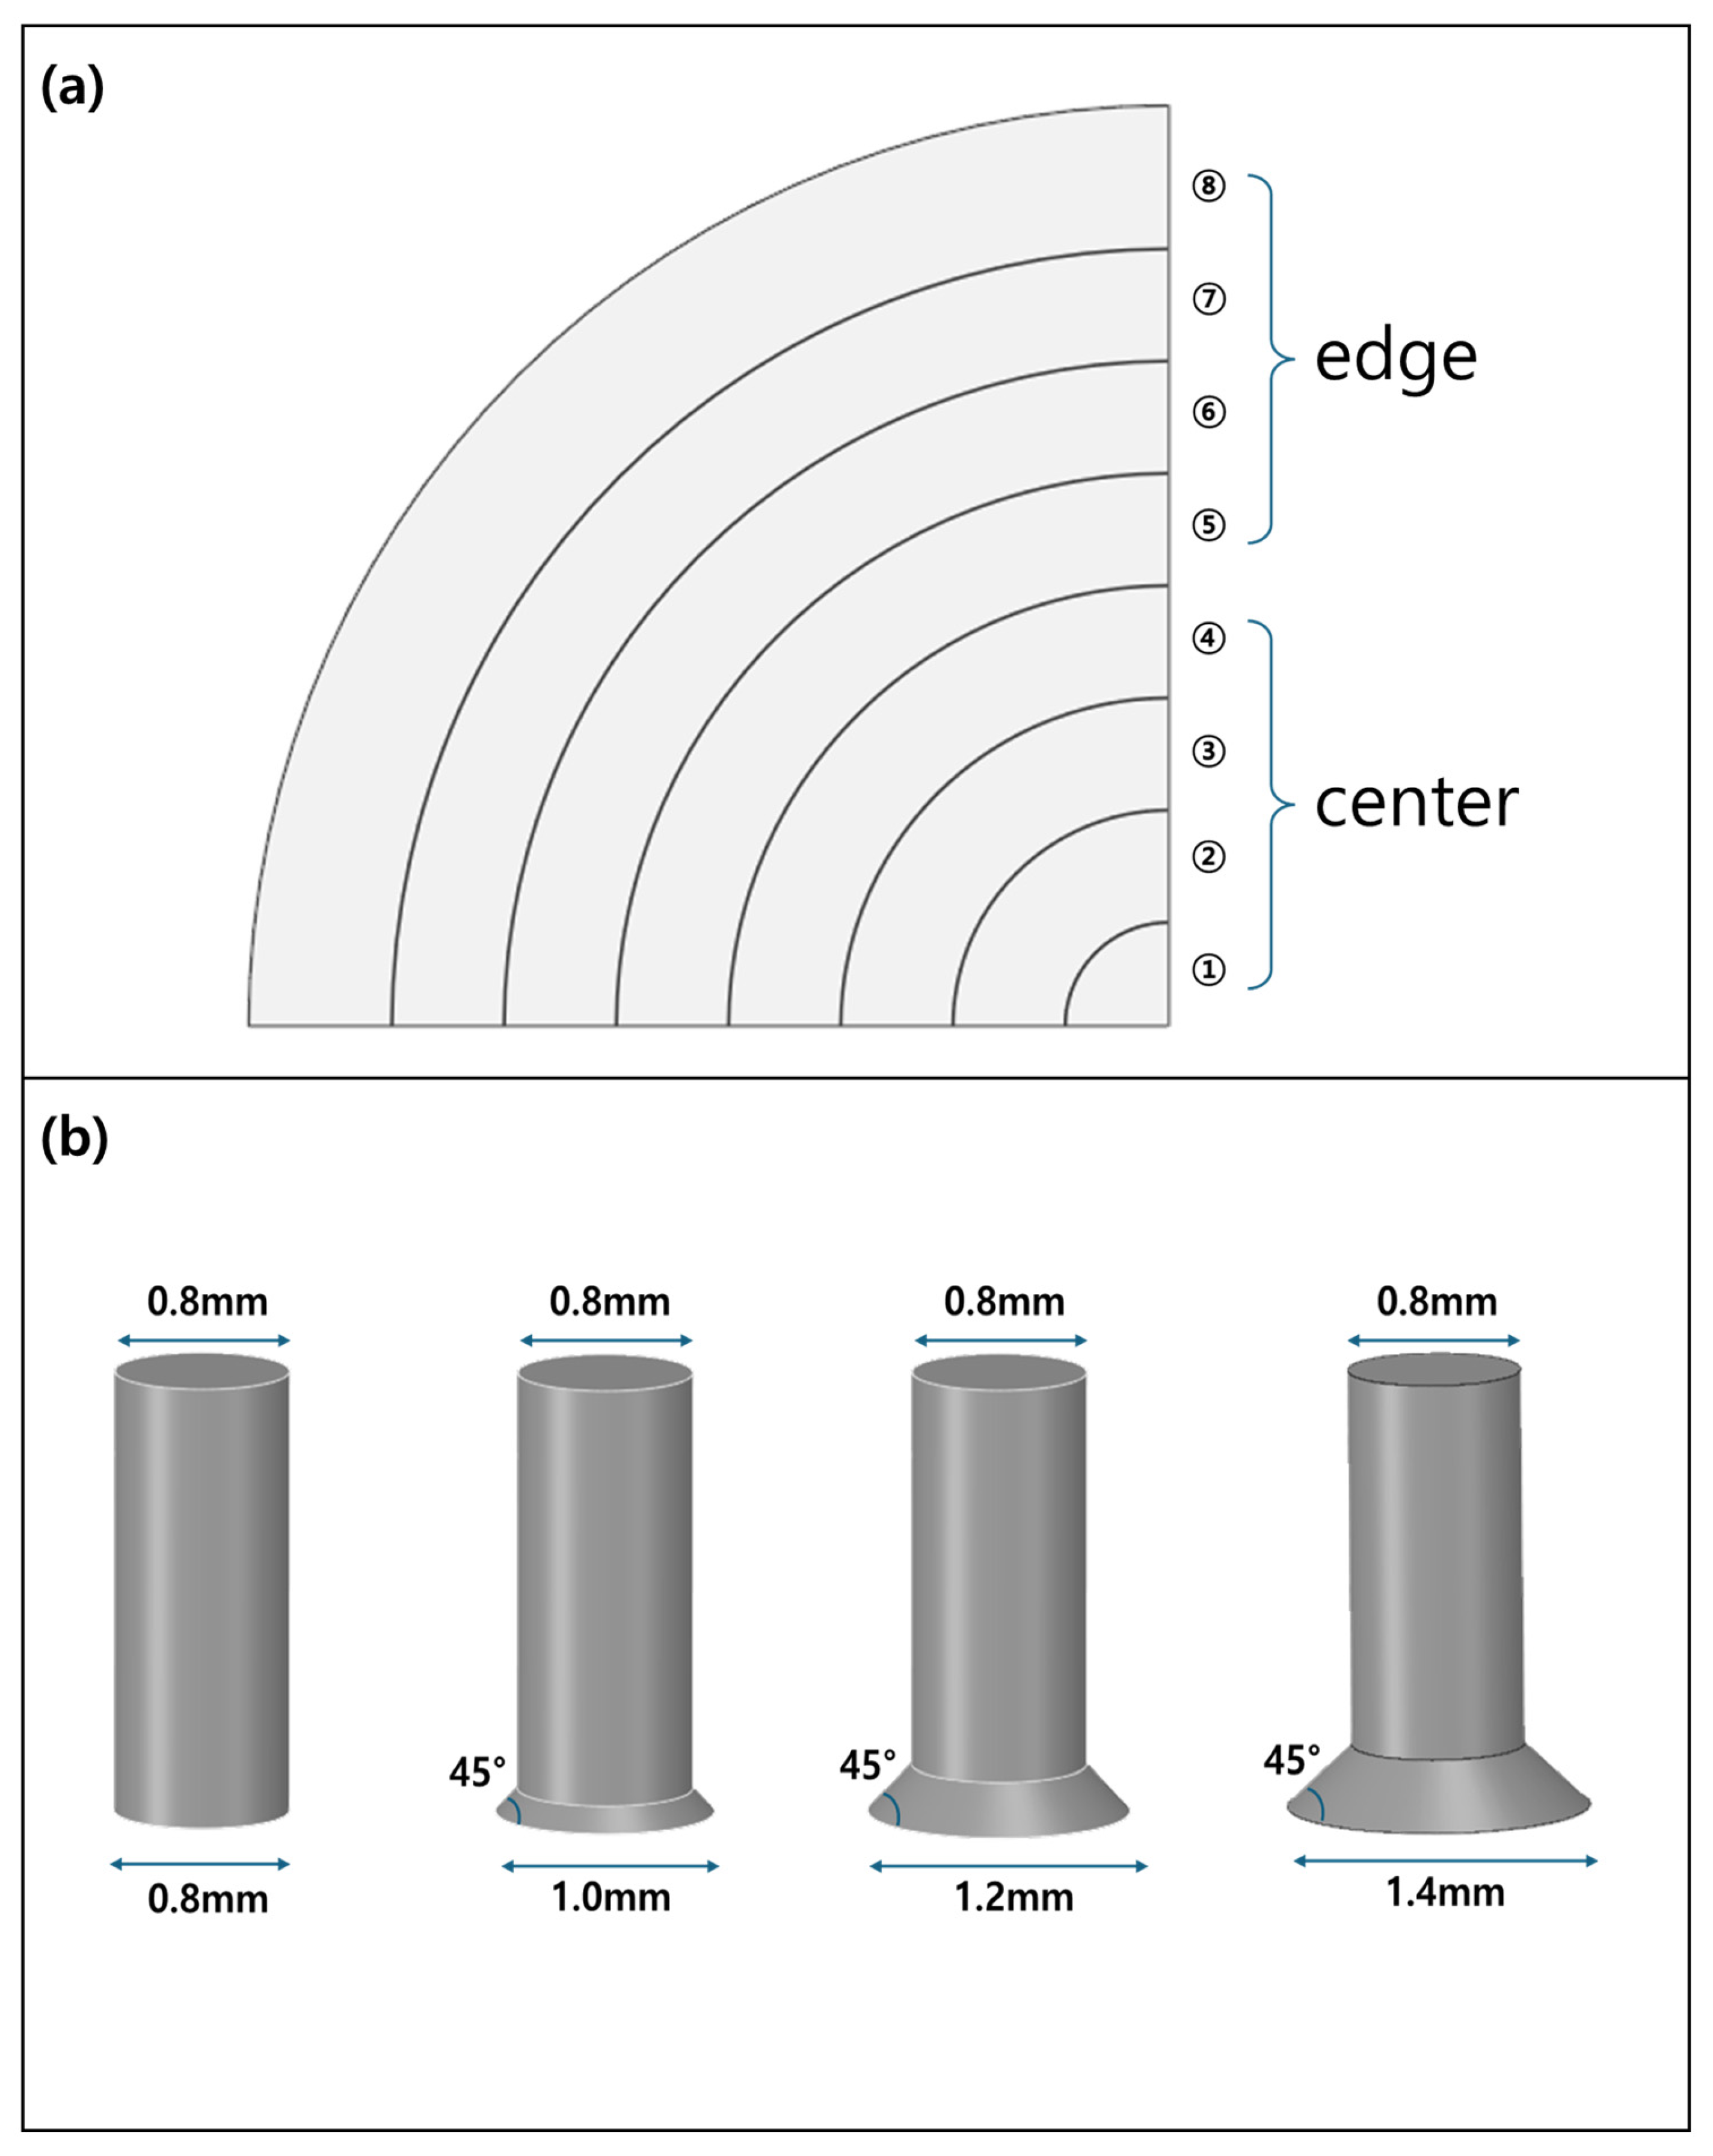
In this study, a total of 16 analysis cases were constructed to evaluate the effects of showerhead nozzle exit geometric degradation on the internal fields of the chamber and on particle distributions. Figure 1a shows the top view of the showerhead. Nozzles are arranged in the radial direction in each zone marked ①–⑧. To examine the spatial effect according to nozzle location, the radial positions of the showerhead were divided into locations ①–④ and ⑤–⑧, and the center-to-edge differences were compared. Figure 1b shows the showerhead nozzle cases. Taking the original nozzle diameter of 0.8 mm before geometric degradation as the reference, the diameter was increased to 1.0, 1.2, and 1.4 mm to represent progressive geometric degradation. Here, 1.0 and 1.2 mm reflected geometric degradation conditions observed during actual equipment operation, whereas 1.4 mm was included as an extended degradation condition to investigate the potential effects of continued nozzle wear beyond the currently observed range. Although this diameter was not directly observed in the target equipment, it was considered a plausible future degradation scenario for trend analysis. Accordingly, the 16 analysis cases in this study were designed to reflect the spatial variation in nozzle diameter and to allow independent comparison of the effects of each variable.
Figure 1.
Explanation of Analysis Cases (a) top view of the showerhead, depending on the showerhead radius, ① to ④ are the center section, and ⑤ to ⑧ are the edge section; (b) Showerhead Nozzle Outlet Diameter.
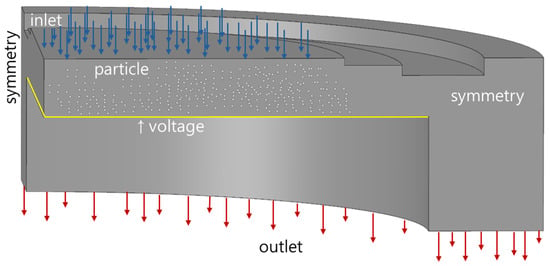
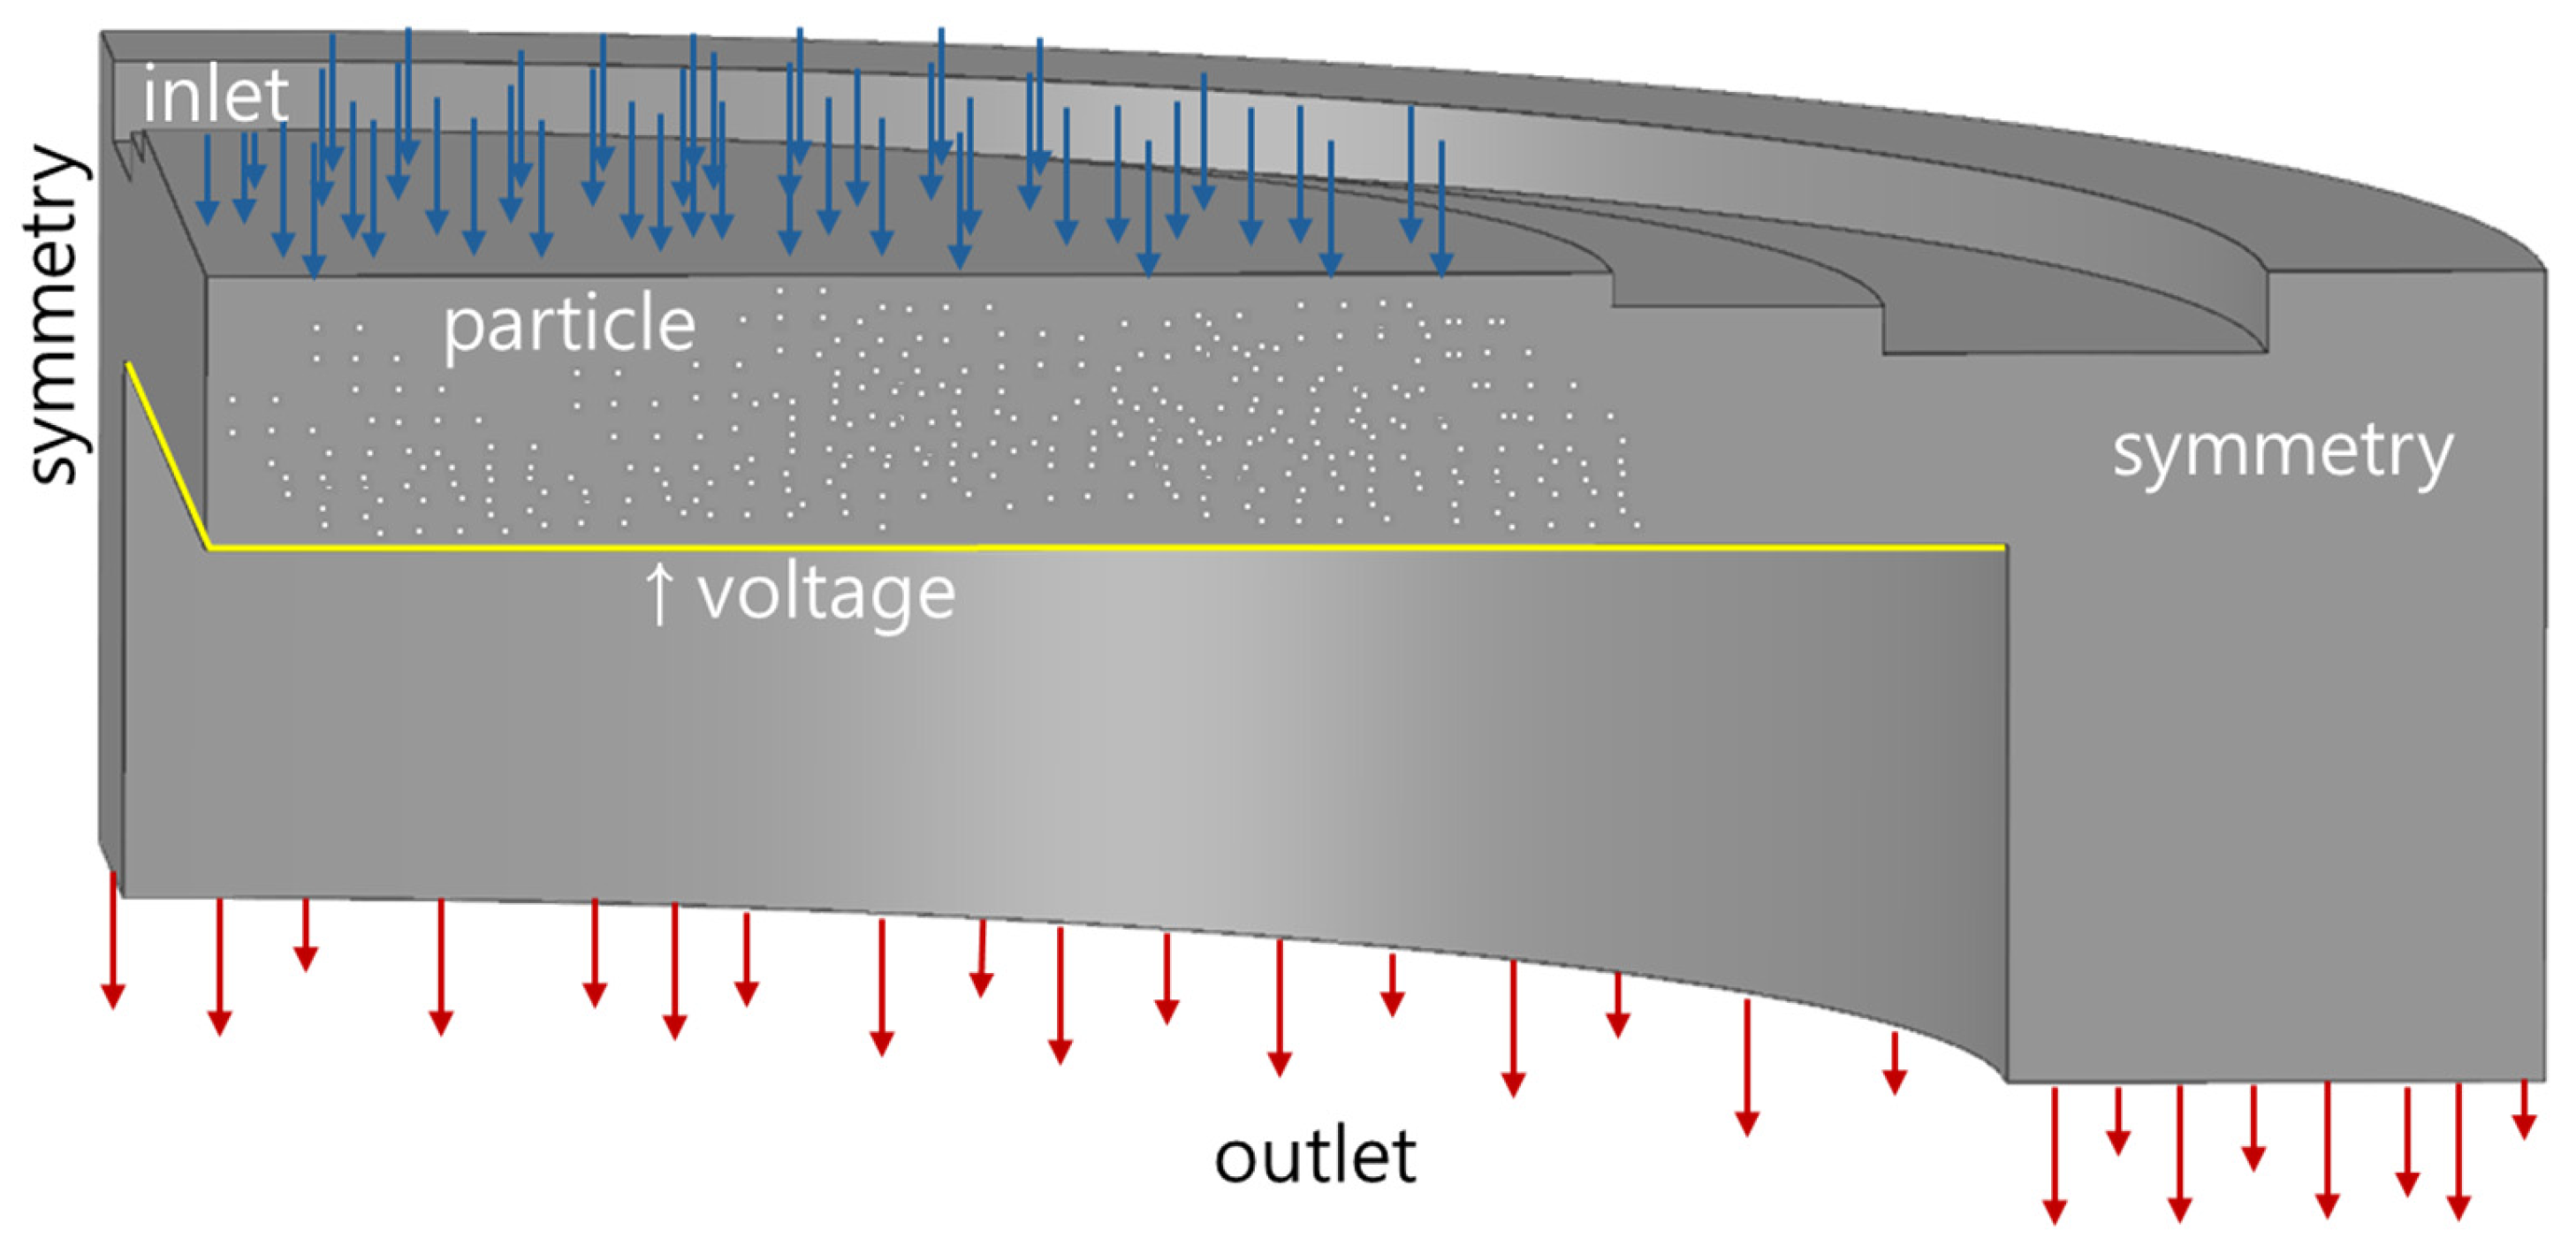
The boundary conditions for the multiphysics numerical analysis are illustrated in Figure 2. In the CFD model, the inlet and outlet were assigned mass flow rate and pressure values, respectively, based on the actual process conditions. For the wall boundary condition, a slip wall condition was applied according to the calculated Knudsen number. In the electrostatic analysis, an electric potential was applied to the wafer holder, the showerhead was set to ground, and the remaining chamber walls were assigned a zero-charge condition. In the particle tracing analysis, the inlet and outlet boundaries were set to ‘disappear’, while all other surfaces were set to ‘freeze’ so that particles stopped upon contact with the surface. In this study, to independently evaluate the effect of showerhead nozzle exit geometric degradation, the temperatures of the chamber walls and major boundaries were fixed at room temperature, 293.15 K. This was intended to exclude the effects of temperature-induced variations in the physical fields and to compare only the relative effects of nozzle geometric degradation. The transport behaviors of neutral and charged etching species toward the wafer were analyzed based on the flow field and electric potential distribution obtained from the preceding analyses. The electric potential field used in this study was obtained from a simplified electrostatic model and did not include self-consistent plasma discharge phenomena such as plasma shielding or sheath dynamics. In other words, the results of the CFD and electrostatic analysis were transferred as input fields to the subsequent particle tracing analysis. The validity of the present multiphysics analysis methodology was confirmed through comparison with experimental results.
Figure 2.
Multiphysics analysis boundary conditions.
2.2. CFD
2.2.1. CFD Model and Setup
Because direct experimental measurement of gas flow inside semiconductor equipment is difficult, numerical approaches have been widely employed [16]. In this study, CFD was used to quantitatively characterize the chamber flow field. Based on the dimensionless number calculations and evaluation results presented in Section 2.2.3, the flow regime was identified as slip flow . Accordingly, the Navier–Stokes equations were adopted as the governing equations, and a slip boundary condition was imposed on the wall surfaces. The flow was modeled as laminar and incompressible , and the CFD analysis was performed under steady-state conditions.
2.2.2. Calculation of Mixed-Gas Properties
In this study, a mixed gas composed of five species, including CF4, CO, and Ar, was used. The process gas was assumed to be an equivalent neutral gas mixture prior to dissociation, and representative properties were estimated accordingly. Therefore, the calculated density and viscosity do not directly reflect reactive plasma chemistry, but rather representative carrier-gas properties used to evaluate the relative changes in the flow field induced by geometric degradation of the showerhead nozzle exit. As listed in Table 1, the representative properties of the mixed gas were calculated and applied in the CFD analysis.
Table 1.
Properties of mixed gases.
The density of the mixed gas was calculated using the incompressible ideal-gas equation of state [17].
Here, denotes the operating pressure, while and represent the gas constant and operating temperature, respectively. and denote the mass fraction and molar mass of the th gas species, respectively.
Because gas viscosity is temperature-dependent, viscosity values reported in the literature or databases vary with the measurement temperature. In fact, viscosity data for individual gases are typically reported under different temperature conditions. Direct use of these values may not accurately reflect the material properties under the actual process conditions. Therefore, prior to calculating the viscosity of the gas mixture, the experimentally reported viscosity values of the individual component gases were corrected to the operating temperature. To this end, Sutherland’s formula was employed to convert the viscosity data of each gas to the operating temperature [18].
Here, denotes the experimentally measured viscosity of each gas species. and represent the measurement temperature and the operating temperature, respectively. is the Sutherland constant, which varies depending on the gas species. The corrected viscosity values of the individual gases were then used to calculate the viscosity of the gas mixture. For this purpose, the kinetic-theory-based equation for the viscosity of gas mixtures was applied [19].
Here, denotes the mole fraction, and denotes the viscosity of the th gas species. is the correction factor, which is calculated as follows.
The molar mass of the gas mixture was determined using the average molar mass equation [20].
2.2.3. Calculation of Dimensionless Numbers for the Mixed Gas
As listed in Table 2, the flow model was determined based on the calculated dimensionless numbers of the mixed gas. Since fluid behavior depends on multiple governing variables, selecting an appropriate flow model through dimensionless number analysis prior to numerical simulation is essential.
Table 2.
Dimensionless number of mixed gases.
The Knudsen number is a key criterion in gas-flow analysis for determining whether the flow may be treated as a continuum or as a non-continuum. For , the flow lies in the continuum regime, and the Navier–Stokes equations are applicable. For , the flow is classified as the slip regime, in which the Navier–Stokes equations remain applicable. For , the flow enters the transition regime, where the Navier–Stokes equations are no longer valid. For , the flow is in the free-molecular regime, for which molecular dynamics analysis is required [21].
Here, denotes the characteristic length, which was considered separately for the nozzle and the chamber in this study. denotes the mean free path, and it was calculated using argon, which has the smallest molecular diameter among the constituent gases of the mixture. As in the viscosity correction described above, Sutherland’s formula was employed to correct the experimental value of to the process conditions. The corresponding relation is given as follows [22,23].
Here, denotes the experimentally measured mean free path. and represent the operating temperature and the measurement temperature, respectively. and represent the measurement pressure and the operating pressure, respectively. is the Sutherland constant.
The Reynolds number is a dimensionless parameter used to characterize whether a flow is laminar or turbulent. For general internal flows, a Reynolds number of 2300 is commonly adopted as the criterion separating laminar and turbulent regimes [24]. However, this criterion differs for constricted geometries such as nozzles and orifices. Previous studies [25,26] reported that turbulence in orifice geometries may occur at a Reynolds number of 70. In addition, unstable flow has been reported at a Reynolds number of 200 in geometries involving sudden expansion [27,28]. Because the showerhead of the semiconductor etching equipment considered in this study has a nozzle geometry in which expansion may occur, the criterion for distinguishing laminar and turbulent flow was set to a Reynolds number of 200.
Here, denotes the density, denotes the average velocity at the nozzle, denotes the nozzle diameter, and denotes the viscosity.
The Mach number is a dimensionless quantity used to determine whether a flow may be treated as compressible or incompressible. In general, when the Mach number is lower than 0.3, the flow-induced density variation is sufficiently small for the flow to be approximated as incompressible [29]. In this study, the calculated Mach number was 0.0335, which is well below 0.3. Therefore, the CFD analysis was performed under the incompressible-flow assumption.
Here, is the average velocity, is the specific heat ratio of the gas mixture, is the gas constant, is the operating temperature, and is the average molar mass. In addition, the present operating condition was confirmed not to reach the choked-flow condition. denotes the Mach number corresponding to choked flow.
Here, denotes the nozzle flow expansion factor, which is given by , where denotes the diameter ratio of the nozzle to the chamber, and denotes the pressure ratio between the nozzle and the chamber [30]. denotes the nozzle flow discharge coefficient and is given by .
2.3. Electrostatic Analysis
In plasma etching equipment, two types of electric fields are primarily involved. The first is the radio frequency (RF) electric field, which dissociates process gas molecules through ionization or radical formation. The second is the ion-accelerating electric field, which drives the dissociated ions toward the wafer and thereby induces physical etching. In this study, the post-dissociation condition was considered. Accordingly, the electric field responsible for ion acceleration toward the wafer was numerically analyzed. Because the magnitude and distribution of this electric field directly affect the incident energy and direction of ions, it plays a key role in directing plasma ions to the substrate and inducing etching reactions. The electrostatic analysis was conducted under steady-state conditions.
Representative operating conditions of the target equipment were applied, as summarized in Table 3. The applied potential of 1700 V corresponded to the DC self-bias voltage measured in the target industrial RIE equipment and was imposed as a constant-potential boundary condition at the wafer holder. The electrostatic analysis was carried out using the Electrostatics physics interface in COMSOL. Instead of directly simulating the RF discharge itself, including the generation and transport of electrons and ions, this analysis aimed to calculate the electric potential distribution and electric field determined by the chamber boundary conditions. Therefore, a quasi-electrostatic assumption was adopted, under which time-dependent induction effects, such as displacement current, were neglected [31], and the plasma space charge density was not solved separately [32]. As a consequence, plasma-specific phenomena including sheath formation, Debye shielding, and self-consistent charge-density distributions were not explicitly resolved in the present model. Instead, the analysis focused on representing the ion-acceleration electric field established between the showerhead and wafer after gas dissociation. This simplified approach was adopted to investigate the relative influence of showerhead nozzle degradation on electric field distribution and charged-species transport while maintaining computational efficiency. Under these assumptions, the electric potential was calculated by satisfying , and the electric field was subsequently used to evaluate the electric-force term in the particle tracing analysis [33].
Table 3.
Electrical parameters.
2.4. Particle Tracing Analysis
In the etching process, geometric degradation of the showerhead nozzle exit is expected to alter the chamber flow field and electric potential distribution, thereby ultimately affecting the radicals and ions directly involved in wafer etching. CFD and electrostatic analysis alone are insufficient to determine how these etching species are transported and distributed over the wafer. Therefore, in this study, the flow field and electric potential distribution were first obtained, and the transport behavior of the etching species within these fields was subsequently analyzed in a sequential manner. In the present analysis, the particles were assumed not to influence the flow or electric fields, and inter-particle collisions were neglected [34,35]. The particle tracing analysis was based on the Langevin equation, in which drag, diffusion, and electric forces were taken into account [36].
Here, denotes the particle mass, and denotes the particle velocity. , and denote the drag, diffusion, and electric forces, respectively. denotes the dynamic viscosity, denotes the particle density, and denotes the particle diameter. Since and represent the fluid velocity and particle velocity, respectively, represents the relative velocity between the fluid and the particle. The drag force was calculated using Stokes’ law for a spherical particle under low-Reynolds-number conditions [37]. is a normally distributed random variable with a mean of 0 and a variance of 1, introduced to account for the stochastic nature of Brownian motion arising from random thermal collisions with fluid molecules. denotes the Boltzmann constant, denotes the temperature, denotes the particle radius, and denotes the time step. denotes the elementary charge, denotes the charge number, and denotes the electric field vector.
As listed in Table 4, fluorine neutral radicals and fluorine radical ions, which are known to contribute to wafer etching, were considered in the particle tracing analysis. In actual processes, directly incorporating the total number of generated radicals and ions into the analysis is not practically feasible because of the extremely large number of particles at the molecular scale and the resulting computational cost. Therefore, a case-study approach was adopted, and an appropriate number of particles was selected to ensure convergence and statistical stability of the results. For both neutral and charged species, particles were initially distributed uniformly throughout the chamber volume with an initial velocity of 0 m/s to compare transport behavior under identical initial conditions among the degradation cases and to isolate the relative influence of nozzle exit geometric degradation on species transport. In actual RIE plasmas, however, ions are generated through ionization processes within the plasma region and are not uniformly distributed throughout the chamber. Therefore, the charged-species results should be interpreted as relative transport and distribution trends rather than absolute ion-flux predictions.
Table 4.
Particle properties.
3. Results
3.1. CFD Results
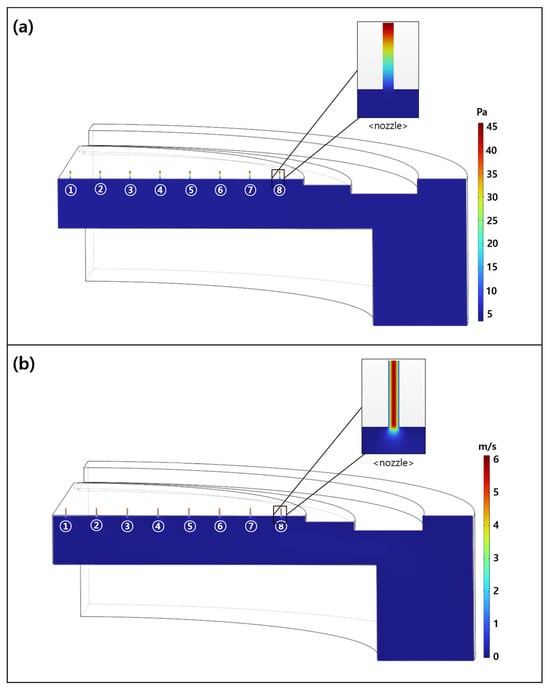
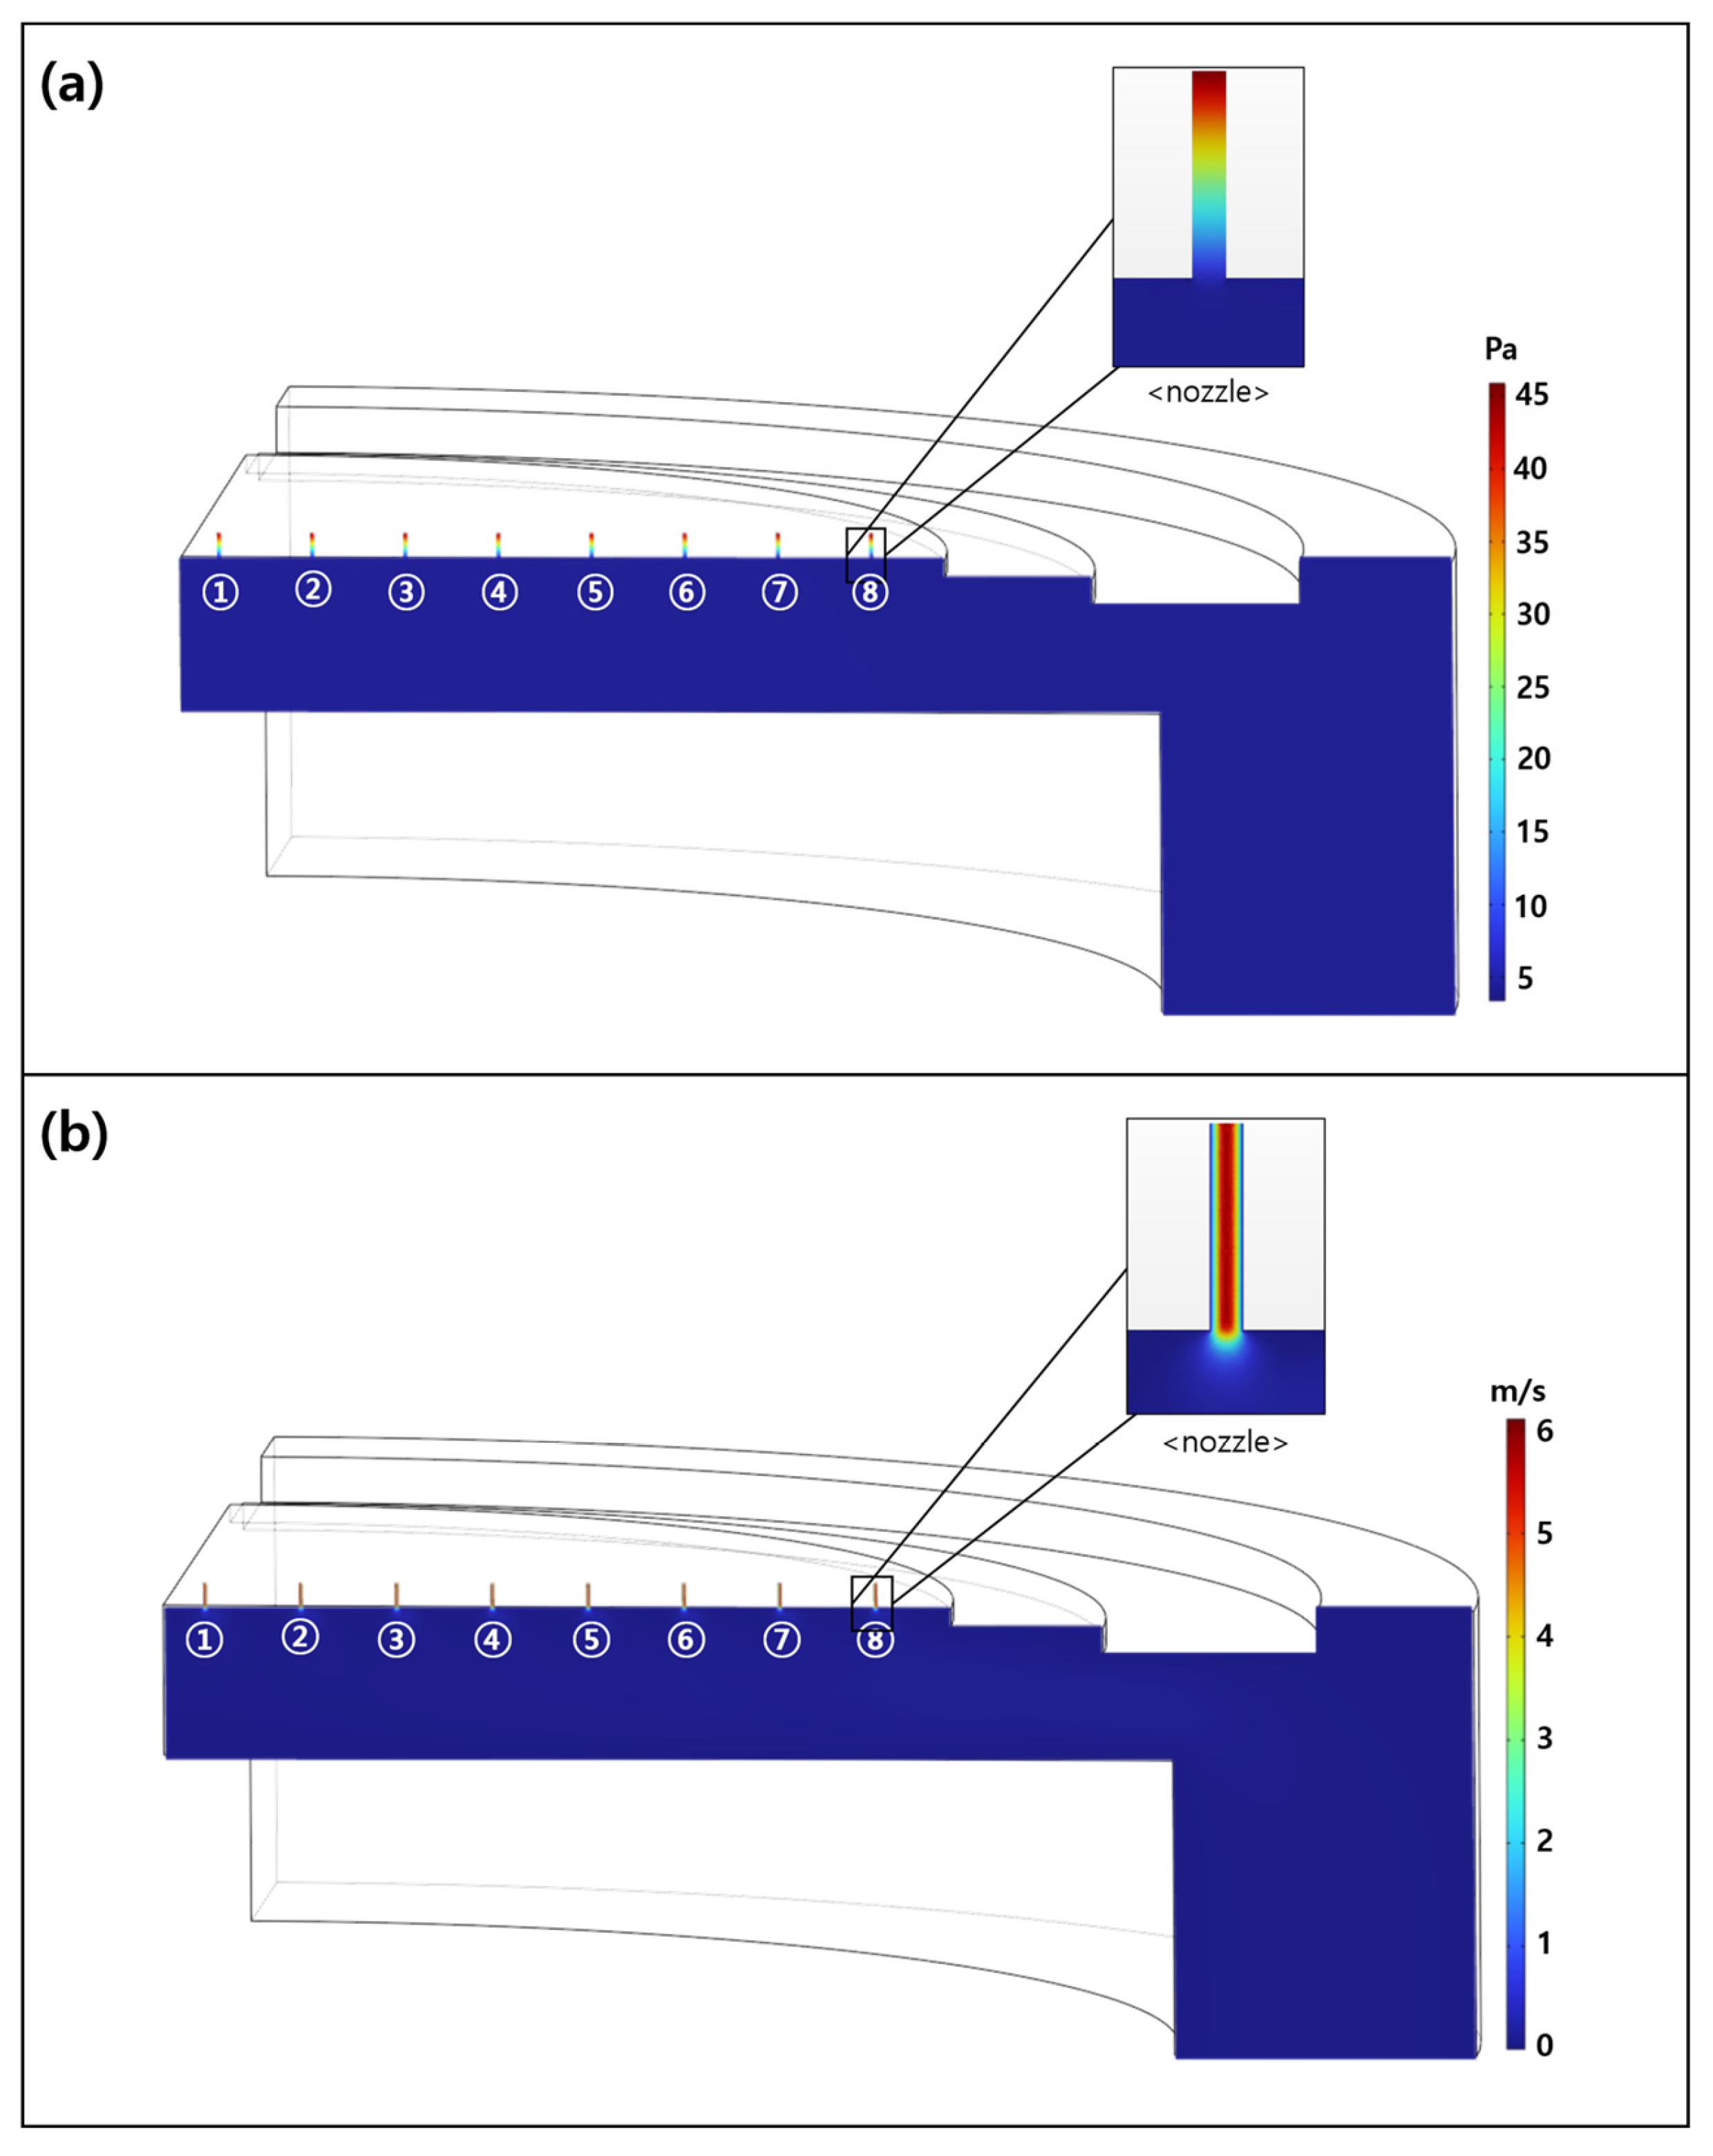
Figure 3a shows the pressure field inside the nozzle and chamber for the normal nozzle model (0.8–0.8). A pressure of approximately 45 Pa was formed at the nozzle inlet, and it decreased nearly linearly toward the showerhead nozzle exit. After the nozzle exit, the pressure decreased rapidly and converged to the chamber pressure of 3.99 Pa. This value was consistent with the chamber pressure under actual process conditions, demonstrating the validity of the analysis model.
Figure 3.
(a) Pressure field of the chamber and nozzle; (b) velocity field of the chamber and nozzle.
Figure 3b shows the velocity field inside the nozzle and chamber for the normal nozzle model (0.8–0.8). The average velocity inside the nozzle was approximately 6 m/s, and it decreased sharply after the showerhead nozzle exit. Inside the chamber, the gas velocity was negligible and was close to 0 m/s.
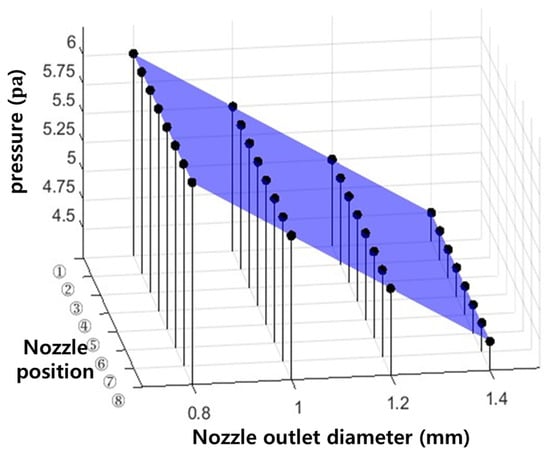
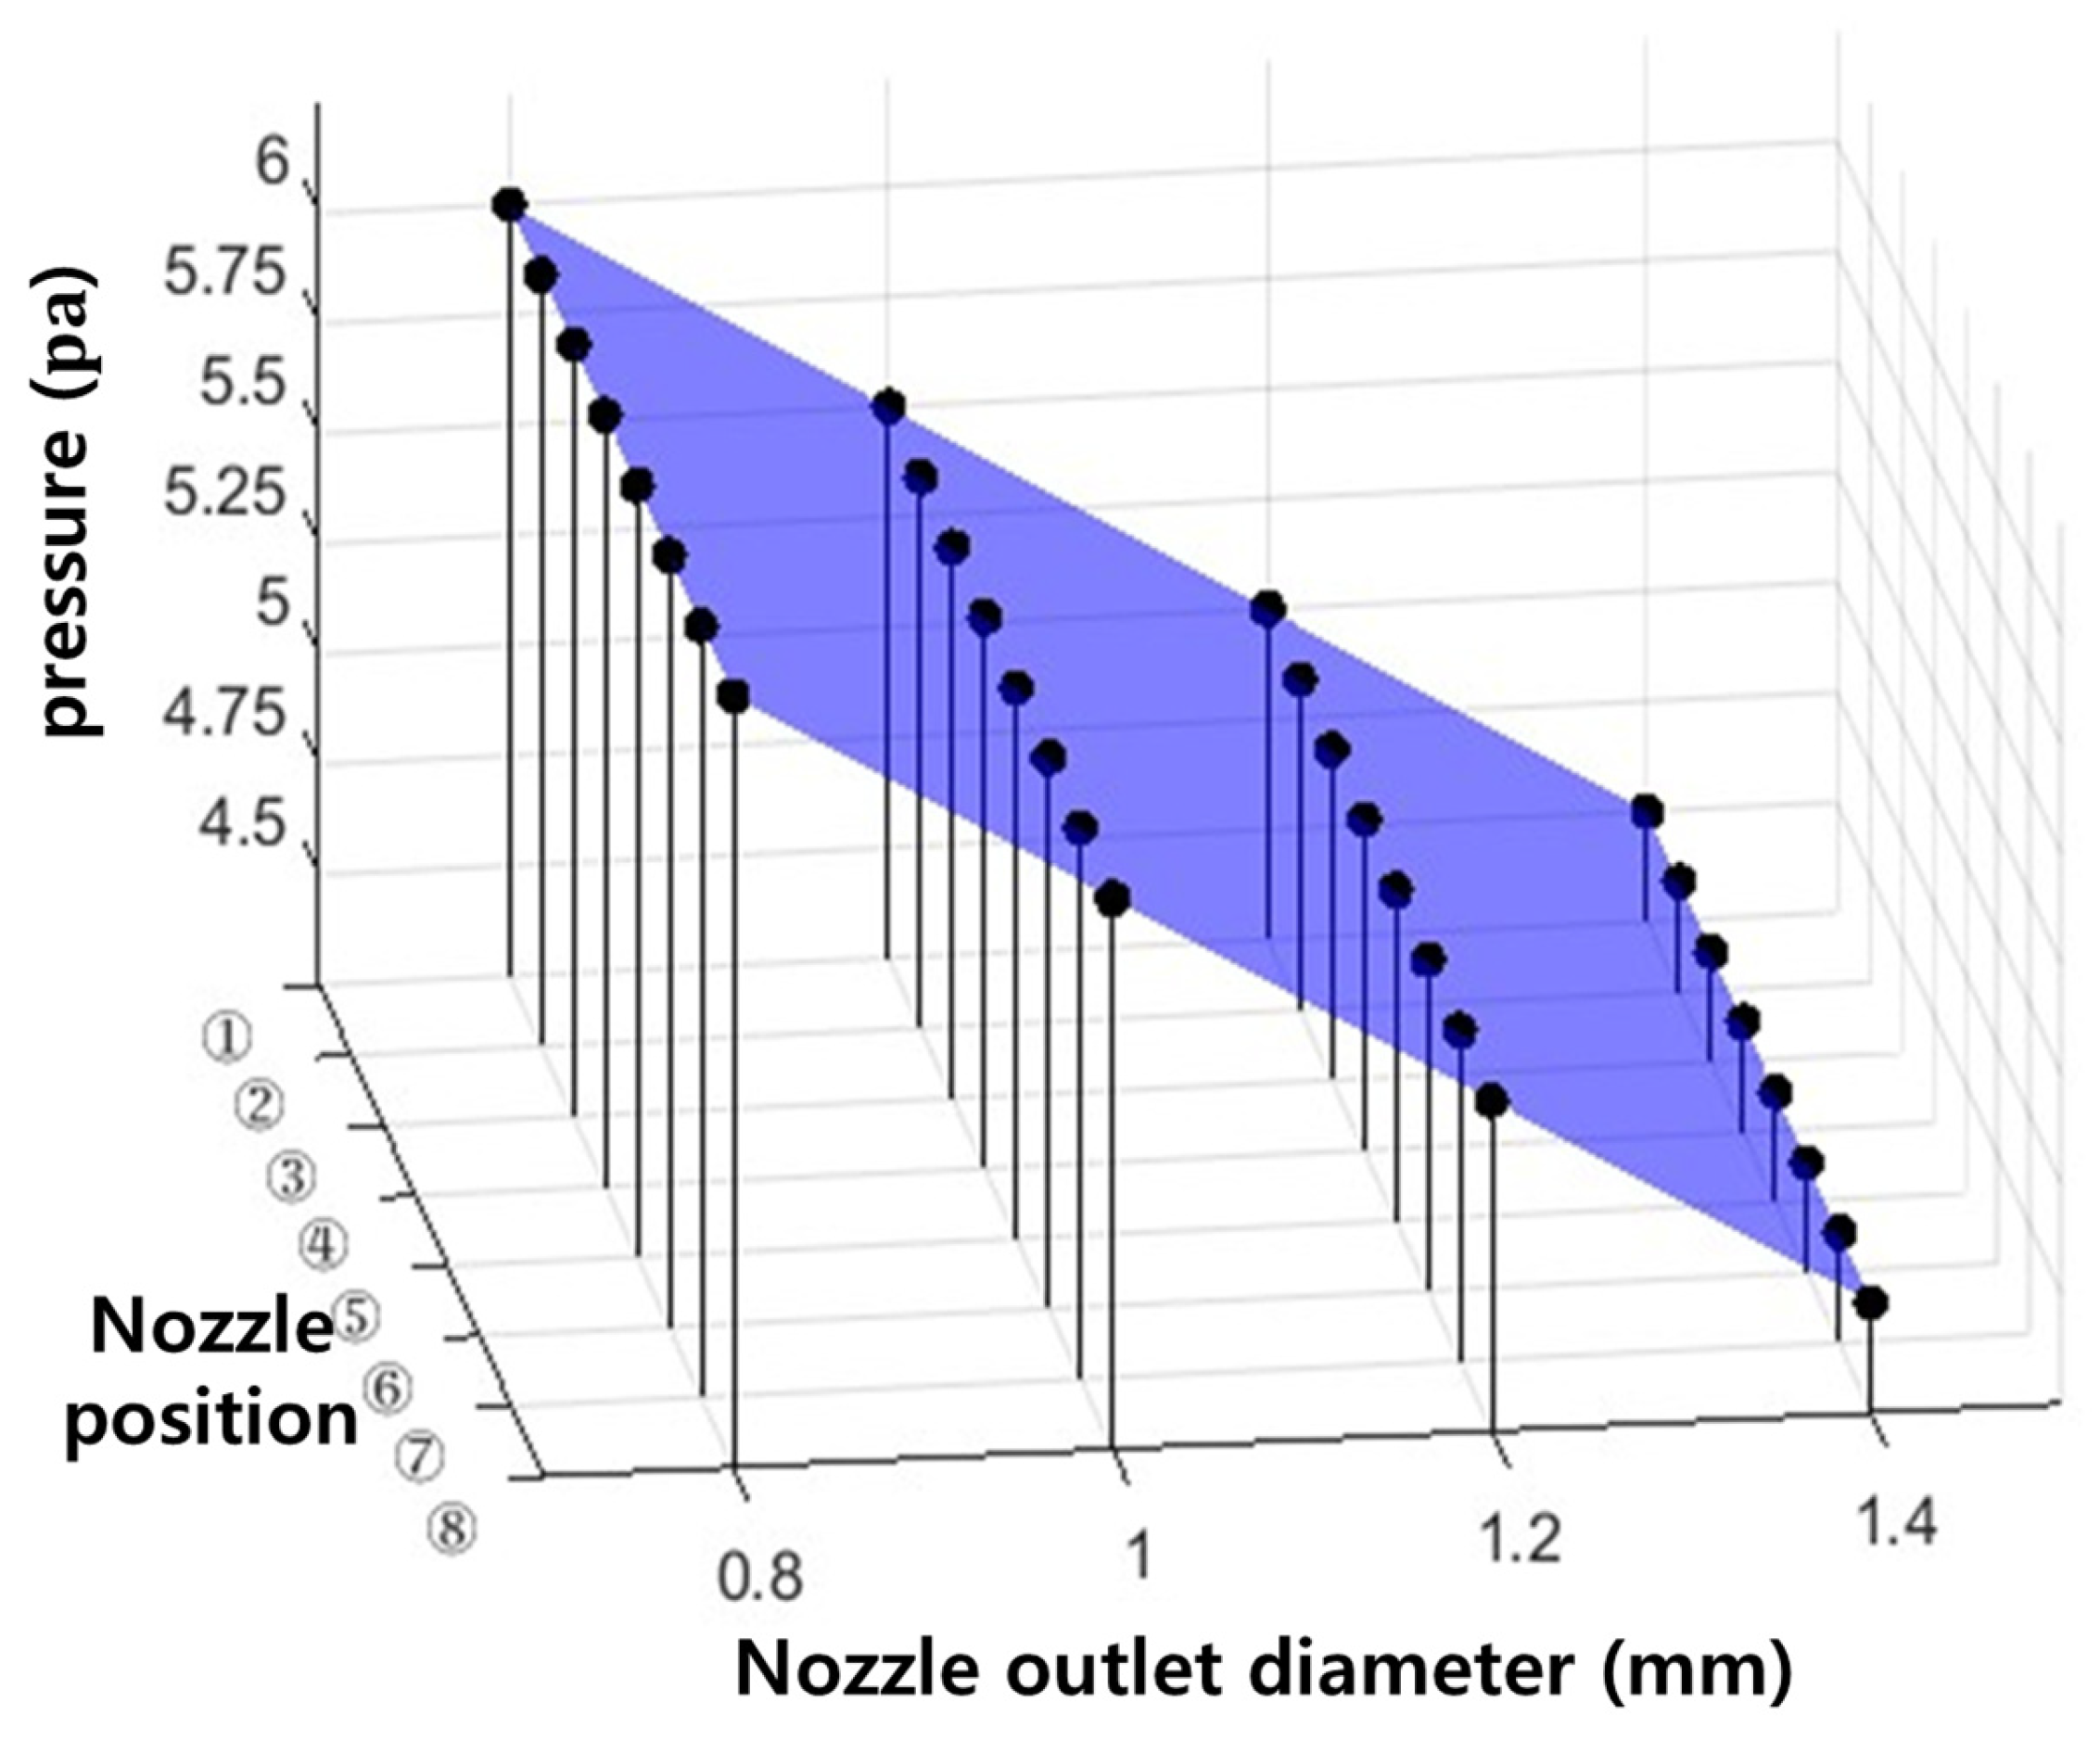
Figure 4 presents the pressure at the showerhead nozzle exit as a function of nozzle position and showerhead nozzle exit diameter. Refer to Figure 3 for nozzle positions ① to ⑧, and No noticeable variation in pressure was observed with nozzle position.In contrast, the pressure decreased as the showerhead nozzle exit diameter increased, with maximum values of 6, 5.5, 5.0, and 4.5 Pa for nozzle diameters of 0.8, 1.0, 1.2, and 1.4 mm, respectively.
Figure 4.
Nozzle exit pressure according to nozzle position and nozzle exit diameter.
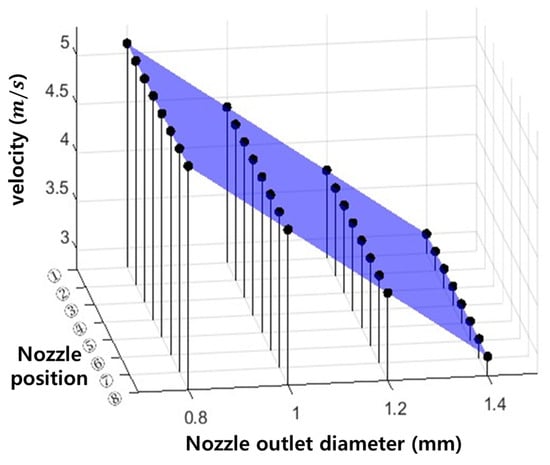
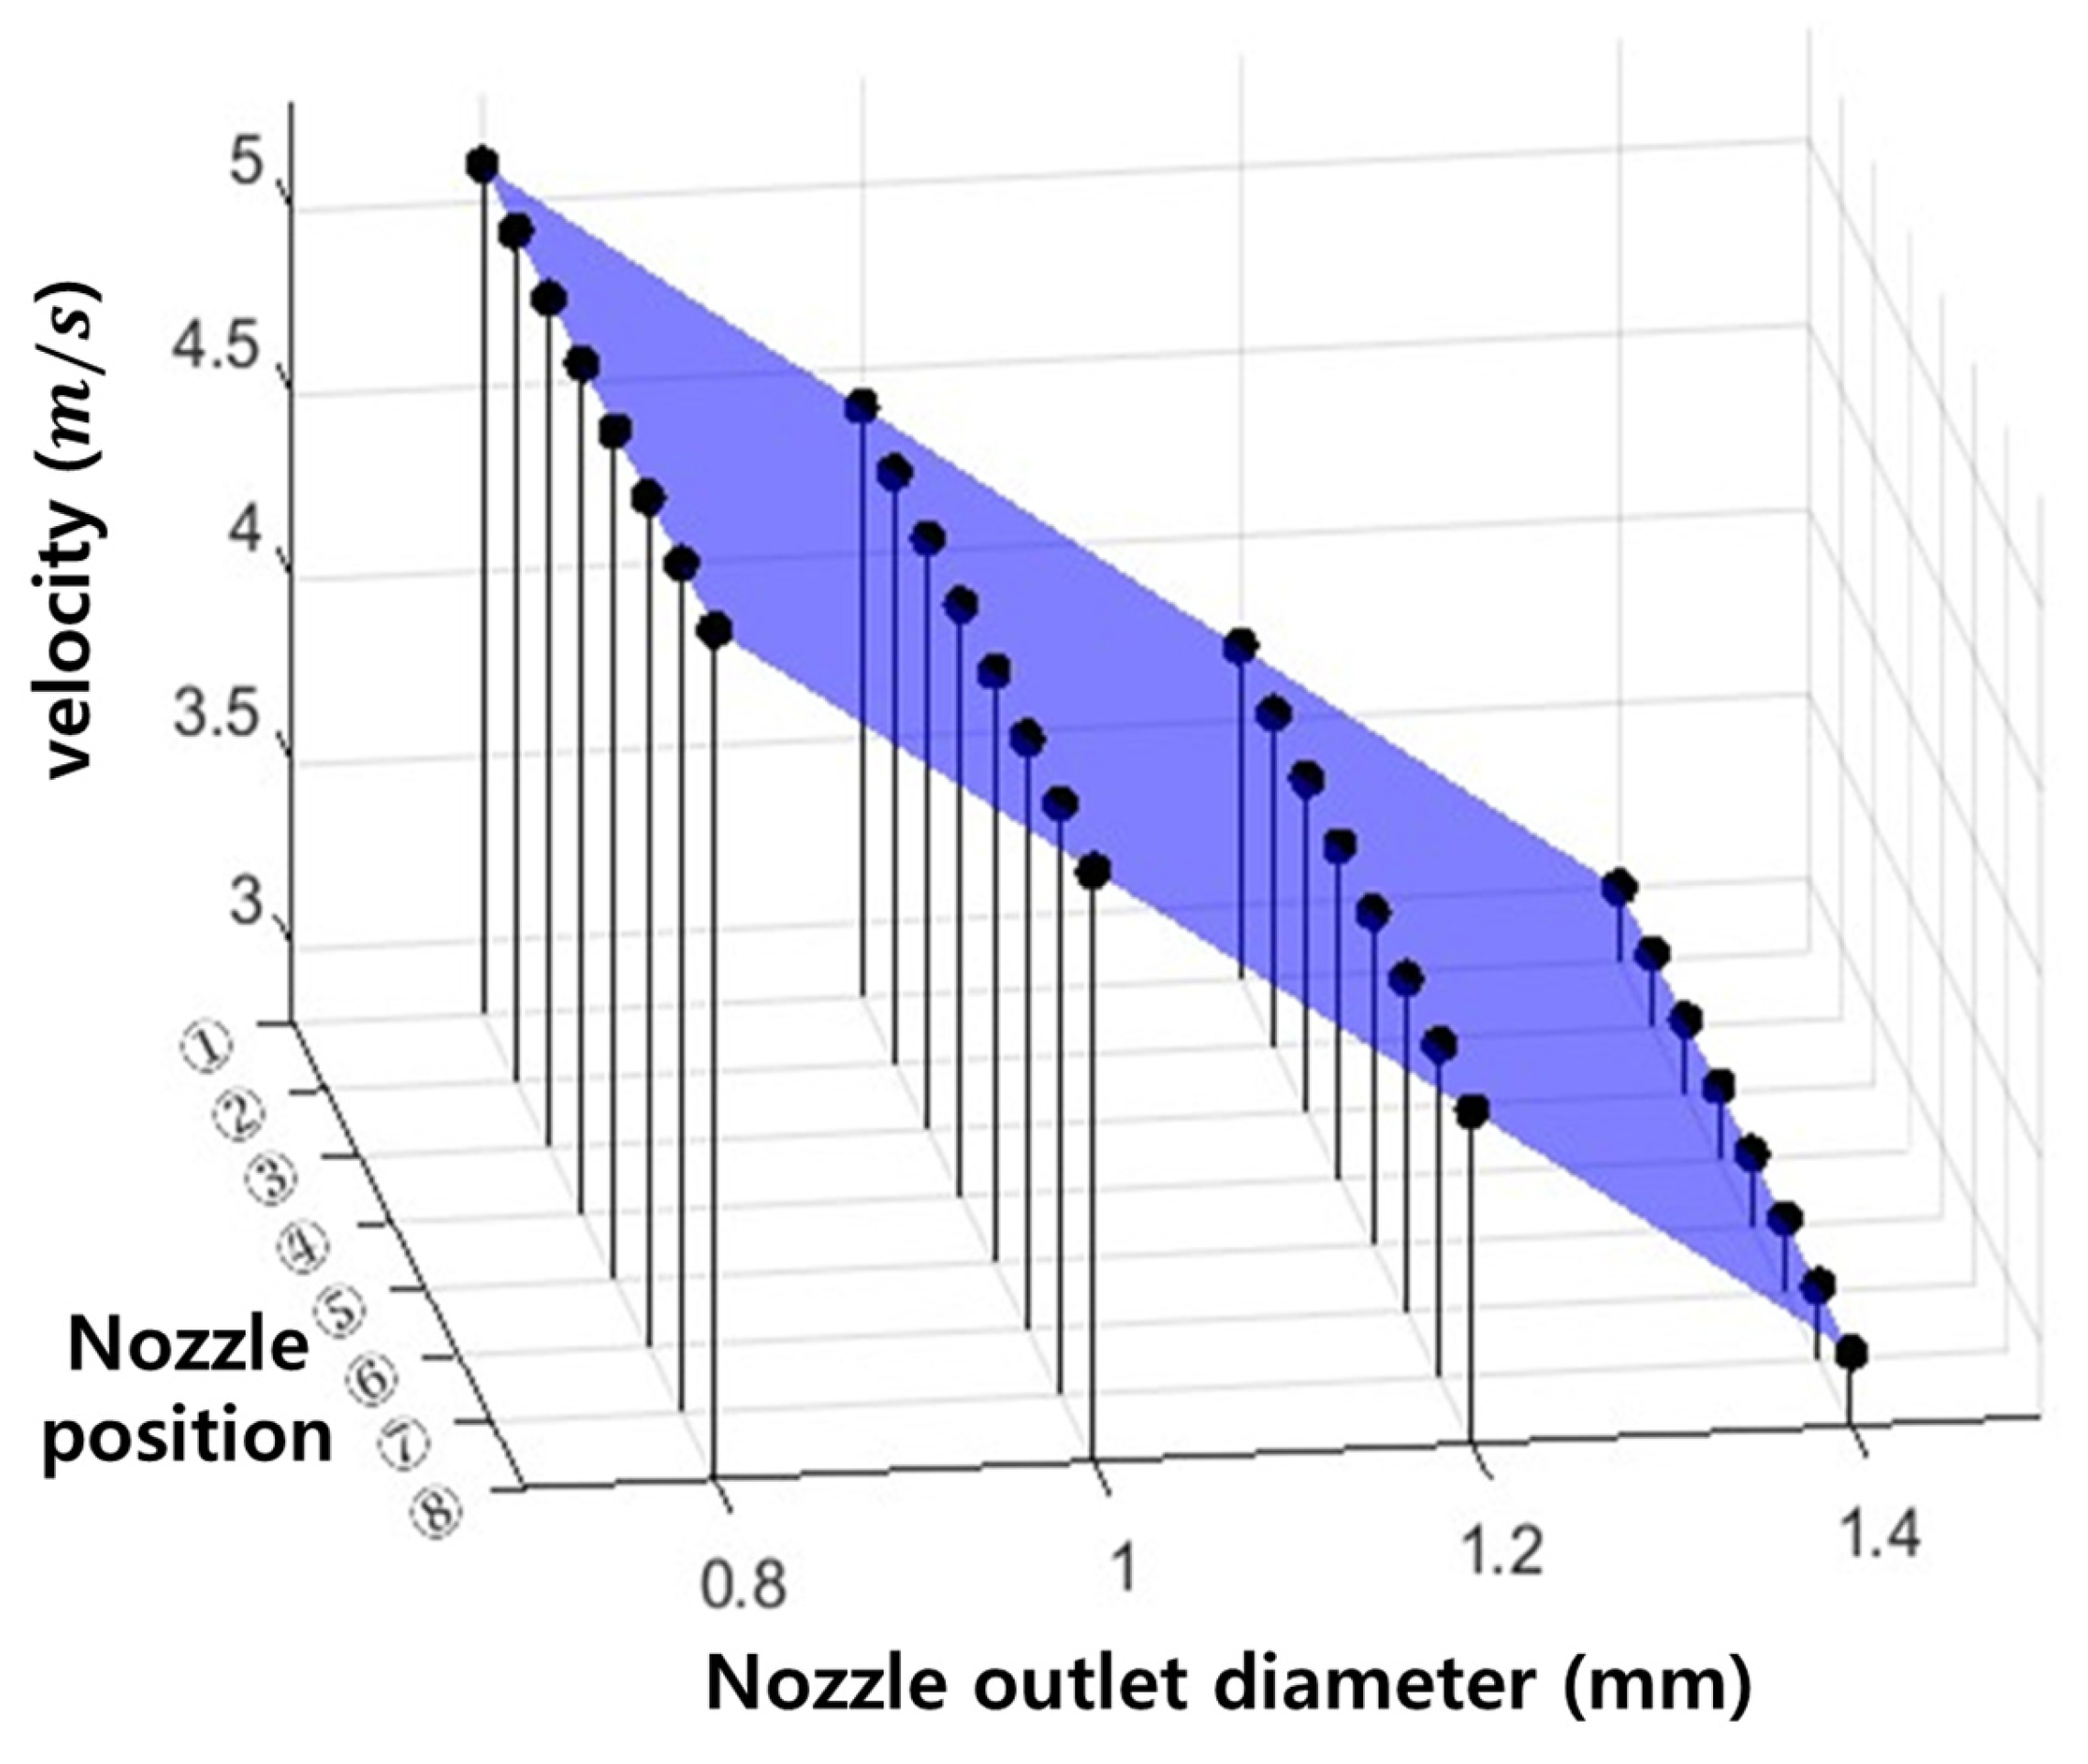
Figure 5 presents the velocity at the showerhead nozzle exit as a function of nozzle position and showerhead nozzle exit diameter. No noticeable variation in velocity was observed with nozzle position. In contrast, the velocity decreased as the showerhead nozzle exit diameter increased, with maximum values of 5.1, 4.4, 3.7, and 3.0 m/s for nozzle diameters of 0.8, 1.0, 1.2, and 1.4 mm, respectively.
Figure 5.
Nozzle exit velocity according to nozzle position and nozzle exit diameter.
3.2. Electrostatic Analysis Results
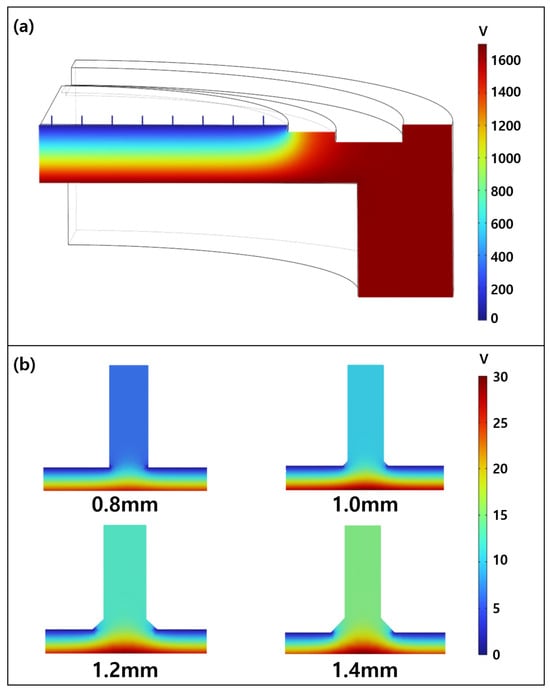
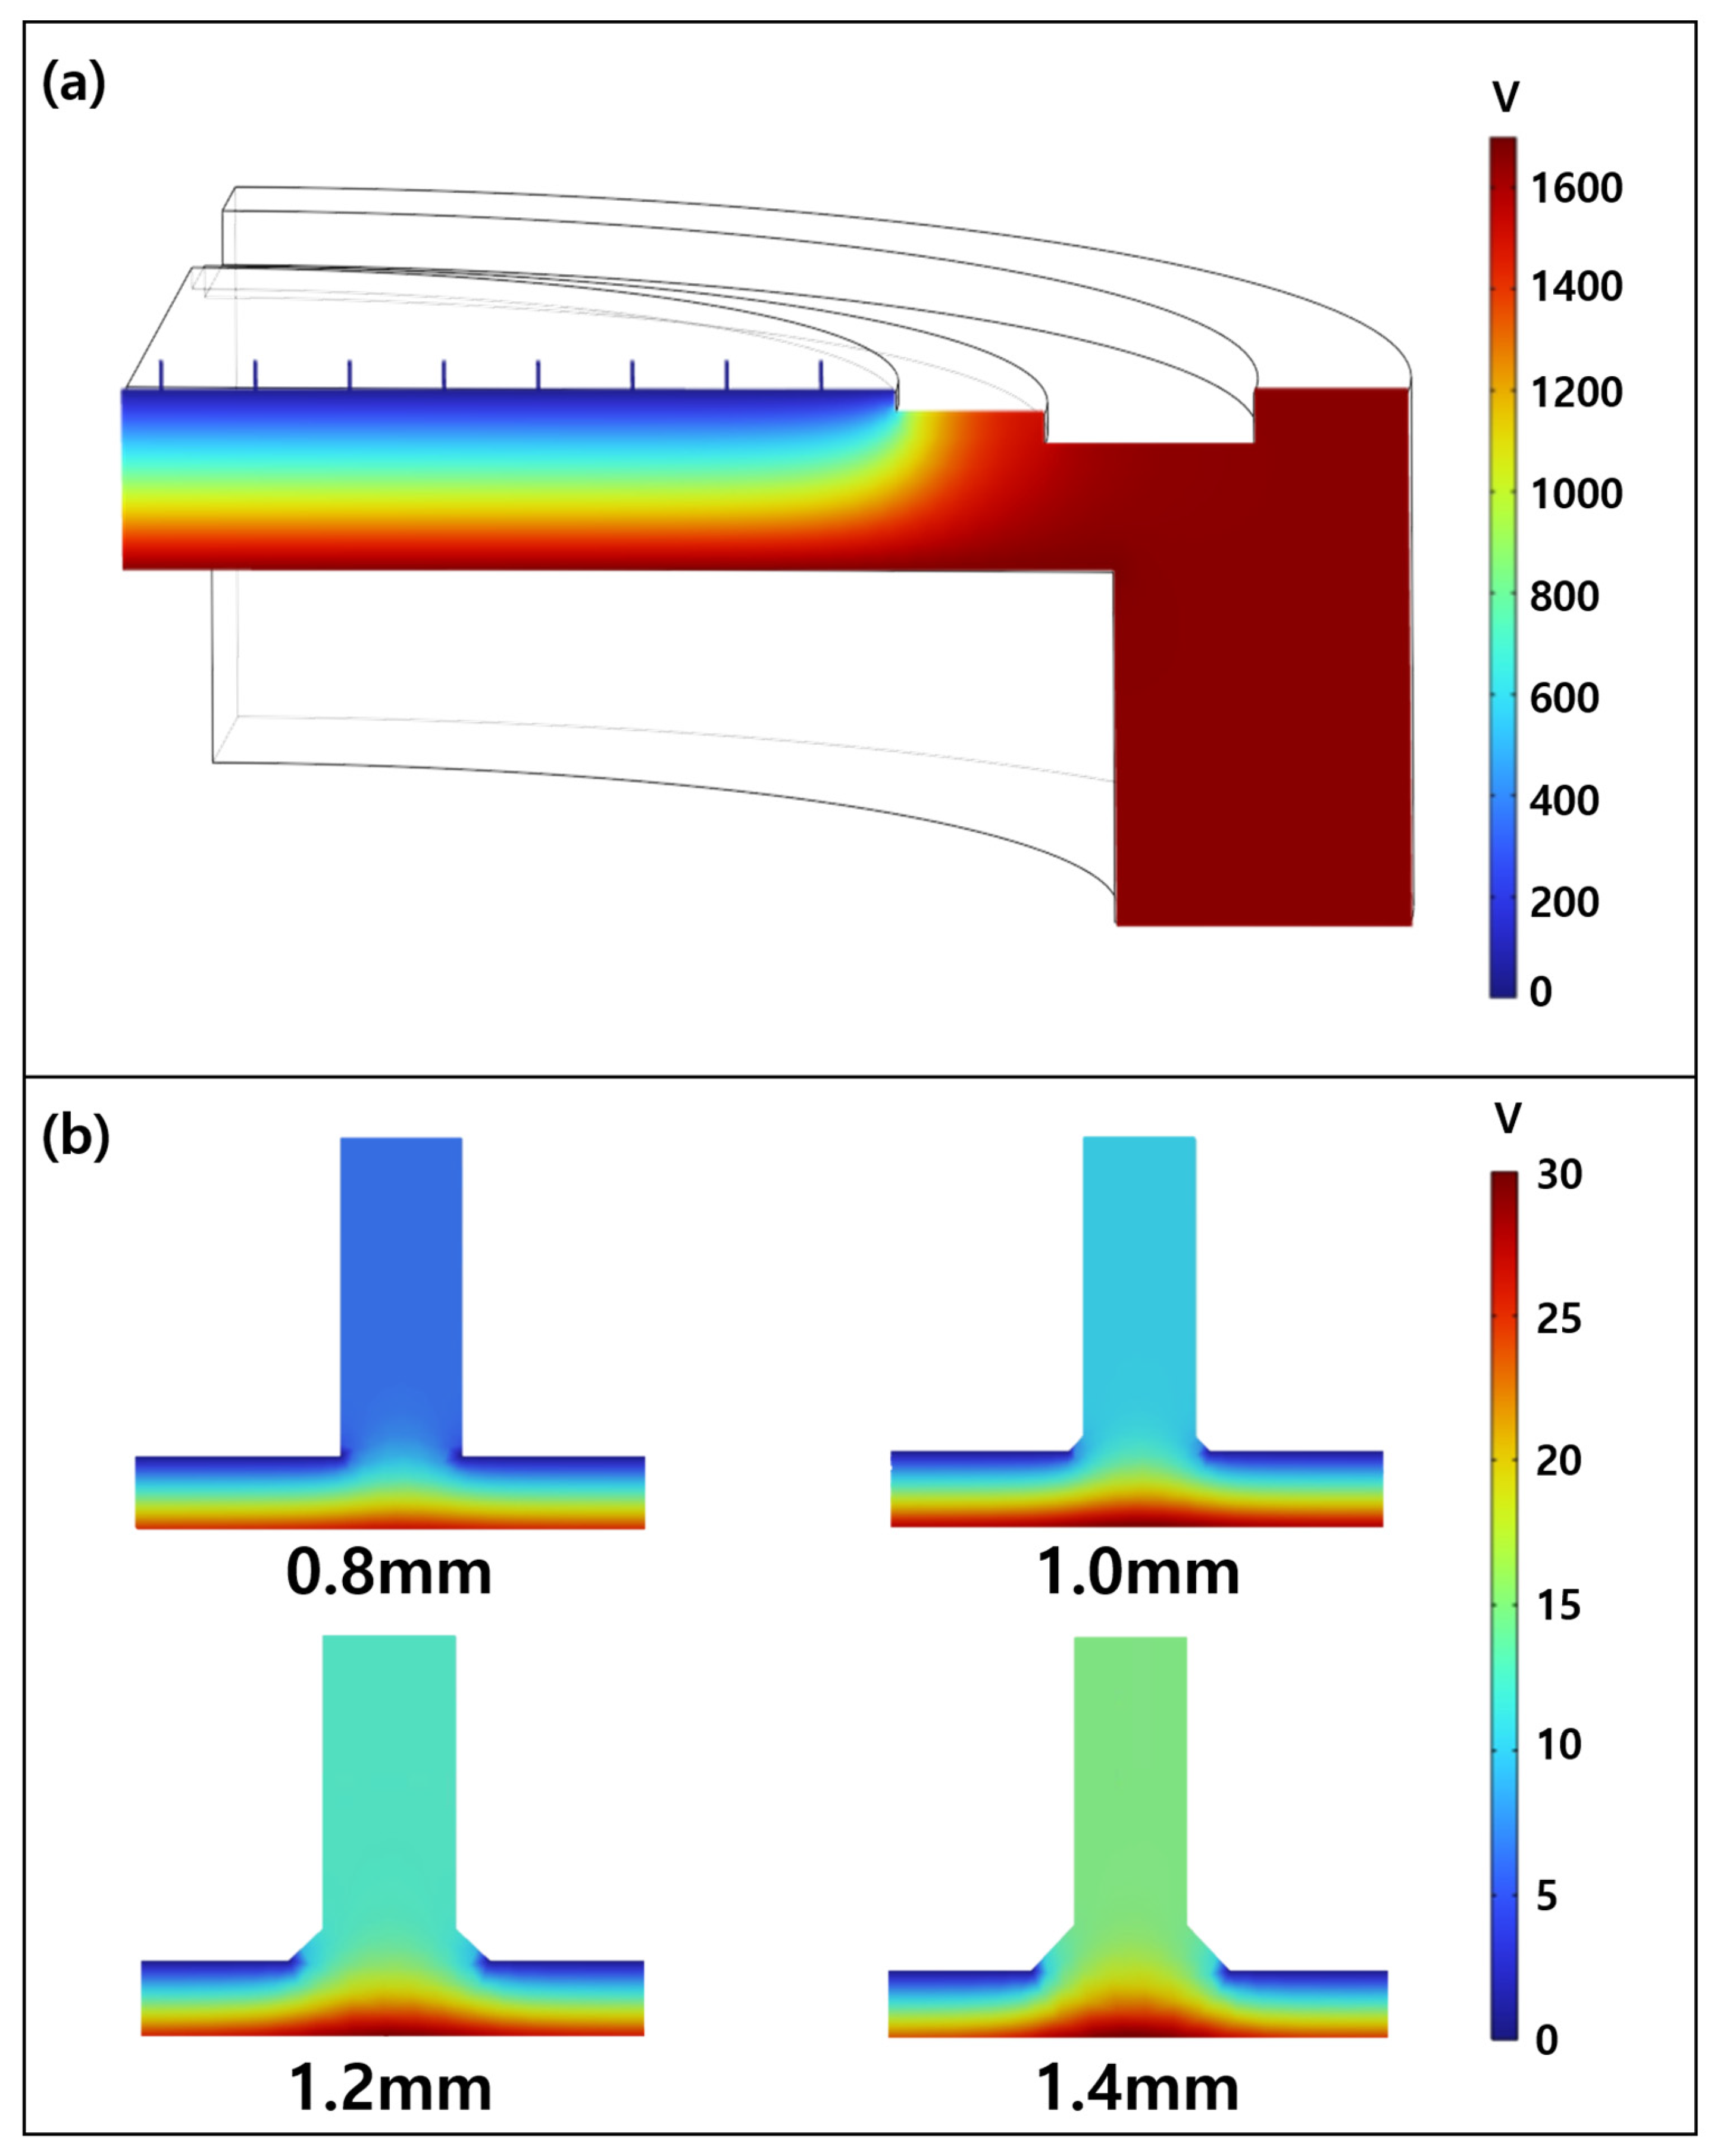
Figure 6a shows the results of the electrostatic analysis for the chamber and nozzle. Under the applied voltage condition of 1700 V at the wafer holder, the electric potential was found to decrease toward the showerhead.
Figure 6.
(a) Electric potential of the chamber, (b) electric potential of the nozzle.
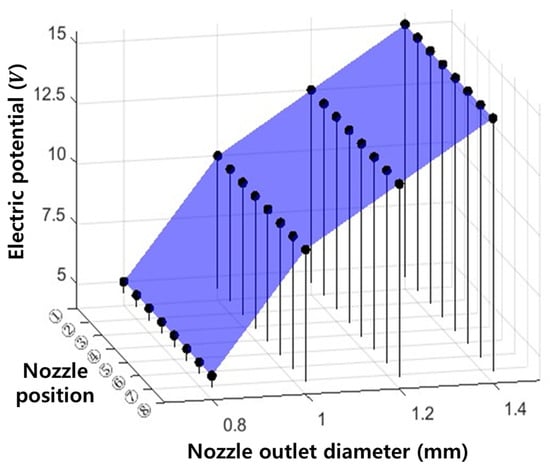
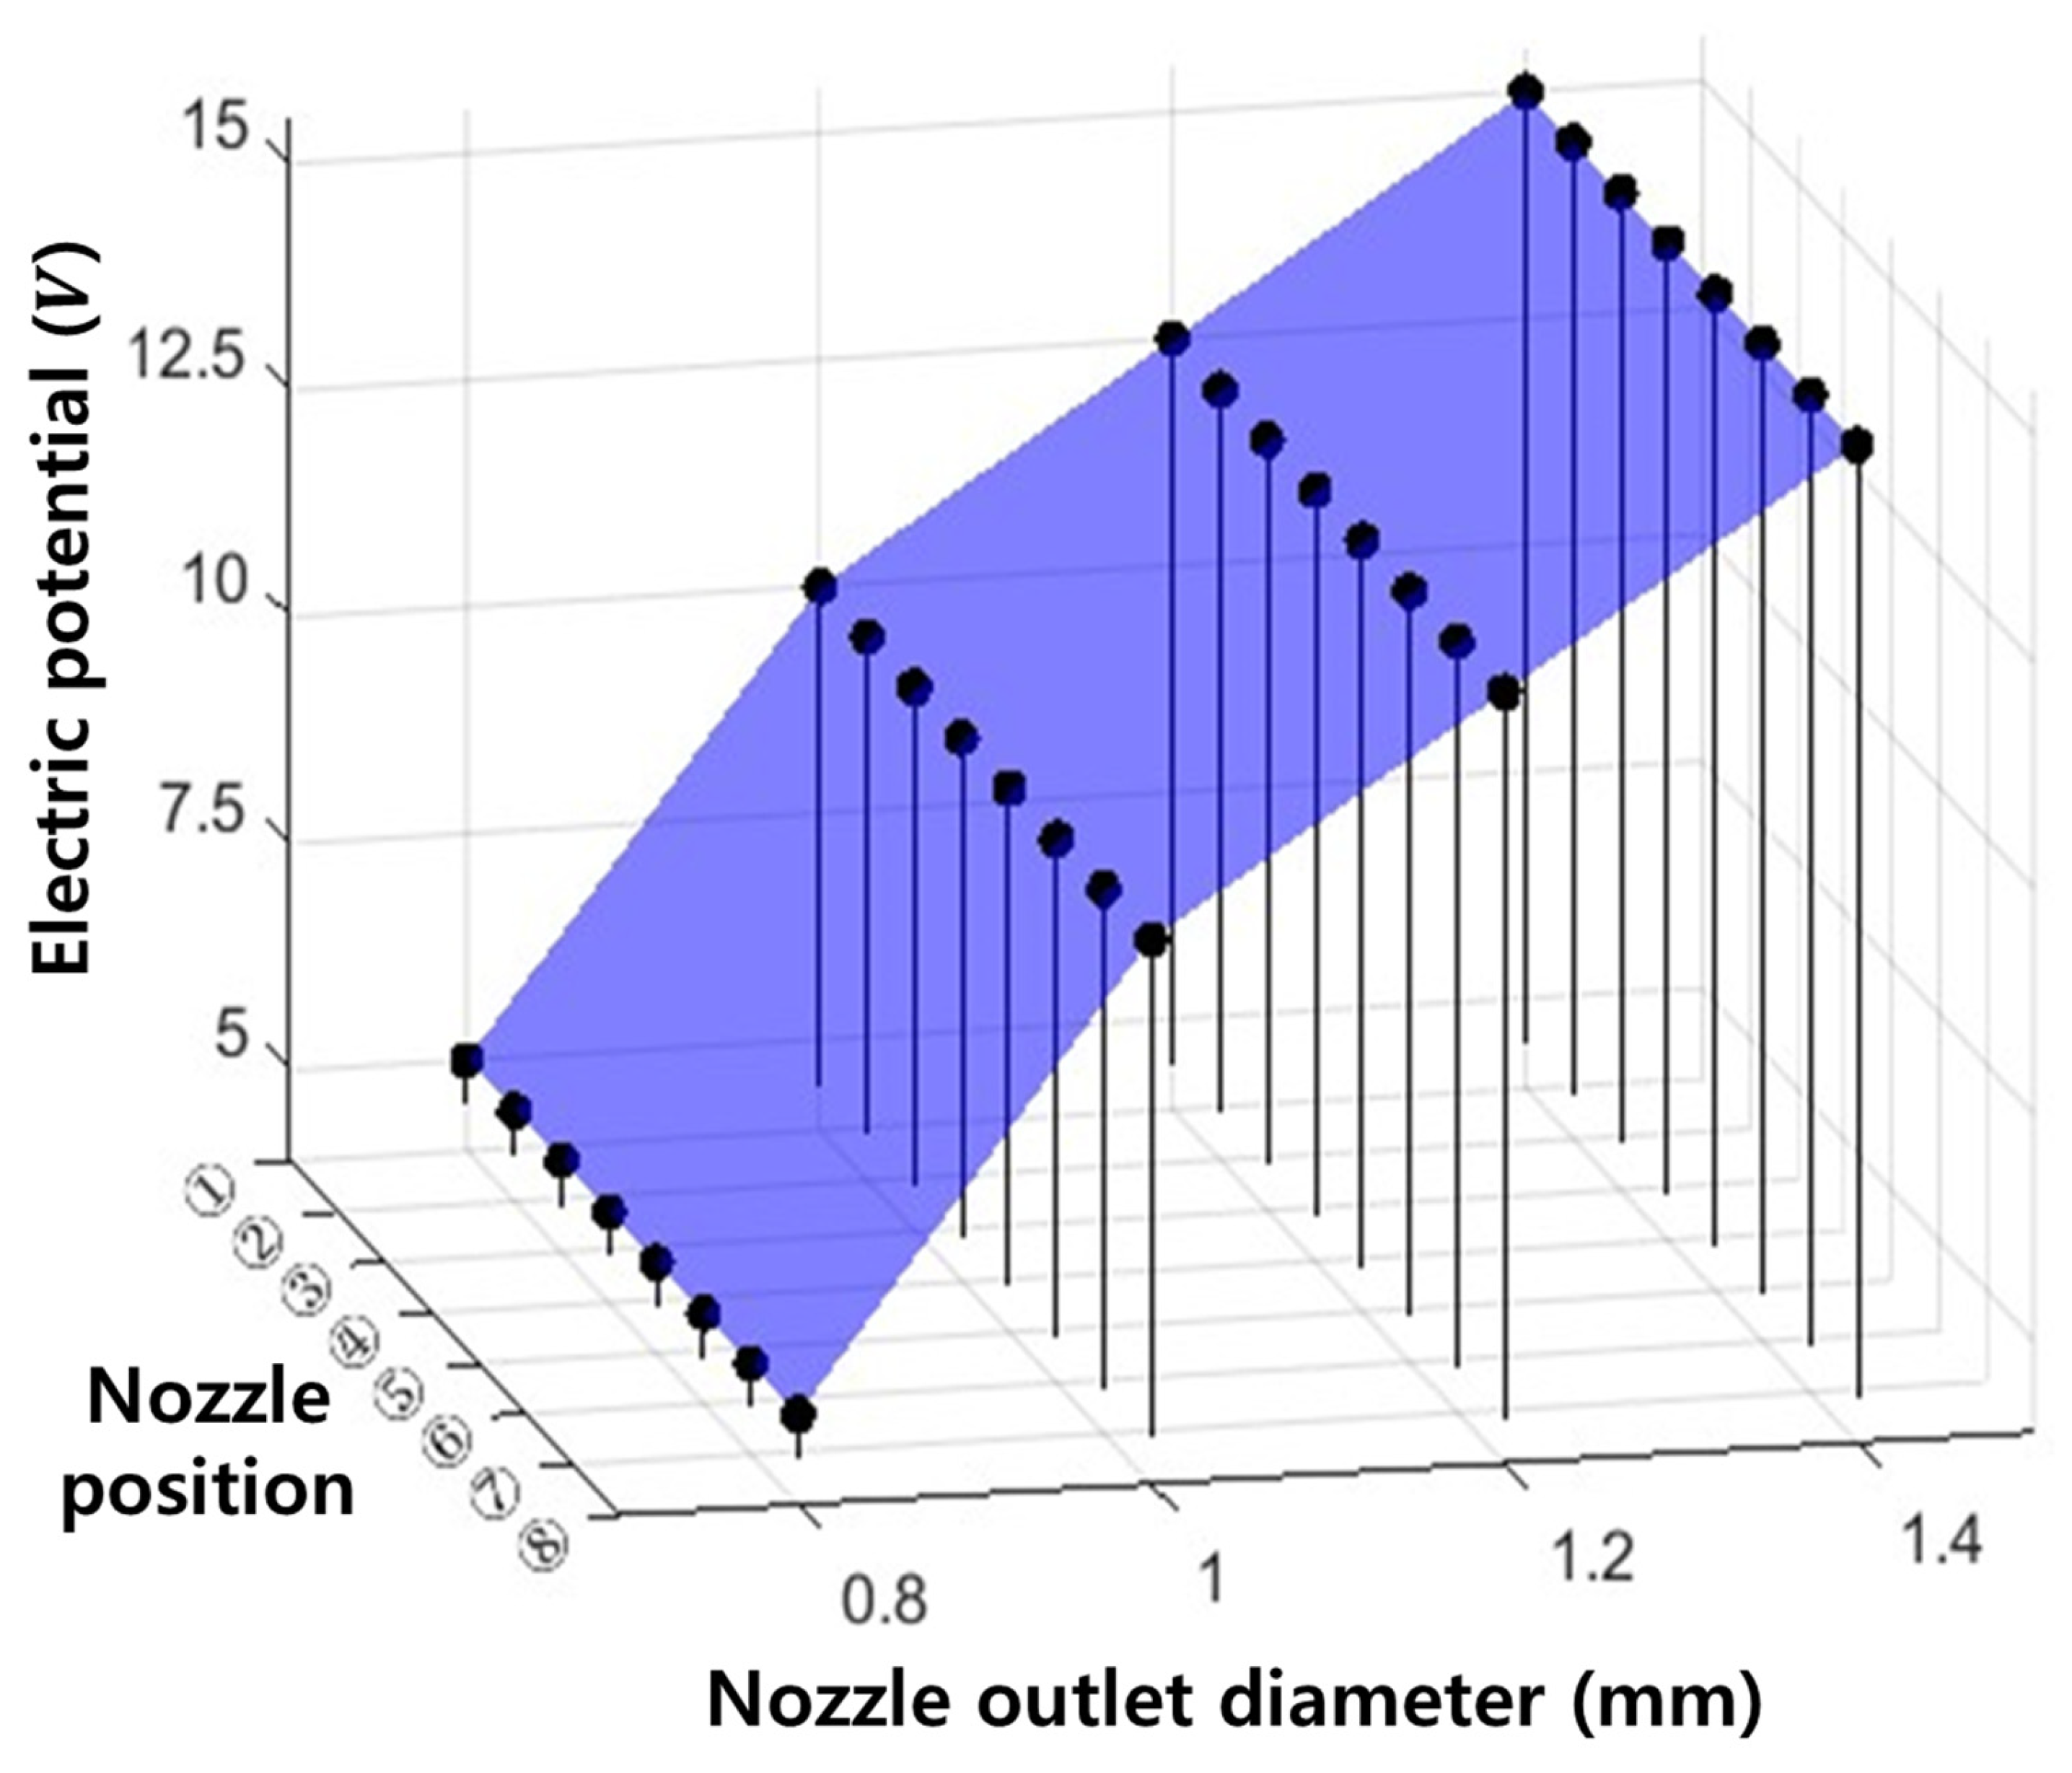
To examine the differences in electrical characteristics according to nozzle geometric degradation, the electric potential distribution near the nozzle was compared in Figure 6b. As the showerhead nozzle exit diameter increased, the electric potential near the showerhead nozzle exit also increased. In addition, a non-uniform electric potential distribution was observed along the vertical direction below the showerhead nozzle exit.
Figure 7 presents the electric potential in the nozzle region as a function of nozzle position and showerhead nozzle exit diameter. No noticeable variation in electric potential was observed with nozzle position, whereas a clear dependence on showerhead nozzle exit diameter was identified. As the showerhead nozzle exit diameter increased, the electric potential near the showerhead nozzle exit increased monotonically, with values of approximately 5, 10, 12.5, and 15 V for nozzle diameters of 0.8, 1.0, 1.2, and 1.4 mm, respectively.
Figure 7.
Nozzle exit electric potential according to nozzle position and nozzle exit diameter.
3.3. Particle Tracing Analysis Results
3.3.1. Neutral Species
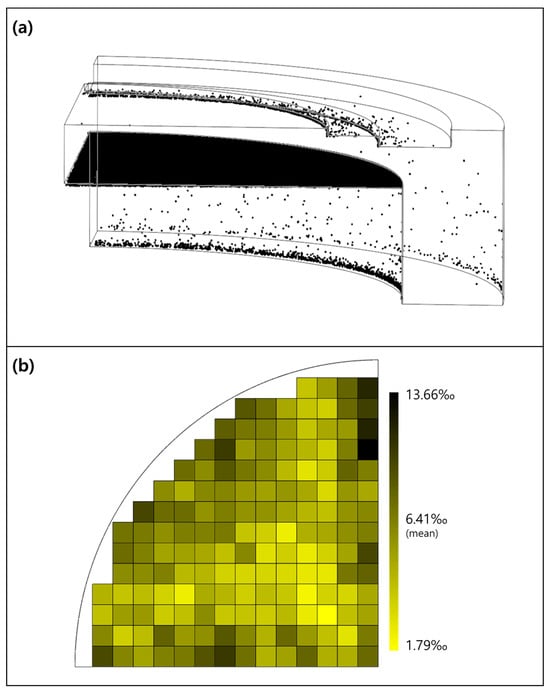
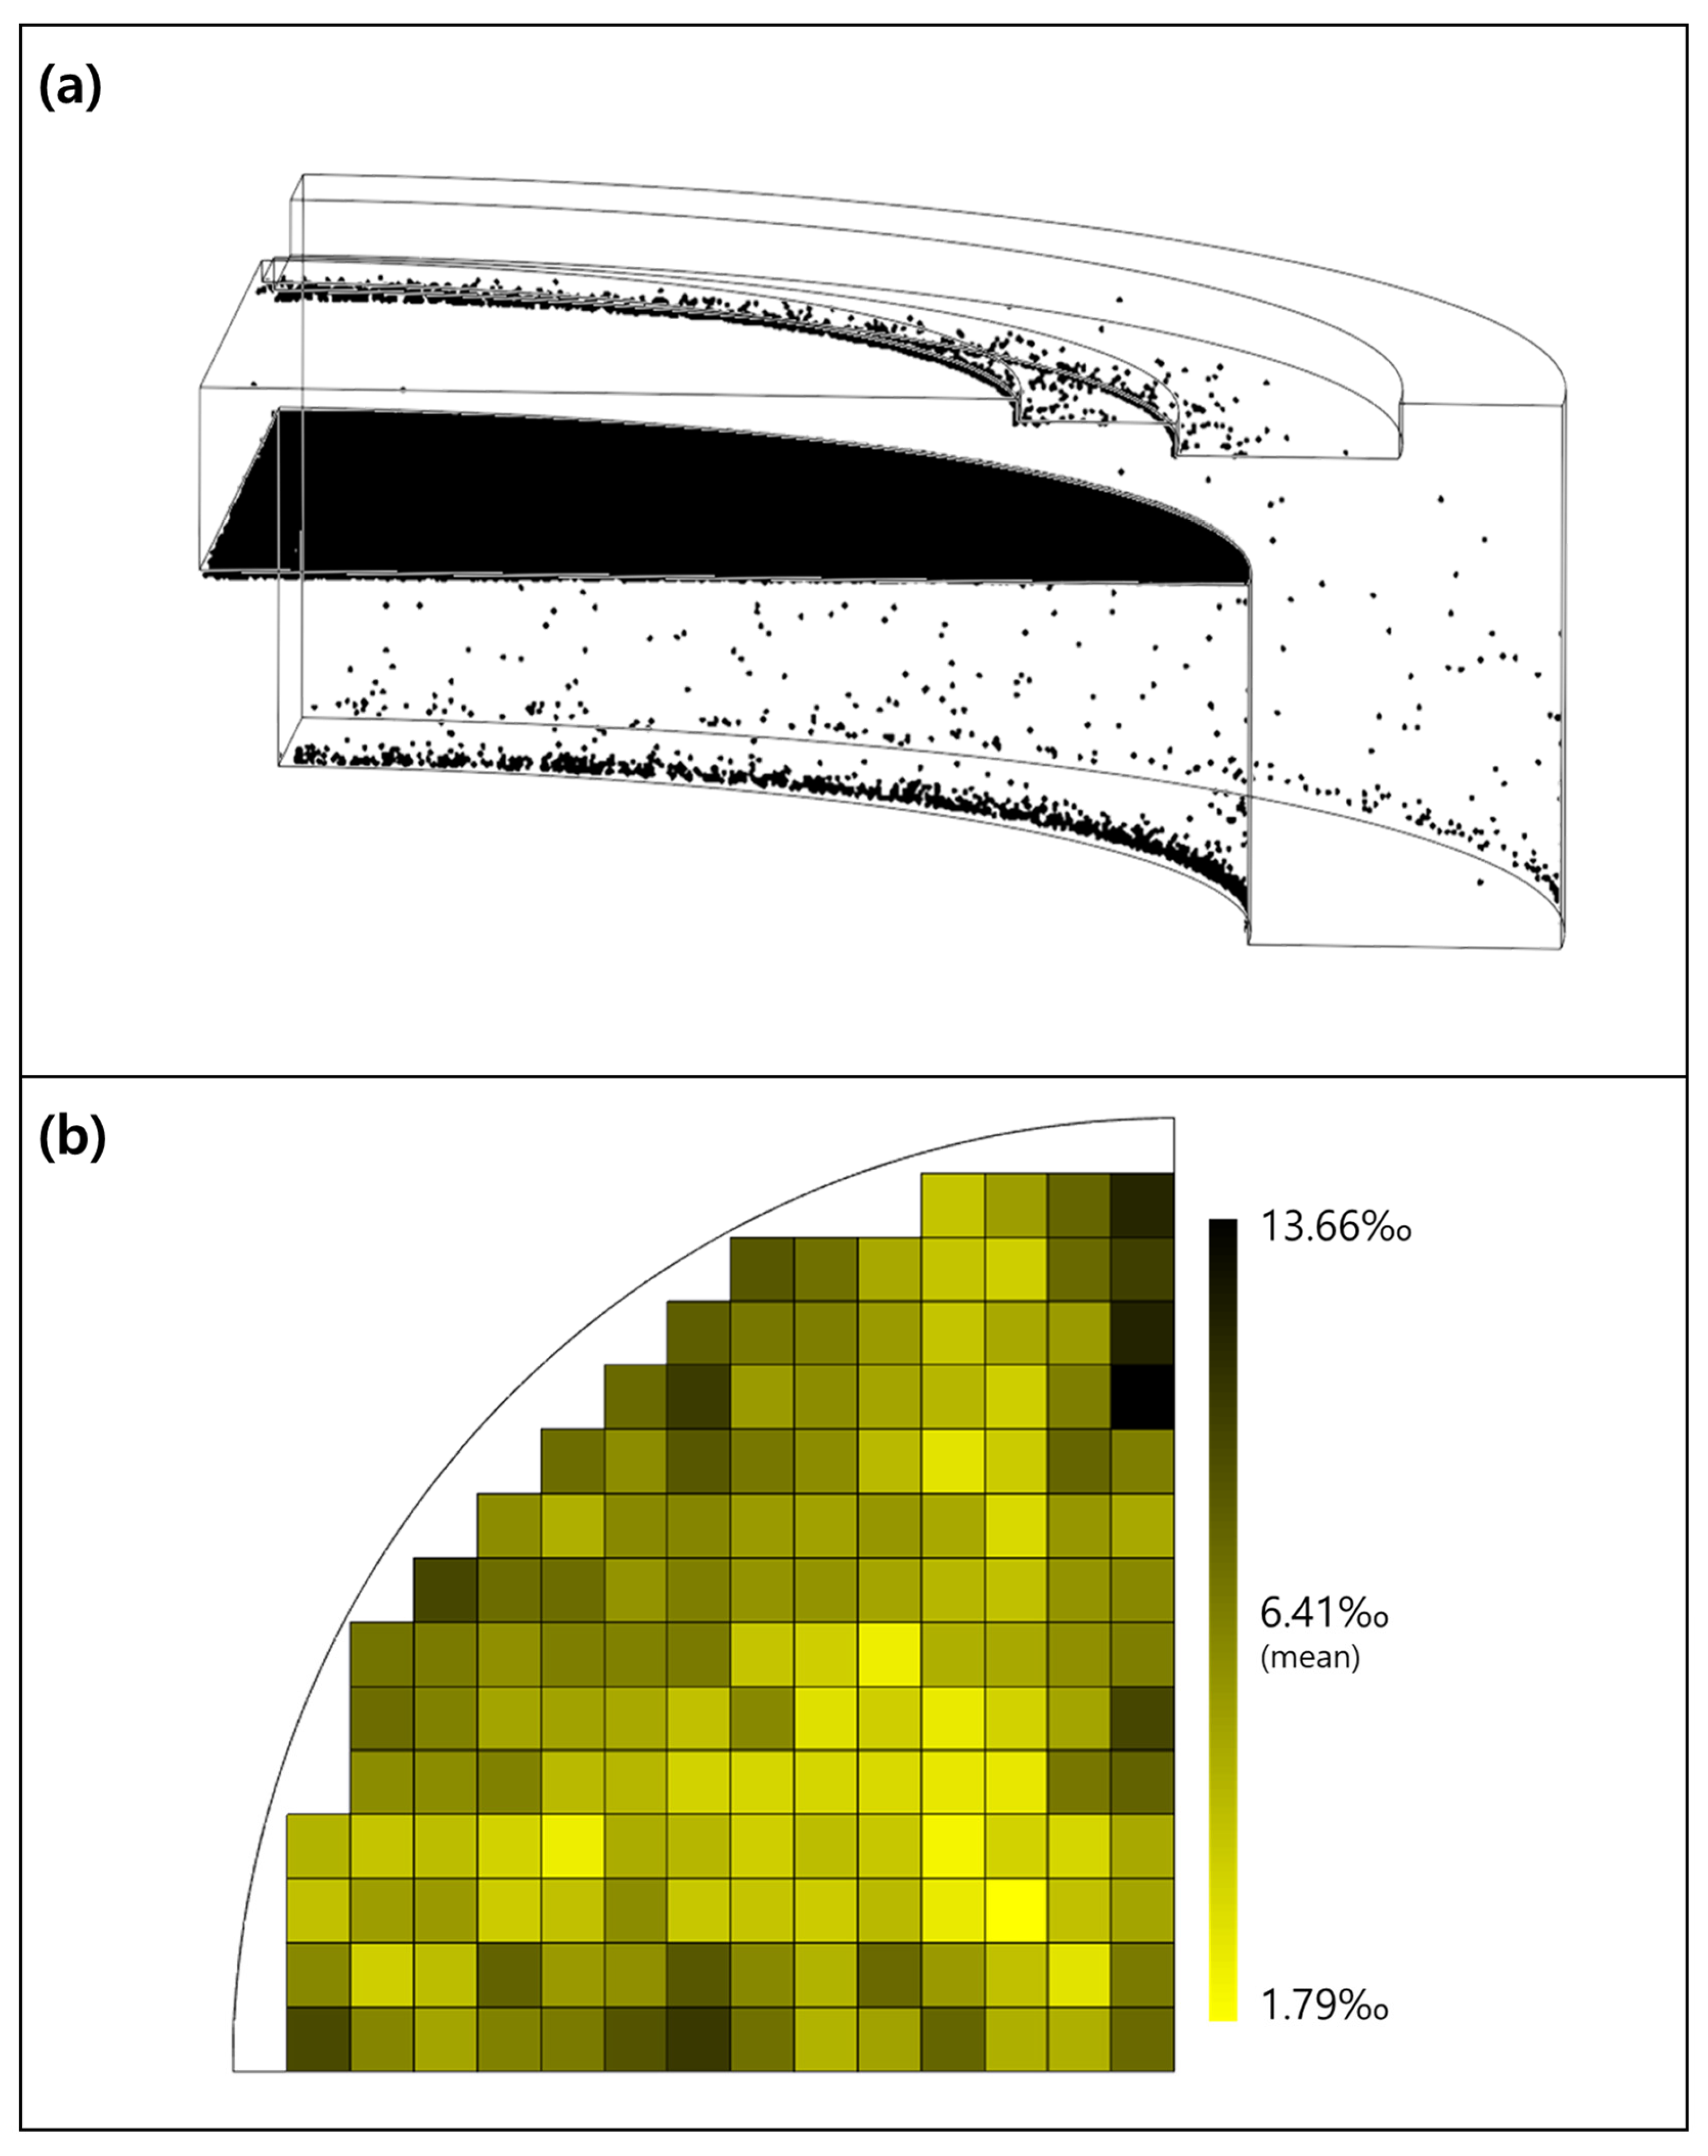
Figure 8a shows the particle tracing analysis results for fluorine neutral radicals, which represent the neutral species, in the normal nozzle model (0.8–0.8). The neutral species were transported primarily under the influence of drag and diffusion forces within the flow field. Most particles were either deposited on the chamber walls or discharged through the outlet along the flow streamlines, and 1.2% of the initial particles reached the wafer.
Figure 8.
(a) Final location of neutral species; (b) distribution rate of neutral species.
To quantify the effect of showerhead nozzle exit geometric degradation on the wafer-level distribution of neutral species, the wafer was segmented into virtual chips of 10 × 10 mm2, which corresponds to a sample size commonly used in equipment-level experiments, and the distribution ratio was calculated based on the number of particles reaching each chip. The corresponding equation for the distribution ratio is given below.
Here, is the number of radicals reaching the th chip (one of the 10 × 10 mm2 segment), and is the total number of radicals reaching all chips. The distribution ratio was expressed in permille (‰) by multiplying the normalized particle fraction by 1000 to improve numerical readability because the particle fractions associated with individual chips were relatively small. In the present study, the minimum and maximum distribution ratios of the normal nozzle model, representing the pre-degradation condition of the showerhead nozzle exit, were adopted as the reference range for evaluating the effects of geometric degradation. Accordingly, this range was used as a comparative baseline for relative evaluation rather than as an absolute process acceptance criterion. As shown in Figure 8b, differences in the distribution ratio of neutral species among individual chips were observed even in the normal nozzle model (0.8–0.8). The average distribution ratio of the neutral species was 6.41‰, while the minimum and maximum values were 1.79‰ and 13.66‰, respectively. A relative evaluation was then performed by comparing the number of chips outside this reference range across the 16 cases.
Table 5 summarizes the minimum and maximum distribution ratios of neutral species for the 16 cases, with the cases outside the reference range of the normal nozzle model (0.8–0.8) separately marked. The lowest distribution ratio was observed for the geometric degradation model (1.2–0.8), reaching 1.29‰, whereas the highest distribution ratio was observed for the geometric degradation model (1.2–1.0), reaching 14.44‰. Overall, eight cases showed below-range distribution ratios, whereas only two cases showed above-range distribution ratios, indicating a fourfold difference.
Table 5.
Neutral species, minimum and maximum distribution rates for each case (‰).
3.3.2. Charged Species
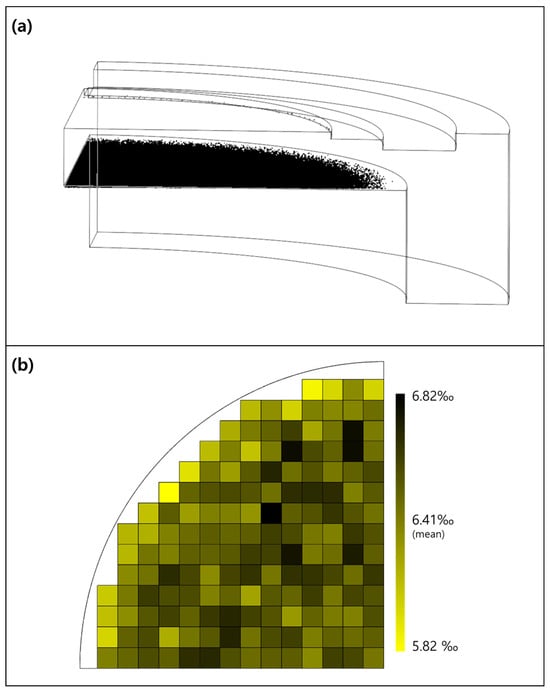
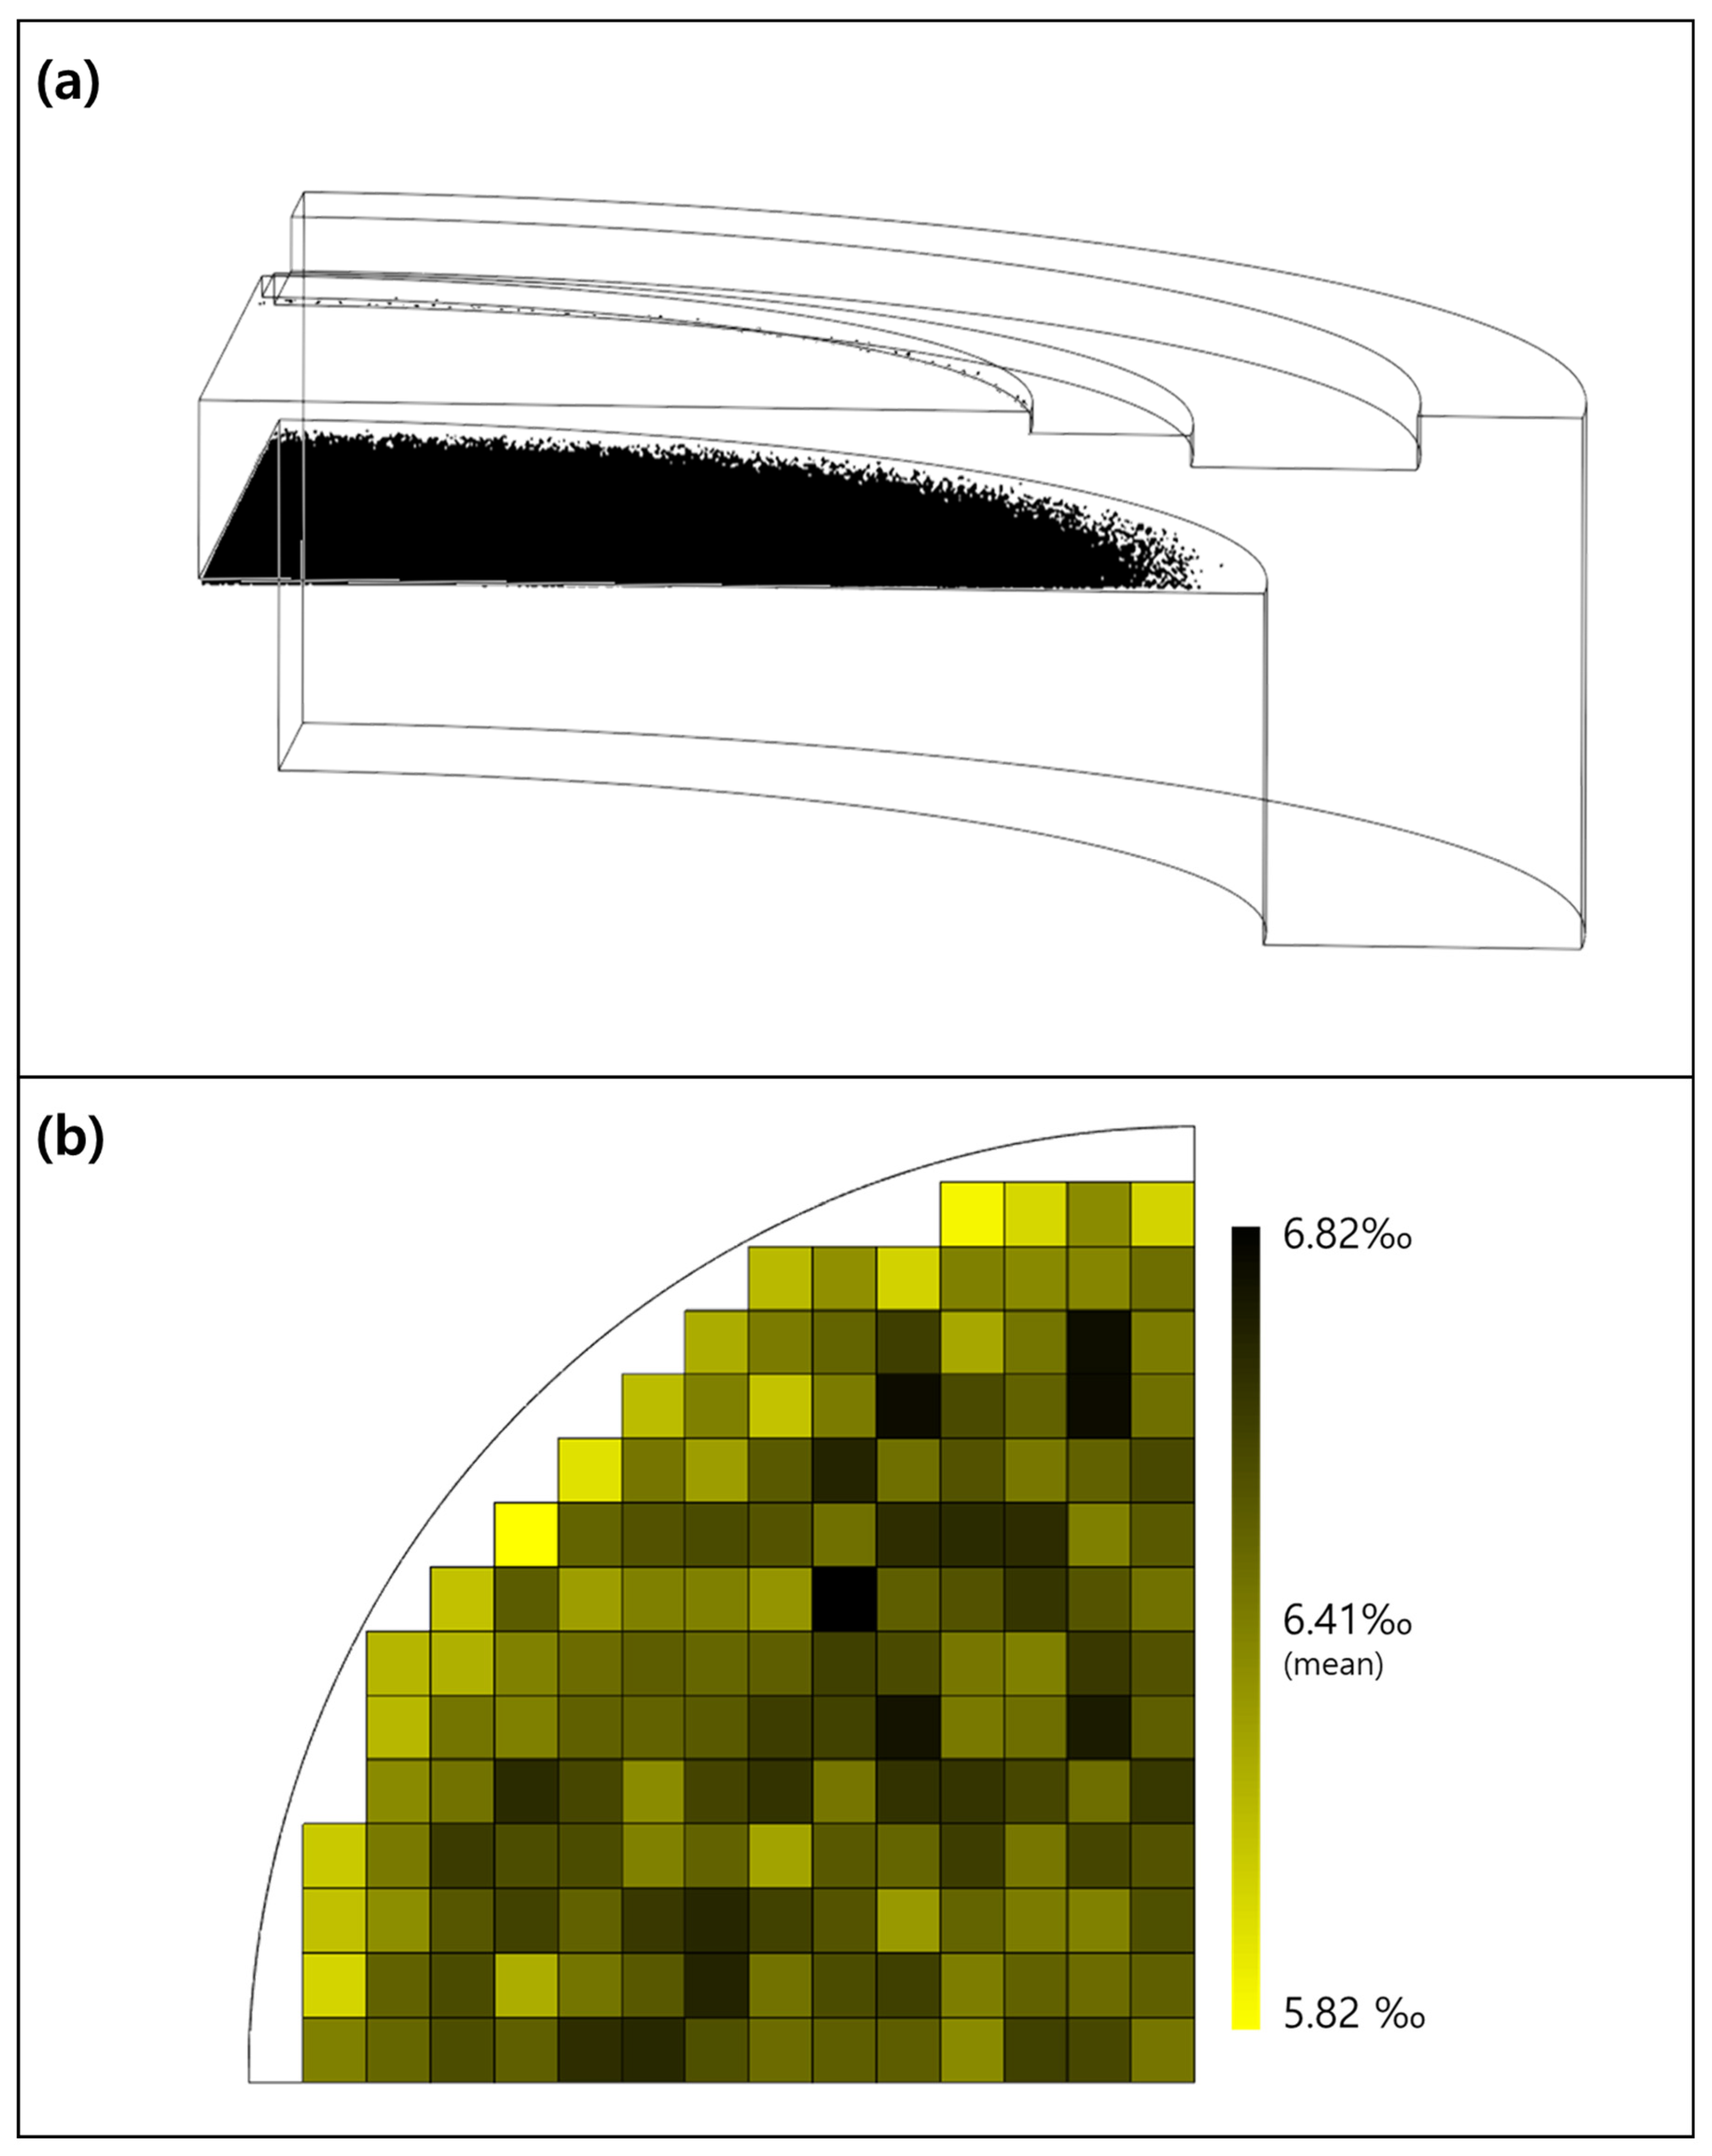
Figure 9a shows the particle tracing analysis results for fluorine radical ions, representing the charged species, in the normal nozzle model (0.8–0.8). The charged species were transported under the combined influence of the flow field and electric force. A total of 73% of the initial charged species reached the wafer, while the remaining particles were located on the edge ring and other surrounding structures. To analyze the effect of showerhead nozzle exit geometry on the wafer-level distribution of charged species, the distribution ratio was calculated using Equation (12), as described above.
Figure 9.
(a) Final location of charged species; (b) distribution rate of charged species.
As shown in Figure 9b, differences in the distribution ratio of charged species among individual chips were observed even in the normal nozzle model (0.8–0.8). The minimum and maximum distribution ratios of the charged species were 5.82‰ and 6.82‰, respectively. Thereafter, the minimum and maximum distribution ratios of the normal nozzle model (0.8–0.8) were adopted as a reference range representing the pre-degradation condition of the showerhead nozzle. This range was used as a comparative baseline for relative evaluation rather than as an absolute process acceptance criterion. And a relative evaluation was performed by comparing the number of chips outside this range across the 16 cases.
Table 6 summarizes the minimum and maximum distribution ratios of charged species for the 16 cases, with the cases outside the reference range of the normal nozzle model (0.8–0.8) separately marked. The lowest distribution ratio was observed for the geometric degradation model (1.4–1.2), reaching 4.90‰, whereas the highest distribution ratio was also observed for the geometric degradation model (1.4–1.2), reaching 6.93‰. Notably, all cases with a center-side showerhead nozzle exit diameter of 1.4 mm exceeded either the lower or upper reference limit.
Table 6.
Charged species, minimum and maximum distribution rates for each case (‰).
4. Discussion
In this study, the effects of showerhead nozzle exit geometry on process characteristics in semiconductor etching equipment were evaluated using a multiphysics analysis approach. To this end, a total of 16 analysis cases were constructed according to nozzle position and showerhead nozzle exit diameter, and CFD, electrostatic analysis, and particle tracing analysis were carried out sequentially.
First, the CFD results showed that both the pressure and velocity at the showerhead nozzle exit decreased as the showerhead nozzle exit diameter increased. Because the same inlet mass flow rate was imposed for all nozzle locations, the outlet pressure and velocity were primarily determined by the nozzle exit diameter rather than the radial position of the degraded nozzle. Consequently, cases with the same nozzle exit diameter exhibited similar outlet pressure and velocity values regardless of nozzle location. For every 0.2 mm increase in nozzle exit diameter, the pressure at the showerhead nozzle exit decreased by approximately 0.5 Pa, while the velocity decreased by approximately 0.7 m/s. This trend can be attributed to the change in flow acceleration characteristics caused by the increase in exit cross-sectional area under identical process conditions, which consequently reduced the flow momentum at the showerhead nozzle exit. Such changes weaken the initial transport conditions of reactive species passing through the nozzle and may directly affect the drag-driven transport behavior of neutral species in particular.
The electrostatic analysis results showed that the electric potential near the showerhead nozzle exit increased as the showerhead nozzle exit diameter increased. The rate of increase gradually decreased, with successive increases of approximately 2.0, 1.25, and 1.2 times, indicating that the electric potential generally increased with diameter, although the magnitude of the increase became progressively smaller. This result suggests that showerhead nozzle exit geometric degradation is not merely a structural change, but also a factor that modifies the local electrical environment. This interpretation is supported by a previous study showing that chamber geometry itself can induce electric field nonuniformity [38].
The particle tracing analysis results showed that the changes in the flow field and electric potential distribution ultimately led to differences in the wafer-level distribution of reactive species. Neutral species were governed mainly by the flow field and were strongly affected by changes in drag-based transport conditions caused by showerhead nozzle exit geometric degradation. In the neutral-species analysis, cases with below-range distribution ratios were four times more frequent than cases with above-range distribution ratios (8 cases vs. 2 cases). As the showerhead nozzle exit diameter increased, the exit velocity decreased, which in turn reduced the drag force acting on neutral radicals. As a result, the driving effect for transport toward the wafer was weakened, which likely reduced radical arrival in some regions and increased the number of cases exhibiting below-range distribution ratios. In contrast, charged species were affected by both the flow field and electric force, and the local electric potential distribution near the showerhead nozzle exit was reflected in their wafer arrival characteristics. In contrast to the neutral-species behavior, the charged-species analysis showed comparable occurrences of below-range and above-range cases (8 cases vs. 10 cases). Notably, all cases with a center-side showerhead nozzle exit diameter of 1.4 mm fell outside the minimum–maximum reference range. This result suggests that charged species, being influenced by both the flow field and electric force, are more sensitive to changes in showerhead nozzle exit geometry. Therefore, although showerhead nozzle exit geometric degradation affects neutral and charged species through different mechanisms, both ultimately influence the wafer-level distribution characteristics.
Overall, this study is significant because it traced the multiphysical transmission pathways through which equipment degradation, represented by changes in showerhead nozzle exit geometry, leads to process-level consequences. These findings physically explain why the likelihood of process non-uniformity may increase as showerhead degradation accumulates.
The objective of this study was not to reproduce the full plasma chemistry and discharge physics of the etching process, but rather to isolate and analyze the relative effects of showerhead nozzle exit degradation on the flow field, electric potential distribution, and reactive-species transport.
One limitation of the present study is that plasma-specific phenomena, including sheath formation and Debye shielding, were not explicitly considered in the electrostatic analysis. This simplification was adopted because the present work focused on evaluating the relative effects of showerhead nozzle degradation rather than performing a self-consistent plasma simulation. Plasma-specific phenomena such as sheath formation and Debye shielding are known to influence local electric potential distributions in plasma-processing environments [38,39]. In particular, for larger nozzle exit diameters such as 1.4 mm, plasma shielding may alter the local potential magnitude and gradient near the nozzle, potentially affecting the quantitative values shown in Figure 7. However, the present study focused on evaluating the relative influence of showerhead nozzle degradation under a simplified ion-acceleration-field framework. Therefore, the reported electric potential distributions should be interpreted as comparative indicators of nozzle-degradation effects rather than exact representations of plasma potential distributions.
Accordingly, the present results should be interpreted primarily as relative comparisons for mechanistic trend analysis. Although the proposed framework was validated using available experimental data, further validation against wafer-level process metrics and long-term equipment data would strengthen its applicability to industrial process diagnostics and predictive maintenance.
Author Contributions
Conceptualization, J.Y.; investigation, J.Y.; writing—original draft preparation, J.Y.; supervision, S.Y. and J.-B.C.; writing—review and editing, S.Y. and J.-B.C. All authors have read and agreed to the published version of the manuscript.
Funding
This research received no external funding.
Institutional Review Board Statement
Not applicable.
Informed Consent Statement
Not applicable.
Data Availability Statement
The raw data supporting the conclusions of this article will be made available by the authors on request.
Conflicts of Interest
Author Sangmo Yang was employed by SEMES Co., Ltd. (R&D Center, Hwaseong, Republic of Korea). The remaining authors declare that the research was conducted in the absence of any commercial or financial relationships that could be construed as a potential conflict of interest.
References
- Jansen, H.; Gardeniers, H.; de Boer, M.; Elwenspoek, M.; Fluitman, J. A survey on the reactive ion etching of silicon in microtechnology. J. Micromech. Microeng. 1996, 6, 14. [Google Scholar]
- Romano, L. Etching: The Art of Semiconductor Micromachining. Micromachines 2025, 16, 213. [Google Scholar] [CrossRef] [Scilit]
- Li, C.; Yang, Y.; Qu, R.; Cao, X.; Liu, G.; Jin, X.; Liu, Y.; Liu, S.; Jiang, W.; Zhang, X. Recent advances in plasma etching for micro and nano fabrication of silicon-based materials: A review. J. Mater. Chem. C 2024, 12, 18211–18237. [Google Scholar] [CrossRef] [Scilit]
- Lee, J.; Jung, P.; Devre, M.; Westermann, R.; Pearton, S. Optimization of gas flow and etch depth uniformity for plasma etching of large area GaAs wafers. Solid-State Electron. 2002, 46, 685–688. [Google Scholar]
- Kreethi, R.; Hwang, Y.-J.; Lee, H.-Y.; Park, J.-H.; Lee, K.-A. Stability and plasma etching behavior of yttrium-based coatings by air plasma spray process. Surf. Coat. Technol. 2023, 454, 129182. [Google Scholar]
- Seong, I.; Lee, J.; Kim, S.; Lee, Y.; Cho, C.; Lee, J.; Jeong, W.; You, Y.; You, S. Characterization of an etch profile at a wafer edge in capacitively coupled plasma. Nanomaterials 2022, 12, 3963. [Google Scholar] [CrossRef] [Scilit]
- Caldarelli, A.; Filleul, F.; Boswell, R.; Charles, C.; Rattenbury, N.; Cater, J. Data processing techniques for ion and electron-energy distribution functions. Phys. Plasmas 2023, 30, 040501. [Google Scholar] [CrossRef] [Scilit]
- Hollsten, E. Langmuir Probe Characterization and Measurements. Master’s Thesis, Uppsala University, Uppsala, Sweden, 2025. Volume 92. [Google Scholar]
- Yeom, H.; Kim, J.; Choi, D.; Choi, E.; Yoon, M.; Seong, D.; You, S.J.; Lee, H.-C. Flat cutoff probe for real-time electron density measurement in industrial plasma processing. Plasma Sources Sci. Technol. 2020, 29, 035016. [Google Scholar] [CrossRef] [Scilit]
- Lynn, S. Virtual Metrology for Plasma Etch Processes; National University of Ireland Maynooth: County Kildare, Ireland, 2011. [Google Scholar]
- Nam, J.H.; Bruggeman, P.J. In Situ Electron Microscopy for Plasma-Enabled Nanoengineering. Plasma Chem. Plasma Process. 2026, 46, 30. [Google Scholar] [CrossRef] [Scilit]
- Kang, M.; Kim, S.; Go, E.; Paek, D.; Lim, G.; Kim, M.; Kim, S.; Jang, S.K.; Choi, M.S.; Kang, W.S. In-situ and Non-contact Etch Depth Prediction in Plasma Etching via Machine Learning (ANN & BNN) and Digital Image Colorimetry. arXiv 2025, arXiv:2505.03826. [Google Scholar]
- Wei, X.; Mitchell, A.; Sun, R.; Yu, N.; Yamamura, K. A review of simulation modeling of the state evaluation and process prediction of plasma processing under atmospheric pressure. Nanomanuf. Metrol. 2024, 7, 16. [Google Scholar]
- Kim, Y.-J.; Boo, J.-H.; Hong, B.; Kim, Y.J. Effects of showerhead shapes on the flowfields in a RF-PECVD reactor. Surf. Coat. Technol. 2005, 193, 88–93. [Google Scholar] [CrossRef] [Scilit]
- Bi, Z.-h.; Liu, Y.-x.; Jiang, W.; Xu, X.; Wang, Y.-n. A brief review of dual-frequency capacitively coupled discharges. Curr. Appl. Phys. 2011, 11, S2–S8. [Google Scholar] [CrossRef] [Scilit]
- Economou, D.J. Modeling and simulation of plasma etching reactors for microelectronics. Thin Solid Film. 2000, 365, 348–367. [Google Scholar]
- Xie, Z.; Yang, Z.; Zhang, L.; Liu, C. Effects of non-catalytic surface reactions on the ch 4–air premixed flame within micro-channels. RSC Adv. 2015, 5, 34272–34280. [Google Scholar]
- Co, C. Flow of Fluids Through Valves, Fittings, and Pipe; Crane Company: Stamford, CT, USA, 1988. [Google Scholar]
- Wilke, C.R. A viscosity equation for gas mixtures. J. Chem. Phys. 1950, 18, 517–519. [Google Scholar] [CrossRef] [Scilit]
- McAllister, S.; Chen, J.-Y.; Fernandez-Pello, A.C. Fundamentals of Combustion Processes; Springer: Berlin/Heidelberg, Germany, 2011; Volume 304. [Google Scholar]
- Colin, S.p. Rarefaction and compressibility effects on steady or transient gas flows in microchannels. In Proceedings of the International Conference on Nanochannels, Microchannels, and Minichannels, Rochester, NY, USA, 17–19 June 2004; pp. 13–24. [Google Scholar]
- Wang, X.; McMurry, P.H. A design tool for aerodynamic lens systems. Aerosol Sci. Technol. 2006, 40, 320–334. [Google Scholar] [CrossRef] [Scilit]
- Rader, D.J. Momentum slip correction factor for small particles in nine common gases. J. Aerosol Sci. 1990, 21, 161–168. [Google Scholar] [CrossRef] [Scilit]
- Rott, N. Note on the history of the Reynolds number. Annu. Rev. Fluid Mech. 1990, 22, 1–12. [Google Scholar] [CrossRef]
- Eichler, T.; De Juan, L.; Fernández de la Mora, J. Improvement of the resolution of TSI’s 3071 DMA via redesigned sheath air and aerosol inlets. Aerosol Sci. Technol. 1998, 29, 39–49. [Google Scholar] [CrossRef] [Scilit]
- Gómez-Moreno, F.; Rosell-Llompart, J.; de la Mora, J.F. Turbulent transition in impactor jets and its effects on impactor resolution. J. Aerosol Sci. 2002, 33, 459–476. [Google Scholar] [CrossRef] [Scilit]
- Gong, S.; Liu, R.; Chou, F.; Chiang, A. Experiment and simulation of the recirculation flow in a CVD reactor for monolithic materials. Exp. Therm. Fluid Sci. 1996, 12, 45–51. [Google Scholar] [CrossRef] [Scilit]
- Back, L.; Roschke, E. Shear-layer flow regimes and wave instabilities and reattachment lengths downstream of an abrupt circular channel expansion. J. Appl. Mech. 1972, 39, 677–681. [Google Scholar] [CrossRef] [Scilit]
- Panton, R.L. Incompressible Flow; John Wiley & Sons: Hoboken, NJ, USA, 2024. [Google Scholar]
- Miller, R.W. Flow Measurement Engineering Handbook, 3rd ed.; McGraw-Hill: New York, NY, USA, 1996. [Google Scholar]
- Kaganovich, I.D. How to patch active plasma and collisionless sheath: A practical guide. Phys. Plasmas 2002, 9, 4788–4793. [Google Scholar] [CrossRef] [Scilit]
- Economou, D.J.; Alkire, R.C. Effect of potential field on ion deflection and shape evolution of trenches during plasma-assisted etching. J. Electrochem. Soc. 1988, 135, 941–949. [Google Scholar] [CrossRef] [Scilit]
- Kenney, J.A.; Hwang, G.S. Prediction of stochastic behavior in differential charging of nanopatterned dielectric surfaces during plasma processing. J. Appl. Phys. 2007, 101, 044307. [Google Scholar] [CrossRef] [Scilit]
- Huang, A.-N.; Ito, K.; Fukasawa, T.; Fukui, K.; Kuo, H.-P. Effects of particle mass loading on the hydrodynamics and separation efficiency of a cyclone separator. J. Taiwan Inst. Chem. Eng. 2018, 90, 61–67. [Google Scholar] [CrossRef] [Scilit]
- Tsuji, Y. Multi-scale modeling of dense phase gas–particle flow. Chem. Eng. Sci. 2007, 62, 3410–3418. [Google Scholar] [CrossRef] [Scilit]
- Wu, M.; Kuznetsov, A.V.; Jasper, W.J. Modeling of particle trajectories in an electrostatically charged channel. Phys. Fluids 2010, 22, 043301. [Google Scholar] [CrossRef] [Scilit]
- Horwitz, J.; Mani, A. Accurate calculation of Stokes drag for point–particle tracking in two-way coupled flows. J. Comput. Phys. 2016, 318, 85–109. [Google Scholar] [CrossRef] [Scilit]
- Chen, F. Introduction to Plasma Physics and Controlled Fusion; Springer: Berlin/Heidelberg, Germany, 2015. [Google Scholar]
- Lieberman, M.A.; Lichtenberg, A.J. Principles of plasma discharges and materials processing. MRS Bull. 1994, 30, 899–901. [Google Scholar]

Disclaimer/Publisher’s Note: The statements, opinions and data contained in all publications are solely those of the individual author(s) and contributor(s) and not of MDPI and/or the editor(s). MDPI and/or the editor(s) disclaim responsibility for any injury to people or property resulting from any ideas, methods, instructions or products referred to in the content. |
© 2026 by the authors. Licensee MDPI, Basel, Switzerland. This article is an open access article distributed under the terms and conditions of the Creative Commons Attribution (CC BY) license.