


Featured Application
The authors designed and are in the course of assembling a prototype scanner for in vivo bone mineral density assessment in the ankle and wrist via photon-counting dual-energy X-ray absorptiometry (DXA). The novel device has potential for clinical use in osteoporosis research, as well as for research on in-flight assessment of astronauts’ bone loss with a compact unit during long missions.
Abstract
Bone densitometry in osteoporosis diagnosis via dual-energy X-ray absorptiometry (DXA) can benefit from advances in imaging detector technology. We devised a compact imaging scanner—DXA4A—using a photon-counting and energy-sensitive Timepix4 hybrid pixel detector (512 × 448 pixels, 55 µm pitch), for areal bone mineral density (aBMD) assessments in the distal radius and tibia in the clinic and for future in-flight astronauts’ bone health assessment. We present the design and Monte Carlo simulations of the scanner. A Timepix4 detector with a 1 mm thick CdTe sensor was tested in the laboratory with X-ray tube sources, acquiring first images of test samples. Monte Carlo simulations were implemented for scanner design and performance prediction, using 50 kVp unfiltered and 100 kVp Sm K-edge filtered spectra. With a digital twin of the scanner and patient wrist, we set up a virtual imaging study and determined the aBMD in the forearm of a patient (0.515 ± 0.048 g/cm2), in agreement with the clinical DXA value (0.571 g/cm2 for the total forearm). This study highlights the feasibility of realizing a compact DXA scanner for the distal tibia and radius with spectral capabilities, exploiting Timepix4 hybrid detectors for its peculiar energy sensitivity and photon event timing properties for tissue identification.
1. Introduction
This study presents the design of a novel compact bone densitometry scanner (called DXA4A) for the distal tibia and radius, based on a photon-counting, energy-sensitive hybrid pixel Timepix4 detector equipped with a 1 mm thick CdTe semiconductor sensor. The virtual twin of the scanner was prepared using Monte Carlo (MC) simulations. In this framework, we set up an MC tool (called VIT-OSTEO), for virtual imaging and dosimetry trials for bone densitometry studies. Laboratory tests of the new generation Timepix4-CdTe assembly were performed.
We investigated various technical and conceptual solutions for the novel scanner, presenting them for illustration of the authors’ investigative approaches for technology understanding and for critical design parameter solutions.
1.1. Background
Assessment of bone strength is an important aspect of human healthcare in the diagnosis and treatment of diseases related to reduced bone mineral density and reduced bone mass. Specifically, this is the condition of patients with osteoporosis, who are increasingly susceptible to bone fractures [1], with a risk of 40–50% of lifetime fracture due to osteoporosis [2]. Clinical assessment of low levels of bone mineral density (volumetric BMD, g/cm3, bone mineral mass/bone volume) is commonly performed by dual-energy X-ray absorptiometry (DXA) non-invasive examinations of femoral neck, total hip, distal radius or lumbar vertebrae—expressed in terms of areal BMD (aBMD, g/cm2), representing bone mineral mass measured on the projected area of the bone, either at specific skeletal sites or the entire skeleton. Low aBMD values can be diagnostically indicative of possible bone mechanical fragility, with a strong correlation to fracture risk [3].
DXA is a non-invasive, reliable, accurate (1–2.5%), precise (0.5–1%), promptly interpretable, low-dose, low-cost, and fast X-ray imaging examination, adopted in screening patients for osteoporosis, as well as for management and follow-up of related treatments and for assessment of possible vertebral fractures via lateral view of the thoracic/lumbar spine [4]. The measurement principle is based on the determination of the (logarithmic) attenuation of a collimated X-ray beam in soft tissue and bone components of body tissues. Acquisitions allow the extraction of aBMD from the derivation of beam attenuation for two separate X-ray energy spectra in a tissue of thickness t (cm), assuming known energy dependent mass attenuation coefficients, μ/ρ (cm2/g), of soft tissue and bone components, and unknown areal density, σ = ρ·t (g/cm2), of each tissue component (with density ρ, g/cm3) along the direction of propagation of the X-ray beam. Determinations of beam attenuation at two separate photon energy intervals permit the derivation of the unknown areal density σ for the two model tissue components of the body [5].
The 3D trabecular bone microarchitecture (at the level of <0.1 mm size) can be specifically weakened by pathological bone loss mechanisms, impairing the bulk mechanical strength of the bone and its load and stress capabilities. In this respect, while DXA is the gold standard for osteoporosis diagnosis, specifically via proximal femur scan [3], complementary imaging techniques, such as quantitative computed tomography (QCT) (lumbar spine and hip), peripheral (ankle, wrist) QCT (pQCT), and high-resolution pQCT with dedicated extremity scanners (HR-pQCT) (distal tibia and radius), are also employed for clinical diagnosis and for research purposes, with high precision and accuracy [6].
For X-ray-based imaging techniques used in osteoporosis, the patient effective dose reported is in the order of 10 μSv for DXA scans in adults, 10–3000 μSv for QCT, less than 10 μSv for pQCT [7], and 2 μSv for HR-pQCT scans [8].
In commercial DXA units, dual energy operation with polychromatic beams is achieved by either rapidly switching the kilovoltage applied to the X-ray tube, or by using K-edge filtration of the photon spectrum. As regards detector technology, both energy-integrating scintillator-based X-ray detectors and semiconductor (typically, CdTe) photon-counting pixel detectors are adopted in modern DXA scanners.
1.2. The DXA4A Project
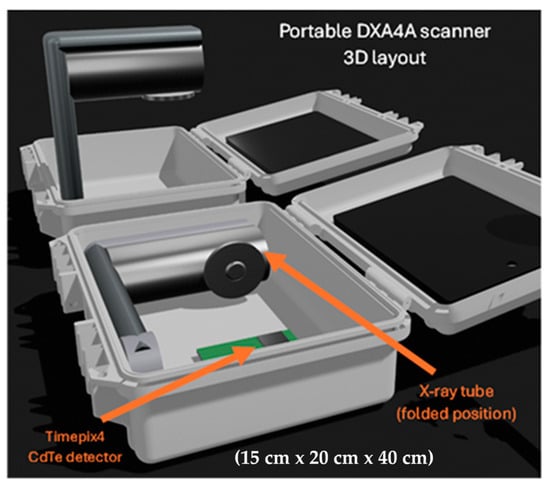
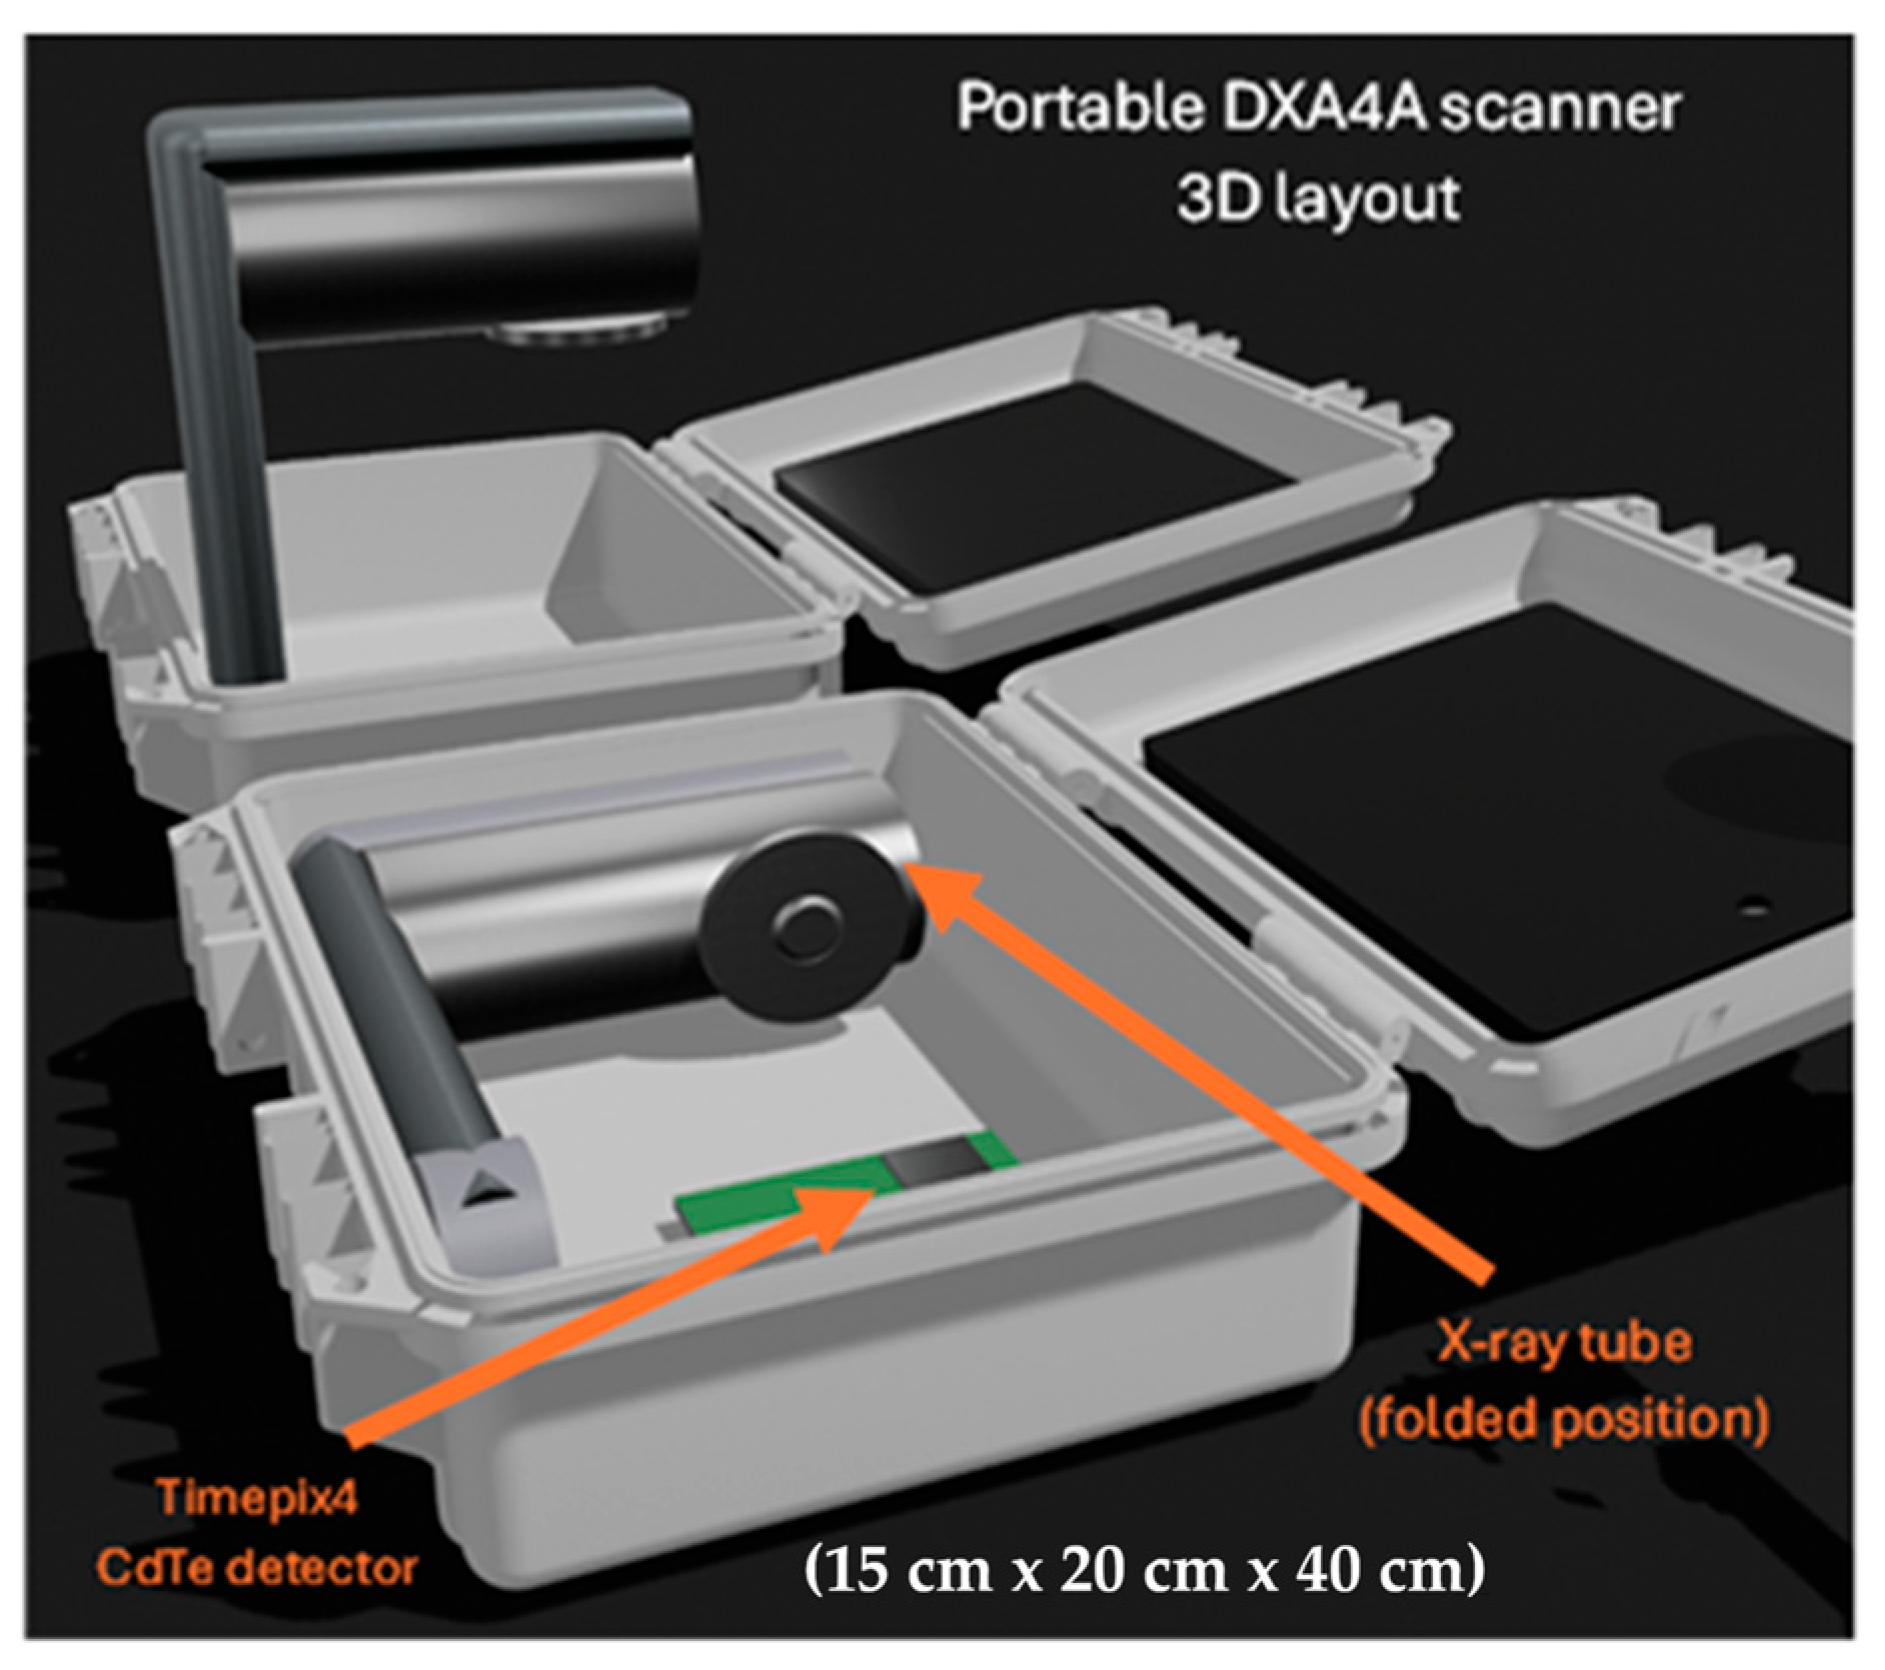
Our team at the University of Naples Federico II (UNINA) and the Istituto Nazionale di Fisica Nucleare (INFN), with the Scuola Superiore Meridionale (SSM), began in 2025 a project to design and demonstrate a prototype DXA scanner for limb imaging, to be used as a compact imaging unit onboard long-duration spaceflights for periodic assessment of astronauts’ bone health. This novel DXA device for astronauts (called DXA4A), currently under development (Figure 1), was intended as a diagnostic tool for monitoring their aBMD decrease due to microgravity conditions, this being a major health problem for astronauts during long spaceflights, characterized by an average bone loss of 0.1% per month for upper limbs and of 0.8% per month for lower limbs, due to skeletal deconditioning in microgravity [9]. A review of space radiography has recently been published [10], which also addresses the assessment of astronauts’ bone health.
Figure 1.
Computer 3D drawing of the imaging unit (called DXA4A) for bone densitometry of the distal tibia and radius, contained in a compact carrying case. A shaped holder will keep the wrist or the ankle in place in the field of view of the X-ray beam during the examination. The imaging detector is a Timepix4 hybrid pixel detector equipped with a CdTe sensor. High-voltage generator and detector readout are hosted at the bottom of the case; external connection to a notebook provides acquisition control, data analysis, and display.
The requirements of compactness, low mass, and low power consumption of the DXA4A scanner made it suitable also as a research-level, portable, and low-cost device for DXA of the distal tibia and radius in the clinical environment, for osteoporosis studies. A schematic depiction of the DXA4A device layout is shown in Figure 1.
The proposed DXA4A device is intended for scanning the distal tibia or radius. Though these are not standard examination sites for bone densitometry with DXA (which is usually performed at the lumbar spine or the femoral neck), the forearm can also be used for bone density assessment in patients with fractures, hip replacement, or spine surgical implants that might hinder scan interpretation, or for patients who cannot be accommodated on the DXA table [4,11]. Several studies explored the correlation between aBMD assessment via DXA, QCT in central skeletal sites (femoral neck, spine), and HR-pQCT performed in the distal tibia or distal radius [12,13,14], reporting a strong association with bone density measured with those three techniques. More specifically, the microstructure, density, and stiffness of bones measured by HR-pQCT at the distal tibia and radius were shown to correlate with stiffness of the lumbar spine and proximal femur [13]. We can therefore suggest that aBMD assessment in distal sites, including the forearm or the ankle, is suitable for assessing the overall bone health of the patient.
A novel feature of DXA4A compared to commercially available devices is the use of a spectral photon-counting detector. Specifically, it will employ a hybrid pixel Timepix4 detector [15], developed by the Medipix4 collaboration at CERN (Geneva, Switzerland), equipped with a 1 mm thick CdTe sensor. Using the spectral capabilities of such a detector, it will be possible to perform dual-energy imaging with a single acquisition, using a continuous X-ray spectrum. Indeed, photons’ energy will be discriminated at the detector level, and two (or more) images will be produced by applying thresholds in the processing phase. To the best of our knowledge, only one DXA device currently available on the market employs a photon-counting detector: the scanner uses a single-threshold CdTe photon-counting detector with an active area of 2.56 cm × 0.16 cm and relatively large pixels (0.8 mm pitch). In comparison, the Timepix4 detector provides a larger active area of 2.816 cm × 2.464 cm, and a significantly smaller pixel pitch (55 µm), potentially enabling higher spatial resolution, and, most importantly, true spectral imaging capabilities.
This work aims to present the initial steps of our teams in the research project (DXA4A) for the development of a photon-counting DXA scanner for the distal tibia and radius, to be employed for in-flight bone health assessment in astronauts during long spaceflights, with possible use also in the clinical environment.
Diverse technological challenges are associated with this project, including scanner design and scan geometry, X-ray spectrum, detector experimental assessment in the photon-counting and spectral regime, and scanner simulation for predicted performance determination. Further papers in the future will illustrate the progress of the DXA4A project; here, we intend to illustrate the issues and the solutions prospected. Specifically, we present the device design and MC simulations of its virtual twin, used for proof-of-concept validation, design optimization, and performance prediction. The basic proof-of-concept and calibration of the scanner—in its initial configuration—are demonstrated through simulated acquisitions, including the measurement of aBMD in a virtual patient. Finally, the first experimental tests of the Timepix4 CdTe detector are presented, showing the peculiar aspects and initial efforts for spectral imaging with such a small pixel pitch detector.
A specific design goal is to take full advantage of the spectral sensitivity of the Timepix4-based detector (which can acquire X-ray images at many spectral energy bins with a resolution of a few keV) via investigating raw data analysis procedures which include either dual-energy acquisitions or multiple-energy acquisitions. In the former case, just one energy threshold is necessary for creating low-energy (LE) and high-energy (HE) images. This is the approach adopted in commercial DXA scanners, which employ a photon-counting CdTe detector and a K-edge filtered X-ray spectrum, where LE and HE photon spectra are well separated. On the other hand, in the latter approach, the transmitted X-ray spectrum is acquired at a plurality of energy bins, with subsequent selection of the suitable energy intervals for LE and HE images calculation; in this case, use of a K-edge filtered spectrum may not conceptually be needed. Initial exploration of DXA4A solutions with either a continuous (unfiltered) or a K-edge filtered source spectrum is a specific investigative goal of this study.
Adding to the above points, the suitability of Timepix4 CdTe detectors for such radiographic techniques is also of interest here, since published reports of the performance of this novel detector are still lacking.
We point out that the compact structure of the DXA4A scanner with its motionless geometry, related to its in-flight usage, does not prevent the future development of a different version of the Timepix4 spectral DXA scanner dedicated to the lumbar spine and femur for full clinical usage, which employs a lateral and longitudinal scan of the patient anatomical site with a moving single detector assembly. Present limitations of this work and future developments will be fully detailed in the Section 5 and Section 6.
2. Materials and Methods
2.1. GPU Monte Carlo Software
The MC code used in this work is a tailored version of the GPU-based code gCTD developed by the team at JHU (USA) [16,17], previously validated for applications in the diagnostic energy range [18,19,20,21], accounting for Compton scattering, Rayleigh scattering, and photoelectric absorption (without X-ray fluorescence de-excitation or Auger electron production). For this work we used a new version (v1.1) of gCTD, adopted in our novel MC platform (VIT-OSTEO) for bone imaging [8].
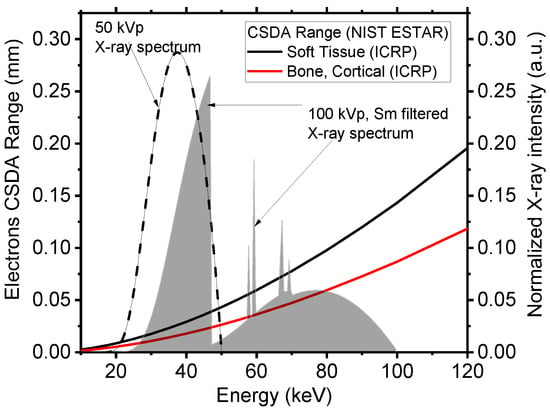
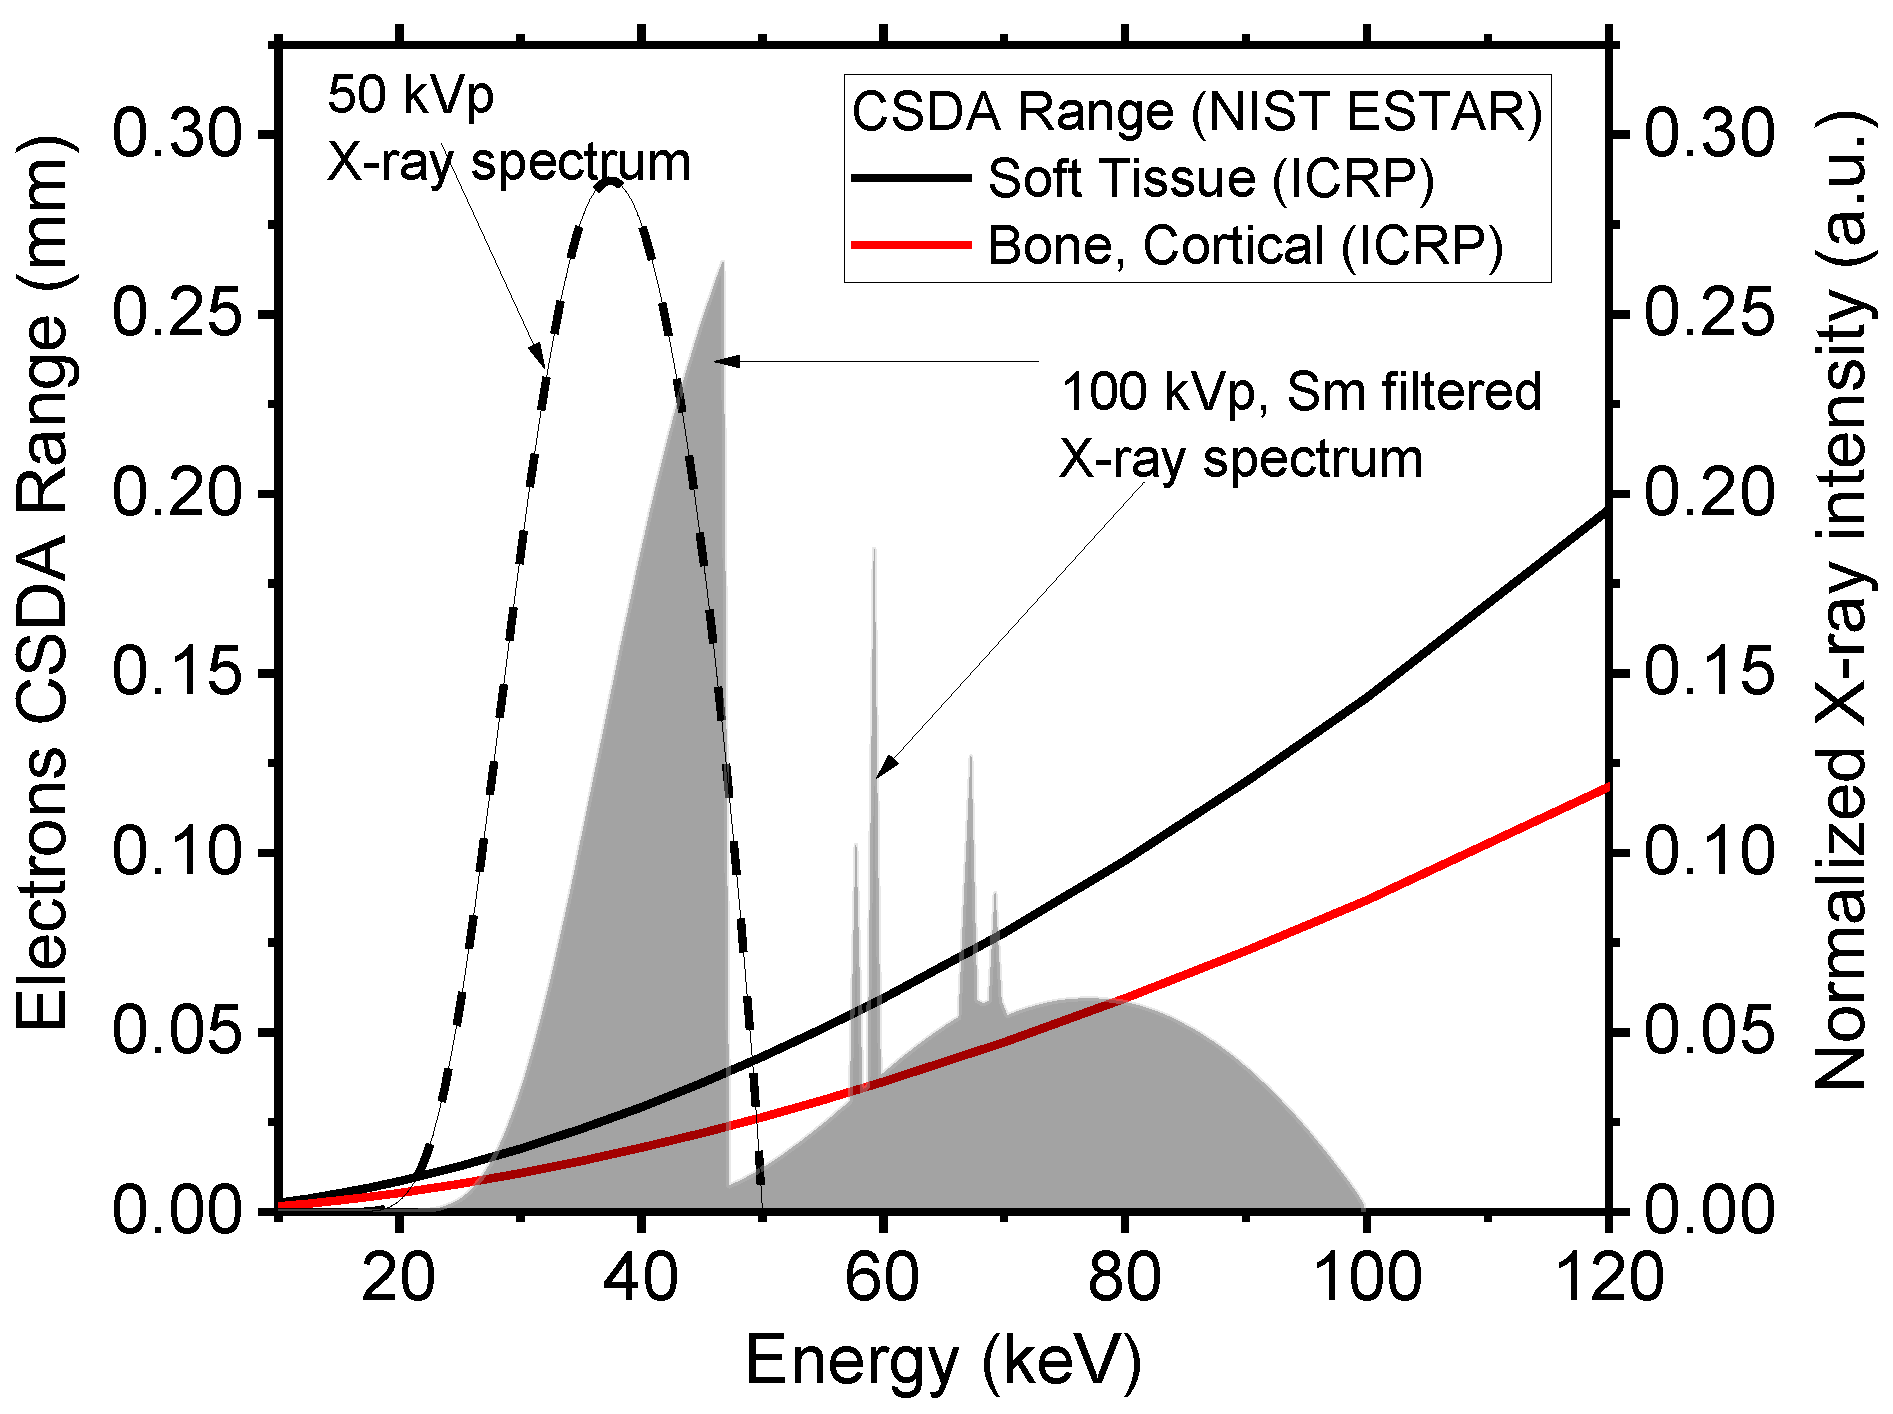
Energy deposition is recorded at the sites of inelastic interactions, and secondary electrons are not tracked, but their energy is deposited locally. This simplification, which considerably reduces the computation time, is valid when considering that the CSDA (continuous slowing down approximation) range for electrons in soft tissue and cortical bone in the diagnostic energy range (Figure 2) is between 1/6 and 1/4 of a millimeter, respectively, and it is less than 0.050 mm below 50 keV, with a voxel side of our phantoms of 0.120 mm.
Figure 2.
CSDA range of electrons in soft tissue (continuous black line) and in cortical bone (continuous red line), as a function of electrons’ kinetic energy. Range data from the NIST ESTAR database [22]. The dashed line shows the X-ray polychromatic spectrum adopted in this work (50 kVp), indicating that secondary electrons generated in soft and hard tissues have a range below 0.05 mm. Also shown for reference is a Sm K-edge filtered 100 kVp high-energy spectrum used by the Lunar iDXA unit (GE Healthcare), for which the electron range in soft tissue is less than 0.15 mm. All spectra are simulated using SpekPy ver. 2.0.8 [23], available on the website https://spekpy.smile.ki.se/ (URL accessed on 3 March 2026).
The gCTD software v1.1 simulates the emission of an X-ray beam (cone-shaped) from a rectangular focal spot of selectable size. Both planar radiography and CT can be simulated. For each projection, the absorbed dose in each voxel of the digital phantom is registered in gray (Gy). The acquisition of an image can be simulated using either an energy-integrating detector or a spectral photon-counting detector. In either case, the interaction of photons within the detector is not simulated. If a spectral photon-counting detector is used, the user can select the energy threshold and binning of the energy spectrum.
The MC code was run on a DELL (Dell S.p.A., Milan, Italy) Alienware Aurora R11 desktop computer (Intel i9-10900KF, 3.70 GHz, 128 GB DDR4 RAM 3200 MHz) equipped with an NVIDIA GeForce RTX 3090 GPU card (1.70 GHz boost clock, 10496 CUDA cores, 24 GB of dedicated GDDR6X memory). With this hardware, a timing performance (simulation time) of was achieved for our setup. For a single projection with 1011 photons, the simulation lasted approximately 3 min, including disk data saving.
2.2. DXA Digital Scanner
We simulated a compact DXA scanner based on a hybrid pixel detector composed of a 1 mm thick CdTe sensor bump-bonded to a Timepix4 [15] application-specific integrated circuit (ASIC). We simulated the detector as an array of four Timepix4 assemblies (each with 512 × 448 pixels each of 55 µm × 55 µm sensitive area) with no dead space, for a total of 2048 × 448 pixels (11.264 cm × 2.464 cm sensitive area). As previously stated, the interactions of photons within CdTe are not simulated in our MC code, where the detector is simulated as an ideal scoring plane. Nevertheless, some post-processing was applied to the simulated images to emulate the real behavior of the detector. The detection efficiency of the sensor was accounted for by multiplying the number of photons in each energy channel by the corresponding detection efficiency. To account for charge sharing between pixels, a Gaussian filter (sigma = 2 pixels) was applied to the image. Such a value of sigma was determined by Geant4 simulations, where a pencil beam of 40 keV photons was impinged orthogonally on a 1 mm thick CdTe wafer with 55 μm pitch pixels: we placed the beam at the center, on the edge, and at the corner of a pixel. For each of these configurations, we evaluated the spatial distribution of absorbed energy by fitting it with a Gaussian function. The maximum spread found in this analysis was 2 pixels, which was therefore chosen as the sigma for the smoothing Gaussian filter to be applied to the images. We point out that, in the Geant4 simulations we performed, we did not simulate any electrical field within the sensor.
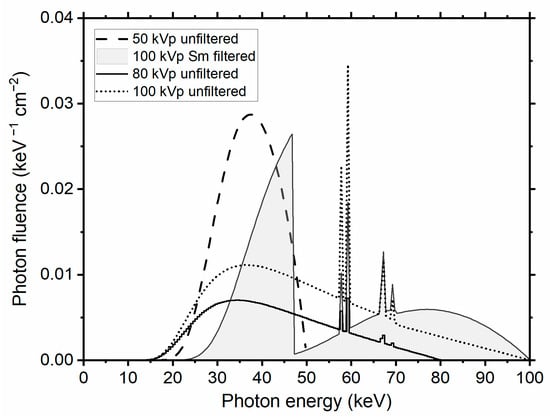
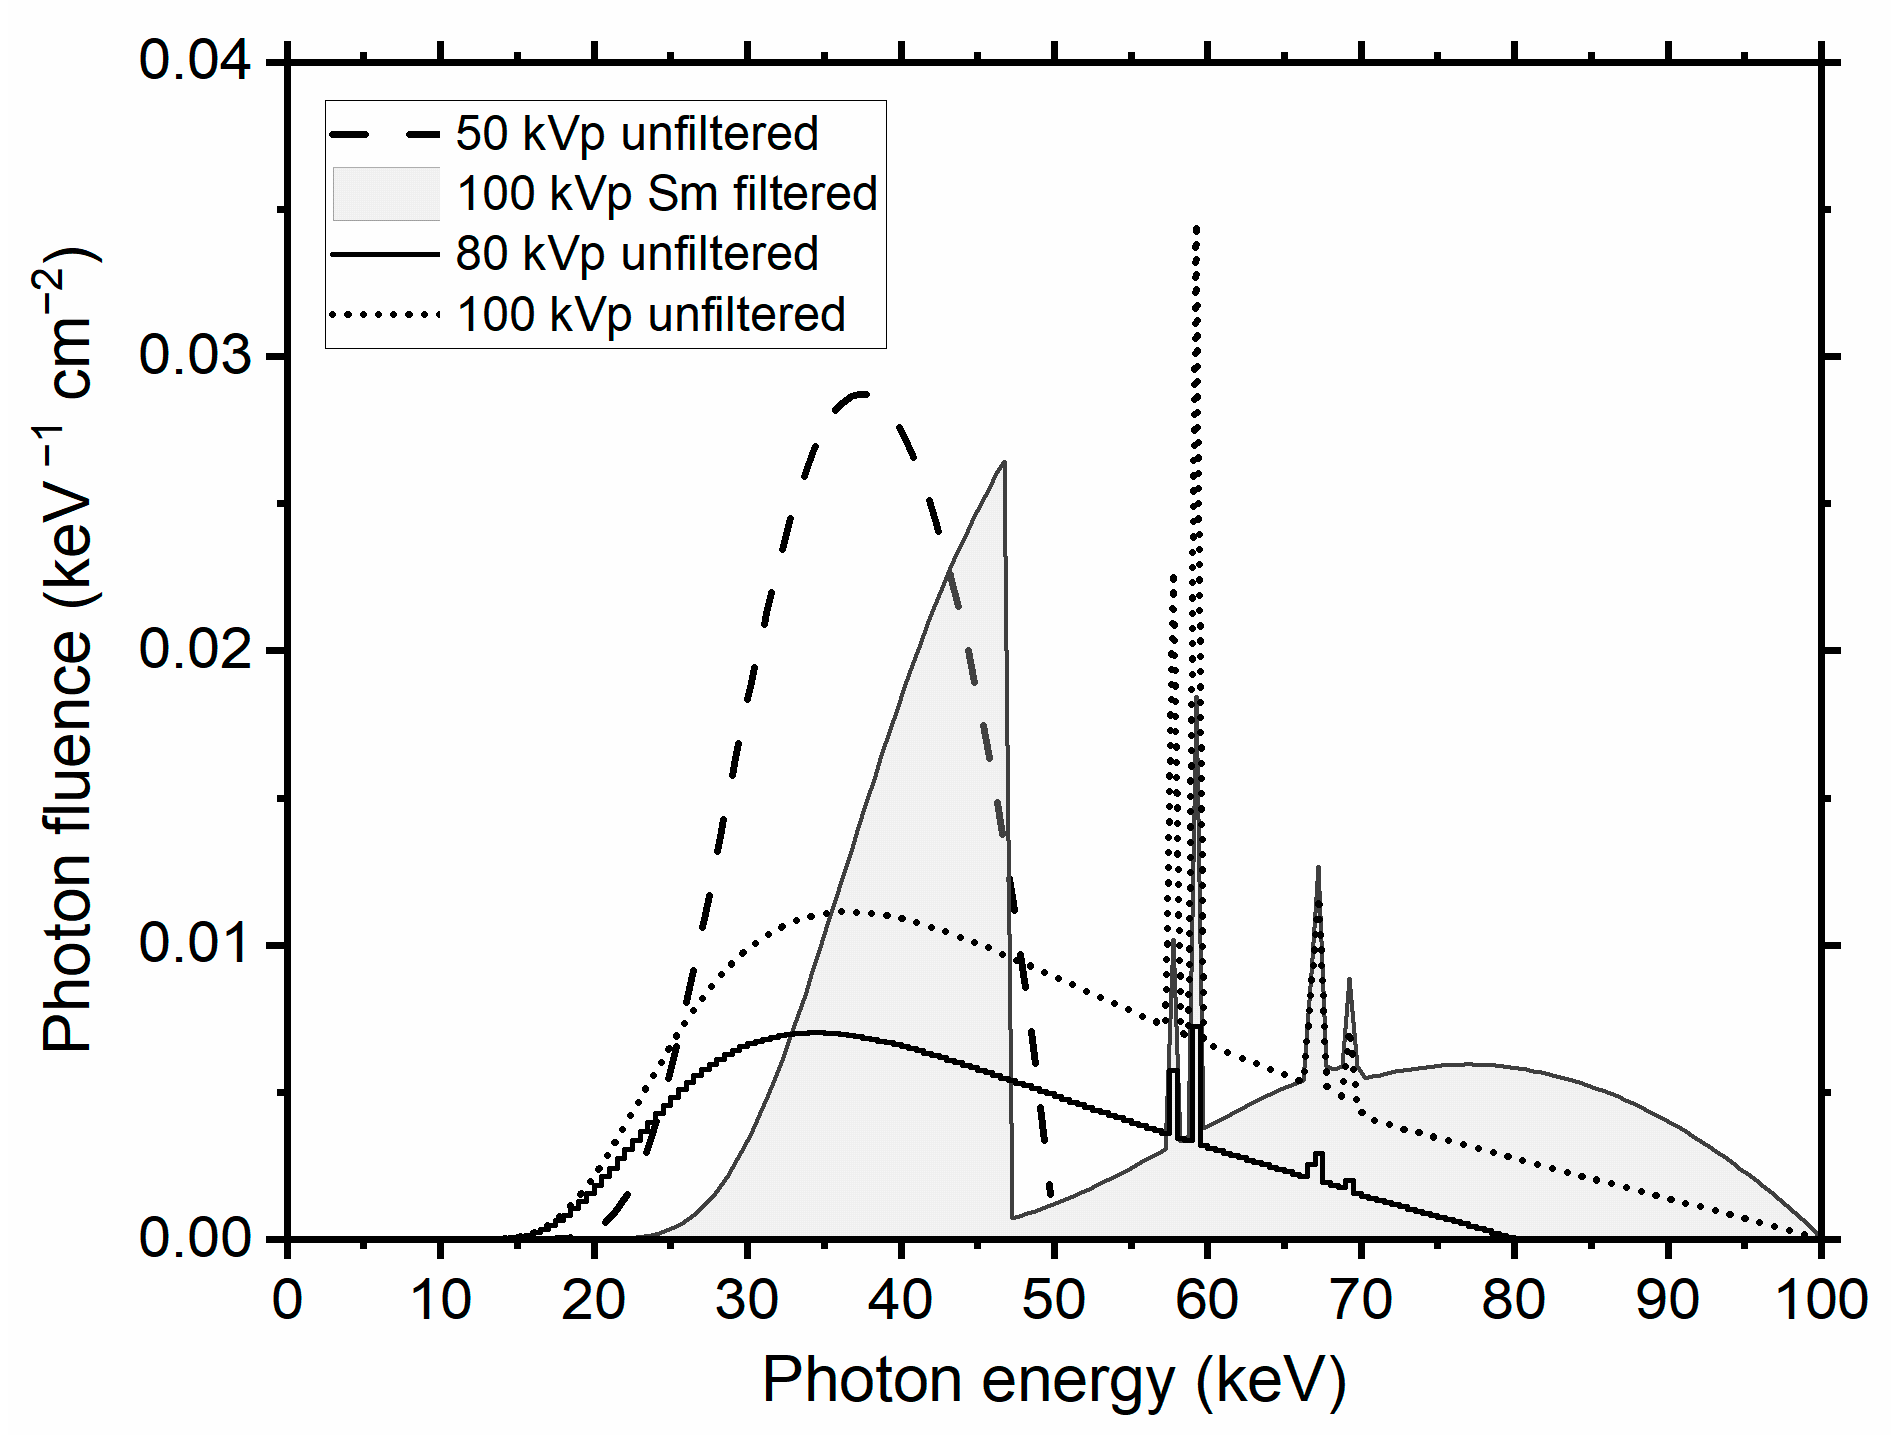
We simulated the X-ray beam spectrum (Figure 3) emitted by a tungsten anode X-ray tube operated at 50 kVp with a 3.1 mm Al HVL (filtration: 2.5 mm Al + 0.150 mm Cu + 0.200 mm Be, median energy 37 keV, fan angle 11°). A focal spot size of 35 µm × 35 µm was simulated, with a uniformly emitting area. The source-to-detector distance was 35 cm. In the MC simulations here reported and analyzed, 1011 primaries were launched within an 11° semi-aperture cone, axially collimated to 2.5 cm on the detector plane. The center of the voxelized phantom was placed at 25 cm from the X-ray source and at 10 cm from the detector.
Figure 3.
Normalized polychromatic X-ray spectra (photon fluence per energy interval) adopted in the MC simulations, calculated with SpekPy [23]. Low-energy (LE) and high-energy (HE) spectral windows for dual-energy attenuation calculations were selected using a single threshold equal to the median energy of the spectrum, hence assuring equal statistics for LE and HE incident photon fluence.
To evaluate the effect of the X-ray spectrum on aBMD determination, we performed Monte Carlo simulations using multiple spectra (Figure 3). Specifically, we simulated continuous spectra at 50, 80, and 100 kVp generated by a tungsten (W) anode with 2.5 mm aluminum filtration. In addition, we simulated a K-edge filtered 100 kVp spectrum using a 0.3 mm samarium (Sm) filter combined with 2.5 mm aluminum filtration, corresponding to the spectrum used in the clinical Lunar iDXA scanner (GE HealthCare, Milan, Italy)(see Section 2.5).
For the sake of completeness, we notice that an at least possible commercial choice for this X-ray source is the Oxford Instruments X-Ray Technology (Scotts Valley, CA, USA) Apogee 5500 series radiation shielded packaged tube (max 50 kV tube voltage, 50 W, 1 mA tube current, 35 µm nominal focal spot size, tungsten target, 11° target angle, dimensions 180 mm L × Ø 70 mm, 2.26 kg weight, with 50 W Shasta series compact power supply, dimensions 140 mm × 83.5 mm × 240 mm, weight 3.6 kg). However, for the DXA4A design, other commercial 50 W X-ray tube sources are under consideration as well, permitting tube voltages up to 80 kV.
2.3. Digital Phantom for Calibration
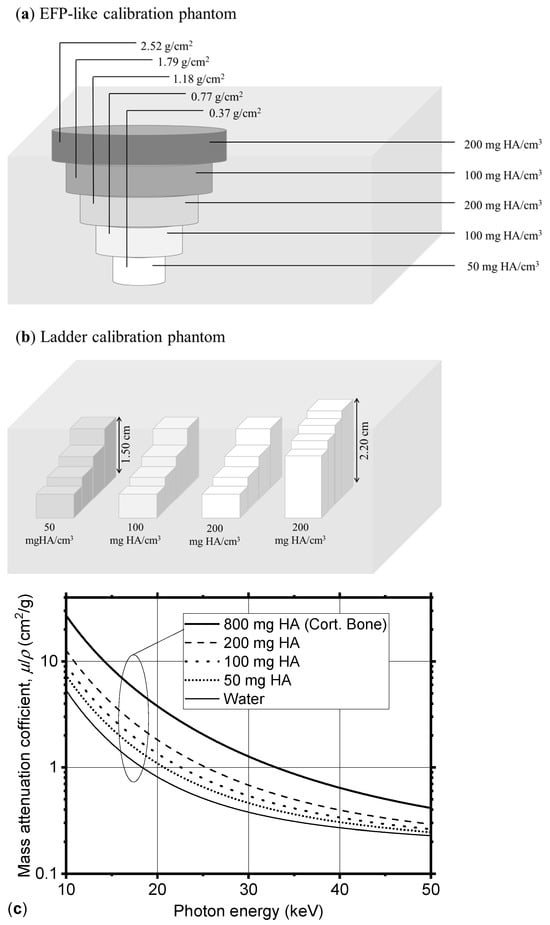
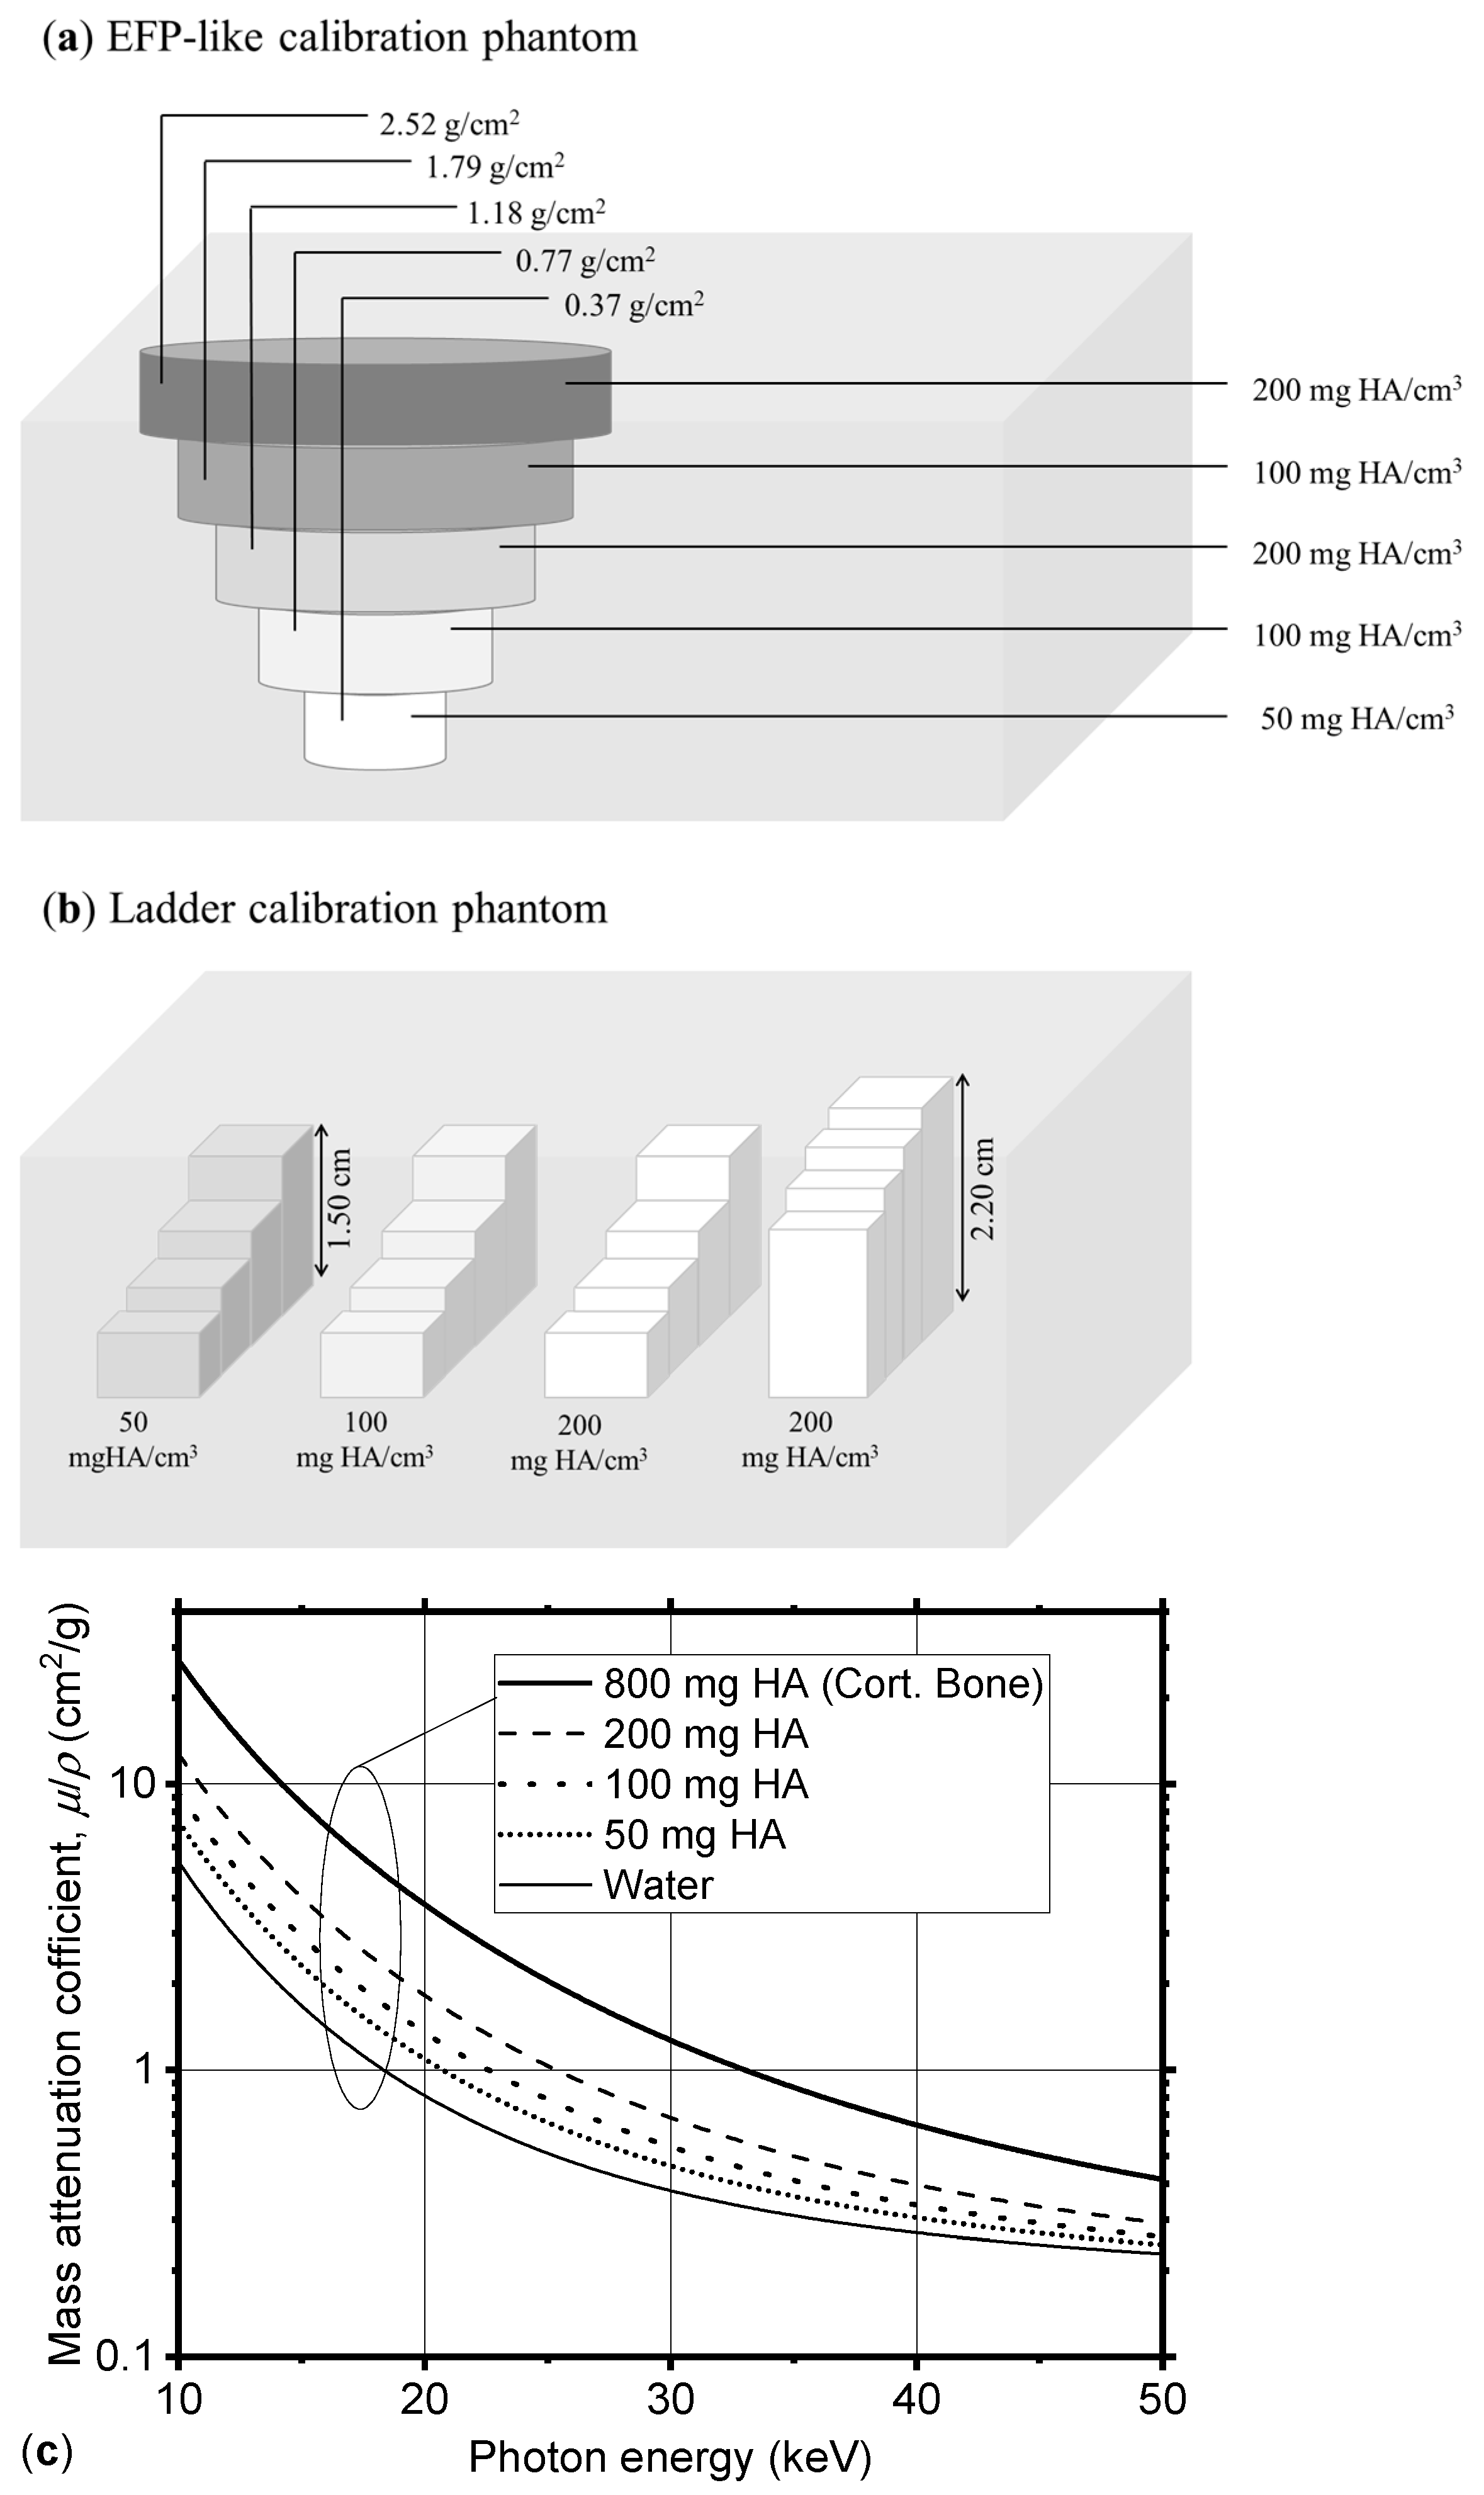
We devised a simplified computational model of a physical DXA calibration phantom by creating a digital voxelized object (voxel size 0.125 mm) mimicking five inserts of the European Forearm Phantom (EFP) [24]. Our model was composed of a water box, containing five rods with different hydroxyapatite content (50, 100, 200 mg HA/cm3) and of different diameters (Figure 4a). The EFP phantom is a physical test object for quality control presently produced by QRM (Möhrendorf, Germany), and used clinically for performing a calibration of a pQCT and DXA scanner for peripheral bone densitometry; it contains 5 sections, having an equivalent density in mg of hydroxyapatite per cm3 (mg HA/cm3) varying from 0 to 200 mg HA/cm3. With respect to the EFP phantom, the digital phantom here realized was adapted to the small field of view of the simulated device by adjusting the rods’ height. In addition to the EFP-like calibration phantom described above, we designed a second calibration phantom featuring four ladder-shaped inserts (Figure 4b). Each insert consists of a single material arranged in slabs of varying thickness, resulting in different areal mineral density values (see Table 1). We defined such materials as a homogeneous mixture of water and hydroxyapatite. Photon interaction cross-sections (Figure 4c) needed for MC simulations were determined using an original subroutine (material.f of the MC simulation code PENELOPE (version v1)) [25]. Within the subroutine, we defined mixtures by a pseudo-chemical formula. The densities of materials used for these digital phantoms are reported in Table 1.
Figure 4.
Scheme of the digital test objects used for virtual DXA calibration: (a) a water box containing five cylindrical inserts of hydroxyapatite of different concentrations, and (b) a water box containing four ladders of different materials, in several values of thickness. (c) Mass attenuation coefficient for the water–HA mixture at different concentrations, as defined in the MC code (coefficients computed using the material generation routine available in the MC code PENELOPE).
Table 1.
Composition, density, and HA equivalent density of materials of the phantoms used in the MC simulation (Figure 4a,b).
2.4. Virtual DXA Scanner Calibration
We performed a simulated scan of the virtual calibration phantoms described in Section 2.3. A photon-counting acquisition was simulated, with collected photons on the detector plane being split into a low-energy (LE, photon energy < 37 keV) and a high-energy (HE, photon energy ≥ 37 keV) channel. The energy resolution of the detector was not accounted for, hence no separation between LE and HE spectra was considered. The value of the threshold, 37 keV, was selected to be the median energy of the simulated spectrum, which implies that the same number of X-ray incident (primary) photons is adopted for generating the LE and HE transmitted images. We then selected regions of interest (ROIs) within the inserts and one within the soft tissue, where we computed the X-ray beam logarithmic attenuation, , separately for the LE () and HE () images:
Here, represent the beam intensity in either channel (i.e., the number of photons reaching the detector, passing through the object, recorded in the LE and HE channels, respectively) in the acquired image, and and represent the beam intensity for LE and HE energy intervals, respectively, in a flat-field acquisition (i.e., with no object in the detector’s field of view). By assuming the validity of the Beer–Lambert law, whereby with σ indicating material’s areal density, we can write:
Here, and are the areal densities (g/cm2) of bone and soft tissue components of thickness and (cm), respectively:
where and are the volume densities (g/cm3) of the tissue components, and , (cm2/g) are their corresponding energy-dependent mass attenuation coefficients. Solving Equations (3) and (4) for the areal density of bone, , and soft tissue, , assuming known attenuation coefficients (evaluated at selected photon energies ELE and EHE for the two image channels, respectively), we obtain the following formula for the areal bone mineral density:
The quantity, , is given by:
and represents the ratio of the attenuation coefficients of soft tissue at low and high energy [5]. This can be assessed from the DXA images by computing the attenuation in a region of interest where only soft tissue is present, assuming volume homogeneity of soft tissue.
By applying the Beer–Lambert law, Equations (3) and (4) assume that the contribution of photon scatter to the transmitted X-ray beam is low at the detector’s sensitive surface (i.e., as in narrow beam conditions), and that the width of the energy bins of LE and HE images is short enough to assure quasi-monochromaticity of the detected photons; use of K-edge filtration permits a good separation between LE and HE energy spectra. Hence, one may consider representative single energies (keV) for transmitted LE and HE images, respectively, e.g., given by the mean or the weighted mean of either energy spectra, then adopt a bi-energetic transmitted spectrum for aBMD calculation. We note that the use of a bi-energetic incident spectrum equivalent to a polyenergetic spectrum has been investigated as a useful computation time-saving step in the realization of a digital twin of a commercial DXA scanner [26].
When applying this algorithm to our unfiltered spectrum, we split it into two channels (LE, HE) using the median energy of the spectrum (37 keV), as previously stated. Then, we computed the weighted mean of the two channels of the energy spectrum, which were ELE = 31.9 keV, and EHE = 42.0 keV, for the low- and high-energy channels, respectively. For computing the areal bone mineral density, we used mass attenuation coefficients at these two energies. The threshold and the two mean energies considered for each spectrum we simulated are reported in Table 2.
Table 2.
Spectra used in the Monte Carlo simulations, together with their median energies, the thresholds used to separate the low- and high-energy channels, and the corresponding effective energies (ELE, EHE) used for the aBMD computation. The effective energies were calculated as the weighted mean energies of the low- and high-energy portions of each spectrum.
2.5. aBMD Measurement for a Virtual Patient
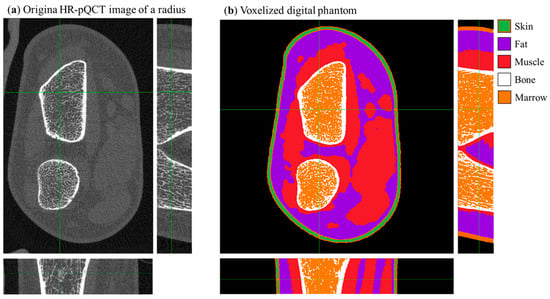
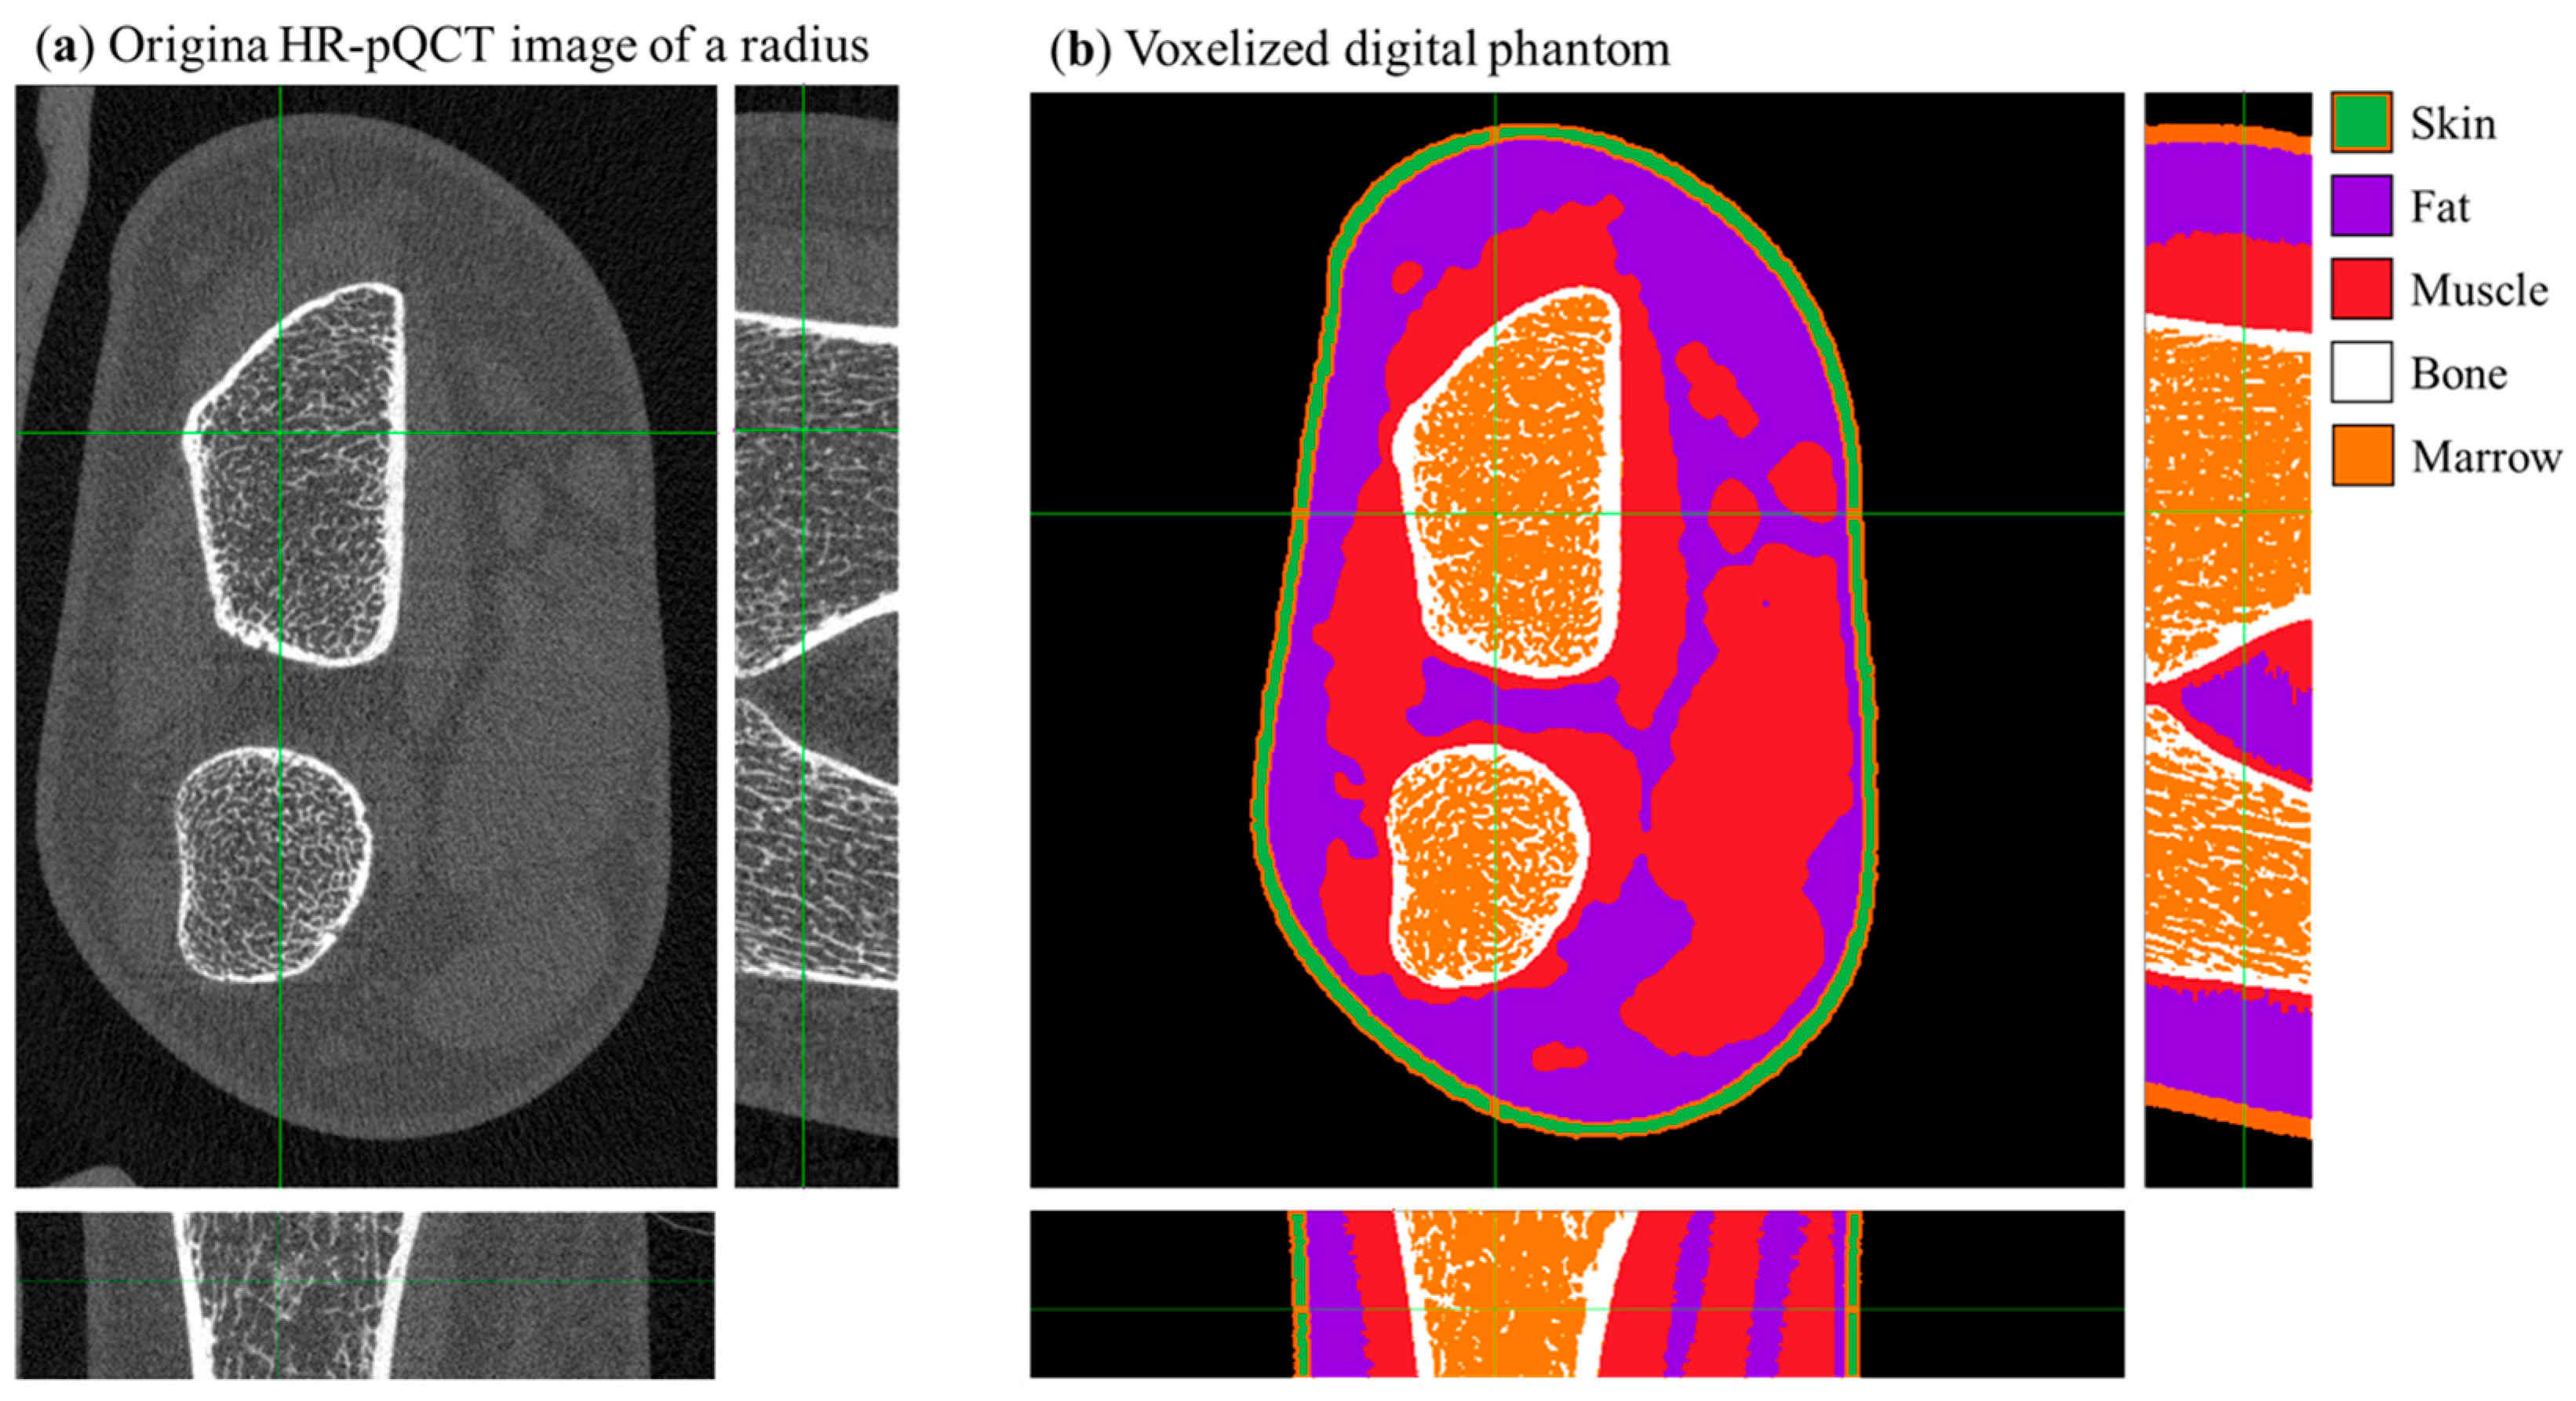
We performed a simulated DXA scan of a virtual patient’s radius. The patient’s voxelized phantom (Figure 5b) was derived from the original HR-pQCT acquisition (Figure 5a) of a 25-year-old female (176.6 cm body height, 78.3 kg body mass, body mass index 25.1) with an aBMD radius and ulna ultradistal of 0.353 g/cm2 and 0.311 g/cm2, respectively, and an aBMD of 0.571 g/cm2 in the total left forearm.
Figure 5.
(a) Central slice views in the original HR-pQCT (density calibrated) image of a radius. (b) Central slice of the digital voxelized phantom of a radius derived via semi-automatic segmentation from the dataset shown in panel (a); the color scale identifies different tissues. Green crosshair lines identify the center of field of view of the scanner.
Bone tissue in the voxelized phantom of the patient was modeled as a homogeneous mixture of HA and water with an equivalent density of 800 mg HA/cm3 (Table 1). aBMD measurements were obtained from a clinical DXA scan of the volunteer performed with a GE Lunar iDXA (100 kVp filtered spectrum). The 3D tomographic image of the patient’s radius (voxel size 0.060 mm) was segmented using a semi-automatic algorithm described in [8]. Tissues were separated into bone tissue, fat, skin, and muscle. The so obtained voxelized phantom was then binned by a factor of 2 for computational limitations, therefore giving a final phantom (Figure 5b) of 550 × 550 × 84 cubic voxels with a side length of 0.120 mm.
2.6. Effective Dose Estimate from MC Simulations
As described in Section 2.1, the gCTD Monte Carlo software (v1.1) provides both the radiographic projections of the virtual phantom and the corresponding 3D absorbed dose map. From this dose distribution, we computed the effective dose (µSv) following the method reported in [8]. The same dataset was used to estimate the entrance surface air kerma (ESAK, µGy), calculated within a 400 cm3 air volume (cylinder of 100 cm2 base area × 4 cm height), emulating a Victoreen Model 660-5 ionization chamber. The number of simulated photons was then calibrated to achieve an ESAK of 10 µGy, corresponding to the value reported for a standard forearm protocol with the GE Lunar iDXA scanner (see manufacturer’s manual).
2.7. Timepix4 CdTe Photon-Counting Detector and the Experimental Setup
The design of the DXA4A bone densitometer features a linear array of four Timepix4 hybrid pixel detectors [15]. Hardware support for such a multi-chip configuration is under development by the team at the Institute of Experimental and Applied Physics of the Czech Technical University (IEAP) and the University of West Bohemia (UWB). First experimental measurements were performed using a single Timepix4 chip bump-bonded to a 1 mm thick CdTe sensor.
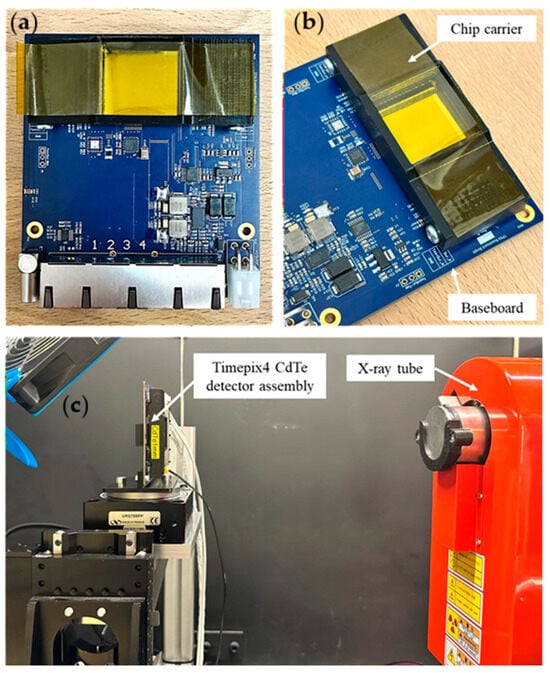
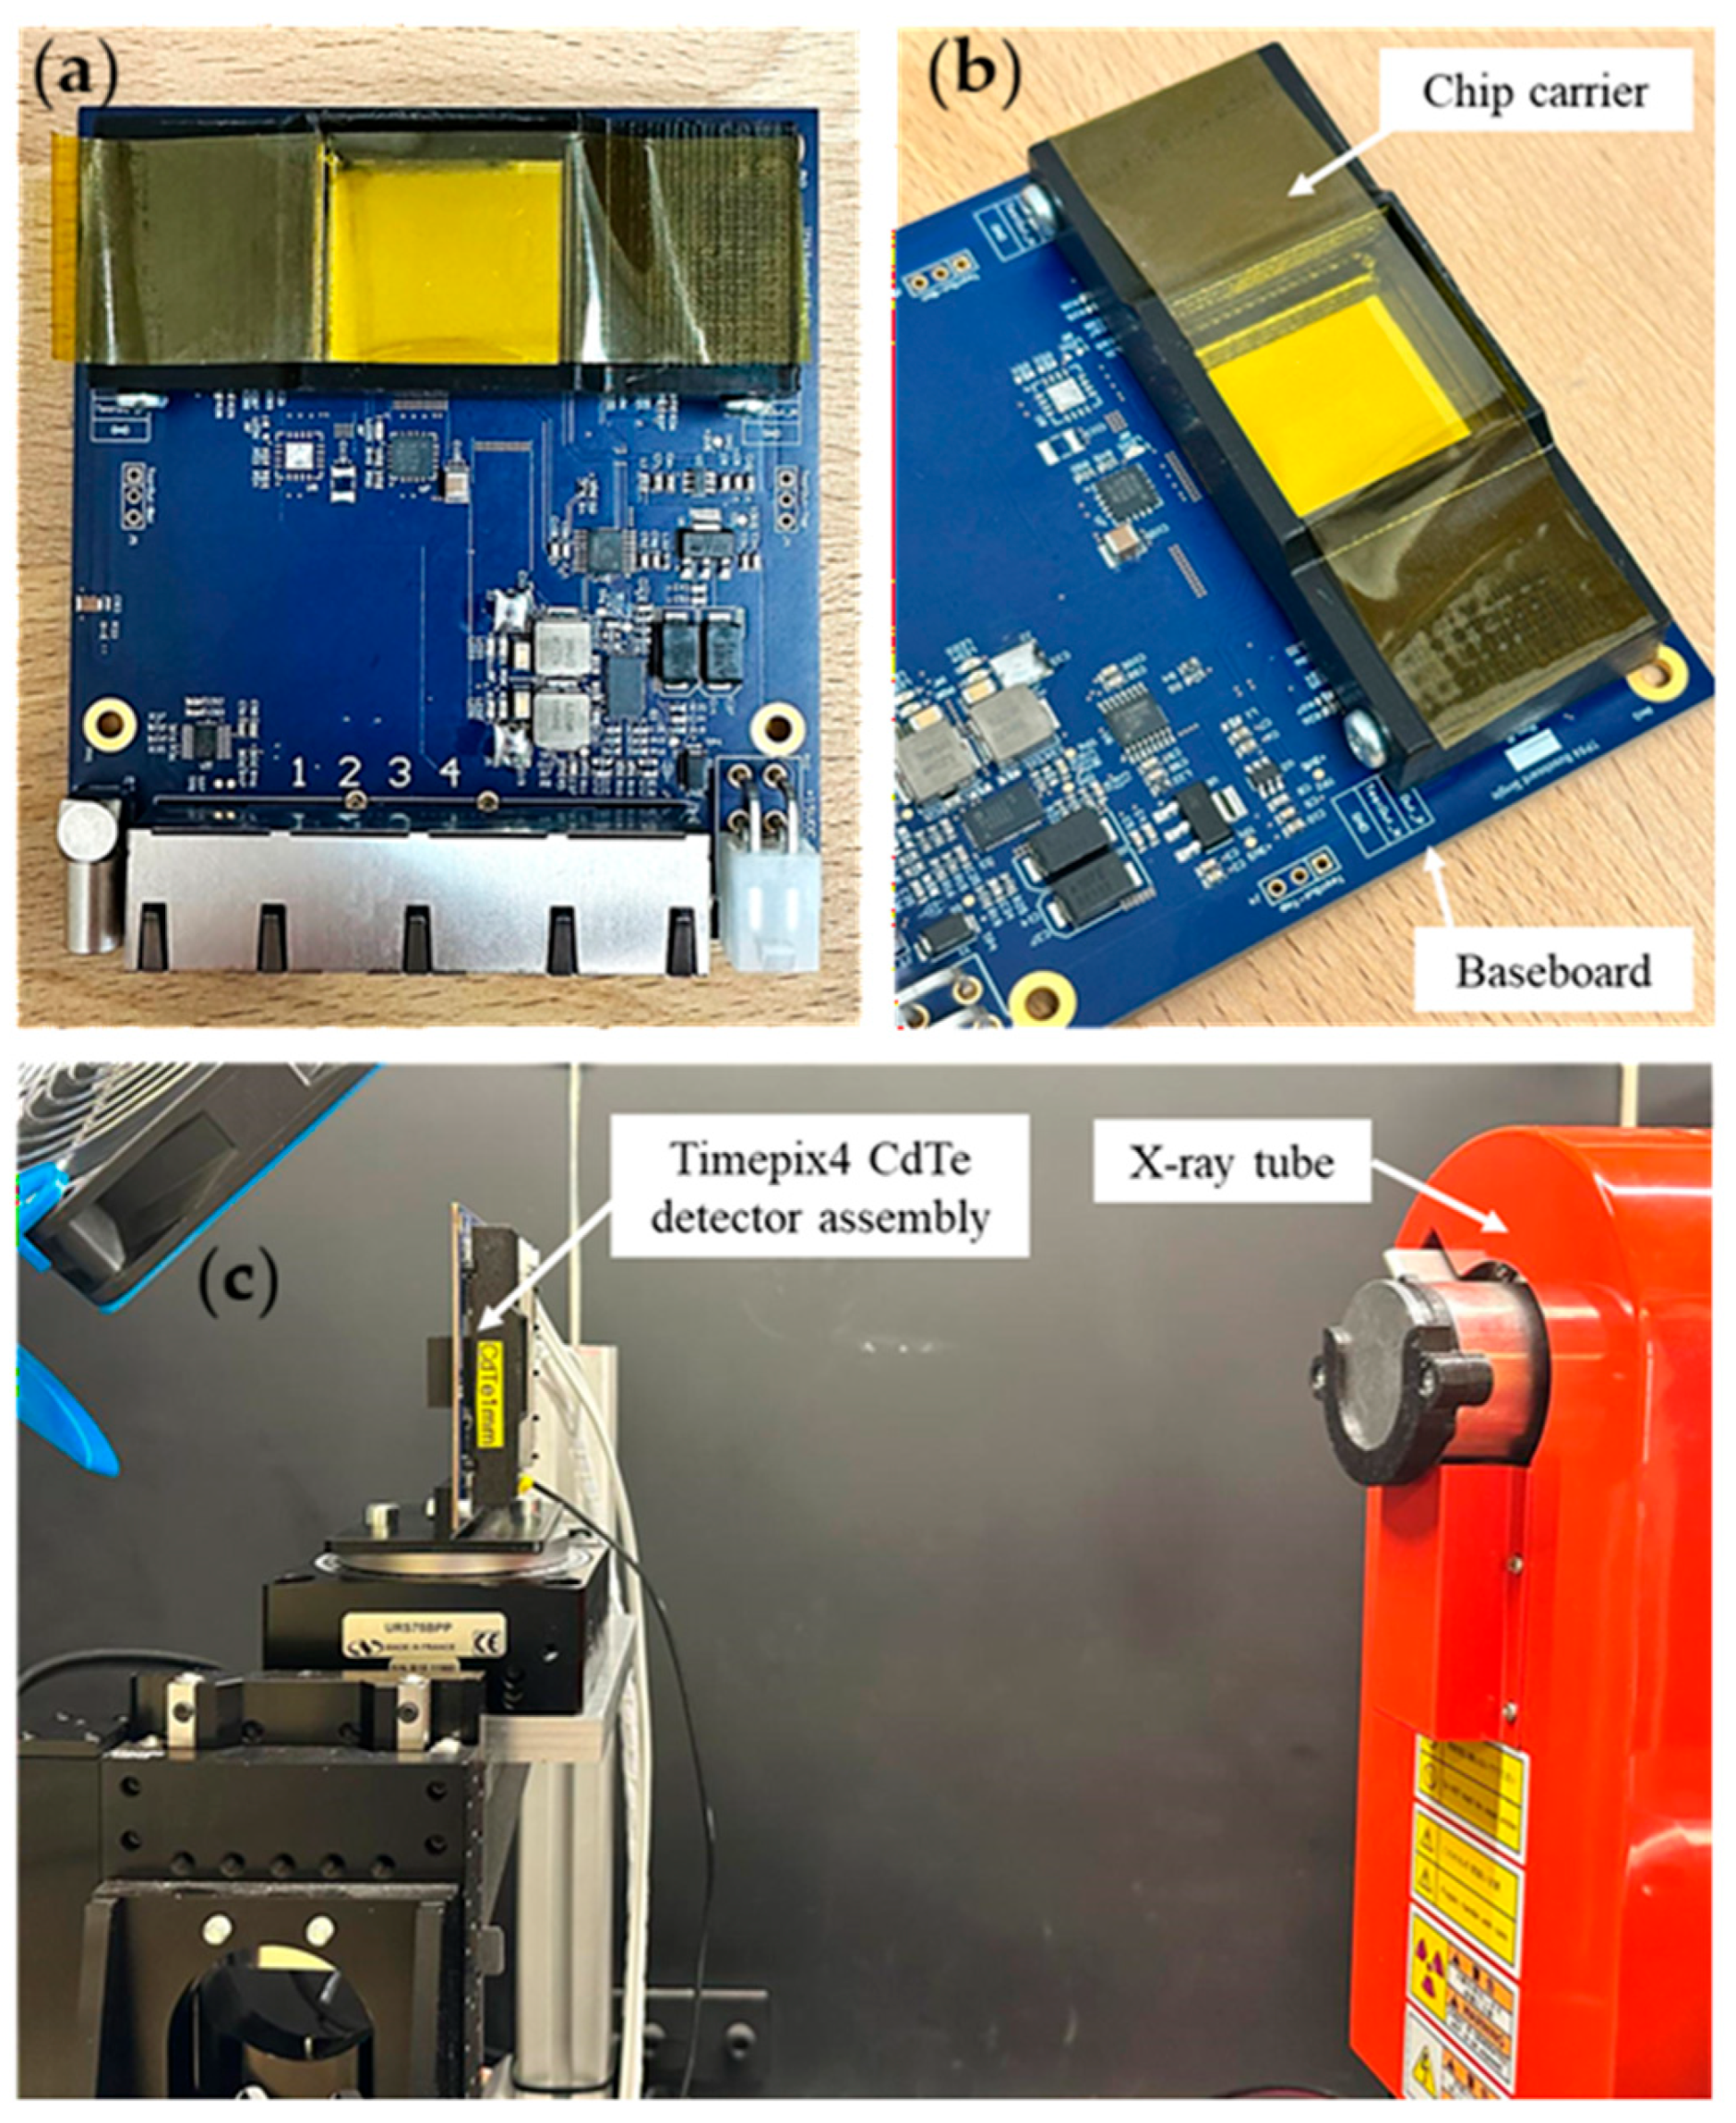
The Timepix4 ASIC is placed on a carrier chipboard which is in turn connected to a baseboard (Figure 6a,b). This modular architecture [27] allows us to use the same baseboard with different Timepix4-sensor assemblies. The baseboard is connected via four ethernet links to the Katherine readout system [28], which also provides the bias voltage to the sensor via LEMO connection for up to ±1 kV. For the imaging tests performed, the CdTe sensor negatively biased at −450 V (sensor leakage current, 50 µA).
Figure 6.
(a) CdTe Timepix4 hybrid pixel detector, mounted on a baseboard. (b) Close-up of the assembly showing the Timepix4 carrier chipboard mounted on the baseboard. (c) Experimental setup for X-ray image acquisition.
The Timepix4 readout ASIC can be operated in either frame-based mode (using the two counters of every pixel to count the hits registered in a given time frame) or in data-driven mode (the information is transmitted when a pixel registers a hit above a threshold). In data-driven mode, the Time of Arrival (ToA) and Time over Threshold (ToT, related to the energy released in the pixel) are registered. This acquisition mode allows for full spectral imaging. The Timepix4 detector used here was energy calibrated using X-ray fluorescence emission of irradiated Sn and Zr foils, and gamma emission from a sealed 241Am gamma-emitting radioactive source. The measured relative energy resolution was 5.63% for the gamma-emitting 241Am source (σ = 3.35 keV). A complete characterization of the detector was performed but is not reported here as it falls outside the scope of the present paper. We performed X-ray imaging tests of a microfocus Hamamatsu (Hamamatsu Photonics Italia S.R.L., Arese, Italia) X-ray tube (L12161-07) operated at 80 kV with a tube current of 8 µA and a filtration of 4 mm Al, 1.5 mm Cu and 0.2 mm Be.
With such configuration of the X-ray tube and a source-detector distance of approximately 40 cm (see Figure 6c), a raw count rate of 9 MHits/s was reached over the entire chip (6.9386 cm2 sensitive area). To achieve statistically acceptable count numbers (~1000 counts/pixel), we performed a 60-second-long acquisition for both the flat field (open beam, no sample) and for acquiring radiographies of small samples. We point out that the achieved count rate performance (107 photon Hits/s per chip) is lower than the count rate of 2.5 × 10⁸ Hits/s per chip expected for a DXA examination (calculated for an ESAK of 10 µGy). The implementation of PCIe interface is foreseen, potentially increasing the maximum count rate to 0.9 × 10⁸ Hits/s per chip [24]. In a further step, within the Medipix4 collaboration, a readout system capable of count rates exceeding 109 Hits/s is under test [29]. Image acquisition was performed via the BurdaMan software v1 [30] and data clustering and analysis were performed via C++/root routines. The clustering here performed used a time window of 200 ns and an 8-connected-pixels space limit. For each cluster, the position of the event was assigned to the pixel having the highest deposited energy. Clusters were then separated in 1 keV energy bins to obtain spectral images.
When a CdTe semiconductor sensor is irradiated with photons of energy higher than the Cd or Te K-edge energy, internal X-ray fluorescence from Cd and Te will distort the shape of the spectrum. This well-known phenomenon in compound semiconductor detector imaging hinders the usage of the spectrum for bone density assessment using the IAEA method, due to the misplacement of the high-energy photons in the low-energy channel, with a consequent underestimation of aBMD. This last issue can be addressed by the fluorescence recovery algorithm currently under refinement at IEAP for Timepix4 detectors, which will correct for the correlated timing of the fluorescence event, and the primary photoelectric event in the detector, taking into account the known energies of Cd and Te K-fluorescence photons. The first results of applying such event-recovery algorithms are already reported in the present work, showing a visible improvement in the measured spectrum’s fidelity to the ground truth.
With the above-described procedure, we acquired the image of an excised human tooth. The sample was placed as close as possible to the sensor, with a subsequent negligible magnification factor.
3. Results
3.1. Virtual Scanner Calibration
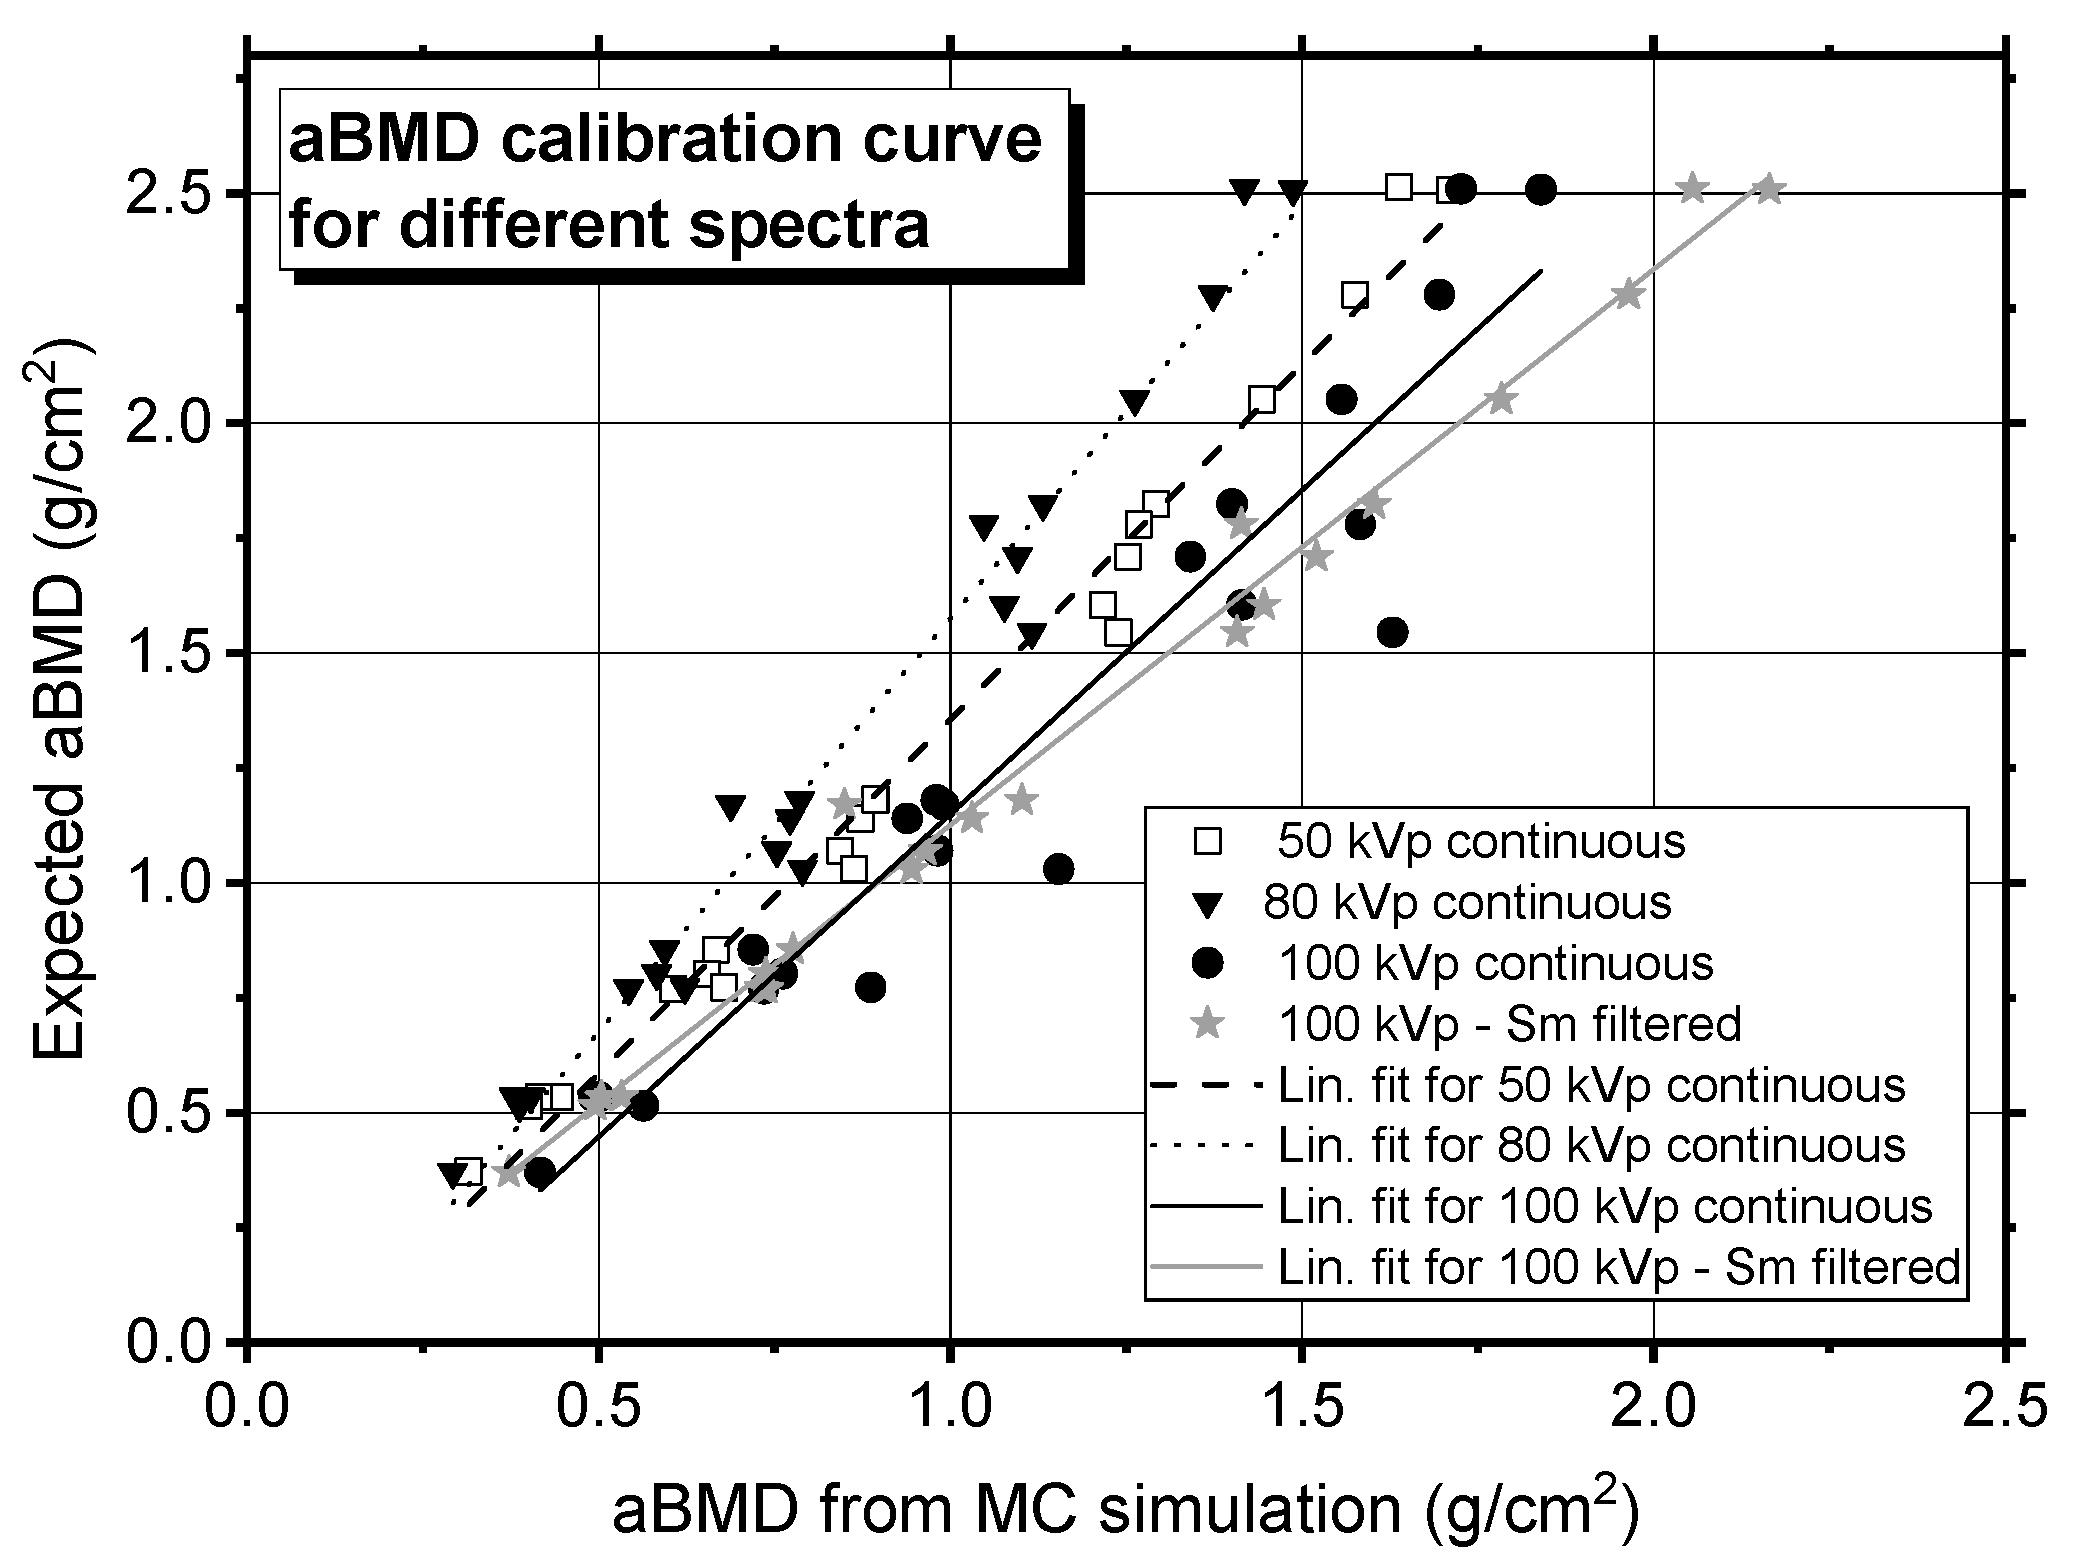
We evaluated the aBMD within rectangular ROIs defined on the low- and high-energy attenuation maps, selecting the regions corresponding to the inserts with different nominal values of aBMD. For each ROI, the mean attenuation value and its standard error were calculated and used to derive the aBMD according to the method described in the IAEA document [5] (Equation (7)). We also computed the low- and high-energy attenuation of the soft tissue (water) for computing the factor (Equation (8)). The resulting aBMD values are reported in Table 3 for the EFP-like phantom, and plotted in Figure 7 for both test objects. These values were plotted against the nominal areal densities of the virtual phantoms, and a linear regression was performed. The resulting linear function was subsequently used for linear correction of the aBMD measurements of the virtual anatomical forearm phantom described in Section 2.5.
Table 3.
Areal density measured for calibration from the EFP-like virtual calibration phantom (Figure 4a). Values for the calibration phantom containing ladders (Figure 4b) are not reported here. Statistical uncertainties here reported were derived from the propagation of the standard error of the mean (SEM), computed within the ROIs in which the attenuation at low and high energy (SLE and SHE) is computed. Please note that the ROIs were drawn on the projected image of the phantom, ensuring that the entire projection of the cylinder was included.
Figure 7.
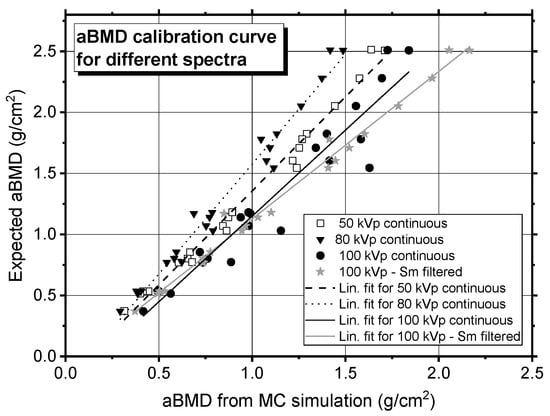
The nominal aBMD values defined in the virtual phantoms (both the EFP-like and the ladder phantoms) are plotted against the aBMD values measured from the MC simulations for several X-ray source spectra. Error bars are smaller than the data symbol. A linear regression was performed on the calibration points, and the resulting fit was used to correct the aBMD measured in the virtual anatomical forearm phantom. The fitting parameters for each linear calibration function are reported in Table 4.
3.2. aBMD Assessment for the Left Forearm of a Patient
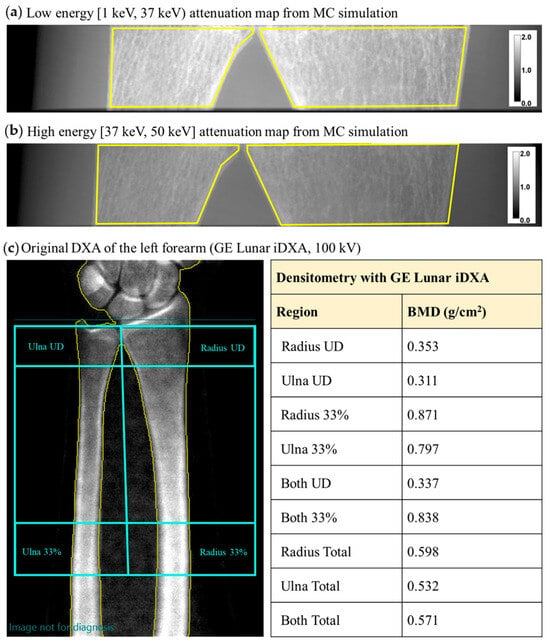
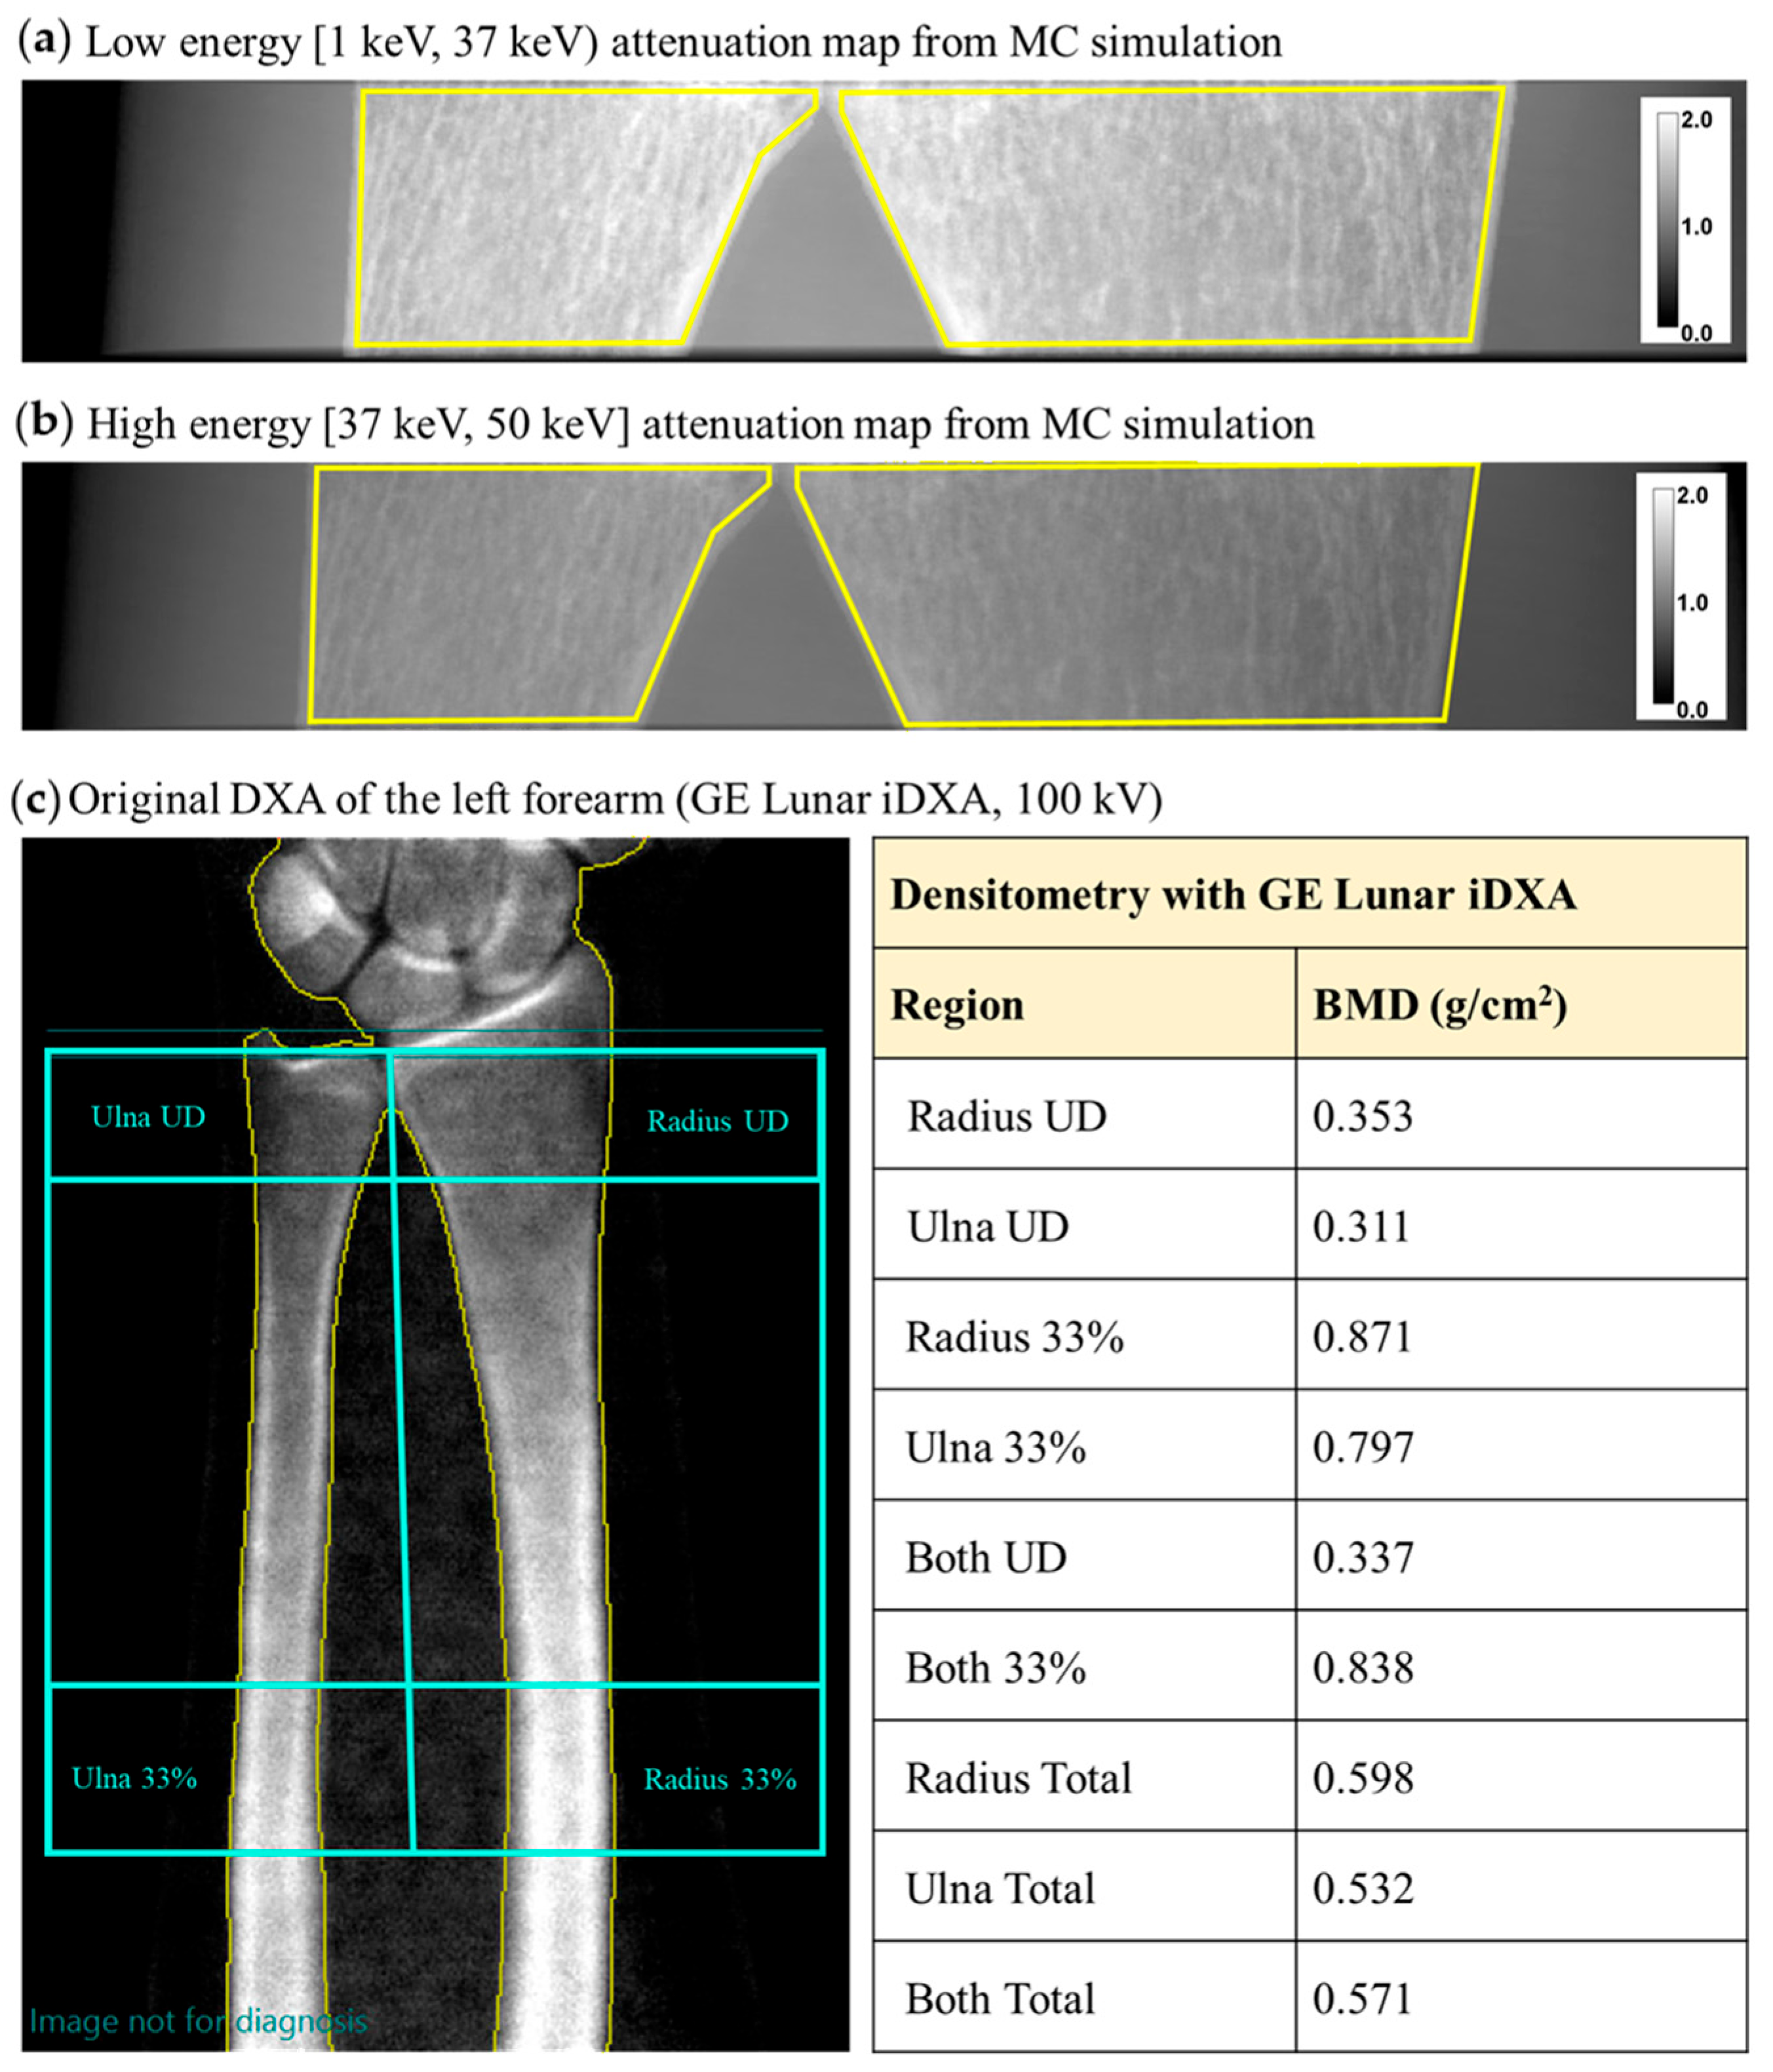
We used the virtual twin of the aBMD scanner, built as described above, to assess the areal bone mineral density in the virtual phantom of a patient. Figure 8a,b show the attenuation maps for the LE and HE channels, respectively, obtained from a virtual scan of the left forearm. By selecting an ROI within the distal regions of ulna and radius, we calculated a total aBMD of 0.454 ± 0.007 g/cm2. After applying the linear correction (Figure 7), a corrected aBMD of 0.515 ± 0.048 g/cm2 was obtained (Table 4). The uncertainty on the corrected value accounts for both the statistical uncertainties and the uncertainties on the fitting parameters used for the correction.
Figure 8.
Monte Carlo-derived X-ray attenuation map, , of a virtual patient’s radius in the low-energy (a) and high-energy (b) range using the DXA4A protocol (i.e., continuous 50 kVp spectrum, no K-edge filtration). We here indicate in yellow the ROIs used for aBMD computation in the forearm phantom. (c) aBMD map in the forearm, obtained from the output report of the clinical DXA scan of the patient, performed with a GE Lunar iDXA scanner.
Table 4.
MC-calculated aBMD for the virtual patient before and after correction with the indicated calibration function, using different source spectra; the aBMD from the DXA clinical examination is also reported. The uncertainties reported for the MC-derived aBMD values represent statistical uncertainties propagated from the attenuation measurements (−ln(I/I0)). They were estimated from the standard deviation of the mean intensity values measured within the selected ROIs used for attenuation and aBMD computation.
For comparison, we report here the clinical DXA scan of the left forearm of the same patient, from which an aBMD of 0.337 g/cm2 was reported for both the ulna and radius, in the ultradistal region. An aBMD of 0.571 g/cm2 is reported for the total forearm, including the ulna and radius (Figure 8c).
We also performed aBMD calculations on a simulated scan of the radius using the 100 kVp K-edge filtered X-ray spectrum employed by the clinical scanner (Figure 2). The aBMD value for the ulna and radius obtained in this case is 0.556 ± 0.045 g/cm2 (Table 4).
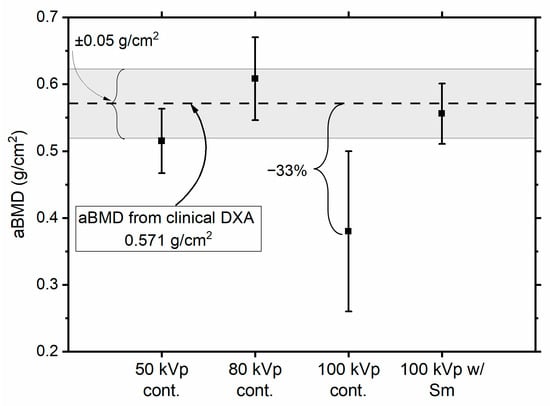
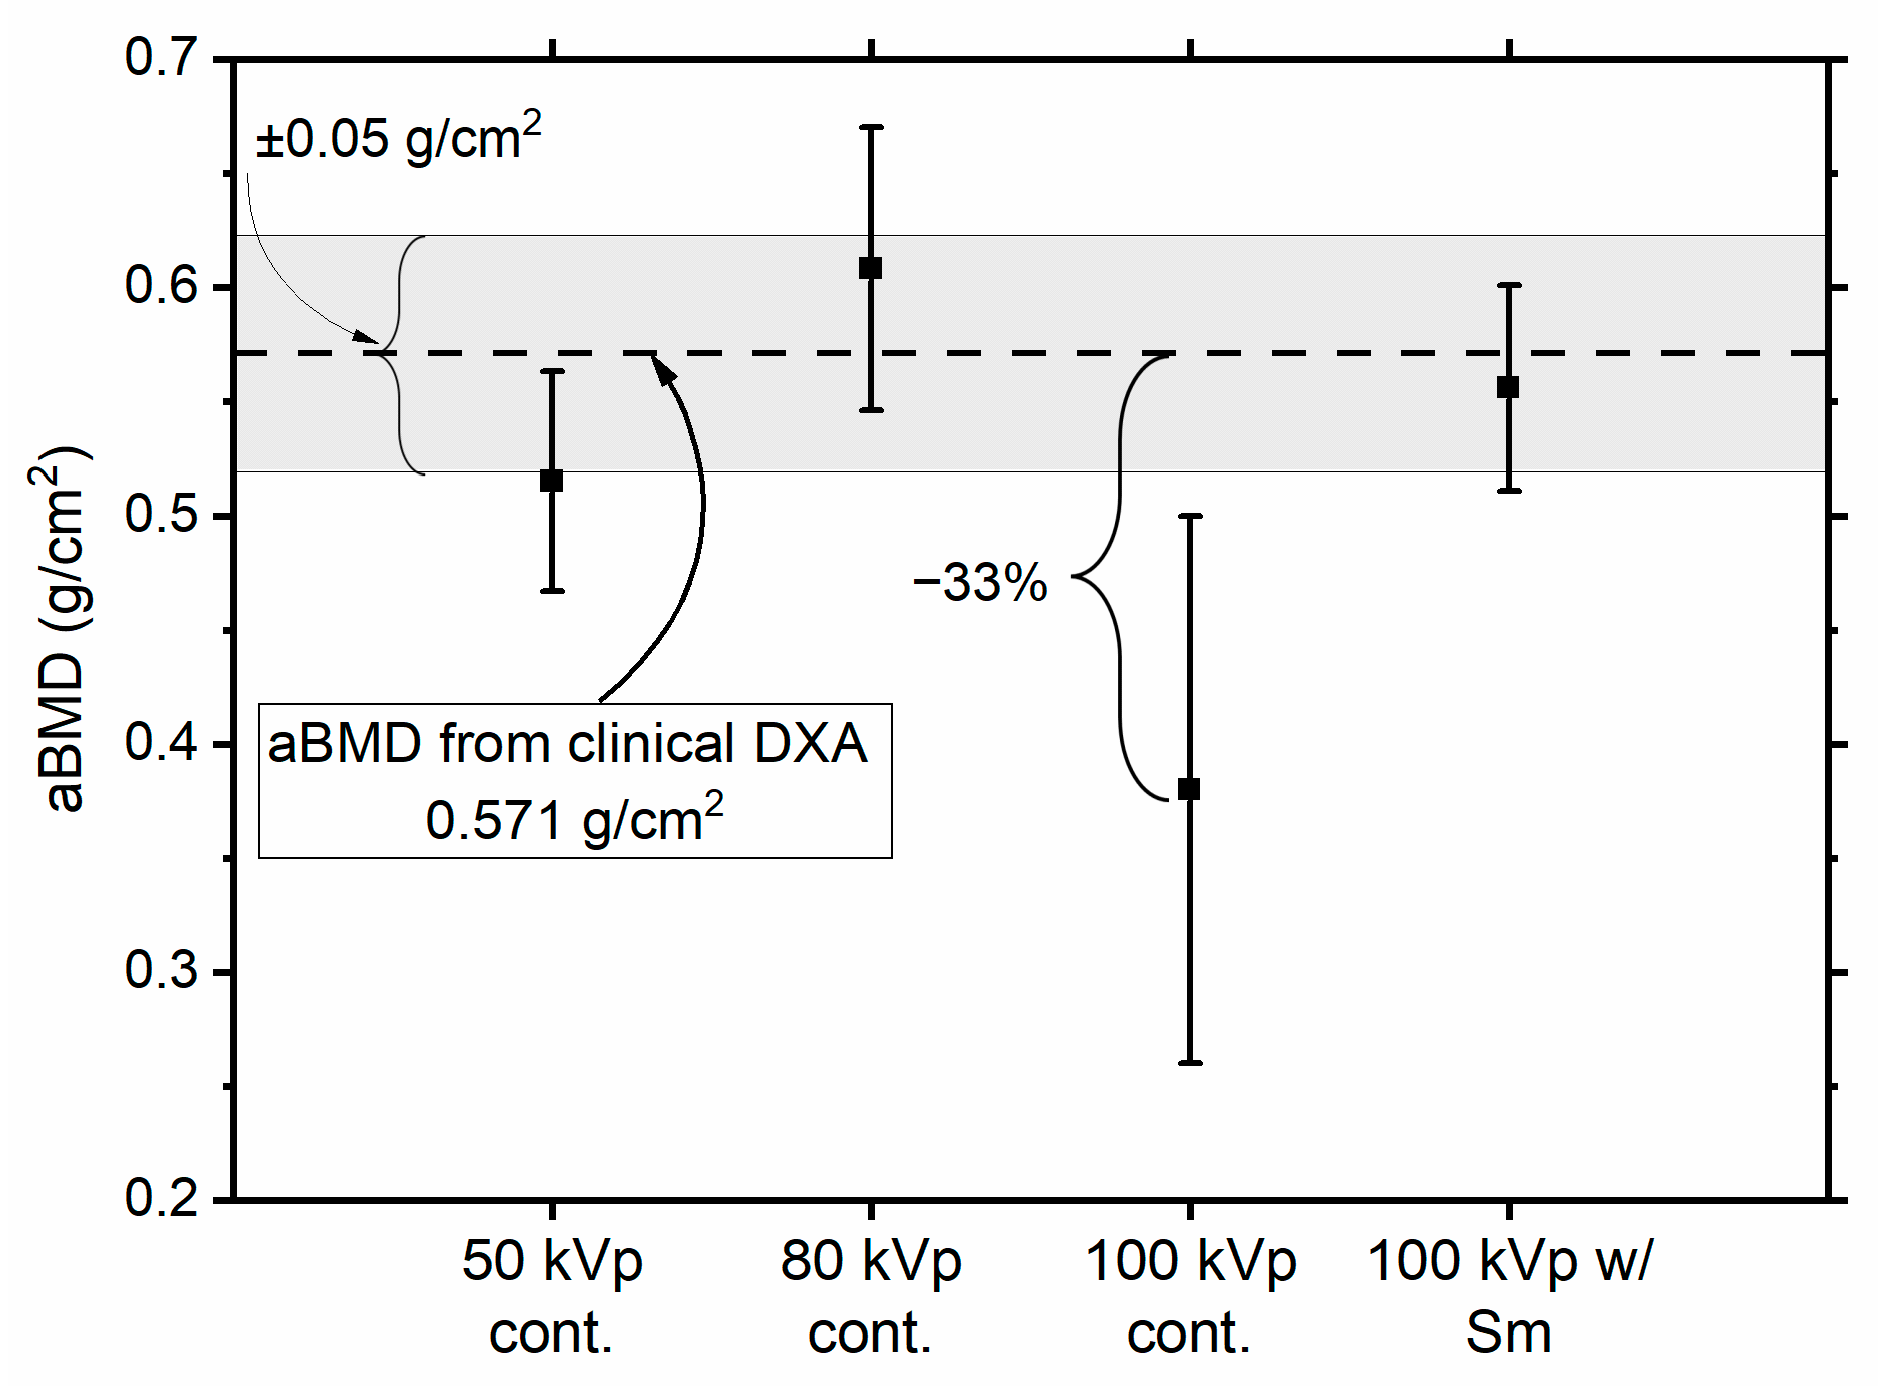
Table 4 also contains the aBMD values obtained for the virtual patient using different spectra. While the absolute value of the aBMD clearly varies with the spectrum, all the determinations we obtained are compatible, within 2σ, with the aBMD clinically determined for the total forearm (Figure 9). All MC-determined aBMD values are within 10% from the clinical aBMD, except the one for a 100 kVp continuous spectrum, which differs by 33% from the clinical value. Further work will be needed to understand the origin of the discrepancy for the aBMD value determined at 100 kVp, for which we anticipate an influence of spectral separation between the low- and high-energy spectra, here reduced by the lack of K-edge filtration in the simulated continuous spectrum.
Figure 9.
aBMD values (mean ± standard deviation) obtained from Monte Carlo simulations using different X-ray spectra. Error bars represent ±1σ uncertainties. The dashed horizontal line indicates the total forearm aBMD value (0.571 g/cm2) measured from the patient’s clinical DXA examination, while the shaded gray area indicates a deviation of ± 0.05 g/cm2. Although the estimated aBMD values depend on the selected spectrum, all results remain compatible within 2σ with the clinical measurement, with three data points within 1σ from the clinical datum.
3.3. Effective Dose Estimate
The ESAK for the virtual bone scan was estimated by calculating the absorbed dose in an air volume of 400 cm3, corresponding to a Victoreen Model 660-5 ionization chamber. For 1011 photon histories, the MC estimate gave an ESAK of approximately 600 µGy. For comparison, an ESAK of 10 µGy is reported in the scanner manual for a standard forearm protocol with the Lunar iDXA scanner. The simulation was therefore repeated with a reduced number of photon histories, scaled by a factor of 10/600 ≈ 0.017. Under these conditions, the effective dose corresponding to an ESAK of 10 µGy was estimated to be 6.24 nSv for the examination of the left radius of the patient here shown. Such an effective dose is lower than what was reported for a DXA examination of the forearm (30 nSv) [31] or of the lumbar spine (10 µSv). We point out that, as concerns astronauts, an effective dose of 6 nSv corresponds to 0.5 s of exposure to space radiation, considering the reported effective dose of 1 mSv per day in low Earth orbit.
3.4. First Experimental Imaging Tests with Timepix4 CdTe Detector
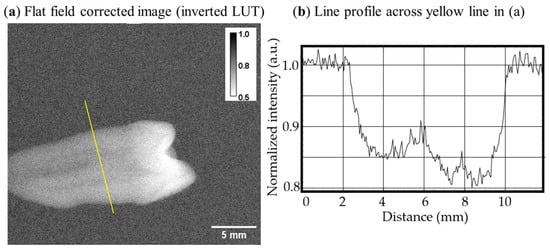
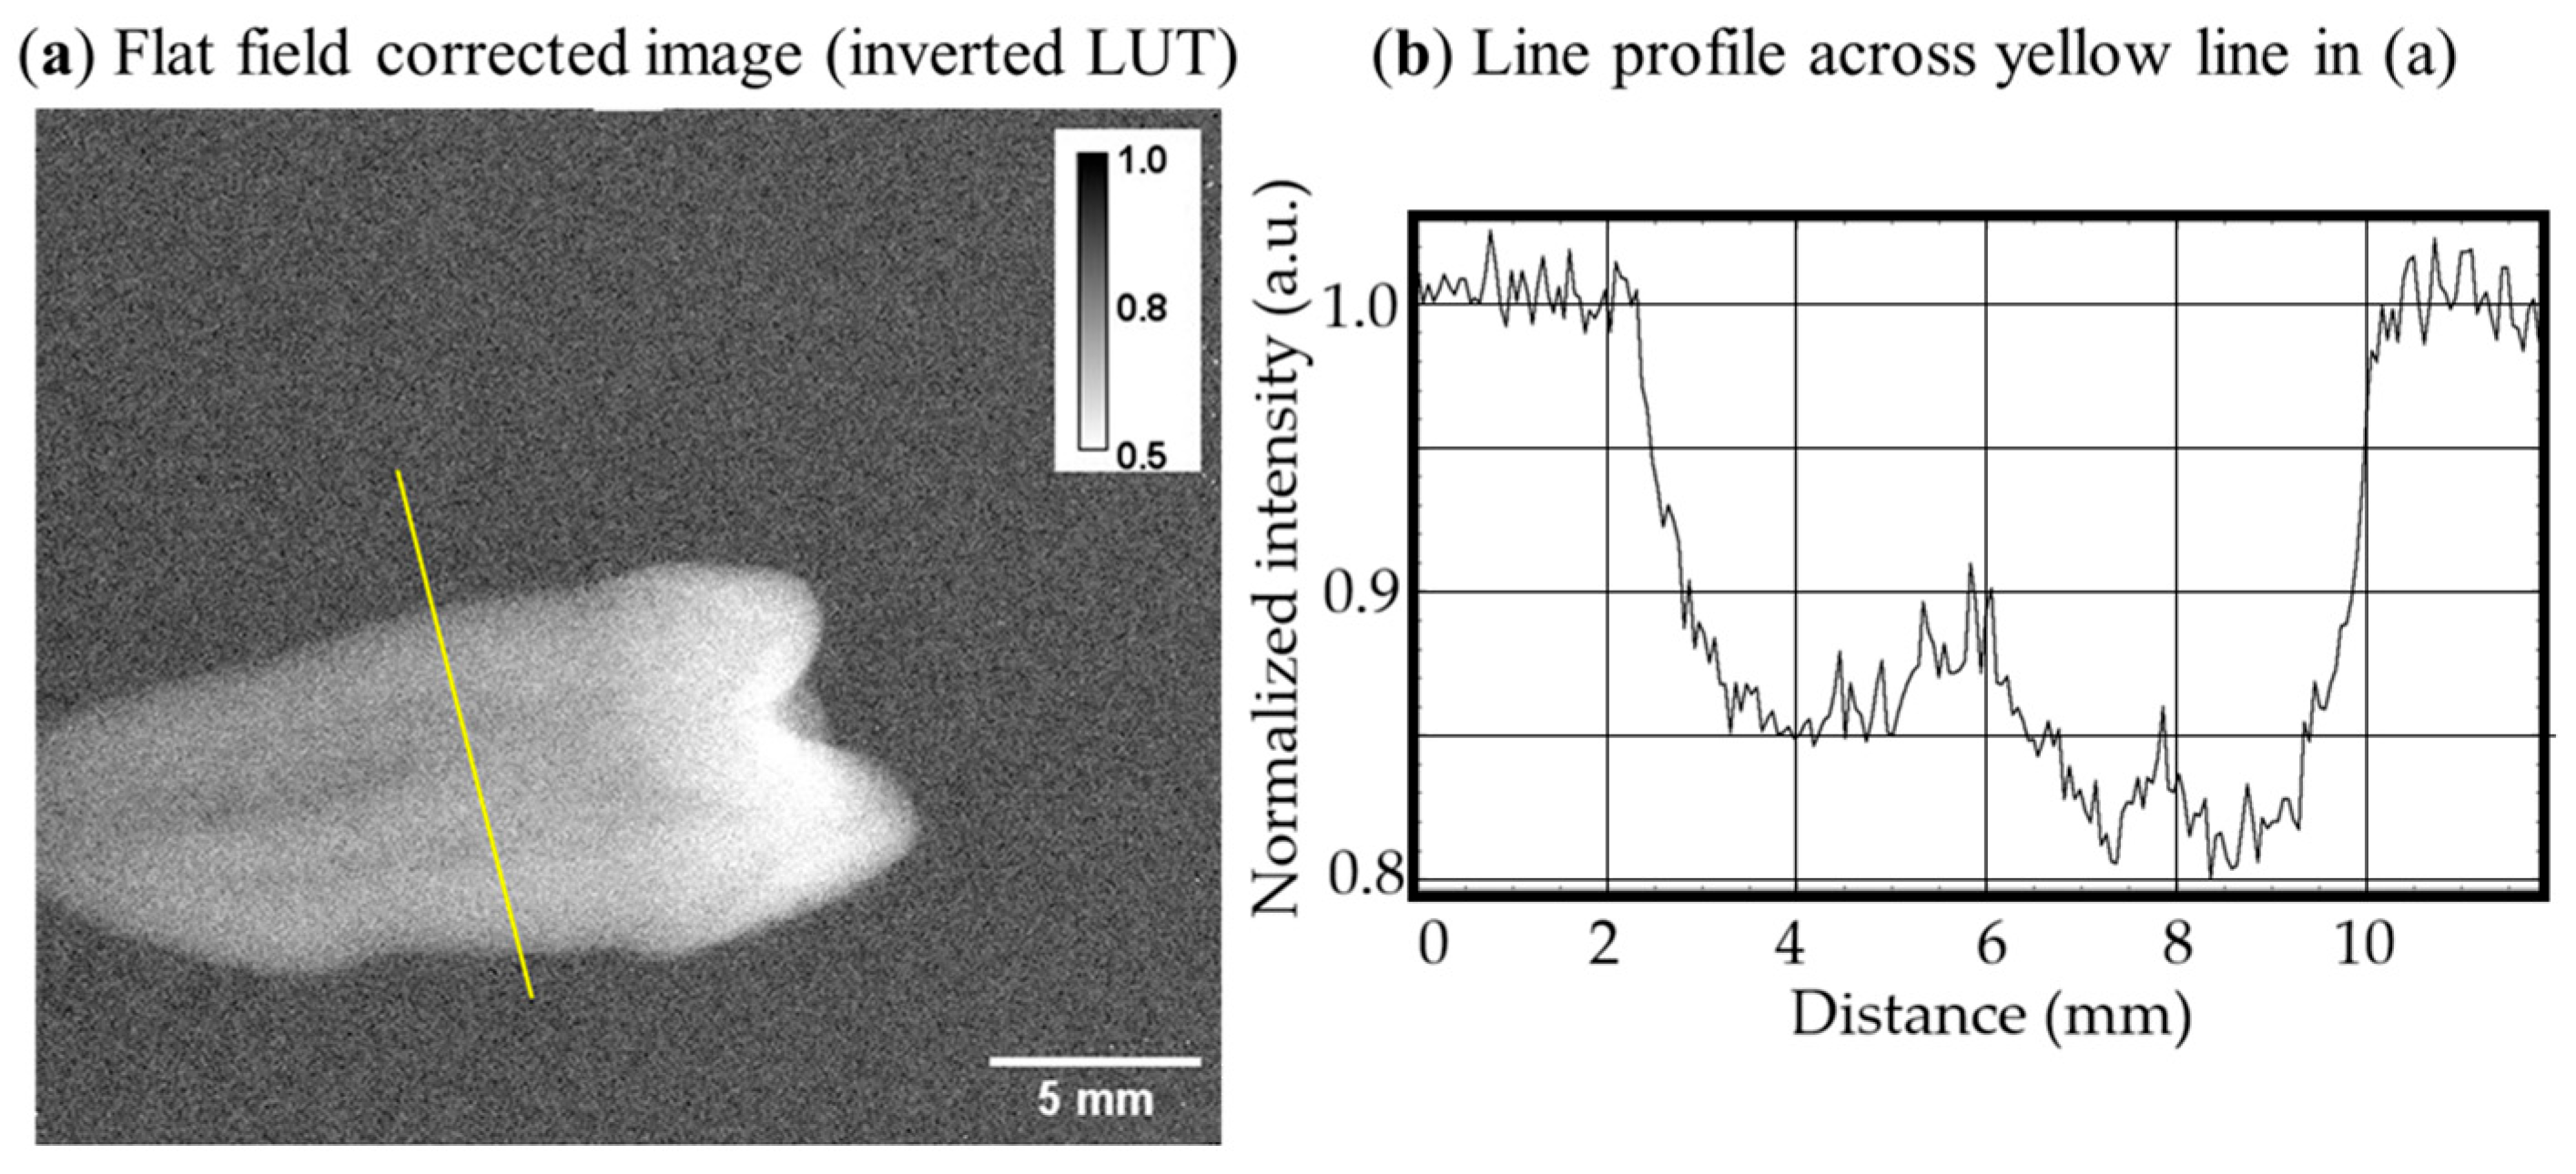
We performed first X-ray imaging tests with a Timepix4 ASIC bonded to a 1 mm thick CdTe sensor. Figure 10 shows a flat-field-corrected X-ray image of a human tooth in air obtained with such an assembly. An average pixel count of ~1000 was achieved in the open beam areas. Flat-field correction was efficient in removing inhomogeneities ascribed to mechanical defects present in the CdTe sensor volume [32]. In this X-ray image it is possible to distinguish the internal channel in the tooth’s root and the increased thickness and density in the crown, corresponding to the higher attenuation of the X-ray beam.
Figure 10.
(a) Flat-field-corrected (pixel values are normalized to open beam) image of a human tooth obtained with an 80 kV X-ray spectrum with a 1 mm thick CdTe sensor read out by a Timepix4 ASIC (inverted look-up table). (b) Line profile across the yellow line shown in (a).
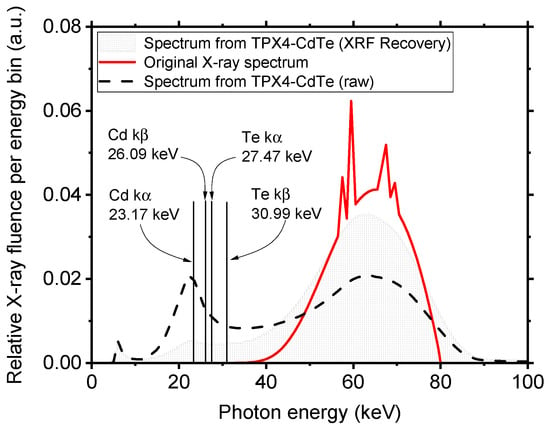
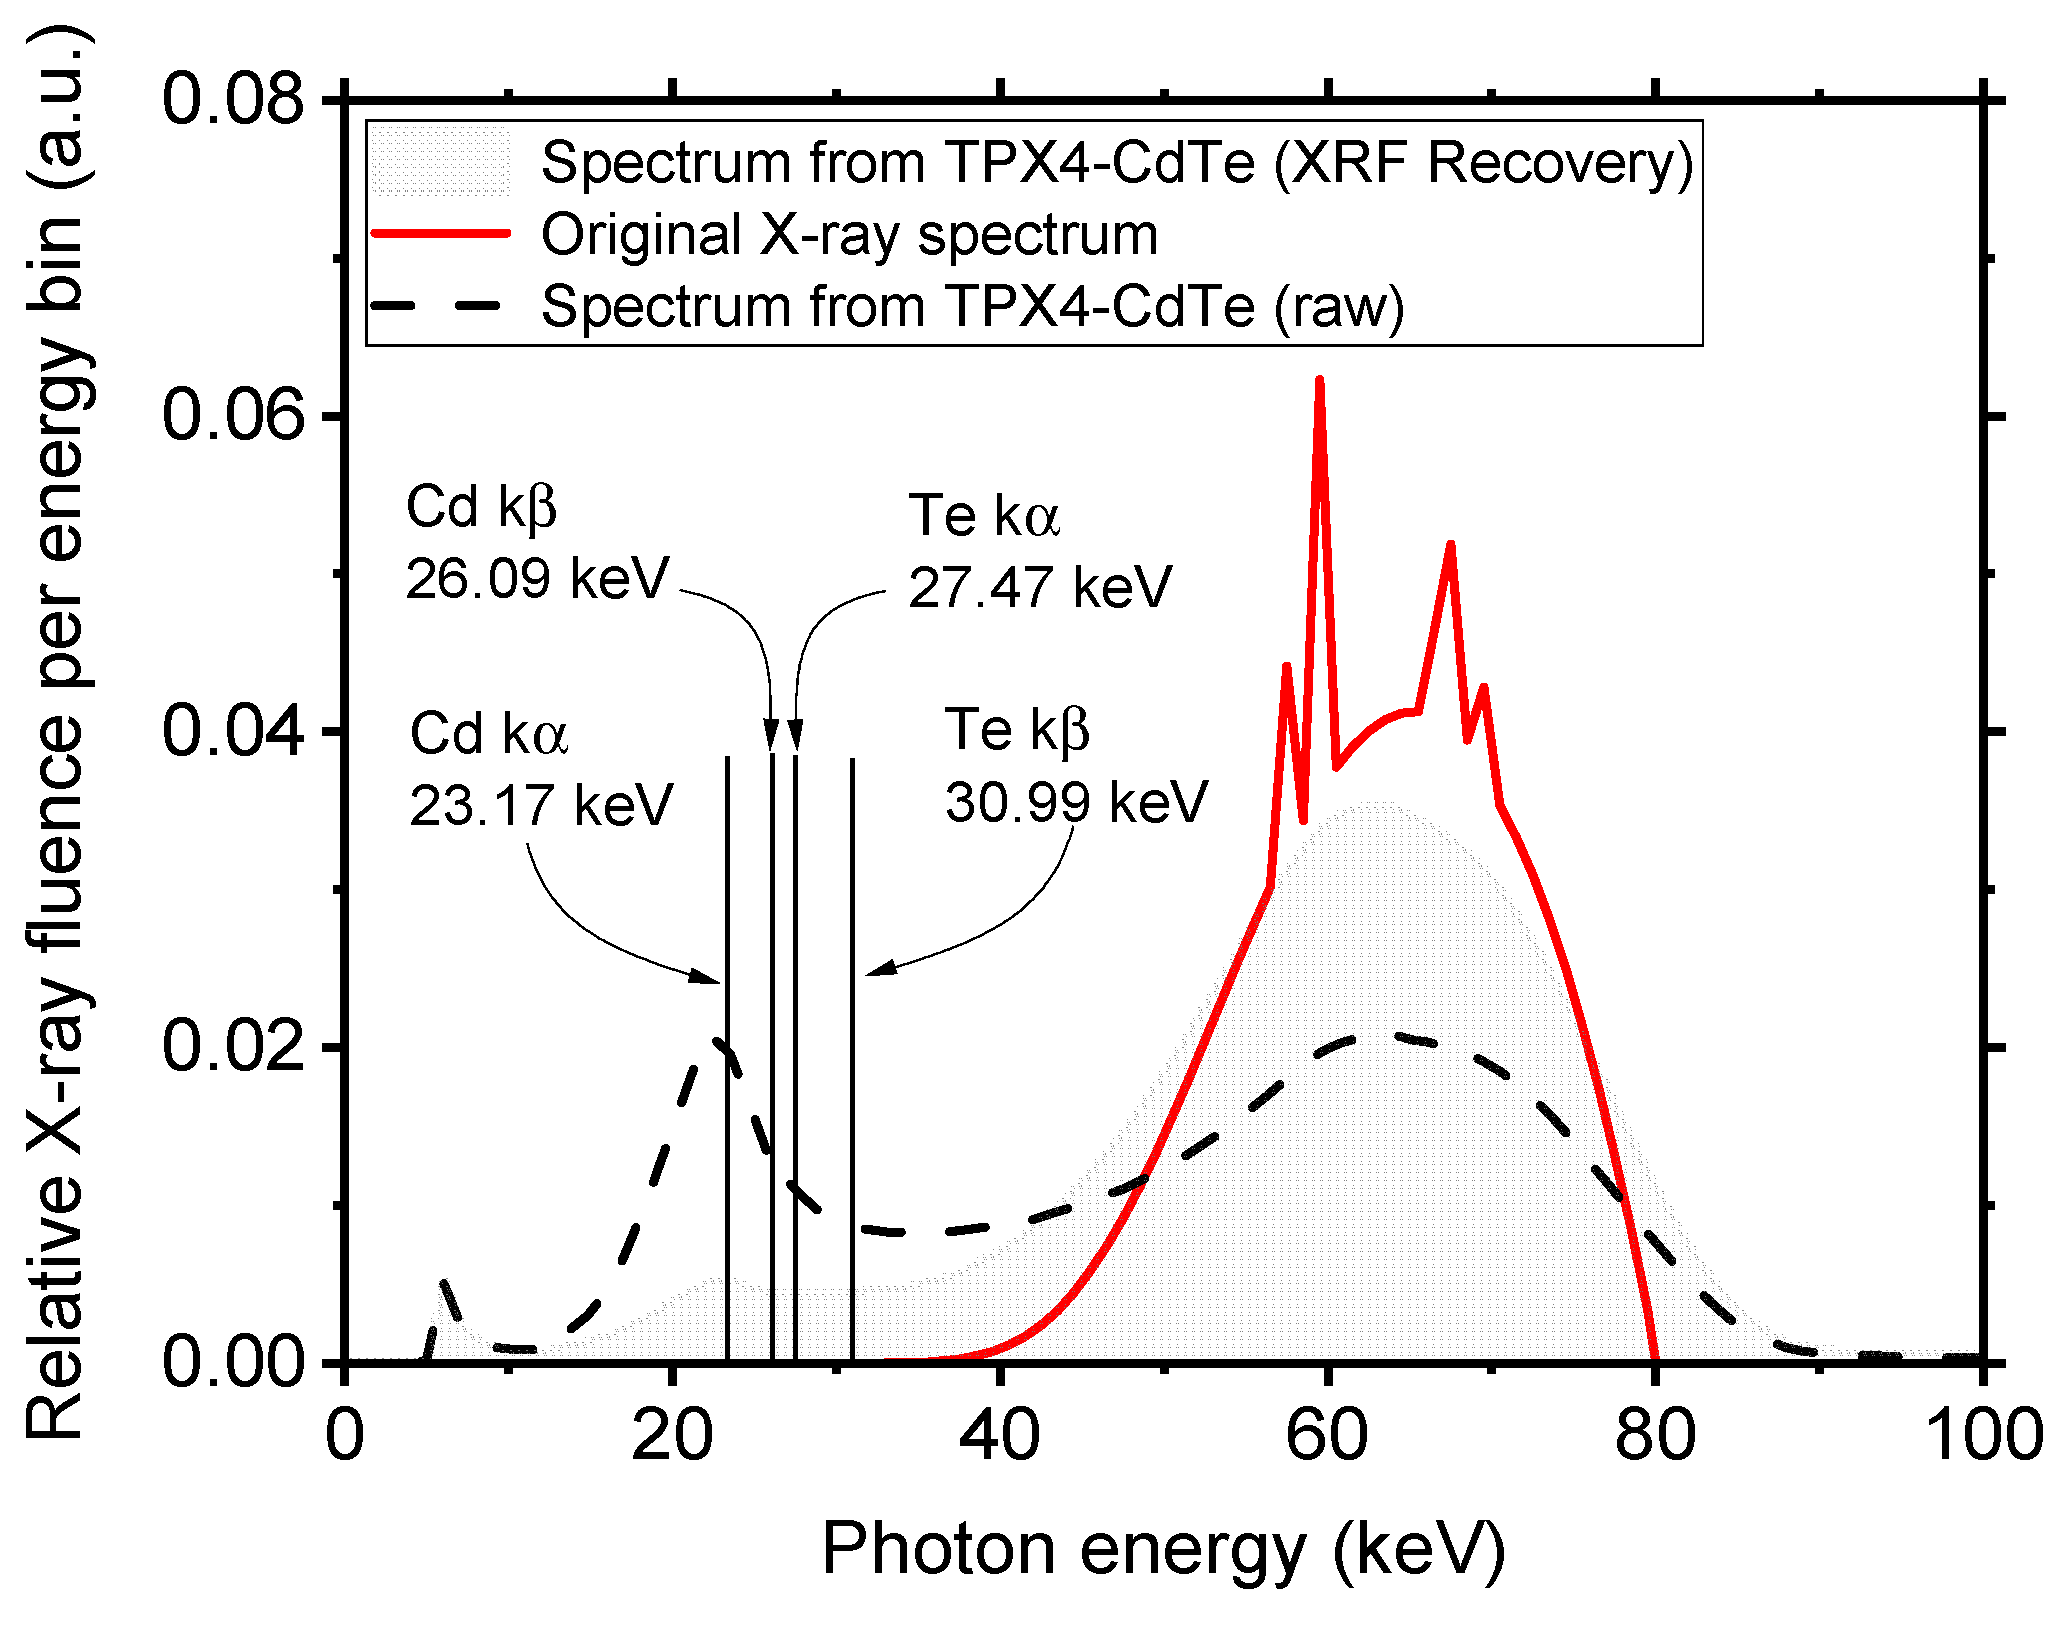
We analyzed the measured energy spectrum of the whole flat-field image. Figure 11 shows the calculated (with SpekPy) X-ray photon energy spectrum (in red), compared to the photon spectrum detected by spectral imaging with the Timepix4-CdTe detector assembly. Photoelectric events in the sensor volume produce with high yield internal K-shell fluorescence photons from both Cd (kα at 23.17 keV, kβ at 26.09 keV) and Te (kα at 27.47 keV, kβ at 30.99 keV), which determine a reshaping of the original spectrum. Specifically, one can observe the presence of an evident peak at around 25 keV resulting from the lines of both Cd and Te fluorescence, and a consequent decrease in the photon fluence at higher energy. As expected for a small-pixel compound semiconductor detector like Timepix4-CdTe (with pixel side about 1/18 of the sensor thickness), to correctly recover the X-ray source spectrum, hence reconstructing with fidelity the energy of photoelectric events occurring in the sensor volume, the use of a fluorescence recovery algorithm is essential [33]. The spectrum shown in the gray shaded line in Figure 11 is obtained by applying a fluorescence recovery algorithm developed at IEAP.
Figure 11.
X-ray source spectrum (80 kV, 4 mm Al, 1.5 mm Cu and 0.2 Be filtration) calculated with SpekPy [23] (continuous red line). Also shown is the photon energy spectrum obtained by flat-field irradiation of the Timepix4-CdTe detector assembly (dashed black line). The influence of the internal fluorescence from Cd and Te produces the altered shape of the Timepix4 recovered spectrum. The gray shaded graph represents the X-ray spectrum obtained from the Timepix4-CdTe assembly, filtering out the fluorescence events. All spectra were normalized to the photon fluence of the original spectrum in the 65 keV energy channel.
4. Discussion
In the framework of this study, we built a GPU-accelerated MC simulation platform (VIT-OSTEO) for designing a new compact DXA scanner for assessing aBMD in the extremities, as a computational tool for virtual imaging and dosimetry in osteoporosis research. The MC code was a new version (1.1) of gCTD (a GPU-based simulation code initially developed for cone-beam CT dosimetry [16,17]), which was recently validated [8]. Such a platform can be extended to simulate different configurations, therefore allowing the simulation of several DXA scanners currently available in the clinics. To the authors’ knowledge, no digital twinning of DXA scanners is currently available for virtual imaging trials. This work, therefore, contributes to filling such a gap by providing a versatile tool for digital twinning of bone densitometers.
Using the presented MC platform, we proved the feasibility of building a compact DXA scanner with a photon-counting detector, with no need to use K-edge filtration for performing a double energy acquisition. Indeed, we here used a continuous Bremsstrahlung 50 kVp spectrum emitted by a tungsten anode X-ray tube and used the spectral capability of the simulated photon-counting detector to discriminate photons at the detector level by applying a threshold at the median energy of the original spectrum. Using the standard IAEA algorithm for computing aBMD values, we obtained areal density measurements for a calibration phantom, first, and for the anatomical phantom derived from a patient. In this last case, using the linear calibration obtained before, we were able to obtain a measurement of the areal bone mineral density in the forearm of the patient. This value was found to be 0.515 ± 0.048 g/cm2, which is compatible (within 2σ) with the clinically obtained measurement of 0.571 g/cm2 for the total forearm.
Moreover, here we presented tests of planar imaging with a 1 mm thick CdTe sensor bonded to a Timepix4 ASIC readout by the Katherine system developed by IEAP-UWB. First tests showed a good image quality and proved the possibility of obtaining a satisfactory flat-field correction for the mechanical defect in the CdTe sensor. Tests for quantitative imaging of bone are currently ongoing with the collaborative effort of IEAP-UNINA-INFN-SSM.
4.1. Limitations of This Study
This work illustrates the initial investigative solutions and results of a compact DXA device. MC simulations are presented for understanding and demonstrating its operating principle and predicted performance; however, the simulations rely on several simplifying assumptions compared to the real system and, therefore, represent an upper-bound for the performance estimate. The main recognized limitations of the present study are outlined below.
4.1.1. Region of Interest for aBMD Computation in MC
The locations of the ROI where aBMD is computed in the MC and in the clinical examination are different. The virtual phantom of the patient was obtained from an HR-pQCT examination of the left forearm in the distal region. Such a region is located slightly closer to the diaphysis of the radius and ulna compared to the ultradistal region where the aBMD was computed in the clinical DXA scan. On the other hand, the aBMD reported for the total forearm is averaged over the entire radius and ulna regions. Thus, the MC-derived aBMD value may differ from the value in the clinical scan.
4.1.2. Clinical vs. Simulated X-Ray Spectra
The clinical aBMD value is obtained using the Lunar iDXA scanner from GE Healthcare, which uses a K-edge filtered 100 kVp spectrum emitted from a tungsten anode. Conversely, we simulated a 50 kVp unfiltered spectrum, for which the aBMD may differ from the corresponding value obtained with the clinical scanner at 100 kVp. Further simulations with 80 kVp and 100 kVp unfiltered spectra demonstrated that the selection of the spectrum has a clear influence on the determination of aBMD. Nevertheless, all MC-derived aBMD values were compatible, within 2σ, with the aBMD for the total forearm found in the clinical examination.
4.1.3. X-Ray Fluorescence in the Real Detector
We applied a CdTe fluorescence recovery algorithm (Section 3.4), which represents a first attempt at correcting the measured energy spectrum with our 55 µm pitch detector. However, the results of this correction algorithm are far from ideal, since the source’s X-ray spectrum is not adequately reconstructed (Figure 10). This important aspect of CdTe small pitch sensors is well known in the literature [33].
4.1.4. Finite Energy Resolution in the Real Detector
The use of a real detector with finite energy resolution introduces spectral smearing that was not accounted for in the MC simulations of the system. This effect leads to an overlap between the low- and high-energy channels, affecting the accuracy of the aBMD measurement. Such overlap could be mitigated by introducing two thresholds and discarding counts from an intermediate energy band from the aBMD computation (e.g., 0–35 keV and 40–50 keV energy channels).
5. Future Work
The present work reports the first image acquired with a Timepix4-CdTe detector assembly. While this demonstrates detector availability and proper response, quantitative aBMD measurements are not presented here. Ongoing experiments at IEAP and UniNA are currently assessing the feasibility of using this detector for that purpose.
The methods presented here for the DXA4A photon-counting bone scanner prompted us to explore the unique spectral capabilities of the Timepix4 detector for a new proposed aBMD scanner strategy, Multi-energy X-ray Absorptiometry (MXA). Unlike conventional DXA, which uses two energy channels (LE, HE) and X-ray K-edge filtering (or kilovoltage switching) for dual spectral separation, in MXA, n energy channels (n > 2) are used to acquire n images using a continuous (unfiltered) X-ray spectrum. This will enable the solution of a system of n equations, to either improve the determination of bone and soft-tissue areal density or to perform multi-material decomposition, possibly leading to a more accurate estimation of aBMD and to a simultaneous areal density determination of soft tissue components. Future work dedicated to investigating the novel MXA technique will highlight the compared simulated performance of DXA and MXA bone density scans.
We point out that while the stationary DXA4A scanner here described is intended for distal tibia and radius scanning, in the future it will be possible to extend the proposed setup to scanning other anatomical sites (e.g., femur head, lumbar vertebrae), by designing a scanning detector geometry, with the detector/tube assembly translating across the region of interest, for any wider clinical application of the proposed techniques.
6. Conclusions
We presented the design of a compact device for bone densitometry, which is potentially useful in the clinic and for monitoring astronauts’ bone density during a flight mission: the DXA4A scanner. In devising a novel platform for virtual imaging and dosimetry in osteoporosis research (VIT-OSTEO), an MC simulation tool (developed by the team at JHU, USA) was implemented to optimize the device’s design and to prove the feasibility of aBMD computation with an unfiltered X-ray spectrum combined with a photon-counting detector.
As a byproduct of our feasibility study via MC simulation, we designed a digital twin of the scanner which can be easily adapted to commercially available DXA scanners, therefore providing a general platform for digital twinning of bone densitometers.
We developed a virtual calibration phantom based on the design of the physical European Forearm Phantom for quality assurance and calibration of the digital scanner. With the virtual DXA4A scanner, in a virtual imaging study, we obtained a bone density assessment of a virtual female patient, which was in realistic agreement with the values obtained with a clinical DXA scanner on the physical patient. Laboratory tests have been presented of the photon-counting and energy-sensitive Timepix4 CdTe detector to be used in DXA4A, showing its potential in this X-ray imaging application and the efforts to improve its spectral performance with fluorescence photon detection.
Author Contributions
Conceptualization, L.A.C. and P.R.; methodology, L.A.C. and P.R.; software, L.A.C., Y.L., X.J., P.S., P.M. and B.B.; validation, L.A.C.; formal analysis, L.A.C. and P.R.; investigation, L.A.C., J.Ž., B.B., P.S., L.C. and P.R.; resources, P.R., L.C. and G.M.; data curation, L.A.C.; writing—original draft preparation, L.A.C. and P.R.; writing—review and editing, L.A.C., G.M., P.R., B.B., P.S., P.M., J.Ž., S.K.B. and Y.L.; supervision P.R., B.B., P.S. and J.Ž.; funding acquisition, L.A.C., L.C., P.R. and G.M. All authors have read and agreed to the published version of the manuscript.
Funding
This research was supported financially by the Università di Napoli Federico II (DXA4A project), within the framework of its International Collaboration Agreement with the Institute of Experimental and Applied Physics, Czech Technical University in Prague, and its STAR (Sostegno Territoriale alle Attività di Ricerca) program, which funded the mobility of L.A.C.; by the Istituto Nazionale di Fisica Nucleare (INFN), Italy (project: Medipix4), for the development of Timepix4 detectors; and by the Scuola Superiore Meridionale, Italy (PhD School in Cosmology, Space Science and Space Technology).
Institutional Review Board Statement
The study adopted a digital representation of the human anatomy of the wrist derived from clinical examinations (HR-pQCT and DXA) of a volunteer originally acquired for the Calgary Bone Health Study (CaBHS), a study conducted in accordance with the Declaration of Helsinki, and approved by the University of Calgary Conjoint Health Research Ethics Board (code REB21-1976).
Informed Consent Statement
Written informed consent was obtained from the subject involved in the Calgary Bone Health Study (CaBHS) from which computational phantoms were derived and used in this work.
Data Availability Statement
The original contributions presented in this study are included in the article. Further inquiries can be directed to the corresponding author. Clinical patient data access is restricted by ethical reasons.
Acknowledgments
The Timepix4 photon-counting detectors have been developed within the Medipix4 Collaboration based at CERN (https://medipix.web.cern.ch/medipix4) (accessed on 3 May 2026).
Conflicts of Interest
The authors declare no conflicts of interest. The funders had no role in the design of the study; in the collection, analyses, or interpretation of data; in the writing of the manuscript; or in the decision to publish the results.
Abbreviations
The following abbreviations are used in this manuscript:
| DXA | Dual-Energy X-Ray Absorptiometry |
| aBMD | Areal Bone Mineral Density |
| BMD | Bone Mineral Density |
| EFP | European Forearm Phantom |
| GPU | Graphics Processing Unit |
| HR-pQCT | High-Resolution Peripheral Quantitative Computed Tomography |
| IAEA | International Atomic Energy Agency |
| IEAP | Institute of Experimental and Applied Physics |
| INFN | Istituto Nazionale di Fisica Nucleare |
| LE | Low Energy |
| MC | Monte Carlo |
| NIST | National Institute of Standards and Technology |
| 3D | Three-Dimensional |
| QCT | Quantitative Computed Tomography |
| SSM | Scuola Superiore Meridionale |
| UD | Ultradistal |
| UNINA | Università degli studi di Napoli Federico II |
| UWB | University of West Bohemia |
References
- Morin, S.N.; Leslie, W.D.; Schousboe, J.T. Osteoporosis: A Review. JAMA 2025, 334, 894–907. [Google Scholar] [CrossRef] [Scilit]
- Chen, M.; Gerges, M.; Raynor, W.Y.; Park, P.S.U.; Nguyen, E.; Chan, D.H.; Ali Gholamrezanezhad, A. State of the Art Imaging of Osteoporosis. Semin. Nucl. Med. 2024, 54, 415–426. [Google Scholar] [CrossRef] [Scilit]
- Kanis, J.A. Diagnosis of osteoporosis and assessment of fracture risk. Lancet 2002, 359, 1929–1936. [Google Scholar] [CrossRef] [Scilit] [PubMed]
- Slart, R.H.J.A.; Punda, M.; Ali, D.S.; Bazzocchi, A.; Bock, O.; Camacho, P. International Working Group on DXA Best Practices. Updated practice guideline for dual-energy X-ray absorptiometry (DXA). Eur. J. Nucl. Med. Mol. Imaging 2025, 52, 539–563. [Google Scholar] [CrossRef] [Scilit]
- IAEA. Dual Energy X Ray Absorptiometry for Bone Mineral Density and Body Composition Assessment—IAEA Human Health Series Publications No.15. 2020. Available online: http://www.iaea.org/Publications/index.html (accessed on 1 February 2026).
- Wang, F.; Zheng, L.; Theopold, J.; Schleifenbaum, S.; Heyde, C.-E. Methods for bone quality assessment in human bone tissue: A systematic review. J. Orthop. Surg. Res. 2022, 17, 174–198. [Google Scholar] [CrossRef] [Scilit]
- Damilakis, J.; Adams, J.E.; Guglielmi, G.; Link, T.M. Radiation exposure in X-ray-based imaging techniques used in osteoporosis. Eur. Radiol. 2010, 20, 2707–2714. [Google Scholar] [CrossRef] [Scilit]
- Cerbone, L.A.; Mettivier, G.; Lai, Y.; Jia, X.; Boyd, S.K.; Russo, P. Absorbed and effective dose estimates in HR-pQCT of the distal radius and tibia: Virtual dosimetry with a GPU-accelerated Monte Carlo code. Phys. Med. Biol. 2025, 70, 095005. [Google Scholar] [CrossRef] [Scilit]
- Stavnichuk, M.; Mikolajewicz, N.; Corlett, T.; Morris, M.; Komarova, S.V. A systematic review and meta-analysis of bone loss in space travelers. npj Microgravity 2020, 6, 13. [Google Scholar] [CrossRef] [Scilit] [PubMed]
- Cerbone, L.A. Radiography for in-flight health assessment in the framework of astronauts’ healthcare: A new field for medical physics? Phys. Med. 2025, 139, 105197. [Google Scholar] [CrossRef] [Scilit]
- El Maghraoui, A.; Roux, C. DXA scanning in clinical practice. QJM Int. J. Med. 2008, 101, 605–617. [Google Scholar] [CrossRef] [Scilit]
- Chirvi, S.; Pintar, F.A.; Yoganandan, N.; Stemper, B.; Kleinberger, M. Trabecular bone mineral density correlations using QCT: Central and peripheral human skeleton. J. Mech. Behav. Biomed. Mater. 2020, 112, 104076. [Google Scholar] [CrossRef] [Scilit] [PubMed]
- Liu, X.S.; Cohen, A.; Shane, E.; Yin, P.T.; Stein, E.M.; Rogers, H.; Kokolus, S.L.; McMahon, D.J.; Lappe, J.M.; Recker, R.R.; et al. Bone density, geometry, microstructure, and stiffness: Relationships between peripheral and central skeletal sites assessed by DXA, HR-pQCT, and cQCT in premenopausal women. J. Bone Miner. Res. 2010, 25, 2229–2238. [Google Scholar] [CrossRef] [Scilit] [PubMed]
- Mesinovic, J.; Breasail, M.; Burt, L.A.; Shore-Lorenti, C.; Zebaze, R.; Lim, C.Q.E.; Ling, Z.; Ebeling, P.R.; Scott, D.; Zengin, A. Bone imaging modality precision and agreement between DXA, pQCT, and HR-pQCT. JBMR Plus 2025, 9, ziae158. [Google Scholar] [CrossRef] [Scilit]
- Llopart, X.; Alozy, J.; Ballabriga, R.; Campbell, M.; Casanova, R.; Gromov, V.; Heijne, E.; Poikela, T.; Santin, E.; Sriskaran, V.; et al. Timepix4, a large area pixel detector readout chip which can be tiled on 4 sides providing sub-200ps timestamp binning. J. Instrum. 2022, 17, C01044. [Google Scholar] [CrossRef] [Scilit]
- Jia, X.; Yan, H.; Cerviño, L.; Folkerts, M.; Jiang, S.B. A GPU tool for efficient, accurate and realistic simulation of cone-beam CT projections. Med. Phys. 2012, 39, 7368–7378. [Google Scholar] [CrossRef] [Scilit]
- Jia, X.; Yan, H.; Gu, X.; Jiang, S.B. Fast Monte Carlo simulation for patient-specific CT/CBCT imaging dose calculation. Phys. Med. Biol. 2012, 57, 577–590. [Google Scholar] [CrossRef] [Scilit]
- Montanari, D.; Scolari, E.; Silvestri, C.; Graves, Y.J.; Yan, H.; Cervino, L.; Rice, R.; Jiang, S.B.; Jia, X. Comprehensive evaluations of cone-beam CT dose in image-guided radiation therapy via GPU-based Monte Carlo simulations. Phys. Med. Biol. 2014, 59, 1239–1253. [Google Scholar] [CrossRef] [Scilit]
- Mettivier, G.; Sarno, A.; Lai, Y.; Golosio, B.; Fanti, V.; Italiano, M.E.; Jia, X.; Russo, P. Virtual clinical trials in 2D and 3D X-ray breast imaging and dosimetry: Comparison of CPU-based and GPU-based Monte Carlo codes. Cancers 2022, 14, 1027. [Google Scholar] [CrossRef] [Scilit]
- Savvidis, G.; Sarno, A.; Mettivier, G.; Paneta, V.; Eleftheriadis, V.; Russo, P. Standardization of breast CT imaging and dosimetry MC simulations using GATE. In Proceedings of the 2023 IEEE Nuclear Science Symposium, Medical Imaging Conference and International Symposium on Room-Temperature Semiconductor Detectors (NSS MIC RTSD), Vancouver, BC, Canada, 4–11 November 2023; p. 1. [Google Scholar] [CrossRef] [Scilit]
- Mettivier, G.; Lai, Y.; Jia, X.; Russo, P. Virtual dosimetry study with three cone-beam breast computed tomography scanners using a fast GPU-based Monte Carlo code. Phys. Med. Biol. 2024, 69, 045028. [Google Scholar] [CrossRef] [Scilit]
- NIST ESTAR: Stopping-Power and Range Tables for Electrons (Gaithersburg, MD: National Institute of Standards and Tech-nology). Available online: https://physics.nist.gov/PhysRefData/Star/Text/ESTAR.html (accessed on 1 February 2026).
- Poludniowski, G.; Omar, A.; Bujila, R.; Andreo, P. Technical note: Spekpy v2.0—A software toolkit for modeling x-ray tube spectra. Med. Phys. 2021, 48, 3630–3637. [Google Scholar] [CrossRef] [Scilit]
- Kalender, W.A. A phantom for standarization and quality control in spinal bone mineral measurements by QCT and DXA: Design considerations and specifications. Med. Phys. 1992, 19, 583–586. [Google Scholar] [CrossRef] [Scilit] [PubMed]
- Sempau, J.; Acosta, E.; Baro, J.; Fernandez-Varea, J.M.; Salvat, F. An algorithm for monte carlo simulation of coupled electron-photon transport. Nucl. Instrum. Meth. B 1997, 132, 377–390. [Google Scholar] [CrossRef] [Scilit]
- Haddadi, K.; Muller, S.; Bloch, I. Validation of a bi-energetic spectrum approximation in bone mineral density measurement with a DXA digital twin. In Proceedings of the 2021 IEEE 18th International Symposium on Biomedical Imaging (ISBI), Nice, France, 13–16 April 2021; pp. 380–384. [Google Scholar] [CrossRef] [Scilit]
- Ruzicka, O.; Burian, P.; Broulím, P.; Bergmann, B.; Kulhánek, T.; Farkas, M.; Smolyanskiy, P. Timepix4 chipboard and readout concept. J. Instrum. 2025, 20, C06074. [Google Scholar] [CrossRef] [Scilit]
- Farkas, M.; Burian, P. Towards a generic Katherine readout platform for Timepix detectors—Plug-in based SW architecture. J. Instrum. 2026, 21, C01041. [Google Scholar] [CrossRef] [Scilit]
- Vladi Biesuz, N.; Bolzonella, R.; Brombal, L.; Cardarelli, P.; Cavallini, V.; Cerbone, L.A.; Cimmino, L.; Delogu, P.; Feruglio, A.; Longo, R.; et al. Review of INFN activities on characterization and applications of hybrid pixel detectors based on Timepix4 ASIC. Front. Sens. 2025, 6, 1585385. [Google Scholar] [CrossRef] [Scilit]
- Burian, P.; Broulím, P.; Jára, M.; Georgiev, V.; Bergmann, B. Katherine: Ethernet Embedded Readout Interface for Timepix3. J. Instrum. 2017, 12, C11001. [Google Scholar] [CrossRef] [Scilit]
- Thomas, S.R.; Kalkwarf, H.J.; Buckley, D.D.; Heubi, J.E. Effective Dose of Dual-Energy X-Ray Absorptiometry Scans in Children as a Function of Age. J. Clin. Densitom. 2025, 8, 415–422. [Google Scholar] [CrossRef] [Scilit]
- Ruat, M.; Ponchut, C. Defect signature, instabilities and polarization in CdTe X-ray sensors with quasi-ohmic contacts. J. Instrum. 2014, 9, C04030. [Google Scholar] [CrossRef] [Scilit]
- Danielsson, M.; Persson, M.; Sjölin, M. Photon-counting x-ray detectors for CT. Phys. Med. Biol. 2021, 66, 03TR01. [Google Scholar] [CrossRef] [Scilit]

Disclaimer/Publisher’s Note: The statements, opinions and data contained in all publications are solely those of the individual author(s) and contributor(s) and not of MDPI and/or the editor(s). MDPI and/or the editor(s) disclaim responsibility for any injury to people or property resulting from any ideas, methods, instructions or products referred to in the content. |
© 2026 by the authors. Licensee MDPI, Basel, Switzerland. This article is an open access article distributed under the terms and conditions of the Creative Commons Attribution (CC BY) license.