Featured Application
This study can provide a rapid evaluation reference for airport front-line ground maintenance personnel in aircraft maintenance and release. It also offers theoretical and technical support for the development of wing anti-hail systems and for pilots to make flight decision-making after aircraft encounters with hail storms.
Abstract
This study aims to analyze how hail pit damage on aircraft wing surfaces affects flight safety after hail impact, characterize the aerodynamic performance degradation, and establish a quantitative evaluation method. Computational fluid dynamics (CFD) simulations are performed using a three-dimensional wing model, and the Shear Stress Transport (SST) k-ω turbulence model is adopted for numerical simulation. The effects of hail pits with different numbers (0–50) and diameters (10–20 mm) on the aerodynamic performance of the wing are investigated under various Mach numbers (0.7–2.0) and angles of attack. By analyzing lift, drag and lift-to-drag ratio and introducing a decay rate for quantitative analysis, it is found that the attenuation of aerodynamic performance exhibits distinct nonlinear characteristics. The maximum performance variation rate does not appear under the condition with the largest number of hail pits. Instead, it peaks at ten pits, and the maximum lift–drag ratio variation rate reaches 33.7% at the transonic Mach number of 1.3. As the number of pits continues to increase, the extent of aerodynamic performance variation does not intensify concurrently but enters a slowly growing plateau stage. Simulation results reveal that intense flow separation and consequent drastic variation in aerodynamic performance are observed for airfoils with sparse hail pits under transonic conditions. As the number of pits increases, densely distributed pits restrain severe flow separation and drive aerodynamic performance degradation toward saturation, and the relevant mechanism is tentatively attributed to surface roughening and flow turbulization effects. As a parametric engineering CFD study, the present findings can serve as preliminary engineering references for similar parametric CFD analyses, as well as for aircraft release assessment and pilot operational decision-making when in-flight hail damage occurs.
1. Introduction
As critical structural components of aircraft [1,2], wings play a vital role in providing lift and ensuring flight stability and controllability.
Hail is a type of solid precipitation caused by severe convective weather. It refers to hailstones at least 5 mm in diameter falling from intense cumulonimbus clouds (hail clouds). These hailstones are mostly spherical, conical, or irregular in shape. According to diameter, hail is classified into four grades: small hail (5–10 mm), medium hail (10–20 mm), large hail (20–50 mm), and extreme hail (≥50 mm). It is one of the major meteorological disasters that frequently occur in spring and summer across China.
Due to its strong destructiveness, hail has been recognized worldwide as one of the major meteorological disasters affecting the aviation industry. In recent years, aircraft hail strike incidents have occurred frequently, as shown in Figure 1. In August 2015, Delta Air Lines Flight 1889 encountered extreme hail with a diameter of approximately 100 mm during flight, forcing the crew to make an emergency diversion. In November 2018, a CRJ-200 passenger aircraft of SkyWest Airlines was struck by severe hail with a diameter of 30–40 mm during the descent phase; the crew executed an emergency go-around and successfully diverted to an alternate airport. In May 2020, a Boeing 737-800 aircraft of All Nippon Airways was hit by severe hail of 35 mm in diameter during the takeoff and climb phase; the aircraft made an emergency landing without causing any casualties. In August 2021, a Cessna 172 general aviation aircraft in China encountered severe hail with a diameter of 20–30 mm during takeoff and climb, eventually crashing and resulting in the deaths of two crew members.
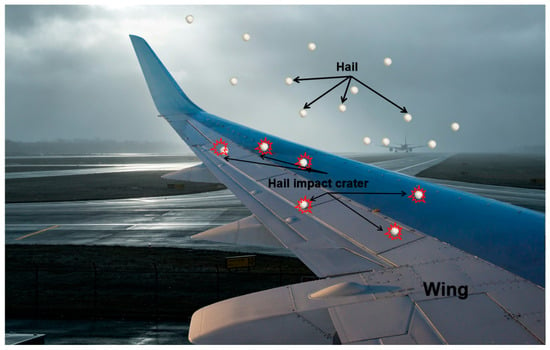
Figure 1.
Wing surface pits induced by hail impact.
In summary, whether an aircraft is on the ground, in cruise flight, or during climb, approach, takeoff and landing phases, hail impact can cause irreversible damage and adverse effects. Hail strikes not only produce obvious pits and other invisible structural damages on key lifting components such as wings, leading to enormous maintenance costs and operational losses, but also directly degrade aerodynamic performance during flight. This may force emergency diversions and even result in catastrophic air accidents with fatalities. As one of the major meteorological hazards threatening global aviation safety, hail disasters have attracted extensive attention from numerous scholars [3,4,5,6,7,8].
Pai A et al. [9] proposed an improved Hertz contact mechanics model. Based on the conservation principles of mass, momentum and energy, the model realizes the prediction of mechanical characteristics and fragmentation features of hail impacting aluminum alloy skins. Alsahlani et al. [10] investigated the effects of airfoil thickness, camber and positional parameters within the low Reynolds number range. Simulation verification indicates that variations in airfoil geometry can induce significant changes in the lift coefficient and drag coefficient. Wang Fei et al. [11] adopted the SST k-ω turbulence model and computational fluid dynamics (CFD) numerical simulation to investigate the effects of different surface roughnesses on the aerodynamic characteristics and flow field properties of the two-dimensional NACA-2412 airfoil. The results shows that the increase in airfoil surface roughness leads to a higher drag coefficient, a lower lift coefficient, and a thicker boundary layer. However, evaluating airfoil roughness merely from the perspective of performance degradation is overly one-sided. Deng Haodong et al. [12] explored the effects of rough surfaces on the aerodynamic characteristics and flow field of airfoils at low Reynolds numbers. Within the small angle-of-attack range (0°~3°), the lift coefficient of airfoils under low Reynolds numbers exhibits nonlinear characteristics due to the abrupt variation in laminar separation bubbles.
However, some studies have found that a moderate increase in airfoil roughness can delay boundary layer separation, reduce the size of separation bubbles, and significantly lower aerodynamic drag and lift-to-drag ratio, thereby bringing aerodynamic benefits to the airfoil. Scholars including Peng Cheng [13], Yang Yingjian [14] and Huang Chenwu [15] investigated the influence of airfoil surface roughness on aerodynamic coefficients. These studies collectively indicate that surface roughness can alter key aerodynamic characteristics such as lift coefficient and drag coefficient, and its impact on the surrounding flow field becomes increasingly prominent as the roughness increases.
In terms of airfoil aerodynamic characteristics under complex operating conditions, Zuo Wei et al. [16] studied the influence of low Reynolds number environment on wing aerodynamic performance. As the Reynolds number decreases (Re < 1.4 × 10⁵), the aerodynamic coefficients of the wing deteriorate rapidly, accompanied by a severe decrease in the maximum lift coefficient. Chang Shinan et al. [17] established an icing model along the normal direction of the wing via numerical simulation, which lays a foundation for the research on aerodynamic characteristics of aircraft wings under extreme cold weather and other severe meteorological conditions.
The above studies mainly focus on the effects of airfoil surface roughness on wing aerodynamic performance, as well as the action mechanism and duality analysis of surface roughness. Hail impacts on wings, fuselages and other aircraft components form hail pits, which create local aerodynamic profile defects on the aircraft skin surface. Different from manufacturing-induced defects, such hail-induced micro-indentations on the wing surface are non-artificially designed depressions with certain depth and curvature. They inevitably disturb the original laminar flow, induce local flow separation at the trailing edge of pits, and act as fixed separation sources, ultimately deteriorating the overall aerodynamic performance of the aircraft.
Due to the high flight efficiency of the transonic regime, most aircraft currently in service worldwide, including civil airliners, transport aircraft and fighter jets, operate under transonic flight conditions [18,19], as shown in Figure 2. Therefore, in this study, a three-dimensional trapezoidal wing model is established based on the NACA-0006 airfoil. Numerical simulation and analysis are carried out to investigate the influence of pits formed on the upper surface of the wing after hail impact. Through numerical simulations of intact wings and damaged wings with hail pits of different sizes and quantities, this parametric CFD study investigates the effects of hail pit distribution and number on wing aerodynamic performance and flow characteristics under transonic conditions. By summarizing the phenomenological variation trends of aerodynamic coefficients and flow features, this study aims to provide engineering reference data for the rapid damage evaluation of hail-damaged wings, and the derived results can serve as a useful reference for further in-depth exploration of relevant physical mechanisms.
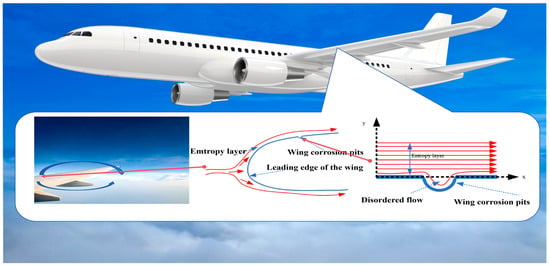
Figure 2.
Schematic diagram of hail-induced pits.
2. Establishment of Wing and Hail Pit Models
2.1. Aerodynamic Force Analysis of the Wing
Lift coefficient and drag coefficient are important dimensionless parameters in aerodynamics [20,21,22]. The lift coefficient describes the aerodynamic characteristics of a wing by quantifying the lift generation efficiency of the lifting surface. It enables a direct comparison of lift performance among wings with different configurations and sizes and serves as a key indicator for evaluating wing aerodynamic efficiency. Lift is characterized by the lift coefficient CL, a dimensionless parameter representing wing performance, as expressed in Equation (1). The resultant aerodynamic force acting on the wing and its components are illustrated in Figure 3.
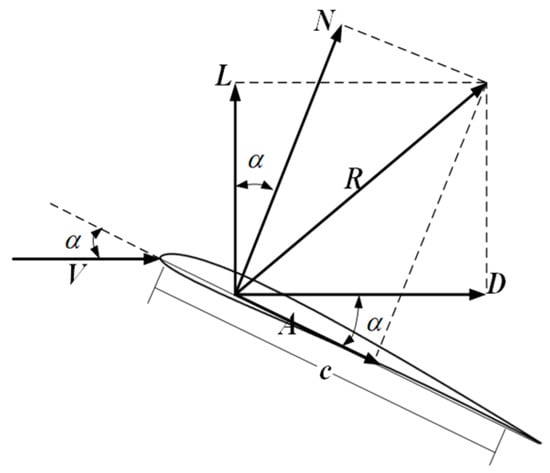
Figure 3.
Aerodynamic resultant force of the wing and its components.
It can be seen from Equation (1) that the lift force is proportional to the air density, the square of the freestream velocity, and the reference area of the wing. By normalizing the lift force in a dimensionless manner, the lift coefficient largely eliminates the influences of the above parameters on lift.
In addition to the influences of the above variables, the lift coefficient of a wing is also affected by the angle of attack (), airfoil profile, turbulence model, Mach number (Ma), and wing surface condition. Therefore, before investigating the effect of hail pits on the airfoil surface upon the wing lift coefficient, it is necessary to first clarify the fundamental source of aerodynamic forces acting on the wing. An object immersed in a flow field is subjected to an aerodynamic force R due to its interaction with the fluid [23,24], as shown in Figure 3. In the figure, N denotes the normal force, represents the angle of attack, and L stands for lift. The dynamic pressure can be expressed as
where is the air density (kg/m3); V is the velocity of airflow relative to the wing (m/s). The pressure difference between the upper and lower surfaces of the wing is the key factor generating lift. Accordingly, the hail pits formed on the upper surface of the wing will inevitably disturb the flow field over the wing upper surface and further affect the lift coefficient of the wing.
2.2. Wing Modeling
The NACA airfoil series was researched and established by the National Advisory Committee for Aeronautics (NACA) in the 20th century [25]. It provides standardized profile references for the design of aerodynamic components such as aircraft wings and empennages, exerting a profound impact on the development of aeronautical engineering.
Classified by designation codes, NACA airfoils are divided into multiple series including four-digit, five-digit and six-digit types. The designation code of an airfoil can directly reflect its geometric parameters, and each series possesses distinct characteristics. Compared with NACA five-digit and six-digit airfoils, the camber and thickness of NACA four-digit airfoils can be directly obtained through analytical formulas without complex calculations. These four-digit airfoils exhibit better environmental adaptability and higher tolerance to wing surface contamination. Therefore, adopting four-digit airfoils to carry out research on hail pits on wing surfaces can better highlight the significance of such investigations.
In addition, as the earliest released airfoil series in the NACA family, four-digit airfoils have been extensively investigated by numerous experts and scholars. Their aerodynamic performance data have been fully verified through abundant wind tunnel tests and possess high reliability. Accordingly, the NACA-0006 airfoil is selected in this study as the baseline airfoil for the wing with hail impact pits, and the three-dimensional wing model is presented in Figure 4a.
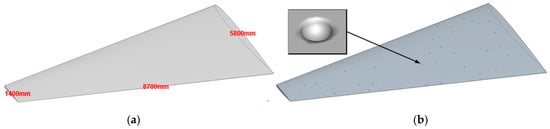
Figure 4.
Intact wing (a); hail-impacted wing (b).
2.3. Establishment of Hail Impact Pit Model
To simplify the modeling process, the geometric shape of the hail impact pit is assumed to be hemispherical. This assumption is based on impact dynamics theory: when a high-speed object strikes a metal target, a typical hemispherical pit is formed at the center of the impact point. In nature, hailstones are mostly spherical impactors, which is consistent with the standard methods of relevant cratering tests [26,27,28]. In addition, the geometric shape of a hemispherical pit can be fully defined only by determining its diameter, which facilitates theoretical analysis and numerical simulation implementation. Analysis of previous hail accident incidents has shown that hail impact pits on the wing surface present a discrete and random distribution. Meteorological studies indicate that even in a single hail event, the landing positions of hailstones exhibit obvious discreteness. This directly results in discontinuous and non-uniform distribution of impact damage on the upper surface of the wing, and the shape and layout of the pits are shown in Figure 4b.
Due to the huge scale difference between millimeter-scale hail pits and meter-scale wings, adopting a single-scale computational mesh will lead to a sharp increase in the number of grid cells and thus greatly raise the computational cost. To accurately simulate the influence of tiny hail pits on the wing surface under transonic flow conditions, the overset mesh generation method is adopted in this paper. The entire flow field is divided into two regions: the near-field region and the far-field region, as illustrated in Figure 5.
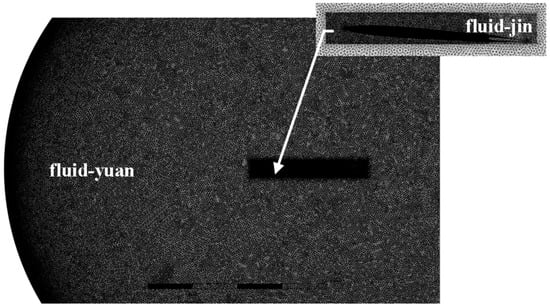
Figure 5.
Flow domain distribution.
Mesh refinement is performed in critical near-field regions such as wing hail pits and boundary layers to capture physical processes at fine scales. In contrast, relatively coarse grids are adopted in the far-field region to save computational resources and improve calculation efficiency. To eliminate the influence of grid scale on simulation results, numerical simulations of the intact wing are carried out at an angle of attack of 2° with three different grid cell counts: 2,156,443, 6,376,368 and 41,385,977. The corresponding results are presented in Figure 6. It is shown that the lift coefficient, drag coefficient and pressure distribution curves obtained under the three grid schemes are highly coincident, with the maximum relative error less than 0.8%.
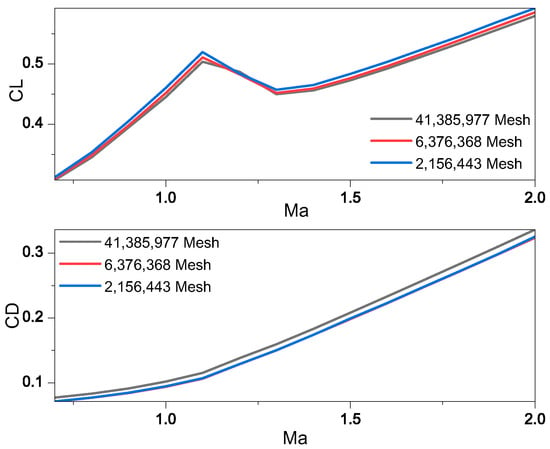
Figure 6.
Grid independence verification.
This result verifies the convergence and reliability of the grid strategy adopted in the present work and satisfies the computational requirements for aerodynamic coefficients and macroscopic flow characteristics in this study.
The lift and drag coefficients of the airfoil were obtained under working conditions with a free-stream Mach number of 0.7~2.0, an angle of attack of 1~6°, hail pit diameters of 10~20 mm, and pit quantities ranging from 0 to 50. A pressure far-field boundary condition was adopted at the inlet, the air domain was defined as an ideal gas, and the gauge pressure was set to 101,325 Pa. Furthermore, the flow field characteristics under the above working conditions were analyzed. The three-dimensional NACA0006 wing employed in this study is characterized by a low aspect ratio, a high taper ratio, and a sharp leading edge. Under supersonic incoming flow conditions, prominent leading-edge vortex lift is induced, resulting in systematically higher absolute lift coefficients relative to those of conventional moderate-aspect-ratio wings [29].
To establish a benchmark and isolate the influence of hail impact pits, the inherent aerodynamic characteristics of the undamaged wing are firstly explored through aerodynamic simulation on the intact wing without hail damage. The simulated results of lift coefficient and drag coefficient are shown in Figure 7a,b. At a fixed angle of attack, both the lift coefficient and drag coefficient gradually increase with the rising Mach number. When the angle of attack remains constant, the drag coefficient increases steadily as the Mach number grows. As illustrated in Figure 7a, the lift coefficient presents obvious fluctuations in the transonic flow regime. Within the Mach number range of 1–1.3, the lift coefficient of the wing fluctuates remarkably, exhibiting a variation trend of increasing firstly, then decreasing, and rising again.
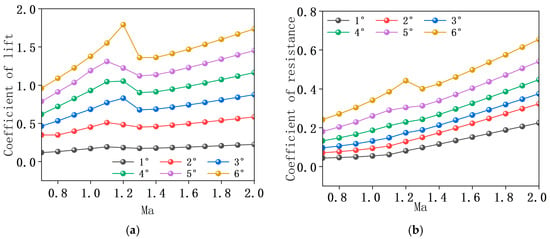
Figure 7.
Variation in lift and drag coefficients. Variation in lift coefficient (a); variation in resistance coefficient (b).
This phenomenon is mainly induced by the nonlinear migration of shock wave position. With the increase in Mach number, the shock wave propagates from the trailing edge toward the leading edge of the wing. The simulation results verify that the variation laws of lift coefficient and drag coefficient are consistent with the physical characteristics of typical transonic flow [30,31].Meanwhile, this result verifies the convergence and reliability of the grid strategy adopted in the present work and satisfies the computational requirements for aerodynamic coefficients and macroscopic flow characteristics in this study.
3. Systematic Flow Field Analysis of Hail Impact Pits on Aircraft Wings
3.1. Inverse Prandtl–Meyer Expansion Wave
When the incoming flow passes over the leading edge of the dimple, the abrupt change in local topography causes the airflow to undergo a deflection angle and forces it to accelerate [32], resulting in the formation of a Prandtl–Meyer expansion wave at the leading edge cusp. This leads to a sharp drop in static pressure at this location; however, the influence range of the expansion wave is limited [33], and it is subsequently truncated by the separated flow and shear layer. The interior of the hail impact crater is generally dominated by the recirculation zone and the trailing edge reattachment shock.
The Prandtl–Meyer expansion wave [34] refers to the isentropic expansion process that occurs when a supersonic flow passes around a convex corner or convex surface, and its schematic diagram is shown in Figure 8a. At the dimple leading edge, due to the presence of the separation shock and shear layer, the variation in streamline curvature will locally form an entropy layer. However, the hail impact dimple in this study is a shallow dimple compared with the airfoil, so the leading edge shock has relatively weak intensity, and the thickness and influence range of the entropy layer are limited [35]. Therefore, the entropy layer may only play a secondary role under the operating conditions of this study.
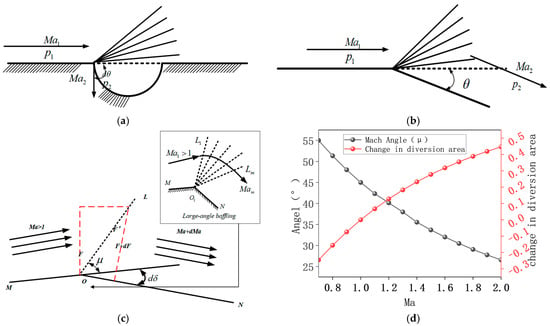
Figure 8.
Prandtl–Meyer expansion wave (a); wall surface small-angle/large-angle deflection variation (b); Prandtl–Meyer expansion wave (c); Mach angle and flow area variation diagram (d).
3.2. Micro-Flow Field of Hail Impact Pits
When laminar flow passes over a hail impact pit, the flow cross-sectional area expands; when the airflow flows out of the pit, the flow cross-sectional area contracts, thereby generating compression waves. In the formula, v(Ma1) represents the incoming flow velocity, and v(Ma2) denotes the flow velocity after passing through the hail impact pit. The corresponding schematic diagram is shown in Figure 8a.
where is the specific heat ratio of air;
When the incoming flow velocity is hypersonic, Equation (4) can be simplified as
Directly solving the governing equations near the wall facilitates the straightforward calculation of velocity gradients and shear stresses within the boundary layer, which is of great significance for analyzing the local flow separation induced by hail impact pits on the wing [36,37]. This method can balance computational accuracy and efficiency.
The edge of the hail impact pit model is set to a right angle of 90°. Therefore, when calculating the expansion wave velocity under this pit configuration, the relevant parameter can be regarded as a known quantity, as shown in Figure 8b.
Combined with the above formulas, the variation laws of Mach angle and flow cross-sectional area with Mach number are presented in Figure 8d. The Mach angle decreases continuously, while the flow cross-sectional area increases steadily. This indicates that at relatively high Mach numbers, especially when the flow velocity exceeds 1 Ma (disturbances propagate upstream when the flow velocity is lower than 1 Ma), the disturbances generated by the concave surface propagate within a smaller angle range and become more concentrated. This restricts the propagation range of the influence induced by hail impact pits. Since the geometric configuration of a hail impact pit corresponds to an extremely large flow deflection angle , local variation in the flow cross-sectional area occurs when the airflow passes over the edge of the hail pit [38,39].
With the increase in Mach number, the same wall deflection induces a more significant variation in the flow cross-sectional area [40,41], and the airflow becomes more sensitive to geometric disturbances. In fluid mechanics, the mass flow conservation equation based on the small perturbation theory can be expressed as follows:
where Qm is mass flow rate, kg/(m2s), representing the fluid mass passing through a unit area per unit time. is fluid density; vn denotes the normal component of velocity on the cross-section. Equation (8) indicates that the density variation and velocity variation induced by hail impact pits are not independent of each other but coupled through the law of mass conservation. The expression of the pressure coefficient at the wall behind the expansion wave is given as
where is the wall pressure coefficient behind the expansion wave; d is the infinitesimal perturbation of the wall deflection angle. This indicates that the large deflection angle induced by the edge of the hail impact pit generates expansion waves and further forms a low-pressure region, and this phenomenon is directly correlated with the incoming Mach number. It can be observed that when the Mach number is close to 1, the flow is in a critical state between subsonic and supersonic regimes, accompanied by drastic pressure variations. When the Mach number is much greater than 1, the flow fully enters the supersonic state, and the relative influence of the incoming Mach number on pressure is weakened.
3.3. Initial Flow Separation Induced by Hail Impact Pits
After being accelerated by the expansion wave, the airflow undergoes flow separation at the edge of the hail impact pit. Part of the separated airflow merges into the main flow and develops downstream to cover the hail pit; the other part, with a Mach number of Ma2, propagates along the pit wall and decelerates at the pit bottom. When the airflow flows over the leeward side of the hail impact pit, the acceleration and expansion process is completed (P1 > P2). Affected by the relatively high pressure in the upstream and downstream of this region, a low-pressure zone is formed on the leeward side of the hail impact pit, and a directional pressure gradient is generated in its upstream and downstream areas. The above evolutionary process is illustrated in the simulation results in Figure 9b,c.
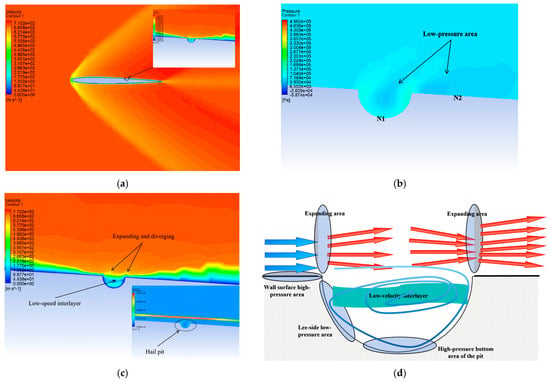
Figure 9.
Simulation results figures. Wing flow field diagram (a); pressure contour plot of the external flow (b); velocity contour plot (c); study on the aerodynamic characteristics of hail pits (d).
It can be seen from Figure 9b,c that the pressure drops sharply when the airflow passes through the two waves near the hail impact pit. By analyzing the entire set of simulation contours, typical characteristics of expansion waves appear at both the leading and trailing edges of the hail impact pit. If the waves were compression waves, a local sharp pressure rise would occur in the downstream region. Accordingly, it can be concluded that both waves are expansion waves.
Upon magnifying the velocity contour around the hail impact pit, it is observed that the thin airflow layer closely attached to the wall undergoes transient acceleration when the high-speed flow passes through the expansion waves generated at the pit edge, manifested as the divergent yellow region near the wall boundary in the contour. Combined with the pressure contour and velocity streamlines, the airflow accelerates when sweeping over the upper part of the hail impact pit, while a low-speed interlayer with a sandwich-like structure forms in the central interior region of the pit, as schematically illustrated in Figure 9d.
3.4. Evolution of Local Vortex Structures
As shown in Figure 10a, the flow field inside the hail impact pit exhibits two prominent features: a concentrated low-velocity core region and converging spiral streamlines surrounding the core. These two characteristics are typical flow manifestations of vortex structures in fluid flow, indicating the potential for vortex formation in this region. The Q-criterion is adopted to visually characterize this phenomenon, and the results are presented in Figure 10b.
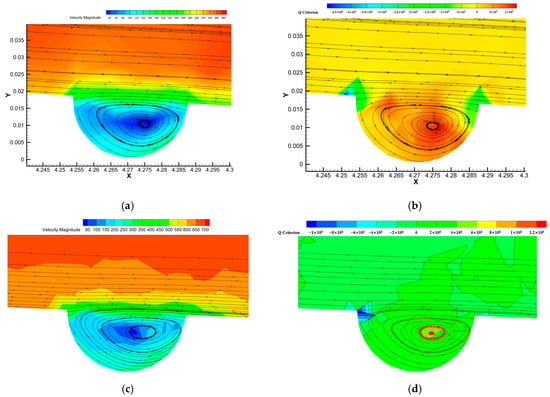
Figure 10.
Internal velocity traces of the hail pits, 0.7 Ma velocity trajectory (a); 0.7 Ma Q criterion (b); 2 Ma velocity trajectory (c); 2 Ma Q criterion (d).
The definition of the Q-criterion is given as follows:
where is the magnitude of the vorticity tensor (used to quantify the rotational intensity of airflow); is the magnitude of the strain rate tensor (used to quantify the shear and deformation intensity). The dark blue region at the leading edge of the hail impact pit indicates the presence of a strong shear layer, from which flow separation originates. Driven by the pressure gradient, part of the airflow reverses its direction, forming a stable recirculation zone inside the hail impact pit and further constructing a simple vortex structure. The Q-criterion contour at Mach number 2 also verifies this inference. Velocity streamlines converge in the region with the maximum Q value. Although the flow velocity at the vortex core is relatively low, the vorticity reaches its peak. The above results indicate a steady recirculating vortex within this region, which serves as supportive evidence for the formation of localized vortex structures inside the pits.
When the flow velocity reaches Mach 0.7, it can be observed from Figure 10a,b that a larger-scale vortex core is formed within the hail impact pit. This indicates that under subsonic conditions, hail impact pits induce flow separation over a larger scale, while the rotational speed of the vortex is relatively low. The velocity field of the vortices presents rotational characteristics locally. However, from the perspective of overall force, these recirculating eddies confined inside the pits counteract each other macroscopically, so their net resultant force contributes nearly nothing to lift. Figure 10c,d shows that the vortex flow inside the hail impact pit is subsonic, and its pressure perturbations can propagate upstream. The subsequent incoming flow decelerates and pressurizes in advance and deflects smoothly. This accounts for why the aerodynamic influence of hail impact pits is weaker at low Mach numbers than at high Mach numbers. Numerical simulation of the airflow trajectory inside the hail impact pit demonstrates that the internal flow pattern is inconsistent with the results of expansion wave analysis. The airflow does not undergo large-angle deflection when passing over the leading edge of the hail impact pit; instead, strong separated flow is generated at the leading edge corner. Such intense separated flow does not produce large-angle deflection, mainly because theoretical analysis generally adopts the assumption of inviscid flow (ideal gas) and ignores the effects of boundary layer, viscous friction and flow separation.
Turbulent kinetic energy (k) equation [42,43,44]:
Specific dissipation rate () equation:
The SST k- hybrid turbulence model is adopted to close the RANS equations by solving the turbulent kinetic energy (k) equation and the specific dissipation rate () equation. This model is well suited for solving problems involving strong adverse pressure gradients and severe flow separation induced by hail impact pits.
It can be observed from Figure 11b that due to the outer edge of hail impact pits on the wing upper surface, the expansion waves generated above the pits accelerate the airflow over all hail impact pits. As shown in Figure 11c, the low-pressure regions are exactly distributed at the locations of the hail impact pits. This indicates that the vortex structures induced by the single hail impact pits analyzed above are not individual phenomena. Instead, the pit group, composed of a large number of hail pits, collectively disturbs the pressure distribution on the wing upper surface.
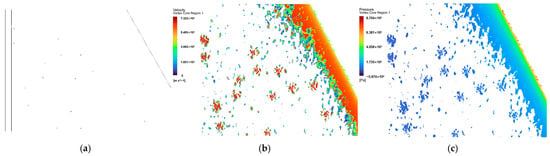
Figure 11.
The location distribution of hail pits on the wing (a); velocity cloud chart (b); pressure map (c).
4. Aerodynamic Performance Degradation Analysis of the Hail-Impacted Wing
To verify the influence of hail impact pit clusters on the aerodynamic characteristics of the wing, comparative numerical simulations were carried out to investigate the law of aerodynamic performance affected by 10 to 50 hail impact pits. Under the operating conditions with a free-stream Mach number of 0.7–2 and an angle of attack of 1–6°, numerical simulations were performed on wings containing 10 to 50 hail impact pits with a single pit diameter of 10–20 mm. The simulation results are presented in the following group of figures.
From the simulation results as illustrated in Figure 12, the flow field of the wing with hail impact pits exhibits obvious instability. The lift coefficient and drag coefficient fluctuate drastically with the variation in Mach number and present distinct non-monotonicity, violent fluctuations, and local inflection points in the transonic/supersonic transition range of 0.8–1.3 Ma. As mentioned above, each hail impact pit can be regarded as a fixed vortex generator on the wing surface, and separated vortices are generated when airflow passes over the pits. When as many as 50 such disturbance sources are distributed on the wing surface, the complex disturbances induced by these pits produce a macroscopic integral effect on the aerodynamic characteristics of the wing. Under specific flight conditions, especially in the transonic regime and at moderate to high angles of attack, the discretely distributed hail impact pits act as strong fixed disturbance sources. They transform the originally relatively steady and stable flow around the wing into a highly unsteady, temporally and spatially inhomogeneous complex flow field. After surface integration, the dynamic instability of this macroscopic flow field is directly manifested as severe fluctuations of aerodynamic coefficients with changing Mach number.
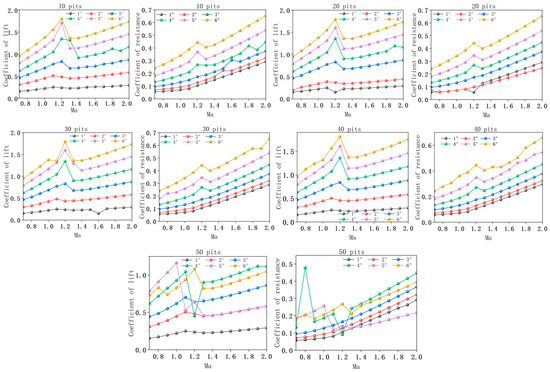
Figure 12.
Numerical simulation of wings with different numbers of hail impact pits.
At specific angles of attack, numerical simulations indicate that the wing with hail-impact pits delivers a higher lift-to-drag ratio relative to the smooth baseline configuration. One plausible interpretation for this trend is that hail pits function as fixed surface roughness elements and may trigger premature boundary-layer transition. As documented in the existing literature, turbulent boundary layers can delay flow separation under certain flow conditions; should such a physical mechanism take effect in the present computations, the coverage of attached flow would expand alongside an enlarged low-pressure region on the wing’s upper surface. The hypothesized mechanism agrees with the numerically captured flow-field features, yet dedicated experimental measurements of transition location and separation position are still essential to fully verify this proposed physics.
Nevertheless, such lift enhancement is not a universal phenomenon and should not be regarded as an improvement in aerodynamic performance.
By analyzing the lift-to-drag ratio of the wing, as illustrated in Figure 13, which presents the lift-to-drag ratio of wings with different numbers of hail impact pits, it can be clearly seen that hail impact pits do not exert a remarkable influence on the wing at all angles of attack. Under small angle-of-attack conditions, as shown in Figure 13a,b, the lift-to-drag ratio curves of wings with different quantities of hail impact pits are highly coincidental with those of the intact smooth wing without pits, indicating that the existence of hail impact pits hardly changes the aerodynamic efficiency of the wing. When the angle of attack increases to 3° and 4°, as depicted in Figure 13c,d, obvious gradient variations appear in the lift-to-drag ratio curves, which are most prominent in the transonic region of 0.8–1.3 Ma. This indicates that hail pits can have a detrimental effect on the aerodynamic characteristics at these conditions, and the influence appears sensitive to the number of pit.
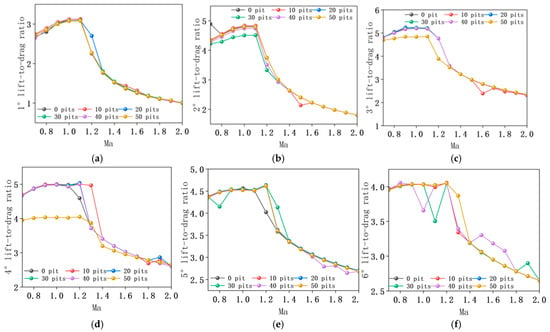
Figure 13.
Lift-to-drag ratios of wings with different numbers of hail pits; lift-to-drag ratio at 1° angle of attack (a); lift-to-drag ratio at 2° angle of attack (b); lift-to-drag ratio at 3° angle of attack (c); lift-to-drag ratio at 4° angle of attack (d); lift-to-drag ratio at 5° angle of attack (e); lift-to-drag ratio at 6° angle of attack (f).
At this moment, the wing operates near the critical angle of attack. Large-scale flow separation disrupts the low-pressure surface on the wing upper surface, causing the lift coefficient (CL) to level off while the drag coefficient (CD) increases sharply. When the flight Mach number reaches 1.4 (within the steady supersonic regime), the dominant physical mechanism of the flow field transforms with the increase in Mach number. The trade-off relationship of the lift-to-drag ratio becomes the primary factor governing the wing aerodynamic characteristics. Compared with the influence of wave drag, the effect of hail impact pits is relatively weak. The lift-to-drag ratio curves of wings with different numbers of hail impact pits are basically consistent with those of the intact wing without pits. When the angle of attack rises to 5° and 6°, entering the high angle-of-attack range, as shown in Figure 13e,f, the lift-to-drag ratio of the wing with hail impact pits exhibits a coexistence of stable and unstable characteristics. This phenomenon results from the interaction between the nonlinear features of the complex transonic flow field and discrete disturbance units (hail impact pits) on the wing surface. In the steady subsonic regime, the flow remains fully attached and the boundary layer maintains a stable state.
Hail pits on the wing surface act as surface roughness elements. These pits aggravate shock wave instability, which partially accounts for the fluctuations of the wing lift-to-drag ratio in the transonic regime. Nevertheless, the inherent unsteadiness of transonic flow is also a major contributing factor. The respective contributions of the two factors remain unclear and require further investigation. After entering other flow regimes of different Mach numbers, the disturbances induced by hail impact pits are gradually suppressed, and the variation in the lift-to-drag ratio tends to be steady. To quantify the effect of hail impact damage on wing aerodynamic performance, the relative decay rate of lift-to-drag ratio is introduced to characterize the aerodynamic damage of the wing, as shown in Equation (13):
where L/Dud is the lift-to-drag ratio of the wing when the number of hail impact pits is 0; L/Dd is the lift-to-drag ratio of the wing with a corresponding number of hail impact pits. The corresponding results are shown in Figure 14.
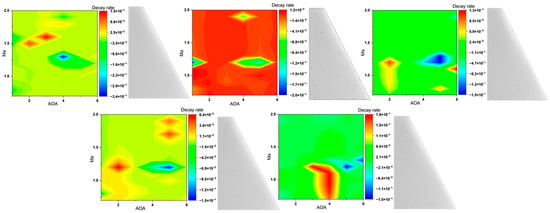
Figure 14.
Contour plot of lift-to-drag ratio decay rate of the wing in the angle-of-attack–Mach number plane under different damage degrees.
It can be observed from Figure 14 that the coverage of aerodynamic deterioration reaches its maximum when the number of hail dimples increases to 20, corresponding to the largest red high-attenuation area. This reveals that the wing with twenty hail dimples undergoes the most extensive and severe overall aerodynamic performance degradation across the entire flight envelope.
This non-monotonic variation indicates that the aerodynamic performance decay does not have a simple proportional relationship with the damage degree and exhibits obvious nonlinear characteristics. When the number of hail impact pits on the wing reaches 20, the shock wave and boundary layer interference within the transonic range appear to be associated with strong shock-boundary layer interactions that coincide with severe flow separation and aerodynamic loss. Statistical analysis of the simulation results shows that the transonic regime (Mach number 1.2–1.3) is the most sensitive region of aerodynamic performance to hail damage. The aircraft is more susceptible to hail impact damage at angles of attack of 4.0° and 5.0°. The maximum lift-to-drag ratio decay under corresponding working conditions and the critical operating parameters are listed in Table 1.

Table 1.
Aerodynamic performance degradation and critical conditions under hail damage.
Table 1 indicates that the extreme variation in lift-to-drag ratio does not increase monotonically with damage severity. The most pronounced change—a 33.7% increase—occurs at only ten hail pits, while larger pit counts lead to smaller or even reversed effects. It should be emphasized that such a sharp deviation, whether a surge or a drop, reflects a critical departure from the design aerodynamic state and poses a potential threat to flight stability. These critical operating conditions can identify the flight states where drastic aerodynamic performance changes are most likely to occur under each damage state, providing a reference basis for subsequent aircraft maintenance and pilots’ flight decision-making when encountering extreme adverse weather conditions such as hailstorms during flight.
5. Conclusions
This study takes the NACA 0006 airfoil as the research object. By adjusting the number of hail impact pits on the wing upper surface to control the surface roughness, the aerodynamic characteristics under hail impact conditions are investigated, and the influencing mechanism and action form of hail impact pits on wing aerodynamic performance are discussed. Subsequently, under moderate hail conditions, numerical simulation models of the fluid domain for wings with different quantities of hail impact pits are established to explore the correlation law between the number of hail pits and the aerodynamic characteristics of the wing. The main conclusions are summarized as follows:
- (1)
- Compared with the intact wing without hail damage, the aerodynamic performance of the wing with hail impact pits exhibits strong unpredictability. Especially in the transonic range of Mach 0.8–1.3, the flow field presents remarkable unsteadiness and instability, which significantly affects the aerodynamic characteristics of the wing. It indicates that the influence of hail impact pits on the wing aerodynamic characteristics is reflected not only in the degradation of aerodynamic performance, but also in the introduction of fatal unsteadiness and unpredictability. Aircraft handling performance and structural integrity may be compromised by these factors, whose influence extent and consequences remain to be verified via further dedicated analyses.
- (2)
- Under partial operating conditions, the aerodynamic performance of the hail-damaged wing is superior to that of the intact wing. The influence of hail impact pits on aerodynamic performance can be summarized as “sensitive triggering and saturation suppression”; future research will combine wind tunnel experiments to further investigate the underlying physical mechanisms responsible for the aerodynamic variations induced by surface pits on wing surfaces. The engineering implication of the research results is that high attention must be paid to slight and local hail impact damage as well as other types of pit defects. Their potential hazards under specific working conditions may be seriously underestimated. Formulating aircraft damage tolerance and release criteria based on the worst-case scenario (10 hail impact pits) rather than average values possesses more practical guiding significance for ensuring flight safety.
- (3)
- It should be noted that, restricted by aviation safety specifications, the CFD simulations of hail-damaged wings in this study have not been directly validated with flight test data. All computational cases adopt unified grid topology, turbulence model and boundary conditions, and grid independence verification is performed to guarantee numerical convergence. The obtained nonlinear variation laws and saturation effect are qualitatively credible, while their quantitative ranges are affected by the Reynolds number, airfoil geometric parameters and pit morphology. Accordingly, the relevant physical interpretations in this paper are not experimentally verified inherent mechanisms. Further high-fidelity scale-resolving simulations and dedicated experiments will be carried out to verify these conjectures.
Author Contributions
Methodology, Y.W.; Validation, X.G.; Investigation, Y.W., S.Z., F.X. and H.F.; Resources, Y.W.; Data curation, X.G.; Writing—original draft, X.G.; Writing—review & editing, H.Z.; Supervision, H.Z. and J.W. All authors have read and agreed to the published version of the manuscript.
Funding
This research received no external funding.
Institutional Review Board Statement
Not applicable.
Informed Consent Statement
Not applicable.
Data Availability Statement
The original contributions presented in this study are included in the article. Further inquiries can be directed to the corresponding author.
Conflicts of Interest
Author Yuhao Wu was employed by the company Qing’an Group Co., Ltd. The remaining authors declare that the research was conducted in the absence of any commercial or financial relationships that could be construed as a potential conflict of interest.
References
- Xiao, Y.; Huang, B.; Wang, Y. Review on Aeronautical Wing Aerodynamic Elasticity. Sci. Technol. Innov. Her. 2020, 17, 11–15. [Google Scholar]
- Zhao, Z.; Zuo, L.; Qian, W.; Chen, T.; Weng, Z.; Wang, Z. Research on Maneuvering Load Control Method for High Maneuverability Aircraft Wings. J. Beijing Univ. Aeronaut. Astronaut. 2026, 52, 482–489. [Google Scholar]
- Yang, Z.; Jin, Z.Y.; Yu, F.; Yu, L.; Yang, Z.G. Review on research of hail impact related problems on aircraft. Aerodyn. Res. Exp. 2024, 2, 1–14. [Google Scholar]
- Zhao, H.C.; Feng, X.W.; Liu, Y.L.; Li, T.; Hu, Y.; Tan, X.; Nie, Y. Damage characteristics of T800 carbon fiber plates under typical hail impact load. Explos. Shock Waves 2025, 45, 74–87. [Google Scholar]
- Kang, J.X. Simulation and Experimental Study on Hail Impact Damage of Honeycomb Sandwich Structures. Ph.D. Thesis, Harbin Institute of Technology, Harbin, China, 2023. [Google Scholar]
- Fang, X. Study on High-Speed Hail Impact Behavior of Composite Structures and Residual Strength Prediction. Ph.D. Thesis, Jiangsu University, Zhenjiang, China, 2022. [Google Scholar]
- Huang, X. Research progress on hail impact of aircraft. J. Jiamusi Univ. (Nat. Sci. Ed.) 2016, 34, 688–691+750. [Google Scholar]
- Bai, C.Y.; Zhao, Z.H.; Liu, X.C.; Zhang, Y.; Guo, Y. Research progress and prospect on hail impact resistance characteristics of aircraft structures. Acta Aeronaut. Astronaut. Sin. 2025, 46, 8–22. [Google Scholar]
- Pai, A.; Sowmya, P.K.; Chaudhary, K.; Kini, C.R.; Nayak, S.Y.; Shenoy, B.S. Modeling hailstone fragmentation upon impact with curved aircraft panels using a modified Hertzian contact mechanics framework. CEAS Aeronaut. J. 2026, 17, 273–285. [Google Scholar] [CrossRef]
- Alsalani, A.A.; Al-Saad, M.; Al-Mosallam, M. A Study of Impacts of Airfoil Geometry on the Aerodynamic Performance at Low Reynolds Number. Int. J. Mech. Eng. Robot. Res. 2023, 12, 99–106. [Google Scholar] [CrossRef]
- Wang, F.; Zhang, K.; He, D.; Qi, J.; Ming, X.; Zhang, J.; Xiao, P. Research on the Influence of Surface Roughness on Aerodynamic Characteristics of NACA2412 Airfoil. Surf. Technol. 2025, 54, 119–129. [Google Scholar]
- Deng, H.; Xia, T.; Dong, H.; Cheng, K. Experimental study on the effect of rough surface on aerodynamic characteristics and flow field of low Reynolds number airfoil. J. Exp. Fluid Mech. 2025, 39, 60–72. [Google Scholar]
- Peng, C.; Zhang, J.; Dong, J.; Qin, Y.; Wei, Z. Research on the influence of local roughness on the aerodynamic characteristics of wing surfaces. Chin. J. Comput. Mech. 2017, 34, 123–129. [Google Scholar]
- Yang, Y.; Jia, Y.; Cai, C.; Zuo, C.; Wang, Y.; Bao, D.; Li, Q. Analysis of Wind Turbine Airfoil Aerodynamic Characteristics under Rough Wall Surface Influence. J. Inn. Mong. Univ. Technol. (Nat. Sci. Ed.) 2023, 42, 237–243. [Google Scholar]
- Huang, C.; Yang, K.; Liu, Q.; Zhang, L.; Bai, J.; Xu, J. Analysis of Aerodynamic Parameters of Wind Turbine Airfoils and Discussion on Evaluation Indicators for Blade Roughness Sensitivity. Sci. China Technol. Sci. 2012, 42, 182–187. [Google Scholar]
- Zuo, W. Research and Control on Wing Aerodynamic Characteristics at Low Reynolds. Master’s Thesis, Nanjing University of Aeronautics and Astronautics, Nanjing, China, 2016. [Google Scholar]
- Chang, S.; Su, X.; Qiu, Y. Three-dimensional wing icing simulation. Acta Aeronaut. Astronaut. Sin. 2011, 32, 212–222. [Google Scholar]
- Zhang, Y.; Wang, H.; Dong, L.; Liu, X.; Chen, J.; Li, M. Research Progress on Hail Fatigue Failure and Life Prediction of Aerospace Aluminum Alloys. Chin. J. Nonferrous Met. 2024, 34, 1893–1913. [Google Scholar]
- Quest, J.; Rolston, S. Investigation of a modern transonic transport aircraft configuration over a large range of Reynolds numbers (AIAA-2002-0422). In Proceedings of the 40th AIAA Aerospace Sciences Meeting & Exhibit. American Institute of Aeronautics and Astronautics, Reno, NV, USA, 14–17 January 2002. [Google Scholar]
- Kundu, P.K.; Cohen, I.M.; Dowling, D.R. Fluid Mechanics, 5th ed.; Academic Press: Cambridge, MA, USA, 2016. [Google Scholar]
- Anderson, J.D. Fundamentals of Aerodynamics, 5th ed.; McGraw-Hill: Columbus, OH, USA, 2010. [Google Scholar]
- Oyewola, M.O.; Idowu, T.E.; Labiran, J.M. Combined effect of surface coating and angle of attack on the aerodynamic performance of NACA 0012, 4412, and 6412 airfoils. Next Mater. 2026, 10, 101531. [Google Scholar] [CrossRef]
- Zhang, Y.J.; Duan, Z.Y.; Lei, W.T.; Bai, J.; Xu, J. Design of supercritical natural laminar flow wing and boundary layer transition wind tunnel test based on TSP technology. Acta Aeronaut. Astronaut. Sin. 2019, 40, 134–148. [Google Scholar]
- Guo, X.D.; Li, Y.R.; Li, R.N.; Li, D.; Yang, B.; Zhao, F. Sensitivity of unsteady aerodynamic characteristics of wind turbine airfoil to turbulence. Trans. Chin. Soc. Agric. Eng. 2023, 39, 52–59. [Google Scholar]
- Rong, H.R.; Dai, Y.T.; Xu, Y.T.; Yang, C. Flutter study of AGARD 445.6 rigid wing at different angles of attack based on unsteady aerodynamic reduced-order model. Eng. Mech. 2022, 39, 232–247. [Google Scholar]
- Liu, W.J.; Zhang, Q.M.; Ma, X.H.; Long, R.R.; Ren, J.K.; Gong, Z.Z.; Wu, Q.; Ren, S.Y. Research progress on cratering models of near-Earth small objects impacting the Earth. Explos. Shock Waves 2021, 41, 119–134. [Google Scholar]
- Ju, Y.Y.; Zhang, Q.M.; Gong, L.F.; Chen, H.; Liu, J.W.; Wang, K. Molecular dynamics simulation of hypervelocity impact on aluminum targets by spherical projectiles. Spacecr. Environ. Eng. 2018, 35, 153–157. [Google Scholar]
- Zhang, Y.; Wang, B.W.; Bai, C.Y.; Li, H.; Zhao, L.; Liu, S. Comparative Study on Impact Resistance Characteristics of Typical Aircraft Structures Against Hail and Simulated Bird Projectiles. J. Vib. Shock 2021, 40, 307–314. [Google Scholar]
- Kyle, R.G.; Feryn, M.O. Effect of Wing Leading-Edge Shape on Aerodynamic Characteristics of a 67° Swept Wing-Body Model at Mach 1.50 to 4.63; NASA TN D-3634; NASA: Washington, DC, USA, 1966. [Google Scholar]
- Ou, J.H.; Wan, B.B.; Liu, J.X.; Cao, W. Study on Basic Flow Characteristics of Hypersonic Entropy Layer over a Blunt Body. Acta Aerodyn. Sin. 2018, 36, 238–246. [Google Scholar]
- Li, G.N.; Lei, K.P.; An, X.M.; Xu, M.; Xu, Y. Virtual flight simulation of variable Mach number effects on airfoils during transonic transition. Acta Aeronaut. Astronaut. Sin. 2024, 45, 275–289. [Google Scholar]
- Chapman, D.R.; Kuehn, D.M.; Larson, H.K. Investigation of Separated Flows in Supersonic and Subsonic Streams with Emphasis on the Effect of Transition; NACA Report 1356; NACA: Boston, MA, USA, 1958. [Google Scholar]
- Nestler, D.E.; Saydah, A.R.; Auxer, W.L. Heat transfer to steps and cavities in hypersonic turbulent flow. AIAA J. 1969, 7, 1368–1370. [Google Scholar] [CrossRef]
- Cheng, X.H.; Yang, T.; Chang, Z.D. Influence of entropy layer on aerodynamics parameters for hypersonic 2-D blunt wedge. J. Aerosp. Power 2012, 27, 1362–1367. [Google Scholar]
- Hayes, W.D.; Probstein, R.F. Hypersonic Flow Theory (Vol.5, Applied Mathematics and Mechanics); Academic Press: Cambridge, MA, USA, 1959. [Google Scholar]
- Wan, B.B.; Luo, J.S. Study on the instability of entropy layer in supersonic flow over a blunt plate. Acta Aerodyn. Sin. 2018, 36, 247–253. [Google Scholar]
- Liu, J.Y. Correction of turbulent Prandtl number in hypersonic flow around bodies. J. Proj. Rocket. Missiles Guid. 2024, 44, 1–5. [Google Scholar]
- Zhang, Y.F.; He, K.; Zhang, Y.R.; Mao, M.L.; Chen, J.Q. Improvement and verification of Menter transition model in hypersonic flow simulation. J. Astronaut. 2016, 37, 397–404. [Google Scholar]
- Menter, F.R. Two-equation eddy-viscosity turbulence models for engineering applications. AIAA J. 1994, 32, 1598–1605. [Google Scholar] [CrossRef]
- Zeng, Y.; Wang, H.B.; Sun, M.B.; Wang, C.; Liu, X. Review on the improvement of SST turbulence model. Acta Aeronaut. Astronaut. Sin. 2023, 44, 103–134. [Google Scholar]
- Du, Y.M.; Gao, Z.H.; Shu, B.W.; Qiu, F.S.; Song, C.X. Modification of k-ω SST turbulence model for three-dimensional shock wave induced separation flow. Acta Mech. Sin. 2022, 54, 1485–1501. [Google Scholar]
- Li, W.H.; Rao, C.Y.; Duan, Y.; Wang, D.; Gao, Y.; Zhang, J. Prediction performance of various SST turbulence models for typical separated flows. Acta Aerodyn. Sin. 2026, 1–12. [Google Scholar] [CrossRef]
- Chien, K.Y. Predictions of Channel and Boundary-Layer Flows with a Low-Reynolds-Number Turbulence Model. AIAA J. 1982, 20, 33–38. [Google Scholar] [CrossRef]
- Wilcox, D.C. Formulation of the k-ω Turbulence Model Revisited. AIAA J. 2008, 46, 2823–2838. [Google Scholar] [CrossRef]


Disclaimer/Publisher’s Note: The statements, opinions and data contained in all publications are solely those of the individual author(s) and contributor(s) and not of MDPI and/or the editor(s). MDPI and/or the editor(s) disclaim responsibility for any injury to people or property resulting from any ideas, methods, instructions or products referred to in the content. |
© 2026 by the authors. Licensee MDPI, Basel, Switzerland. This article is an open access article distributed under the terms and conditions of the Creative Commons Attribution (CC BY) license.