


Abstract
Medical device manufacturing requires strict quality control, reliable traceability, and compliance with regulatory requirements. In many cases, inspection activities are still carried out manually and production information is recorded separately, which can result in inconsistent defect detection and limited visibility of manufacturing performance. This paper presents the development and industrial implementation of an integrated closed-loop quality control architecture for a sterile single-use medical device assembly line, addressing the lack of integration between inspection, traceability, and control systems in existing manufacturing approaches. In the proposed approach, we combine radio-frequency identification, machine vision inspection, programmable logic control, and centralized production monitoring. RFID tags store the status of each unit at individual stations so that defective products cannot proceed to downstream operations. Machine vision systems verify component presence, detect missing parts, and confirm color-specific assembly requirements during production. The architecture was tested through implementation on an assembly line and evaluated with comparative pilot studies against a traditional manual inspection process. The upgraded line achieved scrap cost reductions of 52.77% and 53.23% while also improving inspection consistency and production traceability. The results demonstrate that integrating machine vision inspection with RFID traceability can significantly improve quality control and manufacturing efficiency in regulated medical device production.
1. Introduction and Related Work
Medical device manufacturing places unusually high demands on production quality and process traceability [1]. Since medical devices are used in clinical environments, they must meet strict safety and reliability requirements [2], and manufacturers must document that each unit has been properly assembled and inspected in line with regulatory standards. Authorities like the U.S. Food and Drug Administration and the European Medicines Agency require manufacturers to keep their detailed records of production activities and verification procedures [3]. Trustworthy and reliable inspection methods and precise product traceability are indispensable aspects of modern medical device manufacturing systems [4].
In practice, however, many assembly operations still depend on manual inspection and locally recorded production information [5]. Operators visually check parts, confirm assembly steps, and record results separately at different stations. This approach can work for relatively simple production lines, but it becomes difficult to manage as devices grow smaller and more complex. Variability in manual inspection can lead to inconsistent defect detection [6], as reported in studies highlighting operator-dependent variability and environmental influences on inspection accuracy [7,8], and fragmented data systems make it harder to understand the real status of products moving through the line. When a defect is discovered late in the process, the unit often already contains several assembled components, increasing scrap costs and wasted labor [9].
To address these limitations, automated inspection technologies have been increasingly introduced into manufacturing environments [10].
Machine vision systems are used in many manufacturing environments [11], to verify assembly conditions, check component placement, and detect missing or defective parts during production. In contrast to manual inspection, these systems can operate continuously and apply the same inspection criteria to every unit. Prior research has demonstrated their effectiveness in defect detection, dimensional inspection, and assembly verification across a wide range of industrial applications [12,13,14].
However, in most implementations, machine vision systems are deployed as local inspection tools, where results remain at the station level and are not directly connected to broader process control decisions.
At the same time, radio-frequency identification (RFID) technology enables individual units to be identified and tracked as they move through the manufacturing process [15]. By assigning a unique identifier to each product or carrier, RFID systems make it possible to record where a unit has been in the process and what operations it has completed.
Previous studies have shown that RFID-based systems improve production monitoring, data collection, and product-level traceability in manufacturing environments [16,17,18]. However, RFID is typically used as a passive tracking mechanism, where information is recorded but not actively used to influence process decisions in real time.
Industrial control systems, particularly those based on programmable logic controllers (PLCs), are responsible for coordinating operations and enforcing process logic in manufacturing systems [19]. These systems enable sequencing, synchronization, and interlocking of production steps, and recent studies have explored their integration with sensing and monitoring technologies to improve system responsiveness [20,21].
There have also been attempts to integrate inspection and traceability systems in manufacturing environments. For example, Kumar et al. (2021) [22] showed that combining machine vision with RFID can improve real-time traceability in a learning factory setup.
The evolution of quality control in manufacturing has been characterized by a transition from manual inspection practices to automated inspection systems, followed by the introduction of digital traceability solutions, and more recently toward integrated and data-driven production environments.
Following this progression, existing studies have explored machine vision inspection, RFID-based traceability, and industrial control systems as key components of modern manufacturing [23,24,25]. While machine vision enables automated inspection [26] and RFID supports product-level traceability [27], PLC-based control systems coordinate process execution [19]. However, these approaches are often implemented as separate or loosely connected subsystems. As a result, inspection results are not consistently linked to product-level decision-making, and defective units may continue through downstream operations before being detected, as reported in prior studies [28,29]. Limited work has focused on their integration into a unified closed-loop architecture, where inspection outcomes directly influence process decisions in real time. This gap is particularly relevant in regulated manufacturing environments, where both quality control and traceability are critical.
This limitation is especially critical in medical device manufacturing, where regulatory frameworks require not only defect detection but also strict control of product flow and complete traceability of each unit throughout the production process [30,31].
This represents the primary gap in the literature. The key challenge is not only detecting defects, but ensuring that inspection outcomes directly trigger process-level decisions in real time.
While machine vision, RFID, and PLC-based control systems are widely used in manufacturing, they are typically implemented as separate or loosely connected subsystems. In contrast, the contribution of this work is in its integration into a unified closed-loop architecture, where inspection outcomes are directly linked to product-level state tracking and process control decisions in real time. This enables stopping defects where they occur and preventing them from moving to later stages of the assembly line, which is not achieved in conventional implementations.
In this study, we focused exactly on that point. Instead of treating inspection, tracking, and control as separate layers, we connected them into one system. Inspection results are not just recorded. They are tied directly to the product through RFID and used by the PLC to decide whether that unit is allowed to continue. So the system does not just detect problems, it reacts to them immediately.
Recent literature within smart manufacturing and automation has increasingly explored the convergence of inspection and traceability technologies. Several contemporary studies have highlighted the role of advanced sensing, digital twins, and AI-driven vision systems in optimizing production lines, enhancing parts flow data quality, and automating complex assembly tasks [14,32,33,34,35]. For example, Kumar et al. [22] demonstrated the integration of machine vision and RFID for real-time part traceability. However, their implementation was situated within a simulated learning factory environment and primarily focused on data visibility rather than active process control. Similarly, works by Demčák et al. [16] and de Jesus Pacheco et al. [24] have successfully leveraged RFID technologies for digital twin monitoring and production optimization.
While these studies establish strong foundations for Industry 4.0 data acquisition, they largely utilize RFID and machine vision as passive monitoring or offline decision-support tools. A critical gap remains in translating this passive traceability into active, hardware-level process interlocking. In strictly regulated environments like medical device manufacturing, passive data collection is insufficient; defects must be physically contained at the point of origin. To address this limitation, this study proposes an architecture that transitions from informational monitoring to active defect containment, utilizing RFID-encoded inspection data to directly trigger PLC-based physical interlocks.
The main contributions of this work are as follows:
- We develop a closed-loop manufacturing architecture integrating machine vision, RFID-based traceability, and PLC-based control into a unified, closed-loop decision-making framework.
- We introduce the use of RFID as an active control mechanism, where product-level data is used to enforce process logic and prevent non-compliant units from advancing.
- We implement an in-process defect detection strategy that enables defect identification and containment at each station, reducing defect propagation across the assembly line.
- We validate the proposed system through two industrial pilot studies under real production conditions and support the results with statistically validated analysis.
This study examines the integration of machine vision inspection and RFID-based traceability in a sterile single-use medical device assembly line. The system we designed and built connects automated inspection equipment, RFID, and programmable logic controller (PLC) control to monitor product status and enforce quality decisions throughout the assembly process. The architecture was implemented on an operational production line and evaluated through pilot studies comparing the upgraded system with a traditional manual inspection process. The results illustrate significant declines in scrap rates and increased consistency in defect detection, and improved traceability of manufacturing data.
2. Materials and Methods
2.1. Production Environment and System Overview
In this study, we worked on an existing sterile single-use medical device assembly line consisting of multiple sequential stations, including housing press, welding, pressing, and leak testing operations. Each station performs a defined task, and the product moves step by step until final assembly is completed. Because these devices are used in clinical environments, every unit must be inspected and its production history must be traceable.
Rather than developing a separate laboratory setup, we integrated the proposed system directly into the production line. This allowed us to evaluate the system under real operating conditions, including operator interaction, cycle time constraints, and production variability.
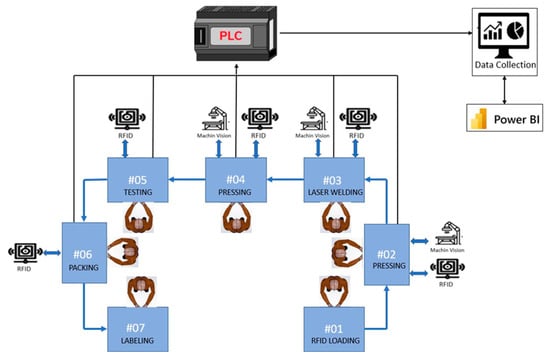
In this work, we combined RFID-based tracking, machine vision inspection, PLC-based control, and centralized data collection into a single architecture. The overall configuration of the integrated assembly cell is shown in Figure 1.
Figure 1.
Assembly cell with integrated RFID, vision system, PLC, data collection, and Power BI. Station numbers (#01–#07) represent sequential assembly stations.
2.2. RFID-Based Traceability Implementation
In this study, we used RFID technology as the main mechanism for tracking and controlling product flow. Each RFID tag is integrated directly into the single-use medical device at the first station, enabling unit-level traceability throughout the assembly process. The tag is used for two purposes: to identify the product and to store process information at each station. At each workstation, a structured read–verify–process–write sequence is executed, where the RFID data is first read and validated before any operation is allowed to proceed, and then updated with the current station result. This sequence is coordinated through PLC-based handshake logic, ensuring that each station confirms completion of upstream operations before initiating processing.
To improve reliability, each station is equipped with dedicated read/write capability, and operations are executed sequentially to avoid communication conflicts. In addition, multi-read verification and controlled read zones are implemented to minimize the risk of misreads or missed reads during operation. The system operates at 13.56 MHz (HF RFID) and has been validated under industrial conditions, including metal proximity, moisture, shielding, and post-sterilization environments, confirming robust performance.
At each station, the system first reads the RFID tag and verifies whether the previous operations were successfully completed. If the required pass condition is not met, the system prevents the operation from starting. After the operation is completed, the station writes a new pass or fail result back to the RFID tag.
This creates a control logic in sequence across the production line. A unit can proceed only if all previous stations have recorded a pass result. If a fail is detected, the process stops at that station and the operator is notified through the HMI.
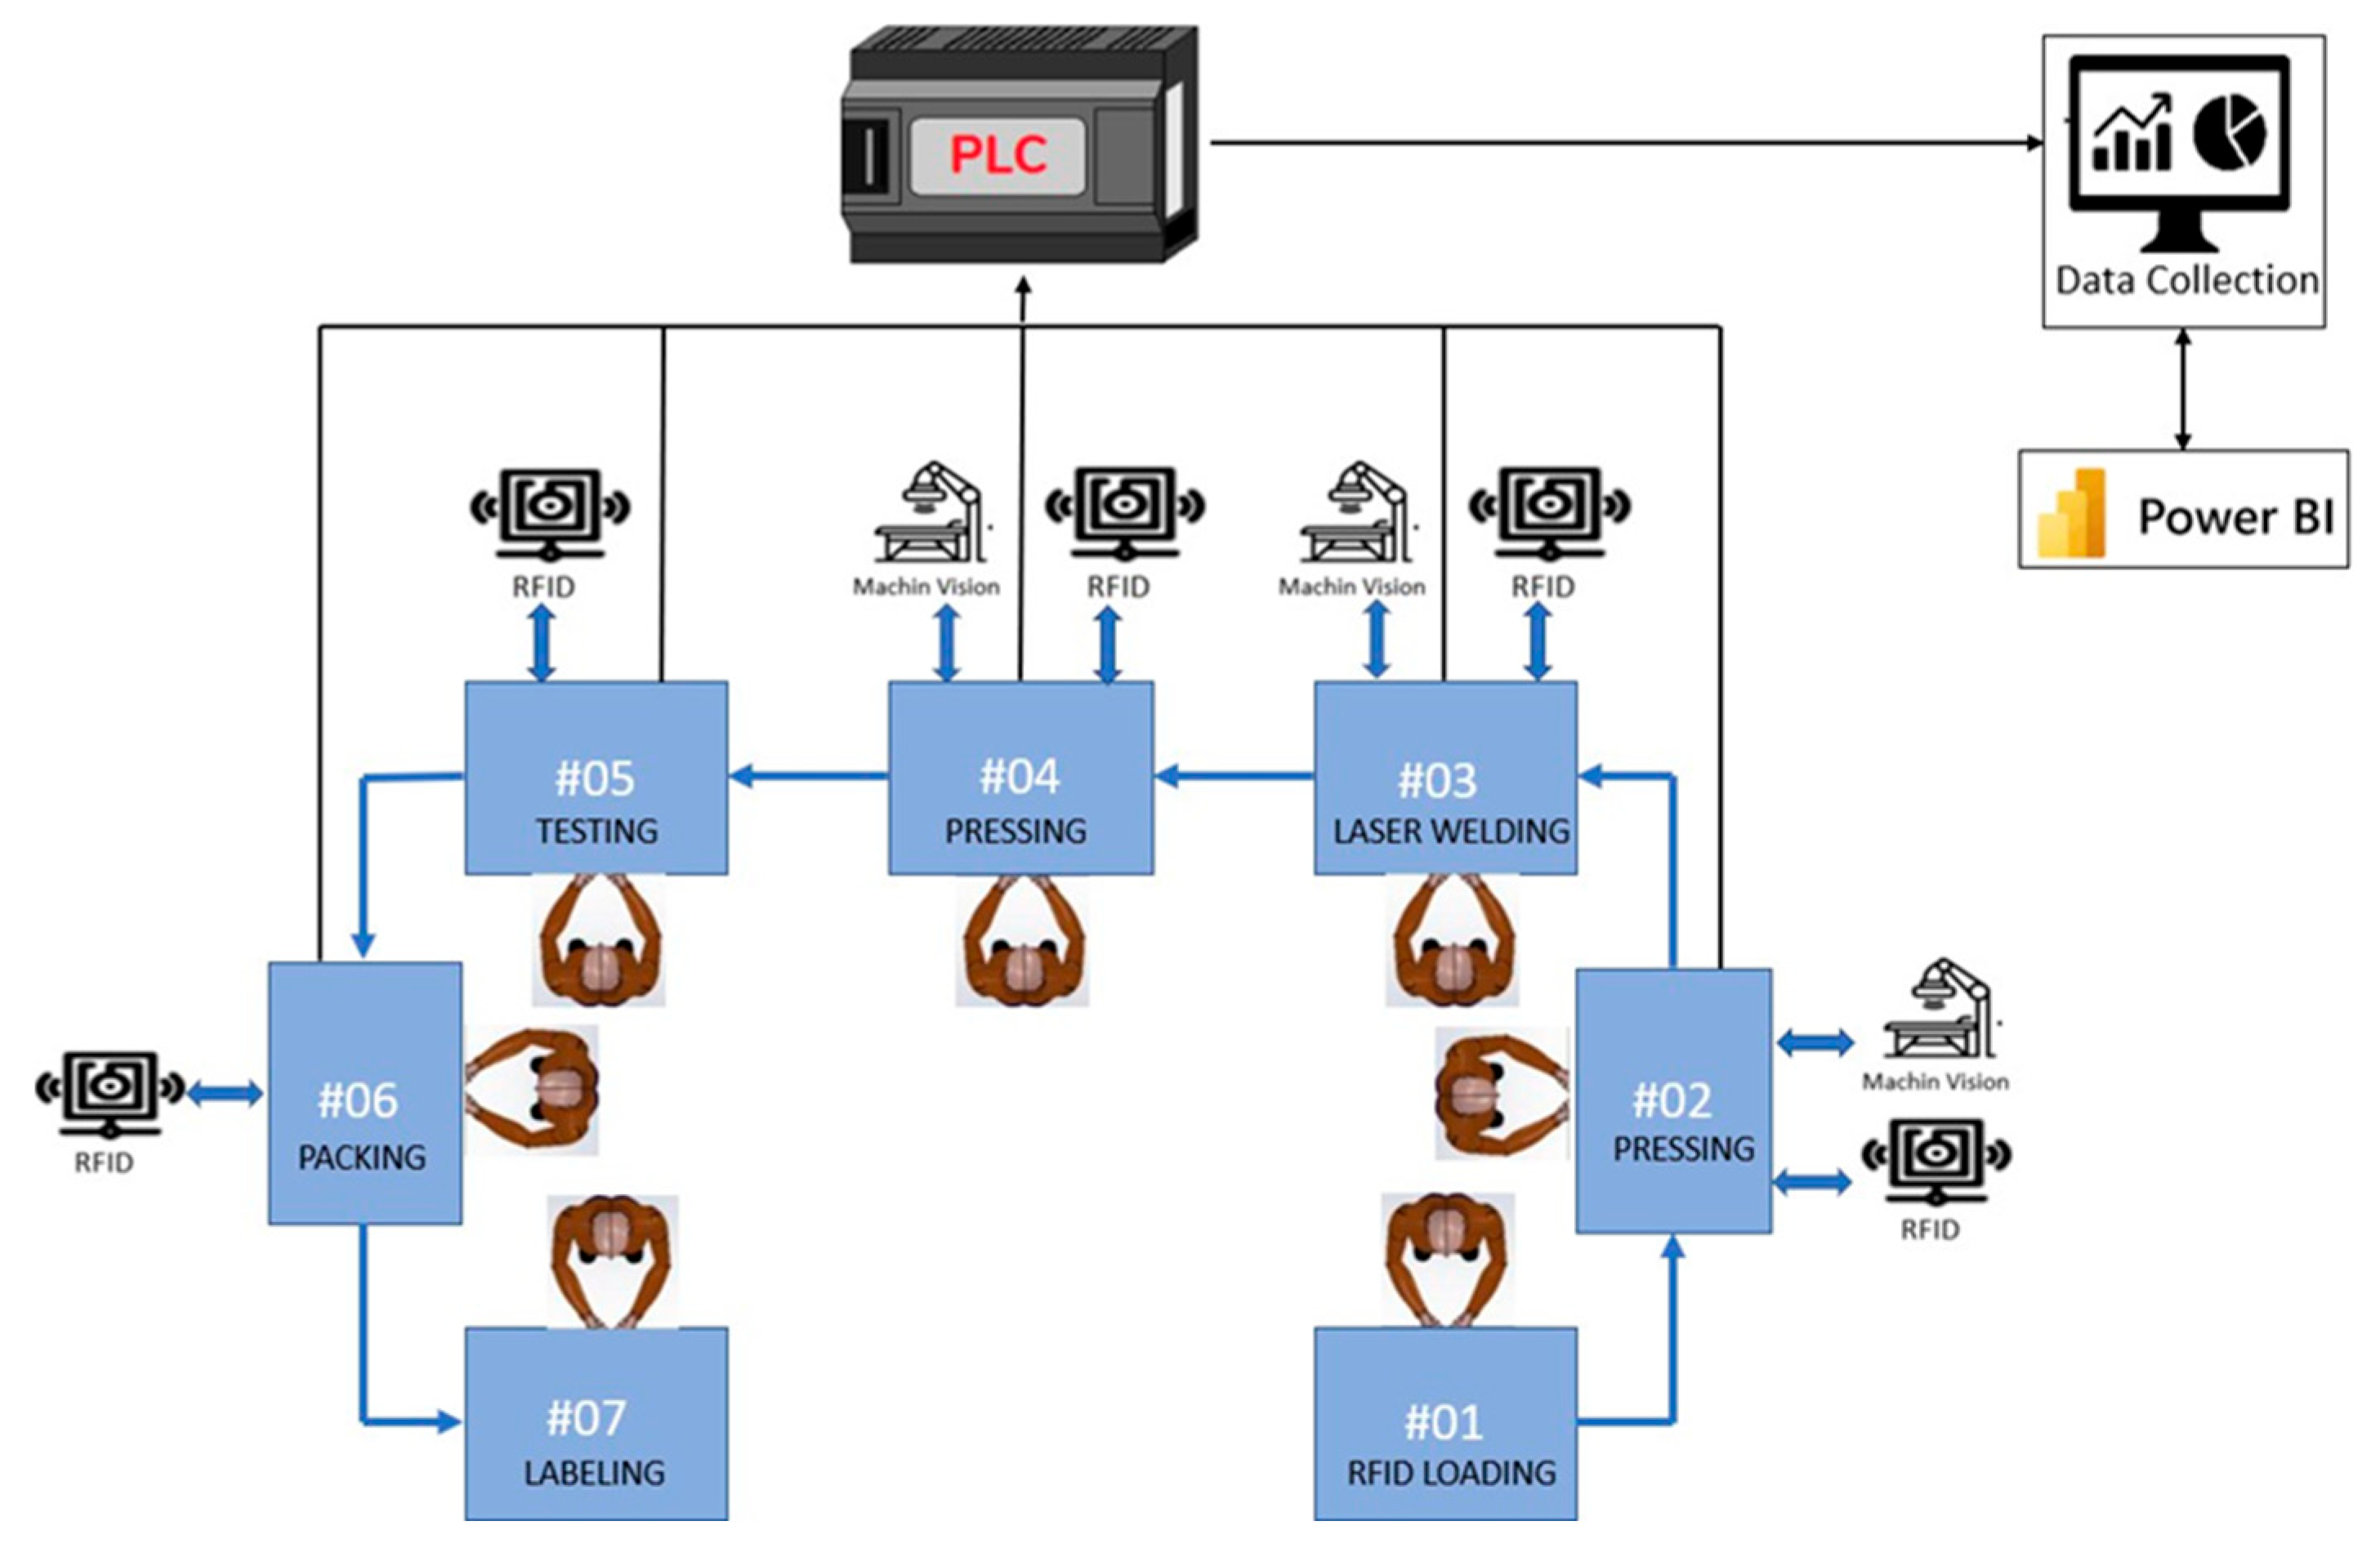
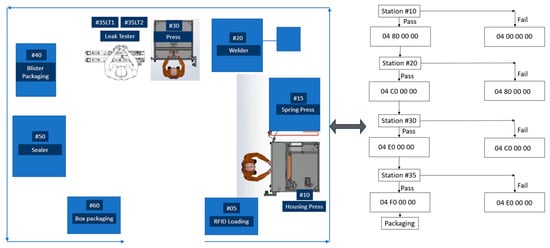
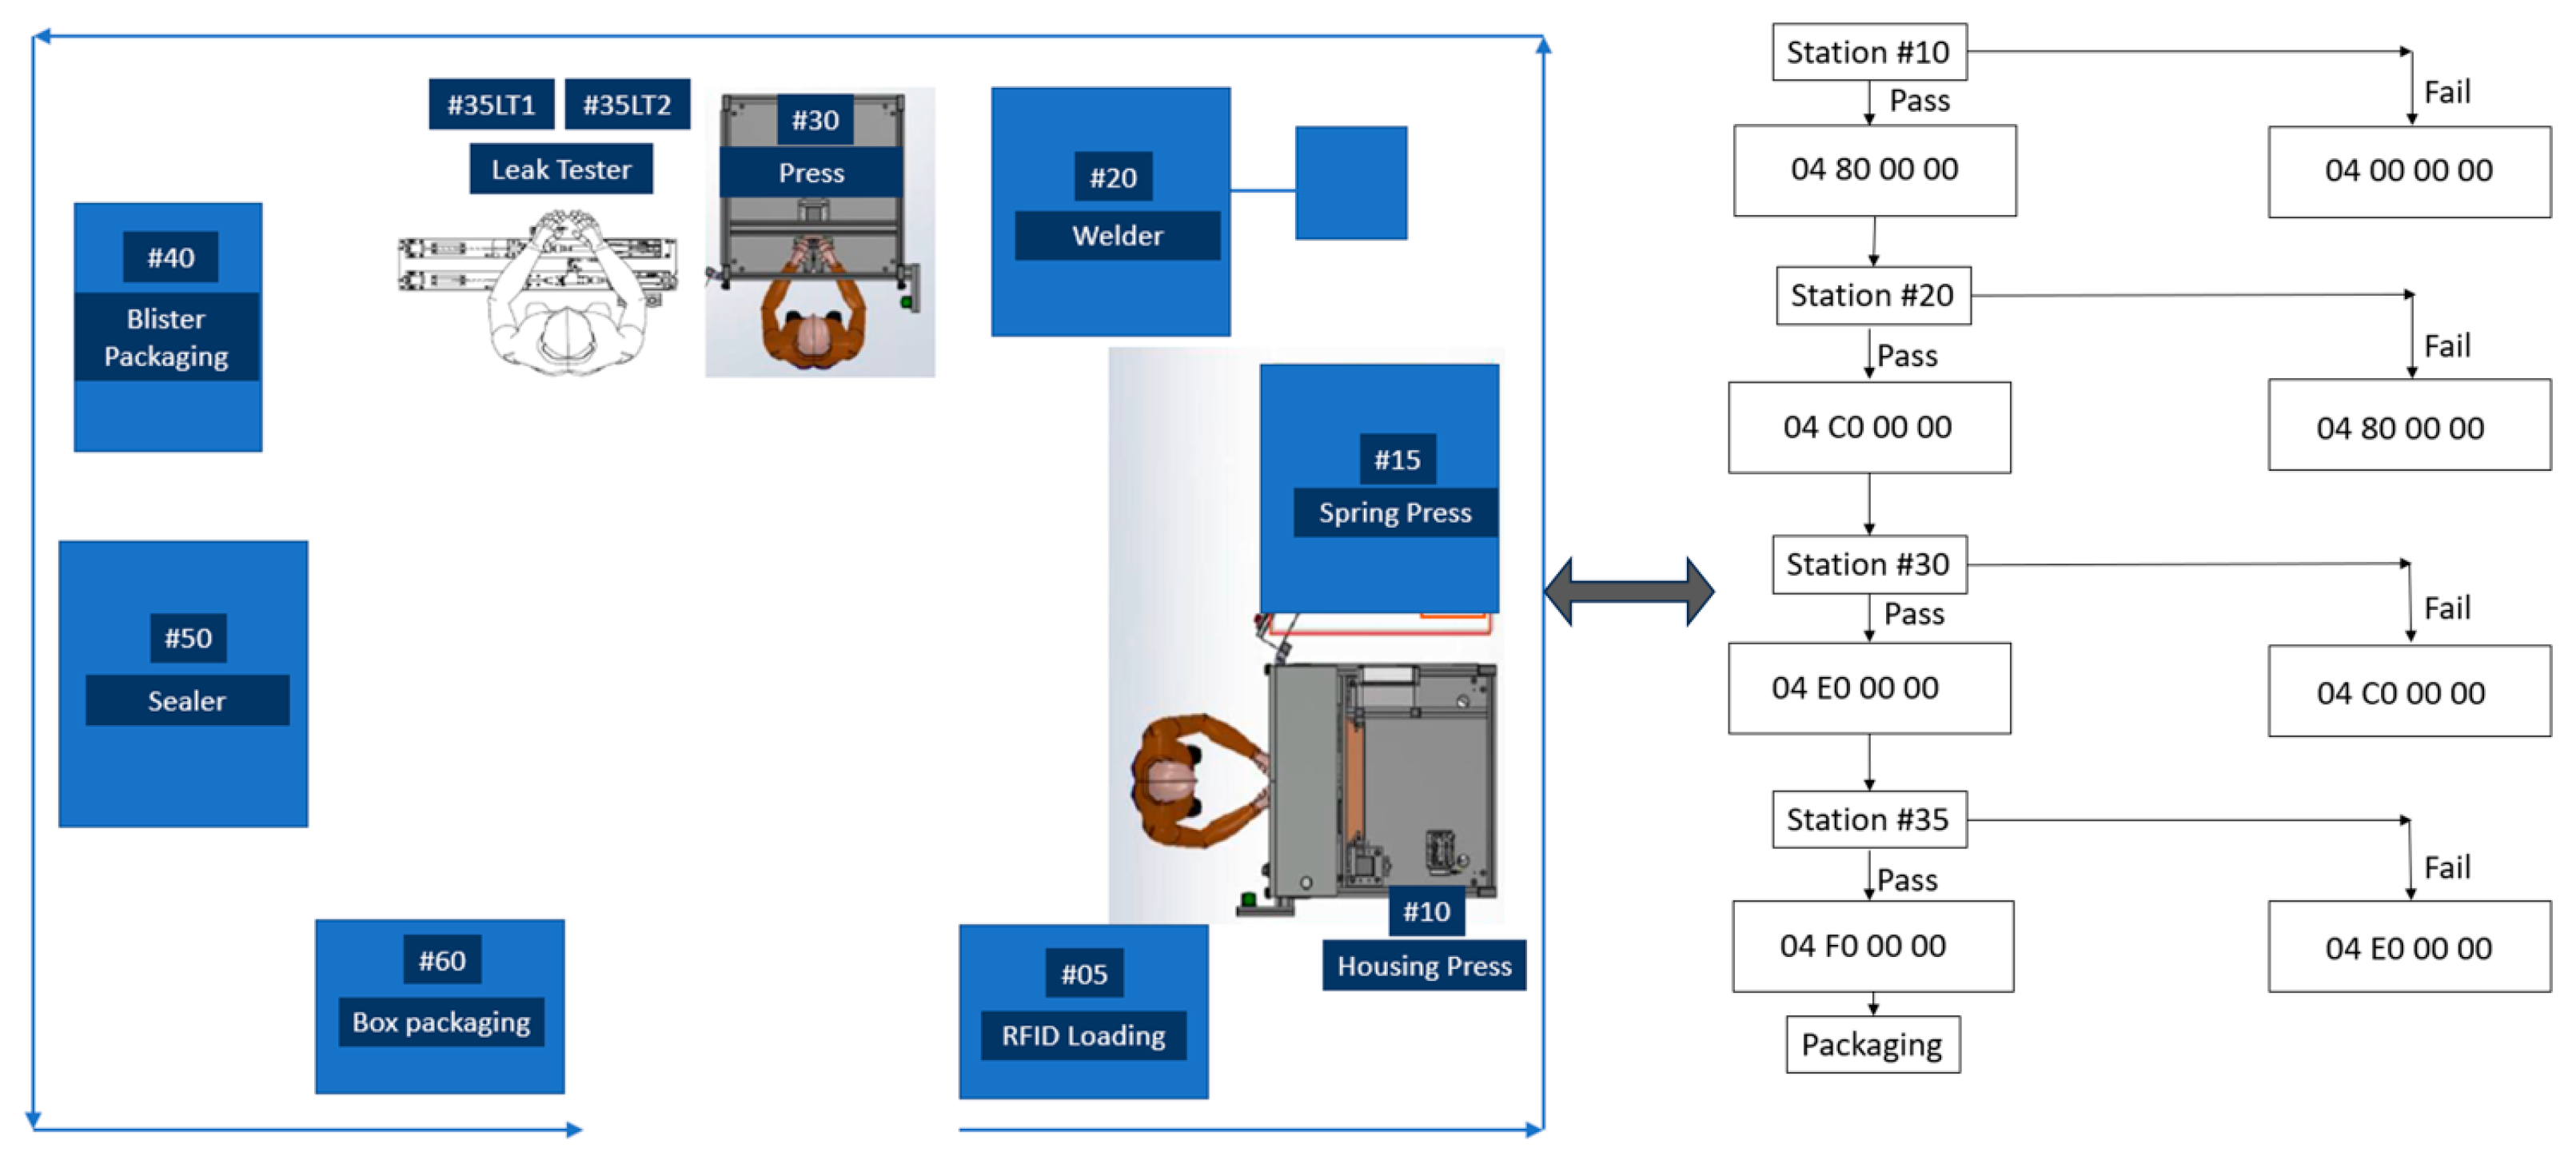
The RFID reading and writing process across stations is illustrated in Figure 2. Unlike conventional traceability approaches, RFID data is used not only for tracking but also for decision-making, where the system actively controls whether a product is allowed to move forward.
Figure 2.
Assembly cell and RFID reading and writing methodology.
2.3. Machine Vision Inspection System
In this study, at selected stations of the assembly process, we used machine vision systems to perform inspection. These systems were used to verify if a part is present, detect missing components, and check whether the assembly was completed correctly or not, including color-specific requirements where needed.
Depending on the station, we used different types of vision systems. For stations with limited space and simpler inspection tasks, we used compact vision sensors. For stations requiring higher accuracy and more detailed inspection, we used industrial cameras.
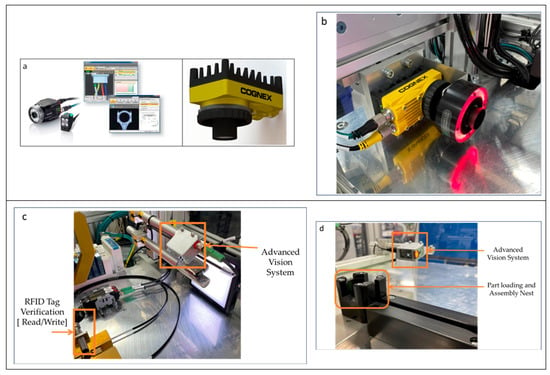
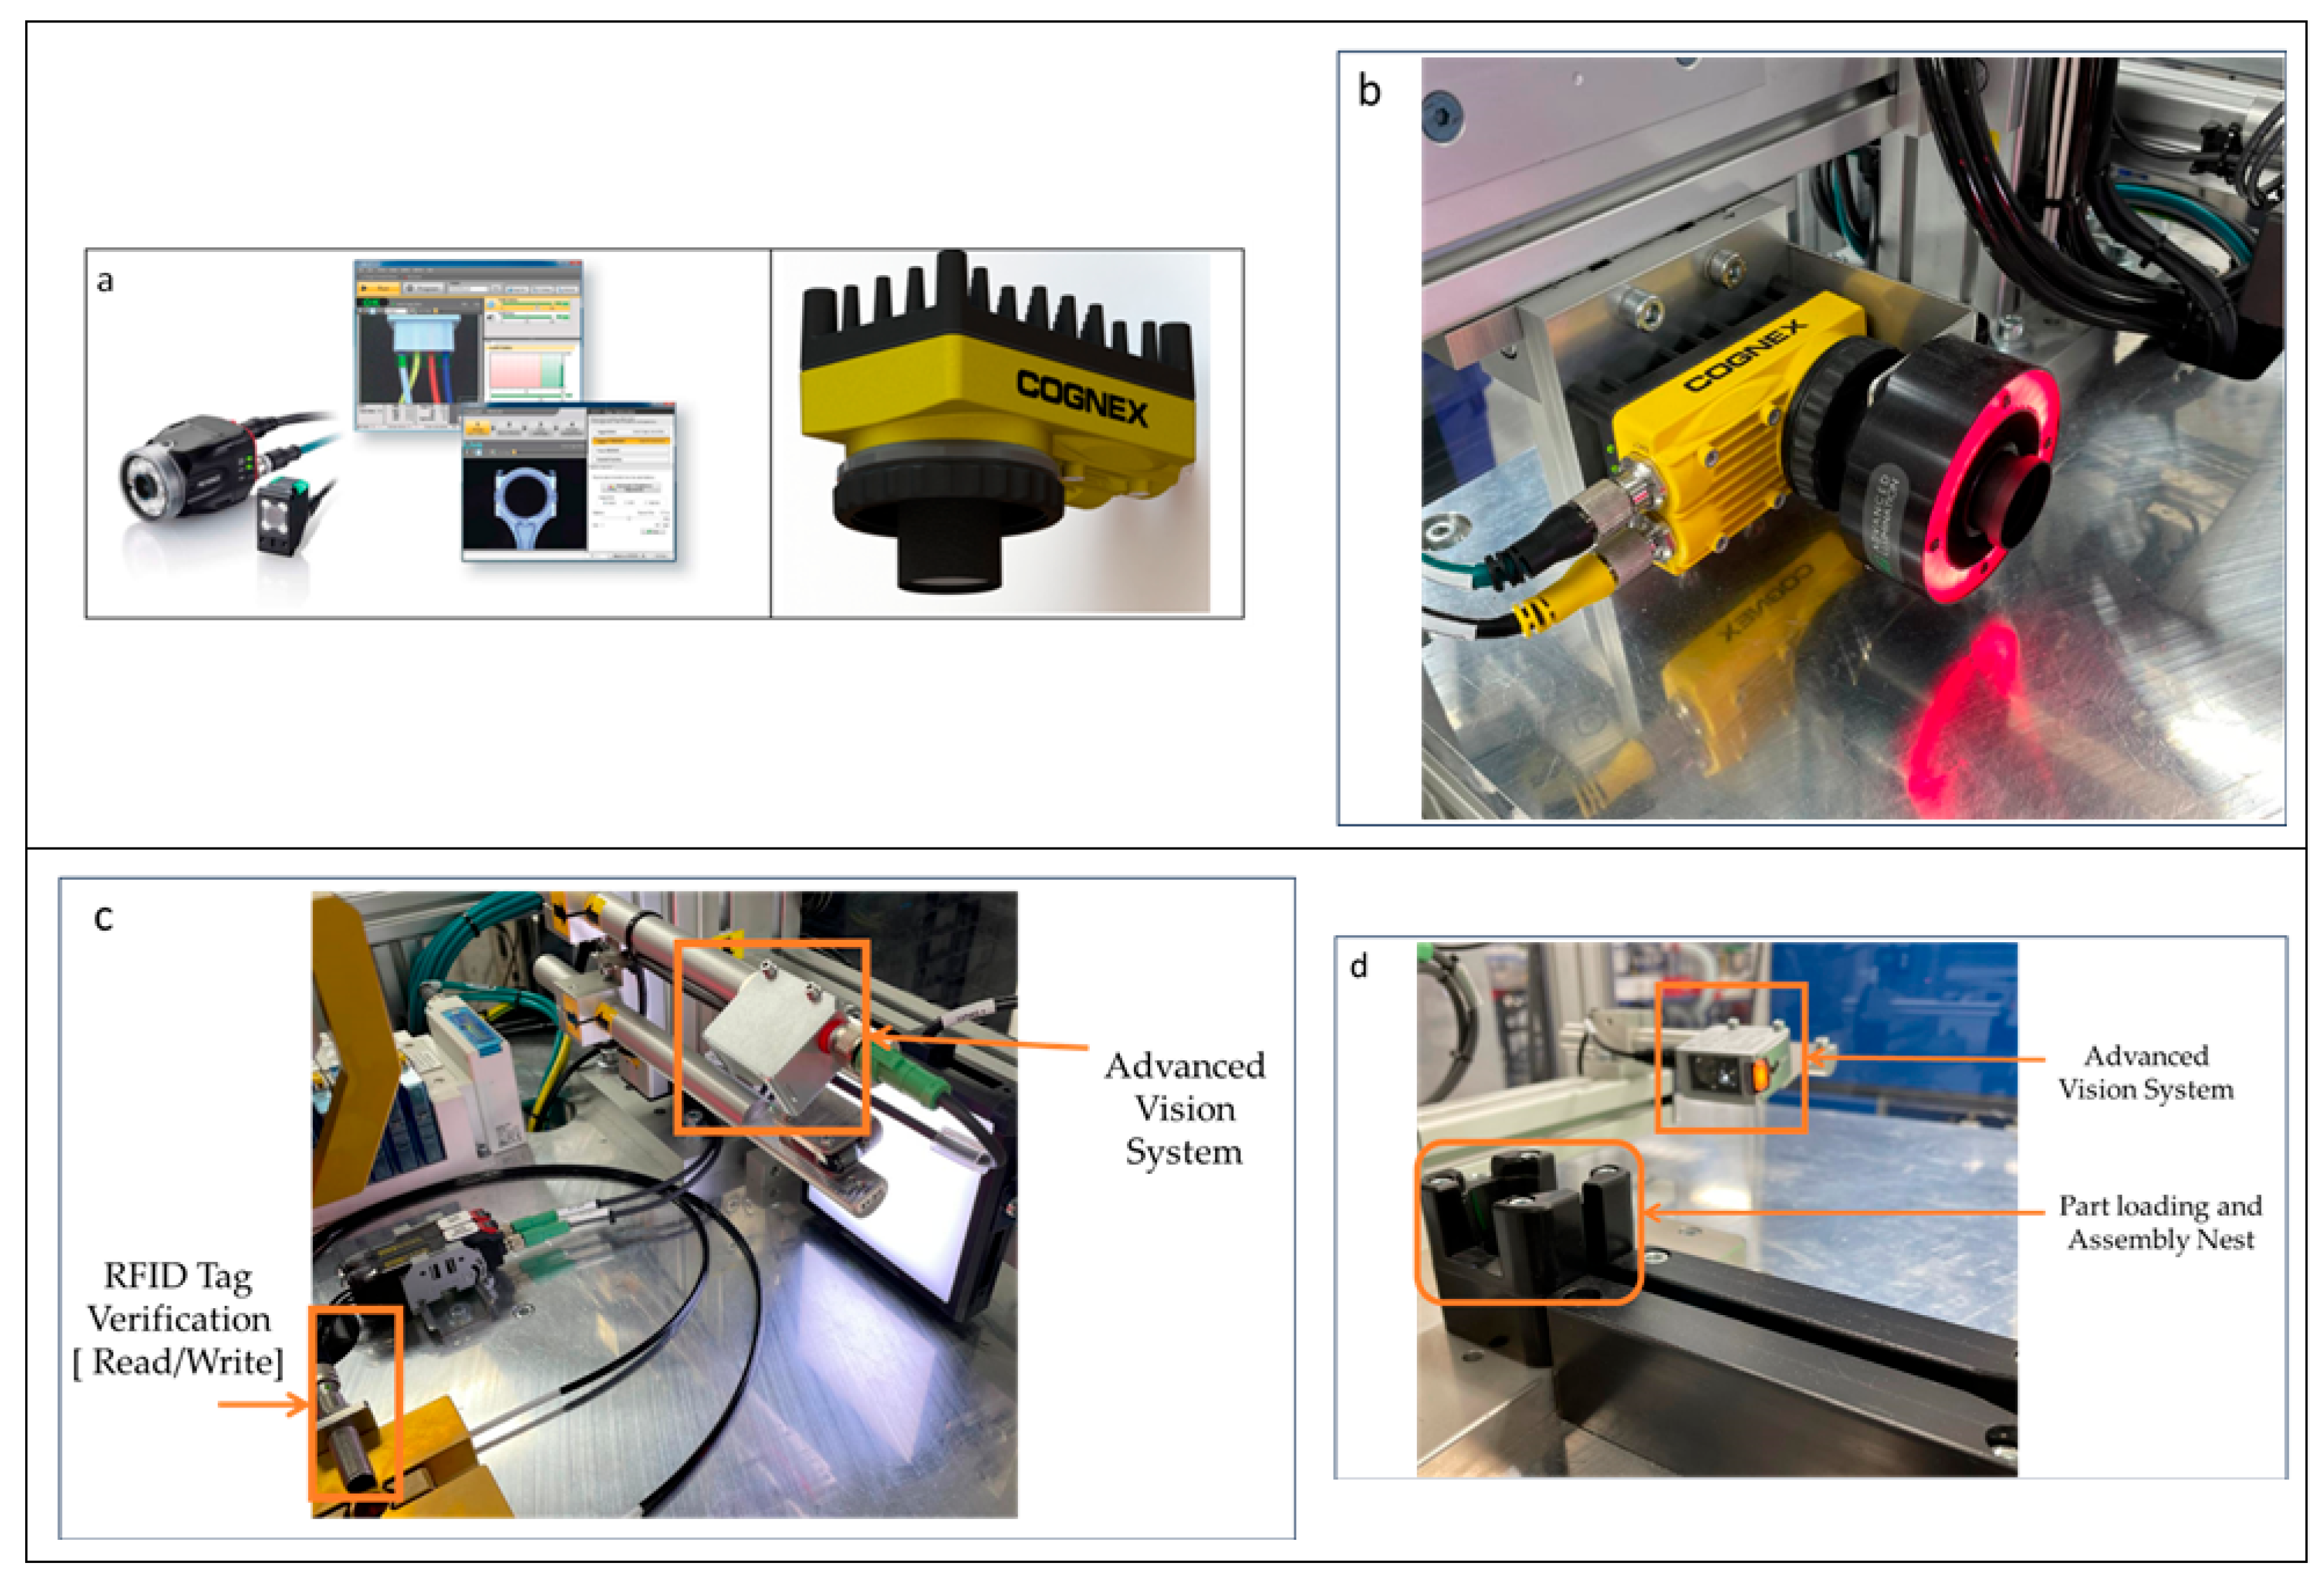
The systems used in this work include Keyence IV-HG (Osaka, Japan) vision sensors and Cognex In-Sight (Natick, MA, USA) cameras, as shown in Figure 3.
Figure 3.
Machine vision systems used in the implemented assembly line: (a) Keyence IV-HG vision sensor interface and hardware; (b) Cognex In-Sight camera integrated into the assembly station; (c) RFID tag verification and advanced vision system setup; (d) Part loading and assembly inspection configuration.
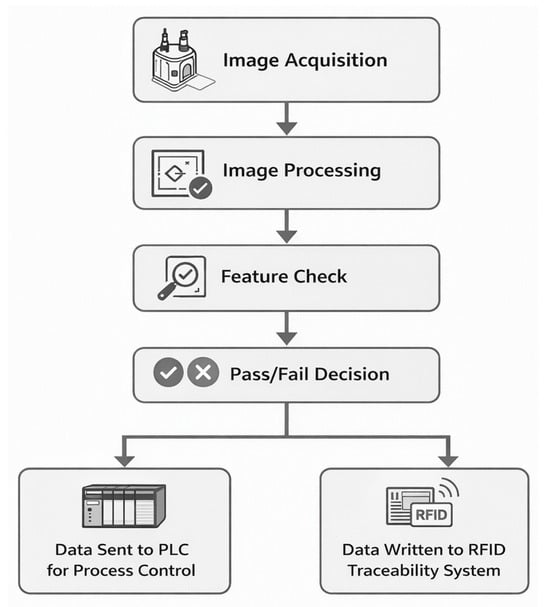
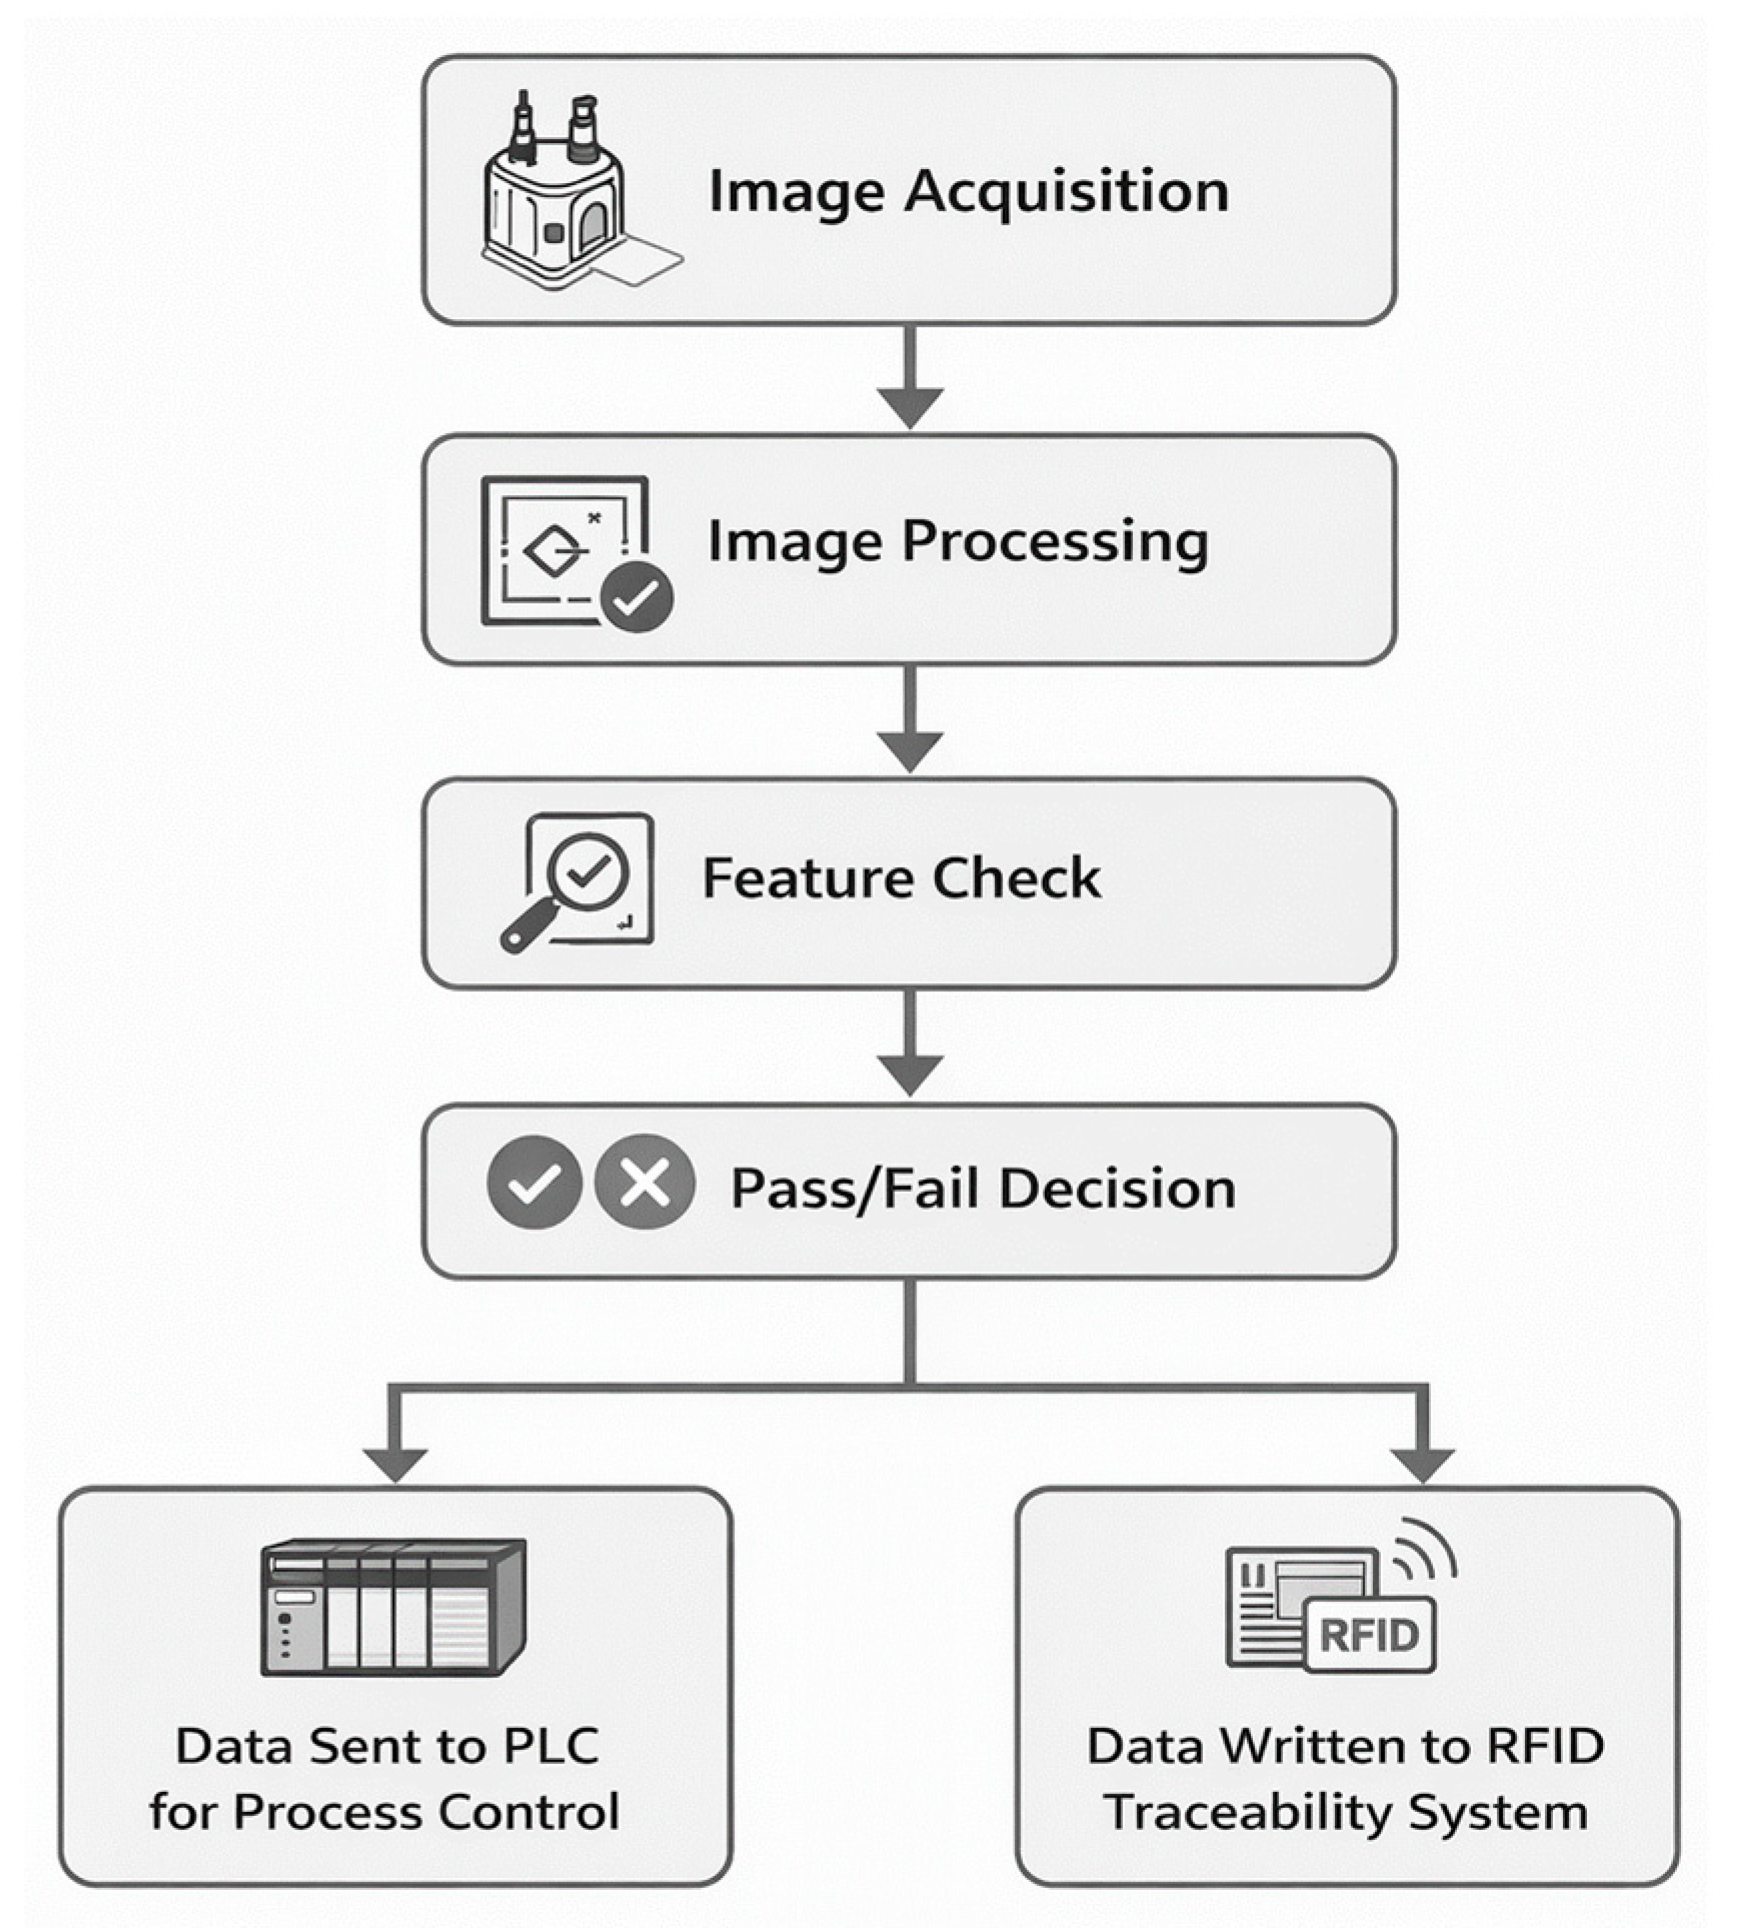
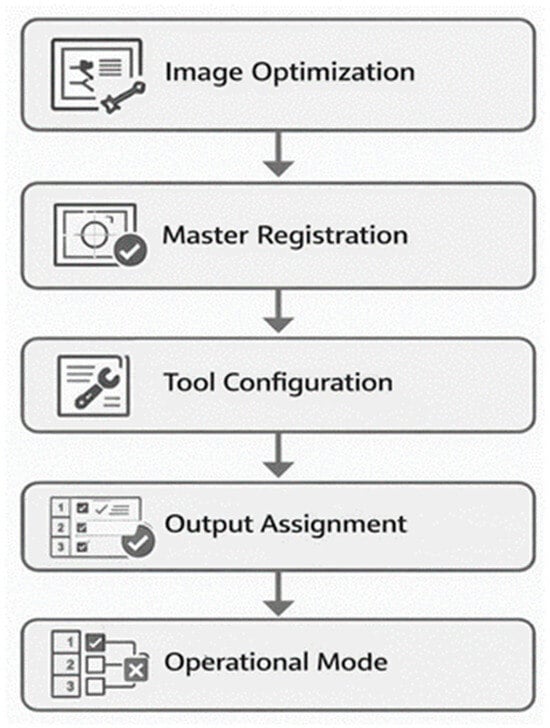
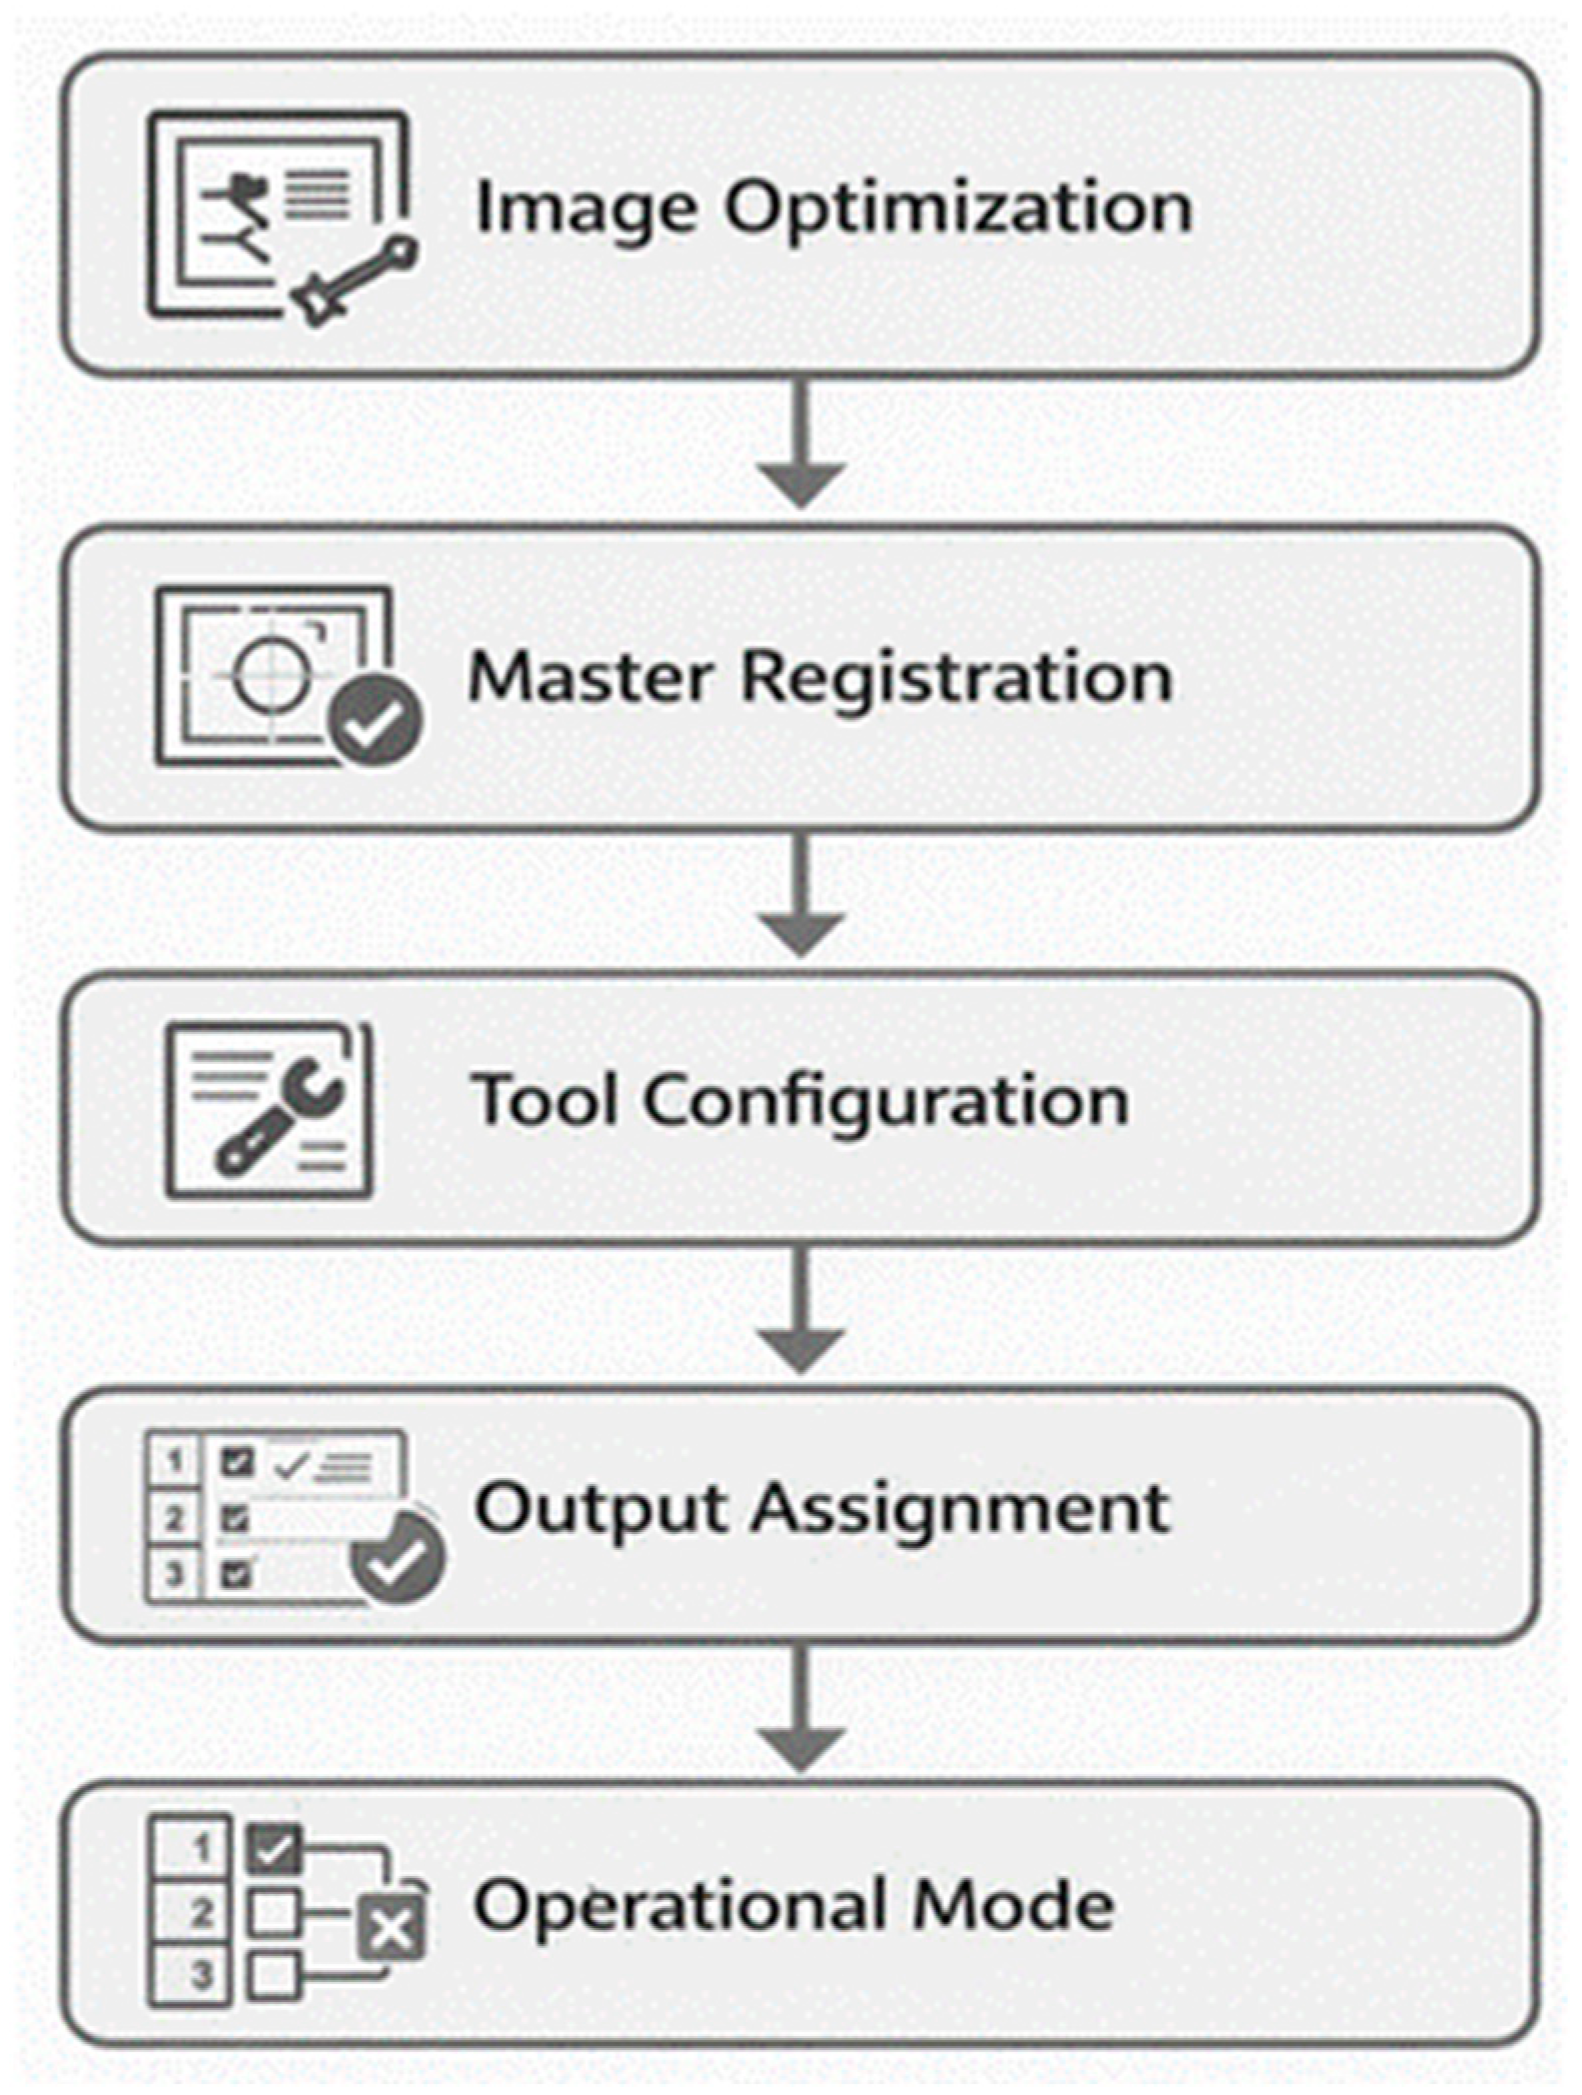
For each station, we set up a reference image that represents a correct assembly. During operation, the system captures an image of each unit and compares it with this reference. The inspection process includes image acquisition, processing, and generating a pass or fail output. This workflow is shown in Figure 4 and Figure 5.
Figure 4.
Process flow of machine vision inspection as implemented in the proposed system.
Figure 5.
Configuration and operation workflow of the vision system adapted for the assembly line.
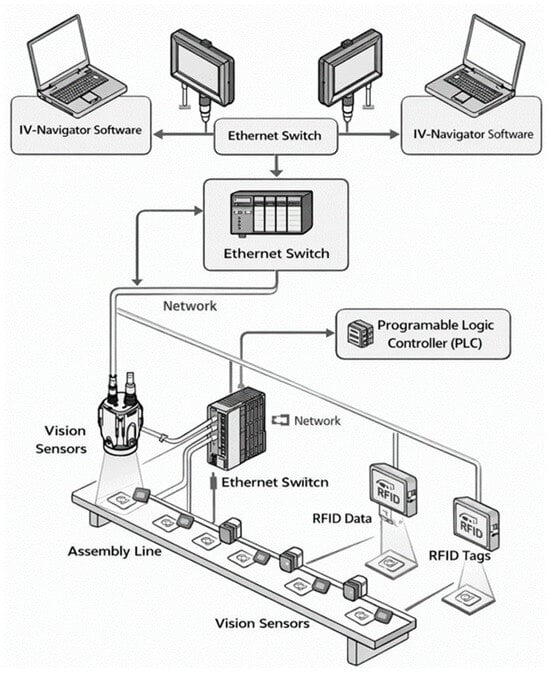
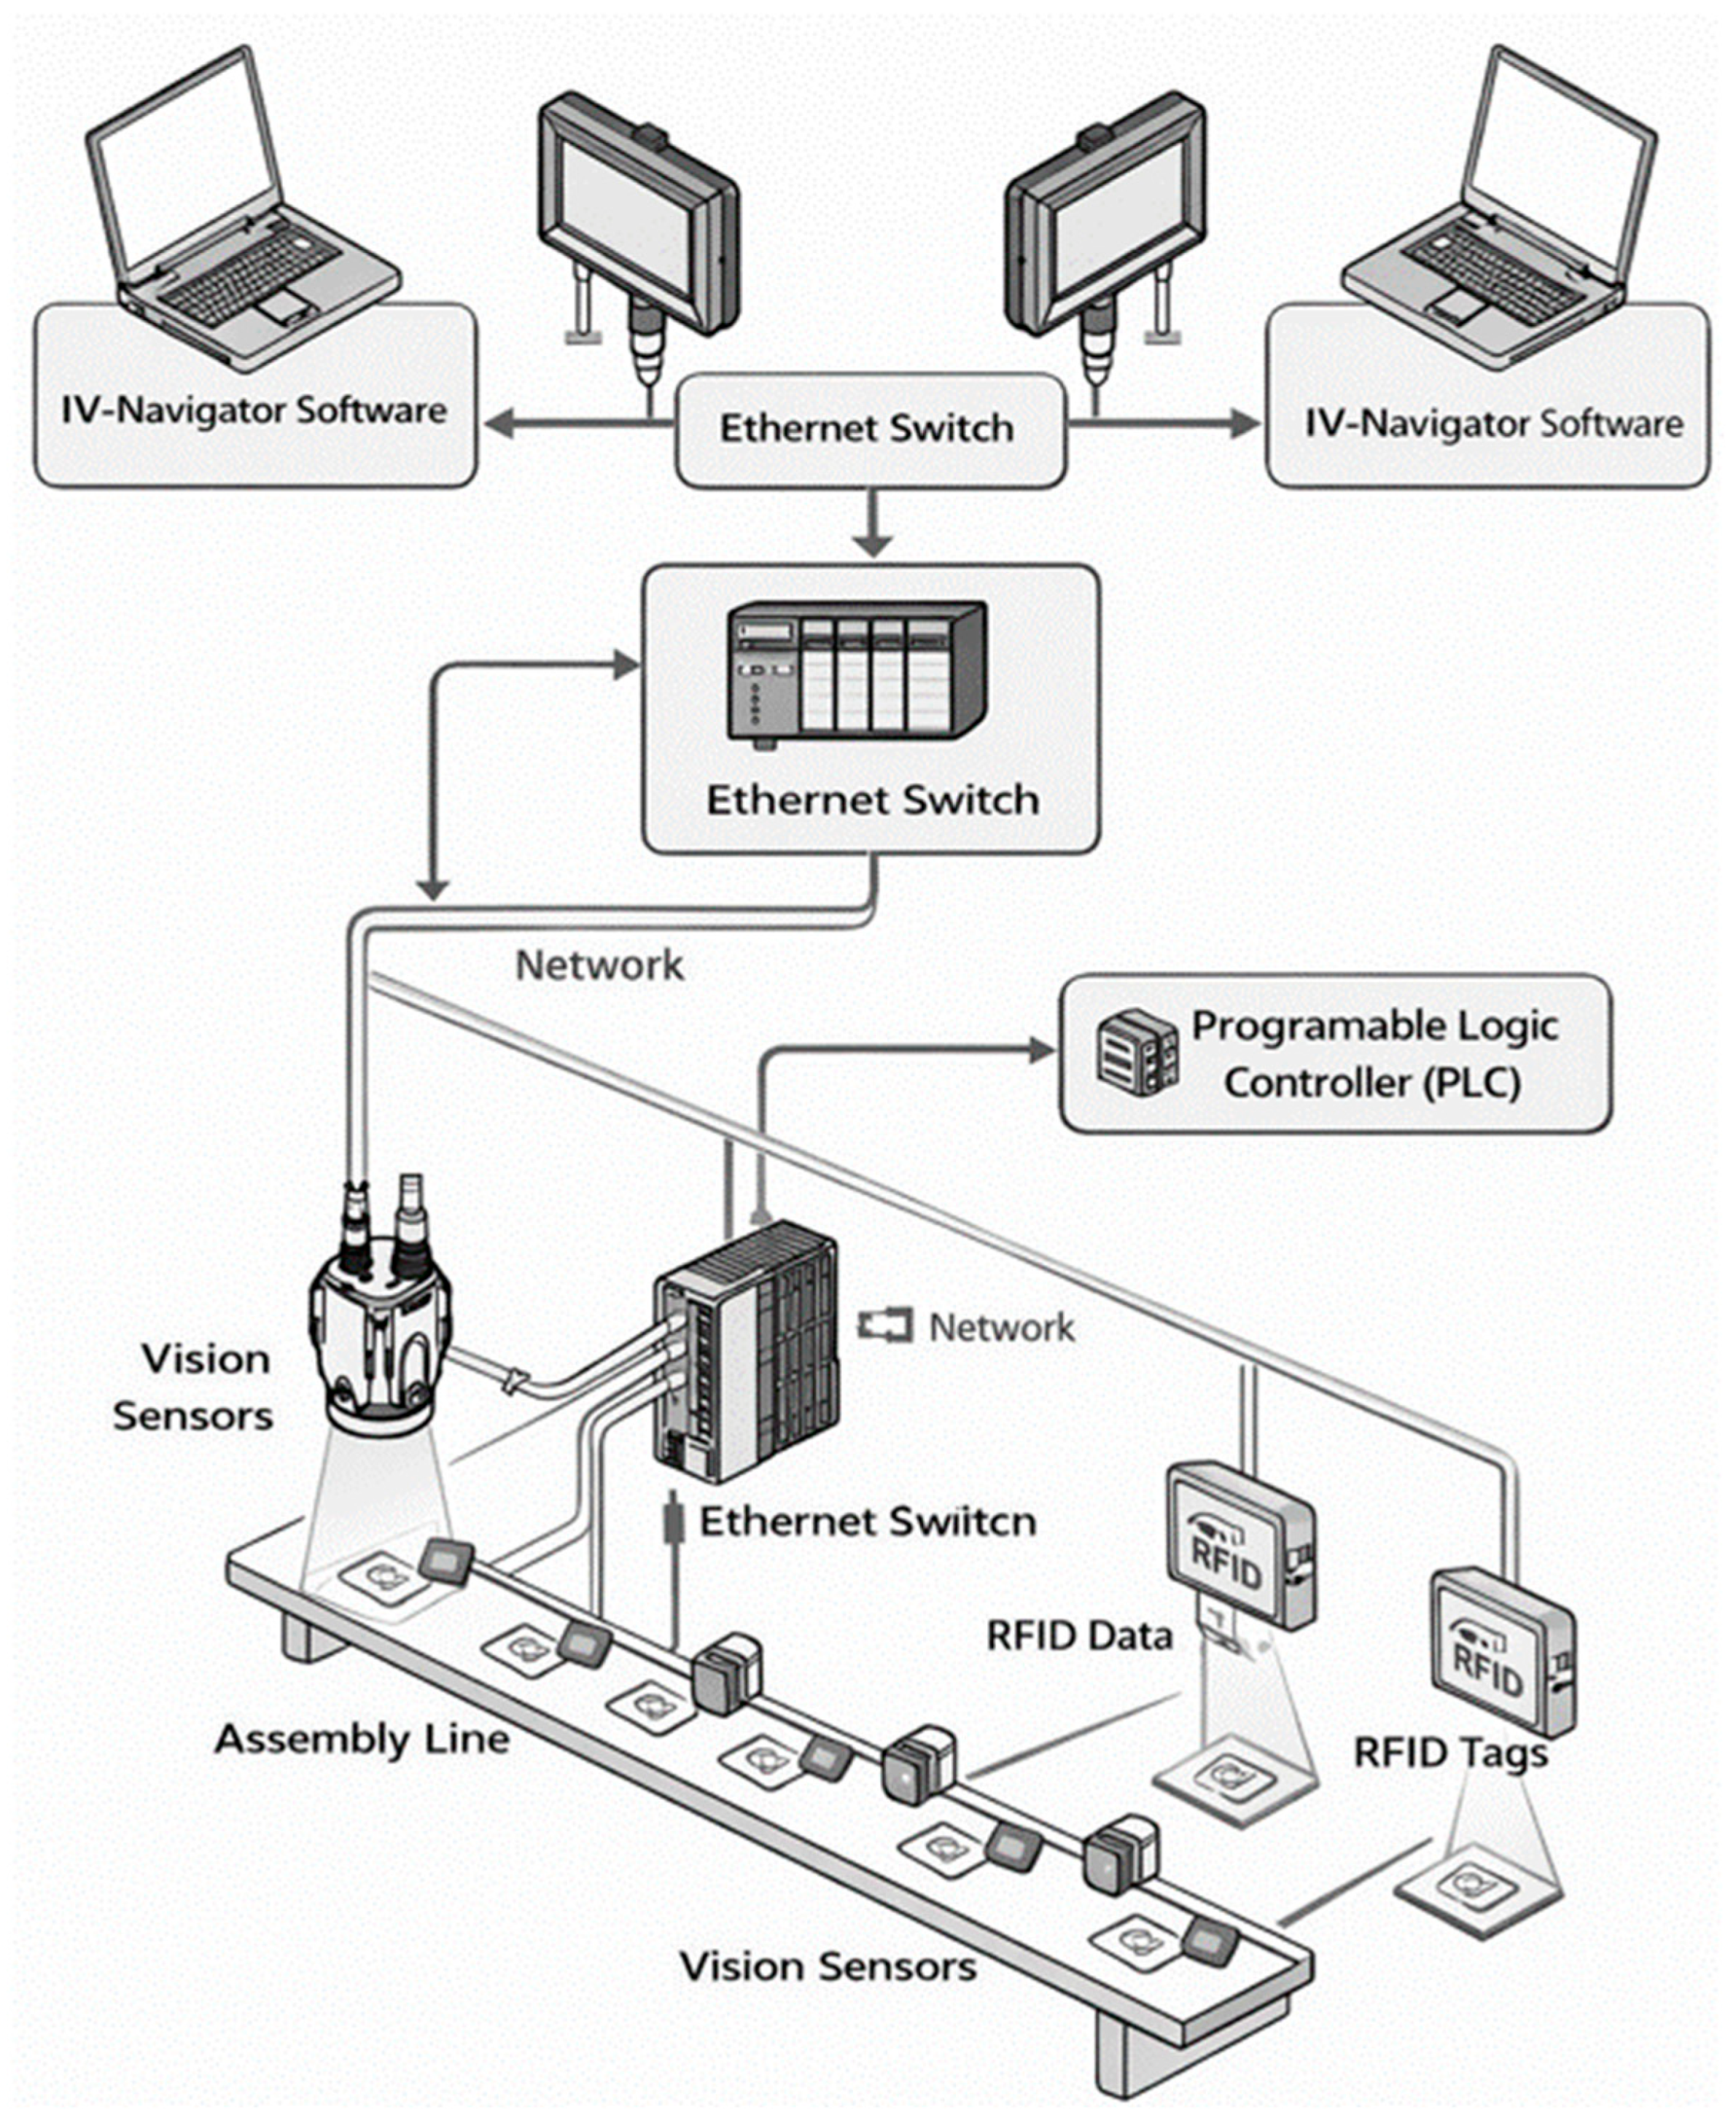
System setup is presented in Figure 6.
Figure 6.
Integration of vision systems with network infrastructure and monitoring tools in the implemented setup.
When a defect such as a missing component or incorrect placement is detected by the system, it then generates a fail signal. In this study, we directly connected this output to both the PLC and the RFID system. This way, the inspection result is not only used locally at the station but also becomes part of the product’s record and affects the next steps in the process.
2.4. System Integration and Control Architecture
To connect all components, we relied on a central PLC as the main controller. Each station runs its own inspection and RFID tasks, but instead of staying local, all results are sent to the PLC. We programmed it to read signals from both the vision systems and RFID readers and then decide whether the unit can move forward. In this way, the inspection results directly control how the product moves through the line.
The system operates using a finite-state control logic, where each unit is associated with a processing state that is updated at every station. The primary states include not processed, pass, and fail, which are stored and updated through the RFID tag as the unit progresses through the assembly line.
At each station, the PLC evaluates both the stored status from previous stations and the current inspection result from the vision system. A station is enabled only when all upstream operations have been completed successfully and the current inspection system is ready. If both conditions indicate a pass, the operation proceeds and the unit status is updated accordingly. If any condition fails, the unit is blocked at that station and marked as FAIL.
To ensure robust operation, a fail-safe approach is applied. In cases where required data are missing, such as an unreadable RFID tag or unavailable inspection signal, the system defaults to a fail condition and prevents the unit from progressing. This ensures that no unit proceeds without verified inspection and traceability information. Fault handling is implemented at the station level, where abnormal conditions result in a localized stop rather than a full-line shutdown, allowing the system to maintain overall operational continuity.
In the event of recoverable faults, such as unsuccessful RFID reads or temporary communication interruptions, the system places the unit in a controlled hold state at the station level and prompts operator intervention through the HMI. Authorized personnel can re-initiate RFID reading or inspection cycles under controlled conditions. During the pilot studies, only minor recoverable events were observed, and no persistent system-level failures affected operation.
The overall setup, including how RFID, vision systems, and the PLC are connected, is shown in Figure 1 in Section 2.1. In this architecture, tracking, inspection, and control are not treated as separate functions. Instead, they work together as part of a single system.
This architecture ensures that defects are handled at the point of occurrence, preventing defective units from progressing further in the assembly process and reducing unnecessary processing.
While machine vision inspection and RFID-based traceability are widely used in smart manufacturing, these technologies are typically implemented as separate subsystems for inspection and tracking. In contrast, the proposed approach integrates machine vision, RFID, and PLC-based control into a unified closed-loop architecture, where inspection results directly drive process decisions at the station level. In this system, RFID is not used only for tracking, but as an active element in process control, carrying unit-level state information that is continuously updated and used by the PLC to enforce interlock conditions. This enables real-time defect containment at the point of occurrence, rather than post-process detection. The contribution of this work therefore lies in the system-level integration and control logic that connects inspection, traceability, and process execution into a single coordinated framework validated under real production conditions.
2.5. Data Collection and Analytics
While the line was running, we collected data at every station. This included inspection results from the vision systems, RFID updates, timestamps, and basic station information. All of this was first handled by the PLC during operation.
Since the PLC cannot store large amounts of data for long periods, we set up a simple transfer to a central server. At regular intervals, the data was pushed out of the PLC and stored externally so it could be kept and analyzed later. From there, we used a reporting tool to look at the data in a more practical way.
Because each unit carries a unique RFID tag, we were able to follow each product through the entire process. For any given unit, we could see where it passed, where it failed, and at which station the issue occurred. This made it easier to understand what was happening on the line without relying only on operator notes or local records.
2.6. Assembly Line Validation
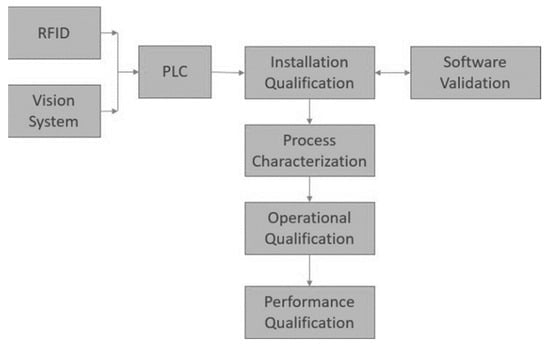
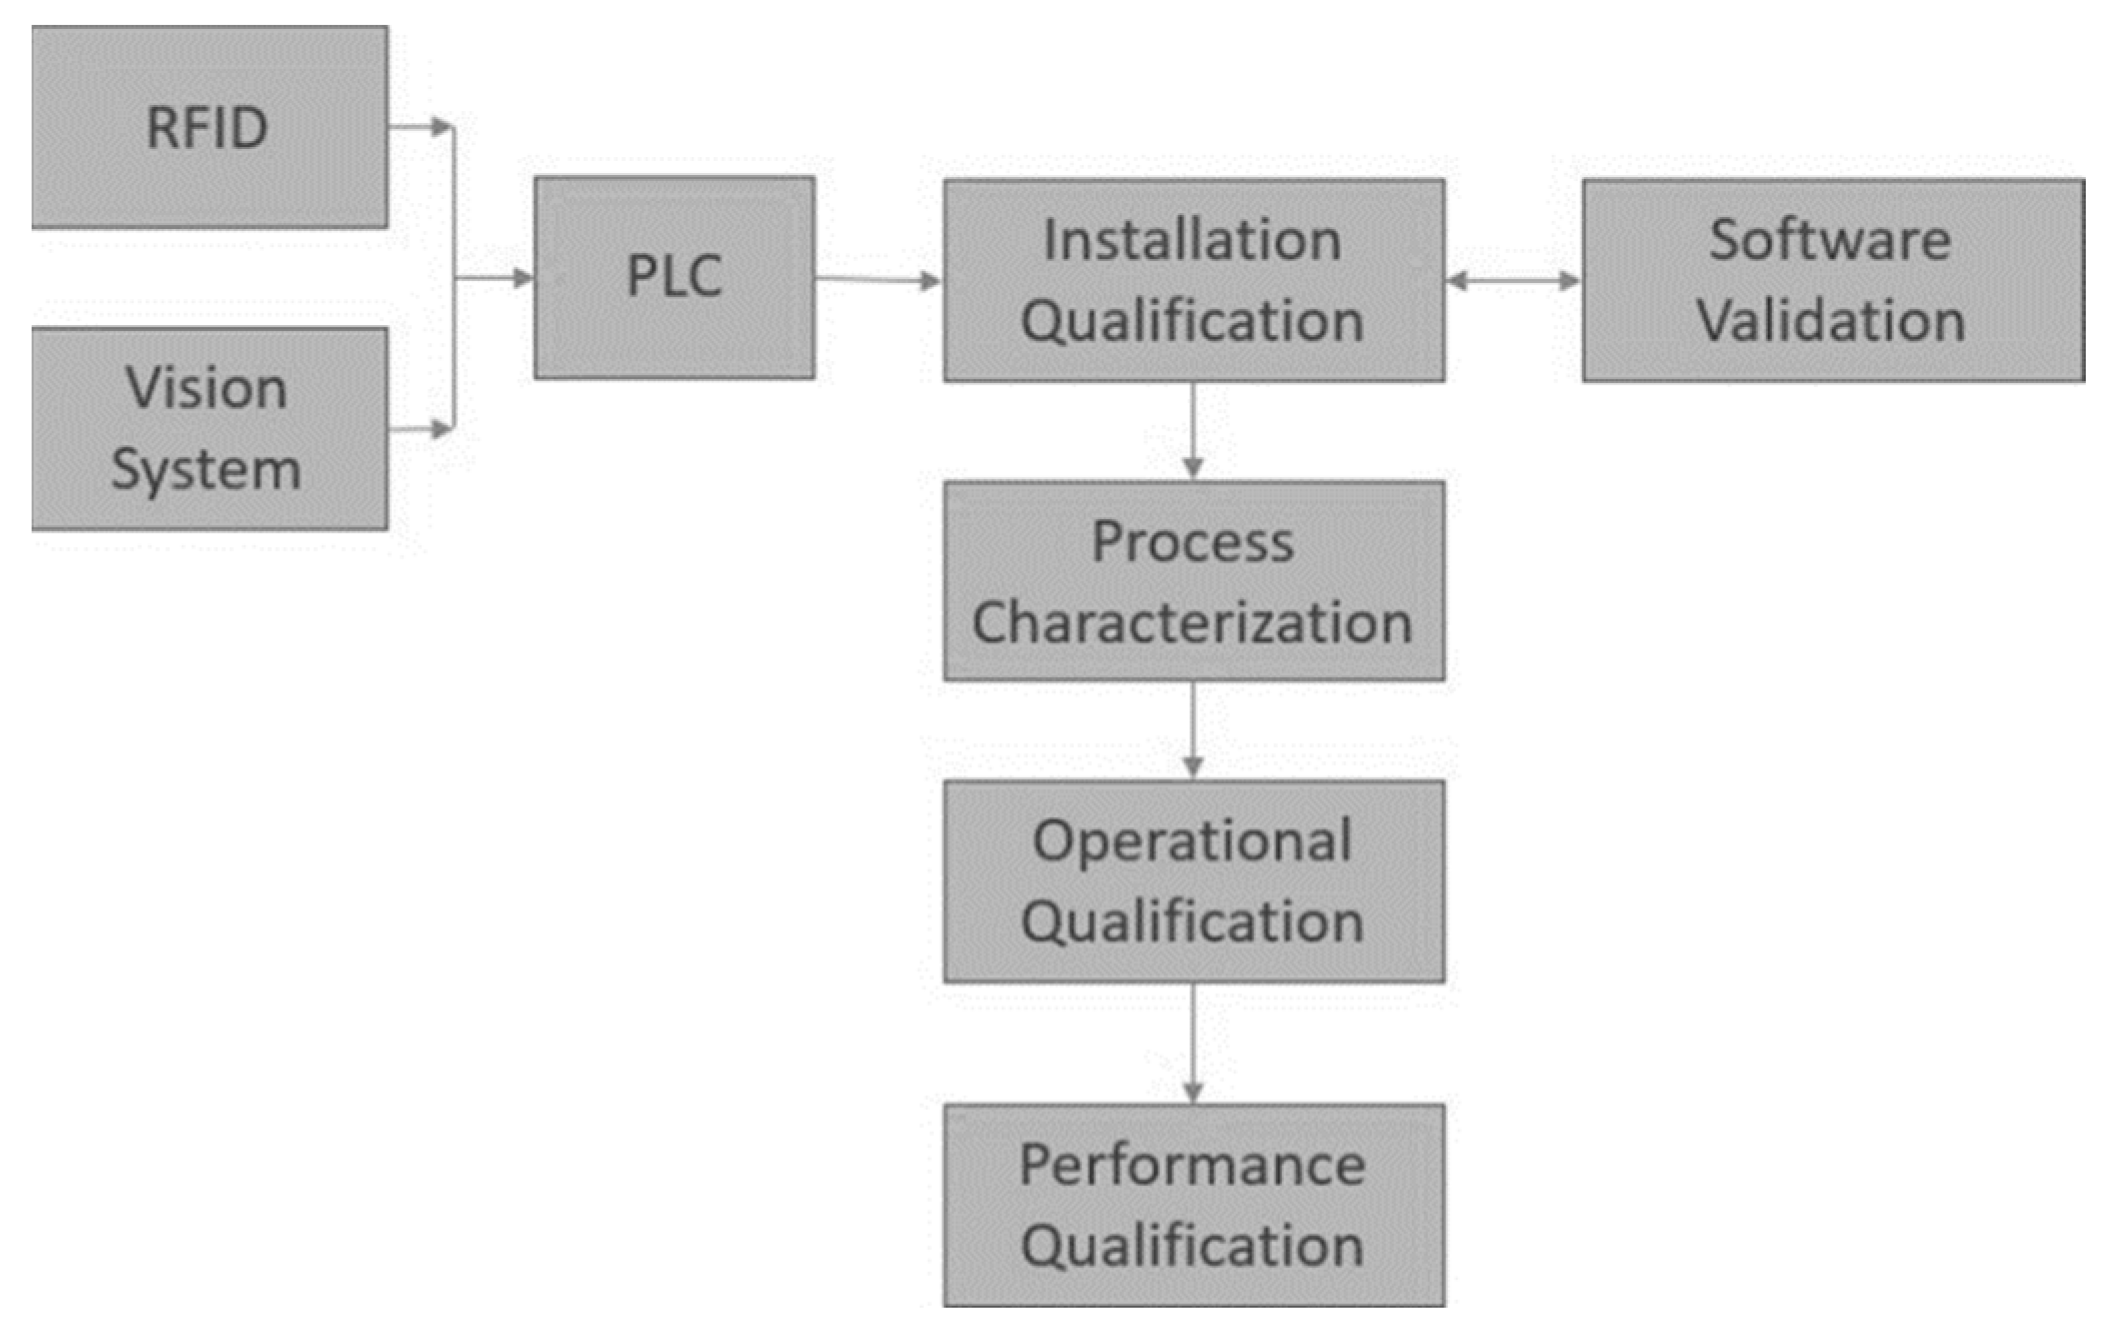
To ensure the reliability and performance of the integrated assembly system, including the machine vision inspection component, a structured validation approach was implemented following industry-standard qualification practices, namely Installation Qualification (IQ), Operational Qualification (OQ), and Performance Qualification (PQ).
During IQ, all system components including vision sensors (Keyence IV-HG), camera-based systems (Cognex In-Sight), lighting configurations, RFID hardware, and PLC interface were verified to be installed according to design specifications. Communication between subsystems (vision–PLC–RFID) was also validated to ensure proper data exchange and synchronization. The system was evaluated under controlled conditions using predefined inspection criteria such as component presence, orientation, and color verification. Known reference samples were introduced to confirm that inspection outputs were correctly generated and transmitted to the PLC, and that corresponding RFID updates and control actions were executed as intended.
To further establish the reliability of the machine vision system, a binary attribute Measurement System Analysis (MSA) was performed using a controlled dataset of conforming (PASS) and non-conforming (FAIL) samples. Conforming samples represented correctly assembled units, while non-conforming samples included intentionally introduced defects such as missing components, misalignment, and incorrect configurations. Each sample was evaluated multiple times to assess classification performance and repeatability.
The system performance was assessed using standard attribute inspection metrics, including false acceptance rate (FAR), false rejection rate (FRR), and repeatability. These metrics are commonly used in attribute inspection systems to evaluate classification performance. The validation results showed no misclassification, with all conforming samples accepted and all non-conforming samples rejected, and no observed false positives or false negatives. Additionally, repeated trials confirmed high repeatability, indicating stable and deterministic system behavior.
The PQ phase was conducted under actual production conditions to verify long-term system stability and repeatability under continuous operation. No false rejection events were observed during production that resulted in unnecessary scrap or operational interruption. The system was tested during continuous operation, incorporating real-world variables such as operator interaction, cycle time variation, and environmental factors typical of medical device assembly environments. These results confirm that the machine vision system meets industrial expectations for accuracy and reliability in attribute-based inspection. Furthermore, integration with PLC-based interlock logic ensures that inspection outcomes are enforced in real time, preventing defective units from progressing through the assembly process. The overall validation process is shown in Figure 7.
Figure 7.
Assembly cell validation process flow.
After completing validation, pilot production runs were conducted to evaluate system performance in comparison with the previous manual setup.
3. Results
3.1. Pilot Study 1
To rigorously evaluate the performance of the integrated architecture, the study was designed as a controlled comparative evaluation between two distinct production configurations. The control condition represents the traditional assembly process, which relies on manual assembly operations and operator-based visual inspection, with most defects identified at the final functional testing stage. The experimental condition represents the proposed RFID–vision–PLC integrated system. In this configuration, in-process machine vision inspection, RFID-based unit-level traceability, and PLC-driven interlock logic enable real-time defect detection, preventing nonconforming units from progressing through the assembly line.
To ensure a valid and unbiased comparison, both pilot studies were conducted under strictly controlled and consistent boundary conditions. As detailed in Table 1, uniform criteria were maintained across product type, process flow, operating duration, and environmental factors. The only intentional variable between the two conditions is the inspection and process control methodology, ensuring that any observed performance differences can be directly attributed to the proposed system.
Table 1.
Experimental design and boundary conditions for the comparative pilot studies.
While the sample sizes differ between configurations (400 vs. 500 units), all performance metrics were evaluated using normalized measures, including proportional scrap rate (%) and cost per unit. This normalization ensures comparability and eliminates bias arising from differences in production volume. Furthermore, formal statistical hypothesis testing (a two-proportion z-test) was employed to confirm that the observed differences are statistically significant. Finally, to further enhance methodological rigor, the study includes two independent pilot runs conducted under these comparable conditions, allowing for a clear assessment of the system’s repeatability and robustness.
After completing system validation, the first pilot study was carried out to evaluate how the upgraded system performs under actual production conditions. The goal was to directly compare the upgraded system with the previous manual inspection process under real production conditions.
In the original setup, inspection was carried out manually at different stations. Operators checked the parts visually, followed by confirmation of the assembly steps, and recorded the results at each station. This approach worked; however, it also had clear limitations. Because inspection depended on the operator, the results were not always consistent, and some defects were only detected later in the process. In many cases, a unit could move through several stations before a problem was noticed.
This has a direct operational impact. By the time the defect is detected, the product already has additional components assembled. That means more material loss and higher scrap cost.
With the upgraded system, this behavior changed. At key stations, machine vision systems were used to verify assembly conditions. With these machine vision systems in place, we checked the presence of parts, placement of components, and certain assembly requirements in a standardized way. At the same time, RFID was used to track each unit and store its status at every station.
The important difference here is not just inspection, but how the system reacts to inspection results.
When a defect is detected, that result is written to the RFID tag and passed to the PLC. The PLC then blocks the unit from moving to the next station. So instead of detecting problems later, the system stops them exactly where they occur. This directly affects scrap.
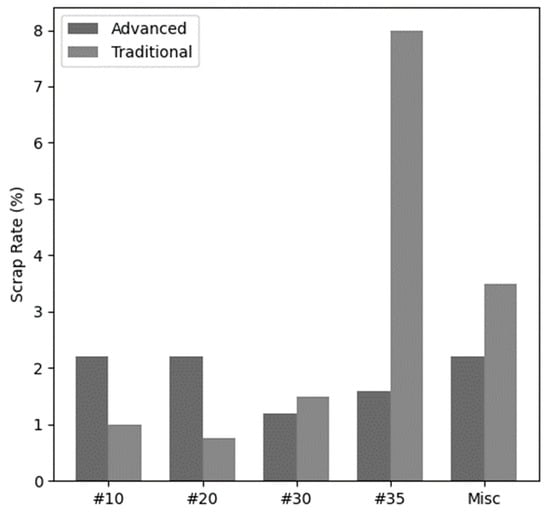
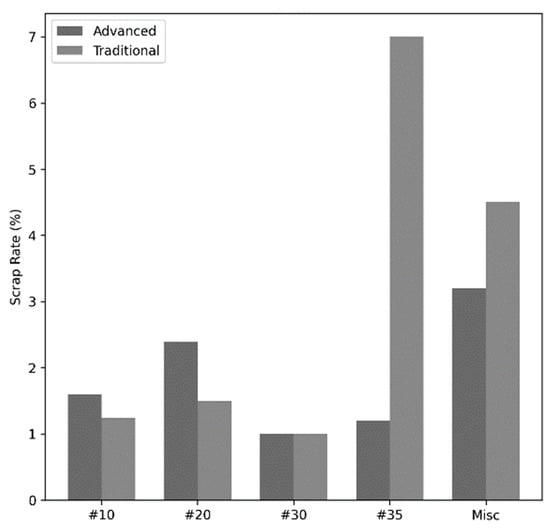
Based on the results presented in Table 2 and Figure 8, the upgraded system achieved a scrap cost reduction of 52.77% compared to the manual process.
Table 2.
Scrap comparison between the vision-guided RFID assembly system and the traditional assembly process (Pilot Study 1).
Figure 8.
Station-level scrap rate comparison between the advanced system and the traditional process (Pilot Study 1). Labels #10, #20, #30, and #35 represent assembly station identifiers.
Looking at the scrap distribution, the reduction is not coming from a single point. It is observed across the process. This is expected, because the system prevents defective units from accumulating additional value as they move forward.
The same trend is observed in scrap cost. As shown in Table 3, scrap cost decreases significantly with the upgraded system. This is mainly because defects are detected earlier. Less material is wasted per defective unit, and fewer processing steps are lost.
Table 3.
Scrap cost comparison between the advanced system and the traditional process (Pilot Study 1).
Another observation from this pilot study is inspection consistency. Vision systems apply the same inspection logic to every unit, and this setting removes operator-to-operator variability that was present in the manual setup. Also, traceability improves as each unit carries its own history through the RFID system. The full process history is available for every product at each step, rather than checking separate records at each station.
3.2. Pilot Study 2
After observing the results from the first pilot study, a second pilot study was carried out to verify whether the same improvements could be achieved under a different production run. The intention here was not to change the setup, but to repeat the evaluation under similar conditions and confirm that the behavior of the system remains consistent.
The same production line was used, and the comparison again was made between the upgraded system and the previous manual inspection process. The structure of the study remained the same to ensure that the results could be directly compared.
In the manual setup, the same limitations observed in the first pilot study were still present. Inspection was carried out by operators at different stations, and although the process was well understood, it still depended on human judgment. This again resulted in additional material being added to defective units, increasing both scrap and wasted processing effort.
With the upgraded system in place, the same inspection and control logic used in the first study was applied. Machine vision systems were again used at selected stations to verify assembly conditions, and RFID was used to track each unit and store inspection results throughout the process. The PLC continued to act as the central decision point, using inspection results to control whether a unit could move forward.
The system behaved the same way as in the first study. When a defect was detected at a station, the result was written directly to the RFID tag, and the PLC stopped the unit from moving any further. In other words, the product was stopped right where the issue happened, instead of being caught later after going through more steps.
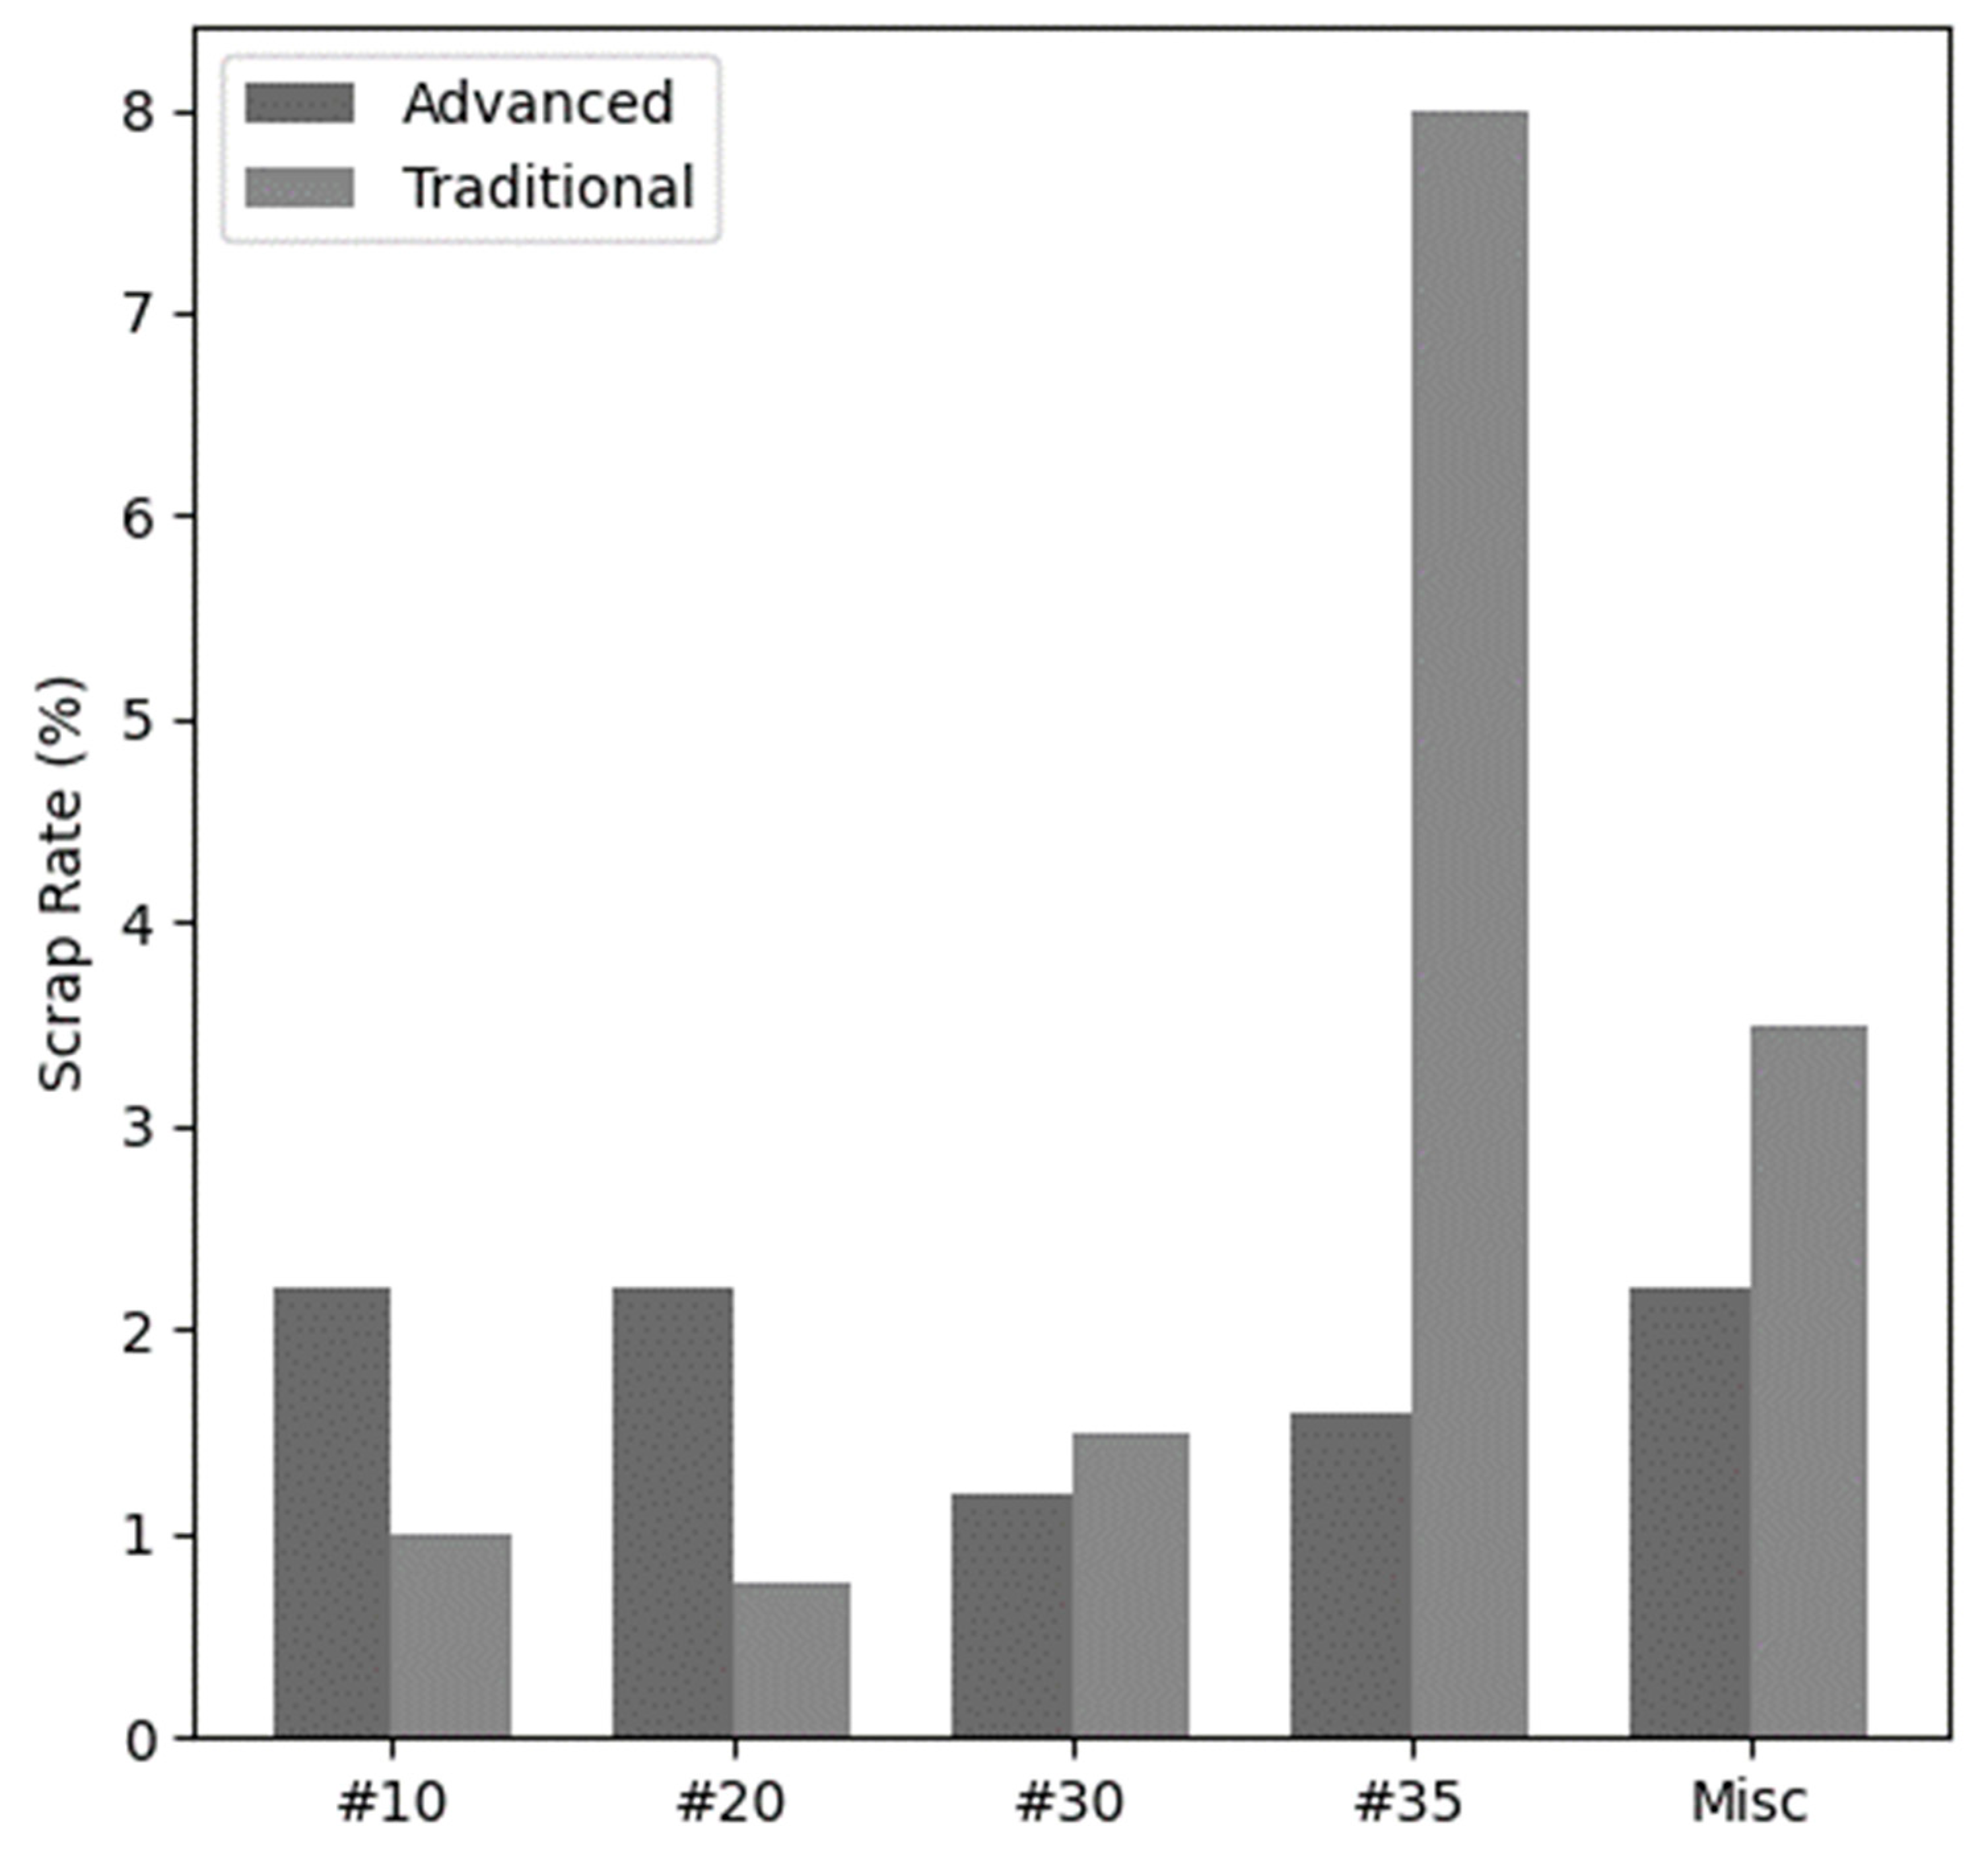
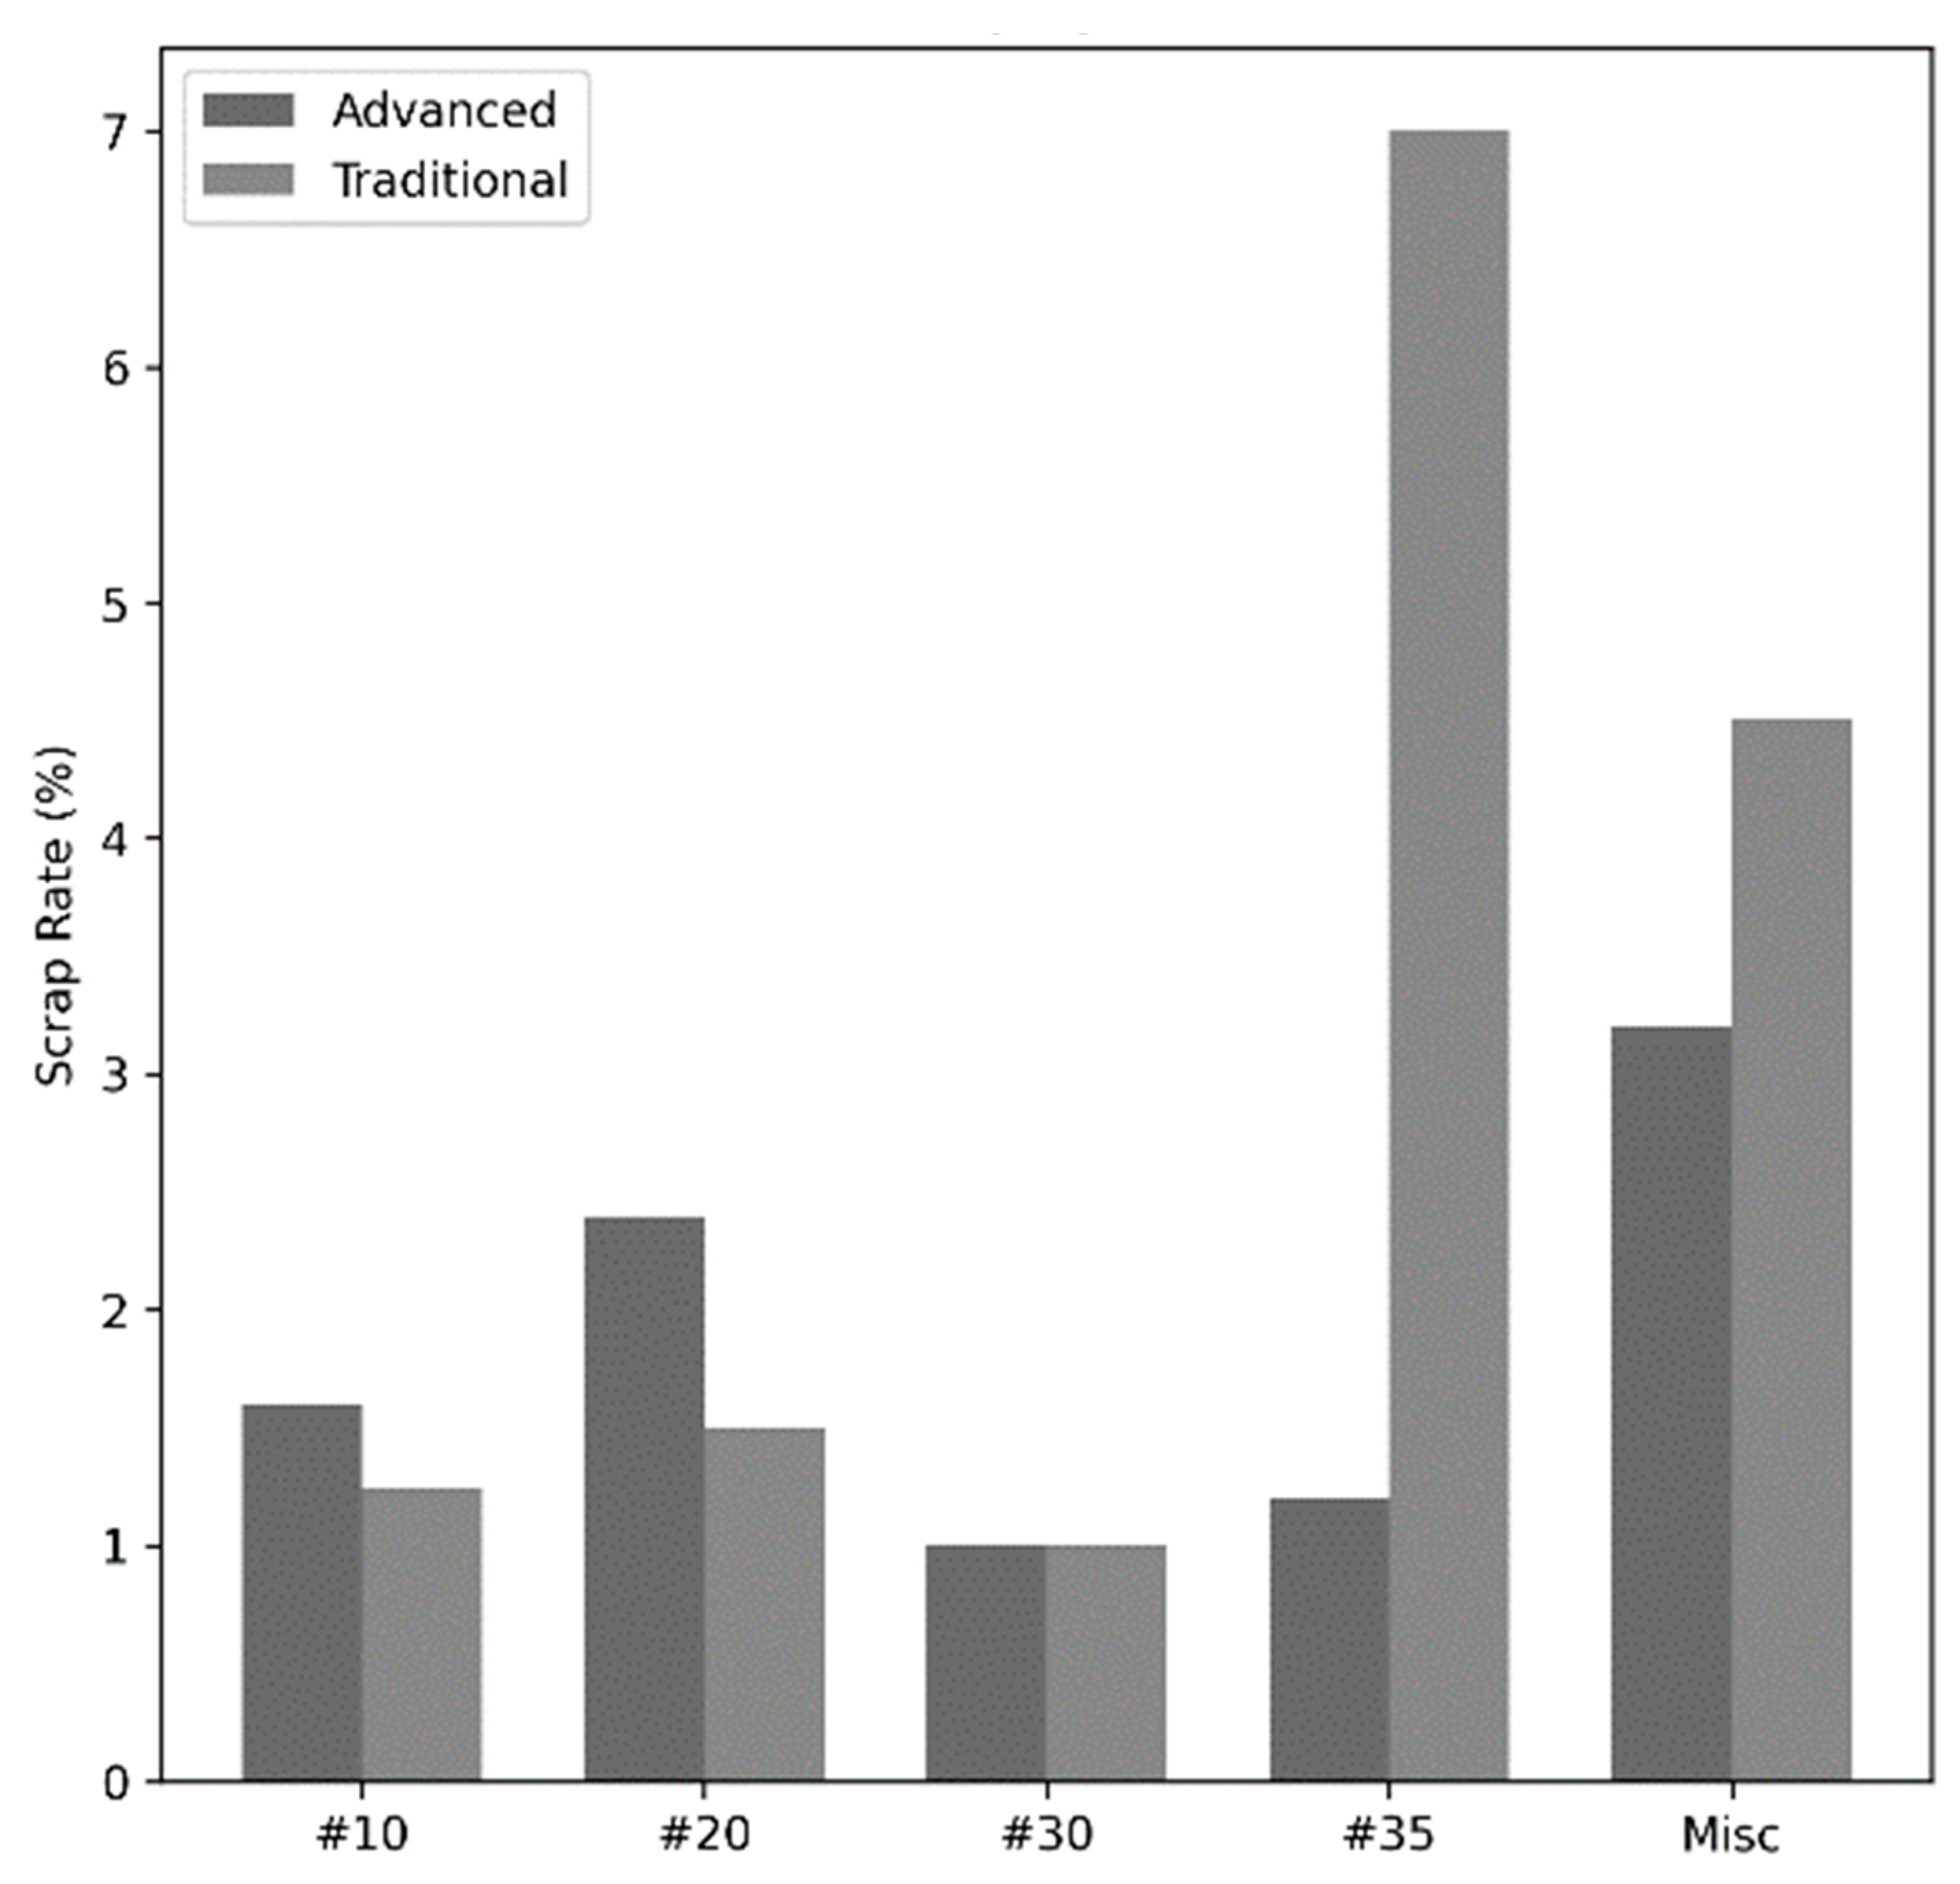
This is reflected clearly in the scrap results. As seen in Table 4 and Figure 9, the upgraded system achieved a scrap cost reduction of 53.23% compared to the manual process. This value is very close to the result obtained in the first pilot study, which indicates that the improvement is consistent across different production runs.
Table 4.
Scrap comparison between the vision-guided RFID assembly system and the traditional assembly process (Pilot Study 2).
Figure 9.
Station-level scrap rate comparison between the advanced system and the traditional process (Pilot Study 2). Labels #10, #20, #30, and #35 represent assembly station identifiers.
Looking more closely at the scrap data, the reduction is again distributed across the process rather than concentrated at a single station. This supports the idea that the system improves overall process behavior, not just a specific step.
A similar trend is observed for scrap cost. As shown in Table 5, the total scrap cost is significantly lower when the upgraded system is used. Since defects are detected earlier, less material is lost and fewer processing steps are wasted. This leads to a more efficient use of resources across the production line.
Table 5.
Scrap cost comparison between the advanced system and the traditional process (Pilot Study 2).
Another point observed during this study is the stability of inspection results. Since machine vision systems apply the same criteria to every unit, the inspection process becomes more predictable. The variability that was previously introduced by different operators is no longer present.
In addition, traceability remains consistent with the first study. Each unit is tracked throughout the entire process, and its status is updated at every station. As a result, each product has a complete record of its processing history. This record can be used for process tracking and documentation purposes when needed.
Overall, the second pilot study shows that the improvements observed in the first study are consistent. The system reduces scrap, improves inspection consistency, and provides better visibility into what is happening on the production line during real operation. These results confirm that the system consistently reduces scrap and improves process stability across different production runs.
3.3. Statistical Validation of Performance Metrics
To rigorously validate the performance improvements observed during the pilot studies and ensure the reliability of the findings, a comprehensive statistical analysis was conducted. Moving beyond basic descriptive metrics, formal hypothesis testing, confidence interval (CI) analysis, effect size evaluation, and variability assessments were applied to the production data from both Pilot Study 1 and Pilot Study 2.
A two-proportion z-test was utilized to compare the defect scrap rates between the traditional manual assembly process and the proposed RFID–vision–PLC integrated system. In Pilot Study 1, the implementation of the advanced system resulted in a reduction in the scrap rate from 14.75% to 9.40% (z = −2.47, p = 0.0134). Similarly, Pilot Study 2 demonstrated a reduction from 15.25% to 8.80% (z = −2.99, p = 0.0028). In both independent trials, the p-values fall well below the standard 0.05 significance threshold, confirming that the observed reductions in scrap rates are statistically significant.
To further substantiate these findings, 95% confidence intervals were calculated for the difference in proportions between the two manufacturing configurations. For Pilot Study 1, the 95% CI was [−9.67%, −1.03%], and for Pilot Study 2, it was [−10.8%, −2.1%]. Because neither interval includes zero, the results indicate that the improvements are statistically robust and not attributable to random process variation. Furthermore, the practical significance of these improvements was evaluated using Cohen’s h to measure effect size. The analysis yielded effect sizes of −0.165 and −0.210 for the respective pilot runs, representing a meaningful and highly relevant effect in the context of industrial manufacturing efficiency.
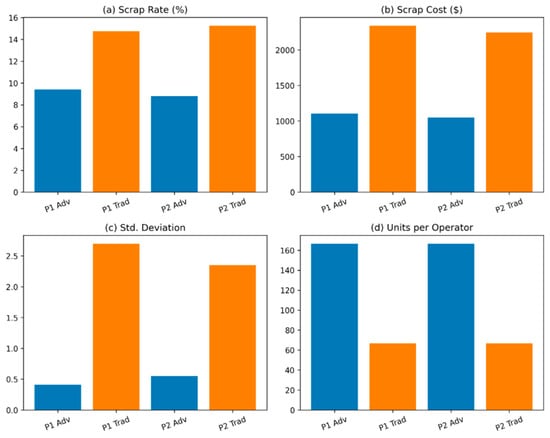
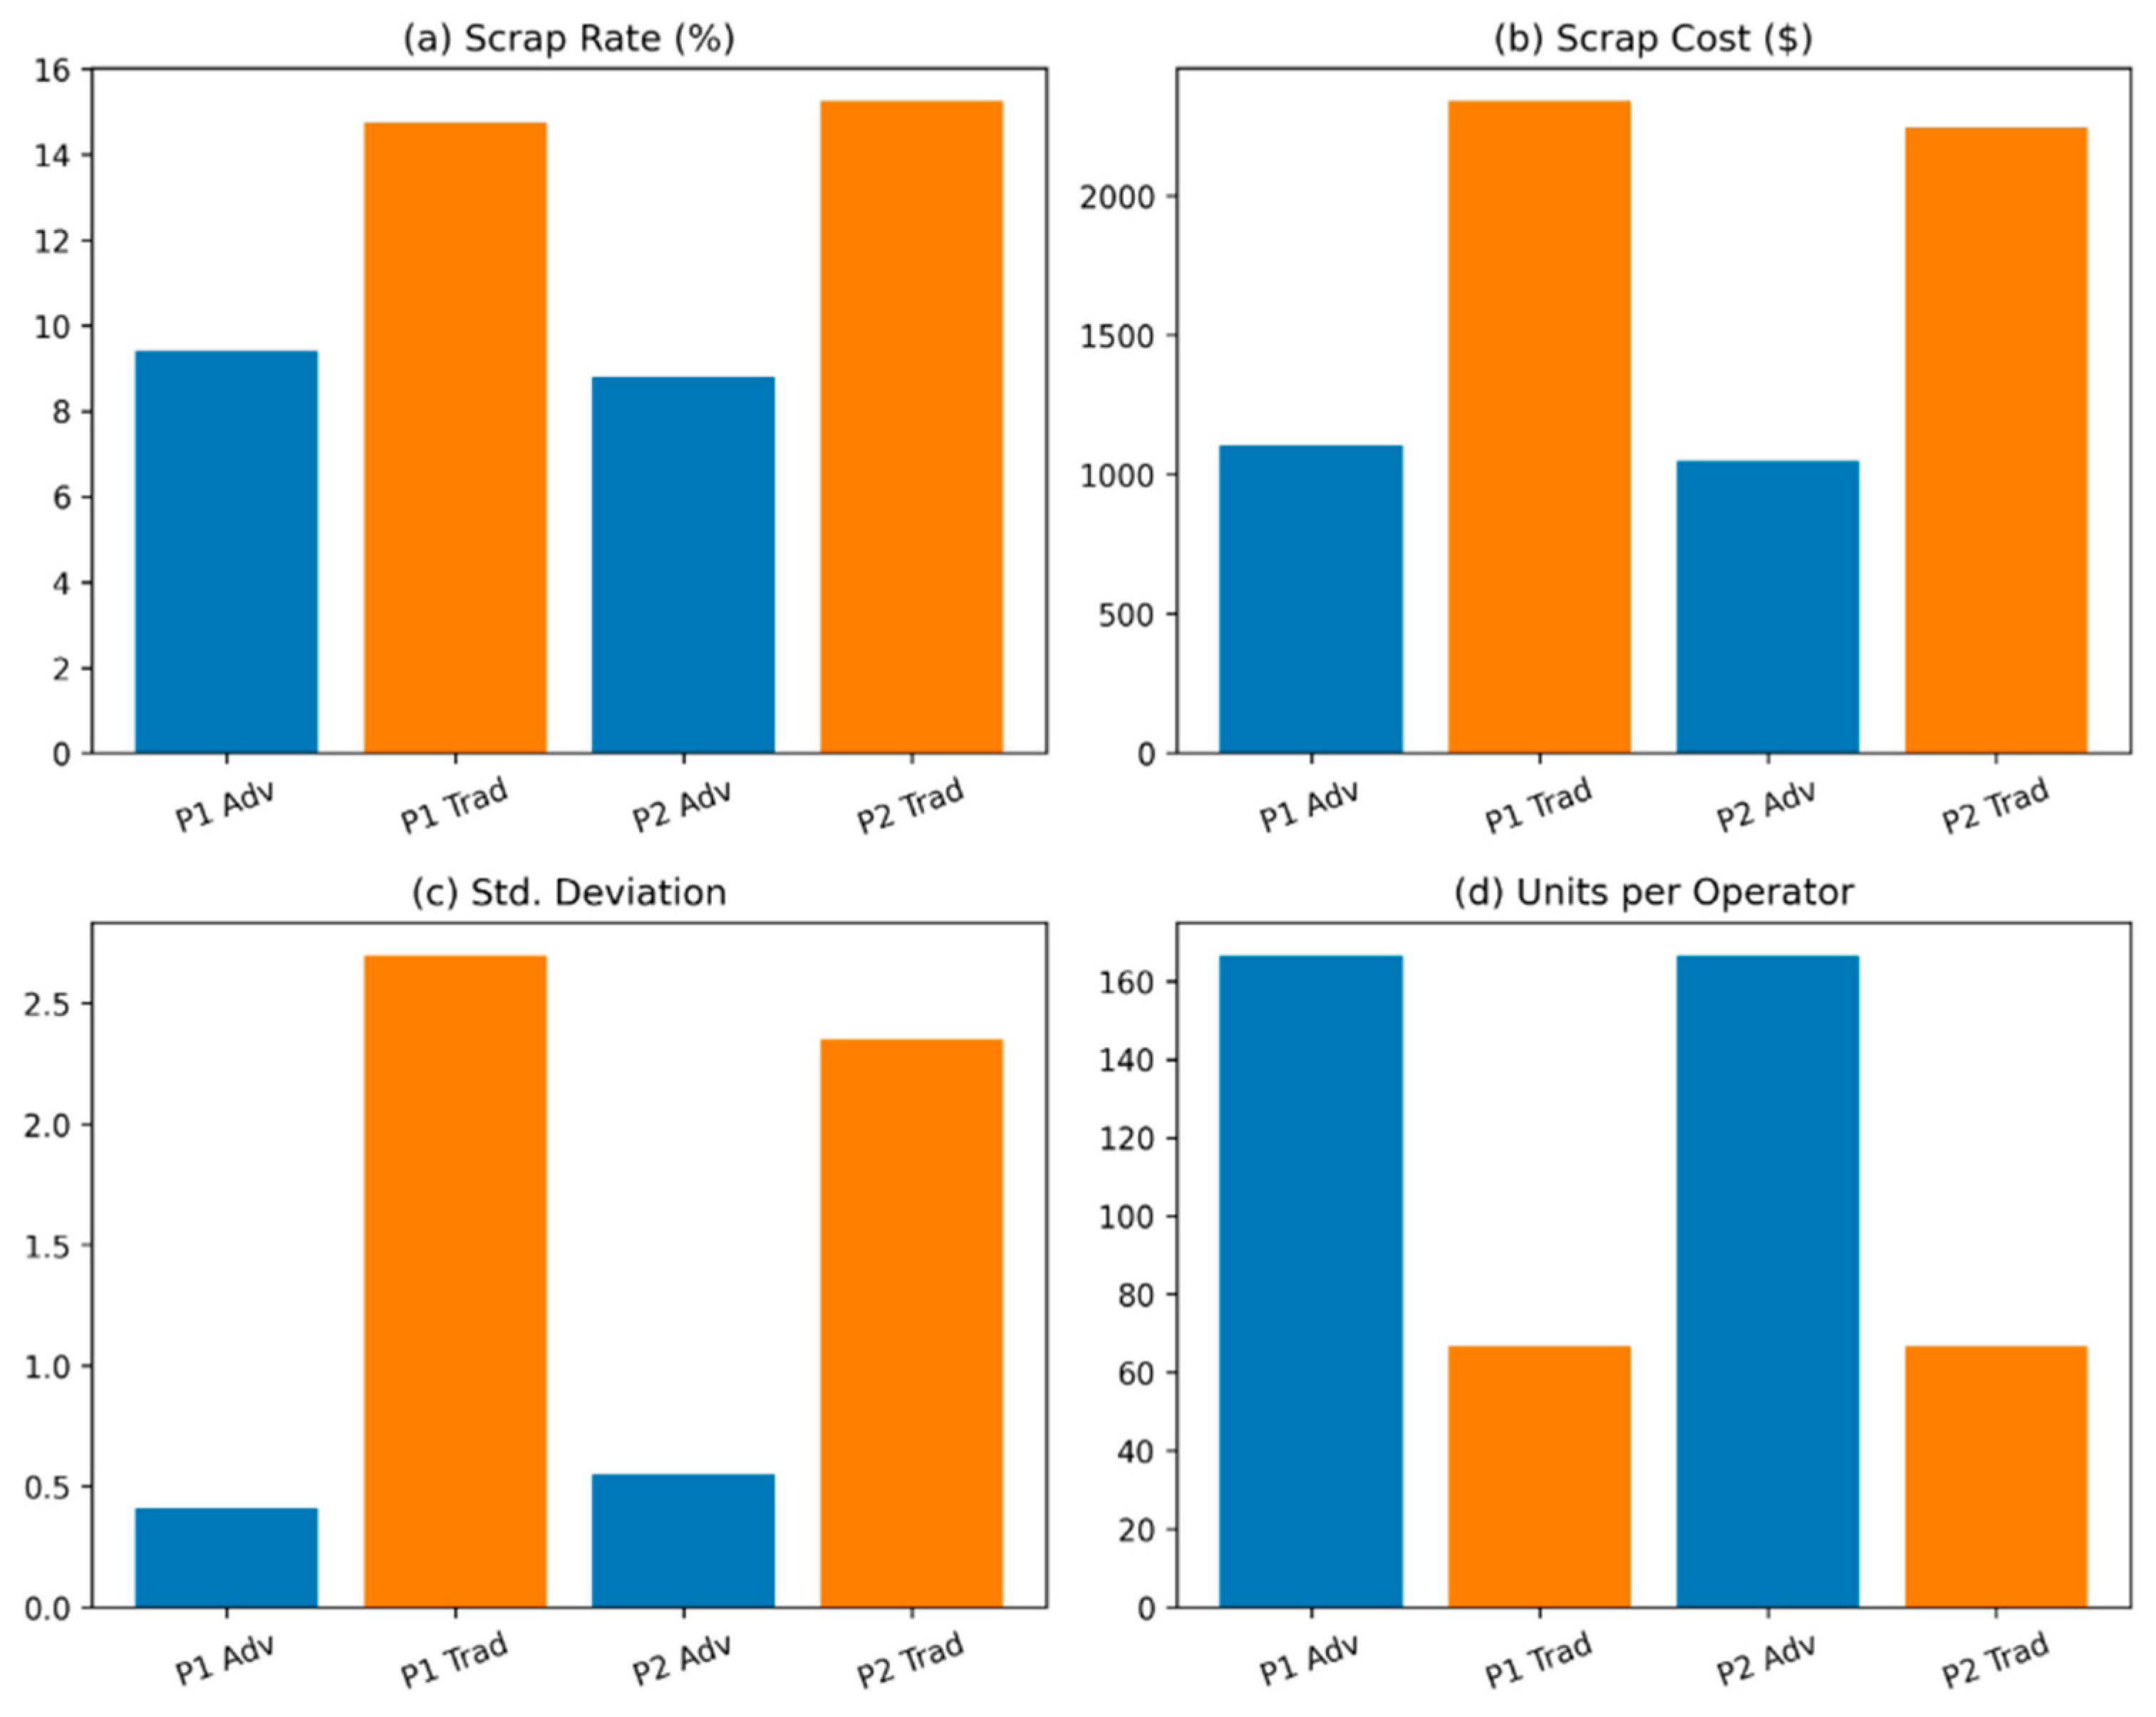
In addition to absolute scrap reductions, the integrated architecture significantly improved process stability. Variability, measured via the standard deviation of station-level scrap rates, decreased drastically. The advanced system exhibited a standard deviation of 0.41 compared to 2.70 in the traditional line for the first pilot, and 0.55 compared to 2.35 in the second. This reduction indicates a highly consistent and controlled manufacturing process, directly resulting from the real-time physical interlocking capabilities of the PLC.
All key statistical results including normalized sample sizes, test statistics, variability, cost impacts, and productivity metrics are systematically summarized in Table 6. Furthermore, Figure 10 visually illustrates this comparative performance across both pilot runs. By achieving statistical significance across two independent trials under identical boundary conditions, this study provides strong evidence of repeatability, confirming that the closed-loop architecture consistently delivers measurable operational improvements.
Table 6.
Comparative statistical analysis of the advanced RFID–vision–PLC system versus traditional assembly.
Figure 10.
Comparative performance analysis across pilot studies.
3.4. Impact on Production Behavior and Process Flow
Beyond the numerical improvements in scrap and cost, one of the more noticeable outcomes of this work was how the behavior of the production line itself changed. This was not something that can be captured fully in a table, but it was clearly observed during both pilot studies.
In the original setup, inspection and product flow were not directly connected. A unit could fail at one station, but still continue moving forward if the issue was not immediately detected or properly recorded. Because of this, defective units often went through additional processing steps before being removed. This not only increased scrap cost, but also made it harder to understand where the problem actually started.
With the upgraded system, this behavior changed in a very direct way. Inspection results were no longer isolated at individual stations, but rather, were immediately tied to the product itself with the RFID tag and used by the PLC to control the flow of the line.
In practice, this meant that when a defect occurred, the unit stopped right there. It did not continue to the next station, and it did not accumulate additional components. This made the process more controlled and easier to manage.
Another thing that changed was how operators worked with the system. In the manual setup, operators were responsible for inspection, decision-making, and recording results. This naturally introduces variability, especially over longer runs.
With the upgraded system, part of that responsibility was taken over by the system itself. The vision systems handled inspection in a consistent way, and the PLC made the decision based on defined logic. Operators were still involved, but their role became more focused on monitoring and handling exceptions rather than making repeated inspection decisions.
This also had effects on production flow. Since defective units were removed earlier, there were fewer interruptions later in the process. The line started behaving in a more predictable way, and overall it was just easier to keep things running steady.
Another thing we noticed was the visibility. Before, if we wanted to understand what happened to a product, we had to go back and look through records from different stations. That took time, and honestly, it was not always easy to connect everything.
With the integrated system, each unit basically carries its own history as it moves through the line.
This makes it much easier to go back and see where something went wrong and why. When the same issue shows up more than once, it also becomes easier to spot patterns and look closer at the stations causing the problem.
Overall, the changes observed were not limited to performance metrics. The system also changed how the production line operates on a day-to-day basis. Inspection, tracking, and control became part of the same workflow, which made the process more structured and easier to manage under real production conditions.
3.5. Economic Analysis and Return on Investment (ROI)
To fully evaluate the viability of transitioning from passive inspection to the proposed active control architecture, an economic analysis was conducted alongside the technical validation. The implementation of the RFID–vision–PLC integrated system requires a significant initial capital investment, primarily associated with hardware acquisition, system integration, and formal regulatory validation. Based on industrial estimates for a comparable medical device assembly line, the total implementation cost is approximately $1.0 M to $1.2 M. The proportional breakdown of this capital expenditure is allocated as follows: Machine Vision Systems (45%), PLC & Control Logic Integration (20%), Validation & Qualification activities (20%), and RFID Infrastructure (15%).
Despite this upfront capital requirement, the system demonstrates strong economic viability when evaluated over its operational lifecycle. The economic benefit of the proposed architecture is driven by two primary factors validated during the pilot studies: direct scrap reduction and labor efficiency. The system achieved a scrap cost reduction exceeding 50%, corresponding to direct savings of approximately $1200 per production batch. Furthermore, the implementation of automated, closed-loop process control enabled a 2.5-fold improvement in operator productivity, translating to an estimated additional savings of $300 per batch.
Under standard industrial operating conditions (e.g., two batches per day, 250 working days per year), the total annual direct savings are estimated to be approximately $750,000. A financial analysis of these savings indicates that the system achieves a payback period of 16 to 19 months, depending on the exact initial investment baseline.
Table 7 summarizes the comprehensive cost–benefit and ROI framework. While the first-year Return on Investment (ROI) is offset by the upfront capital expenditure, the system generates substantial positive cash flow beyond the payback period. A five-year cumulative analysis projects that net savings can exceed $2.5 M. Beyond direct financial metrics, the architecture provides critical intangible benefits—such as improved regulatory compliance, continuous unit-level traceability, and a significantly reduced risk of post-market product recalls—which further strengthen the industrial business case for its adoption.
Table 7.
Comprehensive cost–benefit and return on investment (ROI) framework.
3.6. Summary of Key Findings
When all results are considered together, the main outcome is that the improvement is not coming from a single isolated change, but from how inspection, tracking, and control are integrated into one system.
With the upgraded approach, defects are identified and handled at the point where they occur, instead of being detected later in the process. This changes how scrap develops across the production line and reduces the accumulation of unnecessary processing.
Inspection also becomes more consistent, as machine vision systems apply the same criteria to every unit. At the same time, traceability improves because each unit carries its own process history, making it easier to understand what happened during production and to investigate recurring issues.
Overall, integrating inspection, traceability, and control into a single workflow improves both the performance and the behavior of the production line under real operating conditions.
4. Discussion
The results from both pilot studies show that the value of the proposed system does not come from RFID alone or from machine vision alone. It comes from how these technologies were connected and used together on the line. In both pilot studies, the upgraded system reduced scrap-related cost by slightly more than 50%, with measured cost reductions of 52.77% and 53.23%. These are not small improvements, and more importantly, they are very close to each other. That consistency matters because it shows that the system did not perform well only once under favorable conditions. It behaved in a repeatable way during real production runs.
A major driver of the observed improvement is the shift in both the timing and enforcement of defect detection. In the previous manual setup, inspection outcomes were not directly linked to process control, allowing defective units to continue through multiple stages before detection and accumulate additional material and labor costs. In contrast, the proposed system integrates machine vision inspection with RFID-based state tracking and PLC interlock logic, enabling immediate containment of defects at the point of occurrence. This eliminates downstream propagation of non-compliant units and explains the consistent reduction in both scrap rates and scrap-related costs observed across both pilot studies.
Another important finding is that the improvement was distributed across the process rather than being limited to one single station. That is visible in the pilot study comparisons, where the reduction in scrap is not isolated to only one defect source or one step of assembly. This is important because it suggests that the system improved the behavior of the line as a whole. In other words, the line became more controlled, more disciplined, and less likely to let bad units keep moving. That is a stronger result than simply fixing one local problem. It indicates that the architecture itself is what created the benefit.
The results also show a clear improvement in inspection consistency. In the manual process, operators had to visually inspect parts, confirm assembly steps, and record results at each station. Even in a well-run process, this introduces variability. One operator may catch an issue immediately, another may not. Fatigue, pace, repetition, and local judgment all affect outcomes over time. Once machine vision was introduced at selected stations, the same inspection logic was applied in the same way to every unit. That does not mean the process becomes perfect, but it becomes more stable. In a regulated manufacturing environment, that stability is a major benefit because repeatability is often as important as the average performance itself.
Traceability is another area where the practical impact is significant. In the earlier setup, understanding what happened to one product could require checking records from several stations. That takes time and can make troubleshooting harder than it needs to be. With the integrated system, each unit carries its own production history through the RFID tag, and that history is linked to centralized data collection. This makes it easier to review what happened, where a defect occurred, and how the line responded. From a manufacturing point of view, this is useful for process monitoring. From a quality and compliance point of view, it is also useful because traceability is not being reconstructed after the fact. It is being built into the product flow itself.
These points become even more important in the context of medical device manufacturing. In this kind of environment, the issue is not only efficiency, but also a strong requirement for process control, documentation, and confidence that products are assembled correctly. The system developed in this study supports all three. It improves defect containment, creates a direct link between inspection outcomes and product movement, and gives each product a recoverable process history. For a sterile single-use medical device line, that combination is especially relevant because both quality performance and traceability matter at the same time.
There are also practical implications for workforce use. The study does not suggest that operators are no longer important. They are still part of the process. But their role changes. Instead of constantly making repetitive inspection decisions and manually maintaining product status, they can focus more on supervision, exception handling, and process support. That shift can reduce variability and can also make the production process easier to stabilize over longer runs. In a real plant environment, that matters, because many production problems are not caused by one dramatic failure, but by small inconsistencies repeated over time.
At the same time, the study has clear limitations and these should be stated honestly. First, the work was carried out on one sterile single-use medical device assembly line. That gives the study strong industrial relevance, but it also means the findings are based on one application environment. The architecture is promising and is based on modular integration of inspection, traceability, and control, making it adaptable to other manufacturing environments. However, not every production line will behave in exactly the same way, and implementation in different domains may require adjustments to sensing technologies, system configuration, and validation procedures based on product characteristics and regulatory requirements. Second, the evaluation was based on two pilot studies. The consistency between those two studies is encouraging, but a longer observation period would make the conclusions even stronger. Third, the current paper mainly captures scrap, scrap cost, inspection consistency, and traceability outcomes. Other dimensions such as long-term maintenance burden, implementation cost recovery, operator learning effects, and broader productivity impacts could also be examined in more detail in future work.
From a conceptual perspective, this work extends existing approaches in smart manufacturing by framing inspection, traceability, and control as an integrated closed-loop system rather than as independent functional modules. While prior studies have examined machine vision inspection and RFID-based traceability separately, this work emphasizes their coordinated use within a unified control architecture, where unit-level state information directly drives process decisions. In this sense, the contribution can be interpreted as a system-level framework for traceability-driven quality control, validated through real-world implementation.
When comparing the proposed architecture to existing literature, the distinction between passive traceability and active control becomes clear. Recent studies have effectively utilized machine vision, RFID, and IoT frameworks for process monitoring, digital twin synchronization, and analytical optimization [14,16,22,24,32,33,34,35]. However, these systems predominantly operate at the informational layer collecting data for post-process review, dashboard visibility, or offline optimization. In contrast, the architecture developed in this study operates directly at the physical control layer. By integrating RFID-encoded unit states with real-time vision inspection and PLC-based interlock logic, the system does not merely log a defect, it physically halts the non-compliant unit’s progression. This active defect containment, validated on an operational industrial line rather than in a laboratory setting, addresses a fundamental requirement of highly regulated manufacturing environments that passive monitoring systems cannot fulfill.
To explicitly position the novelty of the proposed framework, Table 8 summarizes a comparison between this study and highly relevant recent implementations in smart manufacturing. As illustrated, while existing literature has successfully leveraged advanced sensing for digital twin synchronization, process monitoring, and task automation, these systems predominantly operate at the passive informational layer. The fundamental contribution of the proposed work lies in transitioning these technologies from passive visibility tools into an active, hardware-level closed-loop control architecture validated in a highly regulated industrial setting.
Table 8.
Comparison of the proposed architecture with recent related literature.
While the empirical validation of the proposed architecture was conducted on a single sterile medical device assembly line, the underlying principles and system framework are specifically designed for broader applicability. The core components of the system, RFID-based unit-level tracking, in-process machine vision, and PLC-driven interlock logic, are inherently modular. The architecture does not rely on product-specific geometries or proprietary hardware; rather, it utilizes standard industrial automation protocols. Consequently, the framework can be readily adapted to other manufacturing environments that require strict quality control and traceability. Within the healthcare sector, the system is highly transferable to other medical device families and pharmaceutical packaging lines operating under stringent regulatory requirements (e.g., ISO 13485 [31]). Furthermore, the closed-loop defect containment logic is equally applicable to high-precision industries such as automotive electronics and aerospace manufacturing, where preventing the downstream propagation of non-compliant parts is critical.
To extend the system technically, future research will focus on deploying this integrated architecture across mixed-model assembly lines to evaluate its scalability and performance under conditions of higher product variety. Another useful direction would be to connect the collected data more directly to predictive analytics, so that repeated defect patterns can be identified earlier and used to support preventive action. The current work already creates the data foundation for that kind of development. What remains is to build the next layer on top of it.
Overall, the discussion comes back to one central point. The improvement observed in this study is not limited to automation of inspection, but reflects a fundamental change in how the production line responds to defects. By linking machine vision, RFID, PLC logic, and centralized data collection into a unified workflow, the system becomes more responsive, traceable, and efficient. This explains the consistent reduction in scrap-related cost observed across both pilot studies and highlights the broader relevance of the proposed architecture beyond the specific production runs evaluated.
5. Conclusions
In this study, we designed and implemented an integrated quality control architecture for a sterile single-use medical device assembly line by combining machine vision inspection, RFID-based traceability, PLC control, and centralized data collection. Instead of evaluating these technologies separately, we used them together as part of one connected production system. This allowed inspection results to directly influence product flow and made it possible to stop defective units at the point where the issue occurred.
The results from both pilot studies show that this integration had a clear impact on production performance. The upgraded system achieved scrap cost reductions of 52.77% in Pilot Study 1 and 53.23% in Pilot Study 2 compared to the previous manual inspection setup. In addition to reducing scrap and scrap cost, the system also improved inspection consistency by reducing operator-to-operator variability and provided stronger traceability by giving each unit its own process history through the RFID system.
Another important outcome of this work is that the benefit did not come from one isolated improvement. It came from connecting inspection, tracking, and control into a single workflow. In the previous setup, defects could move through several steps before being identified. In the upgraded setup, defects were detected and handled where they occurred, which changed how the production line behaved in practice.
Overall, the findings show that integrating machine vision and RFID into a closed-loop assembly system can improve both quality control and process visibility in regulated medical device manufacturing. The study also shows that these improvements are repeatable under real production conditions, not just under controlled laboratory settings.
This work was carried out on one sterile medical device assembly line, so future studies can expand the approach to other products, other line configurations, and longer production periods. There is also room to build on the collected production data for future predictive quality and process improvement applications.
The contribution of this work can therefore be interpreted as a practical system-level framework for closed-loop quality control, supported by real industrial implementation and validation.
Author Contributions
Conceptualization, D.G. and G.M.; methodology, D.G. and G.M.; software, D.G.; validation, D.G., G.M. and F.P.; formal analysis, D.G., G.M. and F.P.; investigation, D.G., G.M. and F.P.; data curation, D.G., G.M. and F.P.; writing—original draft preparation D.G., G.M. and F.P.; writing—review and editing D.G., G.M. and F.P.; visualization, D.G.; supervision, G.M.; project administration, D.G. and G.M. All authors have read and agreed to the published version of the manuscript.
Funding
This research received no external funding.
Institutional Review Board Statement
Not applicable.
Informed Consent Statement
Not applicable.
Data Availability Statement
The authors confirm that the data supporting the findings of this study are available within the article.
Conflicts of Interest
The authors declare no conflicts of interest.
References
- Bianchini, E.; Francesconi, M.; Testa, M.; Tanase, M.; Gemignani, V. Unique device identification and traceability for medical software: A major challenge for manufacturers in an ever-evolving marketplace. J. Biomed. Inform. 2019, 93, 103150. [Google Scholar] [CrossRef] [Scilit]
- Tettey, F.; Parupelli, S.K.; Desai, S. A review of biomedical devices: Classification, regulatory guidelines, human factors, software as a medical device, and cybersecurity. Biomed. Mater. Devices 2024, 2, 316–341. [Google Scholar] [CrossRef] [Scilit]
- Sellers, J.W.; Mihaescu, C.M.; Ayalew, K.; Kronstein, P.D.; Yu, B.; Ning, Y.M.; Rodriguez, M.; Williams, L.; Khin, N.A. Descriptive analysis of good clinical practice inspection findings from US Food and Drug Administration and European Medicines Agency. Ther. Innov. Regul. Sci. 2022, 56, 753–764. [Google Scholar] [CrossRef] [Scilit] [PubMed]
- Leal, F.; Chis, A.E.; Caton, S.; González–Vélez, H.; García–Gómez, J.M.; Durá, M.; Sánchez–García, A.; Sáez, C.; Karageorgos, A.; Gerogiannis, V.C.; et al. Smart pharmaceutical manufacturing: Ensuring end-to-end traceability and data integrity in medicine production. Big Data Res. 2021, 24, 100172. [Google Scholar] [CrossRef] [Scilit]
- Zhang, Z.; Zeng, J.; Groll, J.; Matsusaki, M. Layer-by-layer assembly methods and their biomedical applications. Biomater. Sci. 2022, 10, 4077–4094. [Google Scholar] [CrossRef] [Scilit] [PubMed]
- Bono, F.M.; Radicioni, L.; Cinquemani, S. A novel approach for quality control of automated production lines working under highly inconsistent conditions. Eng. Appl. Artif. Intell. 2023, 122, 106149. [Google Scholar] [CrossRef] [Scilit]
- Sharma, A. Making electric vehicle batteries safer through better inspection using artificial intelligence and cobots. Int. J. Prod. Res. 2024, 62, 1277–1296. [Google Scholar] [CrossRef] [Scilit]
- Dubey, P.; Jackman, J.; Kremer, G.E.; Kremer, P. A probabilistic model to estimate automated and manual visual inspection errors. In International Conference on Flexible Automation and Intelligent Manufacturing; Springer International Publishing: Cham, Switzerland, 2022; pp. 685–695. [Google Scholar] [CrossRef] [Scilit]
- Knott, A.L.; Stauder, L.; Ruan, X.; Schmitt, R.H.; Bergs, T. Potential of prediction in manufacturing process and inspection sequences for scrap reduction. CIRP J. Manuf. Sci. Technol. 2023, 44, 55–69. [Google Scholar] [CrossRef] [Scilit]
- Palanikumar, K.; Natarajan, E.; Ponshanmugakumar, A. Application of machine vision technology in manufacturing industries—A study. In Machine Intelligence in Mechanical Engineering; Academic Press: New York, NY, USA, 2024; pp. 91–122. [Google Scholar] [CrossRef] [Scilit]
- Zhou, L.; Zhang, L.; Konz, N. Computer vision techniques in manufacturing. IEEE Trans. Syst. Man Cybern. Syst. 2022, 53, 105–117. [Google Scholar] [CrossRef] [Scilit]
- Park, M.; Jeong, J. Design and implementation of machine vision-based quality inspection system in mask manufacturing process. Sustainability 2022, 14, 6009. [Google Scholar] [CrossRef] [Scilit]
- Frustaci, F.; Spagnolo, F.; Perri, S.; Cocorullo, G.; Corsonello, P. Robust and high-performance machine vision system for automatic quality inspection in assembly processes. Sensors 2022, 22, 2839. [Google Scholar] [CrossRef] [Scilit] [PubMed]
- Silva, C.A.D.; Paladini, E.P. Smart machine vision system to improve decision-making on the assembly line. Machines 2025, 13, 98. [Google Scholar] [CrossRef] [Scilit]
- Kang, K.; Zhong, R.Y. A methodology for production analysis based on the RFID-collected manufacturing big data. J. Manuf. Syst. 2023, 68, 628–634. [Google Scholar] [CrossRef] [Scilit]
- Demčák, J.; Židek, K.; Krenický, T. Digital twin for monitoring the experimental assembly process using RFID technology. Processes 2024, 12, 1512. [Google Scholar] [CrossRef] [Scilit]
- De Marchi, M.; Mark, B.G.; Angeli, N.; Rauch, E.; Matt, D.T. Using RFID and Industrial IoT in manual assembly for data collection and processing in learning factories. In Proceedings of the 12th Conference on Learning Factories (CLF 2022), Singapore, 11–13 April 2022. [Google Scholar] [CrossRef] [Scilit]
- Chen, Z.; Xiao, Z.; Sun, Y.; Dong, Y.; Zhong, R.Y. Production efficiency analysis based on the RFID-collected manufacturing big data. Manuf. Lett. 2024, 41, 81–90. [Google Scholar] [CrossRef] [Scilit]
- Shamim, M.M.R.; Ruddro, R.A. Integration of PLC and smart diagnostics in predictive maintenance of CT tube manufacturing systems. Int. J. Sci. Interdiscip. Res. 2022, 1, 62–96. [Google Scholar] [CrossRef] [Scilit]
- Shaheed, B.N.; Selman, N.H. Design and implementation of a control system for a steel plate cutting production line using programmable logic controller. Int. J. Electr. Comput. Eng. 2023, 13, 3969–3976. [Google Scholar] [CrossRef]
- Huang, K.C.; Ku, H.C.; Chuang, T.H.; Huang, W.N. Improved fault diagnosis method for PLC-based manufacturing processes with validation through a cyber-physical system. In 2024 IEEE 4th International Conference on Electronic Communications, Internet of Things and Big Data (ICEIB); IEEE: New York, NY, USA, 2024; pp. 705–710. [Google Scholar] [CrossRef] [Scilit]
- Kumar, R.; Patil, O.; Nath, K.; Rohilla, K.; Sangwan, K.S. Machine vision and radio-frequency identification (RFID) based real-time part traceability in a learning factory. Procedia CIRP 2021, 104, 630–635. [Google Scholar] [CrossRef] [Scilit]
- Singh, S.A.; Desai, K.A. Automated surface defect detection framework using machine vision and convolutional neural networks. J. Intell. Manuf. 2023, 34, 1995–2011. [Google Scholar] [CrossRef] [Scilit]
- de Jesus Pacheco, D.A.; Jung, C.F.; de Azambuja, M.C. Towards industry 4.0 in practice: A novel RFID-based intelligent system for monitoring and optimisation of production systems. J. Intell. Manuf. 2023, 34, 1165–1181. [Google Scholar] [CrossRef] [Scilit]
- Taatali, A.; Sadaoui, S.E.; Louar, M.A.; Mahiddini, B. On-machine dimensional inspection: Machine vision-based approach. Int. J. Adv. Manuf. Technol. 2024, 131, 393–407. [Google Scholar] [CrossRef] [Scilit]
- Altuğlu, Ö.; Gündüzalp, M. A UHF RFID-Based System for Real-Time Production Monitoring and Tag Quality Control in the Textile Industry. Int. J. RF Technol. 2026, 16, 2–20. [Google Scholar] [CrossRef] [Scilit]
- Zhang, H. Optimization and Innovation of Industrial Control Systems Based on PLC. Int. J. Res. Pract. Robot 2024, 3, 45–74. [Google Scholar] [CrossRef] [Scilit]
- Fang, Q.; Xiong, G.; Zhou, M.; Tamir, T.S.; Yan, C.B.; Wu, H.; Shen, Z.; Wang, F.Y. Process monitoring, diagnosis and control of additive manufacturing. IEEE Trans. Autom. Sci. Eng. 2022, 21, 1041–1067. [Google Scholar] [CrossRef] [Scilit]
- Mayr, M.; Luftensteiner, S.; Chasparis, G.C. Abstracting process mining event logs from process-state data to monitor control-flow of industrial manufacturing processes. Procedia Comput. Sci. 2022, 200, 1442–1450. [Google Scholar] [CrossRef] [Scilit]
- McDermott, O.; Conroy, N.; Thenarasu, M.; Duarte, S. Digitalised validation systems as an enabler for quality 4.0 within a medical device manufacturer. Sustain. Futures 2024, 8, 100383. [Google Scholar] [CrossRef] [Scilit]
- ISO 13485:2016; Medical Devices—Quality Management Systems—Requirements for Regulatory Purposes. International Organization for Standardization: London, UK, 2016. Available online: https://www.iso.org/standard/59752.html (accessed on 11 May 2026).
- Silva, J.; Coelho, P.; Saraiva, L.; Vaz, P.; Martins, P.; López-Rivero, A. Validating the Use of Smart Glasses in Industrial Quality Control: A Case Study. Appl. Sci. 2024, 14, 1850. [Google Scholar] [CrossRef] [Scilit]
- Zhu, T.; Bai, Y.; Zhang, L. Enhancing Parts Flow Data Quality in Serial Production Lines: Algorithms and Computational Implementation. Automation 2025, 6, 78. [Google Scholar] [CrossRef] [Scilit]
- Huang, Y.-Y.; Lai, J.-T.; Wu, H.-H. Real-Time 3D Vision-Based Robotic Path Planning for Automated Adhesive Spraying on Lasted Uppers in Footwear Manufacturing. Appl. Sci. 2025, 15, 6365. [Google Scholar] [CrossRef] [Scilit]
- Calderon-Cordova, C.; Castillo, D.; Fernandez, J.; Sarango, R.; Castro, R. An Integrated System of Industrial Robotics and Machine Vision for the Automation of the Assembly and Packaging Process of Industrial Hinges. Eng. Proc. 2024, 77, 19. [Google Scholar] [CrossRef] [Scilit]

Disclaimer/Publisher’s Note: The statements, opinions and data contained in all publications are solely those of the individual author(s) and contributor(s) and not of MDPI and/or the editor(s). MDPI and/or the editor(s) disclaim responsibility for any injury to people or property resulting from any ideas, methods, instructions or products referred to in the content. |
© 2026 by the authors. Licensee MDPI, Basel, Switzerland. This article is an open access article distributed under the terms and conditions of the Creative Commons Attribution (CC BY) license.