


Abstract
To address the accuracy limitations in identifying micro-scale and low-distinguishability defects, we proposes an improved EfficientNet model for wafer defect classification in semiconductor fabrication. In particular, we construct the model using EfficientNetV2 architectures as the backbone and introduce a multi-scale self-attention enhancement module to strengthen the capture capability for critical defect characteristics. This module consists of four parallel self-attention enhancement modules, aiming to obtain spatial context information at different levels and enhance relevant features through a self-attention mechanism. Meanwhile, we merge the manually extracted features of defects with the CNN’s fully connected layer, effectively compensating for the deficiency of automatic features in the differentiated representation of defects. The manual feature extraction module leverages image processing techniques to capture diverse morphological characteristics of defects including geometric features, moment features and texture features. We simulate and generate a lithography SEM image dataset with various types of defects based on the typical line-space structure and the ICCAD2019 mask pattern dataset. The total sample size of the wafer defect dataset is 1500, covering 15 typical defects with an average distribution. The classification performance of models is evaluated on the simulated defect dataset. The results indicate that the overall classification accuracy of the improved model reaches 96.60%, representing an improvement of 8.14% compared to the original EfficientNetV2. This demonstrates the superiority of the proposed model in addressing classification tasks involving micro-scale and low-distinguishability defects.
1. Introduction
As technology advances toward greater digitization and intelligence, integrated circuit (IC) chips have become the foundation of the modern information technology industry. IC fabrication is a highly precise, complex sequence of specialized processes and equipment, and each step can introduce different types of defects that degrade IC performance or cause functional failure [1,2]. Yield is a central metric of process stability and maturity, and it directly determines production costs and economic returns for chip manufacturers [3,4,5]. In-line defect detection provides an effective means to guarantee yield.
Wafer defect inspection relies on specialized inspection equipment, primarily the scanning electron microscope (SEM); offering an image resolution of 1–2 nm, it is crucial for identifying defects in advanced process nodes [6]. The process of wafer defect inspection involves two primary stages: detection and classification. Defect detection employs image analysis algorithms like die-to-database for precise defect localization and measurement of their geometric properties [7]. On the other hand, defect classification utilizes machine learning techniques to classify defects in real time and generate diverse statistical data. Accurate classification of wafer defects is essential for identifying issues throughout the chip manufacturing process and represents a critical technology for process optimization and yield improvement [8,9].
Wafer defect classification methods commonly adopt supervised learning, including both traditional machine learning and deep learning approaches. Defect classification methods based on deep learning have gradually become the mainstream technology in the field of wafer defect classification due to their powerful feature extraction capabilities in the image classification domain, which can effectively meet the requirements of scenarios with diverse, complex, micro-scale features of wafer defects [10,11,12]. Yu et al. [13] proposed a lightweight network WM-PeleeNet based on the PeleeNet module. By optimizing the data augmentation based on the convolutional auto-encoder and the dense block structure, it achieves a balance between accuracy and efficiency and significantly reduces the model complexity. Deya et al. [14] proposed a defect classification model based on RetinaNet. This model strengthens the feature extraction ability for different defect types by combining ResNet backbone networks of different depths and compares the detection accuracies on defect patterns such as bridge, break, and line collapse. Kazunori et al. [15] proposed a convolutional neural network defect classification model based on transfer learning. It uses 33 convolutional layers with different kernel sizes to extract defect features. The classifier part consists of two fully connected layers, a Dropout layer, and a Softmax layer. Finally, the trained model was applied to other defect classification tasks through transfer learning. Other popular deep neural network classification frameworks are also widely used in the field of wafer defect classification, for example: ResNet [16] and ShuffleNet [17].
However, most of these methods are validated on small private industrial datasets, and their practical application is severely restricted by the scarcity of high-quality, accurately annotated training data. In real industrial contexts, the large-scale acquisition and accurate labeling of defect images not only require considerable labor but also rely heavily on the expertise of domain specialists. Furthermore, industrial lithography inspection data is subject to confidentiality requirements, and the processes across different production lines can vary significantly, leading to a near absence of public datasets available for scientific research. This acute shortage of data resources has severely hindered the development of standardized training processes and unified benchmark testing schemes. To address these challenges, this paper presents experiments utilizing a simulated wafer defect dataset derived from linewidth structures and ICCAD2019 mask pattern generation, aiming to mitigate the difficulties associated with acquiring real industrial data and the high costs of annotation.
As the defect sizes of chips continue to decrease and manufacturing processes grow increasingly intricate, a variety of complex defect types have emerged. In addressing these complex defects, these learning methods reveal limitations in feature extraction capabilities, classification accuracy, and generalization performance, rendering them inadequate for meeting the high-precision defect classification requirements of advanced processes. While previous studies have shown favorable classification results, the increasing complexity of defect patterns in advanced process nodes, coupled with smaller scales and lower defect recognition, brings challenges for the classification task.
To overcome these limitations, this study introduces an enhanced classification method for lithography micro-defects, leveraging the EfficientNetV2 architecture. EfficientNetV2, as an upgraded version of the EfficientNet series, addresses the inefficiencies of previous architectures in training speed and parameter utilization by introducing more efficient MBConv blocks, progressive learning strategies, and optimized scaling rules. It achieves better performance with fewer parameters, making it suitable for industrial lithography defect classification scenarios where computational resources may be limited. Moreover, in the classification of semiconductor defects, the size of lithography defect images can vary significantly depending on the processing environment and imaging conditions. The EfficientNet architecture excels in processing input images of varying dimensions, rendering it particularly suitable for semiconductor wafer inspections that involve multiple defect scales and shapes. This adaptability highlights its significant engineering practicality and generalization capability. Moreover, EfficientNet attains exceptionally high classification accuracy on large datasets, such as ImageNet, while incurring relatively low training costs. Its robust feature extraction and representation capabilities allow it to effectively capture the micro-scale and low-distinguishability patterns found in semiconductor defect images, thereby meeting the stringent recognition requirements for minor defects. Consequently, this paper designates EfficientNet as the primary backbone network. Considering that the experimental images predominantly have a resolution of 256 × 256, EfficientNetV2-s is selected as the benchmark model.
The primary innovation of this study lies in the effective integration of manual extraction features, specifically geometric, texture, and gray-scale features extracted through traditional image processing techniques with the deep semantic features that are automatically learned by deep networks. This approach addresses the limitations of interpretability and process specificity inherent in single deep learning features. Building on this foundation, we introduce a multi-scale self-attention enhancement module designed to improve the network’s sensitivity to micro-scale defects and its capacity to concentrate on critical features. This enhancement significantly boosts the extraction and discrimination of defect features in complex processing scenarios. Experimental results demonstrate that the proposed method achieves higher classification accuracy and greater robustness compared to traditional single-feature extraction models.
In comparison to the original EfficientNetV2 architecture, the enhancement scheme presented in this paper demonstrates significant advancements in design philosophy. The original architecture predominantly relies on data-driven automatic feature mining, failing to incorporate prior knowledge related to semiconductor processes, which restricts its capacity to effectively capture features. In contrast, the proposed scheme implements targeted optimizations in feature sources, extraction mechanisms, and modeling logic by explicitly integrating artificially designed features and introducing multi-scale self-attention enhancement modules. These improvements substantially enhance the model’s classification accuracy and robustness, effectively addressing the challenges of limited recognition capabilities inherent in the original architecture when detecting semiconductor micro-defects.
This article is organized as follows: Section 2 describes the semiconductor defect detection procedure and typical process-related defects. Section 3 presents on the framework of the proposed defect classification model, including its basic network architecture, manual feature extraction scheme, and multi-scale attention enhancement mechanism. Section 4 outlines the dataset settings, comparative experiments, and quantitative result analysis. Finally, Section 5 summarizes the contributions of this work and discusses potential future research directions.
2. Wafer Defect Inspection Process and Typical Defect Types
2.1. Wafer Defect Inspection Process
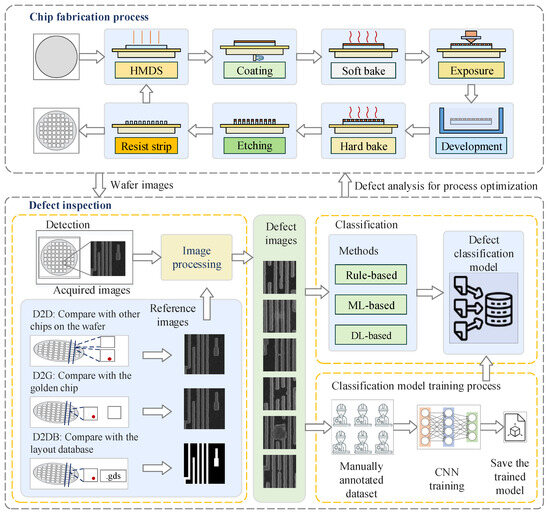
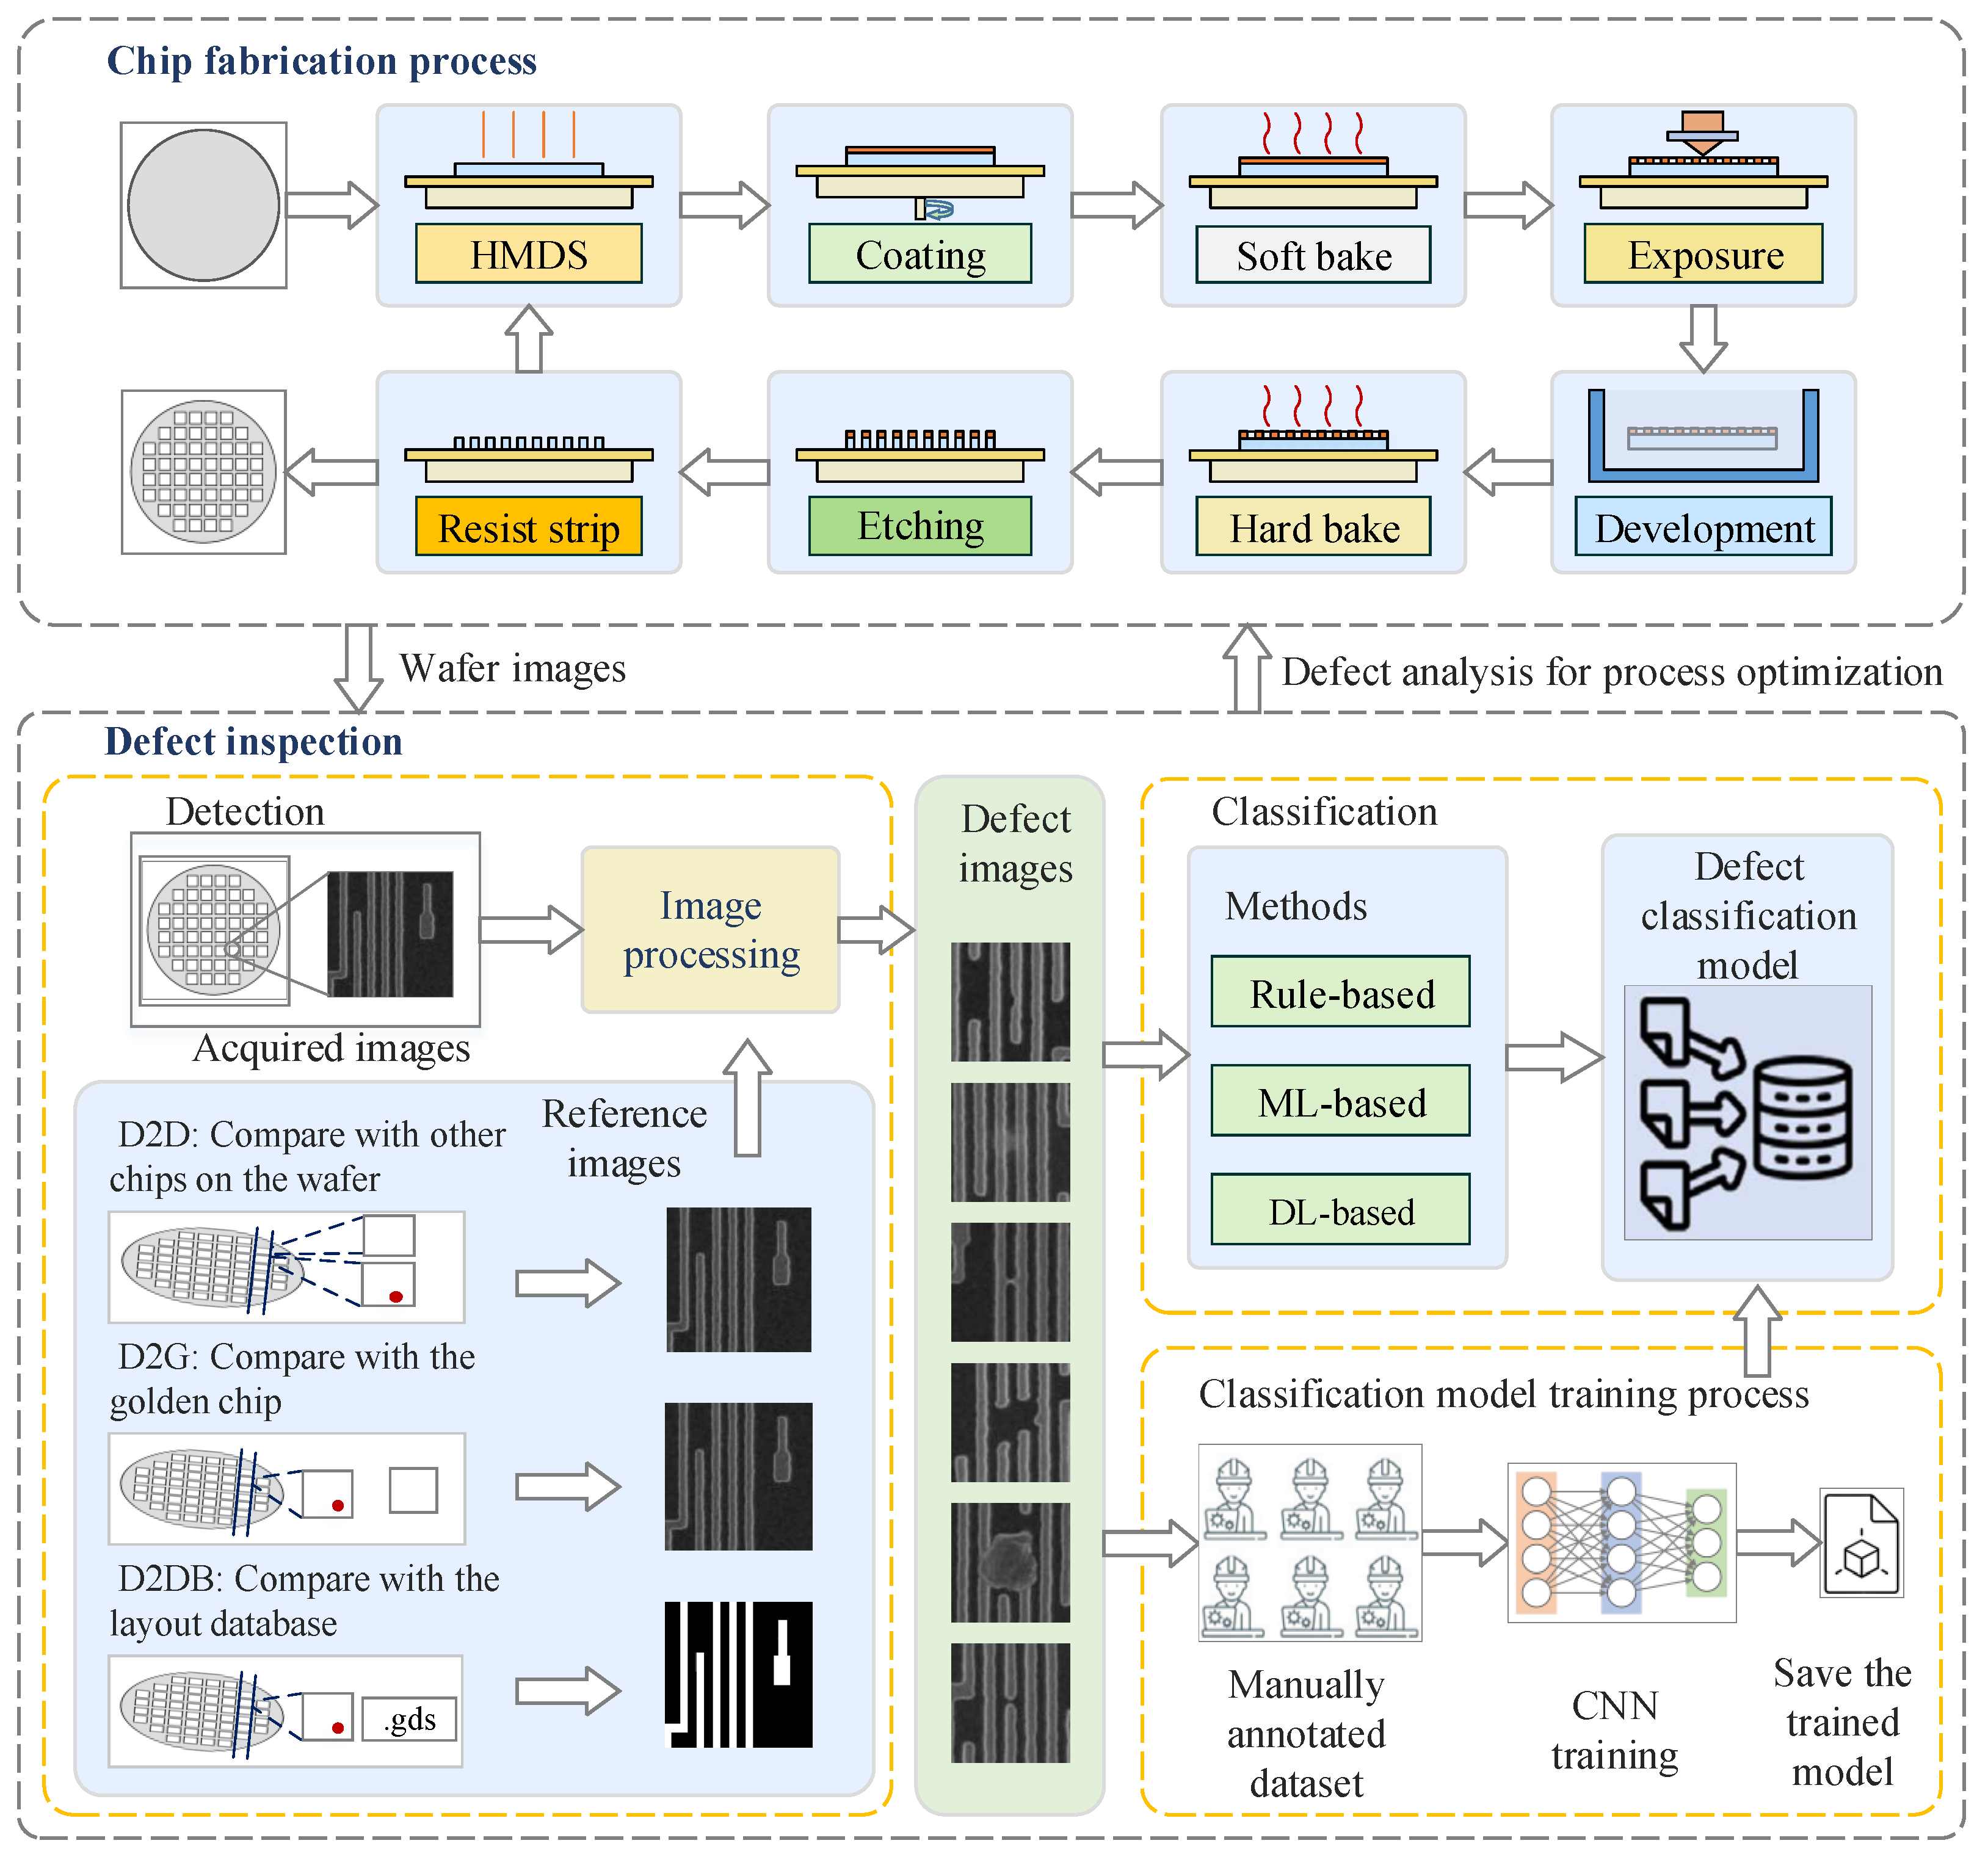
The wafer defect inspection process is shown in Figure 1, which includes two core steps: defect detection and defect classification [18]. In the defect detection stage, SEM images of the wafer are captured using specialized detection equipment. Then the wafer surface image is preprocessed, where abnormal regions are identified using an image comparison algorithm. Common detection algorithms are die-to-die, die-to-golden, and die-to-database [19,20]. The die-to-die method involves pairwise comparison of graphic areas among three dies to identify defects based on significant gray value differences exceeding a preset threshold. Die-to-golden compares the test chip image with a golden template, while die-to-database compares it with an ideal image from design layout data. Following defect detection, postprocessing is conducted on the identified defect images to extract critical information, including precise coordinate positions, geometric parameters, and defect sizes.
Figure 1.
Process flow diagram of wafer defect inspection. The overall inspection flow comprises two key steps: defect detection and defect classification. Defect images are obtained from preprocessed and aligned images via image comparison algorithms. These defects are then classified online using machine learning models with training and labeling conducted offline.
After the detection of wafer defect images is completed, the process enters the stage of automatic online classification of defects. The defect classification model is established based on machine learning methods, and the model parameters are obtained through offline training. The defect type labels of the training dataset need to be manually annotated, and then the model is trained and validated according to the selected training parameters and dataset. The wafer defect classification model needs to be deployed on the dedicated computing system of the inspection equipment. To improve the efficiency of online detection and classification, current mainstream defect inspection equipment generally adopts a distributed computing architecture to achieve efficient parallel processing of defect detection and online classification. The classification results are automatically stored in the defect data management system. Generally, independent defect management software is used to implement functions such as defect data retrieval, visual display, statistical analysis, and report generation, providing data support for subsequent process traceability and yield optimization.
2.2. Typical Defect Types
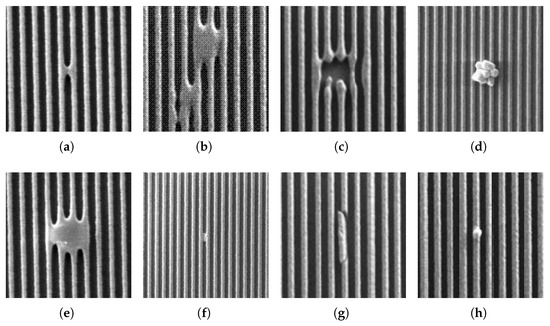
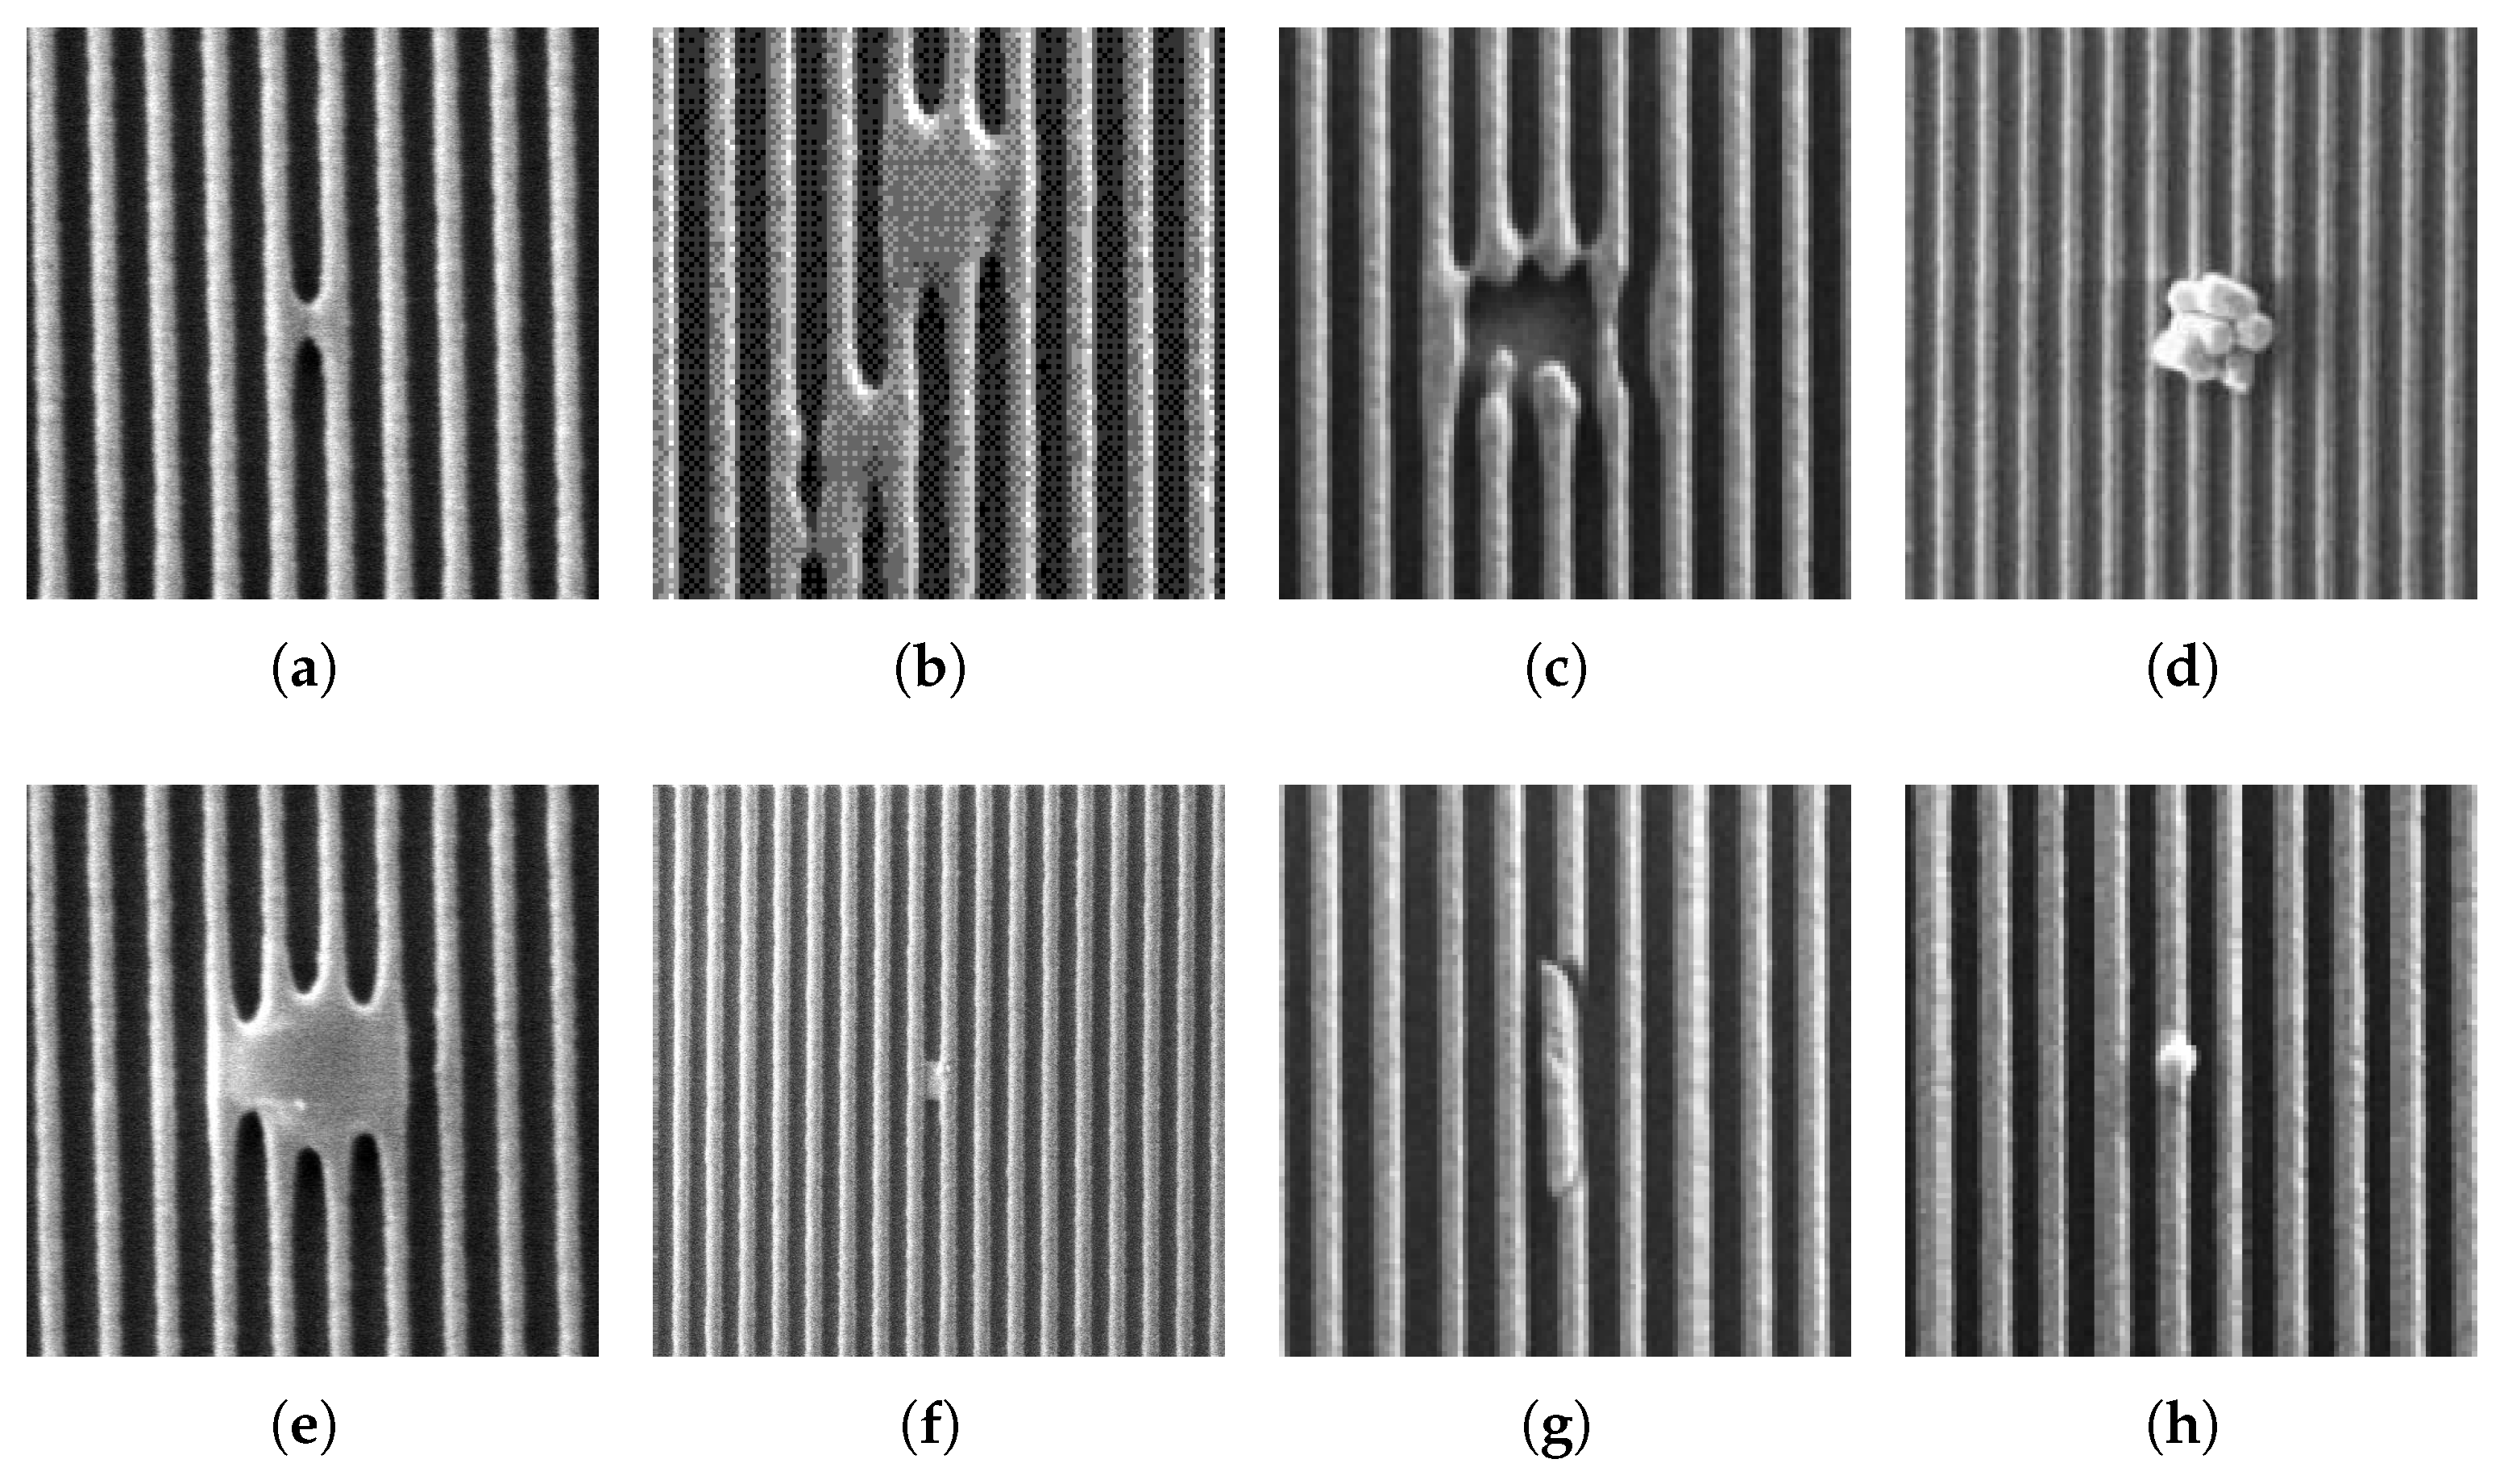
Defects can arise at every stage of the chip manufacturing process [21,22]. Lithography exposure represents a critical phase in this process, and defects resulting from lithography are frequently critical. Common defects associated with the traditional dry lithography process include bridge, multi-bridge, missing pattern, particles, embedded particles, residue, line collapse and bump, as illustrated in Figure 2. Bridge defects primarily stem from mask defects, photoresist particles, and bubbles, causing partial or complete connection of adjacent line structures. Multi-bridge defects arise from foreign particle contamination and development issues, resulting in extensive interconnection of line structures within the affected region. Missing-pattern defects result from mask defects, particle contamination, and development exposure problems, leading to significant loss or incompleteness of the lithography pattern. Surface particle and embedded particle defects can arise at various stages of the process, originating from sources like developer solution, environmental metal contaminants, and polymer residue. These defects typically manifest as foreign particles adhering to or being embedded within the lithography pattern. Residue defects stem from incomplete development, leaving behind a thin layer of residue on the pattern. Line collapse defects primarily result from photoresist material instability when subjected to capillary forces during development, leading to line adhesion and collapse. Such defects are particularly prevalent in fine line patterns at advanced process nodes.
Figure 2.
Common wafer defects [21,22]. (a) Bridge; (b) multi-bridge; (c) missing pattern; (d) particle; (e) embedded; (f) residue; (g) collapse; (h) bump.
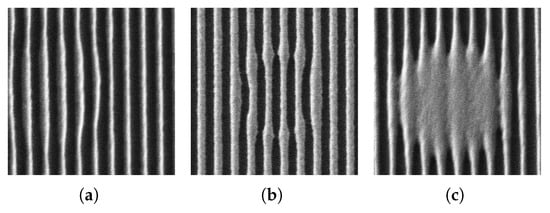
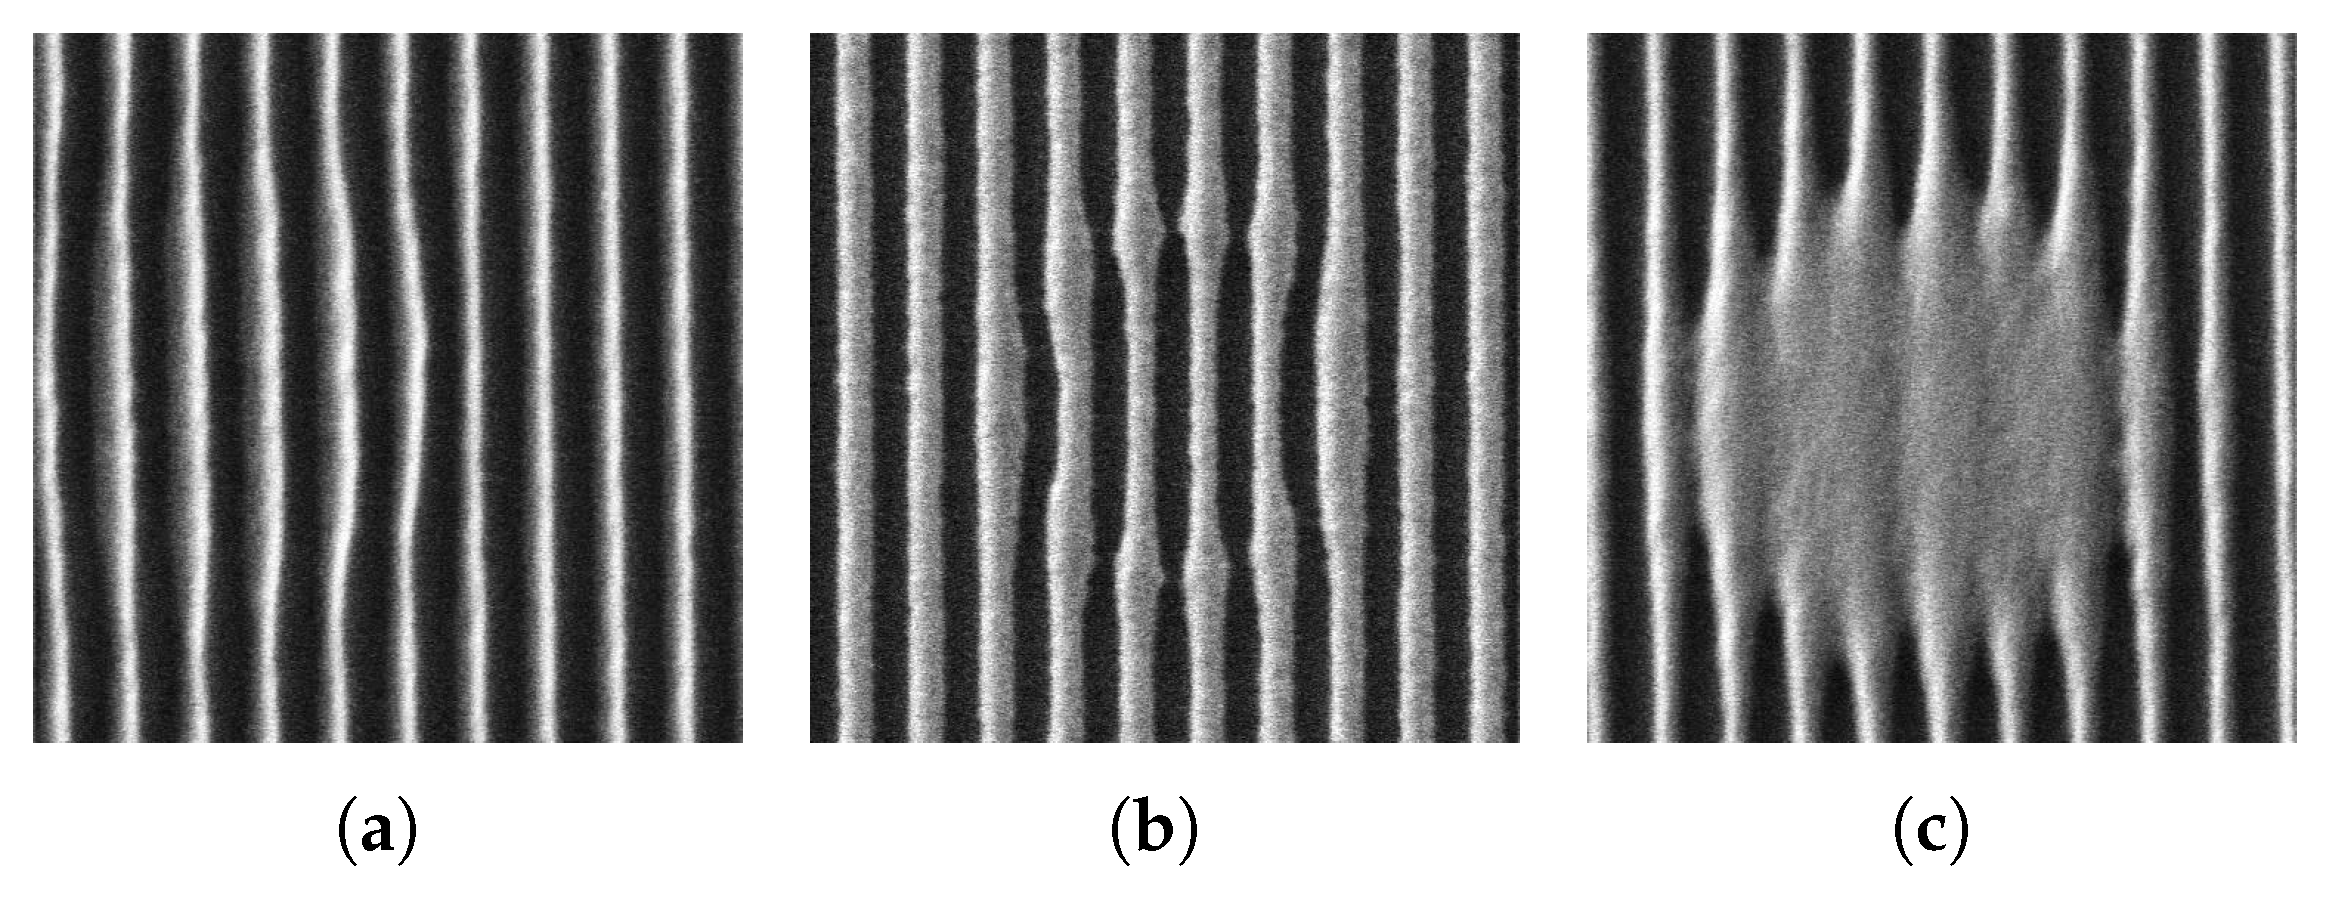
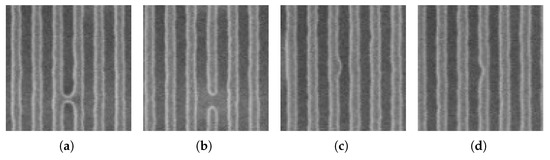
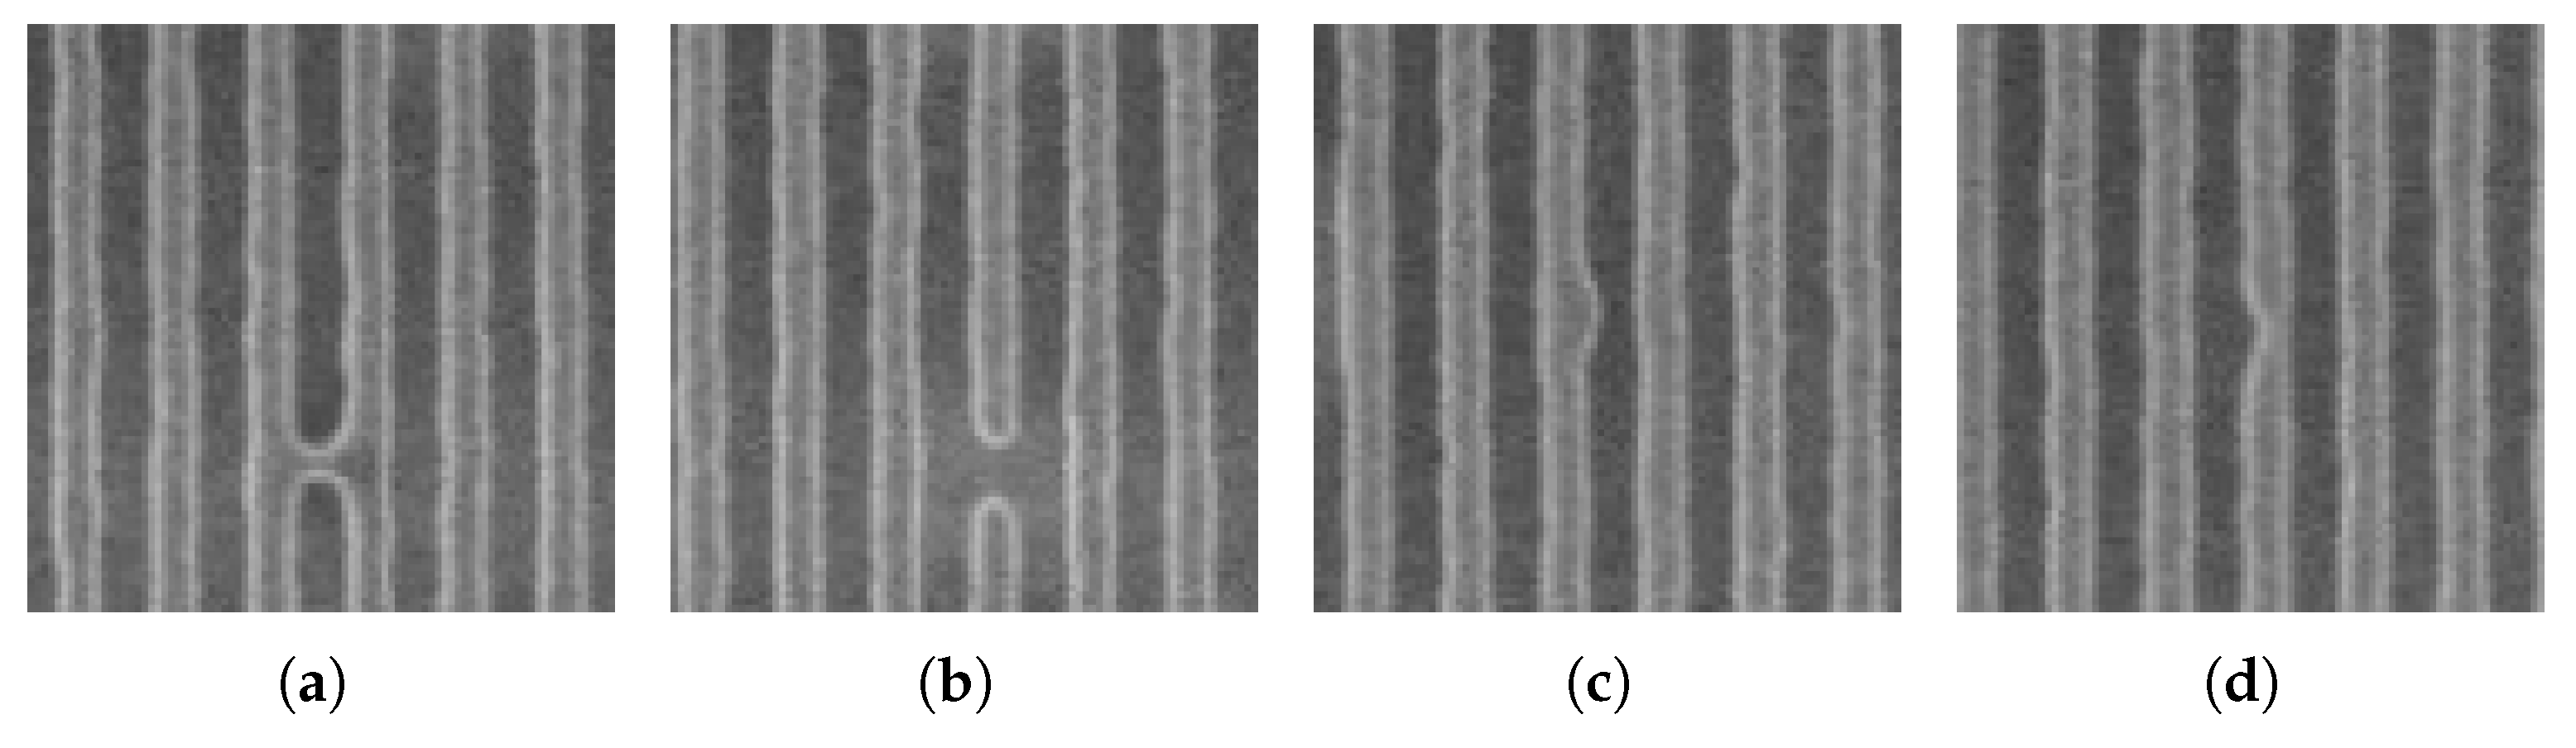
Immersion lithography can induce distinct defects such as pattern attenuation, shrinkage, and expansion, illustrated in Figure 3, primarily due to moisture absorption during contact of the photoresist with the immersion liquid [22]. This interaction results in material expansion or water mark residue, leading to overall attenuation, shrinkage, and expansion of lithography lines within the defect area, which typically assumes an elliptical shape. In state-of-the-art EUV lithography technology, shot noise can cause EUV stochastic defects, characterized by bridges, breaks, protrusion, and intrusion of photolithography lines [23,24], as illustrated in Figure 4. These defects, despite their low frequency and microscopic scale, are extremely harmful and can directly compromise chip function. Their micro-scale and rare occurrence pose a critical challenge for defect detection techniques.
Figure 3.
Specific defects of immersion lithography [22]. (a) Pattern attenuation; (b) pattern shrinkage; (c) pattern expansion.
Figure 4.
EUV stochastic defects [24]. (a) Micro-bridge; (b) broken; (c) extrusion; (d) intrusion.
3. Design of Wafer Defect Classification Model
3.1. EfficientNet Model
EfficientNet is a lightweight convolutional neural network model introduced by Google in 2019. It enhances model performance by optimizing the balance among the network’s depth, width, and input resolution. Currently, it comprises two primary series: EfficientNetV1 and EfficientNetV2. EfficientNetV1 employs a compound scaling technique. Following the establishment of the baseline model EfficientNet-B0 through Neural Architecture Search (NAS) technology, it uniformly scales the network’s depth, width, and resolution using various compound scaling factors, resulting in a series of enhanced versions tailored for diverse applications.
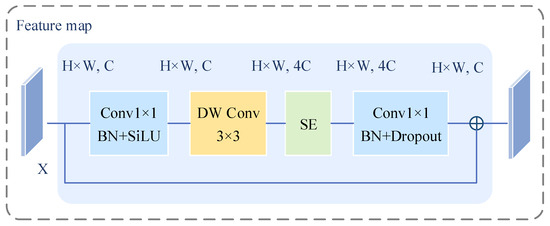
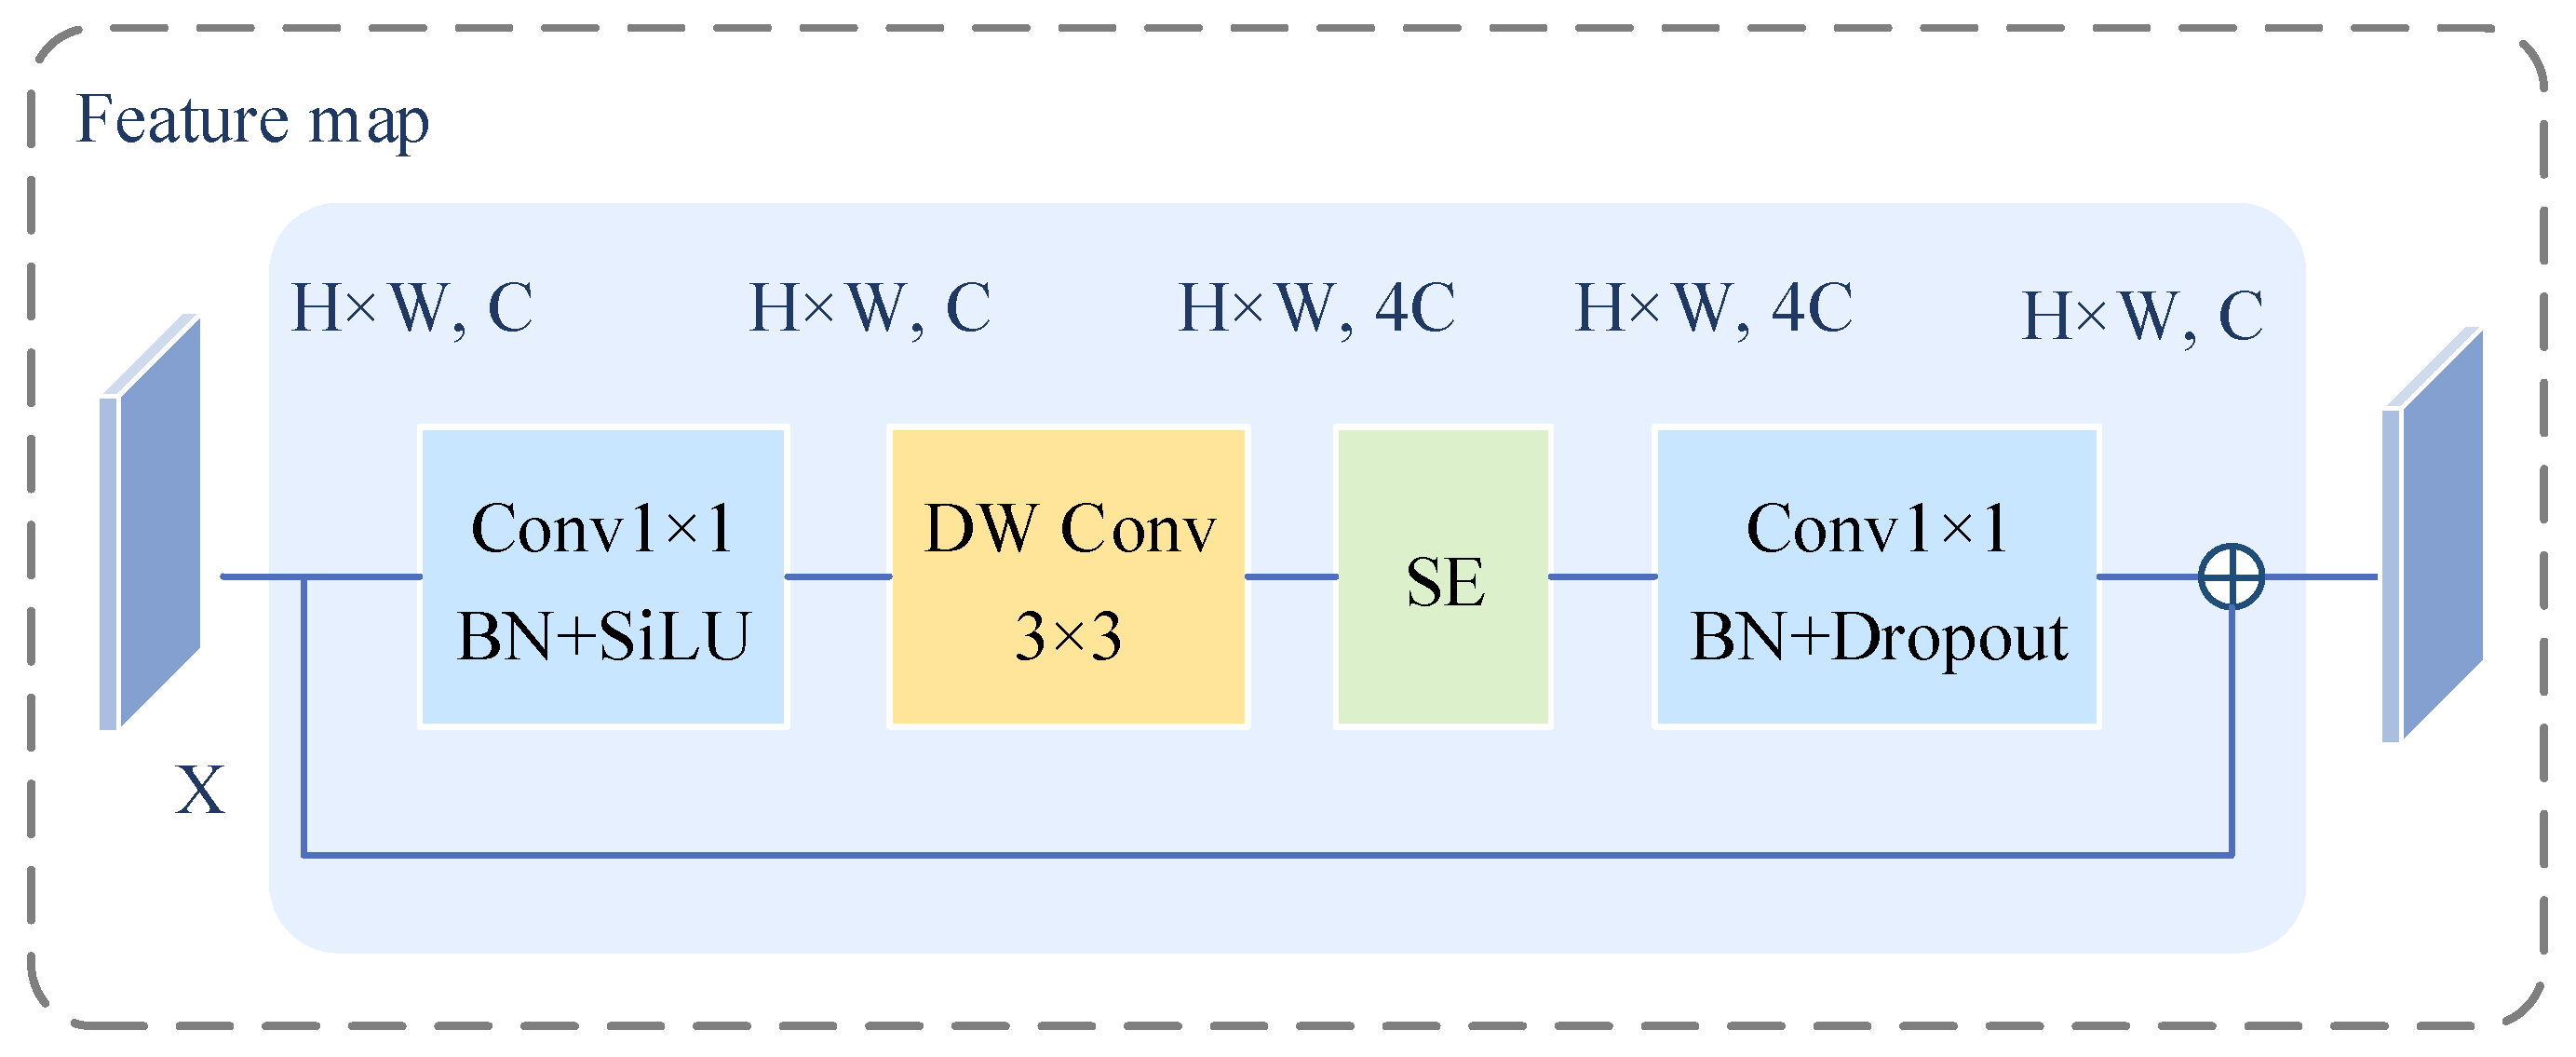
The fundamental building block of EfficientNetV1 is the Mobile Inverted Bottleneck Convolution module (MBConv), as illustrated in Figure 5. This module is adapted from the inverted residual module found in MobileNetV2. Efficient feature extraction is facilitated through standard convolution, batch normalization (BN), the SiLU activation function, depthwise convolution (DWConv), and the channel attention module known as Squeeze-and-Excitation (SE).
Figure 5.
The MBConv module, the fundamental building block of EfficientNetV1. It integrates convolution, batch normalization, SiLU activation, depthwise convolution, and Squeeze-and-Excitation (SE) attention for efficient feature extraction.
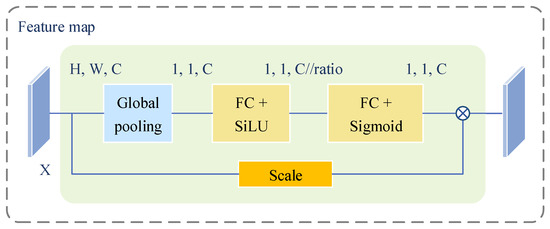
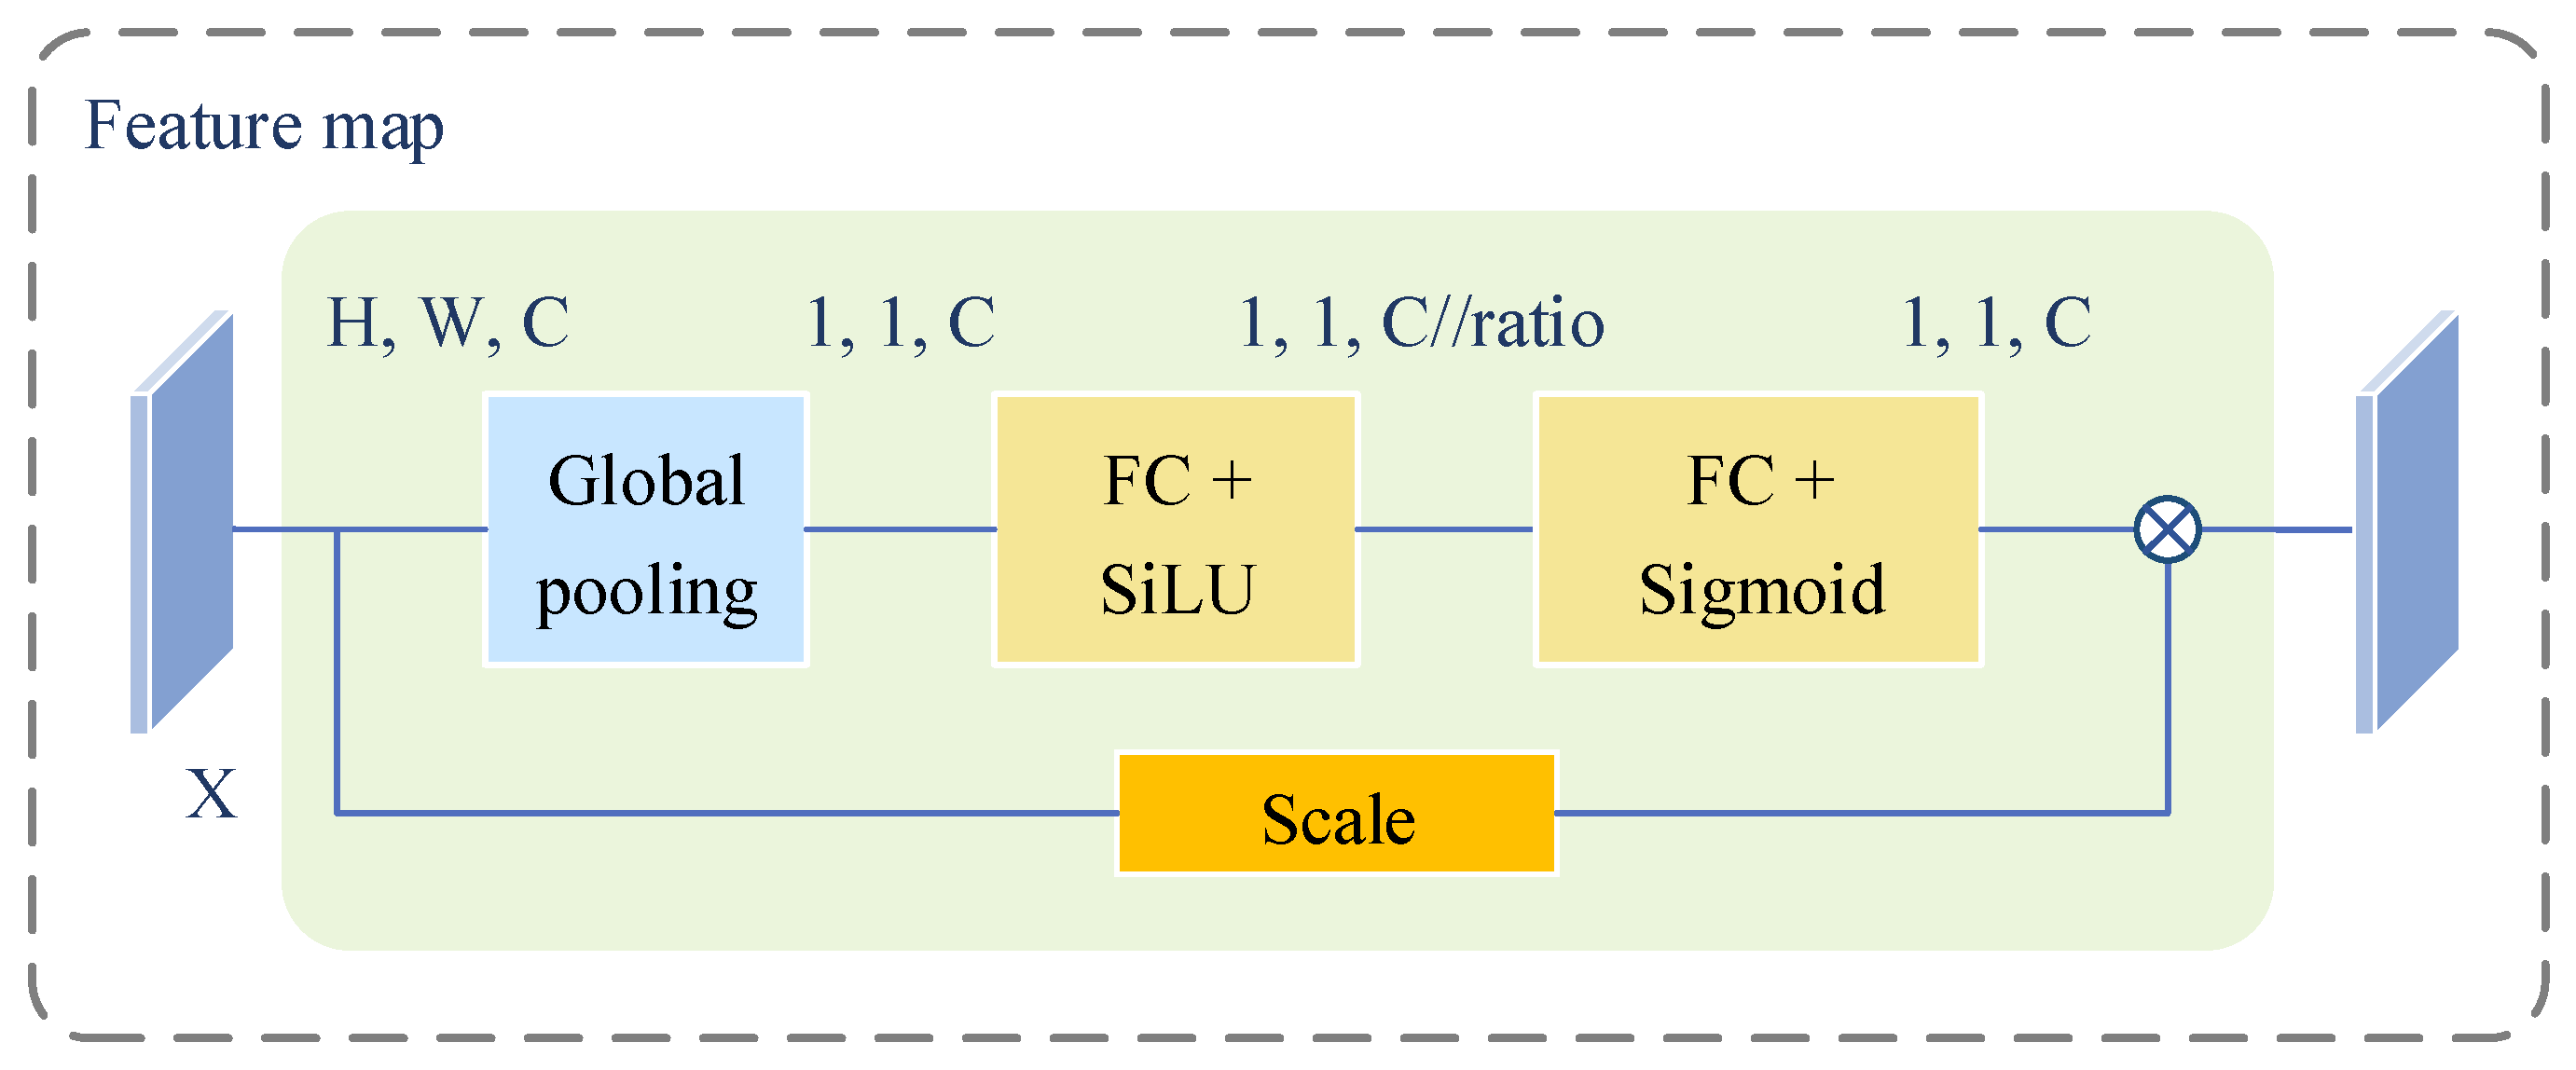
The structure of the SE channel attention module is illustrated in Figure 6. Although EfficientNetV1 maintains a relatively high spatial resolution for input images in the network’s shallow layers, it exhibits limited sensitivity to variations in feature details. This limitation constrains the potential for enhancing model accuracy and diminishes overall training efficiency.
Figure 6.
SE module. The SE module consists of global average pooling, two fully connected layers, and element-wise multiplication to learn channel-wise attention weights for adaptive feature recalibration.
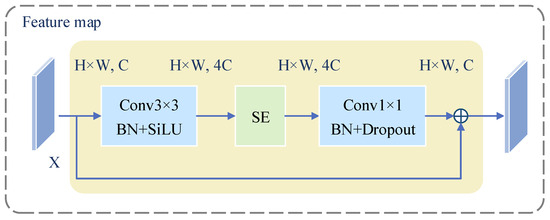
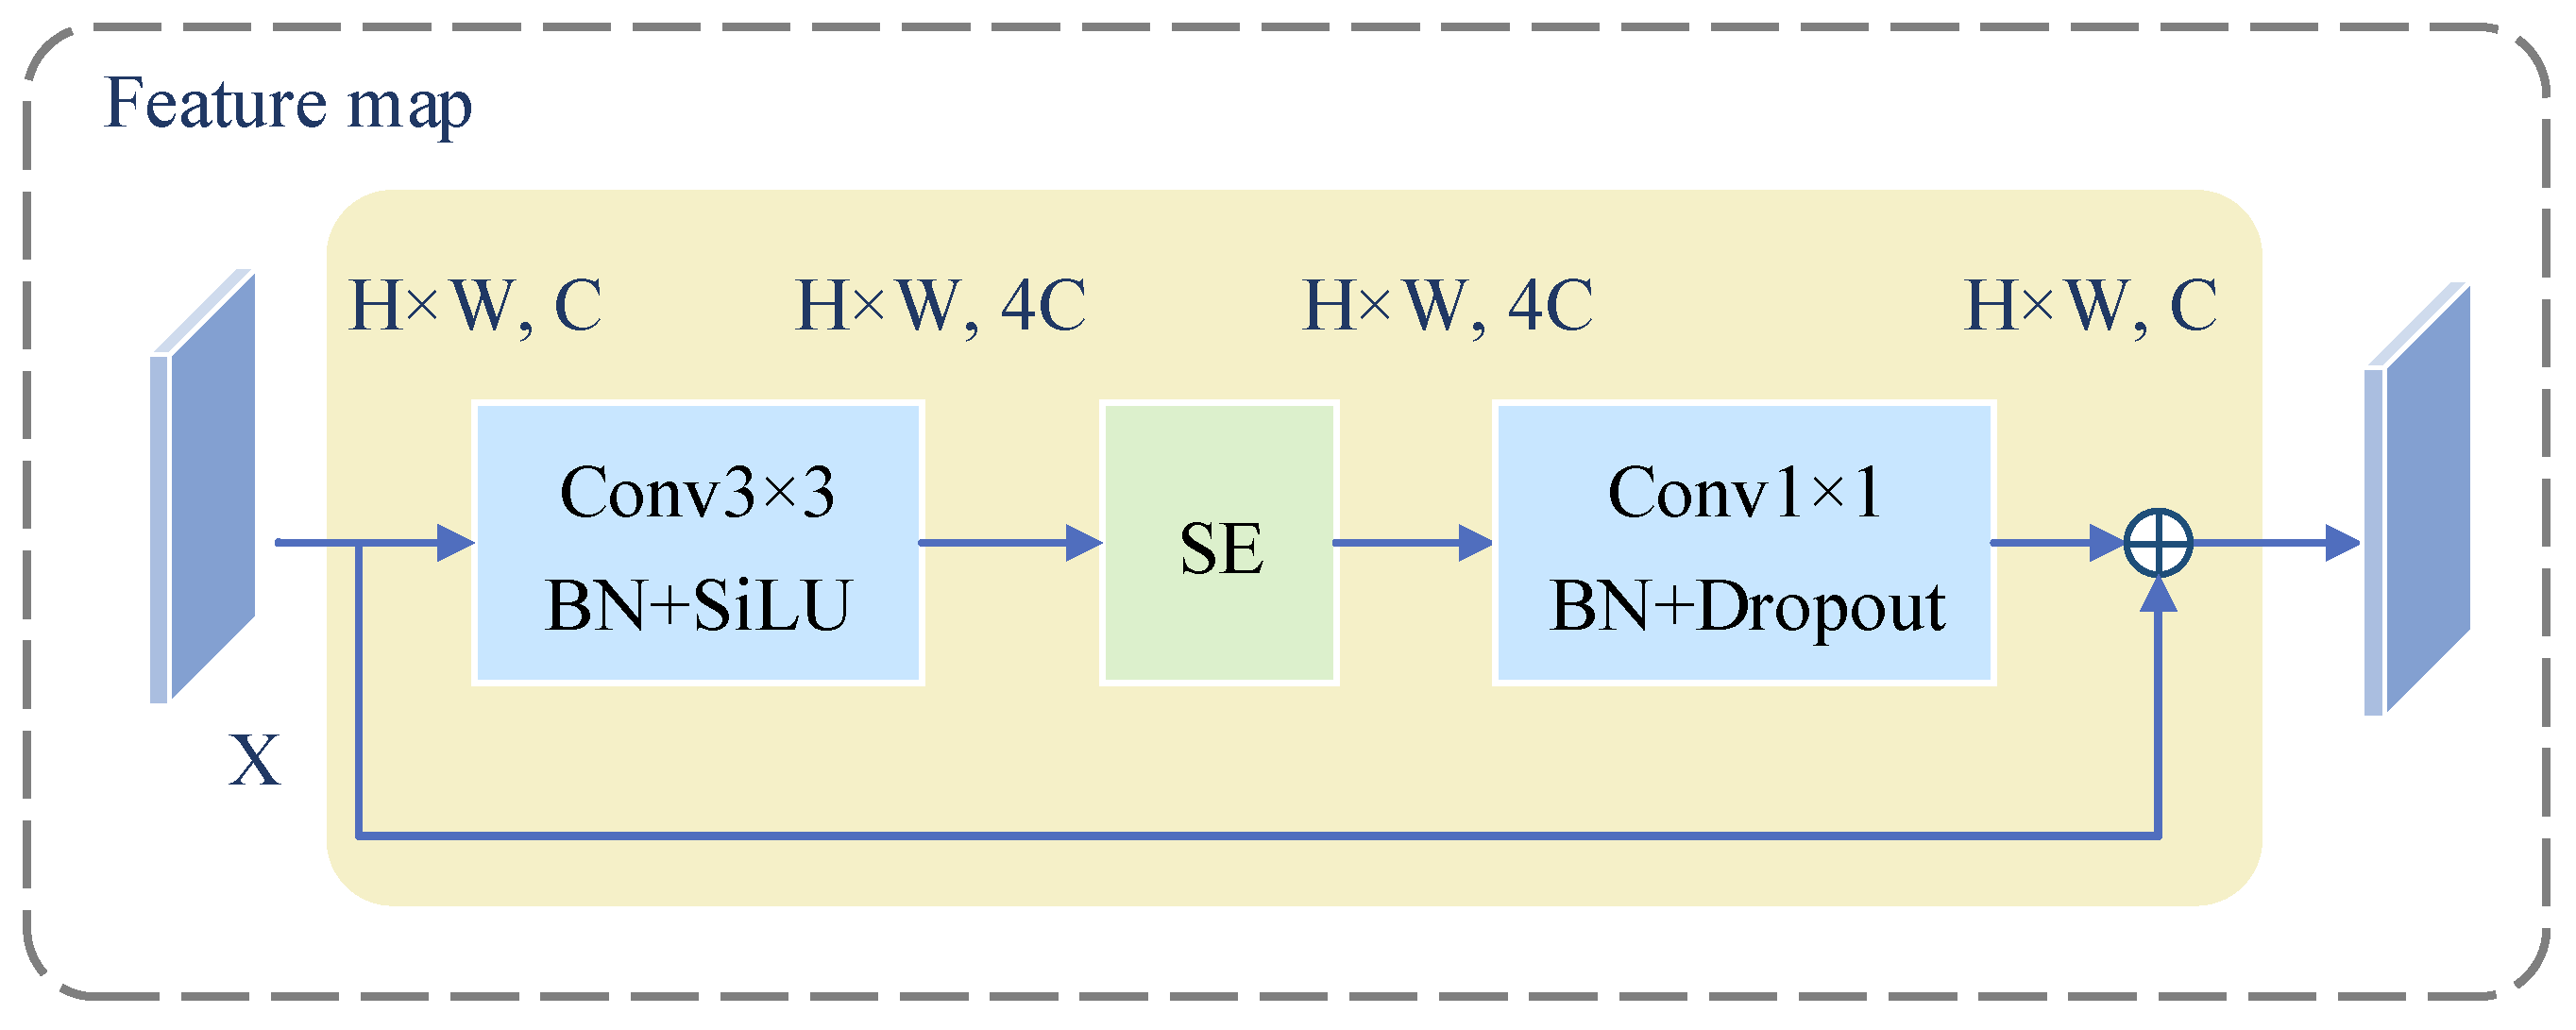
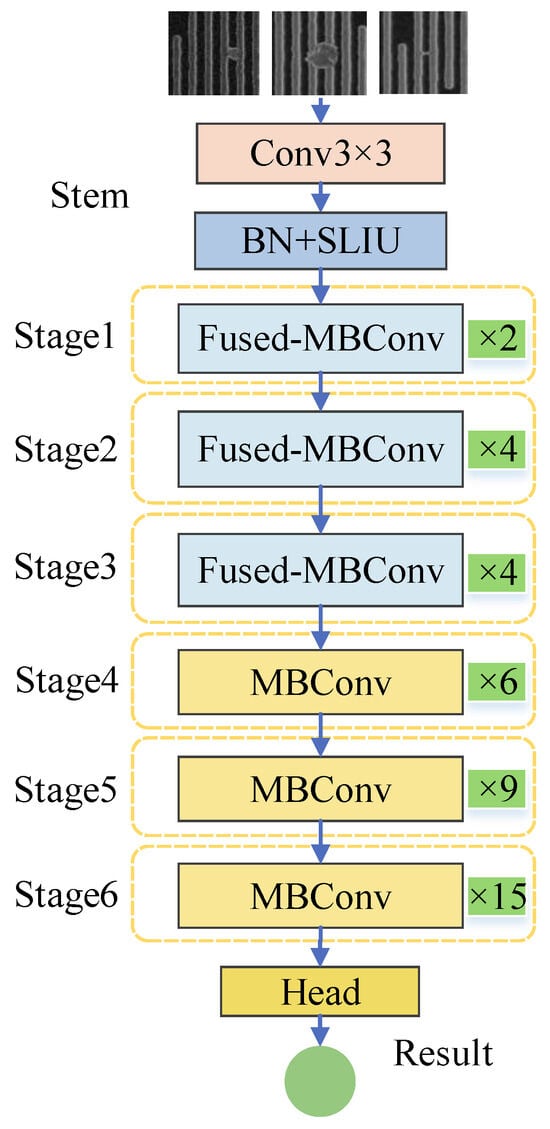
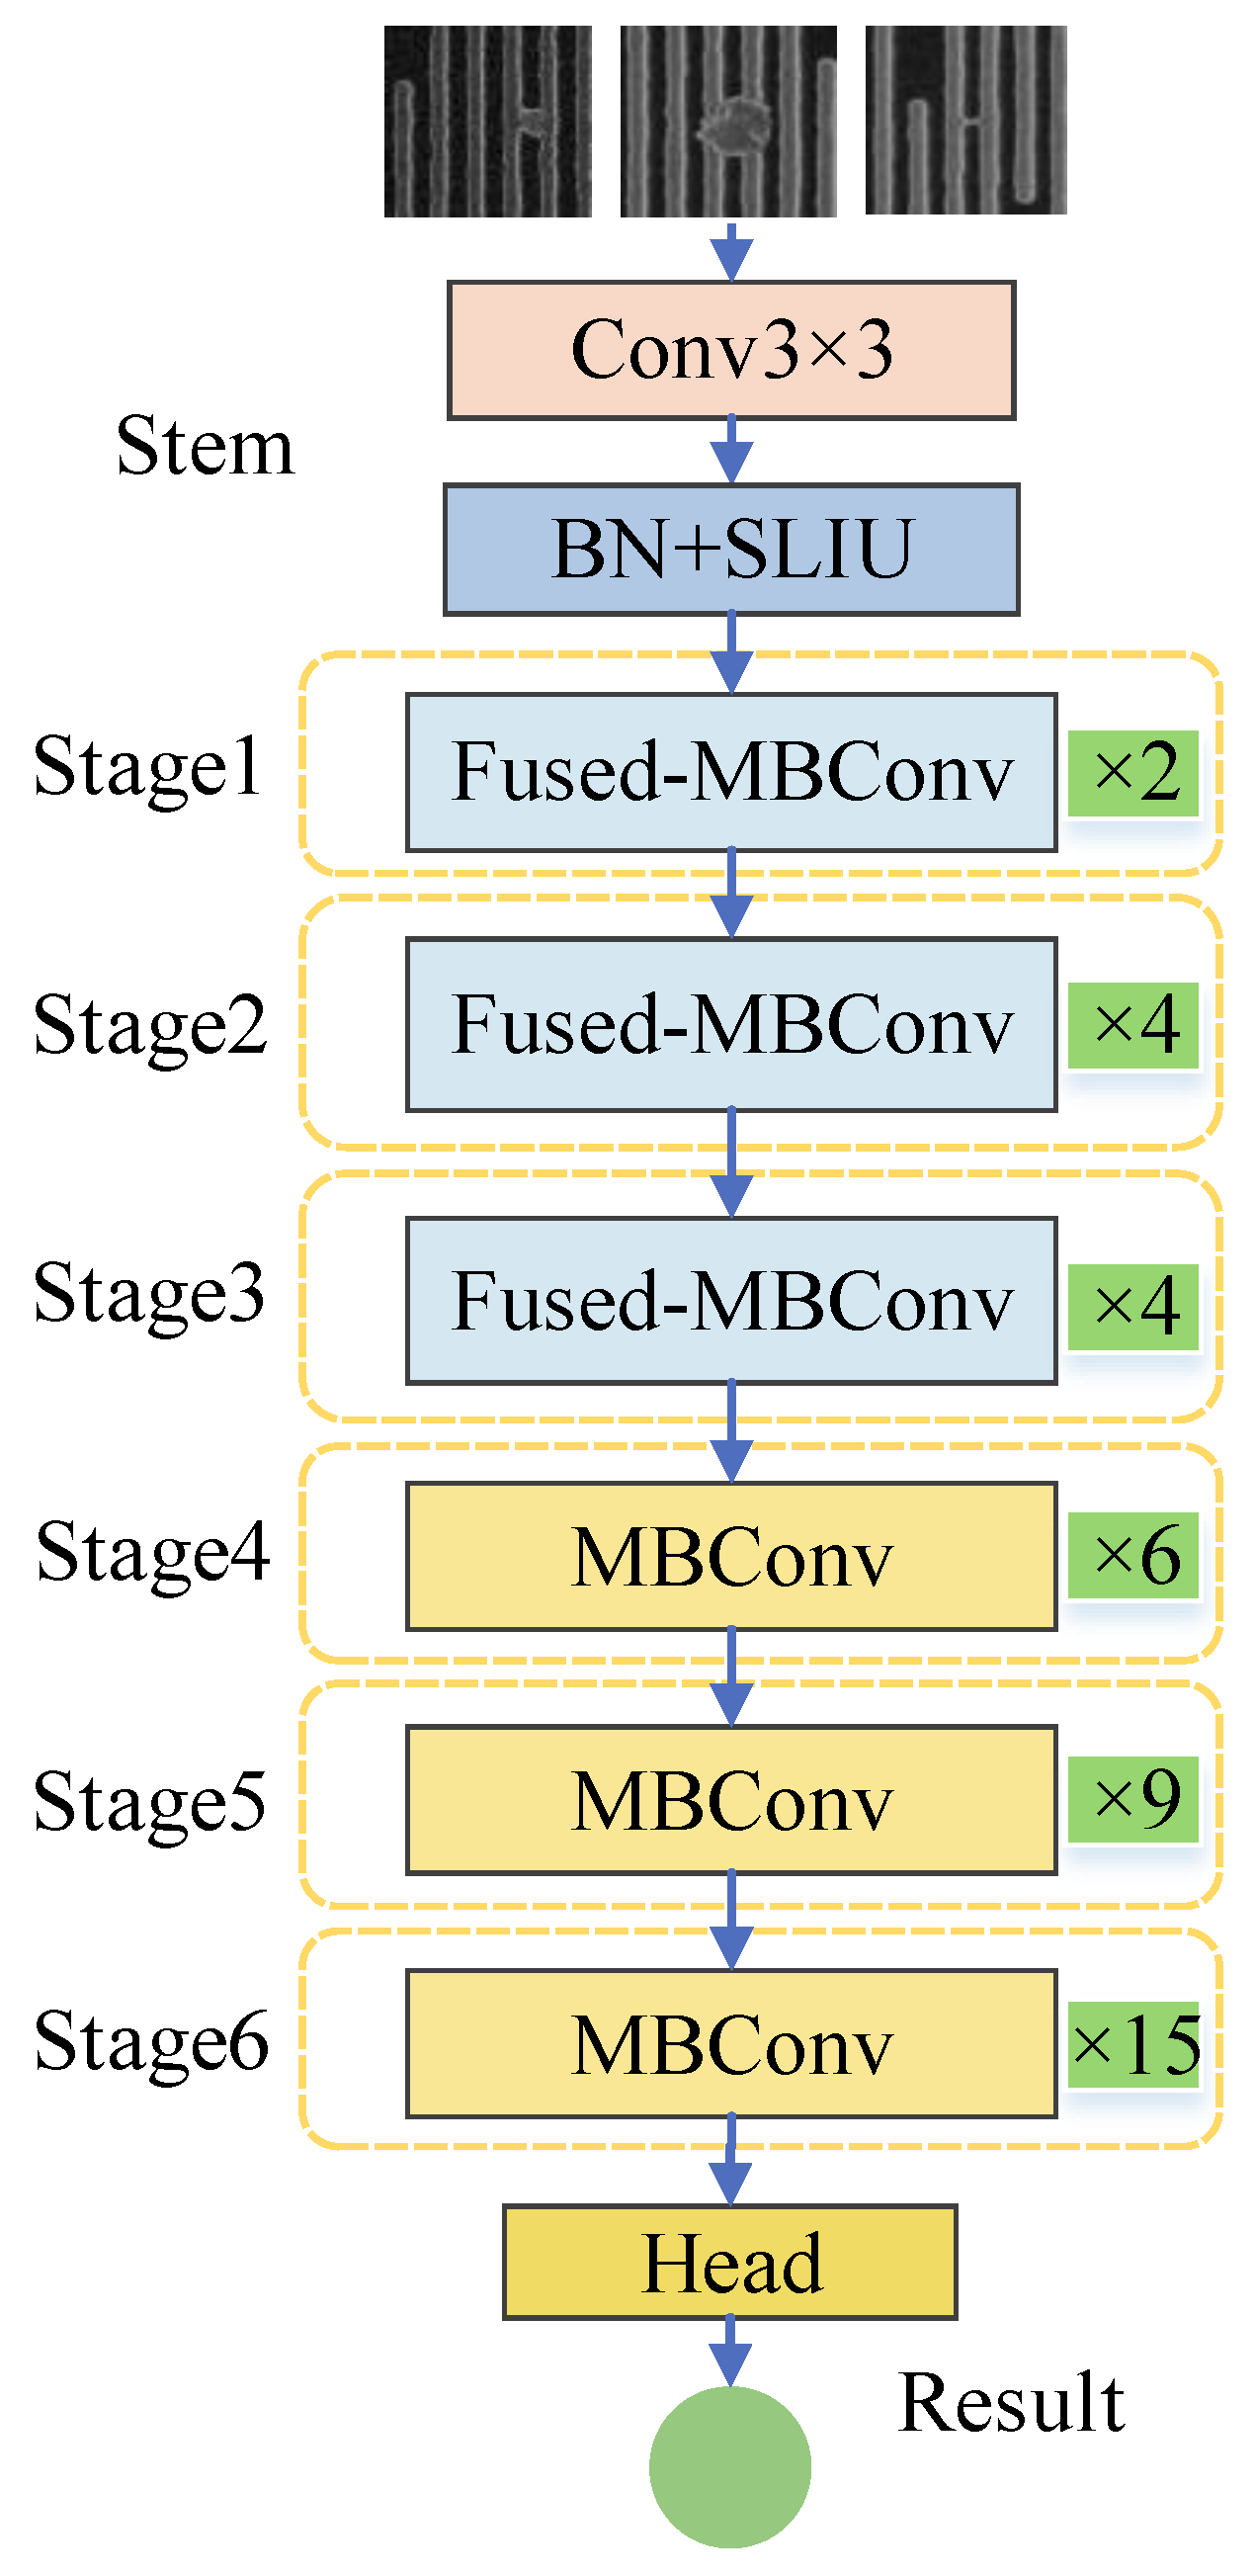
EfficientNetV2 is an improved version proposed by Google in 2021. It addresses the deficiencies of the V1 version, such as slow training speed and low efficiency, by improving the network structure, scaling rules, and training strategies. The shallow layer of EfficientNetV2 utilizes the Fused Mobile Inverted Bottleneck Convolution (Fused MBConv) module, which offers higher computational efficiency. A progressive learning approach was implemented to significantly accelerate the training process. The structure of the Fused MBConv module involves a 3 × 3 standard convolution replacing the depth-separable convolution and 1 × 1 expanded convolution in MBConv, thereby simplifying the network architecture and improving computational efficiency. The configuration of the Fused MBConv module is illustrated in Figure 7. For instance, in EfficientNetV2-S, three Fused MBConv modules and three MBConv modules are integrated into the primary network to achieve a balance between computational efficiency and model performance, as illustrated in Figure 8.
Figure 7.
Fused-MBConv module. As a modified variant of the standard MBConv block, the Fused MBConv replaces the depthwise separable convolution and 1 × 1 expansion convolution in the original MBConv with a single 3 × 3 standard convolution.
Figure 8.
Architecture diagram of EfficientNetV2-S. The network consists of three Fused MBConv modules with 2, 4, and 4 layers respectively, as well as three MBConv modules with 6, 9, and 15 layers respectively.
The structural design of EfficientNet is both scientific and rational, ensuring computational efficiency while achieving classification accuracy that significantly surpasses that of other architectures on widely used large-scale datasets, such as ImageNet. Furthermore, it exhibits robust feature expression capabilities and impressive generalization performance.
3.2. Improved EfficientNet Defect Classification Model
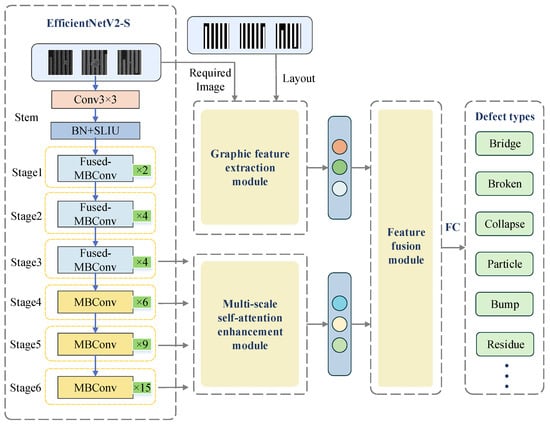
In the actual process, various types of defects exist on the wafer surface, each exhibiting complex geometric morphological characteristics in terms of shape, size, and angle. The images of these defects captured by inspection equipment are often affected by external factors like image noise and contrast variations. This study introduces the Improved EfficientNet Defect Classification Model (IEDCM), which enhances defect classification accuracy. IEDCM combines automatic image feature extraction from EfficientNetV2 with manual feature extraction and feature merging before classification. Moreover, it incorporates a multi-scale self-attention enhancement module to better capture features of micro-scale and low-distinguishability defects. The network architecture of IEDCM, illustrated in Figure 9, comprises four main components: a convolutional network branch utilizing Fused-MBConv and MBConv modules from EfficientNetV2, a manual feature extraction (MFE) module, a multi-scale self-attention enhancement (MSSAE) module, and a feature fusion module. The graphics feature extraction module employs image processing techniques to extract diverse morphological features of defects, encompassing geometric, moment, and texture features. Subsequently, the feature fusion module combines and integrates the feature vectors derived from the manual feature extraction module and the multi-scale self-attention enhancement module, followed by processing through a fully connected layer for classification.
Figure 9.
Architecture diagram of IEDCM. The network adopts EfficientNetV2 as the backbone, and consists of a manual feature extraction module, a multi-scale self-attention enhancement module and a feature fusion module.
3.3. Manual Feature Extraction Module
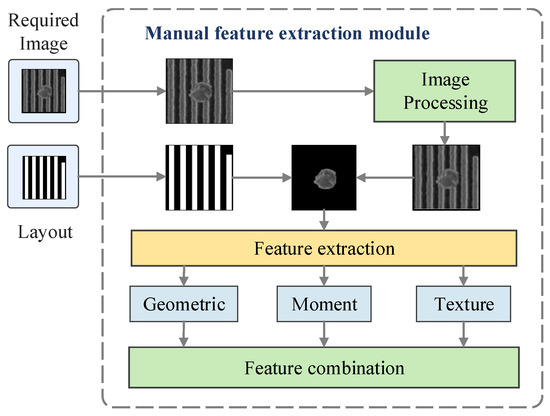
In the wafer defect classification task, solely inputting raw defect images into the neural network proves inadequate for capturing the subtle differences between defects, resulting in classification errors and reduced accuracy. To enhance the neural network classification performance and discrimination capabilities, it is essential to precisely locate and segment the defect regions on the wafer, and then extract graphic features specific to the defects, as illustrated in Figure 10. These features are subsequently integrated as supplementary data during both the training and inference stages of the neural network, complementing the intrinsic semantic features learned by the network. This approach optimizes the classification outcomes and boosts the model’s overall ability to generalize.
Figure 10.
Manual feature extraction module. This module extracts geometric features, moment features, and texture features from defect images, and concatenates them into a manual feature vector.
In the training of the classification model, feature selection is crucial for enhancing effective information and improving accuracy. In this chapter, considering the morphological and gray-scale distribution characteristics of wafer defect images, 27-dimensional defect feature information is extracted. Each defect is characterized by multiple features, and defect classification is assisted by comparing feature differences. The features extracted in this study are categorized into three main types: geometric features, moment features, and texture features.
Geometric features are extracted from the contour and size of the defect area to quantitatively describe the overall shape, area, and regularity of the defect, which can intuitively reflect the external morphological characteristics of the defect. The main feature parameters extracted include perimeter, area, major axis, minor axis, eccentricity, ellipticity, and circularity. Moment features analyze the binary distribution of the defect area to determine parameters such as centroid position, orientation angle, and distribution dispersion by calculating the first-order and second-order moments. This method provides complementary information to basic geometric features and effectively describes the properties of complex defect contours. Texture features, including contrast, correlation, energy, and entropy, focus on the fine structure of the defect surface and gray-scale spatial correlation to characterize texture roughness, uniformity, and complexity. They reveal subtle texture differences imperceptible to the naked eye, improving the model’s ability to distinguish similar defects.
The extraction methods of geometric features and moment features are as follows: After defect detection, a binary distribution map of the defect can be obtained. Morphological preprocessing is performed on the segmented binary image of the defect to eliminate edge burrs and isolated pixels to ensure the integrity of the contour. Then, relevant parameters are calculated by traversing the edge pixels of the defect, counting the number of pixels in the defect area, fitting the minimum circumscribed rectangle and ellipse, etc. Texture features are extracted using the gray-level co-occurrence matrix (GLCM) method to capture the gray-scale spatial correlation and fine texture features of the defect surface from the segmented defect gray-scale image.
The selection of defect features must consider the classification type of the defect. The defect types discussed in this article are closely associated with the shape, texture, and gray-scale characteristics of the defects. Notably, these defect types are randomly distributed across the chip and lack a fixed orientation. Consequently, the directional angle and positional attributes of the defects do not aid in distinguishing between the defect types presented herein. Additionally, the original feature set exhibits significant correlation and information redundancy. Given these considerations, this article selects features such as area, perimeter, circularity, lightness, Hu moments, second-order moments, contrast, correlation, angular second moment, and variance. Comparative analysis of the experimental results demonstrates that these selected features effectively correspond to the defect types discussed in this paper and significantly enhance the accuracy of defect classification.
3.4. Multi-Scale Self-Attention Enhancement Module
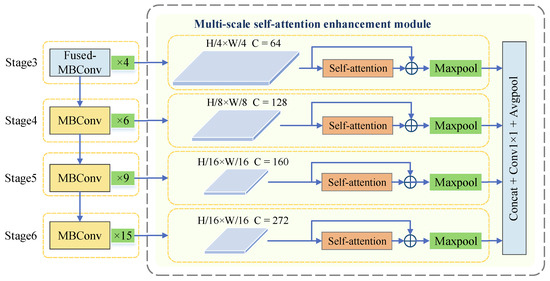
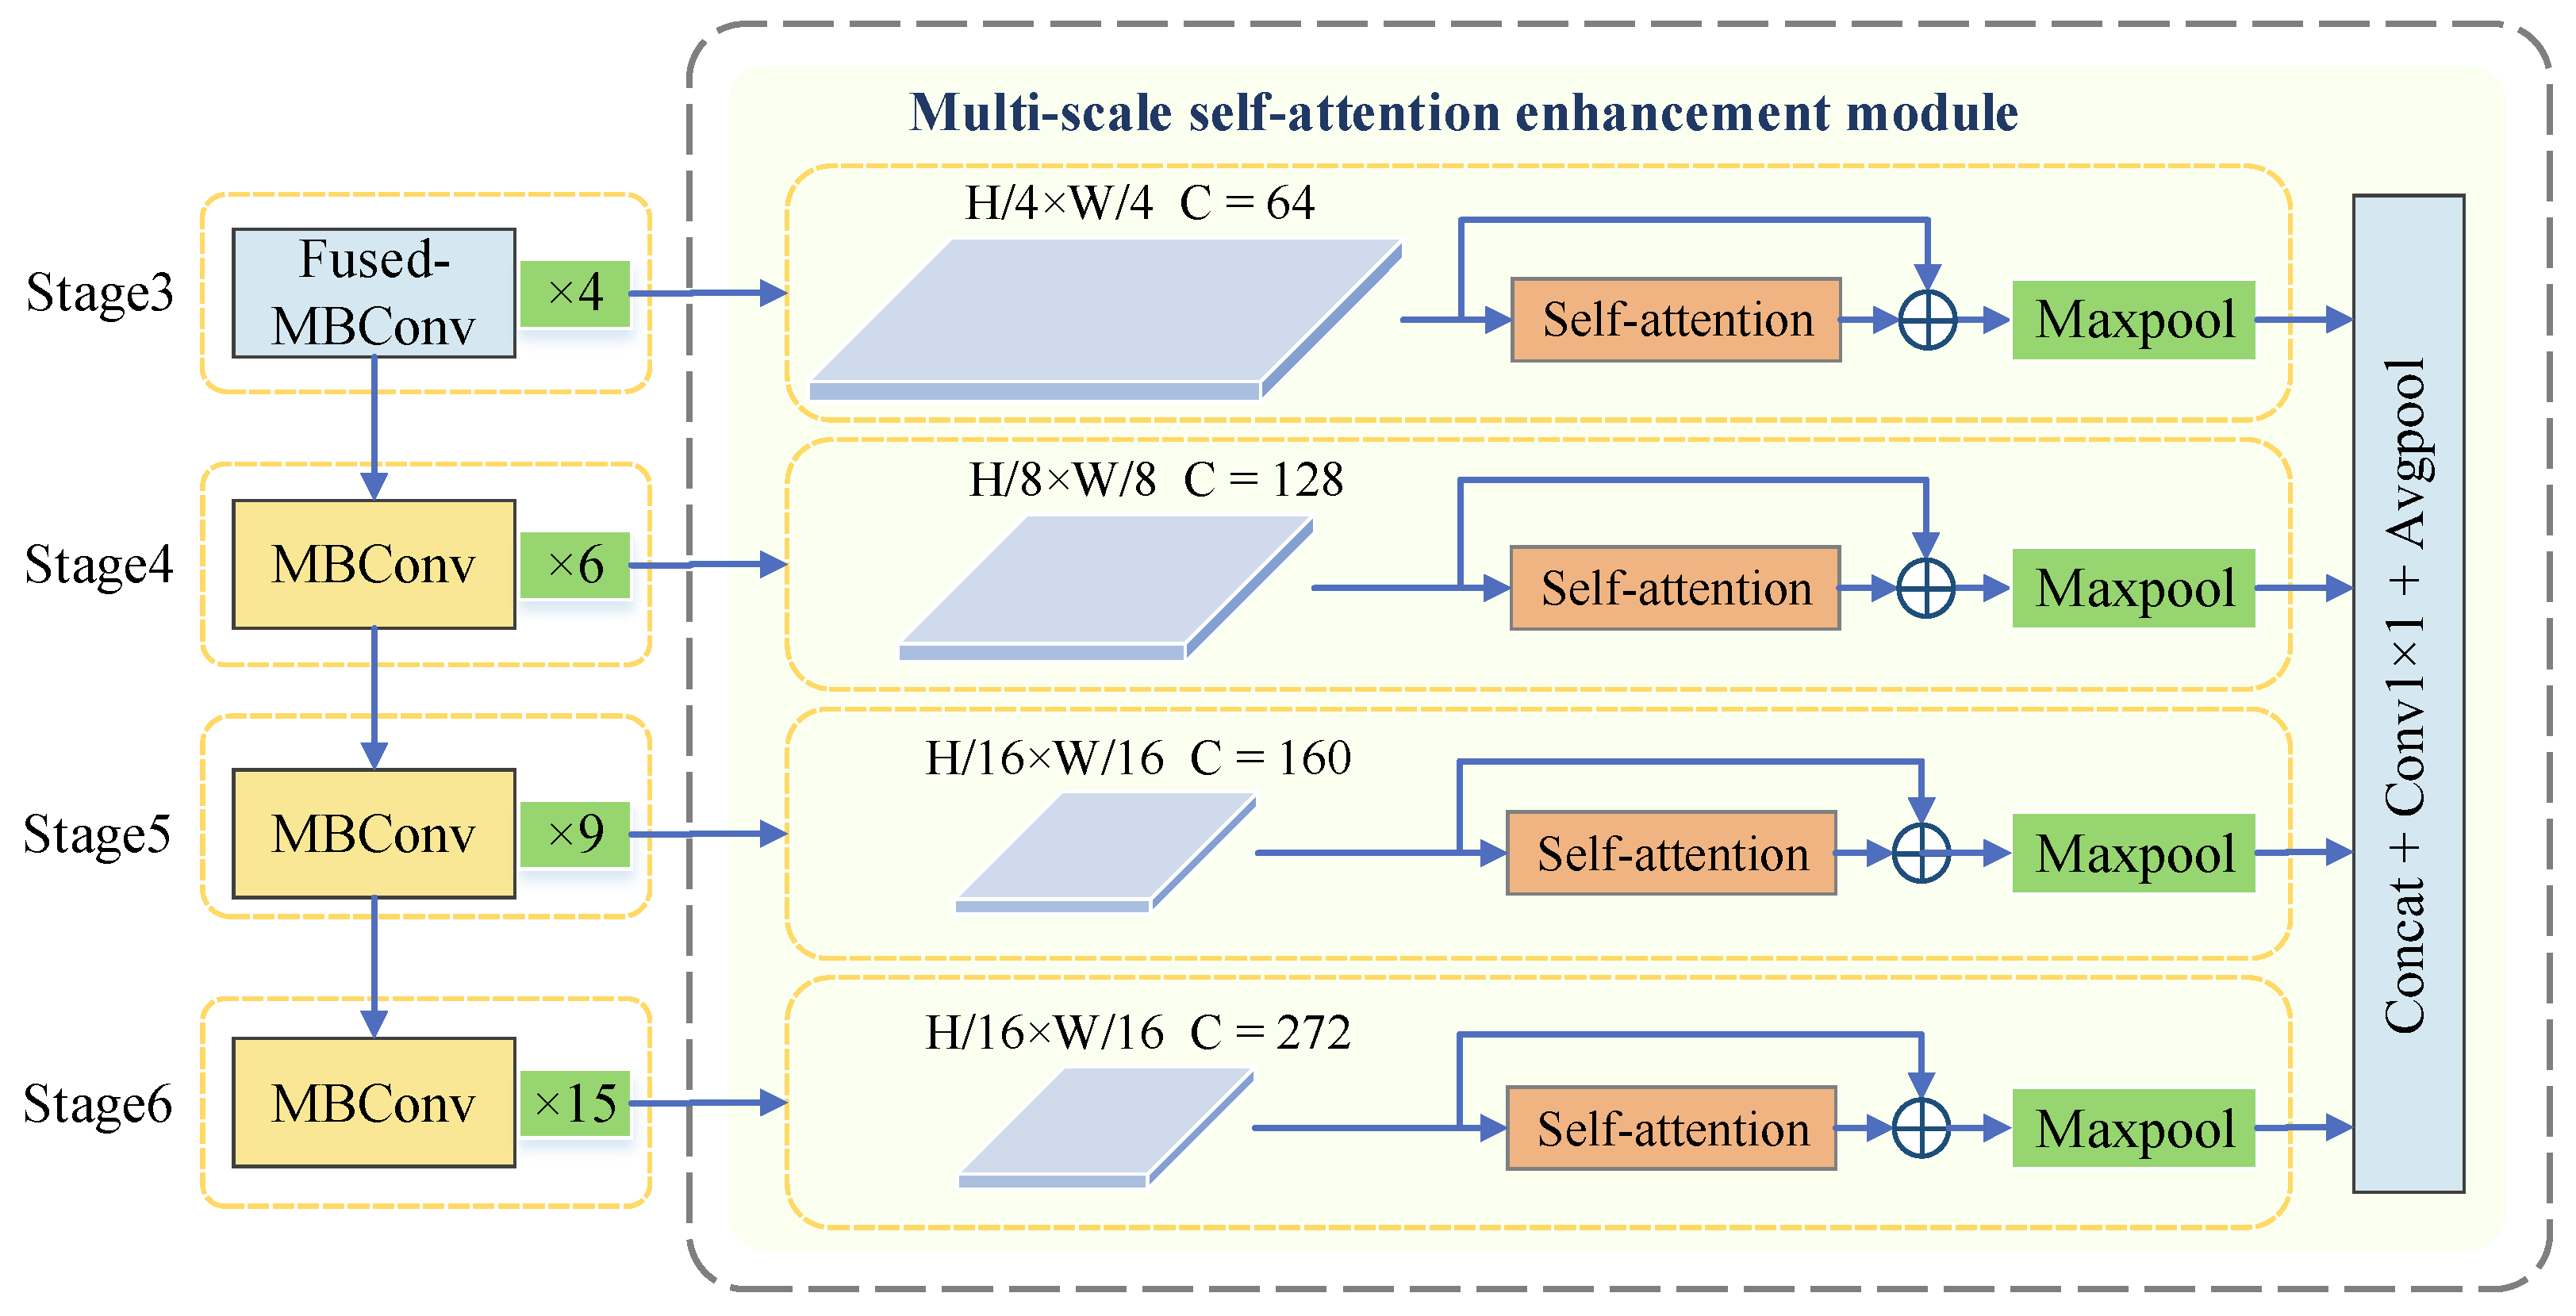
The multi-scale self-attention enhancement module consists of four parallel branches, aiming to obtain spatial context information at different levels and enhance relevant features through the self-attention mechanism. The implementation of the self-attention mechanism is illustrated in Figure 11. To effectively integrate shallow and deep feature information, the module extracts feature maps from the third, fourth, fifth, and sixth stages of EfficientNetV2, assigning them to four distinct branches. Each branch is processed through a self-attention enhancement block. Following this, the features from all branches are concatenated and fused, and the feature vector is derived through a global average pooling layer.
Figure 11.
Multi-scale self-attention enhancement module. This module extracts feature maps from the 3rd, 4th, 5th, and 6th stages of the backbone network and assigns them to four separate branches with progressively decreasing scales.
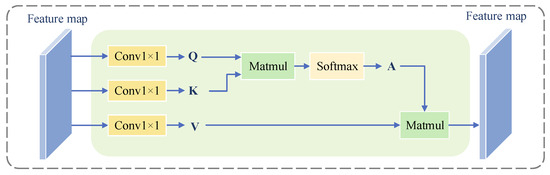
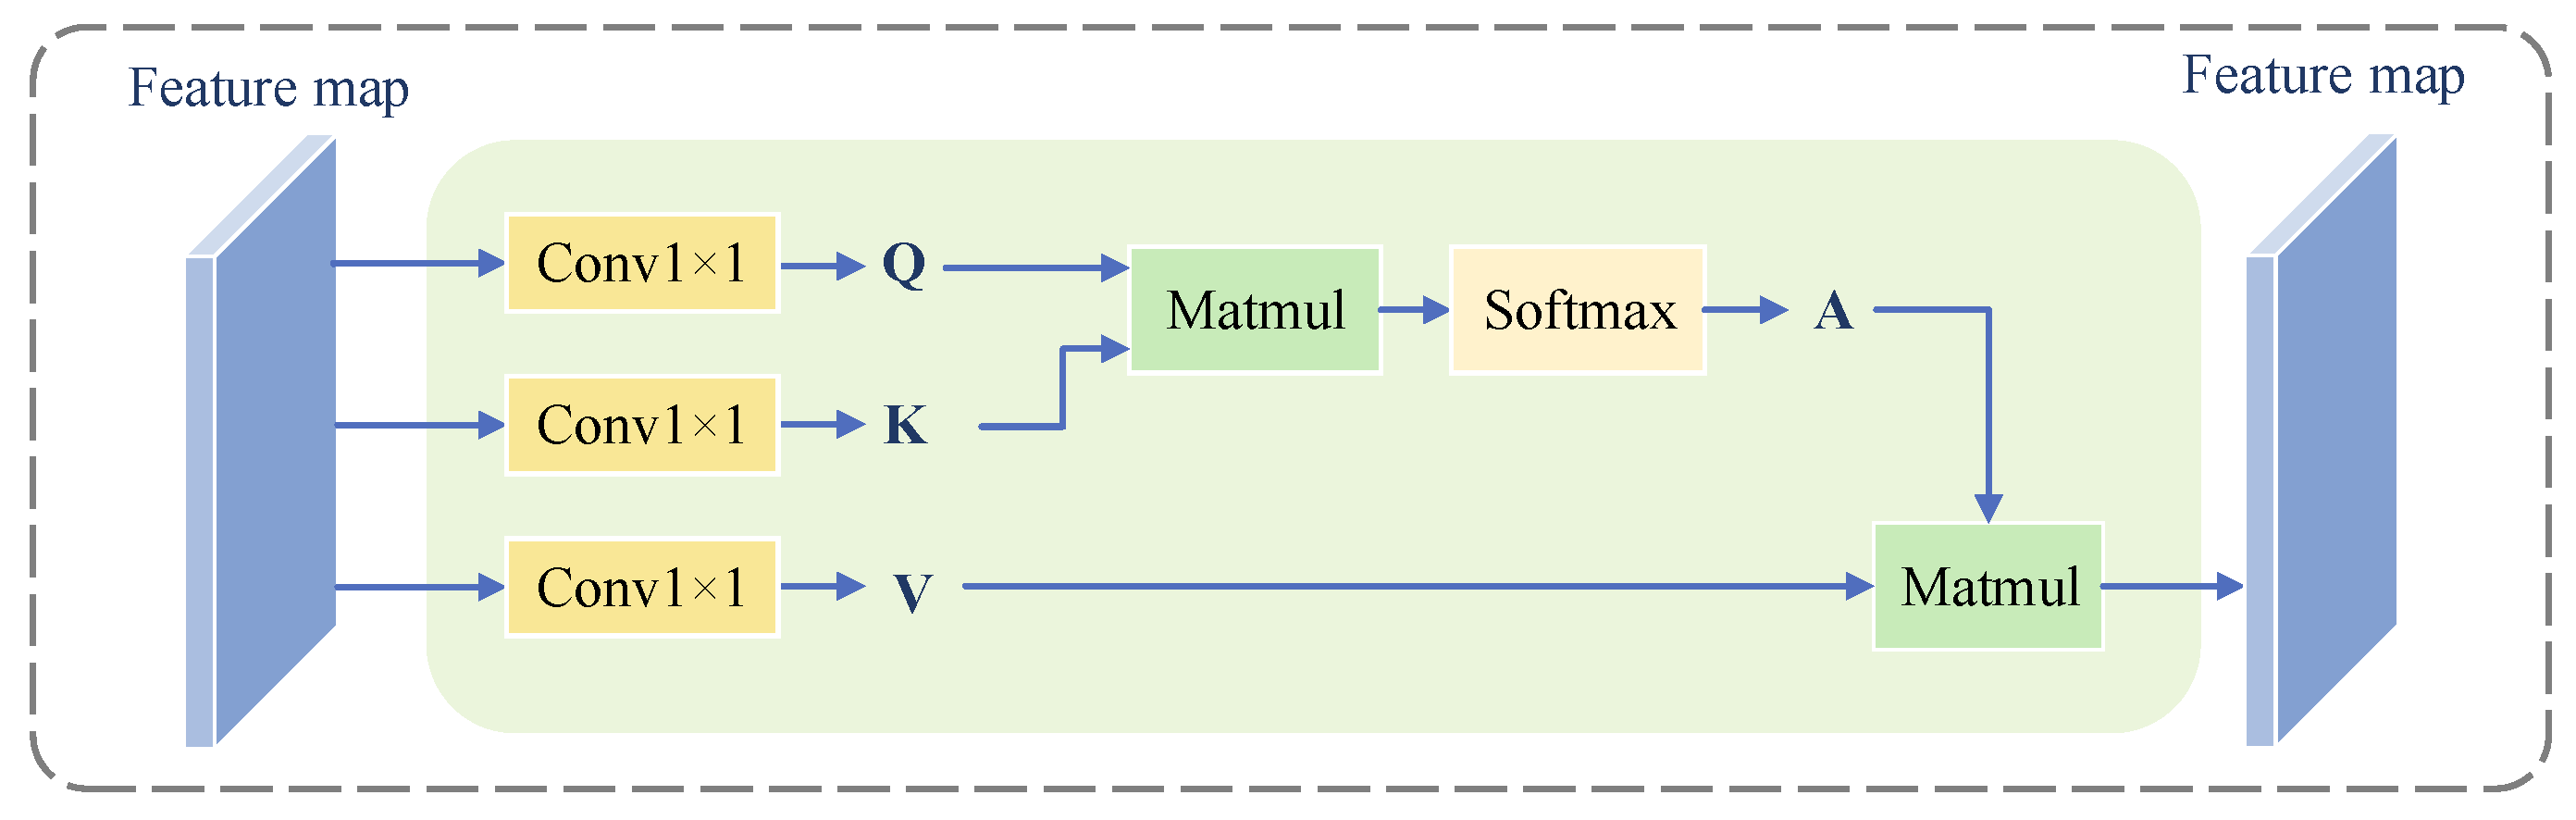
The self-attention enhancement module initiates with a max pooling operation on the input feature map of each branch to standardize their sizes, and then applies the self-attention mechanism to enhance them. This process includes adjusting the attention with learnable scaling parameters and establishing a residual connection with the original input features. The implementation of the self-attention mechanism is illustrated in Figure 12, where three distinct 1 × 1 convolutional layers project the input features into matrices Q, K, and V in different spaces. The similarity between Q and K is calculated through matrix multiplication, followed by normalization using the Softmax function to obtain the attention map A. The resulting attention weight A is used to perform a weighted sum on the value V, generating the enhanced feature map output.
Figure 12.
Self-attention mechanism. The query (Q), key (K), and value (V) can capture the global contextual information and enhance the multi-scale features.
3.5. Feature Fusion Module
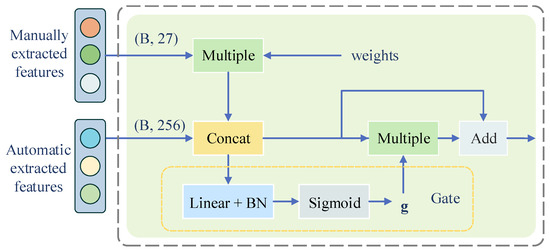
For the diverse features extracted by the multi-scale self-attention enhancement module and the manual feature extraction module, this paper adopts a strategy based on adaptive concatenation and gated attention-guided fusion [25]. As illustrated in Figure 13, the 27-dimensional manual features are adaptively weighted and then concatenated with 256-dimensional automatic features. The fused features are fed into a gated unit consisting of a linear layer, batch normalization and a Sigmoid activation function to generate adaptive weights g, which are multiplied with automatic features element-wisely with a residual connection to enhance critical defect-related features and suppress background noise. Compared with basic channel concatenation and standard weighted fusion, the gated fusion dynamically enhances key defect features and reduces background noise using adaptive weight learning.
Figure 13.
Feature fusion module. The module concatenates manually extracted and automatic extracted features, and then applies the gate mechanism to produce fusion features.
4. Experiments and Analysis
This section systematically outlines the comprehensive construction process of the lithography defect dataset and the experimental plan for model training and validation utilizing this dataset. The central premise of this framework is to develop a mathematical model for defect generation, which through standardized and reproducible technical processes accurately simulates typical defects encountered in the process flow. This approach yields high-quality, reliably labeled training data for the artificial intelligence defect detection model. Initially, this section introduces the categories, characteristics, and generation methods of typical simulated defects, along with strategies for defect detection and labeling. Subsequently, it elucidates the overall composition and category distribution of the dataset. Finally, a detailed overview of the experimental setup is presented, encompassing the training processes and performance evaluation schemes for various comparative models.
4.1. Simulated Defect Dataset
This paper constructs a wafer defect simulation dataset that provides highly realistic and high-quality experimental data to support training and validation of the proposed model. The dataset is built on typical line-space periodic patterns, supplemented by diverse mask structures from the ICCAD2019 mask pattern dataset. All original patterns are presented as binary images, clearly distinguishing photoresist and non-photoresist regions [26].
On the basis of the above results, image processing techniques are employed to intentionally introduce various typical wafer defects. This paper selects the most common defect types in industrial scenarios, which are frequent defects with a relatively sufficient data volume. Depending on the preset type, size, and location of each defect, the corresponding pixel information of the defect components is substituted into the images, resulting in simulated pattern structures with various defects. This approach not only ensures the rationality of defect distribution but also accurately reproduces various defect morphologies that occur in practical lithography processes, enhancing the practicality of the dataset.
Considering that practical wafer defect detection relies heavily on SEM imaging, we further improve the authenticity and fidelity of the dataset. We simulate the SEM imaging effect on the defect-containing structures, generating simulated SEM images with realistic gray-scale levels, surface textures, and noise characteristics that replicate the defect appearance under actual electron microscope scanning [27].
After generating the simulated SEM images, an image registration algorithm is applied to precisely align the images with the original binary mask designs, eliminating deviations such as displacement and distortion introduced during the imaging process. Subsequently, die-to-die and die-to-database matching algorithms are used to precisely locate and segment the defect regions, extracting local images that contain only the defect areas to ensure the targeted training of the subsequent model.
Finally, predefined defect types are associated with their corresponding segmented defect images and labels are assigned to these defect region images. All simulated SEM images are then integrated into a unified dataset with standardized annotations to establish the wafer defect dataset. The dataset provides reliable data support for subsequent model training and performance validation.
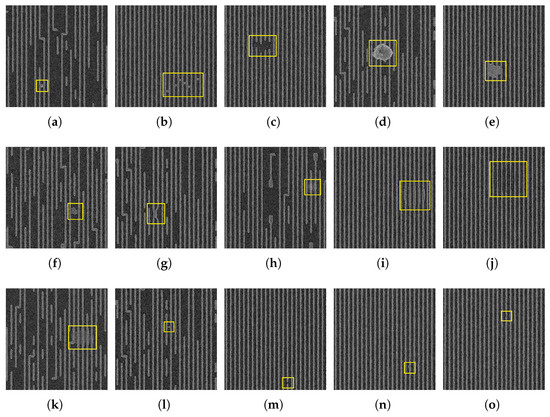
The total number of samples in the wafer defect dataset is 1500, covering 15 typical defect types with an average distribution of the number. Typical examples of various defect types are illustrated in Figure 14, and the specific numbers and defect size are presented in Table 1.
Figure 14.
Wafer defect simulation images. (a) Bridge; (b) multi-bridge; (c) missing pattern; (d) particle; (e) embedded; (f) residue; (g) collapse; (h) bump; (i) pattern attenuation; (j) pattern shrinkage; (k) pattern expansion; (l) micro-bridge; (m) broken; (n) extrusion; (o) intrusion.
Table 1.
Composition of wafer defect dataset.
4.2. Evaluation Metrics
In this paper, accuracy, precision, recall, and F1-score are used to evaluate the performance of the wafer defect classification model. Accuracy is defined as the ratio of the number of correctly predicted samples to the total number of samples, which is used to evaluate the comprehensive classification ability of the model. Precision is defined as the ratio of true positive samples to all samples predicted as positive. Recall is defined as the ratio of correctly predicted positive samples to all actual positive samples. The F1-score is the harmonic mean of precision and recall. The formulas for calculating each classification accuracy metric are as follows:
Here, , , , and represent true positive, true negative, false positive, and false negative, respectively.
4.3. Parameter Configuration of the Classification Model
All models were trained with a unified training protocol. A five-fold cross-validation strategy was adopted in the experiments. In each fold, the dataset was partitioned into 80% training set, 20% testing set. The default input resolution was 256 × 256 pixels. The optimization algorithm adopted the Adam optimizer, and the cross-entropy loss was selected as the loss function. Training was conducted for 100 epochs with a batch size of 32. A learning rate scheduling strategy combining linear warmup and cosine annealing was employed for stable convergence. Specifically, we set a linear warmup phase of 10 epochs, during which the learning rate linearly increased from zero to the initial learning rate. After the warmup stage, the learning rate decayed following the cosine annealing schedule with a minimum learning rate ratio of 0.2, ensuring gradual and stable reduction in the learning rate throughout the training process. The specific training hyperparameters of the EfficientNet model are detailed in Table 2, and the hyperparameters were determined through multiple rounds of comparative experiments.
Table 2.
Training hyperparameters.
All experiments were conducted on the same hardware platform to eliminate the influence of hardware differences on the experimental results. The specific hardware configuration is as follows: Intel Core i9-13900HX × 2.20 GHz CPU, NVIDIA GeForce RTX 4060 Laptop GPU, and the system memory is 32GB. All the experiments were implemented based on Python 3.10 and Pytorch 2.3.1, and CUDA 12.1 is employed to fully leverage GPU performance to accelerate the training speed. Table 3 summarizes the system specification.
Table 3.
System specification.
4.4. Analysis of Classification Results
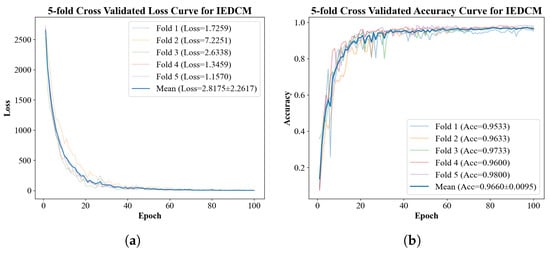
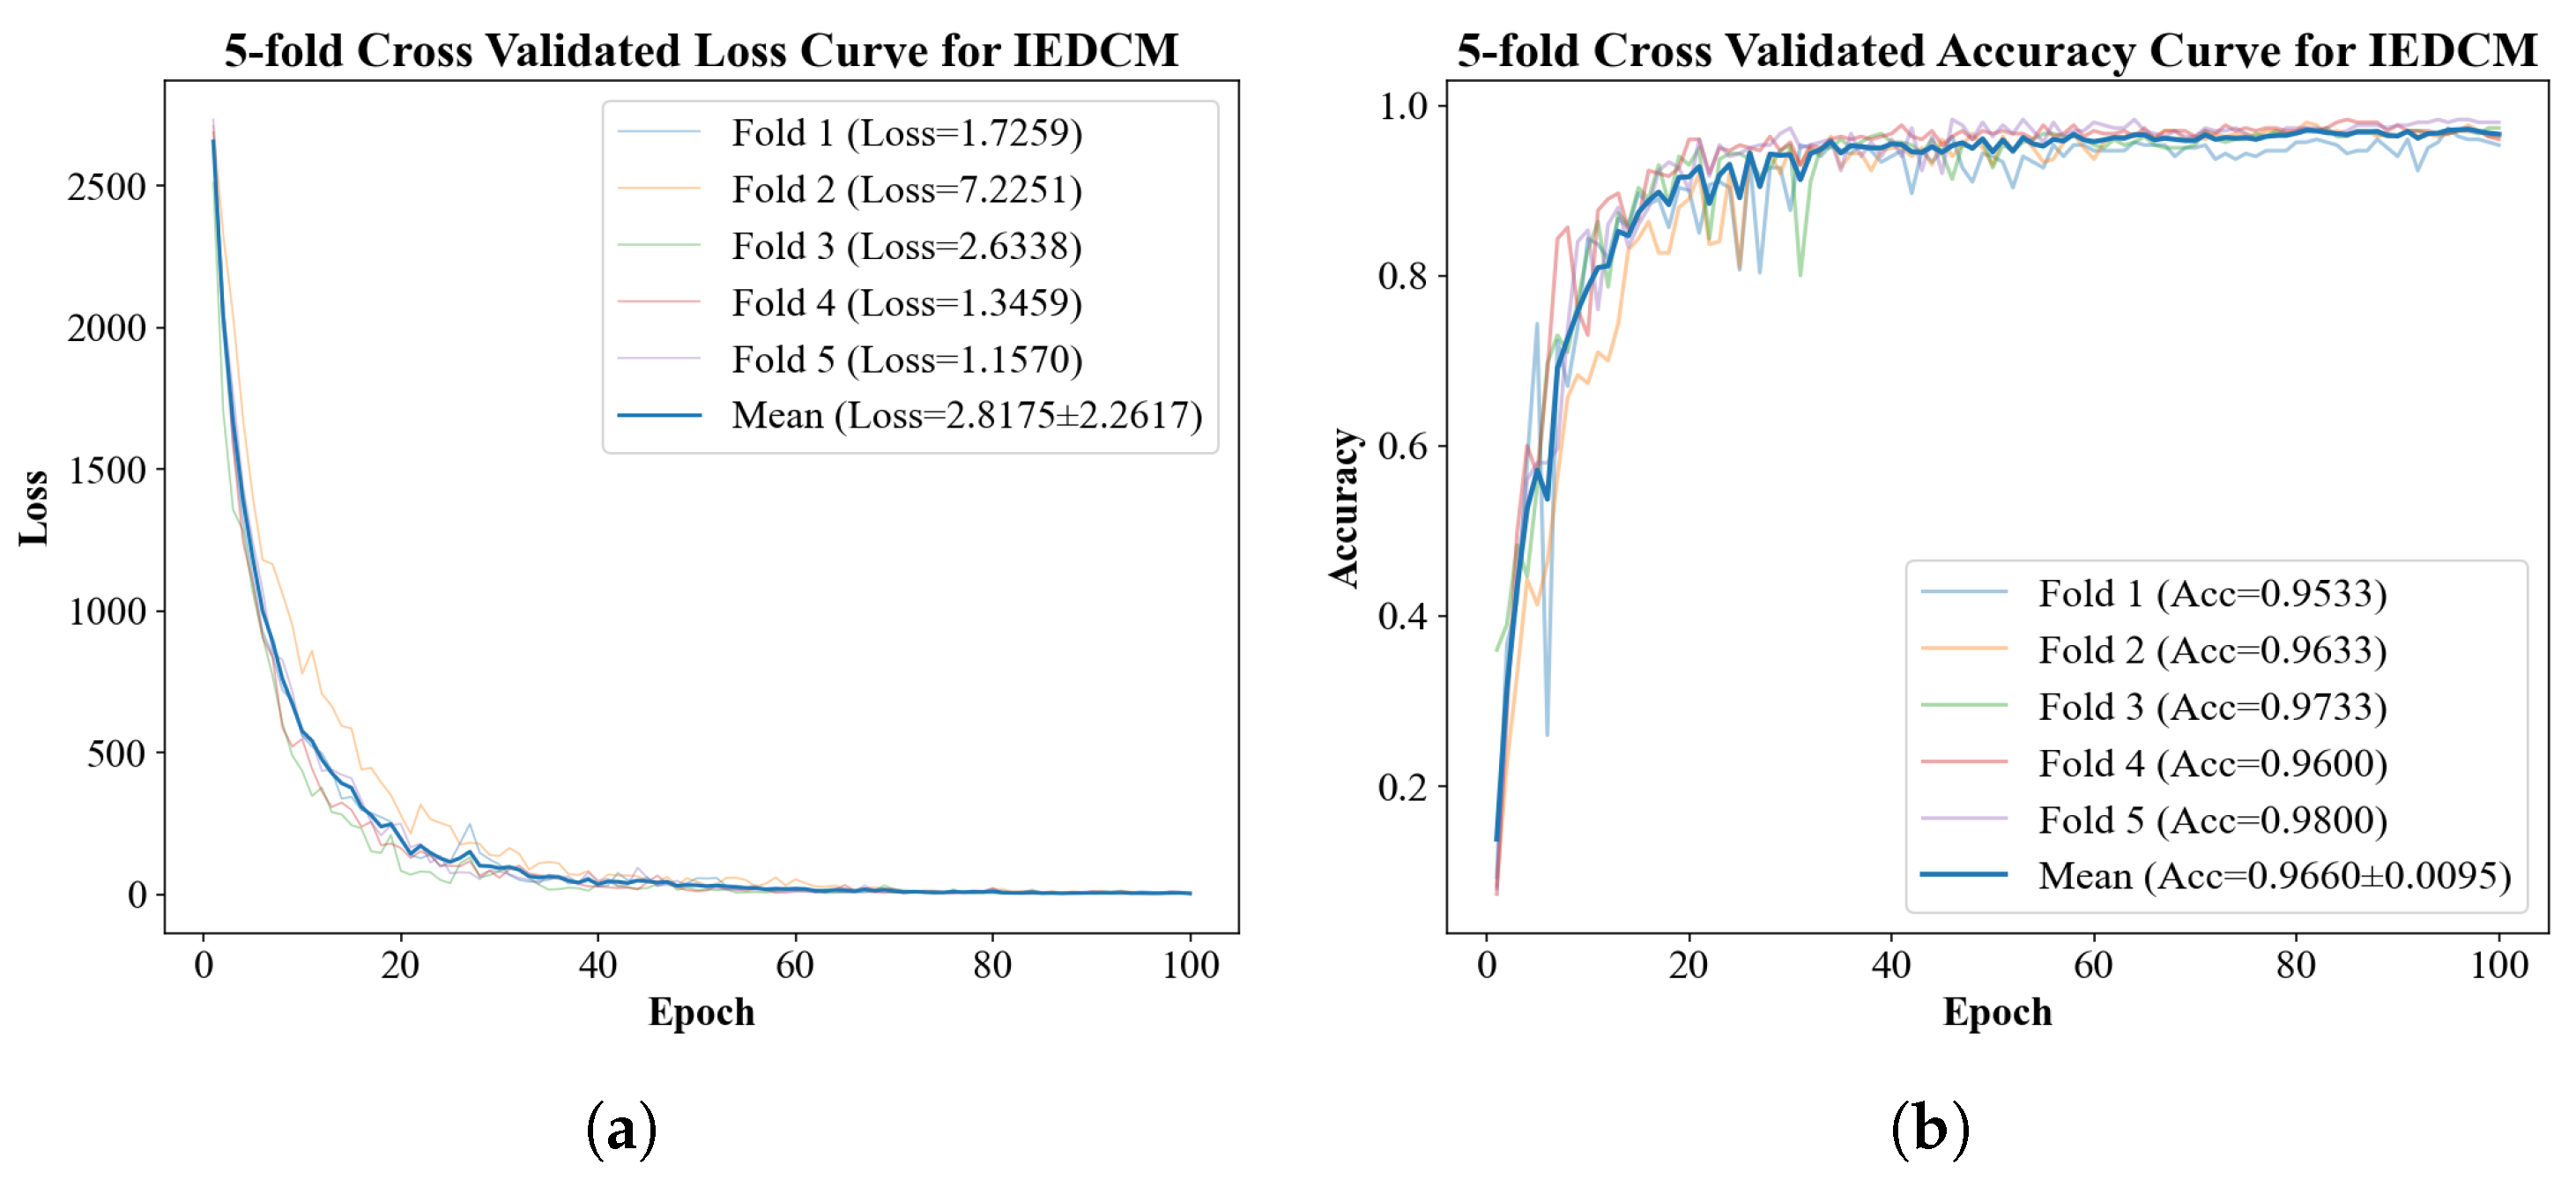
To comprehensively evaluate the stability and generalization capabilities of the proposed IEDCM, we conducted five-fold cross-validation on the dataset. The training loss and accuracy curves are illustrated in Figure 15. It can be observed that all the loss and accuracy curves exhibit smooth convergence and stabilize around 20 epochs without obvious fluctuations throughout the training process. The average cross-entropy loss over the five folds is quantified at 2.818, while the average classification accuracy of the five folds is 96.60% with a standard deviation of ±0.95%. The low standard deviation of the accuracy suggests that the proposed model exhibits low variance and considerable robustness to variations in data partitioning.
Figure 15.
Five-fold cross-validated training curve of IEDCM. (a) Loss curve; (b) accuracy curve. The loss and accuracy curves tend to stabilize around 20 training epochs, and achieve satisfactory performance after 100 epochs.
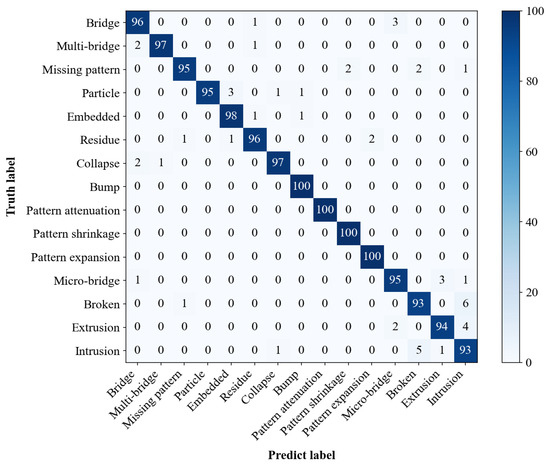
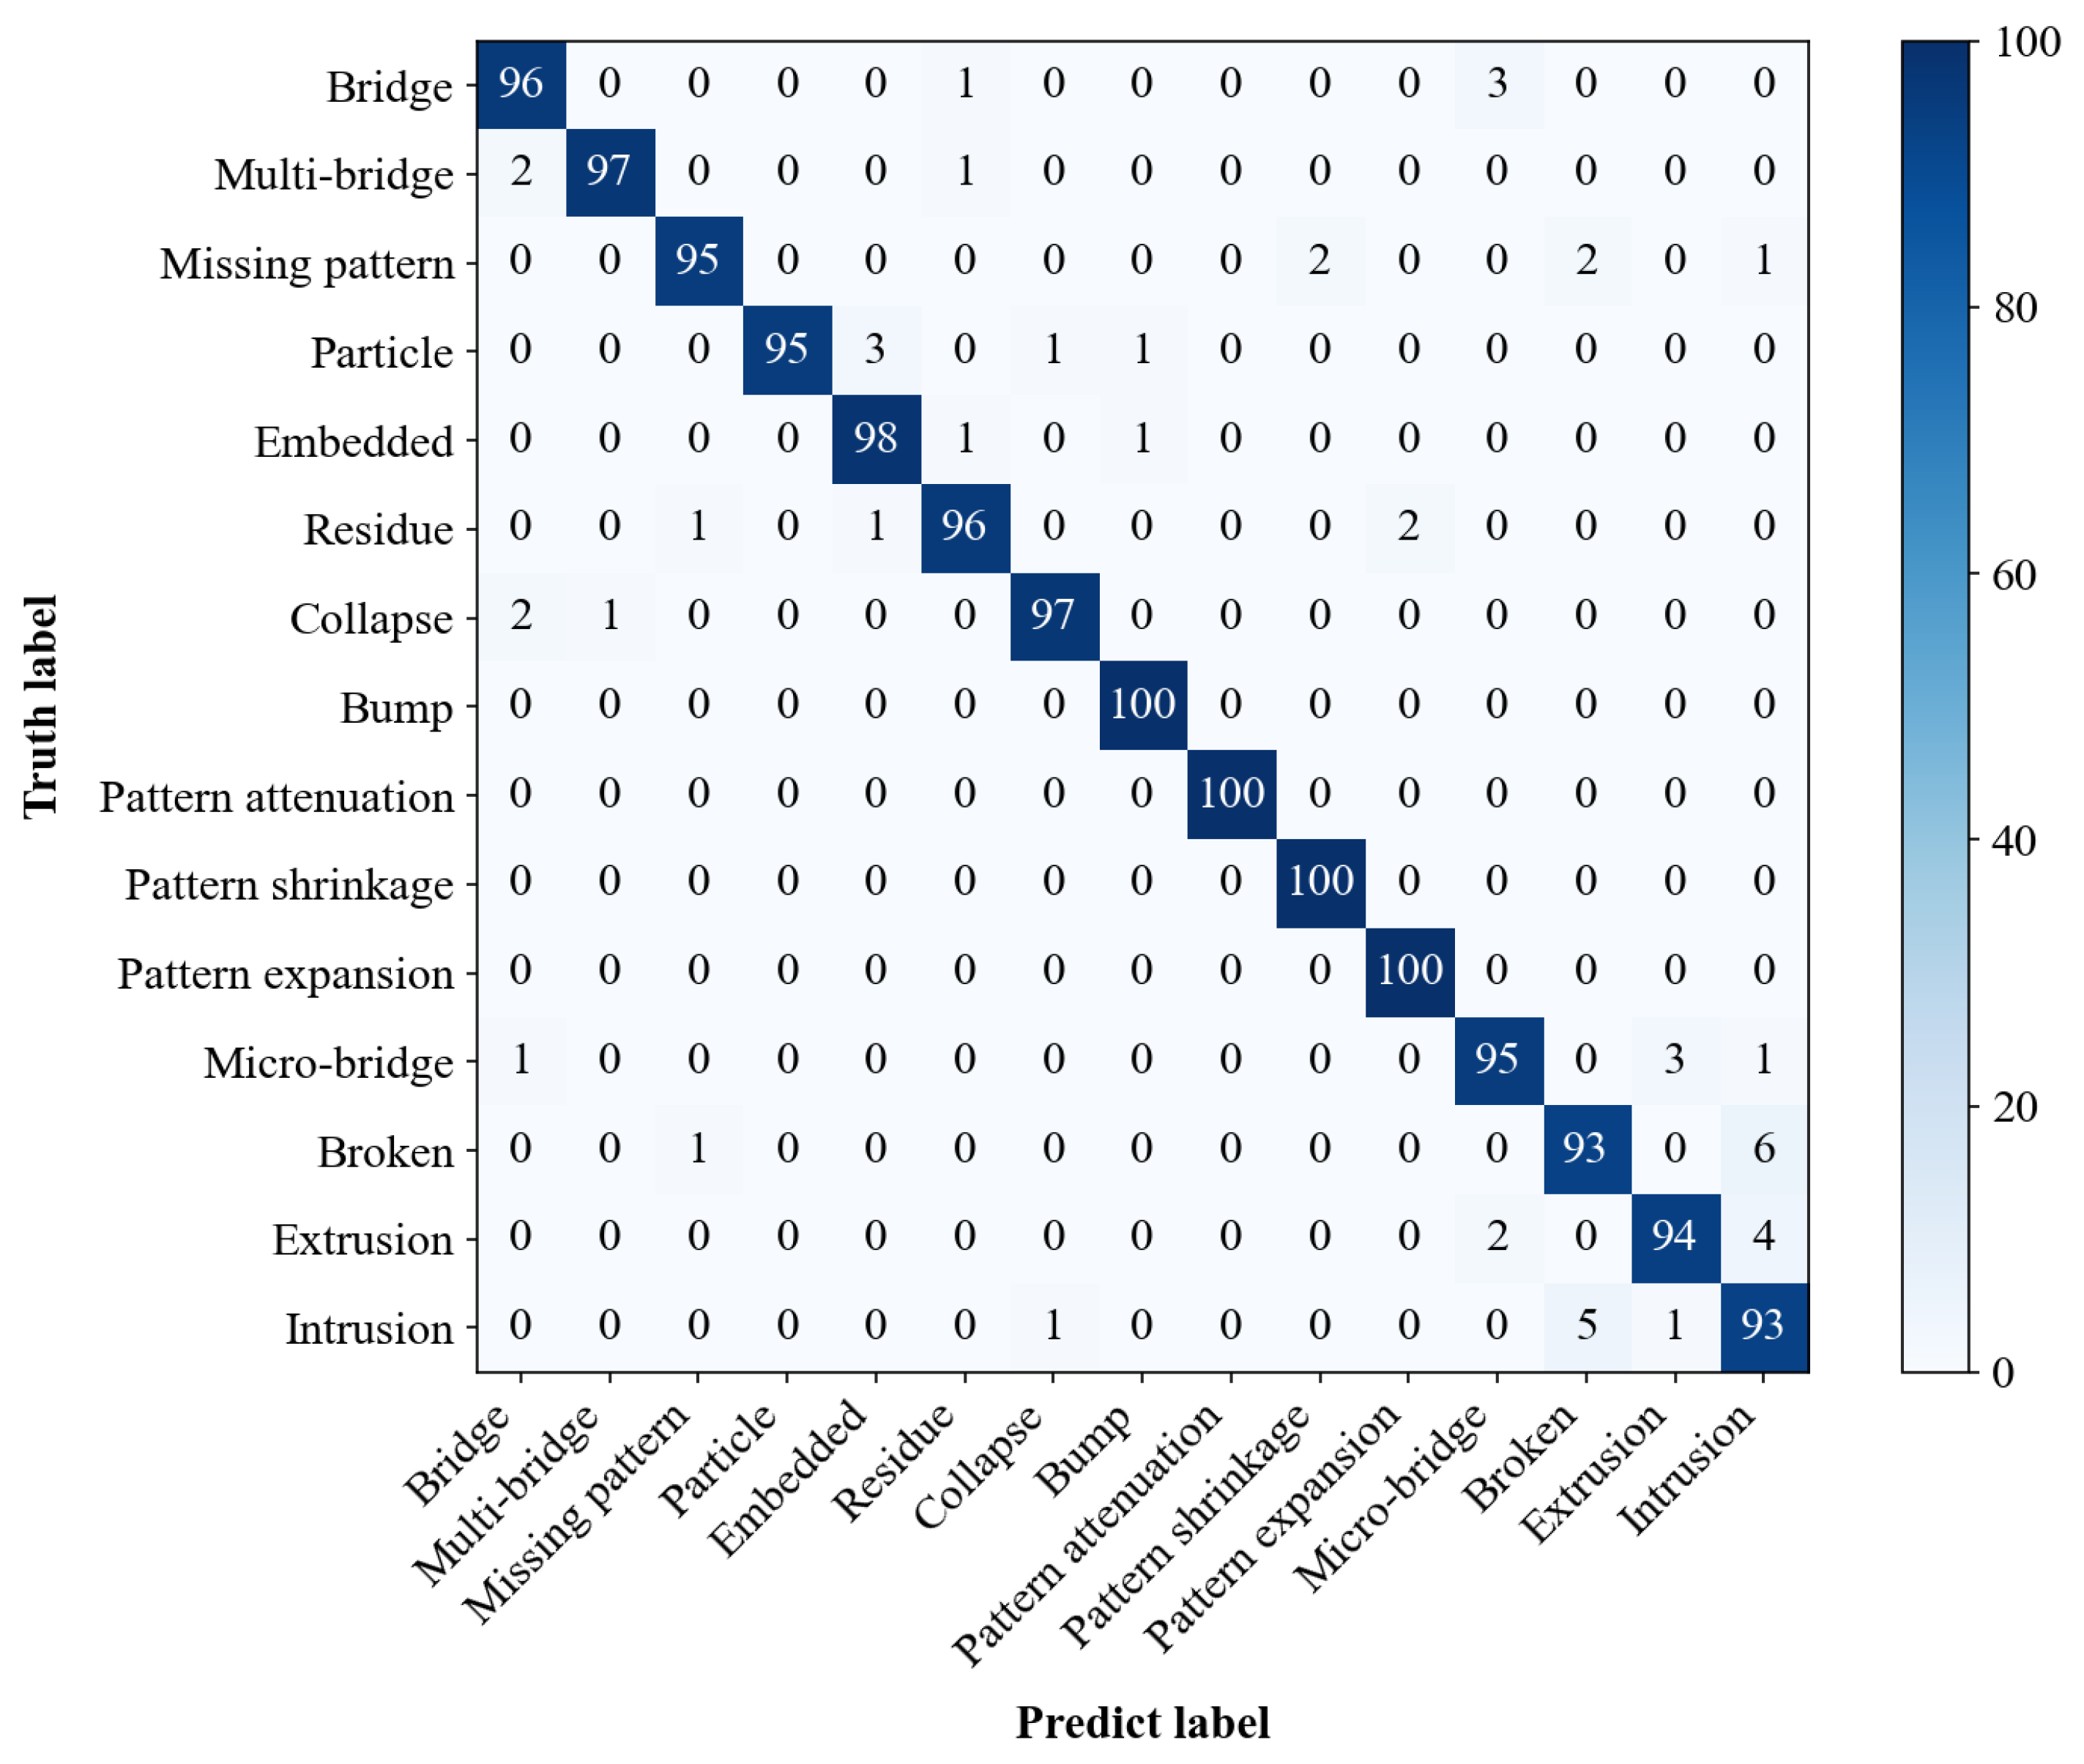
The classification performance of IEDCM was evaluated on the test set, achieving an overall accuracy of 96.60%. Table 4 shows the classification metrics of IEDCM for various wafer defects. The average precision was 96.57%, the average recall was 96.80%, and the average F1-score was 96.67%. The above results indicate that IEDCM can efficiently extract defect features and achieves accurate classification across diverse defect types and significant scale variations. Figure 16 illustrates the confusion matrix of IEDCM, providing a more intuitive evaluation of its classification performance for each defect type.
Table 4.
Defect classification metrics of IEDCM.
Figure 16.
Confusion matrix of IEDCM. The overall classification accuracy of defect samples is satisfactory. For broken, extrusion, and intrusion types, missed and false detections frequently occur due to their small defect sizes and indistinct features.
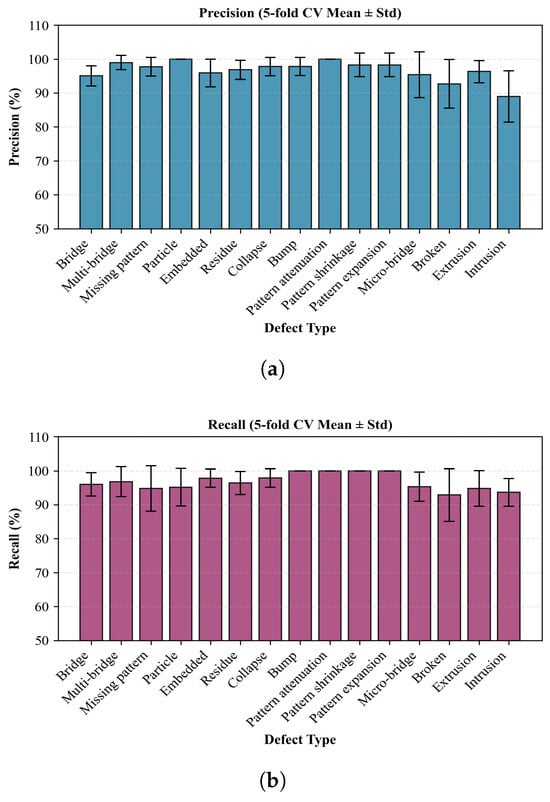
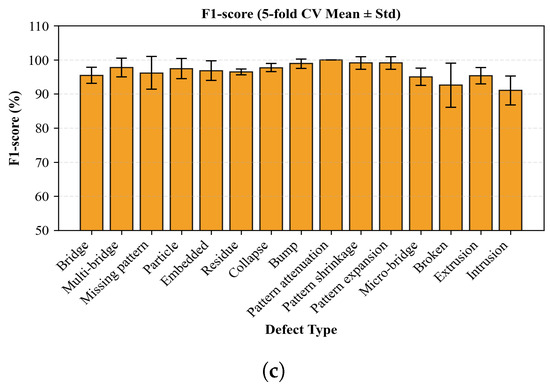
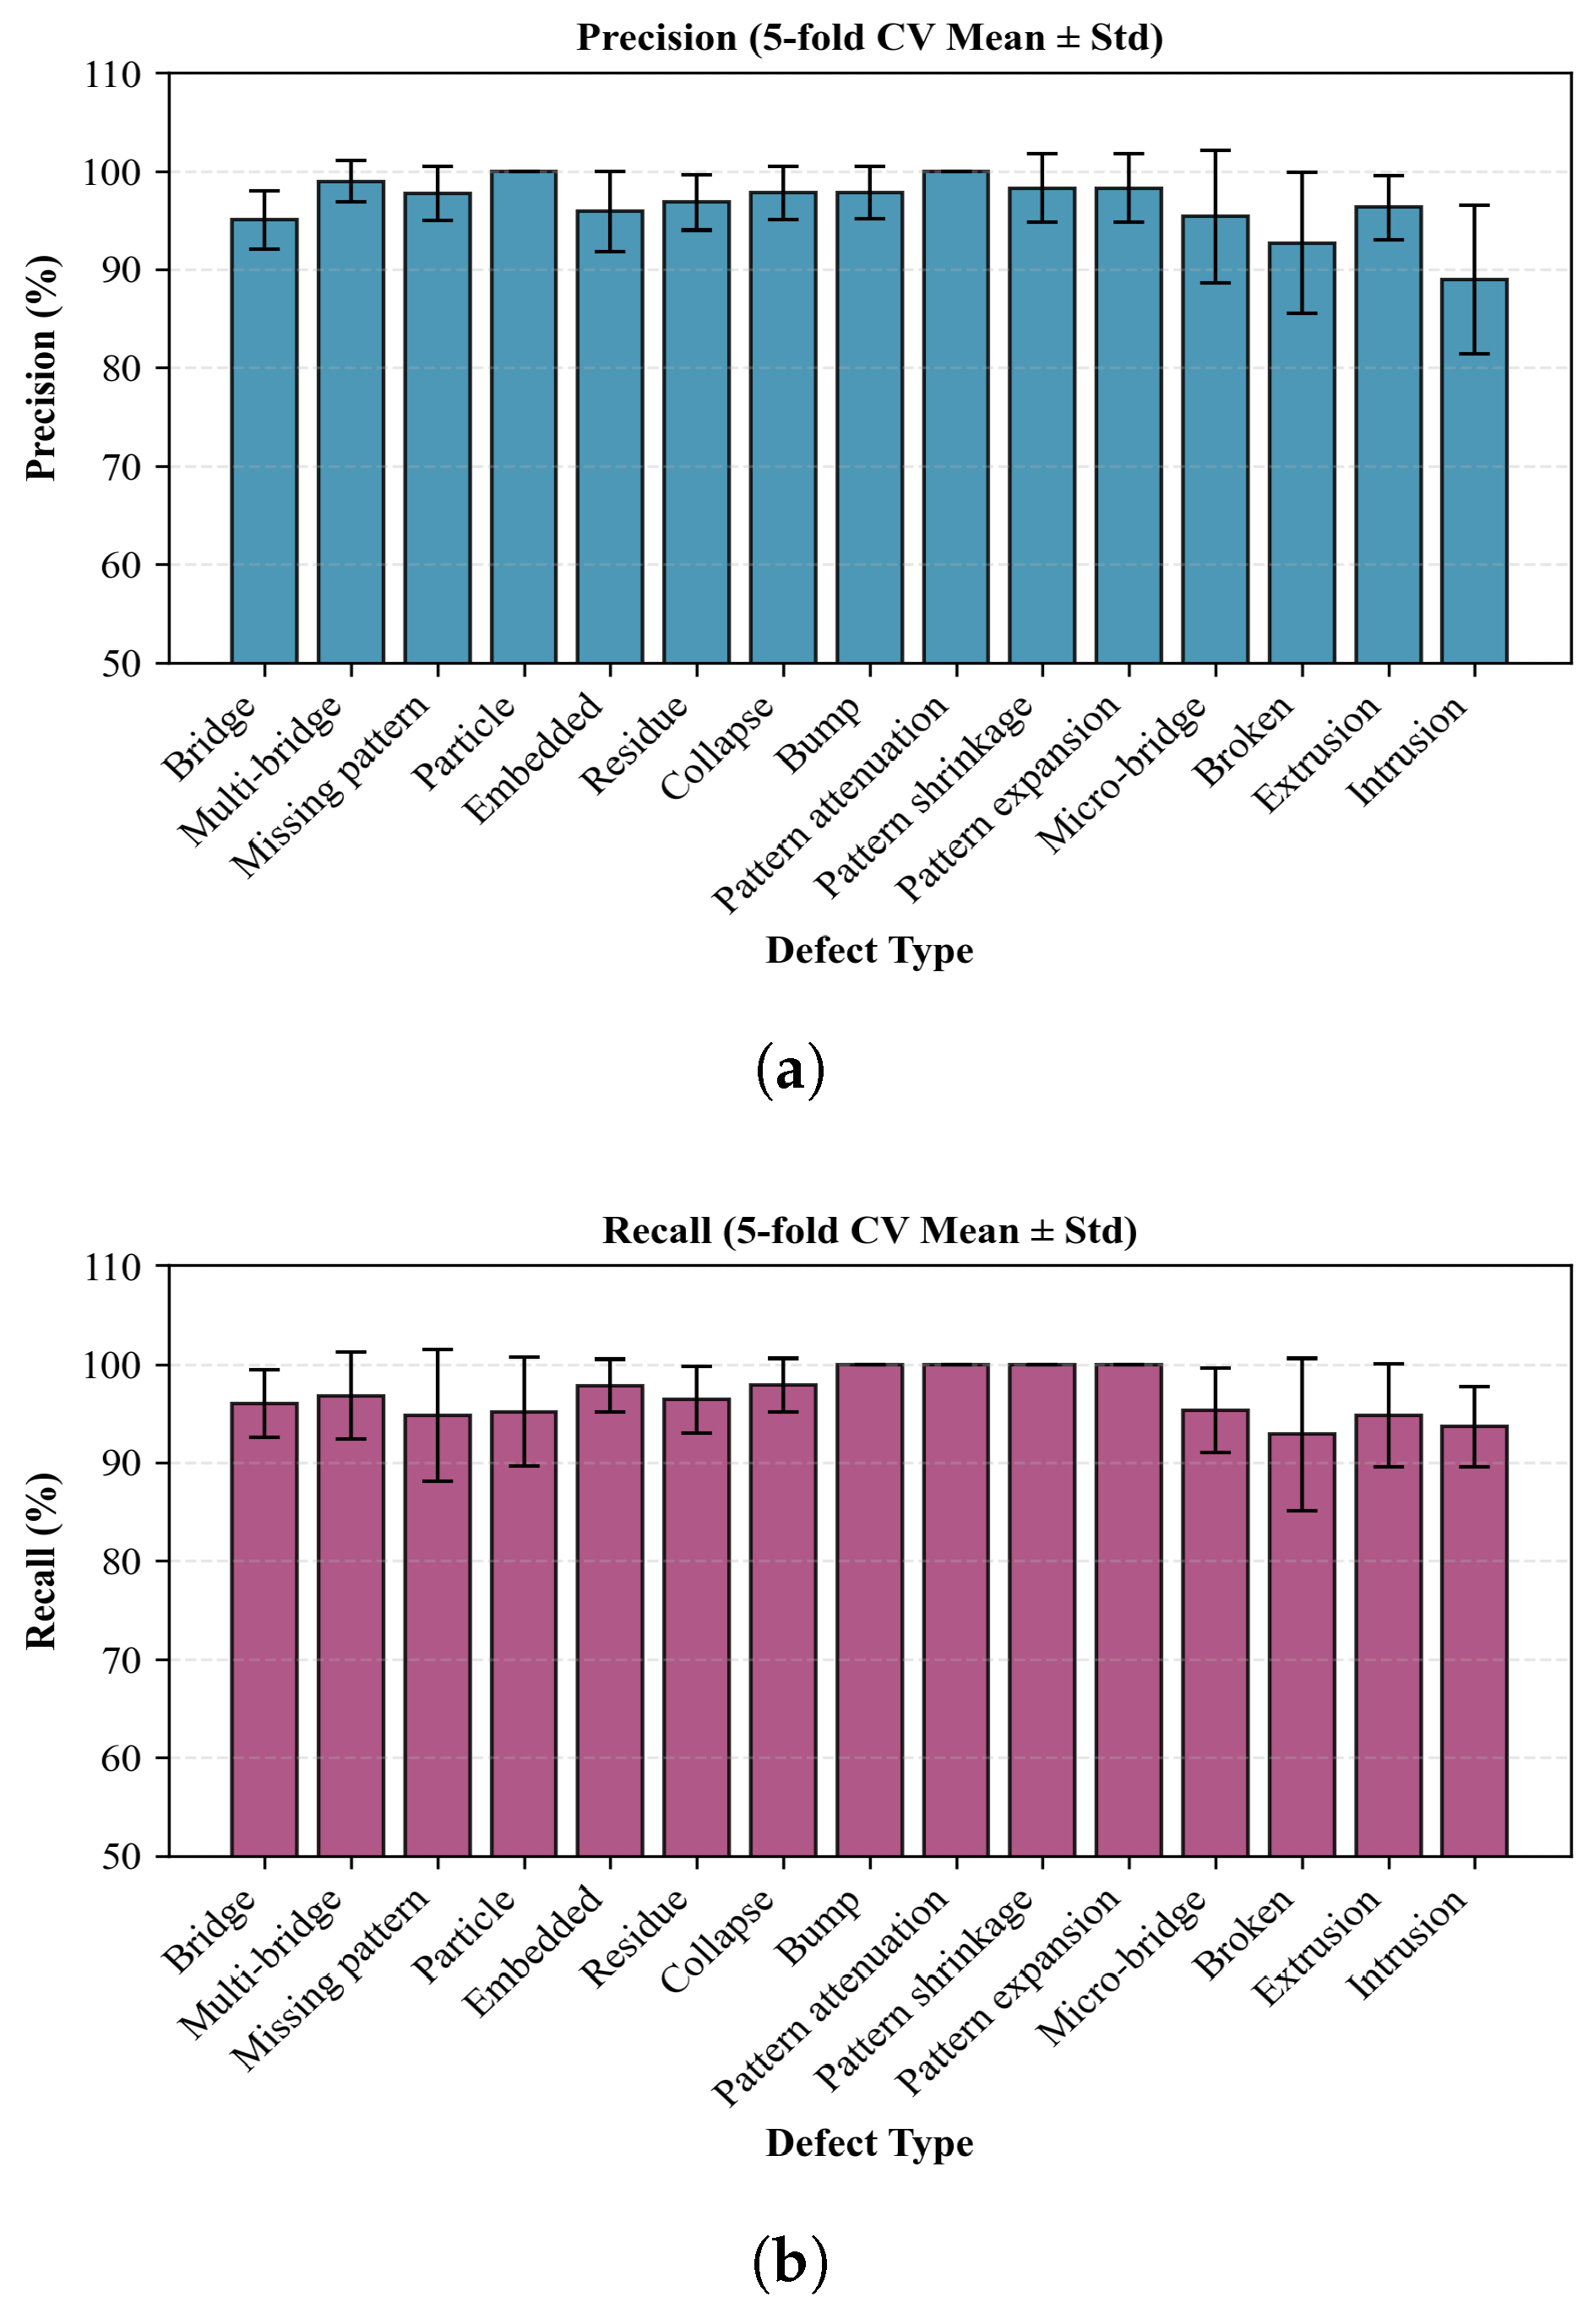
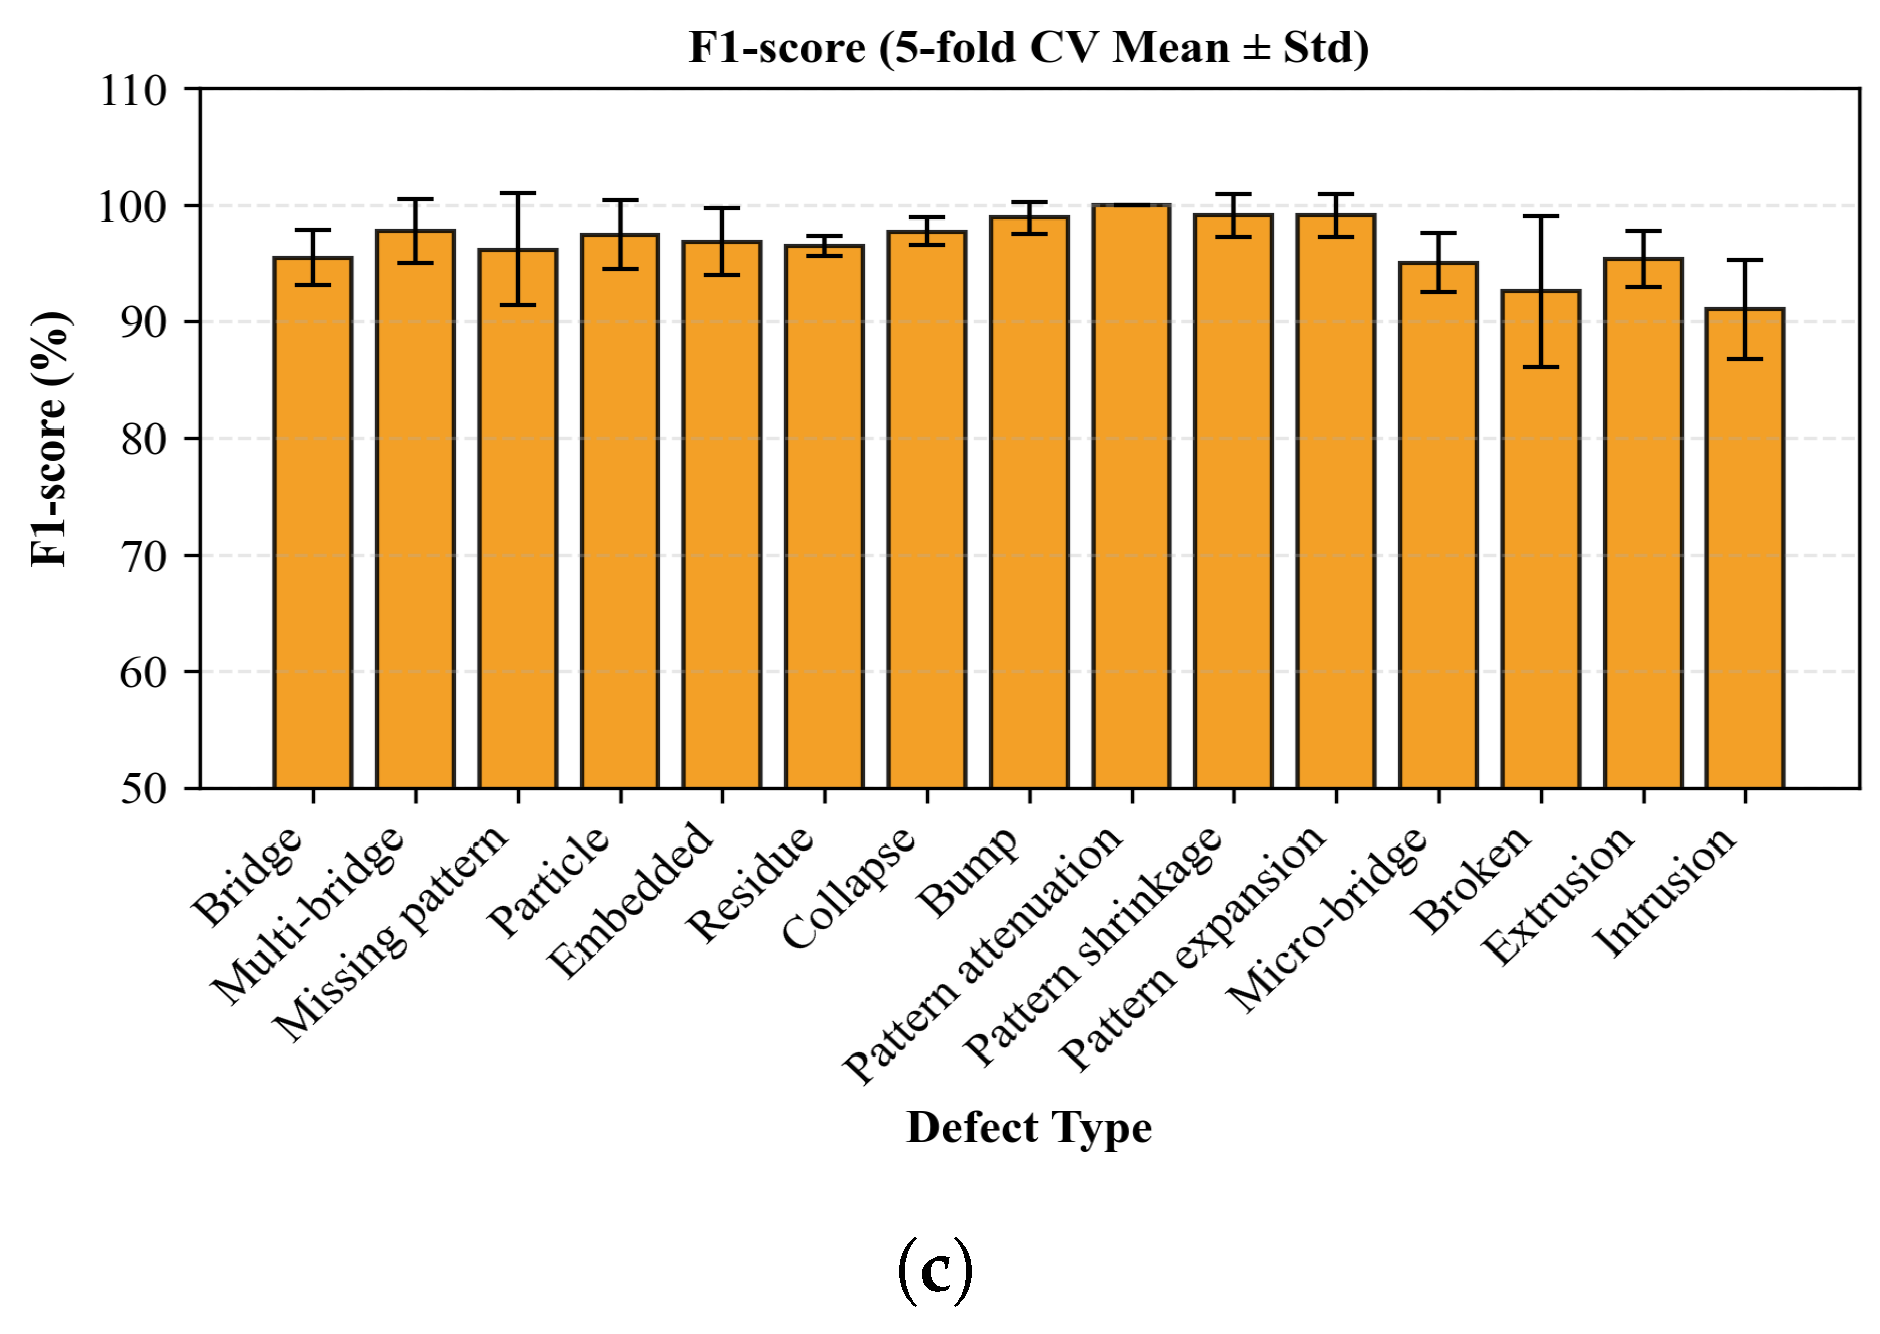
Figure 17 illustrates the fluctuation in evaluation metrics for each defect type. On the whole, the proposed method exhibits favorable statistical stability. Due to large feature variations within the same type, bridge, missing pattern, embedded and residue defects achieve relatively low precision. Missing pattern and particle defects have indistinct features from other defect types, leading to poor recall. As micro-size defects, broken, extrusion and intrusion defects are difficult to identify, and all their evaluation metrics are remarkably lower than those of other defect types, along with relatively larger deviations.
Figure 17.
Precision, recall and F1-score of five-fold cross-validation. (a) Precision; (b) recall; (c) F1-score. Due to small defect sizes and poor distinguishability, the four types of micro-bridge, broken, extrusion and intrusion exhibit high rates of false detection and missed detection.
4.5. Ablation Experiments
We conducted systematic ablation experiments on the wafer SEM simulation image dataset to evaluate the contribution of the multi-scale self-attention enhancement module and the manual feature extraction module to defect classification. Three experimental settings were established: the multi-scale self-attention enhancement module alone, the manual feature extraction module alone, and the simultaneous use of both modules. The defect classification accuracy across these different module combinations was comprehensively compared to the baseline model. The results, detailed in Table 5, indicate that both proposed modules significantly enhance defect classification performance of the model and the combination of both modules produces the most favorable result in defect classification.
Table 5.
Ablation experiment results.
From the above results, the baseline model without manually extracted feature integration achieves an accuracy of 93.33% and an F1-score of 93.21%. To comparatively analyze different feature fusion schemes, we conduct ablation studies by replacing the feature fusion module with several representative fusion strategies. As shown in Table 6, the simple add fusion and cross-attention fusion methods even lead to performance degradation, indicating that direct feature fusion or naive cross-attention is insufficient to effectively integrate multi-scale features and may introduce redundant or noisy information. The concat fusion method brings only moderate performance improvements, reaching 95.07% accuracy. However, the proposed fusion module achieves the best performance, with an accuracy of 96.60%, outperforming all other fusion strategies. In summary, the adopted feature fusion method effectively integrates manual features and multi-channel extracted features, thus achieving the optimal defect classification performance.
Table 6.
Ablation experiment results of feature fusion.
4.6. Comparison of Classification Model
To evaluate the effectiveness of the defect classification methods proposed in this study, Table 7 displays a comparison between IEDCM and EfficientNetV2, with the same training hyperparameters. The results indicate that IEDCM outperforms EfficientNetV2 across all classification metrics. Specifically, precision has improved by 8.07%, recall has increased by 8.33%, and the F1-score has risen by 8.22%. The classification performance of IEDCM has significantly improved for defect types such as multi-bridge, particle, embedded, collapse, bump, pattern attenuation, pattern shrinkage and pattern expansion, with most achieving approximately 95% precision.
Table 7.
Classification result comparison of IEDCM and EfficientNetV2.
In particular, for challenging defect types such as micro-bridge, broken, extrusion, and intrusion, which exhibit tiny-scale features and low distinguishability, IEDCM shows substantial improvements over EfficientNetV2. The precision values have increased from 78.64%, 81.25%, 74.19%, and 75.96% to 95.00%, 93.00%, 95.92%, and 88.57%, respectively. Meanwhile, the recall values have improved from 81.00%, 78.00%, 69.00%, and 79.00% to 95.00%, 93.00%, 94.00%, and 93.00%, correspondingly. This remarkable improvement demonstrates that IEDCM effectively addresses the bottleneck of low-discriminability defect recognition, which has long limited the industrial application of data-driven methods in lithographic defect inspection.
To further evaluate the classification performance of IEDCM, we compared it against four baseline systems: a ResNet-34 CNN, a ShufflenetV2 CNN, an EfficientNetV2-s and an EfficientNetV1-B2 architecture. The comparison results are detailed in Table 8, where the mean accuracy of IEDCM reached 96.60%, surpassing the other methods by 11.93%, 19.73%, 16.80% and 8.14%, respectively. In addition, there were significant improvements in precision, recall, and F1-score, highlighting the clear advantages of the method in classification accuracy.
Table 8.
Performance comparison of different classification models.
The transformer is currently an efficient and high-precision image classification method; we make comparisons with several typical transformer-based models from recent years, including ViT, EfficientViT, RepViT and LinearDiffViT. The comparison results are presented in Table 9, and IEDCM exhibits obvious improvement over the above transformer-based models in accuracy, precision, recall and F1-score.
Table 9.
Performance comparison of different transformer-based models.
Moreover, the small standard deviation confirms the low variance and strong stability of IEDCM under different data splits, which is essential for reliable industrial inspection. In summary, comprehensive comparisons validate that the proposed IEDCM framework exhibits superior feature extraction capability.
5. Conclusions
We propose an enhanced wafer defect classification method based on EfficientNet, aiming to improve the classification accuracy of micro-scale and low-distinguishability defects. This model adopts EfficientNetV2 as its backbone network and incorporates manually extracted graphic features, which effectively mitigates the limitations of relying solely on automatic feature extraction in capturing fine-grained defect characteristics. Additionally, the integration of a multi-scale self-attention enhancement module significantly enhances the ability of the classification model to identify key features of micro-scale and low-distinguishability defects. The effectiveness of the proposed method was validated using a simulated wafer defect dataset based on line-space structures and ICCAD2019 mask patterns.
The experimental results show that the proposed model achieves a classification accuracy of 96.60%, a precision of 96.57%, a recall of 96.80%, and an F1-score of 96.67%. Compared with the original EfficientNetV2 network, these metrics are improved by 8.14%, 8.07%, 8.33%, and 8.22%, respectively.
The proposed method possesses considerable engineering value in semiconductor manufacturing. By improving the classification accuracy and robustness of lithography micro-defects, it effectively facilitates automatic defect identification, process anomaly diagnosis, and yield optimization in advanced wafer production lines. The incorporation of manual features alongside multi-scale attention mechanisms significantly enhances the fine-grained detection capabilities for micro-defects, while simultaneously reducing the false detection rate and minimizing the need for manual intervention, thereby increasing the efficiency of online detection.
Author Contributions
Conceptualization, Z.W. and L.Z.; methodology, L.Z.; software, L.Z.; validation, L.Z.; writing—original draft preparation, L.Z.; writing—review and editing, Z.W. and L.Z.; supervision, Z.W.; project administration, Z.W.; funding acquisition, Z.W. All authors have read and agreed to the published version of the manuscript.
Funding
This research was supported by Ministry of Science and Technology of the People’s Republic of China (2018ZX02103002-004).
Institutional Review Board Statement
Not applicable.
Informed Consent Statement
Not applicable.
Data Availability Statement
The data can be obtained from the authors on request.
Conflicts of Interest
The authors declare no conflicts of interest.
References
- Xu, N.Y.; Ng, H.P.; Ang, G.B. Failure analysis case studies on wafer edge failure due to process uniformity issue. In Proceedings of the 2018 IEEE International Symposium on the Physical and Failure Analysis of Integrated Circuits (IPFA), Singapore, 16–19 July 2018; IEEE: New York, NY, USA, 2018; pp. 1–5. [Google Scholar]
- Ohri, A.; Snyder, S.; Nair, V.V.; Watson, B.; Ahn, K.; Ege, E.S.; Singh, Y.; Lee, E.; Chen, H.; Light, S.; et al. Enhanced EUV photolithography control for overcoming defectivity challenges. Proc. SPIE 2024, 13215, 132150P. [Google Scholar]
- Tsai, Y.; Chang, Y.; Wang, J.; Trivkovic, D.; Ronse, K.; Kim, R. A yield prediction model and cost of ownership for productivity enhancement beyond imec 5nm technology node. Proc. SPIE 2022, 12052, 1205203. [Google Scholar]
- Zhu, J.; Liu, J.; Xu, T.; Yuan, S.; Zhang, Z.; Jiang, H.; Gu, H.; Zhou, R.; Liu, S. Optical wafer defect inspection at the 10 nm technology node and beyond. Int. J. Extrem. Manuf. 2022, 4, 002031. [Google Scholar] [CrossRef] [Scilit]
- Abu Ebayyeh, A.A.R.M.; Mousavi, A. A review and analysis of automatic optical inspection and quality monitoring methods in electronics industry. IEEE Access 2020, 8, 183192–183271. [Google Scholar] [CrossRef] [Scilit]
- Solecky, E.; Patterson, O.D.; Stamper, A.; McLellan, E.; Buengener, R.; Vaid, A.; Hartig, C.; Bunday, B.; Arceo, A.; Cepler, A. In-line E-beam wafer metrology and defect inspection: The end of an era for image-based critical dimensional metrology? New life for defect inspection. Proc. SPIE 2013, 8681, 86810D. [Google Scholar]
- Gao, W.; Zeng, X.; Lin, P.; Pan, Y.; Song, H.Y.; Nguyen, H.; Cai, N.; Chen, Z.; Zafar, K. Net tracing and classification analysis on E-beam die-to-database inspection. Proc. SPIE 2016, 9778, 97783Q. [Google Scholar]
- Taha, K. An effective approach for associating the sources of defect signatures to process zones. IEEE Trans. Semicond. Manuf. 2017, 30, 176–184. [Google Scholar] [CrossRef] [Scilit]
- Xu, H.W.; Zhang, Q.H.; Sun, Y.N.; Chen, Q. A fast ramp-up framework for wafer yield improvement in semiconductor manufacturing systems. J. Manuf. Syst. 2024, 76, 222–233. [Google Scholar] [CrossRef] [Scilit]
- Lee, K.B.; Cheon, S.; Kim, C.O. A Convolutional Neural Network for Fault Classification and Diagnosis in Semiconductor Manufacturing Processes. IEEE Trans. Semicond. Manuf. 2017, 30, 135–142. [Google Scholar] [CrossRef] [Scilit]
- Qiao, Y.; Mei, Z.; Luo, Y.; Chen, Y. DeepSEM-Net: Enhancing SEM defect analysis in semiconductor manufacturing with a dual-branch CNN-Transformer architecture. Comput. Ind. Eng. 2024, 193, 110301. [Google Scholar] [CrossRef] [Scilit]
- Leary, J.O.; Sawlani, K.; Mesbah, A. Deep Learning for Classification of the Chemical Composition of Particle Defects on Semiconductor Wafers. IEEE Trans. Semicond. Manuf. 2020, 33, 72–85. [Google Scholar] [CrossRef] [Scilit]
- Yu, N.; Chen, H.; Xu, Q.; Hasan, M.M.; Sie, O. Wafer map defect patterns classification based on a lightweight network and data augmentation. CAAI Trans. Intell. Technol. 2022, 8, 1029–1042. [Google Scholar] [CrossRef] [Scilit]
- Dey, B.; Dehaerne, E.; Halder, S.; Leray, P.; Bayoumi, M.A. Deep learning-based defect classification and detection in SEM images. Proc. SPIE 2022, PC12053, PC120530Y. [Google Scholar]
- Imoto, K.; Nakai, T.; Ike, T.; Haruki, K.; Sato, Y. A CNN-based transfer learning method for defect classification in semiconductor manufacturing. IEEE Trans. Semicond. Manuf. 2019, 32, 455–459. [Google Scholar] [CrossRef] [Scilit]
- Chen, S.; Huang, Z.; Wang, T.; Hou, X.; Ma, J. Mixed-type wafer defect detection based on multi-branch feature enhanced residual module. Expert Syst. Appl. 2024, 242, 122795. [Google Scholar] [CrossRef] [Scilit]
- Kim, Y.; Cho, D.; Lee, J.H. Wafer defect pattern classification with detecting out-of-distribution. Microelectron. Reliab. 2021, 122, 114157. [Google Scholar] [CrossRef] [Scilit]
- Dehaerne, E.; Dey, B.; Blanco, V. Scanning electron microscopy-based automatic defect inspection for semiconductor manufacturing: A systematic review. J. Micro/Nanopatterning Mater. Metrol. 2025, 24, 020901. [Google Scholar]
- Yan, C.; Qiao, J.; Gan, Y.; Ding, N.; Chen, Z.; Ding, M.; Luo, X.; Jiang, J.; Yu, Z.; Han, C. Innovative wafer defect inspection mode: Self-adaptive pattern to pattern inspection. Proc. SPIE 2024, 12955, 129552E. [Google Scholar]
- Ouchi, M.; Ishikawa, M.; Shinoda, S.; Toyoda, Y.; Yumiba, R.; Shindo, H.; Izawa, M. A trainable die-to-database for fast e-beam inspection: Learning normal images to detect defects. Proc. SPIE 2020, 11325, 113252F. [Google Scholar]
- Golan, E.; Meshulach, D.; Raccah, N.; Yeo, J.H.; Dassa, O.; Brandl, S.; Schwarz, C.; Pierson, B.; Montgomery, W. Immersion lithography defectivity analysis at DUV inspection wavelength. Proc. SPIE 2007, 6518, 65180S. [Google Scholar]
- Englard, I.; Stegen, R.; Brederode, E.V.; Vanoppen, P.; Minnaert-Janssen, I.; Duray, F.; der Kinderen, T.; Tanriseven, G.; Lamers, I.; Mantecon, M.B.; et al. Immersion-induced defect SEM-based library for fast baseline improvement and excursion. Proc. SPIE 2008, 6518, 65182G. [Google Scholar]
- Latypov, A.; Khaira, G.; Fenger, G.; Sturtevant, J.; Wei, C.; Bisschop, P.D. Probability prediction of EUV process failure due to resist-exposure stochastic: Applications of Gaussian random fields excursions and Rice’s Formula. Proc. SPIE 2020, 11323, 113230L. [Google Scholar]
- Cho, K.-Y.; Park, J.-O.; Park, C.; Lee, Y.-M.; Kang, I.-Y.; Yeo, J.-H.; Choi, S.-W.; Park, C.-H.; Lange, S.R.; Cho, S.; et al. The analysis of EUV mask defects using a wafer defect inspection system. Proc. SPIE 2010, 7636, 76361E. [Google Scholar]
- Dai, Y.; Gieseke, F.; Oehmcke, S.; Wu, Y.; Barnard, K. Attentional feature fusion. In Proceedings of the IEEE Winter Conference on Applications of Computer Vision (WACV), Waikoloa, HI, USA, 3–8 January 2021; pp. 3559–3568. [Google Scholar]
- Iida, S.; Nagai, T.; Uchiyama, T. Development of standard samples with programmed defects for evaluation of pattern inspection tools. Proc. SPIE 2019, 10959, 109590J. [Google Scholar]
- Mack, C.A.; Bunday, B.D. Analytical linescan model for SEM metrology. Proc. SPIE 2015, 9424, 94240F. [Google Scholar]

Disclaimer/Publisher’s Note: The statements, opinions and data contained in all publications are solely those of the individual author(s) and contributor(s) and not of MDPI and/or the editor(s). MDPI and/or the editor(s) disclaim responsibility for any injury to people or property resulting from any ideas, methods, instructions or products referred to in the content. |
© 2026 by the authors. Licensee MDPI, Basel, Switzerland. This article is an open access article distributed under the terms and conditions of the Creative Commons Attribution (CC BY) license.