


Abstract
Complex mechanical systems, such as agricultural combine harvesters, are subjected to dynamic excitations from multiple coupled sources, compromising structural integrity and operational reliability. Disentangling these vibrations to identify dominant sources and quantify their transmission paths remains a significant engineering challenge. This study proposes a robust diagnostic framework to address this issue. We employed a multi-condition vibration test with sequential source activation and an improved Operational Transfer Path Analysis (OTPA) method. Applied to a harvester chassis, the results revealed that vibration energy is predominantly concentrated in the 0–200 Hz frequency band. Path contribution analysis quantified that the “cutting header → conveyor trough → hydraulic cylinder → chassis frame” path is the most critical contributor to vertical vibration, with a vibration acceleration level of 117.6 dB. Further analysis identified the engine (29.3 Hz) as the primary source for vertical vibration, while lateral vibration was mainly attributed to a coupled resonance between the threshing cylinder (58 Hz) and the engine’s second-order harmonic. This study’s theoretical contribution lies in validating a powerful methodology for vibration source apportionment in complex systems. Practically, the findings provide direct, actionable insights for targeted structural optimization and vibration suppression.
1. Introduction
As an indispensable core piece of equipment in agricultural production systems, the combine harvester plays a critical role in key operations such as grain harvesting, threshing, and cleaning. Its efficient and stable operation is directly linked to agricultural productivity and profitability [1,2,3,4,5]. However, during field operations, combine harvesters are subjected to complex and severe vibration problems [6,7,8]. This phenomenon stems primarily from the dynamic excitation generated by various internal working components—such as the engine, cutting header, threshing cylinder, and vibrating sieve—operating at high speeds or in periodic cycles. It is further compounded by external impacts arising from complex field conditions, including uneven ground and variations in crop feed rate [9,10,11,12]. These multi-source, dynamic excitations are ultimately transmitted to the chassis frame, which serves as the core load-bearing structure of the entire machine.
Severe vibration exerts multiple adverse effects on the performance and lifespan of a combine harvester. It not only accelerates the structural fatigue of the chassis frame and its connected components, leading to premature failure and consequently reducing the machine’s overall reliability and service life, but also increases maintenance costs and downtime [13,14,15,16,17,18]. Furthermore, vibration significantly impairs operational efficiency and quality by, for instance, causing instability in the cutting and cleaning processes and reducing operational precision [19,20]. More critically, the vibration transmitted to the operator’s cabin severely degrades the driver’s comfort and health, thereby compromising operational safety [21,22,23]. Therefore, precisely identifying excitation sources, quantifying their transfer paths, and understanding the chassis frame’s vibration response are critical for developing targeted vibration reduction strategies. Such efforts are essential for enhancing machine performance, extending service life, and improving operator comfort and safety [24,25].
To address the vibration problems in mechanical systems, researchers worldwide have conducted extensive studies. In the analysis of structural mechanical properties, the Finite Element Method (FEM) has been widely applied to the static and modal analysis of agricultural machinery chassis to assess their strength, stiffness, and natural frequencies, thereby providing a foundation for structural optimization [26,27,28]. However, these studies often focus on single operating conditions or static analysis and thus fail to comprehensively capture the complex vibration behavior under multi-source dynamic excitation. Recent research on combine harvesters has explored these complex dynamics using various approaches. For instance, studies [29] have used advanced signal processing techniques like the low-pass filter-EEMD combination to extract vibration signals from specific components under different working conditions and analyzed non-stationary vibration characteristics caused by the machine’s time-varying mass during harvesting [30]. Other works have focused on identifying the overall vibration response under multisource excitation [31] or on optimizing the topology of individual components like the header to mitigate vibration [32]. While these valuable studies successfully identify dominant vibration frequencies and characterize the system’s response, they often do not quantitatively diagnose the entire vibration transmission system. Specifically, there is a research gap in systematically decoupling the contributions of individual excitation sources and precisely quantifying how much each specific transmission path contributes to the vibration at a target point on the chassis. This precise decoupling and quantitative analysis of multi-source coupling effects and their corresponding transfer paths represent a common challenge and a research hotspot in the design and optimization of modern complex engineering systems [33].
In recent years, with advancements in vibration diagnostic technologies, Operational Transfer Path Analysis (OTPA) has garnered significant attention for its unique advantage of identifying and quantifying the contribution of each excitation source to the vibration at a target point under actual operating conditions [34,35,36]. This method, which does not require system disassembly, can effectively handle Multiple-Input Multiple-Output (MIMO) vibration problems. It has been successfully applied in fields such as the automotive, rail transit, and construction machinery industries, for instance, in identifying vehicle interior noise sources and analyzing the vibro-acoustic transfer paths of train bogies [37,38,39,40]. Thompson et al. [41] assessed a variety of measurement-based methods for separating railway noise, showcasing OTPA’s place among a suite of diagnostic tools. However, a well-documented challenge in OTPA is the potential for an ill-conditioned input matrix, especially under complex operational conditions where excitation sources are highly correlated or measurement noise is present. This ill-conditioning can compromise the accuracy and stability of the estimated transfer functions. To address this, various improvements have been proposed. For example, Roozen et al. [42] suggested a two-step approach using artificial hammer excitation to generate linearly independent responses, thereby improving the quality of the transmissibility matrix. To address the issue of limited computational accuracy in OTPA caused by the ill-conditioning of the input matrix under complex conditions, researchers have introduced improvements to the algorithm. Methodological advancements, such as the development of Decoupled Transfer Path Analysis (DTPA), have also sought to overcome the challenge of path crosstalk in complex systems [43]. In addition, the integration of Singular Value Decomposition (SVD) for data dimensionality reduction and denoising has enhanced the method’s robustness and accuracy in practical applications [44].
Despite these advancements, the systematic application of an improved OTPA framework to diagnose the multi-source vibration characteristics of a combine harvester chassis remains relatively insufficient. While some studies have applied OTPA to harvesters [45], a detailed, robust analysis that overcomes the inherent ill-conditioning problem to clearly quantify source contributions and identify critical transfer paths is still needed. This study aims to fill this gap by proposing and validating a robust diagnostic framework, which employs an improved OTPA method with SVD-based proportional truncation, to decouple the complex, multi-source vibrations in a combine harvester chassis. Given the significant structural complexity of the harvester chassis, which makes the development of an accurate analytical mass-stiffness-damping model exceptionally challenging, the present study focuses on the chassis frame of a crawler-type combine harvester, aiming to comprehensively analyze its vibration response characteristics under multi-source excitation through a combination of theoretical analysis, experimental validation, and an improved OTPA method. Specifically, this research will first reveal the fundamental mechanical characteristics of the chassis frame and identify the excitation features of its main working components. Subsequently, the improved OTPA method will be employed as a key tool to quantify the vibration contributions from primary excitation sources—such as the engine, cutting header, threshing cylinder, and vibrating screen—to critical target points on the chassis frame. Ultimately, the study will identify the key paths through which vibration energy is transmitted from the main excitation sources to the chassis frame. The findings of this research are intended to provide a crucial theoretical basis and data support for the precise vibration reduction and optimization design of the combine harvester chassis frame.
2. Materials and Methods
2.1. Test Object and Equipment
2.1.1. Basic Characteristics of the Chassis Frame
As a core piece of equipment in modern grain harvesting systems, the combine harvester integrates the full process of operations for rice crops, including efficient harvesting, material conveying, threshing and separation, and grain cleaning [46,47,48,49,50]. Its chassis frame is the main structural component that supports all core working components, such as the engine, cutting header, threshing cylinder, and vibrating screen. The frame is fabricated by welding Q235 structural steel, and its material properties are presented in Table 1.
Table 1.
Material properties of Q235 steel.
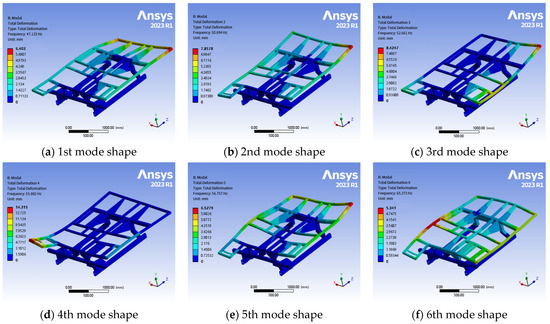
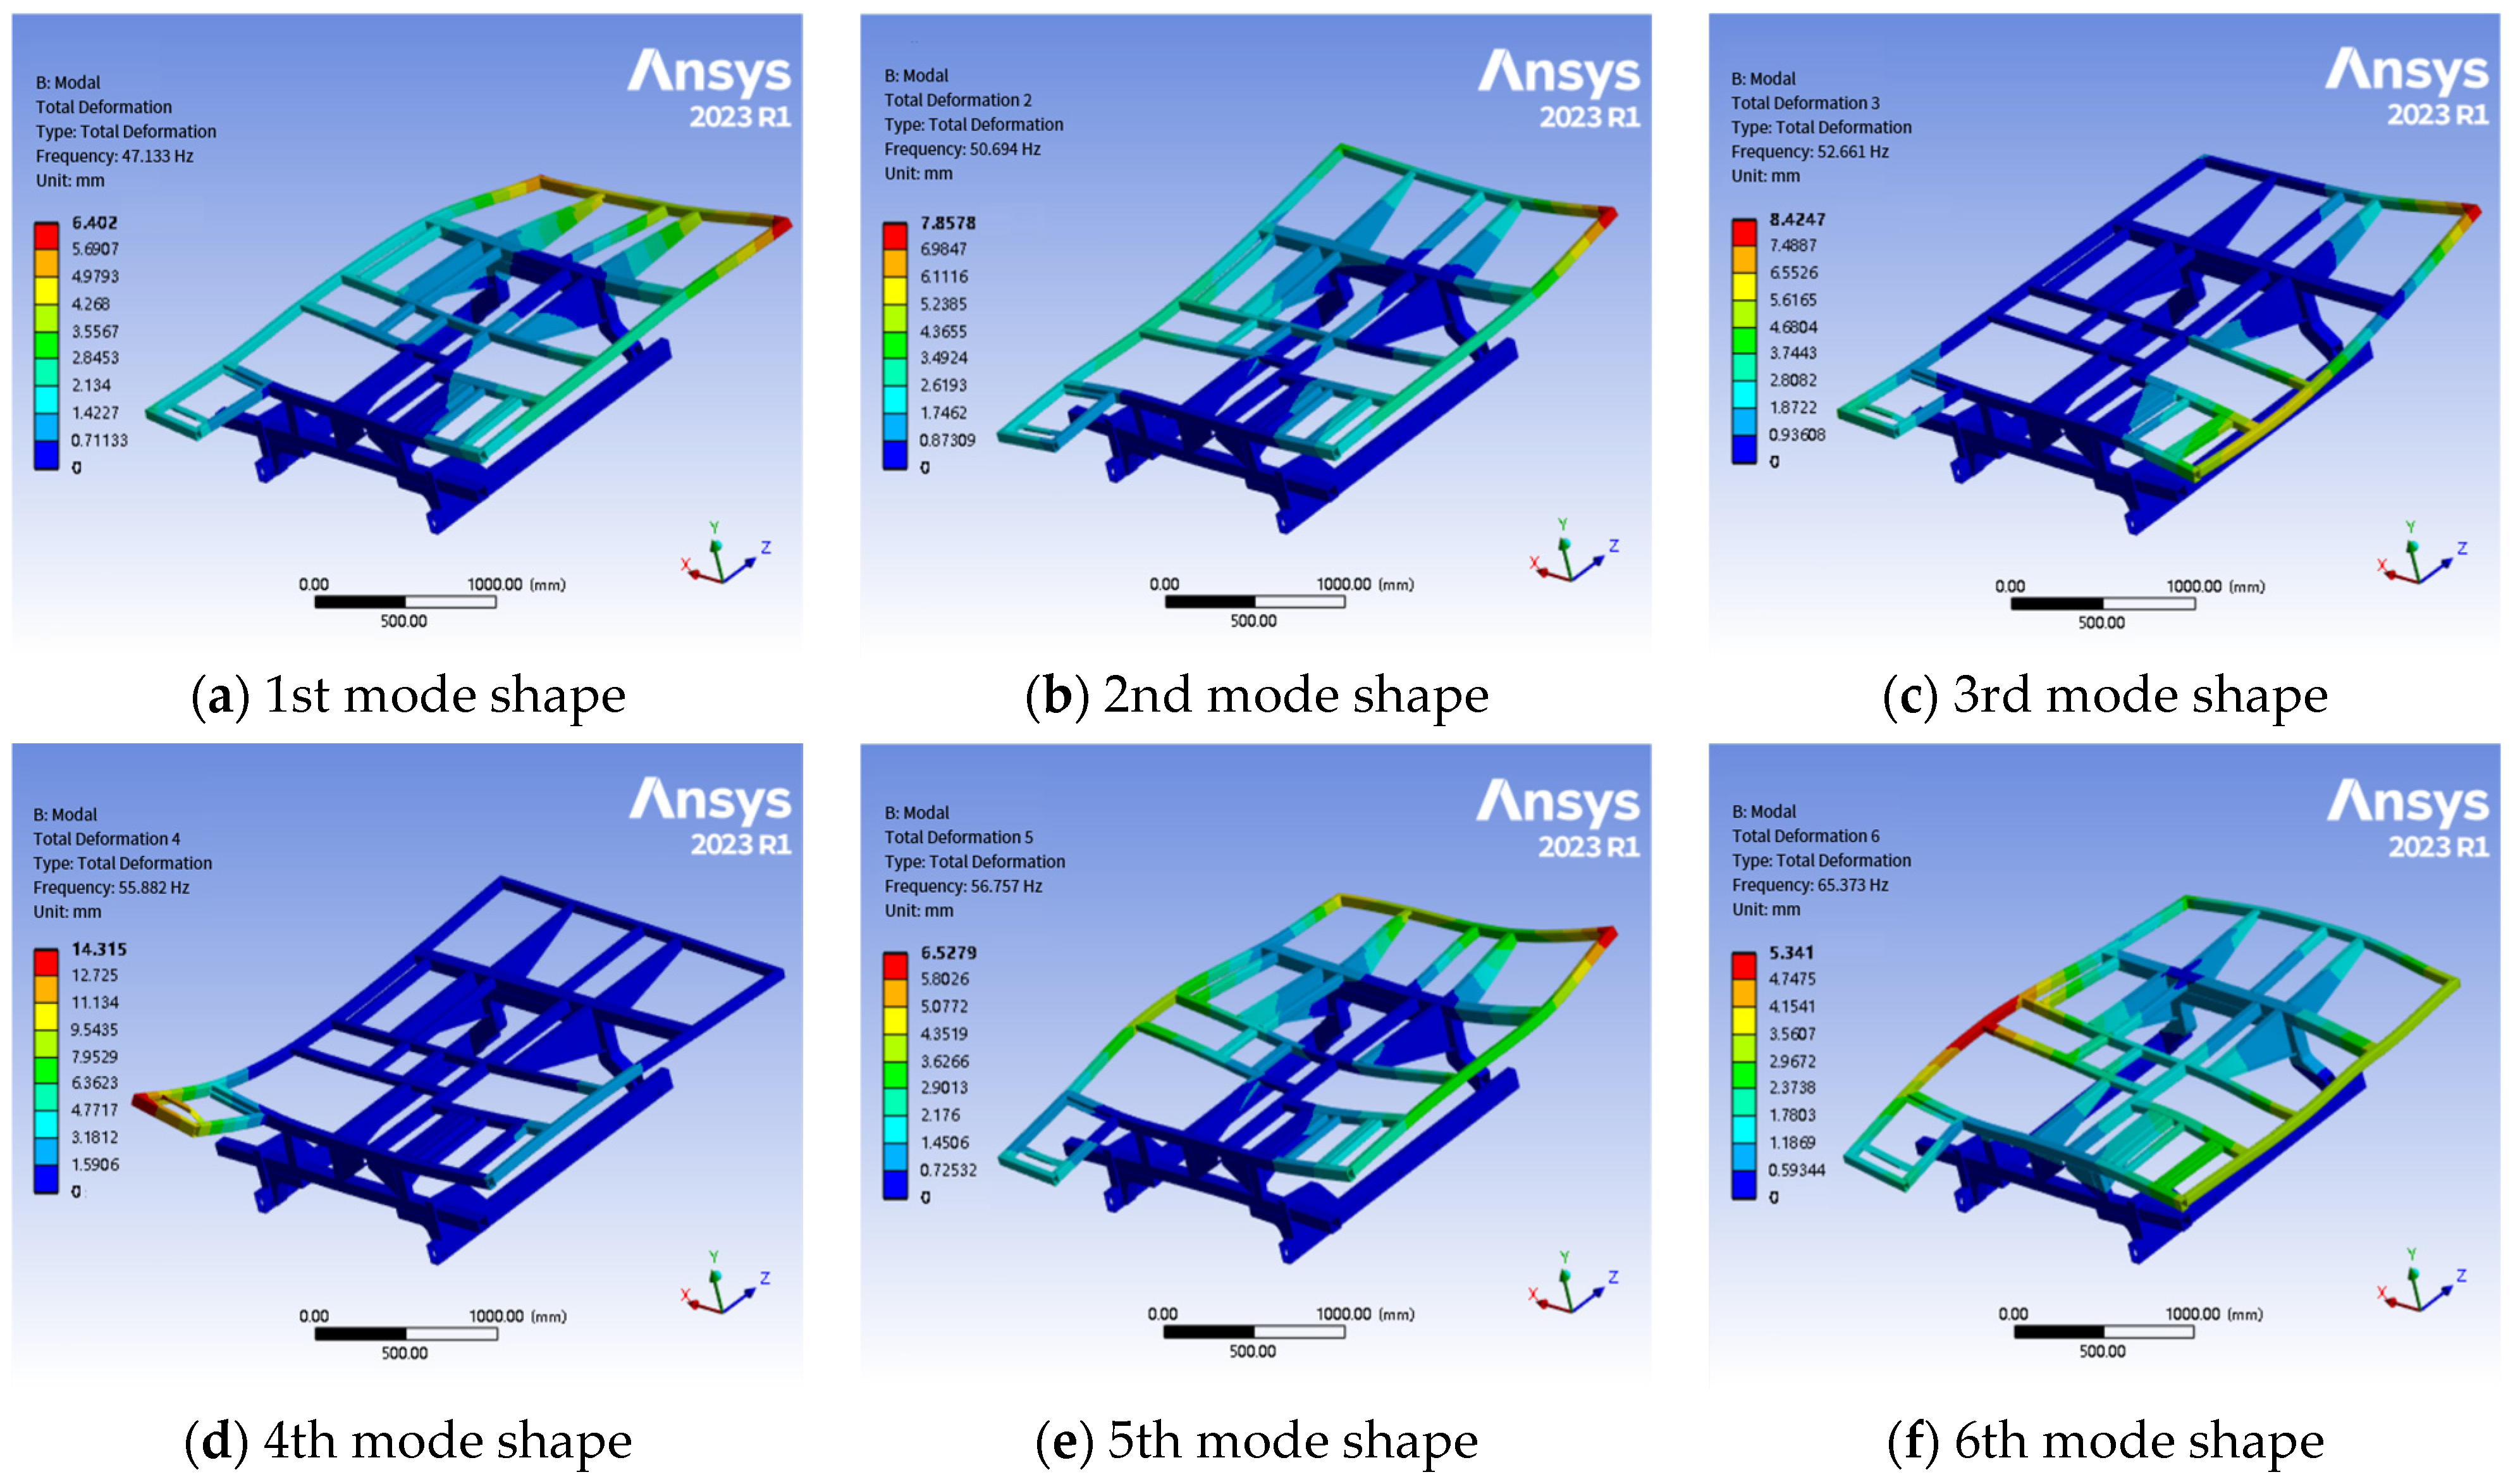
Modal analysis is a core theoretical method in the field of structural dynamics, and its primary function is to identify the key dynamic parameters of a mechanical system, such as its natural frequencies, modal damping ratios, and mode shapes. From a physical perspective, structural modes represent the inherent dynamic properties that a system exhibits under free vibration. In this study, a modal analysis of the combine harvester chassis frame was conducted using the Modal module in ANSYS Workbench 2023 R1. The finite element model was subjected to a meshing process. To ensure the accuracy of the simulation analysis, the mesh size was set to 12 mm, and a combination of solid and shell elements was selected for the mesh type. The final statistical results of the meshing were 838,840 nodes and 245,398 elements. The modal analysis was performed under free boundary conditions to determine the structure’s natural frequencies and mode shapes. The resulting first six free mode shapes of the chassis frame are presented in Figure 1.
Figure 1.
The first six free mode shapes of the chassis frame.
The natural frequencies, maximum deformations, and characteristics of each mode shape are summarized in Table 2.
Table 2.
Natural frequencies and characteristics of the first six free modes of the chassis frame.
The modal analysis results indicate that the first six natural frequencies of the chassis frame are primarily concentrated between 47.133 Hz and 65.373 Hz, with the corresponding mode shapes being predominantly local bending, torsion, and coupled modes. These natural frequencies have the potential to couple with the excitation frequencies of the combine harvester’s main working components, making them critical factors for inducing resonance in the chassis frame.
2.1.2. Vibration Signal Acquisition System
This study focuses on a self-propelled combine harvester, with vibration tests conducted on all major working components of the machine. The vibration signal acquisition system was primarily composed of the following precision equipment:
- (1)
- DH5902N Dynamic Signal Analyzer(Jiangsu Donghua Testing Technology Co., Ltd., Taizhou, China): This served as the core data acquisition unit, responsible for the high-efficiency digitization and preliminary processing of the analog signals received from the sensors.
- (2)
- 1A312E Triaxial Acceleration Sensors: These sensors incorporate three mutually perpendicular shear structures, enabling the simultaneous capture of acceleration signals along the X, Y, and Z axes of a Cartesian coordinate system. The sensors have a sensitivity of 1 mV/(m·s−2) and a measurement range of up to 5000 m·s−2. To meet the precision requirements of this study, their measurement range was set to ±500 g, with a linearity error of less than 1%, a maximum transverse sensitivity of less than 5%, and a frequency response range of 0.5–10,000 Hz.
- (3)
- Accelerometer Buses, Adapter Cables, and Magnetic Mounts: These were used for providing power to the sensors, transmitting signals, and ensuring stable installation at various measurement points.
- (4)
- Dynamic Signal Analysis Computer: This computer was equipped with the DHDAS dynamic acquisition system software and was used for real-time monitoring of the data acquisition process, setting acquisition parameters, and performing initial data visualization and storage.
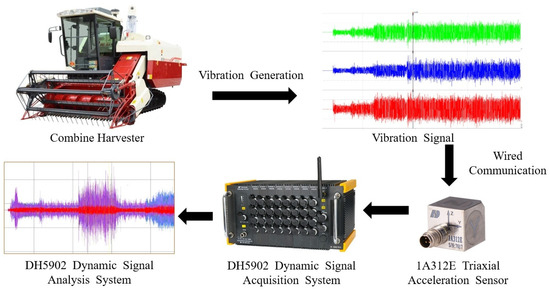
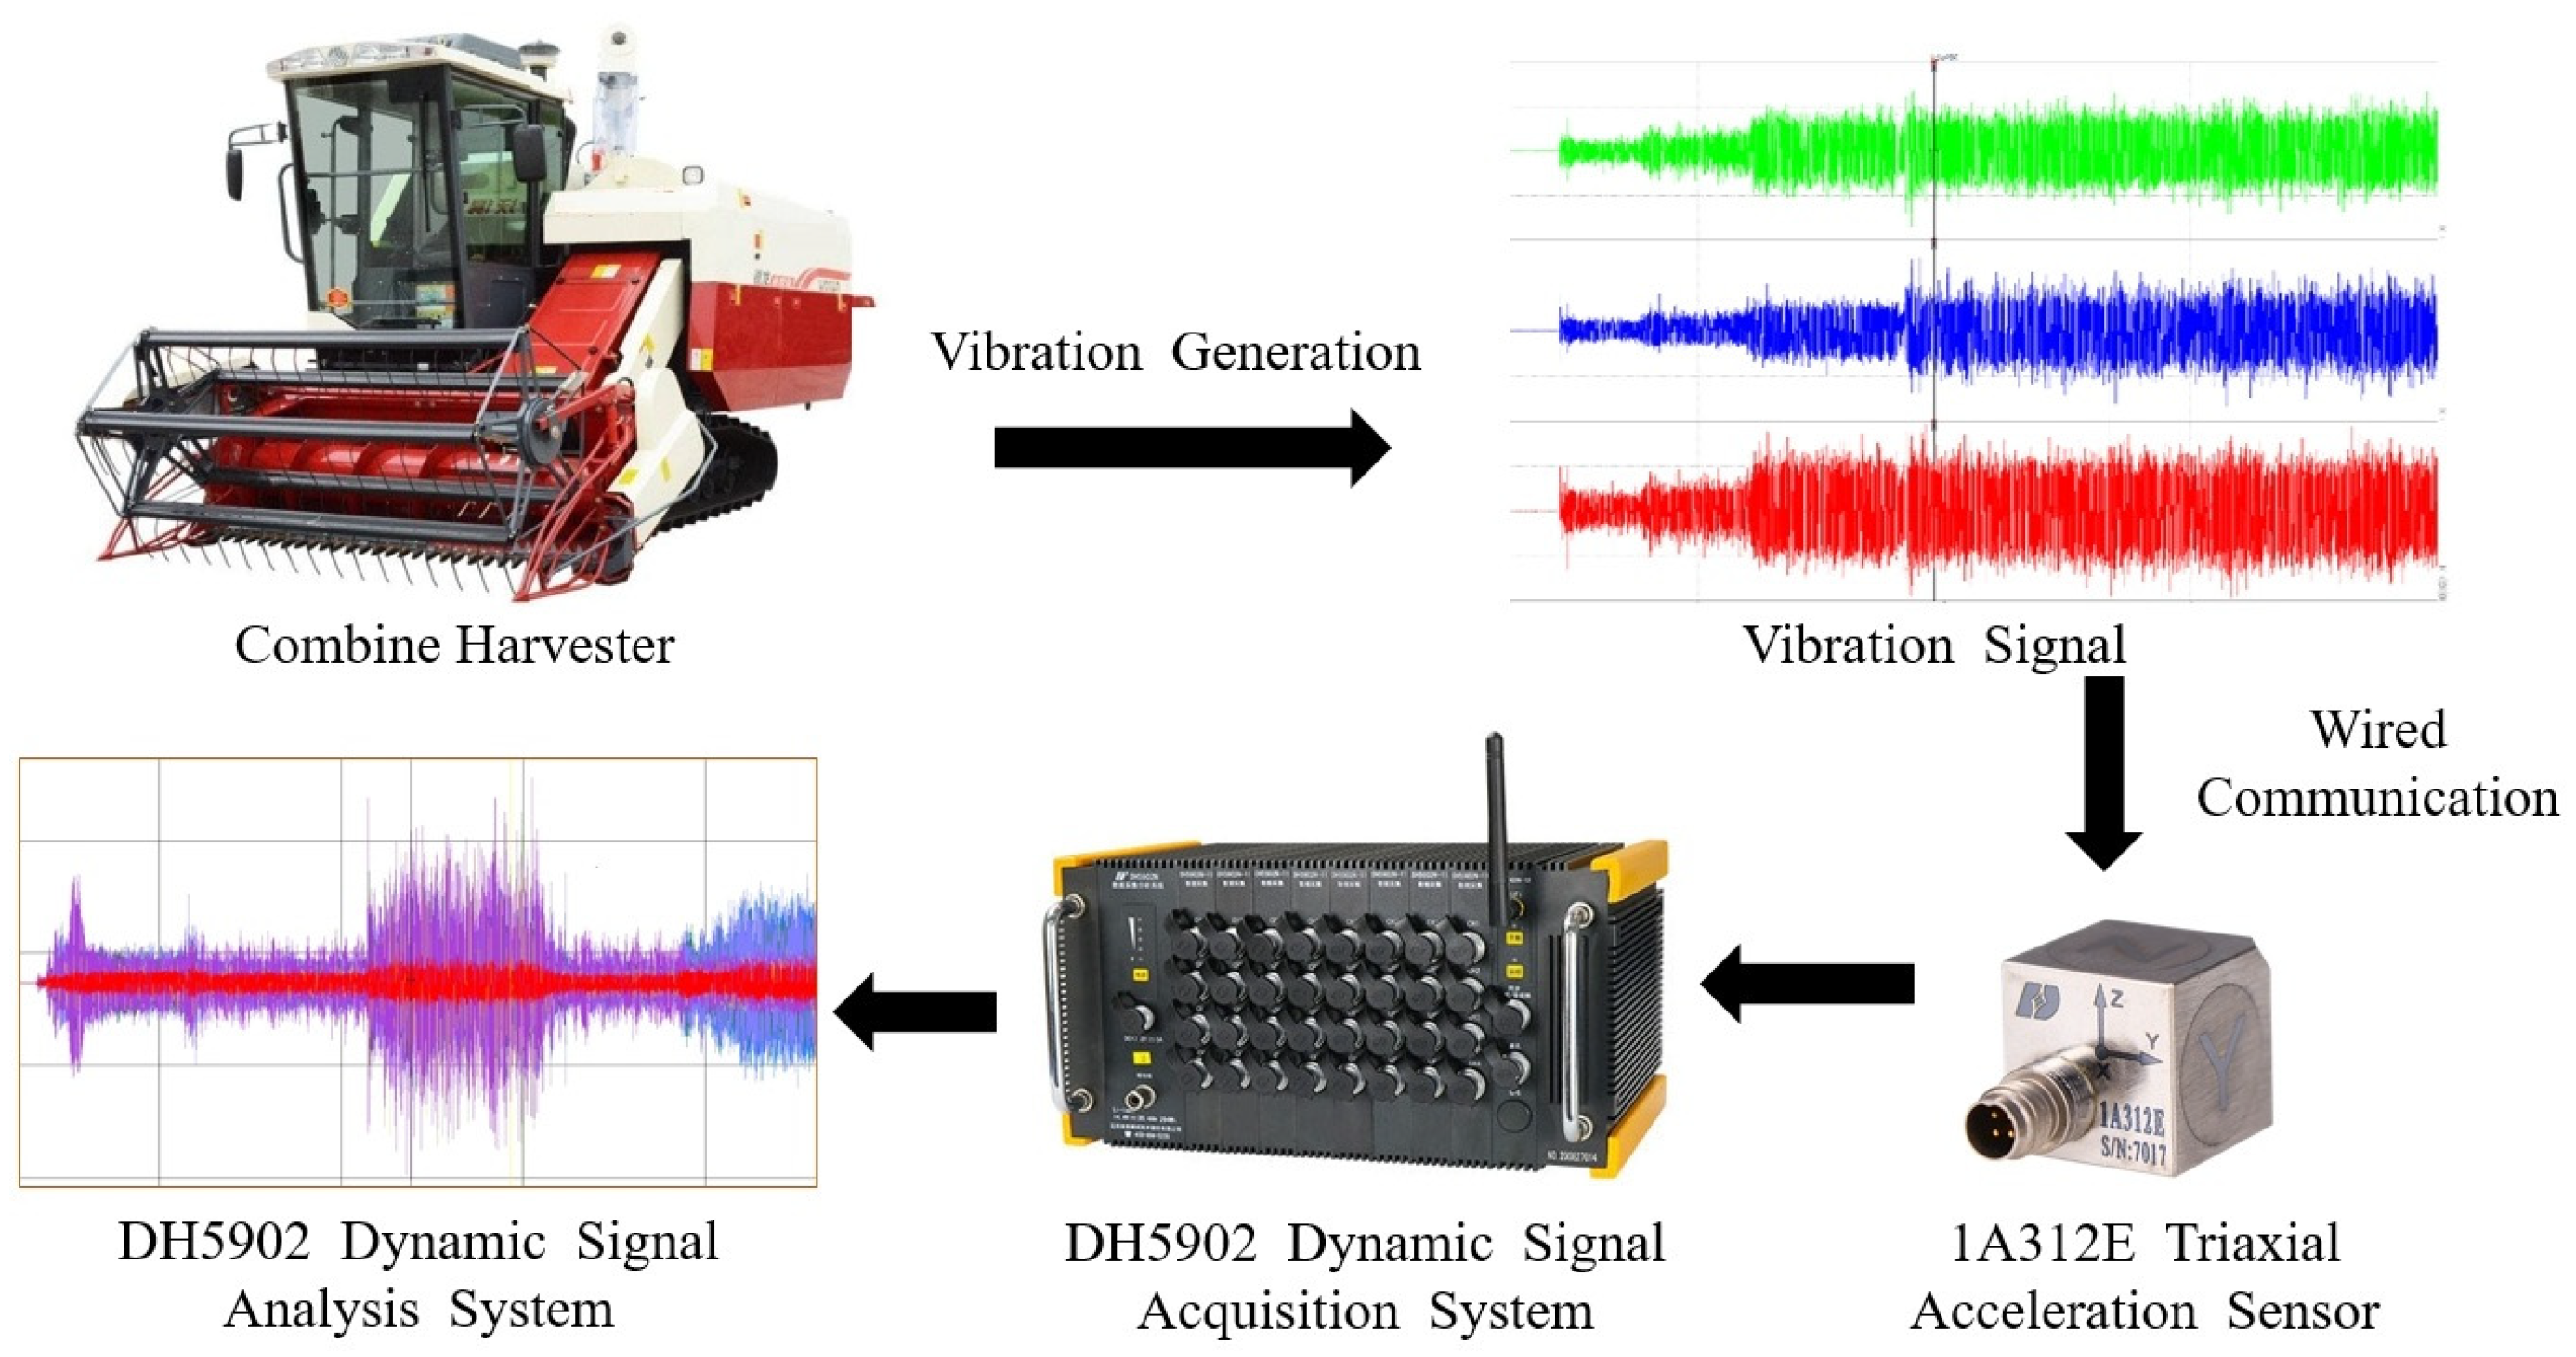
The dynamic signal acquisition system is illustrated in Figure 2. The coordinated operation of the entire acquisition system laid the foundation for subsequent high-precision and high-reliability vibration data analysis.
Figure 2.
Schematic diagram of the dynamic signal acquisition system.
2.2. Excitation Source Identification and Theoretical Analysis
During operation, the core working components within the combine harvester generate complex dynamic excitation. These excitations are transmitted through various paths to the chassis frame, ultimately influencing the overall vibration performance of the machine. This study focuses on four primary excitation sources: the engine, cutting header, threshing cylinder, and vibrating screen. Through theoretical calculations, the characteristic excitation frequencies of these components can be preliminarily determined, providing a reference for the subsequent frequency-domain analysis of the experimental data.
2.2.1. Engine Excitation Analysis
The combine harvester used in this test is equipped with a four-stroke, four-cylinder diesel engine. Its excitation is primarily caused by the periodic thrust from the combustion of high-temperature, high-pressure gas within the engine and the unbalanced inertial forces from the motion of the crank-connecting rod mechanism. The diesel engine operates at an idle speed of 880 r/min, and its principal firing order is the 2nd order. The corresponding excitation frequency can be calculated using the following Equation [51]:
In the Equation, is the engine firing frequency in Hz, c is the number of engine cylinders, and n is the engine speed in r/min. Given that the engine speed at idle is 880 r/min, the calculated excitation frequency of the harvester’s engine under idle conditions is 29.3 Hz.
2.2.2. Cutting Header Excitation Analysis
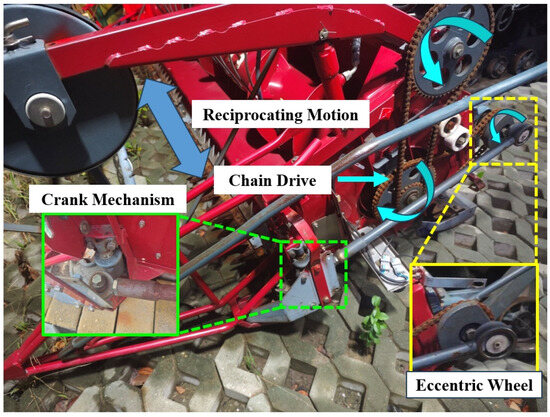
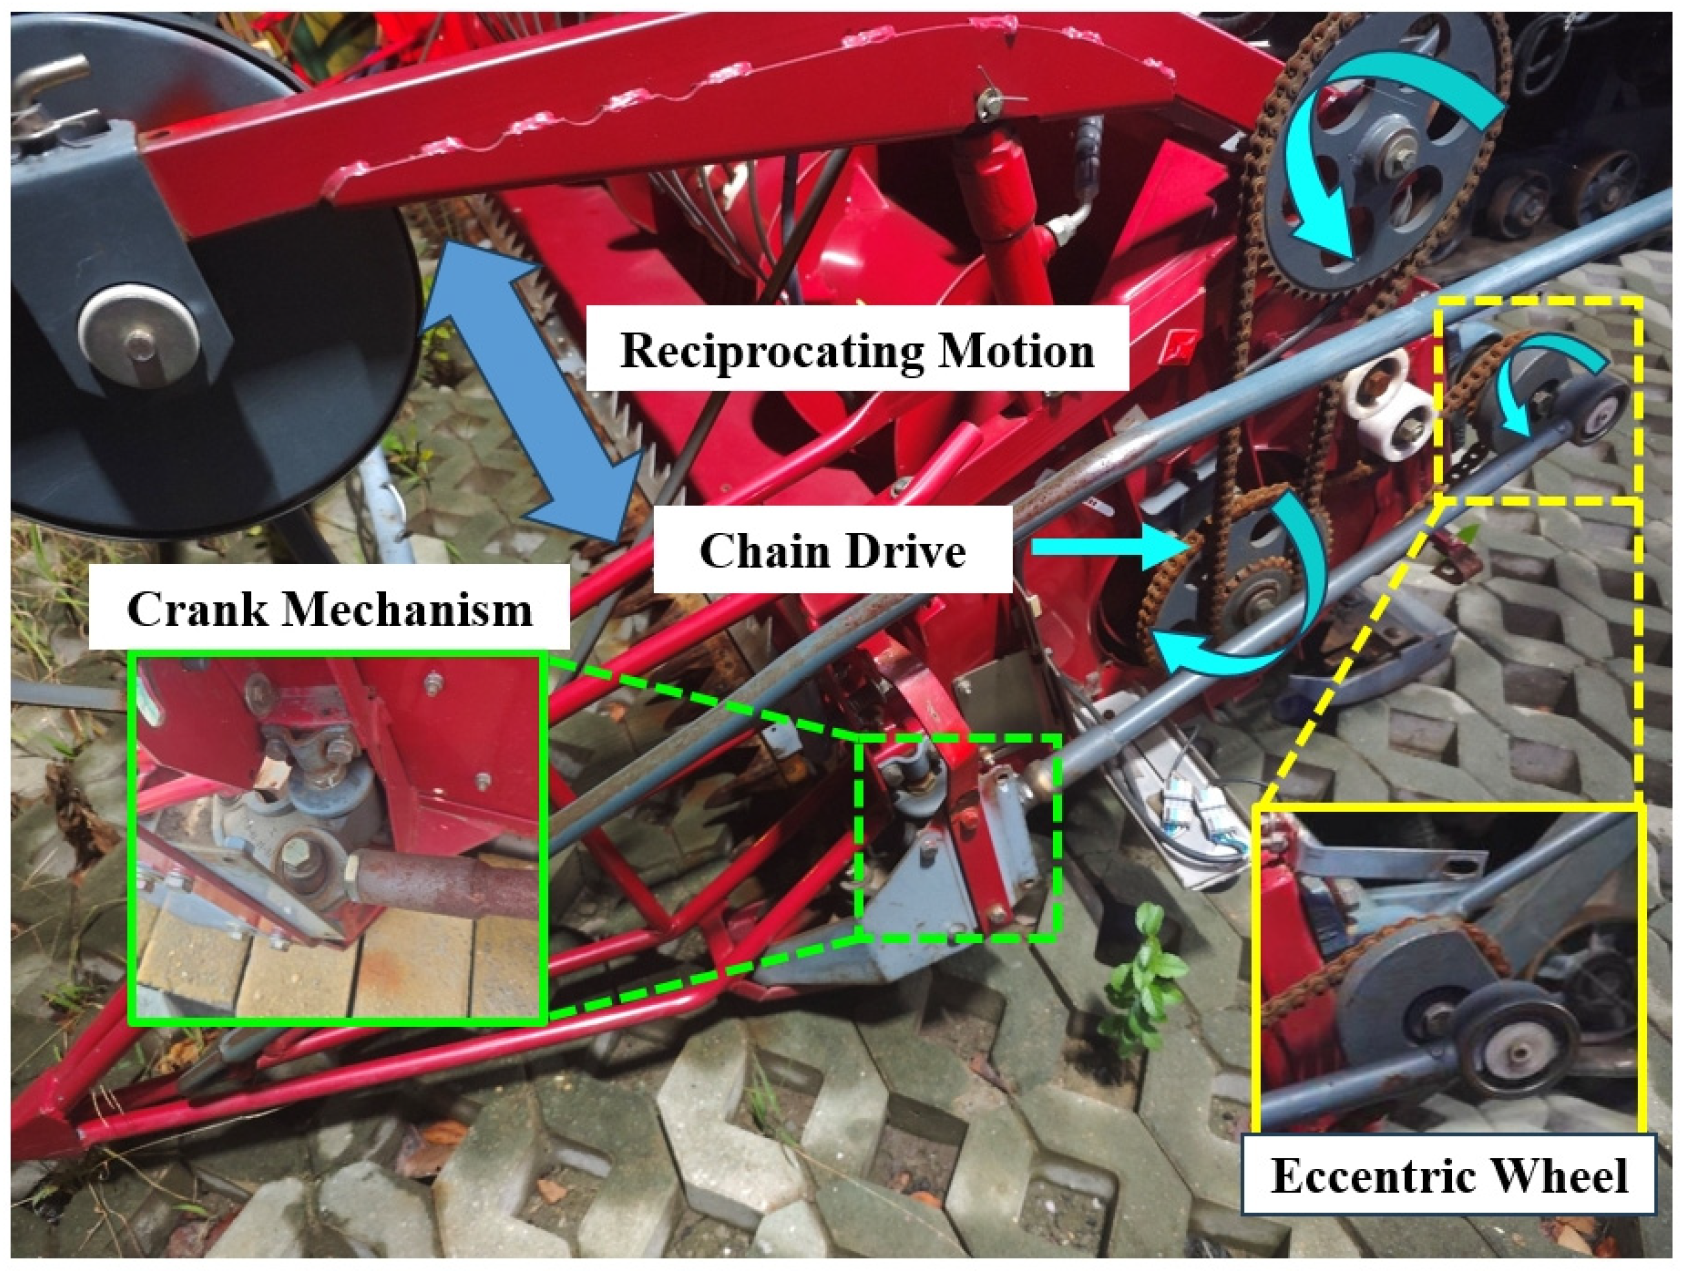
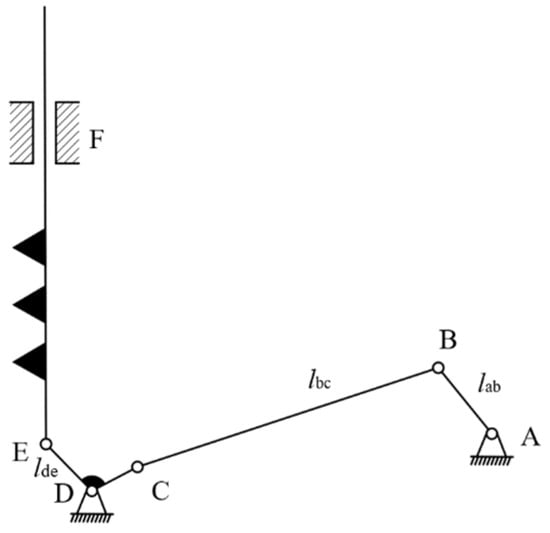
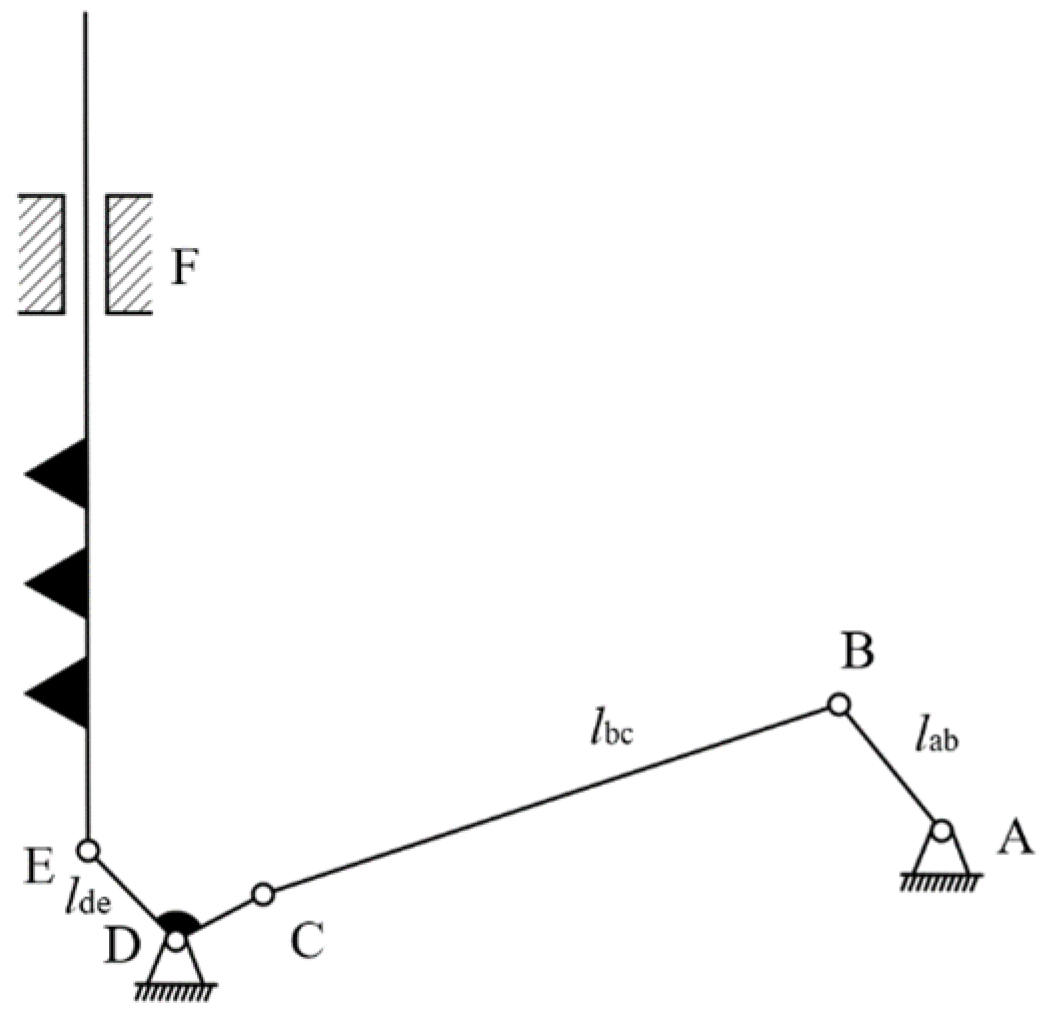
The cutting header is a crucial front-end component of the harvester, responsible for crop cutting and initial conveying. Its vibration is primarily generated by the reciprocating motion of the cutter, the rotation of the reel, and the chain drive of the conveyor trough. The cutter consists of two parts, a vertical cutter and a horizontal cutter. Its operating principle involves a chain drive that transmits power to an eccentric wheel. A long connecting rod then transfers this power to a crank mechanism, ultimately driving the reciprocating motion of the cutter. A physical diagram and a kinematic model of the cutter mechanism are shown in Figure 3 and Figure 4, respectively.
Figure 3.
Physical diagram of the cutter mechanism.
Figure 4.
Kinematic model of the cutter mechanism.
During harvester operation, to ensure harvesting efficiency and quality, the cutting speed of the reciprocating cutter is generally required to be between 1 and 2 m/s. The crank speed can be calculated using Equation (2).
In the above equation, represents the crank speed of the cutter mechanism (in r/min), is the cutting speed of the cutter (in m/s), and is the crank length ( = 125 mm).
Based on this calculation, the crank speed ranges from 76.39 to 152.79 r/min. As the reciprocating motion of the cutter generates significant dynamic forces, the vibration frequency of the rotating component can be determined by the Equation . The theoretical vibration frequency range for the reciprocating motion of the cutter is thus calculated to be 1.27–2.55 Hz.
2.2.3. Excitation Analysis of the Threshing Cylinder and Vibrating Screen
The threshing cylinder is the core component of the harvester responsible for crop threshing. According to the user manual for this harvester model, the rotational speed of the threshing cylinder is set to 580 r/min, and its radius is 310 mm. The threshing cylinder is equipped with multiple rows of threshing teeth, uniformly distributed on its surface; the unit under study has six rows of these teeth. As the threshing cylinder rotates, the interaction of each row of teeth with the crop and internal structures generates periodic impact excitation. Its excitation frequency, , can be calculated using Equation (3).
In the above equation, represents the rotational speed of the threshing cylinder (in r/min), and k is the number of rows of threshing teeth. Based on this calculation, with a cylinder speed of 580 r/min and six rows of threshing teeth, the theoretical excitation frequency of the threshing cylinder is calculated to be approximately 58 Hz.
The vibrating screen is a core component used for grain cleaning. Its operating principle involves being driven by an eccentric bearing to produce reciprocating vibration, which separates the grain from impurities. For this study, its motion is simplified and analyzed primarily within the X-Z plane, and its vibration is generally approximated as simple harmonic motion. The excitation frequency of the vibrating screen can be calculated using Equation (4).
In the above equation, fs represents the excitation frequency of the vibrating screen (in Hz) and is the rotational speed of the vibrating screen’s eccentric bearing (in r/min). Taking = 960 r/min, the theoretical excitation frequency of the vibrating screen is calculated to be 16 Hz.
The results of the above theoretical analysis are summarized in Table 3, which provides a theoretical reference for the excitation frequencies to be used in the subsequent vibration tests and data analysis.
Table 3.
Excitation frequencies of combine harvester sources under idle conditions.
2.3. Vibration Test Scheme
2.3.1. Arrangement of Measurement Points
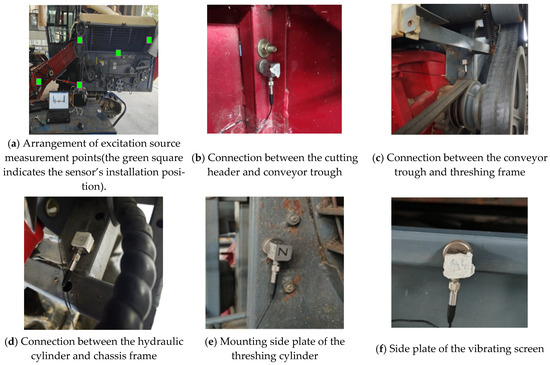
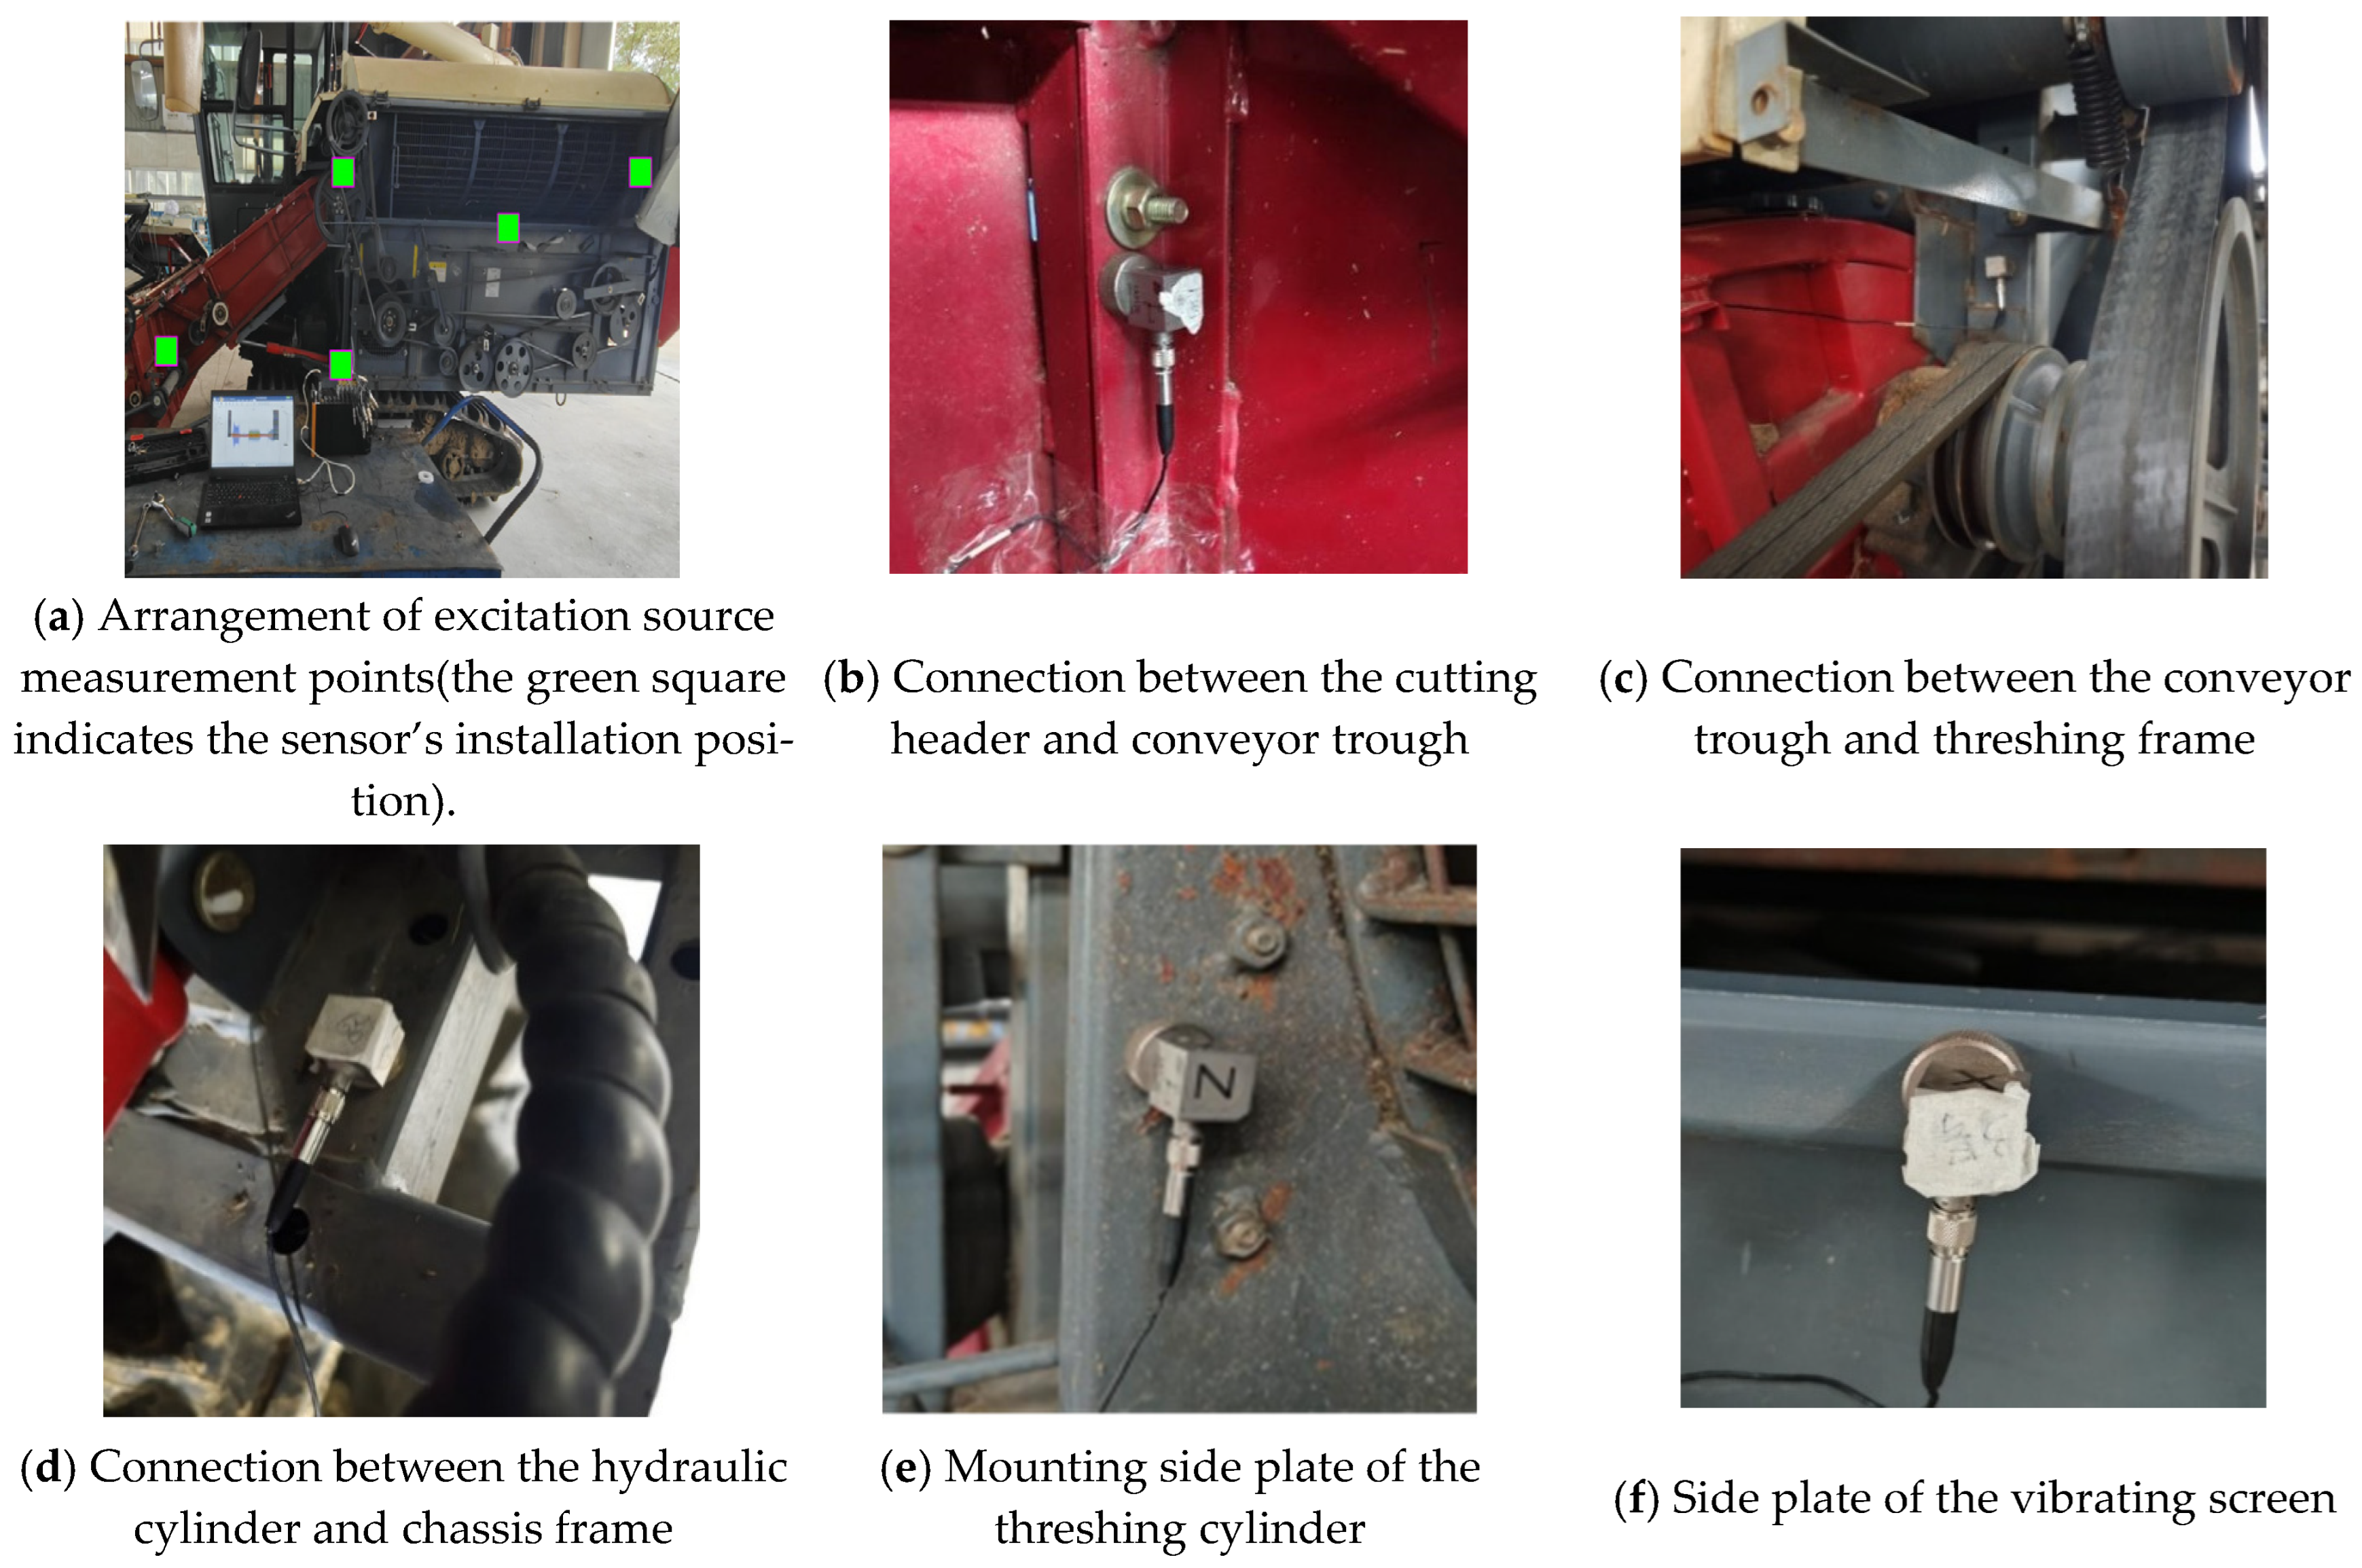
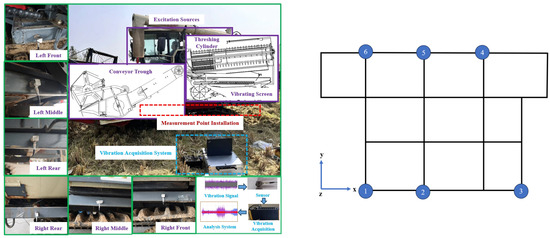
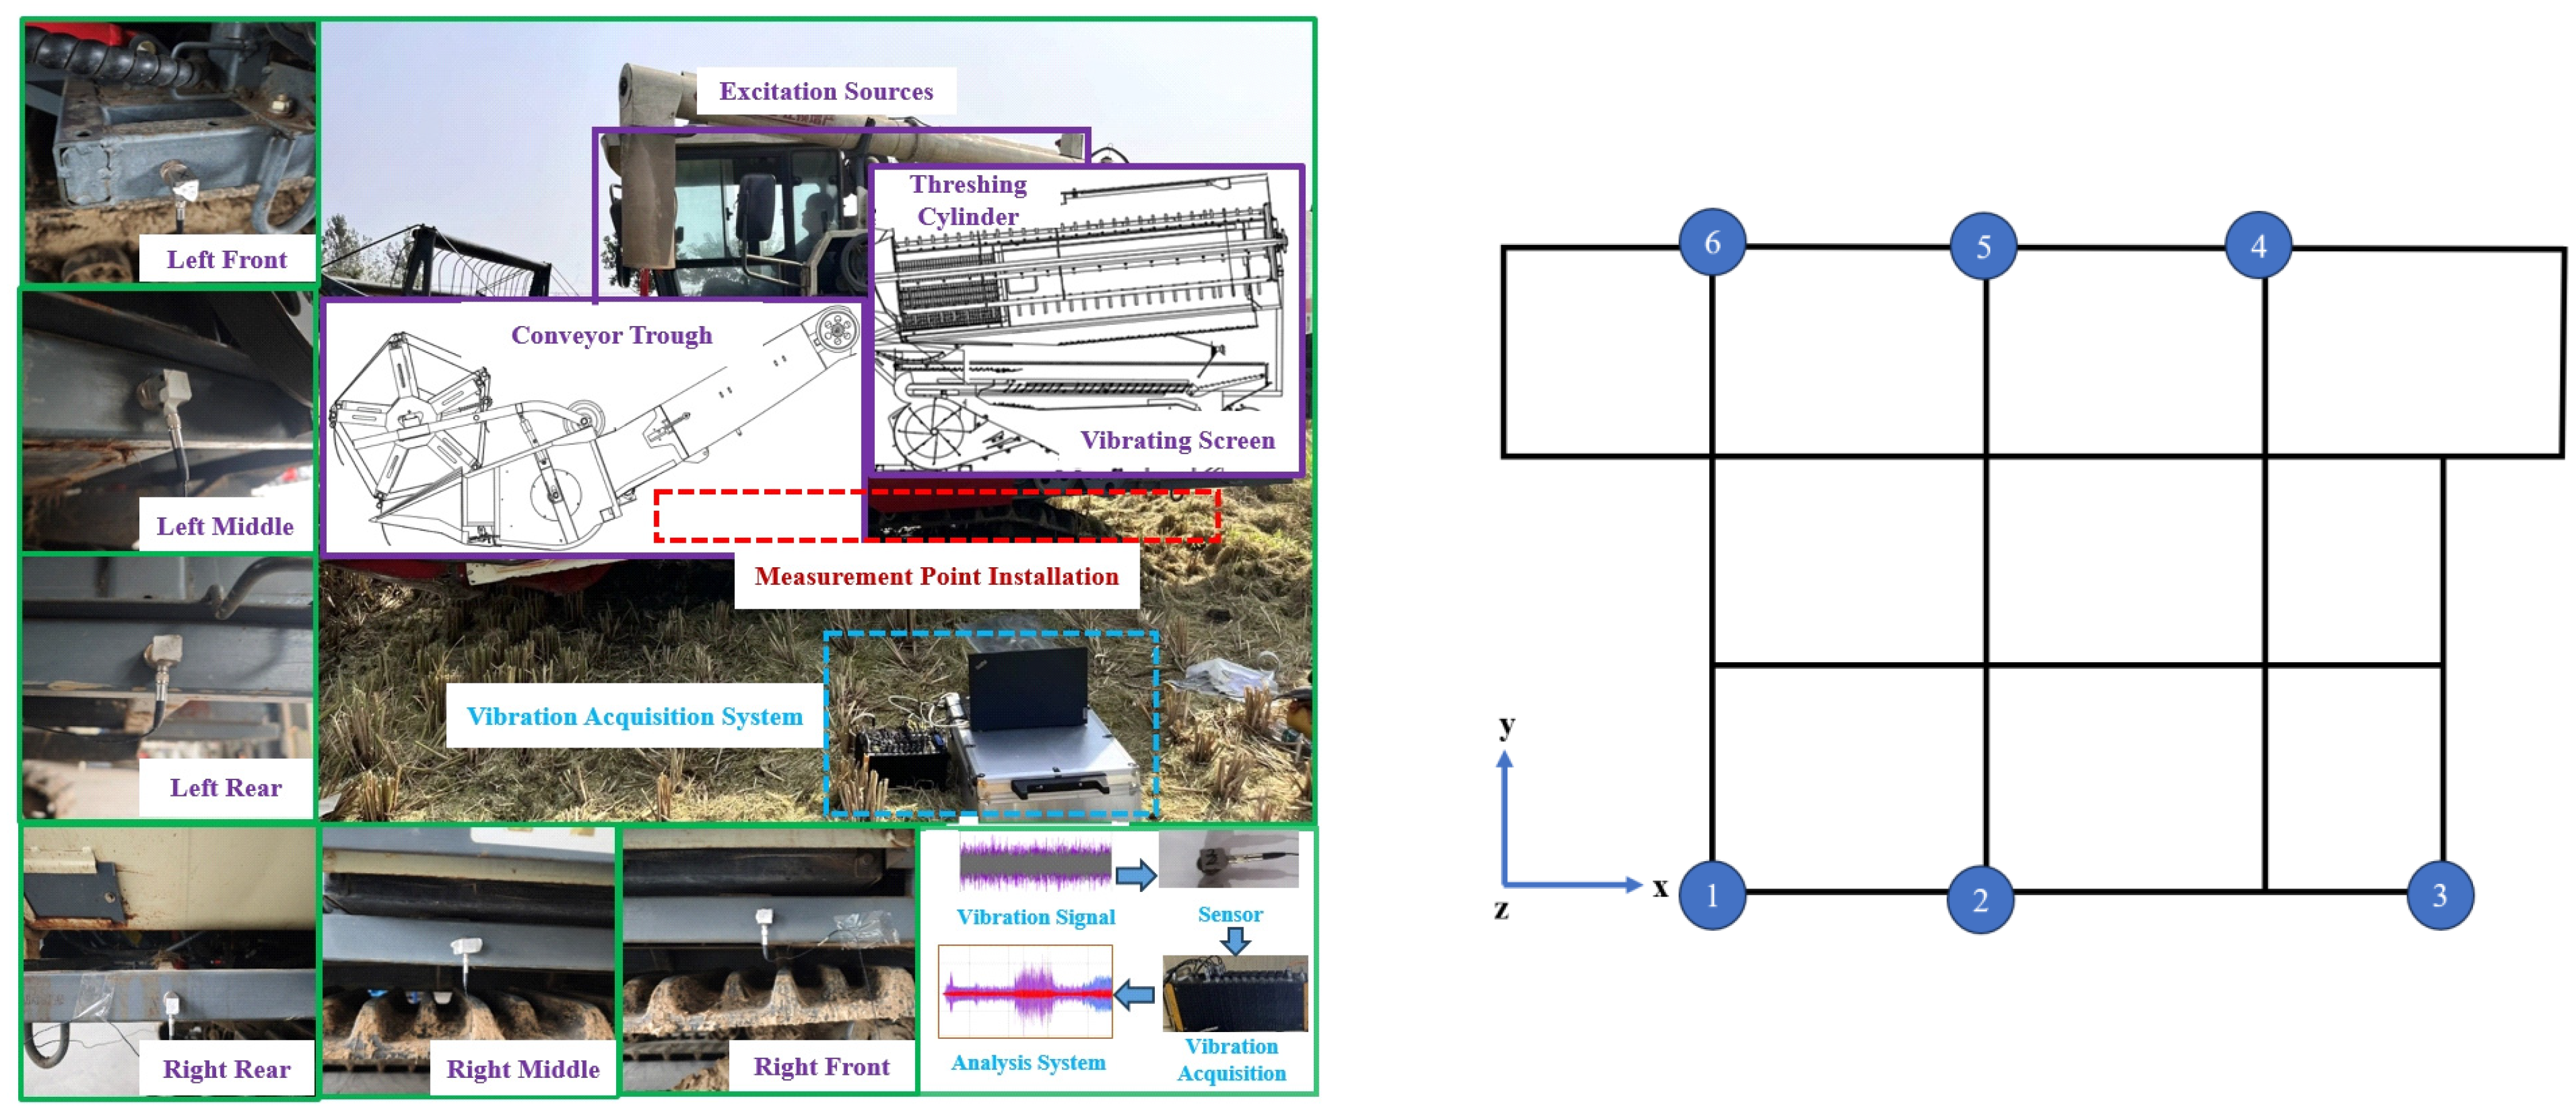
To investigate the influence of the main excitation components of a rice combine harvester on the vibration characteristics of its chassis frame and to accurately identify the contribution of each excitation source to the frame’s vibration, this study designed a systematic vibration test scheme. The vibration measurement points were divided into two main categories: excitation source points and target response points on the chassis frame. Triaxial acceleration sensors were used at all measurement points to acquire vibration data in the X, Y, and Z directions.
- (1)
- Input Measurement Points: A total of five measurement points were established near the primary excitation sources to capture the vibration input signals from each source. The specific installation locations were the connection point between the cutting header and the conveyor trough (A1); the connection point between the conveyor trough and the threshing frame (A2); the connection between the cutting header’s lifting hydraulic cylinder and the chassis frame (A3); the mounting side plate of the threshing cylinder (A4); and the outer frame of the vibrating screen (A5). These locations are illustrated in Figure 5.Figure 5. Installation locations of excitation measurement points on the combine harvester.
- (2)
- Target Response Points on the Chassis Frame (Output Points): A total of six measurement points (numbered 1 to 6) were established at key locations around the outer frame of the chassis. These points were symmetrically distributed on the front, middle, and rear sections of both the left and right sides of the chassis frame to capture its overall vibration response. A schematic diagram showing the specific installation locations of the test points is presented in Figure 6.Figure 6. Schematic diagram of the measurement point distribution on the chassis frame( The numbered points correspond to the physical locations as follows: 1—Left Front, 2—Left Middle, 3—Left Rear, 4—Right Rear, 5—Right Middle, and 6—Right Front).
2.3.2. Test Conditions and Data Acquisition Procedure
The tests were conducted with the combine harvester stationary and at idle speed to eliminate interference from external dynamic excitations, such as uneven ground and crop load. To accurately analyze the excitation contribution of each working component, the experiment employed a procedure of sequentially activating and deactivating the components. The data acquisition sampling frequency was set to 2 kHz. The specific test procedure was as follows:
- (1)
- Engine-Only Operation Phase: The engine was started and allowed to run stably for 10 s. During this phase, the engine was the primary source of vibration excitation, which was used to capture its fundamental excitation characteristics.
- (2)
- Threshing and Cleaning System Operation Phase: After the engine stabilized, the threshing cylinder and vibrating screen were engaged and allowed to run stably for 10 s. In this phase, the engine, threshing cylinder, and vibrating screen acted as combined excitation sources.
- (3)
- Full-Function Operation Phase: Subsequently, the cutting header was activated, causing components such as the cutter, auger, reel, and conveyor trough to begin operation. The system was then allowed to run stably for 10 s. At this point, all core working components (engine, cutting header, threshing cylinder, and vibrating screen) were in an active state of excitation.
- (4)
- Sequential Shutdown Phase: After 10 s of stable full-function operation, the cutting header was first disengaged. Following this, the threshing cylinder and vibrating screen were shut down. Finally, the engine was turned off. After each shutdown action, a 10-s waiting period was observed to ensure system stability.
By following this procedure, the vibration responses of the chassis frame under various combinations of excitation sources could be obtained, providing rich input data for the OTPA.
2.4. Vibration Transfer Path Analysis (OTPA) Method
2.4.1. Basic Principle of OTPA
The OTPA method is a transfer path analysis technique based on a system’s actual operating conditions, primarily used to identify and quantify the contribution paths of energy, such as vibration and noise, within complex mechanical or structural systems [52,53]. The core principle of OTPA involves establishing the relationship between the excitation source inputs and the target point responses through a transfer function matrix. This relationship can be expressed as:
In the above equation, Y(ω) represents the vibration response (output) matrix at the target points, X(ω) is the vibration signal (input) matrix from the excitation sources, and H(ω) is the transfer function matrix. The dimension of H(ω) is n × m, where n is the number of target points and m is the number of excitation sources. The element Hij within this matrix represents the transfer function from the j-th excitation source to the i-th target point.
Under ideal conditions, the transfer function matrix H(ω) can be obtained by solving the aforementioned equation:
2.4.2. Improved OTPA Method
In practical applications, however, the input matrix X(ω) is often ill-conditioned (i.e., its condition number is excessively large) due to potential correlations among the multi-source excitation signals or the presence of noise interference. Directly inverting this matrix can make the results highly sensitive to minor errors, thereby compromising the accuracy and stability of the transfer function estimation. To address the challenges of modeling and analyzing such complex MIMO systems, various engineering fields have explored advanced solutions. For instance, in the field of power electronics control, researchers have adopted data-driven methods like machine learning to replace traditional physical models, aiming to cope with system nonlinearities and uncertainties [54]. To overcome the challenges encountered in this study, an improved OTPA method based on Singular Value Decomposition (SVD) was employed. SVD is a mathematical tool that decomposes an arbitrary matrix into the product of three matrices:
In this equation, U and V are unitary matrices, and Σ is a diagonal matrix whose diagonal elements are the singular values σi, arranged in descending order. SVD can reveal the intrinsic structure of a matrix and can be used for data dimensionality reduction and noise filtering.
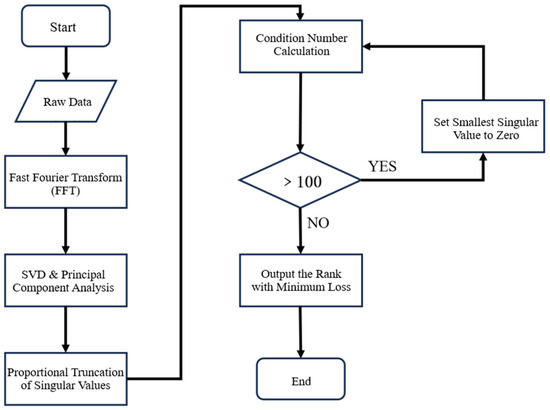
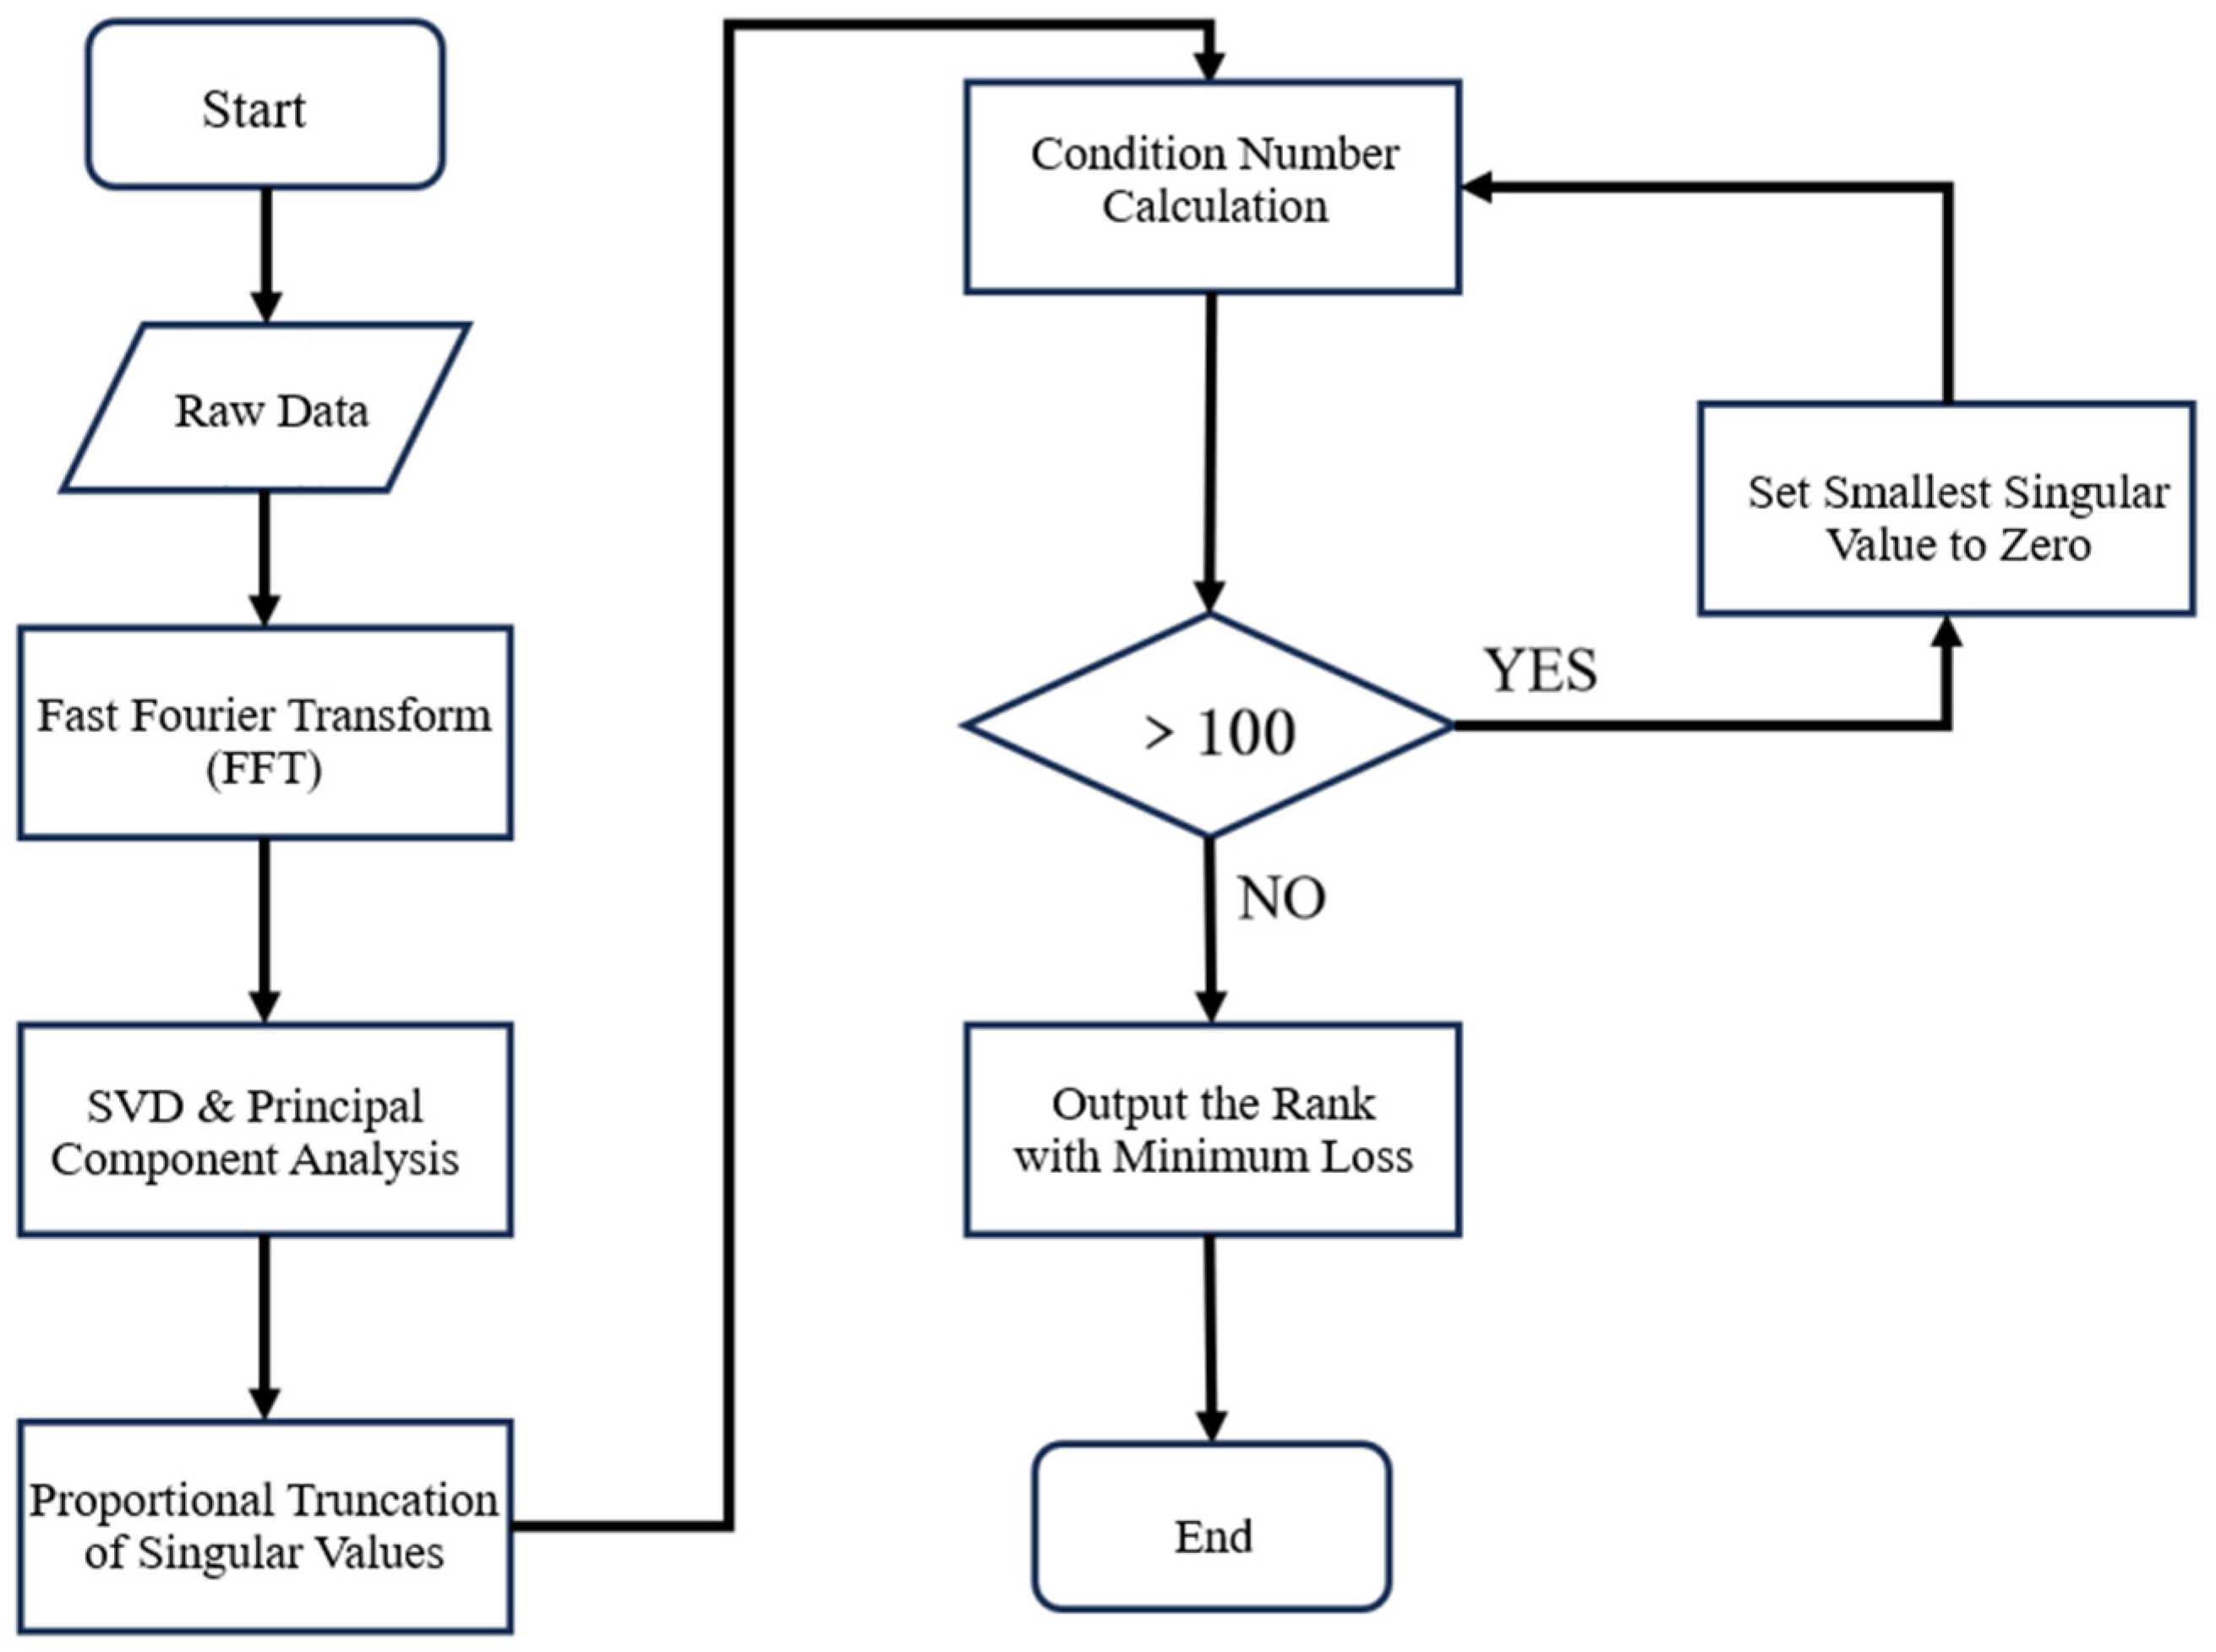
To further enhance the stability and accuracy of the OTPA calculation, this study introduces a proportional truncation technique for singular values. The core idea is to set to zero any singular values in the matrix Σ that are smaller than a certain percentage of the largest singular value (a threshold of 0.4% was used in this study). This truncation operation effectively filters out noise and insignificant components from the data while preserving the most dominant energy information in the signal. Consequently, it significantly reduces the condition number of the matrix, thereby improving the stability of the solution.
The specific process of this improved method is illustrated in Figure 7. By setting to zero the singular values that fall below a predefined threshold, we can adaptively select the optimal number of singular values for truncation. This approach avoids the potential information loss associated with fixed truncation, thereby ensuring the effectiveness of the OTPA model’s optimization. Based on this, the contribution of each excitation source to the target point can be calculated. For a specific transfer path j, its contribution can be expressed as:
Figure 7.
Flowchart of the optimization process using proportional truncation of singular values.
2.4.3. Model Construction
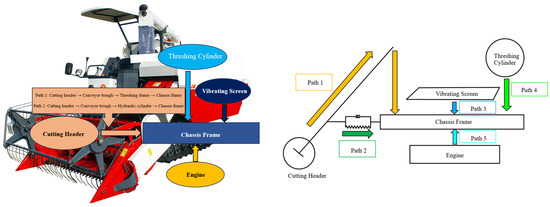
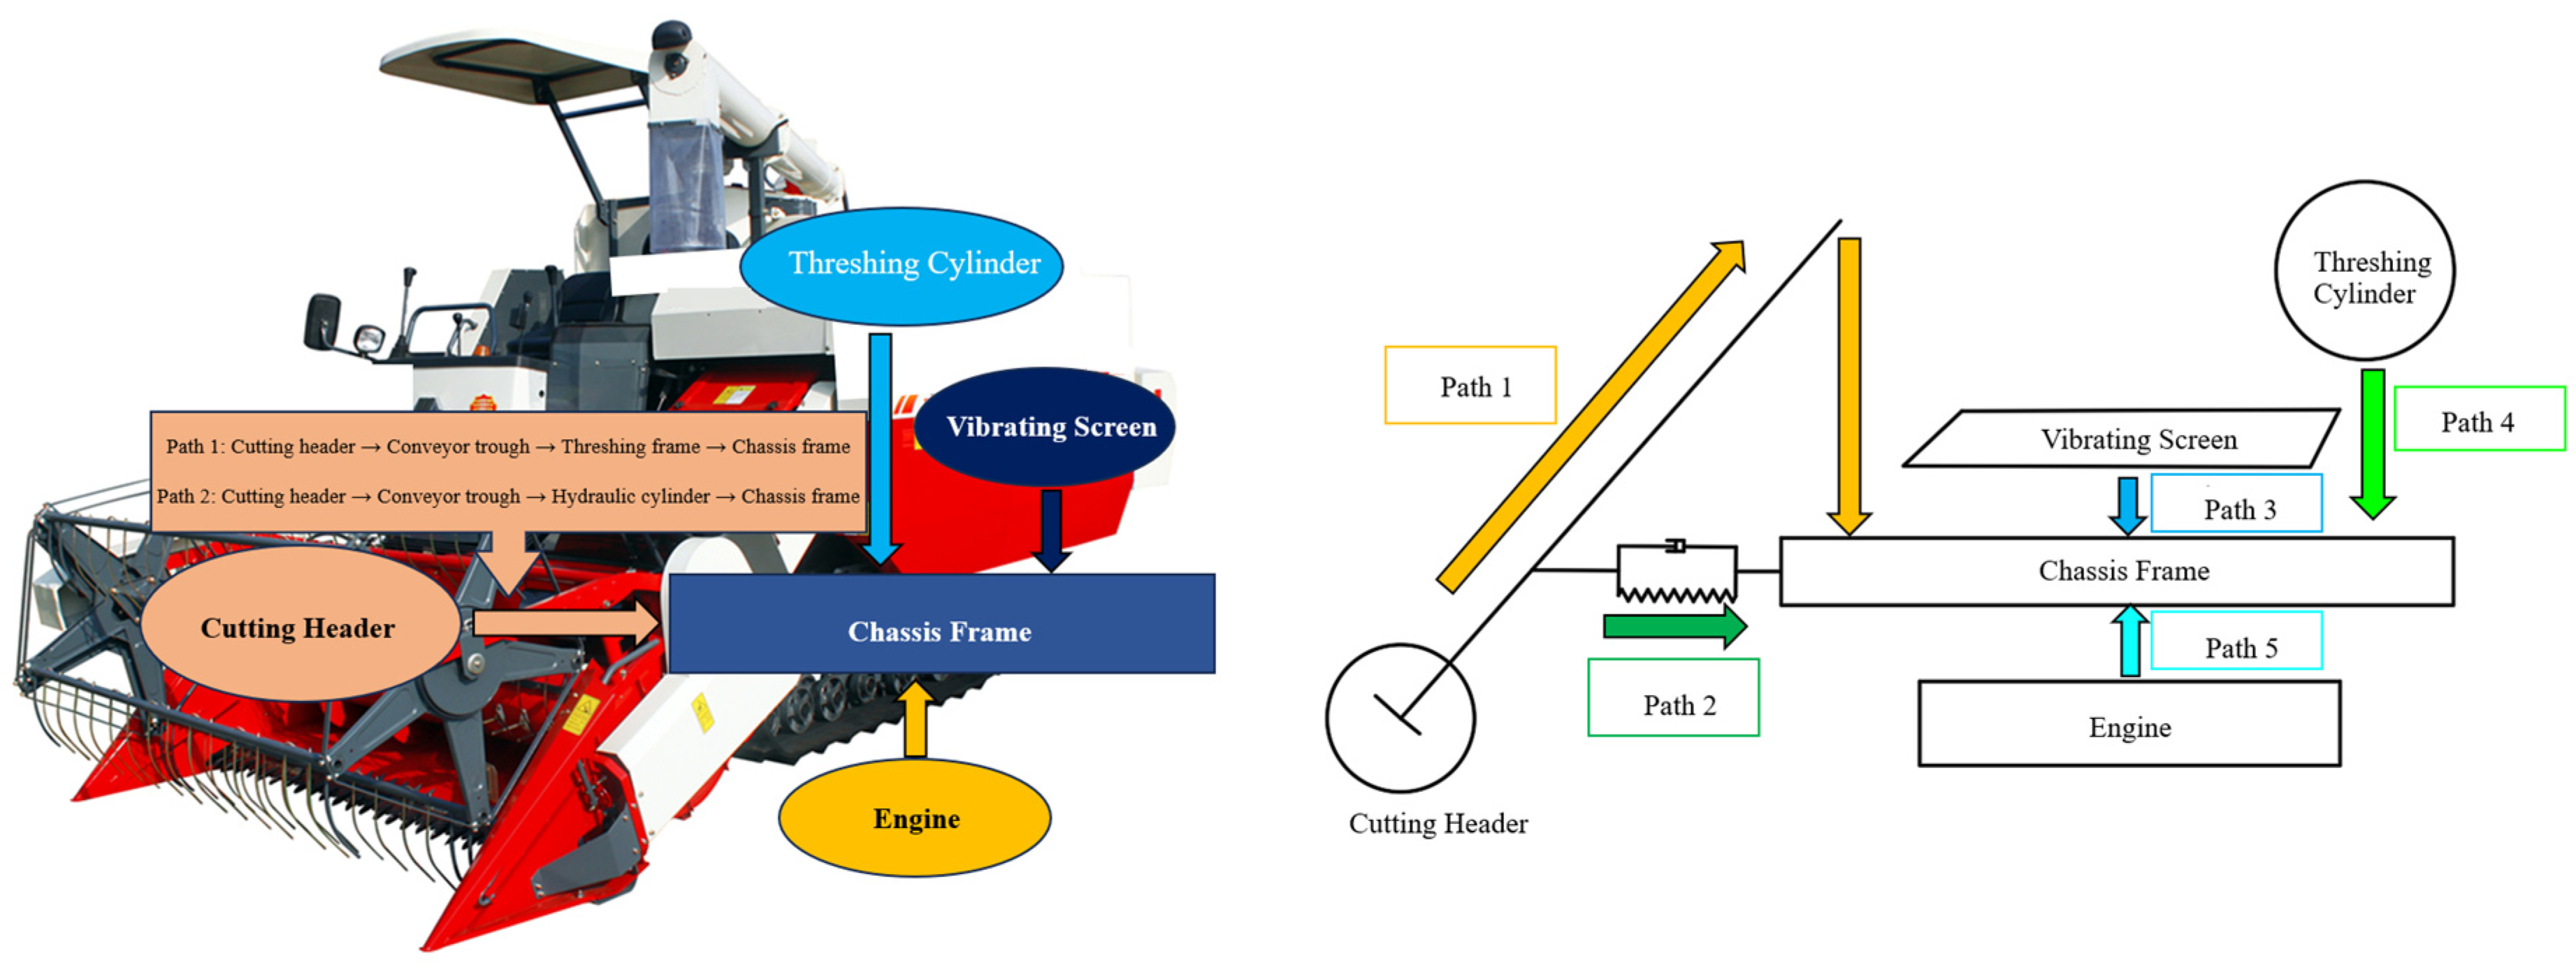
Based on the improved OTPA method described above, this study constructed a 5 × 6 OTPA transfer path model that incorporates 5 input points (A1 to A5) and 6 target response points on the chassis frame (1 to 6). The model comprises a total of five defined transfer paths:
- (1)
- Path 1: Cutting header → Conveyor trough → Threshing frame → Chassis frame
- (2)
- Path 2: Cutting header → Conveyor trough → Hydraulic cylinder → Chassis frame
- (3)
- Path 3: Threshing cylinder → Chassis frame
- (4)
- Path 4: Vibrating screen → Chassis frame
- (5)
- Path 5: Engine → Chassis frame
As illustrated in Figure 8, the model uses the vibration signals from each excitation source as inputs and the vibration responses at the target points on the chassis frame as outputs. By solving for the improved transfer functions, the model quantifies the contribution of each excitation source to the chassis frame’s vibration through the different defined paths.
Figure 8.
The OTPA transfer path analysis model.
3. Results and Discussion
3.1. OTPA Model Validation
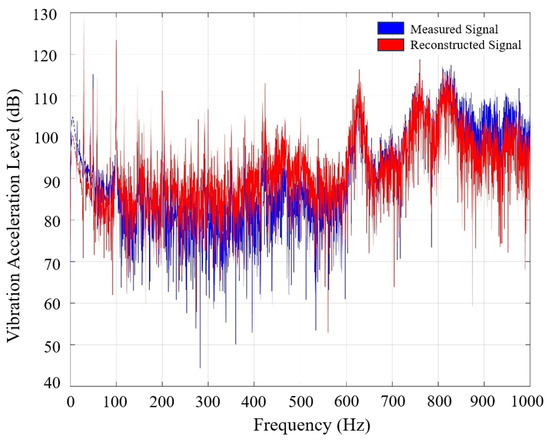
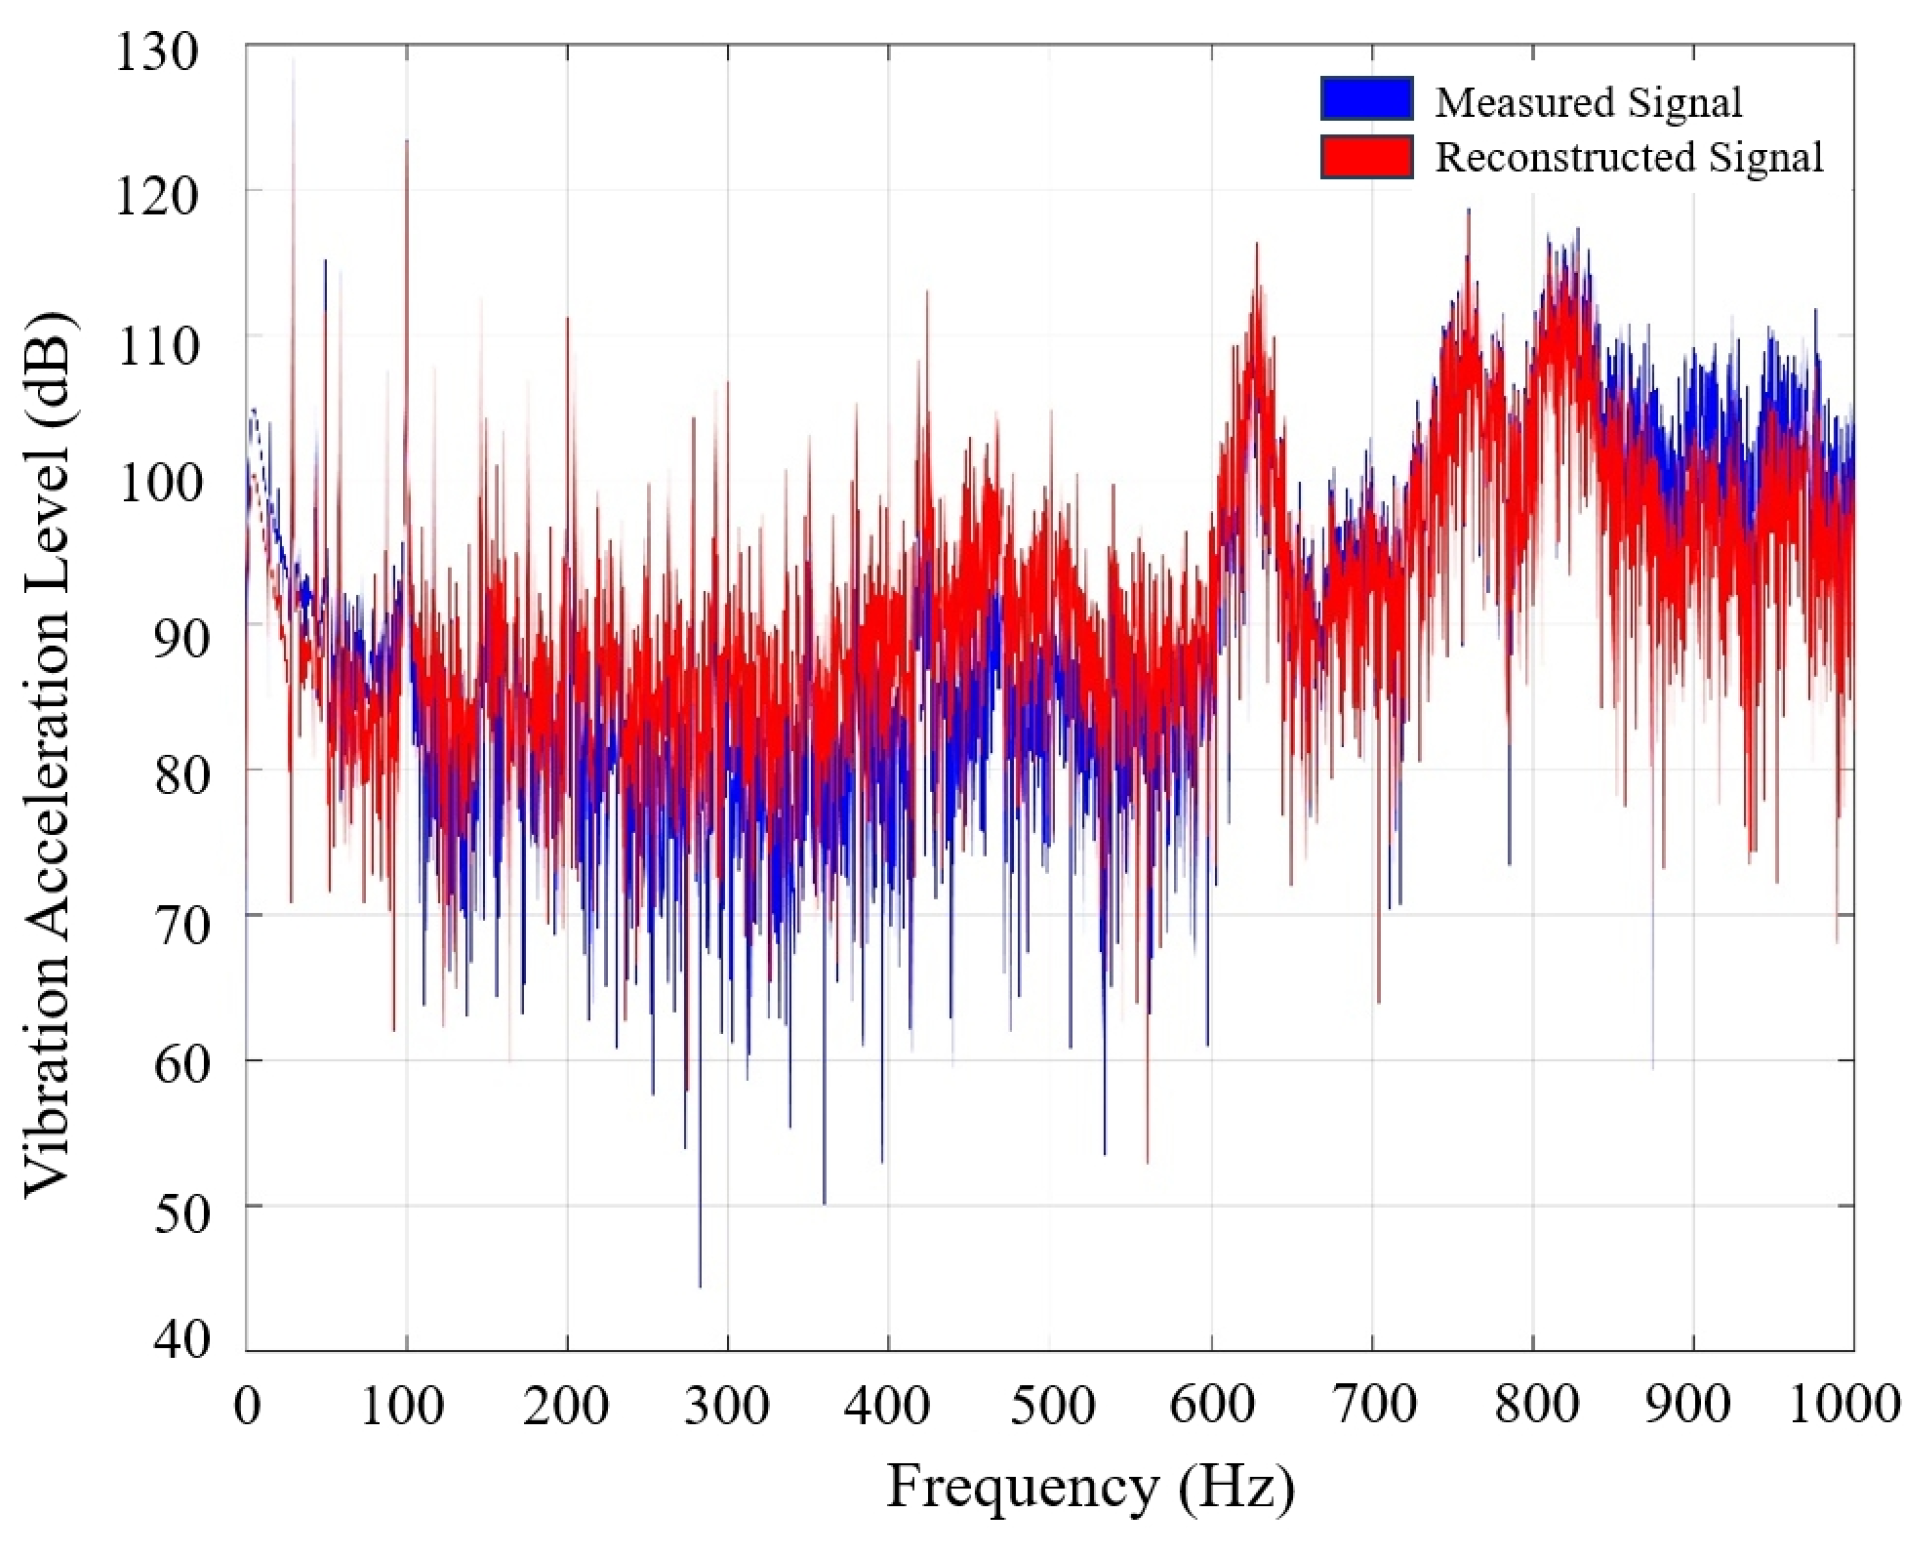
To ensure the reliability of the OTPA analysis results, the effectiveness of the improved OTPA model was validated. This was achieved by comparing the measured vibration signals at the target points on the chassis frame with the signals reconstructed by the model. The results of this comparison are presented in Figure 9.
Figure 9.
Comparison of measured signals and OTPA-reconstructed signals.
Figure 9 shows that the signals reconstructed by the improved OTPA model exhibit good overall agreement with the measured signals, particularly in the dominant vibration frequency ranges. This indicates that the application of SVD combined with the proportional truncation of singular values (with a truncation ratio of 0.4% used in this study) effectively addressed the issue of the ill-conditioned matrix and significantly improved the stability and accuracy of the transfer function estimation. The improved OTPA model is therefore capable of accurately describing the vibration transfer characteristics of the combine harvester chassis frame, which validates its effectiveness for practical applications.
Despite the good fit, minor discrepancies still exist between the signals. These may be attributed, first, to the inherent coupling phenomenon among the multi-source excitation signals, which can lead to incomplete decoupling. Second, they may be due to the presence of uneliminated background noise or interference from other non-primary excitation sources in the actual operating environment. Nevertheless, the model is deemed sufficiently accurate for identifying the dominant vibration sources and transfer paths. This successful validation, showing good agreement between measured and reconstructed signals (Figure 9), is a critical first step, similar to the validation approach used by Lu et al. [55], before proceeding with their source contribution analysis on an electric vehicle.
3.2. Vibration Response Characteristics of the Chassis Frame Target Points
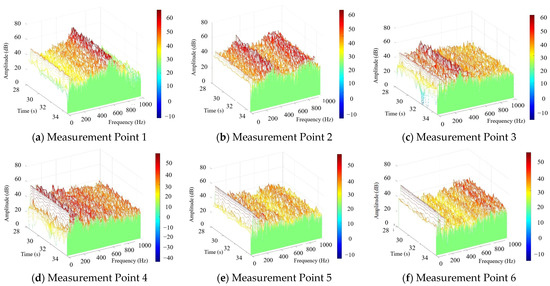
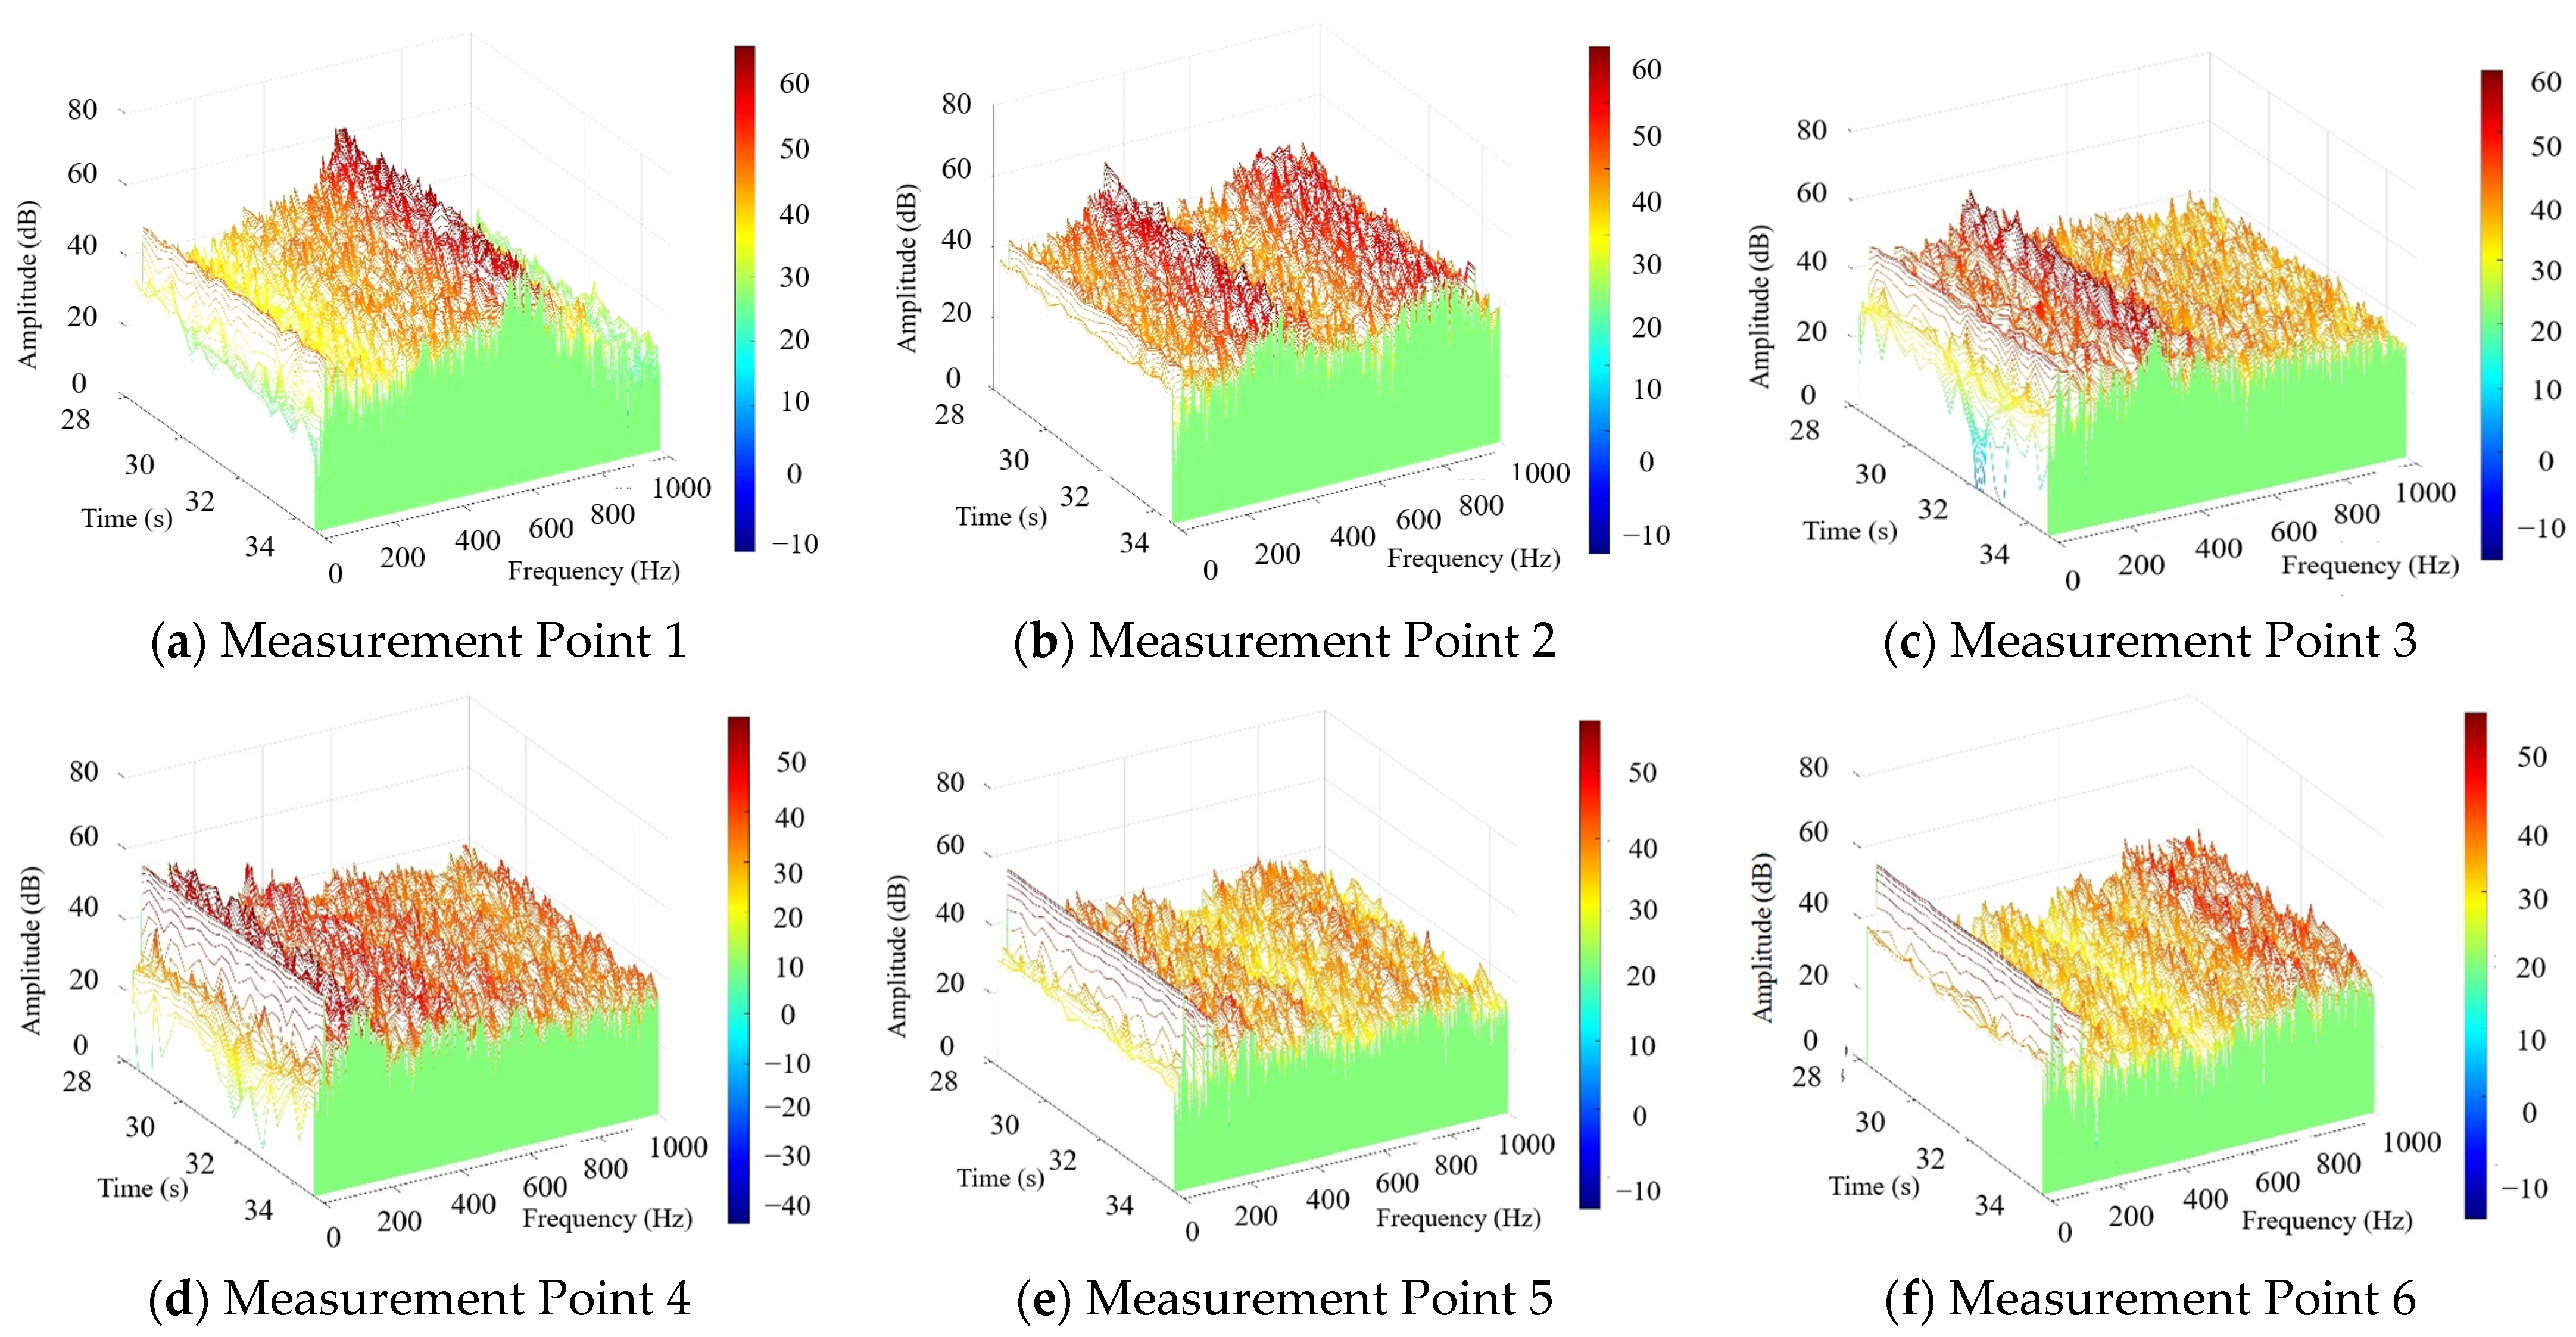
To comprehensively assess the vibration response of the chassis frame under multi-source excitation, the vertical acceleration signals from the six target points on the frame were processed using a Fourier Transform to generate a three-dimensional energy waterfall plot, as presented in Figure 10.
Figure 10.
Three-dimensional energy waterfall plot for the measurement points on the combine harvester chassis frame.
The energy waterfall plot reveals that the vibration energy of the chassis frame is predominantly concentrated in two frequency bands: 0–200 Hz and 600–800 Hz. Although the primary operational vibrations of the harvester are typically in the low-frequency range, the energy concentration in the higher frequency band (600–800 Hz) could be attributed to high-frequency excitation components, such as noise from bearings or gears, or to higher-order modal vibrations of the frame itself.
Further analysis reveals that while the waterfall plots for the left-side and corresponding right-side measurement points share similar features, the energy peaks are more pronounced on the left side. This asymmetry is likely due to the installation of major excitation sources, such as the engine and threshing unit, primarily on the left side of the frame, which subjects that side to greater excitation and results in a stronger vibration response.
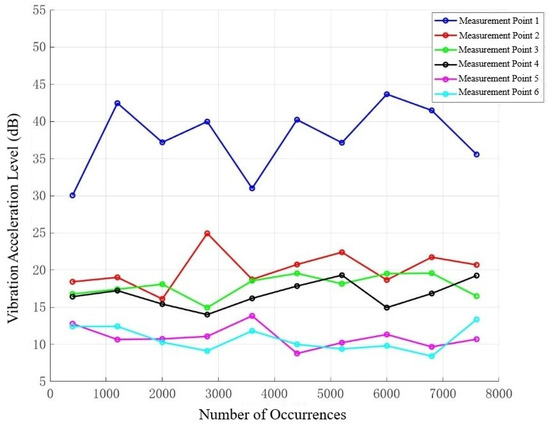
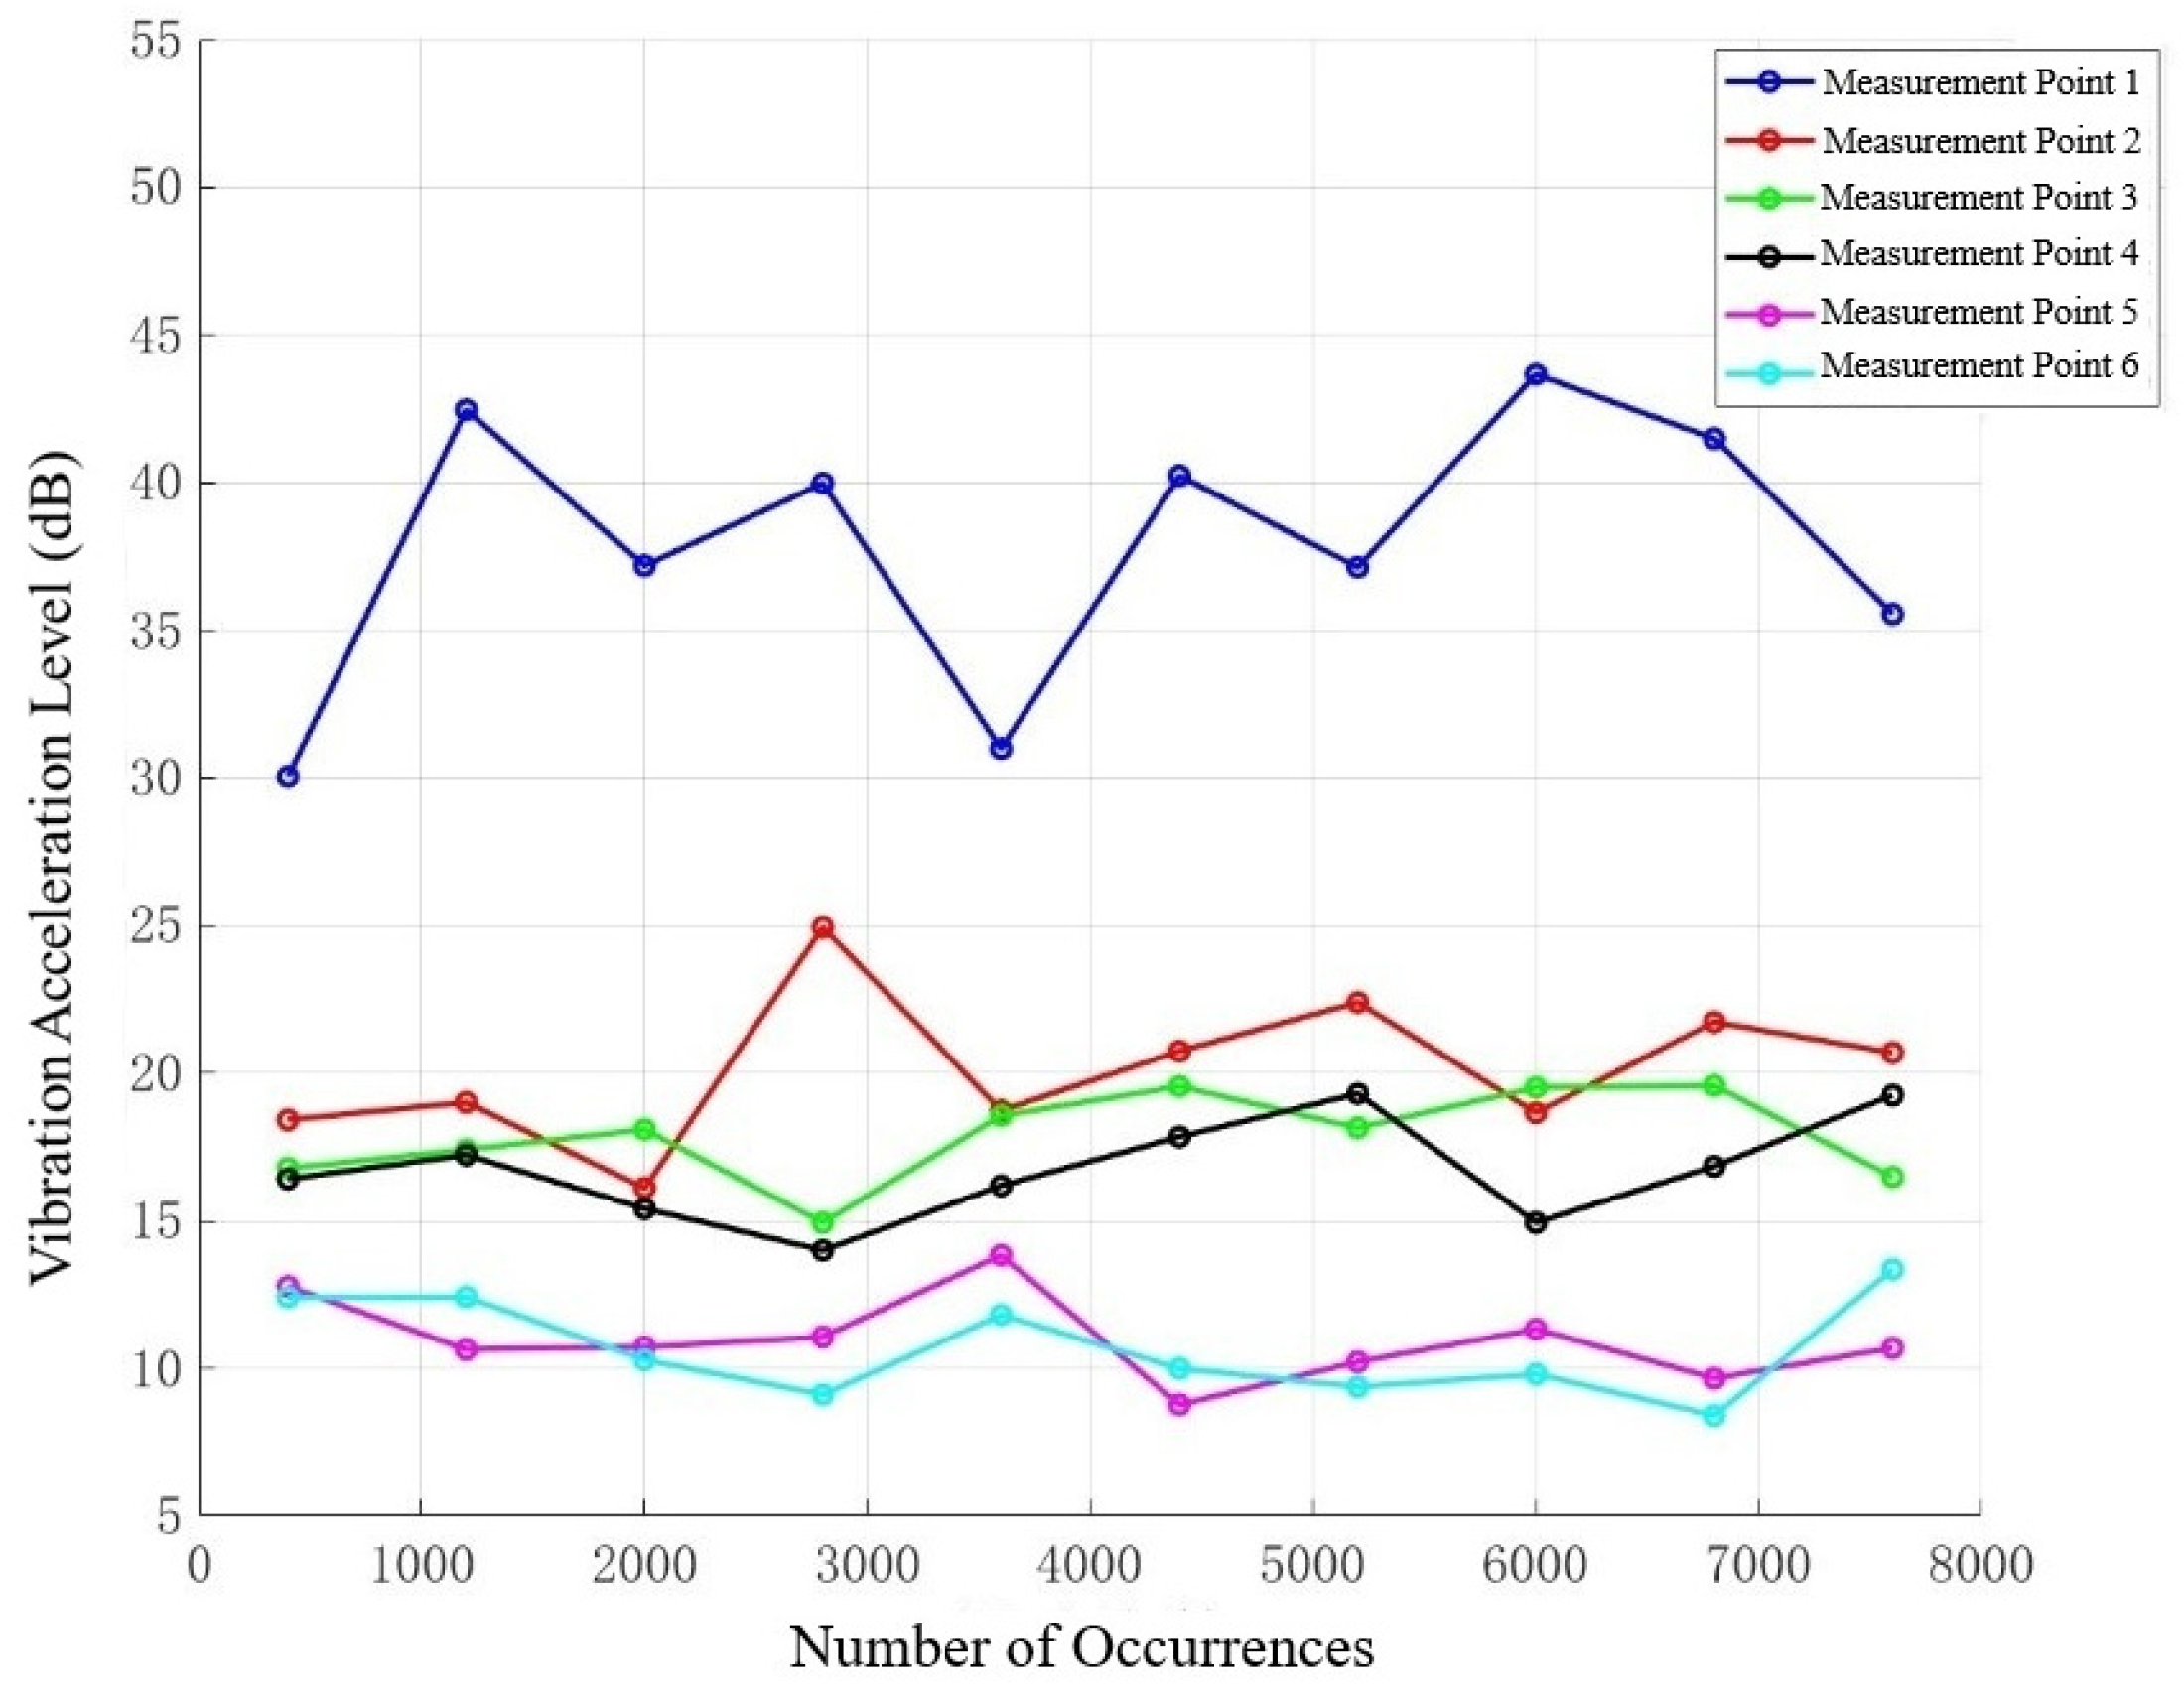
To quantify the vibration levels at each measurement point, the maximum vibration amplitude at each point was plotted against the number of occurrences, as shown in the statistical distribution of maximum vibration amplitudes for the chassis frame measurement points in Figure 11.
Figure 11.
Amplitude–frequency distribution curves of vertical vibration at each measurement point on the chassis frame.
Figure 11 reveals that the vertical acceleration level at measurement point 1, located beneath the cutting header, is significantly higher than at the other points. Concurrently, the vertical acceleration levels on the left-side measurement points are markedly greater than those on the right side. This is because the main excitation components of the combine harvester are predominantly installed on the left side, a finding that aligns with the machine’s actual operational behavior.
3.3. Excitation Source Contribution Analysis and Critical Transfer Path Identification
3.3.1. Analysis of Vibration Contributions from Excitation Sources to the Chassis Frame
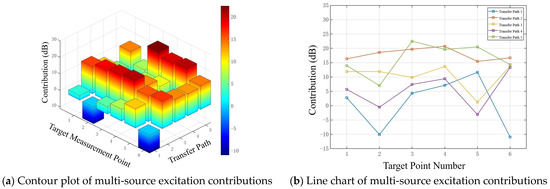
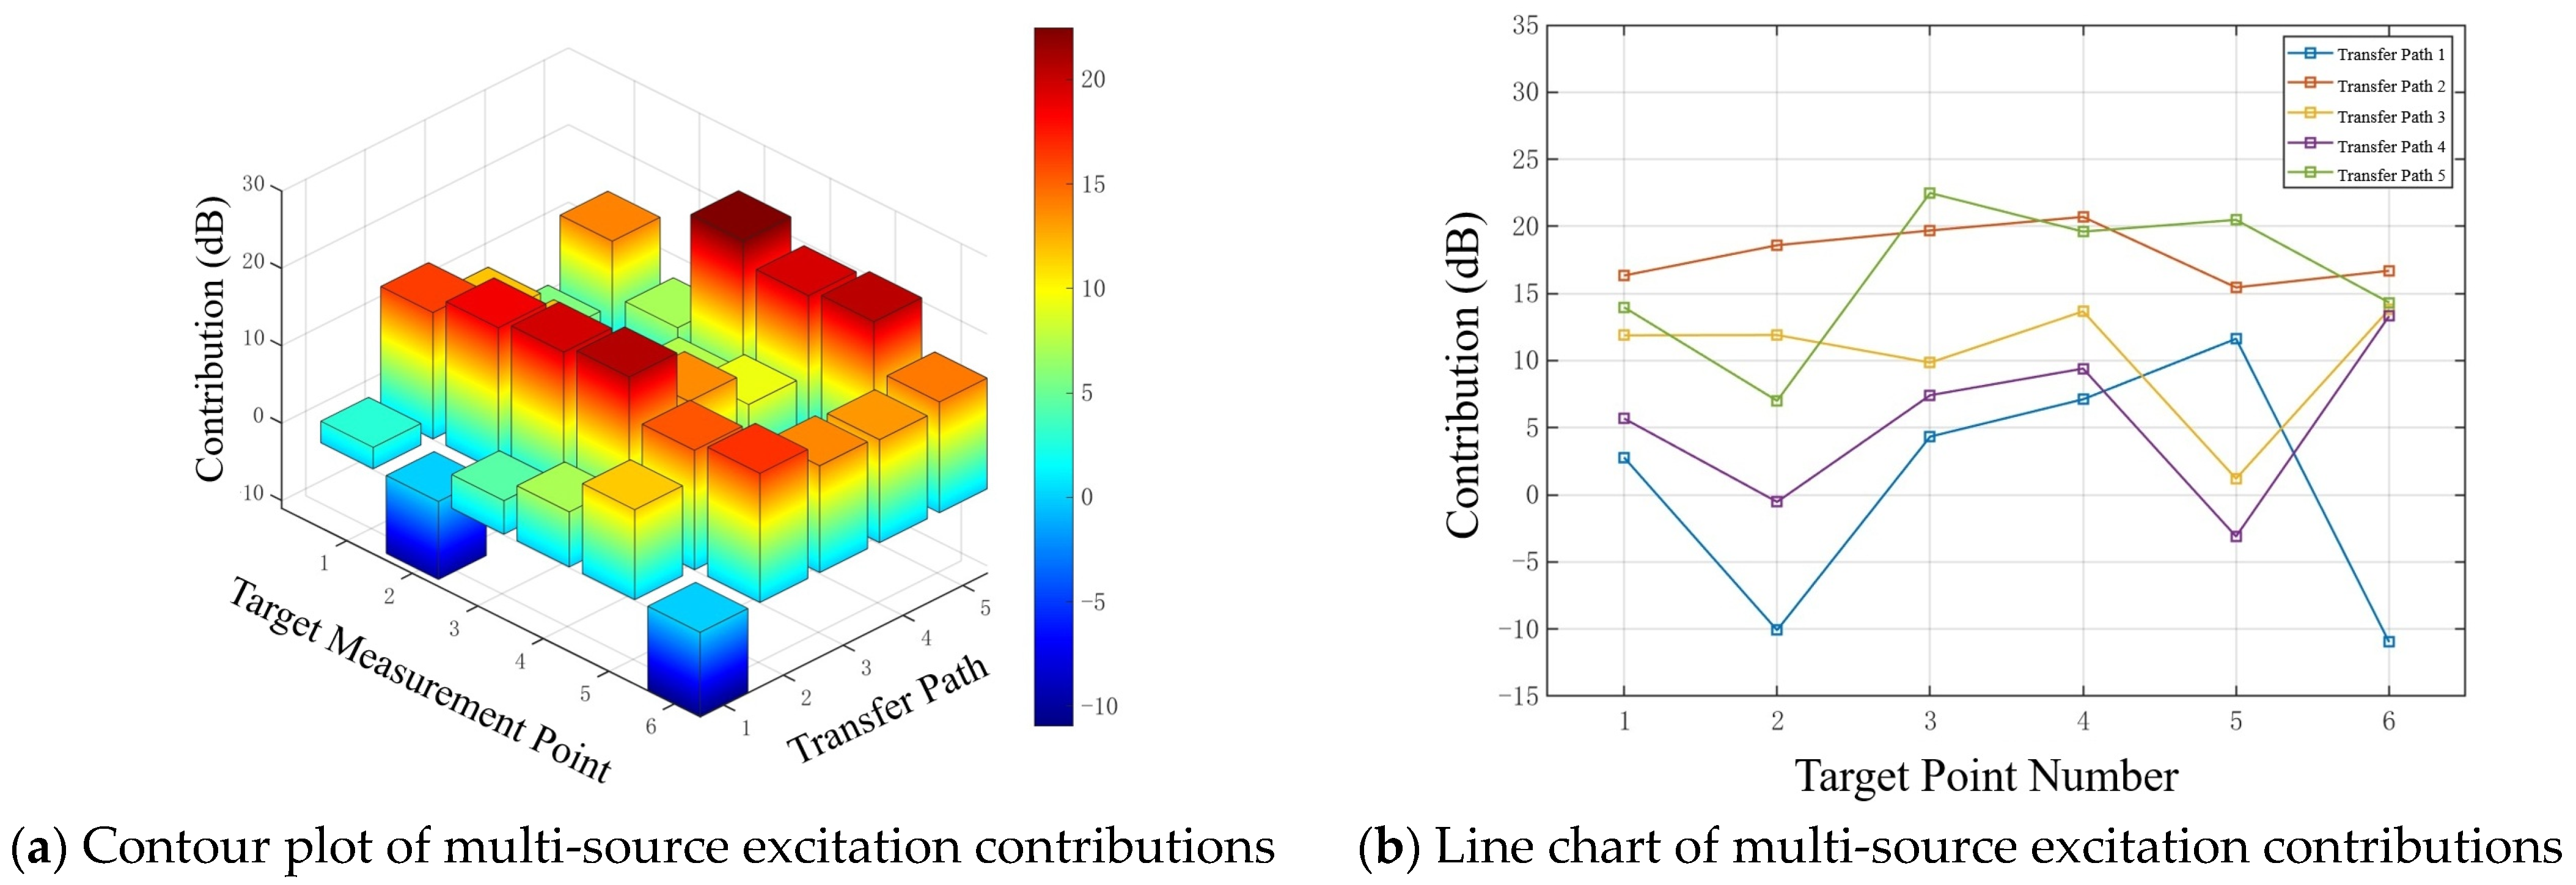
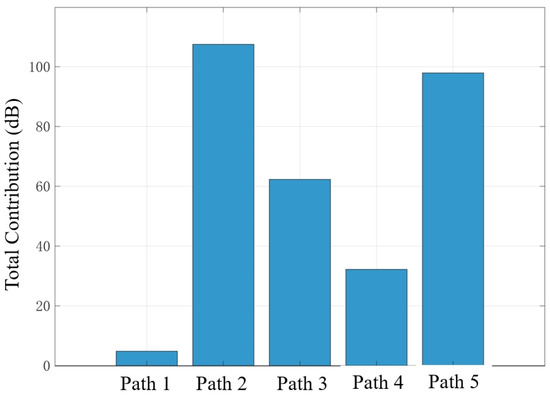
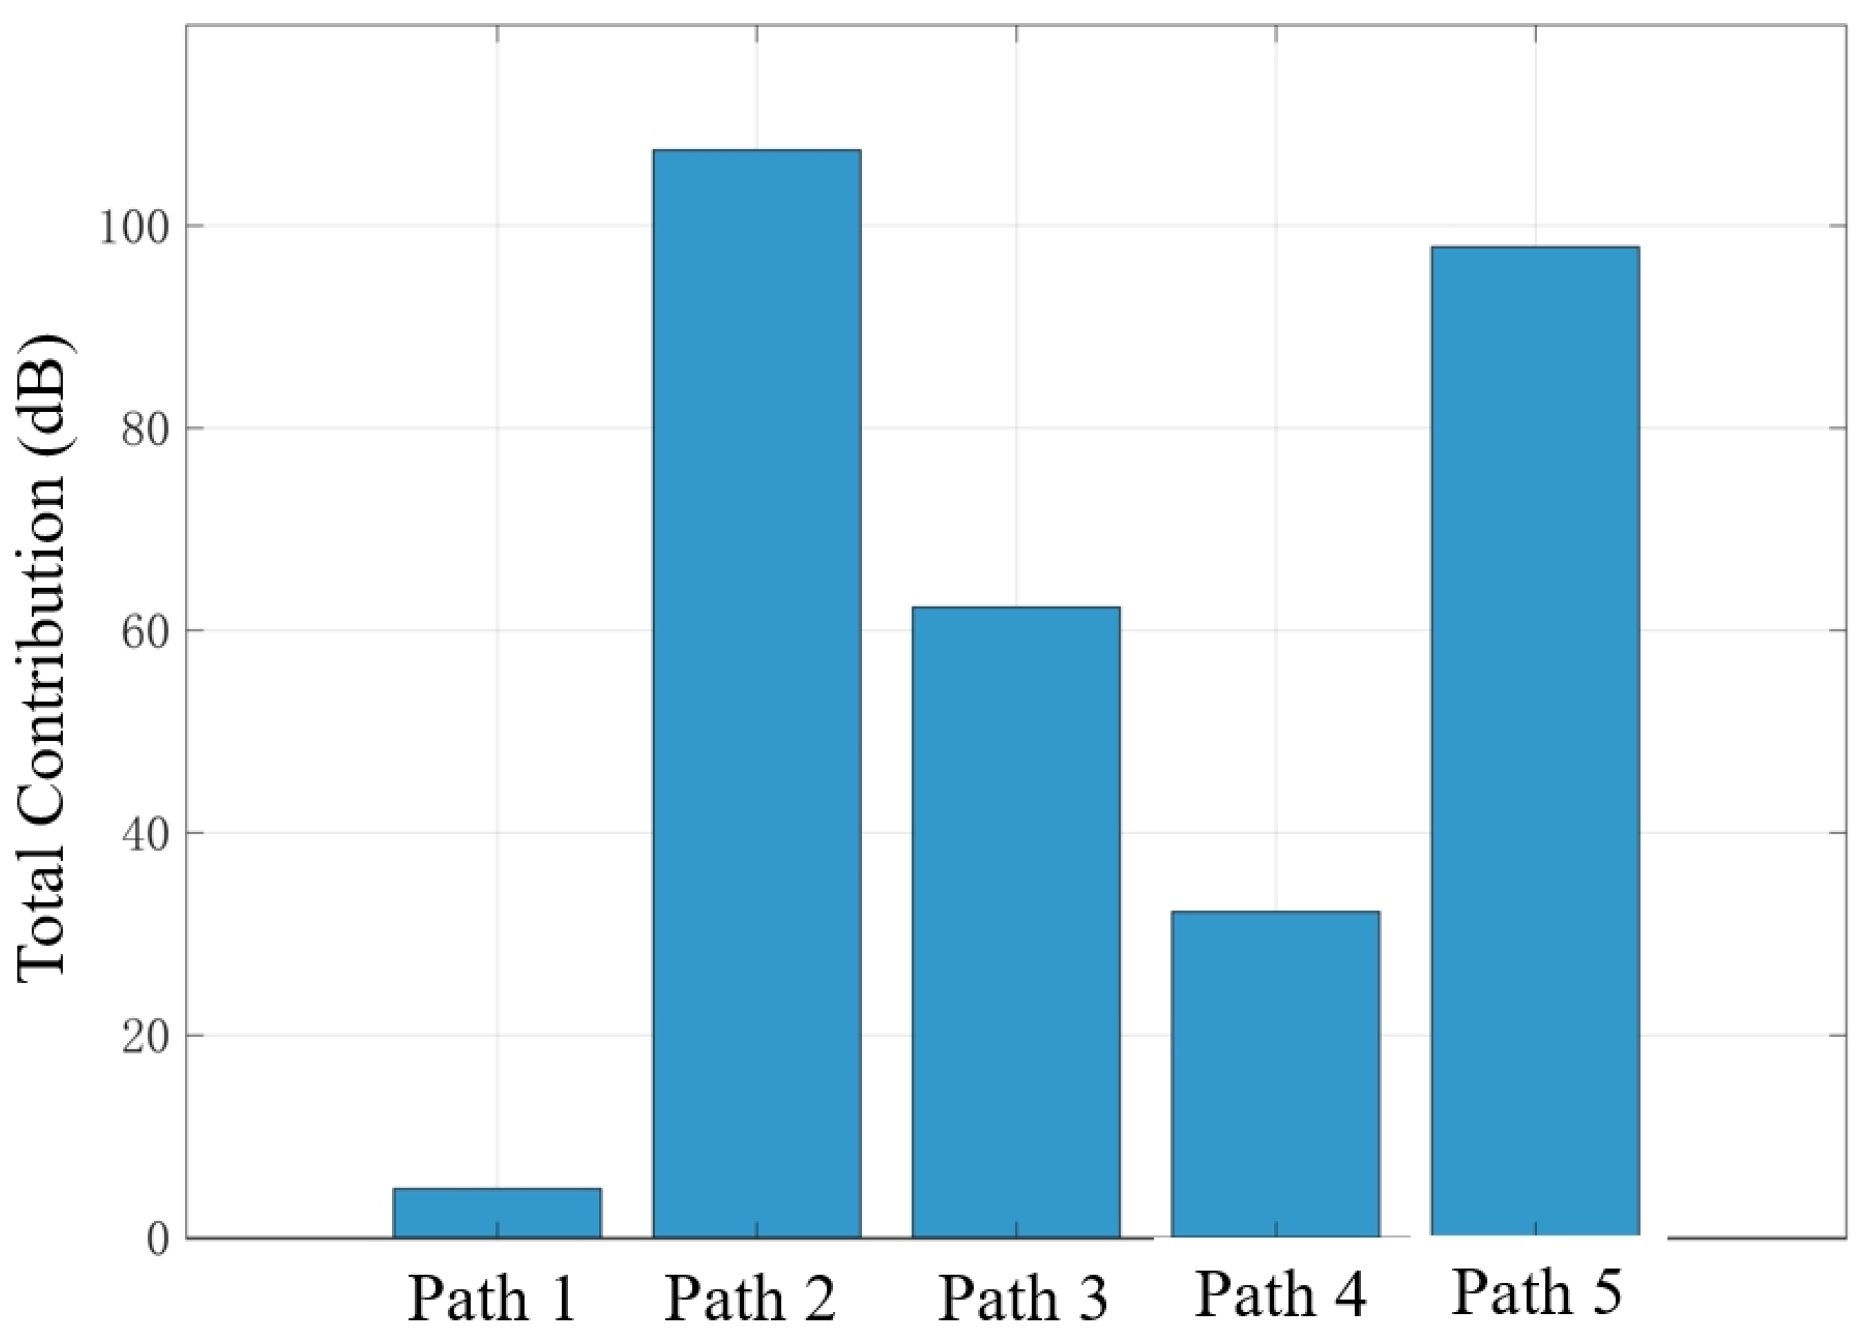
To determine the contributions of the multiple excitation sources to the chassis frame, the vertical accelerations from the conveyor trough–threshing frame connection point, the hydraulic cylinder–chassis frame articulation point, the threshing cylinder, the vibrating screen, and the engine were imported into MATLAB R2023b for analysis. Under conditions where all excitation components of the combine harvester were operating stably, the improved OTPA method was used to calculate the contributions of the cutting header, threshing cylinder, vibrating screen, and engine to each measurement point on the chassis frame via the five defined transfer paths. The results are presented in Figure 12. The total contribution of each transfer path to the vertical vibration of the chassis frame is shown in Figure 13.
Figure 12.
Contribution of each excitation source to the vertical vibration of the chassis frame.
Figure 13.
Total contribution values from each excitation source.
The results show that transfer path 2 (cutting header → conveyor trough → hydraulic cylinder → chassis frame) has the largest total contribution to the vertical vibration of the chassis frame, reaching a vibration acceleration level of 117.6 dB. This finding, identifying the cutting header assembly as a primary contributor transmitted through a rigid hydraulic connection, is highly significant. It aligns with the general understanding that major working components are primary vibration sources. For instance, Wang et al. [45], in their study on a similar combine harvester, also identified the engine and threshing system as major sources of vibration. Our work provides a more granular insight by quantifying the specific path through the hydraulic cylinder as the most critical one, which contributes more than other paths. This suggests that while the engine is an inherent source, the structural design of the cutting header’s mounting system plays a dominant role in amplifying and transmitting vibrations to the chassis. The second largest contributor is transfer path 5 (engine → chassis frame), with a total contribution of 98.2 dB. As the core power source of the machine, the engine is an inherent and major source of vibration due to combustion impacts and the imbalance of rotating components. Although installed with vibration isolation mounts, its vibration energy remains a significant factor influencing the frame’s vibration. In contrast, path 1 (cutting header → conveyor trough → threshing frame → chassis frame) has the smallest total contribution, at only 4.8 dB. This is likely because the path is relatively long and involves multiple component connections, leading to significant attenuation of vibration energy through structural damping and dissipation at connection interfaces during transmission.
3.3.2. Analysis of Vibration Transmission to a Single Target Point on the Chassis Frame
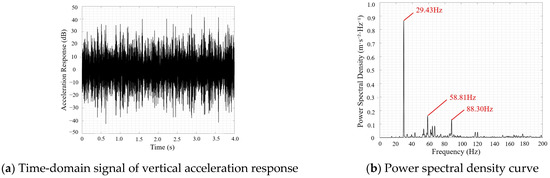
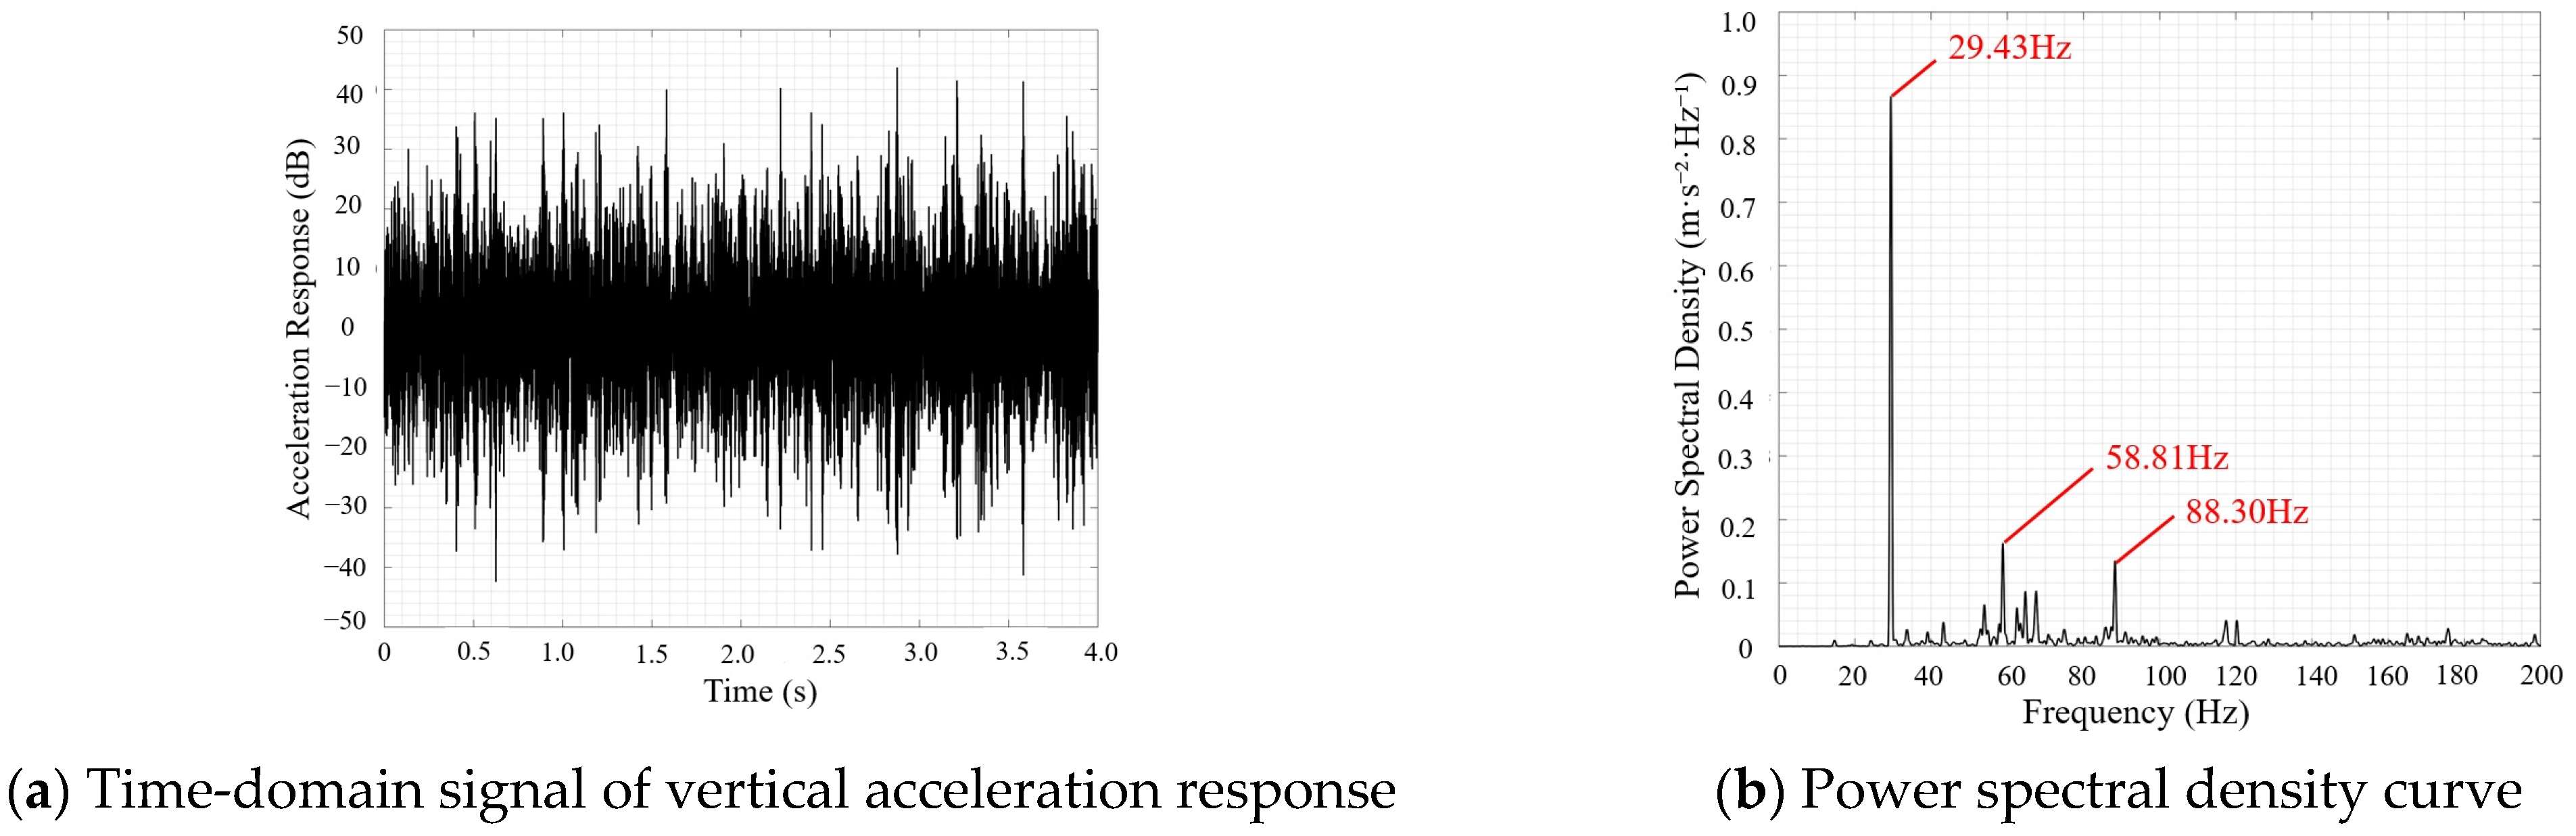
The preceding analysis indicates that the vertical vibration is most intense at the articulation point between the lifting hydraulic cylinder of the cantilevered conveyor trough and the chassis frame (measurement point 1). This location is also near the combine harvester’s operator cabin, making it a critical area for vibration improvement. Therefore, a detailed single-point contribution analysis of this location is essential. In this study, measurement point 1 was selected as a representative case for a detailed analysis of its vibration spectrum characteristics in the vertical (X), longitudinal (Y), and lateral (Z) directions. The vertical acceleration response and power spectral density (PSD) curve for measurement point 1 are plotted in Figure 14.
Figure 14.
Vertical acceleration response and power spectral density curve for measurement point 1.
To provide a quantitative assessment of the overall vibration intensity at measurement point 1, the root mean square (RMS) values of the triaxial accelerations at this point were first calculated under different operating conditions. The results are presented in Table 4.
Table 4.
Vibration data for the chassis frame (measurement point 1).
As shown in Table 4, the vibration intensity at measurement point 1 varies significantly under different operating conditions. In Condition 1 (engine-only operation), the RMS value in the X-direction (vertical) is the highest at 6.20 dB, which is substantially greater than in the Y-direction (longitudinal, 1.97 dB) and the Z-direction (lateral, 1.30 dB). This indicates that even with only the engine running, vertical vibration is already the primary component of the chassis frame. When the threshing cylinder and vibrating screen are engaged (Condition 2), the RMS values in all directions increase markedly. The X-direction RMS value climbs to 10.76 dB, the Y-direction value increases to 3.50 dB, and the Z-direction value rises to 1.75 dB. This demonstrates that the excitation introduced by the threshing and cleaning system has a cumulative effect on the chassis frame’s vibration, with the most significant impact on vertical vibration. In Condition 3 (all components operating simultaneously), the RMS values in all directions show a further slight increase, and the overall weighted value at measurement point 1 reaches its maximum (7.06 dB). This clearly illustrates that as additional working components like the cutting header are progressively engaged, the cumulative effect of the various excitation sources leads to a continuous intensification of the chassis frame’s vibration, with the vertical direction consistently remaining the dominant mode of vibration at measurement point 1.
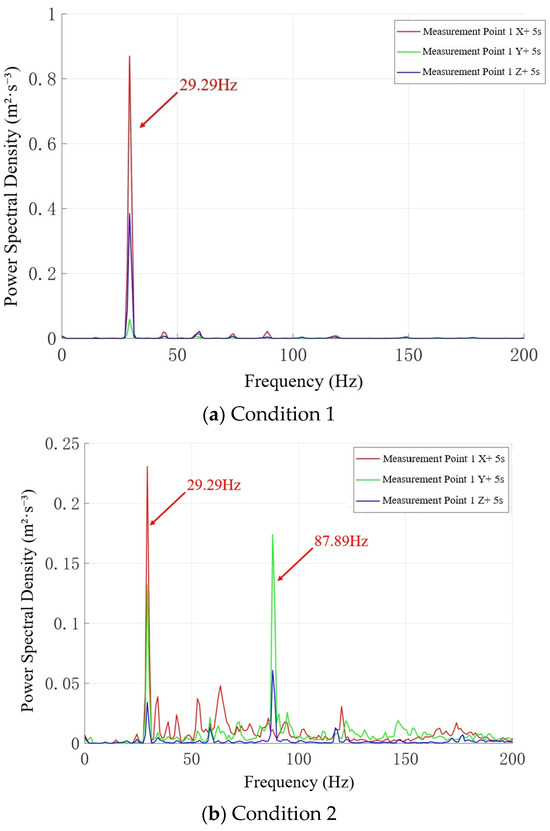
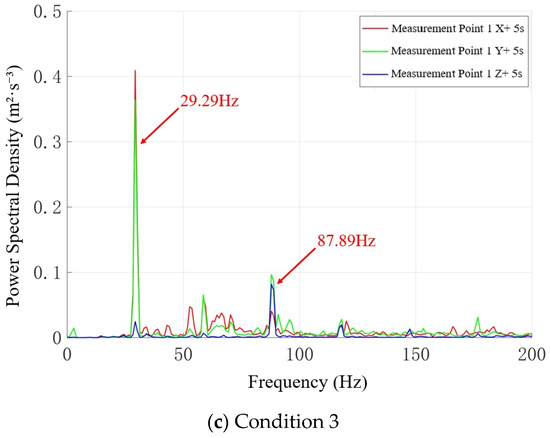
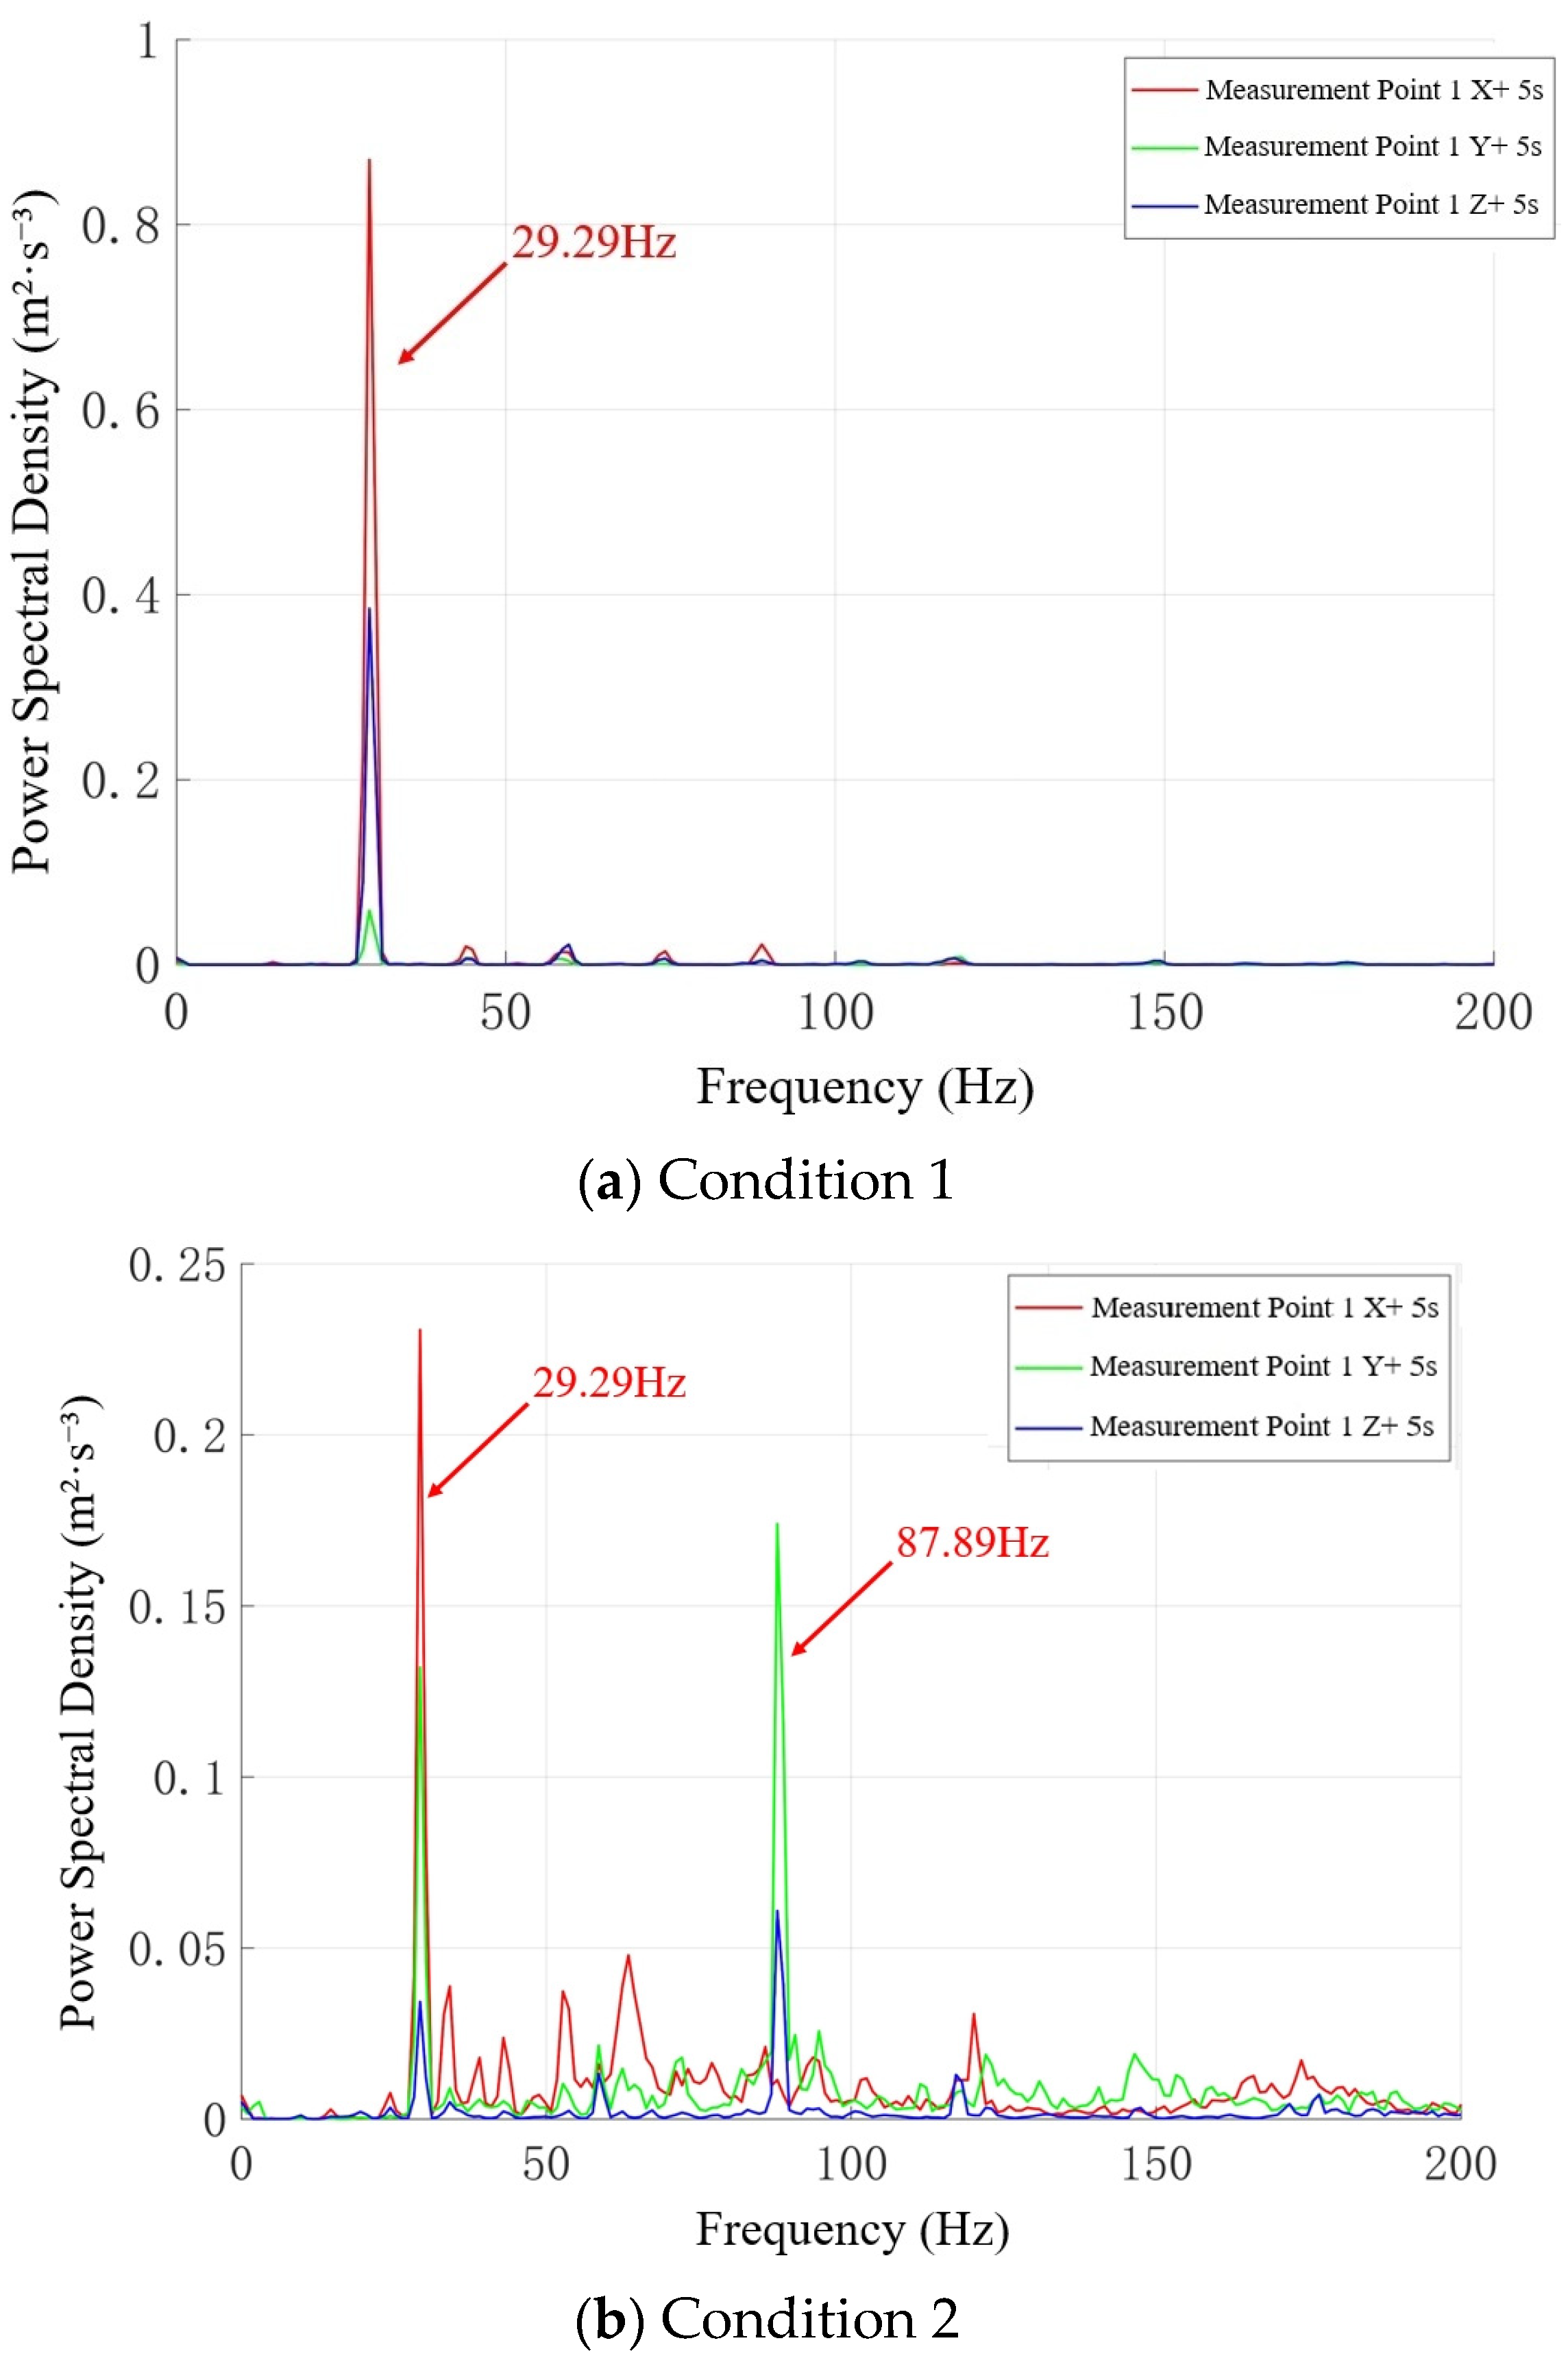
The power spectral density (PSD) curves for the triaxial acceleration at measurement point 1 under different operating conditions are shown in Figure 15. In Condition 1 (engine-only operation), the primary PSD peak for chassis frame measurement point 1 is concentrated at 29.29 Hz. The amplitude is largest in the X-direction (vertical), followed by the Y-direction (longitudinal), and is smallest in the Z-direction (lateral). When the threshing cylinder and vibrating screen are engaged (Condition 2), the peak at 29.29 Hz remains, and a new significant peak appears at 87.89 Hz. This new peak has a larger amplitude in the Y-direction (longitudinal), followed by the X-direction, and is smallest in the Z-direction. This indicates that the engagement of the threshing and cleaning system introduces new excitation components and generates a new resonance response with the frame system. In Condition 3 (all components operating simultaneously), a vibration response similar to that of Condition 2 is observed. The PSD peak frequency of 29.29 Hz observed in all three conditions corresponds to the engine’s excitation frequency under idle conditions, and the direction of the maximum PSD aligns with the direction of the engine’s excitation.
Figure 15.
Power spectral density curves of triaxial acceleration at measurement point 1.
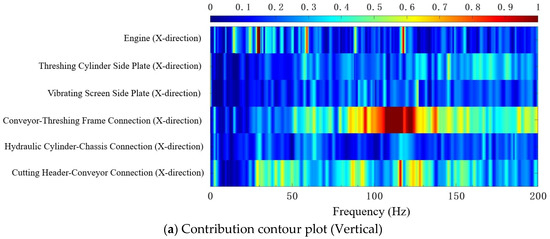
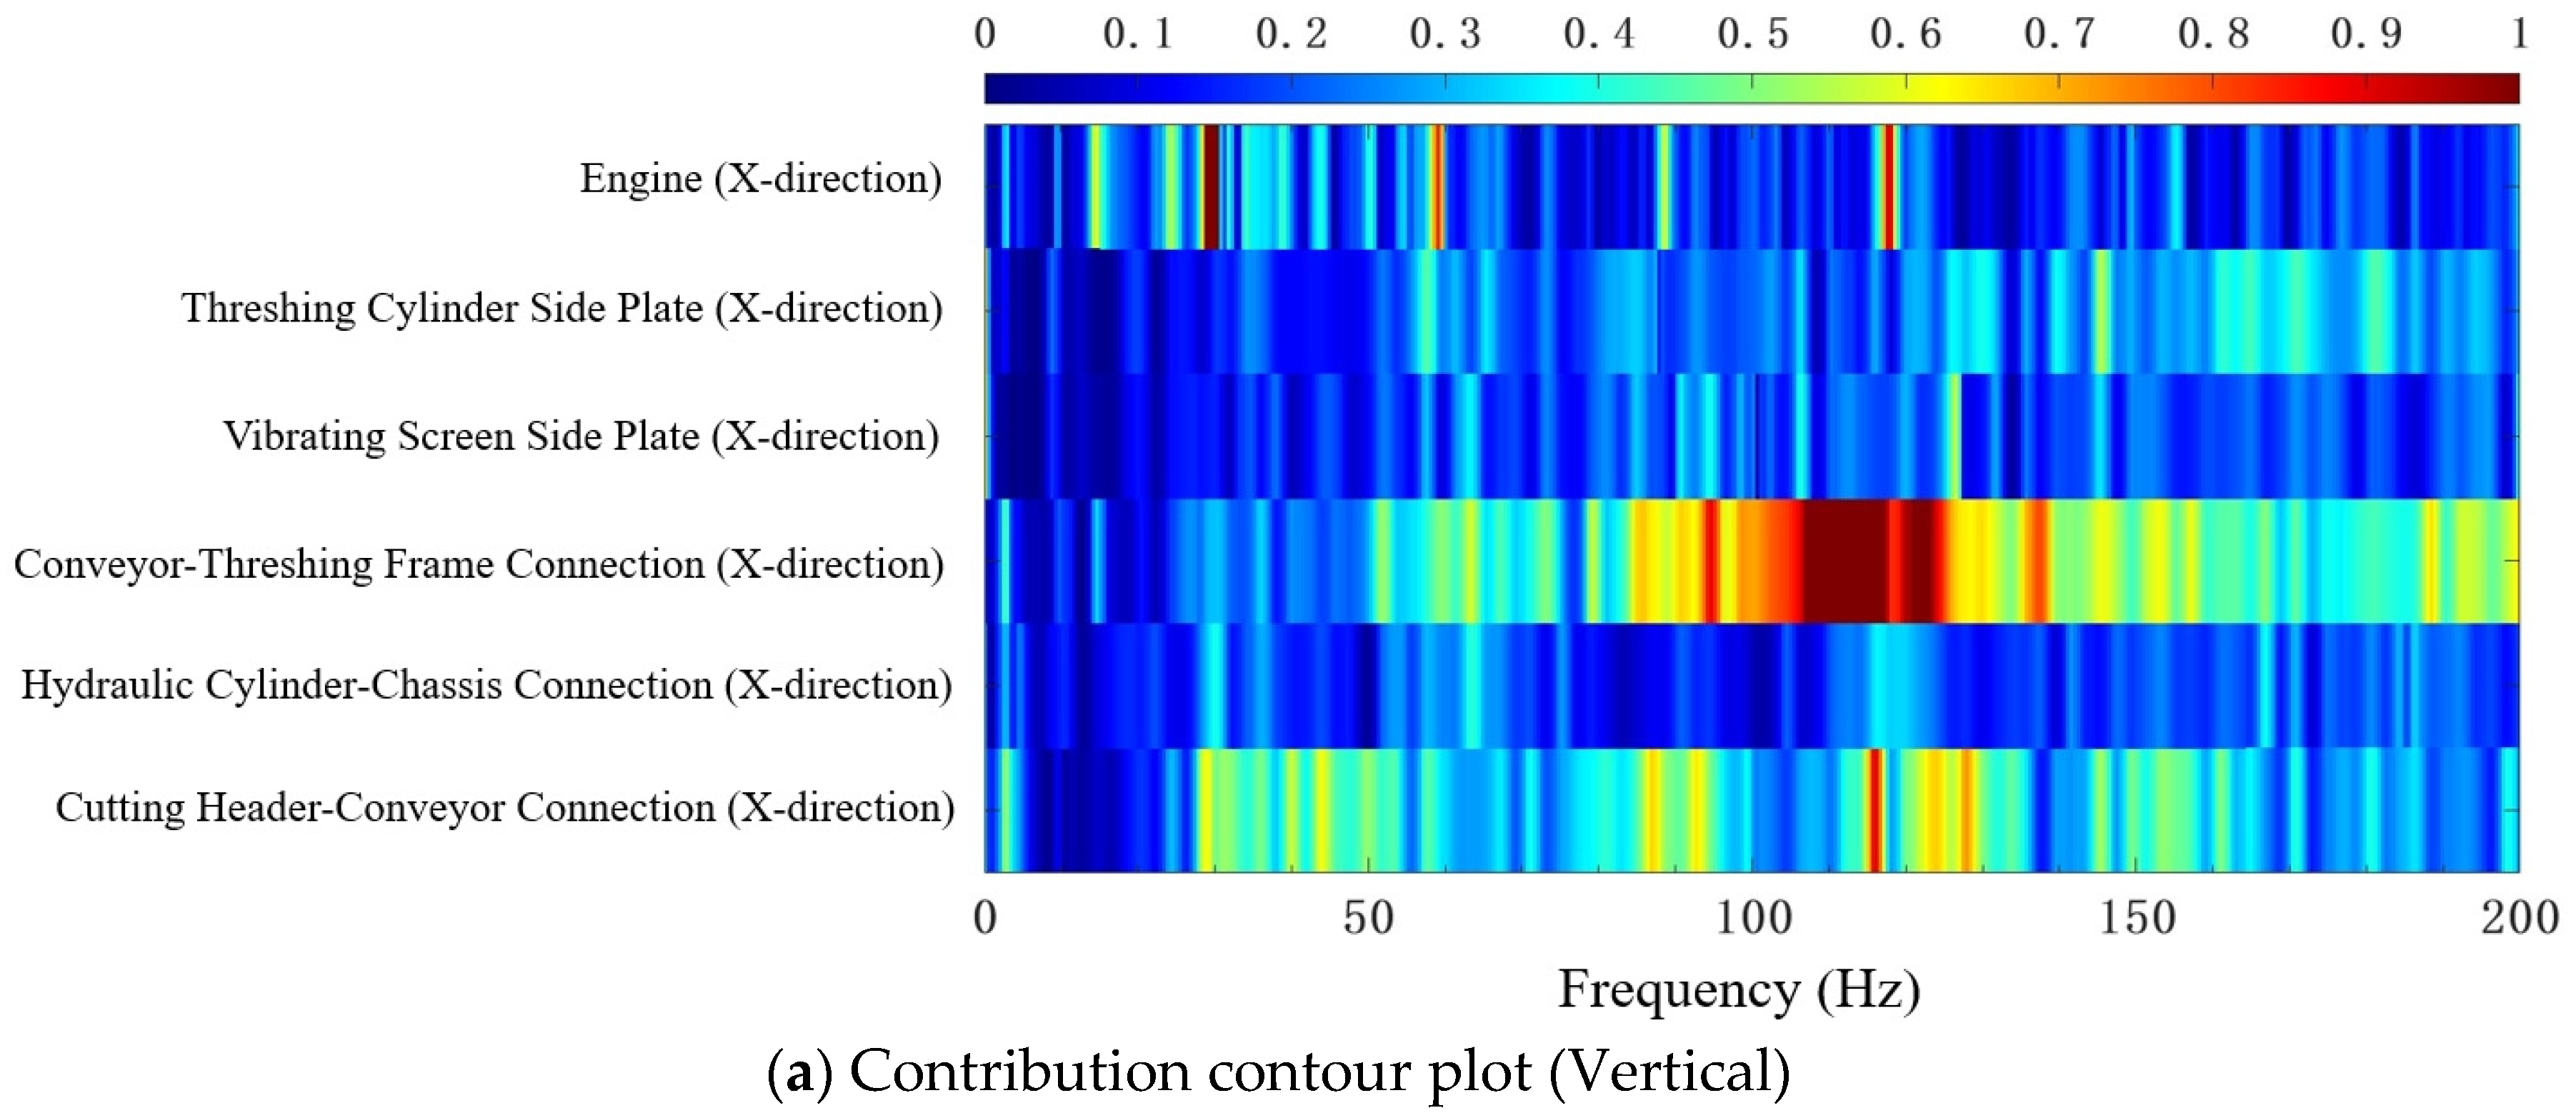
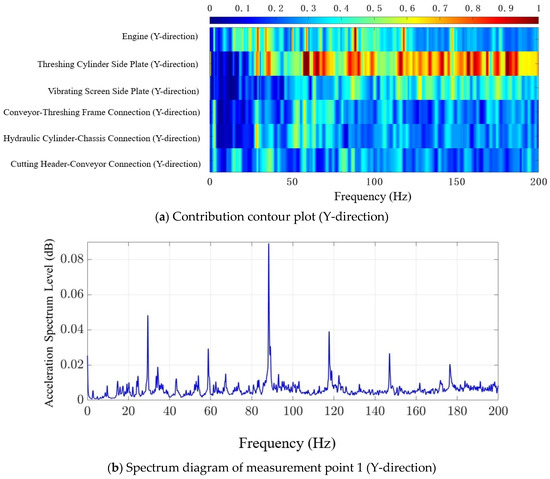
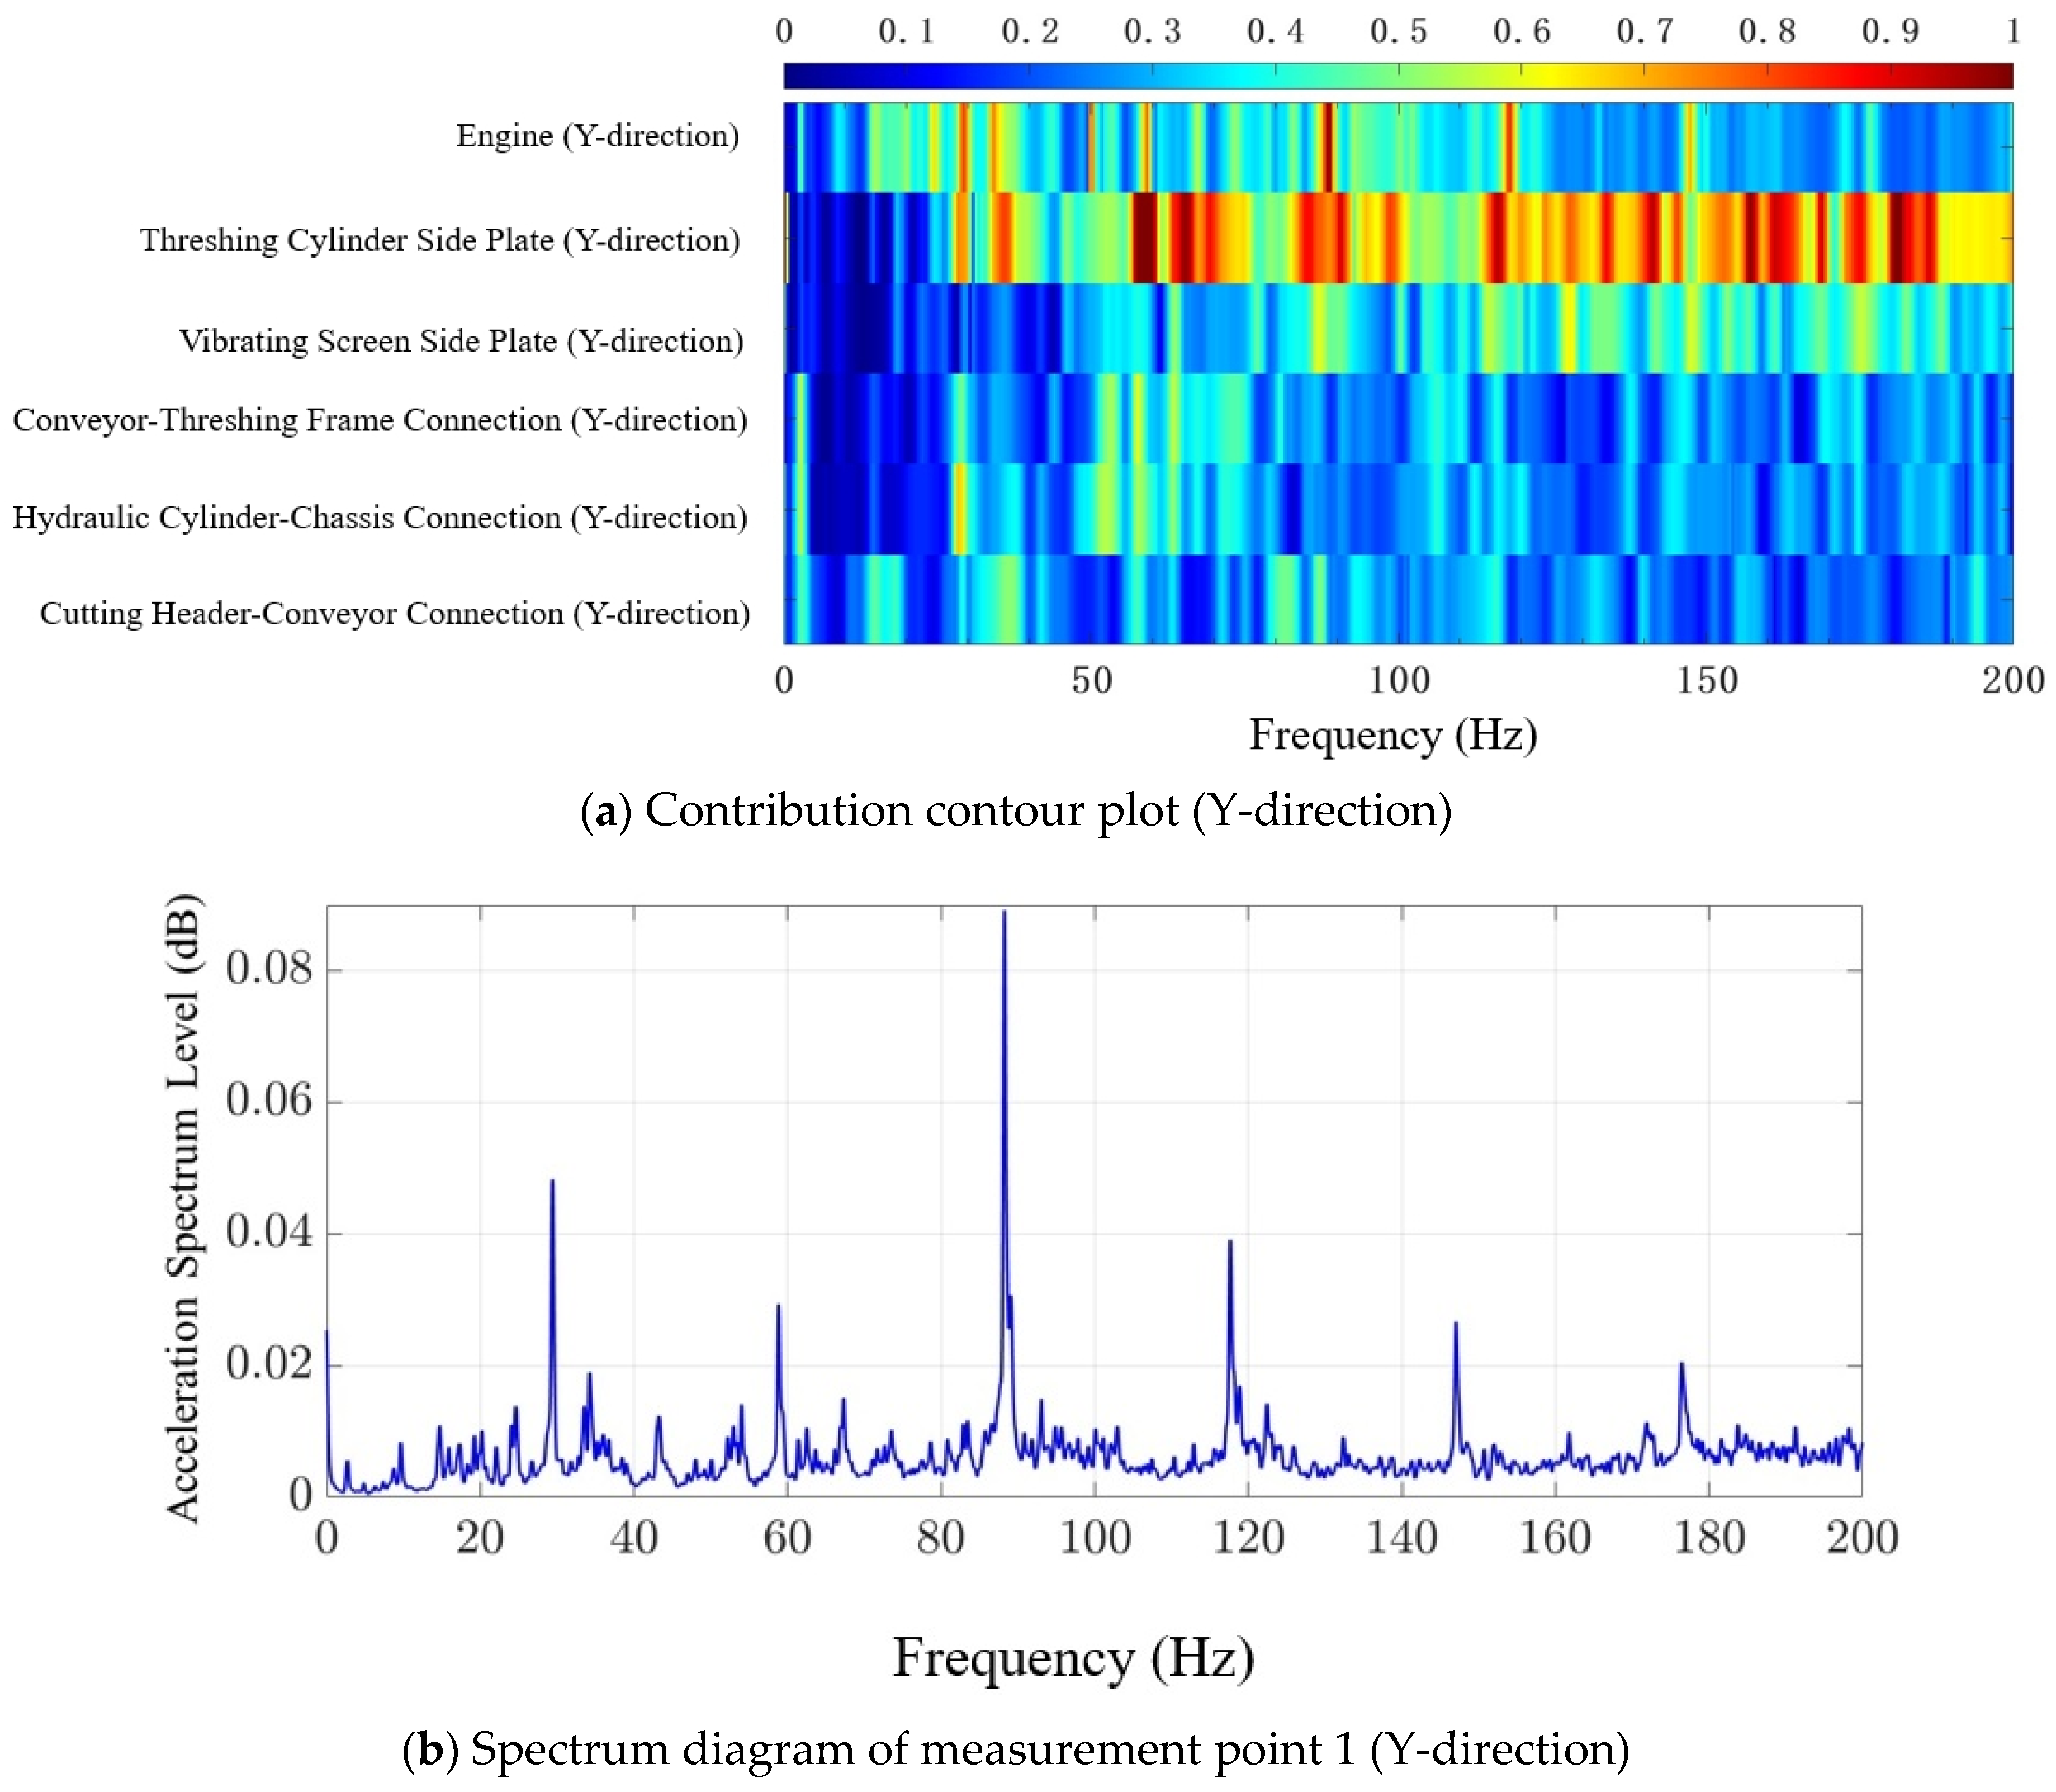
To more intuitively analyze the influence of each excitation source on the vibration at chassis frame measurement point 1, this study utilized the improved OTPA method to create contribution contour plots for the lateral, longitudinal, and vertical directions at this point. These plots, in conjunction with the corresponding spectrum diagrams for the three directions, were used as a reference to identify the primary excitation components and their main transfer paths, thereby analyzing the sources of excitation for measurement point 1 in the X, Y, and Z directions.
- (1)
- Vertical Vibration (X-direction):
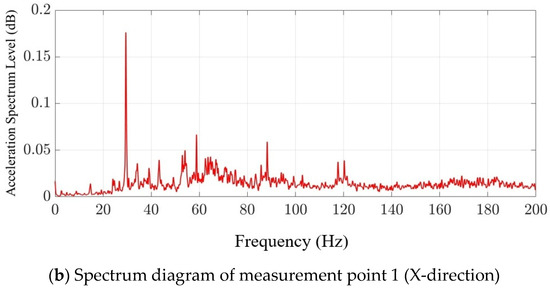
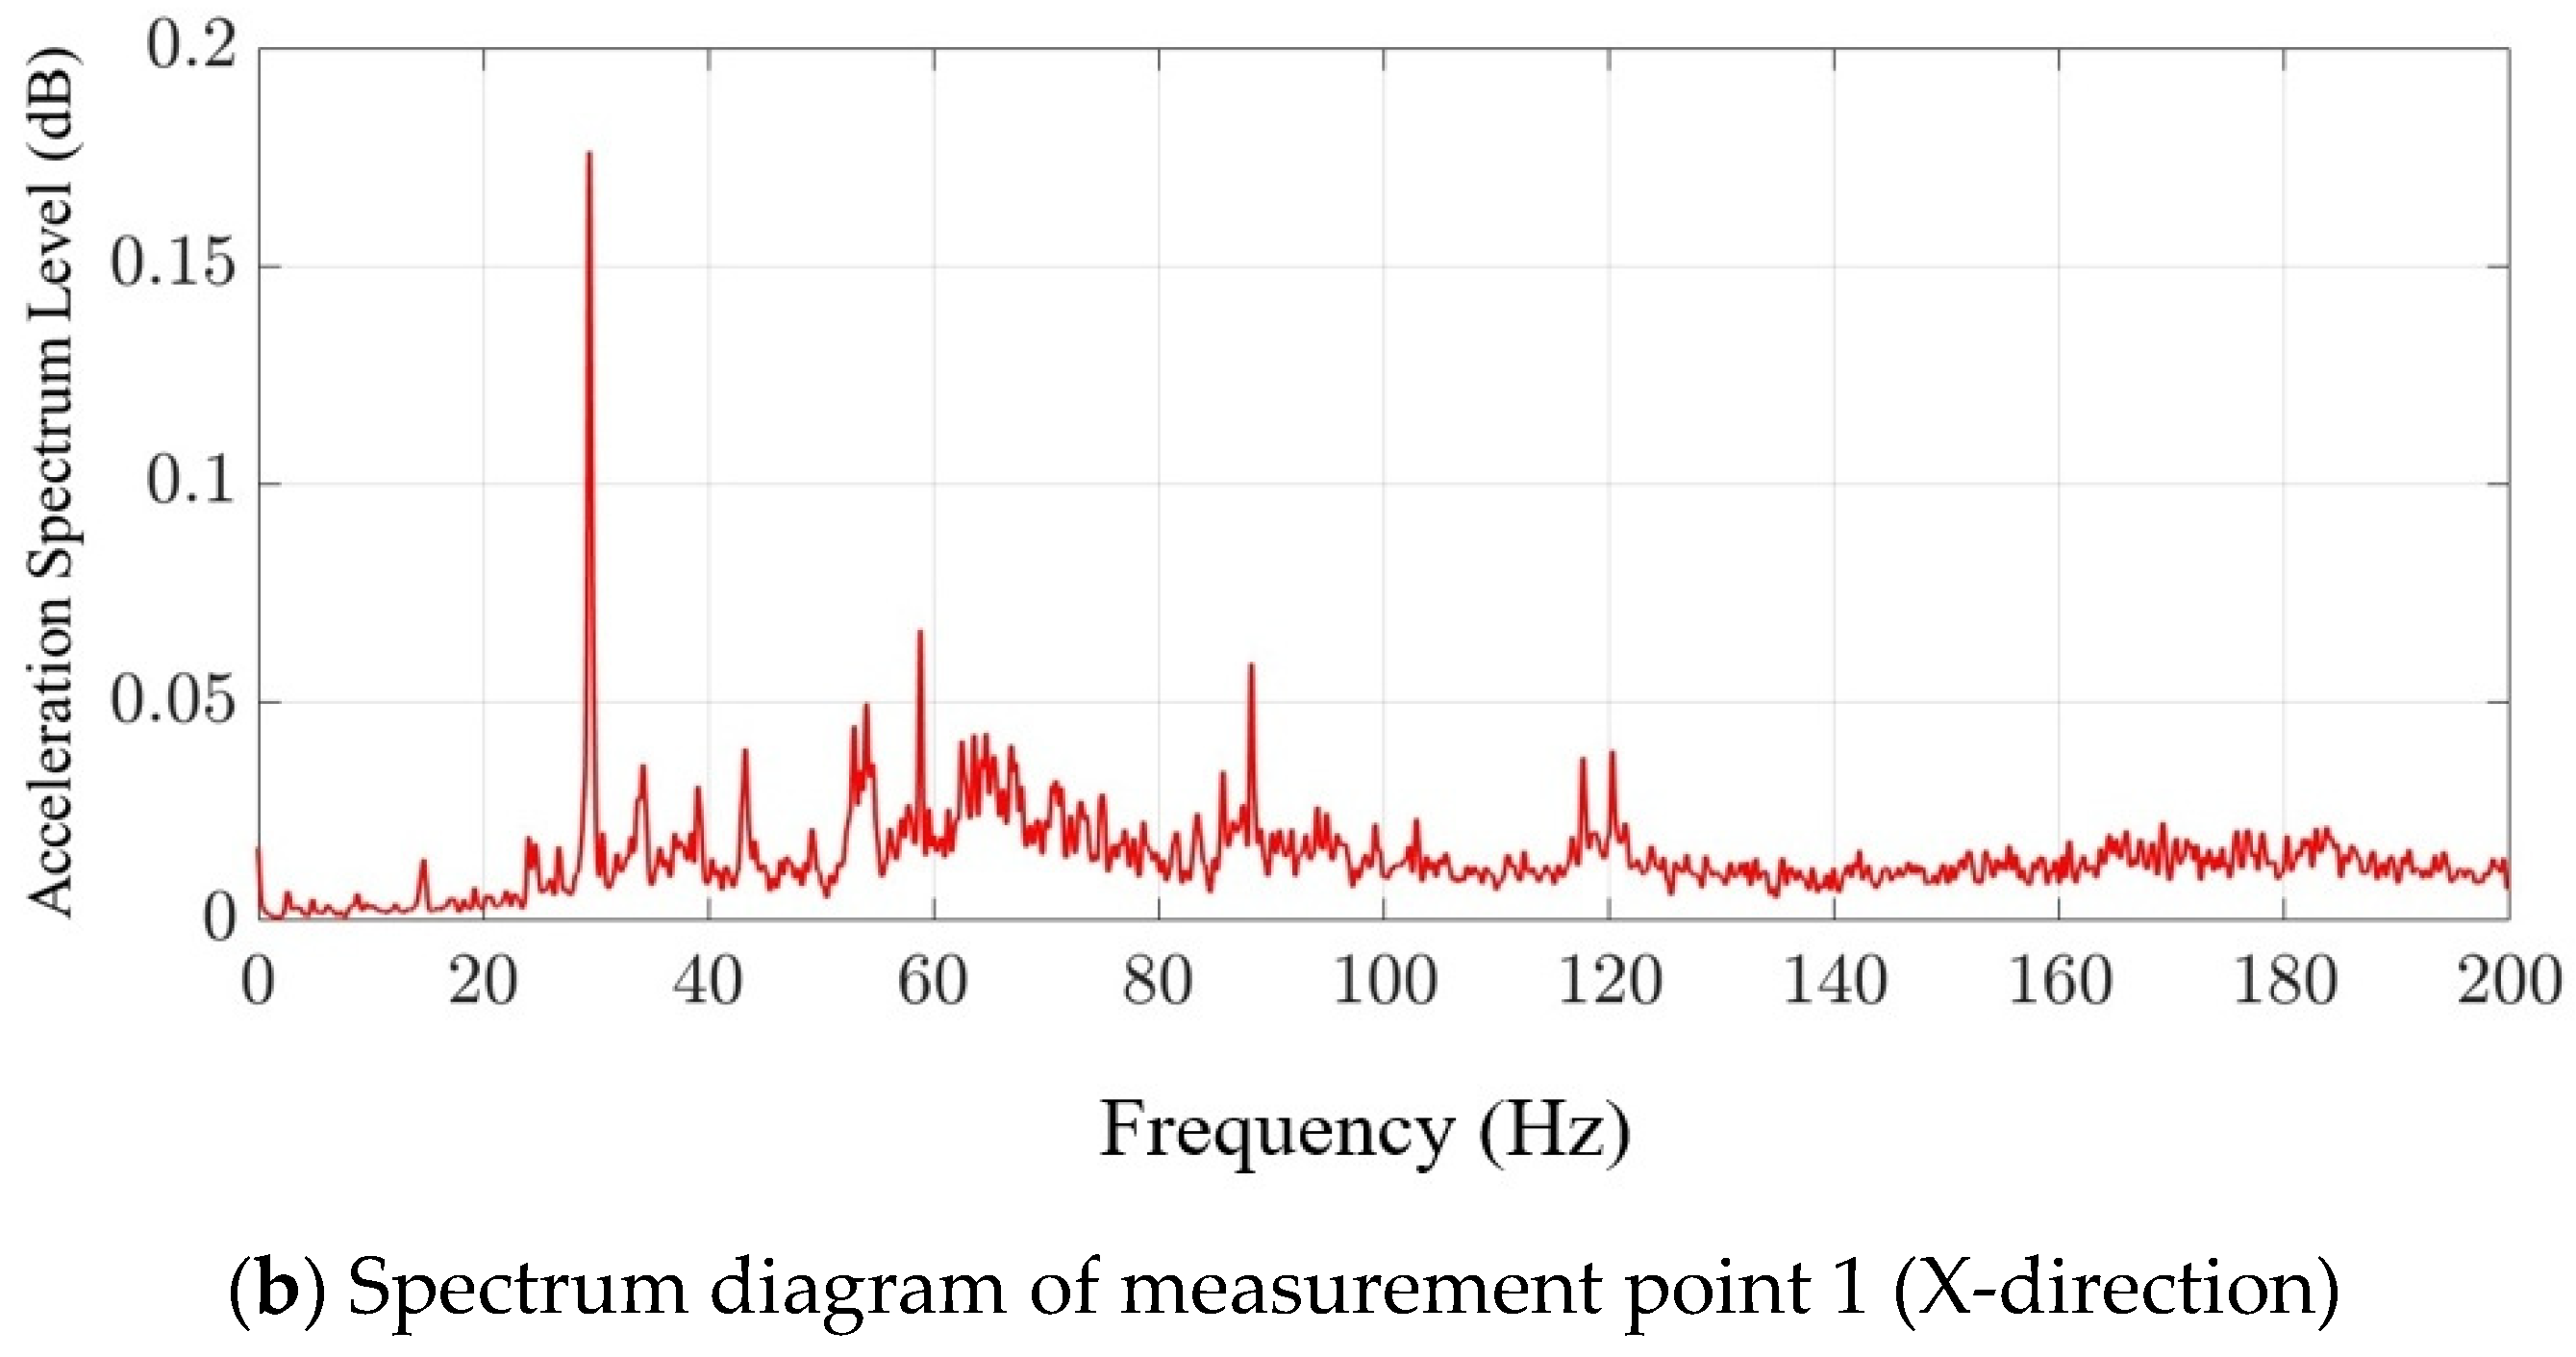
As shown in the vertical contribution contour plot for chassis frame measurement point 1 (Figure 16), the primary excitation sources for vertical vibration are the engine and the cutting header. The contour plot visually demonstrates through its color intensity that within specific frequency ranges, the contributions from the engine and cutting header are significantly higher than those from other sources, forming distinct hot-spot regions. The PSD analysis further reveals that the primary peak frequencies in this direction are concentrated at 29.29 Hz and 120 Hz, with the 29.29 Hz peak corresponding to the engine’s excitation frequency.
Figure 16.
Contribution contour plots from each excitation source for chassis frame measurement point 1 (X-direction).
Notably, the contribution from the cutting header is most significant via the “cutting header → conveyor trough → hydraulic cylinder → chassis frame” transfer path. This is manifested in the contribution contour plot as a large, high-intensity region around the 120 Hz frequency. This indicates that the hydraulic cylinder, acting as a supporting structure, plays a critical role in transmitting high-frequency excitation from the cutting header to the chassis frame, and its connection stiffness and damping properties have a decisive impact on the vertical vibration. Therefore, optimization targeted at this critical frequency and path—for instance, by adjusting the mounting angle of the hydraulic cylinder, adding damping materials, or optimizing the stiffness of the connection point—would be an effective approach for reducing the vertical vibration of the chassis frame.
- (2)
- Lateral Vibration (Z-direction):
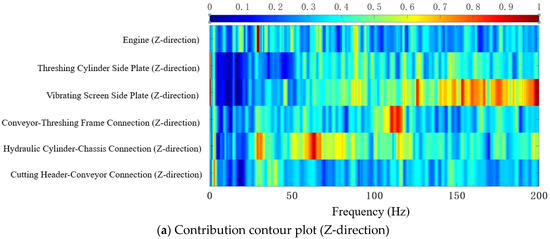
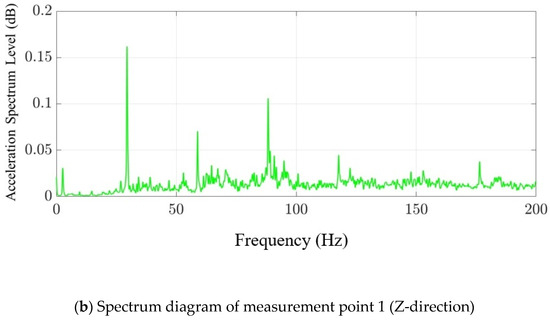
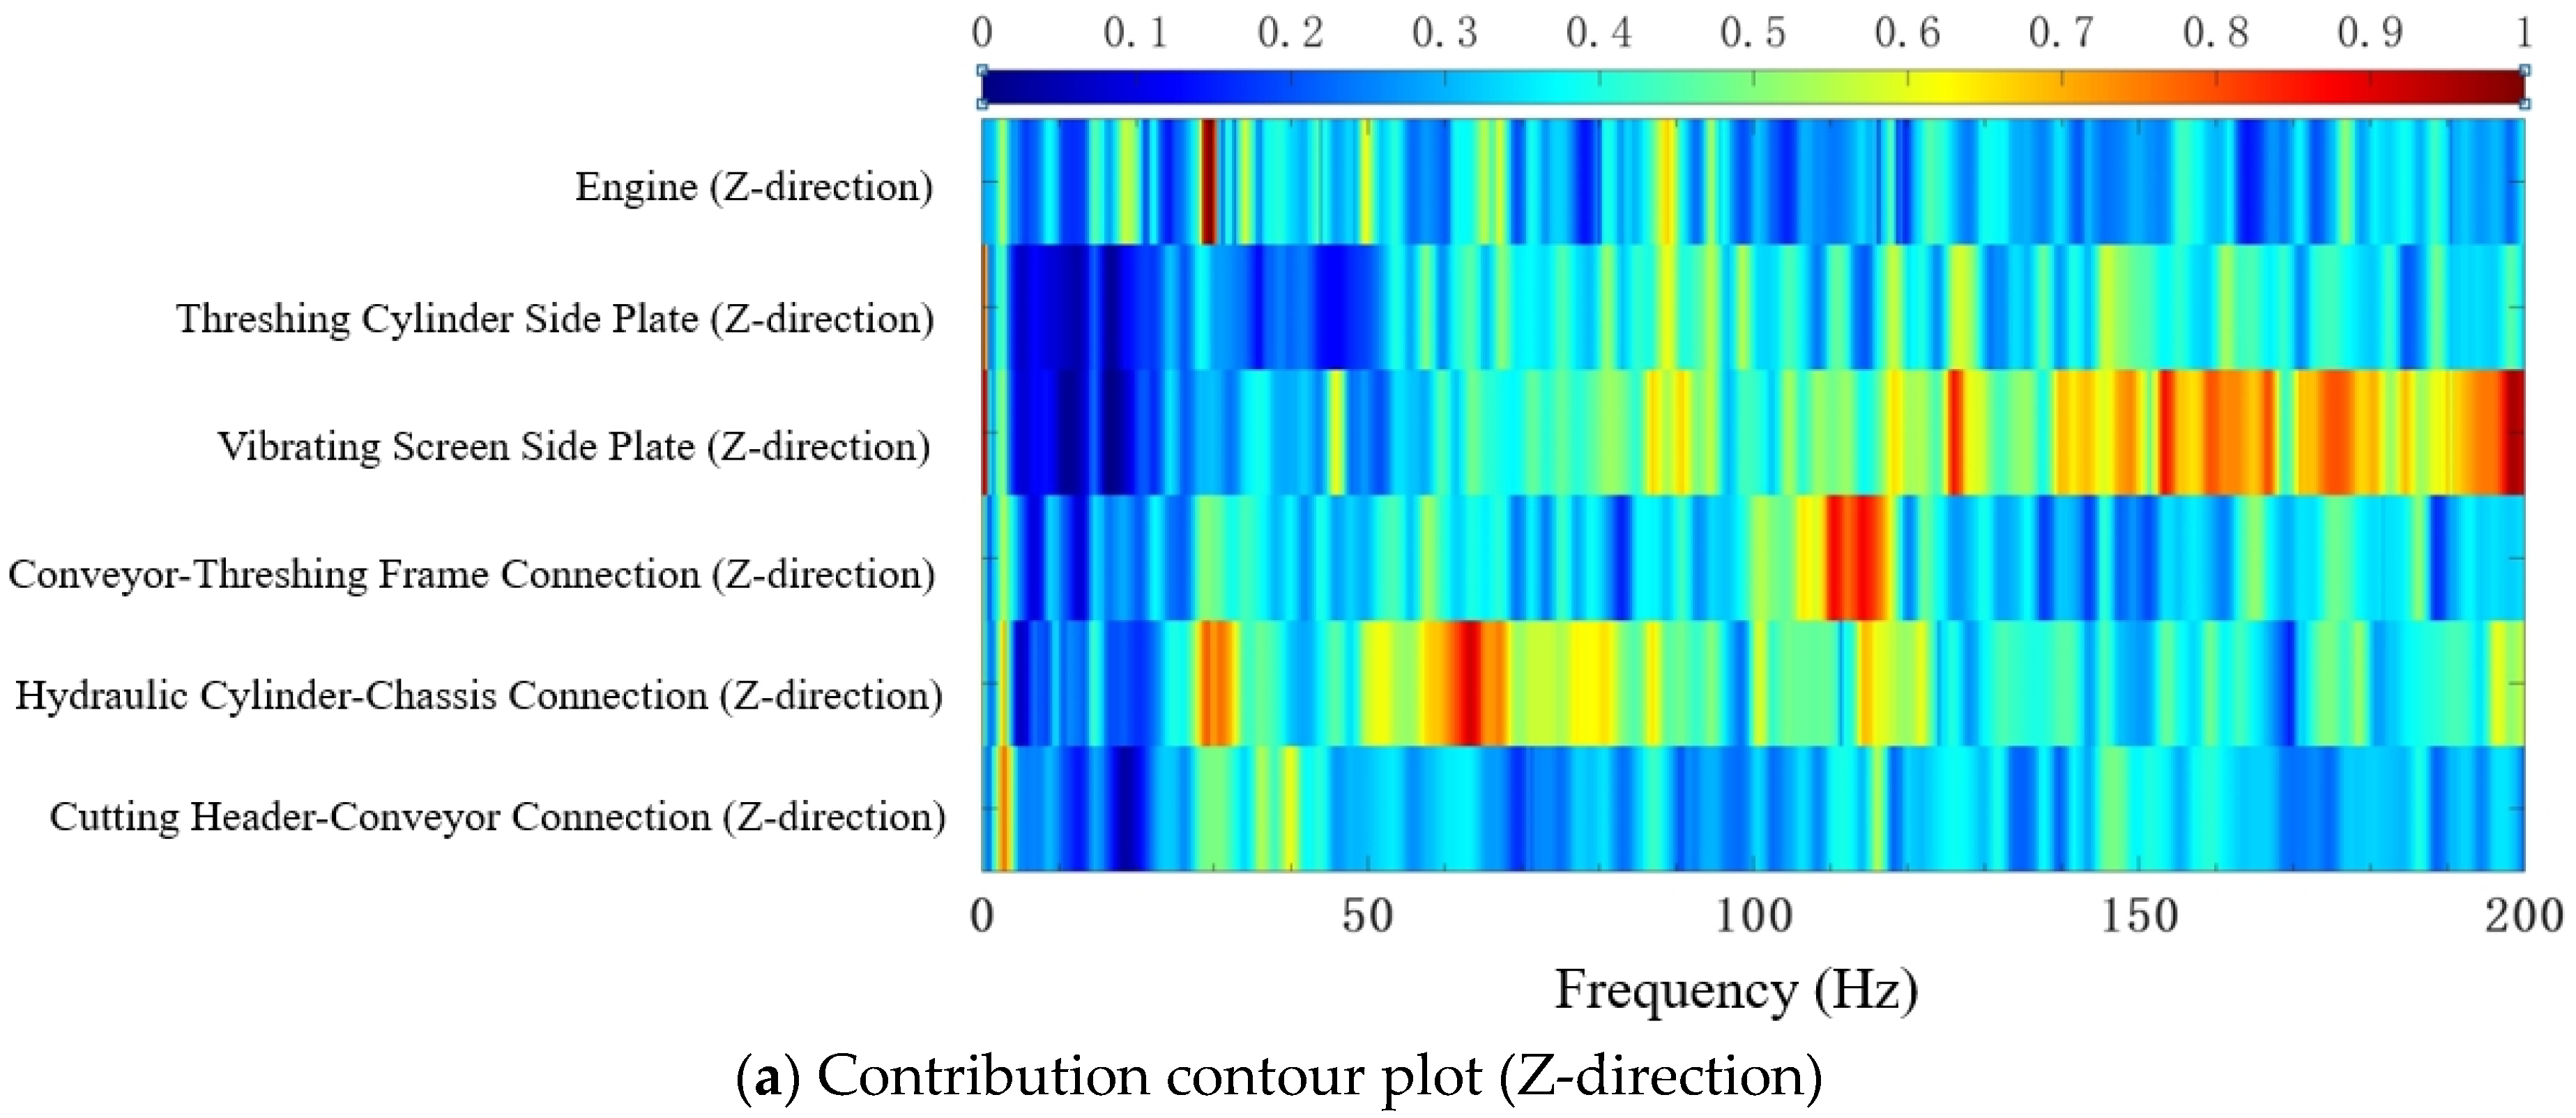
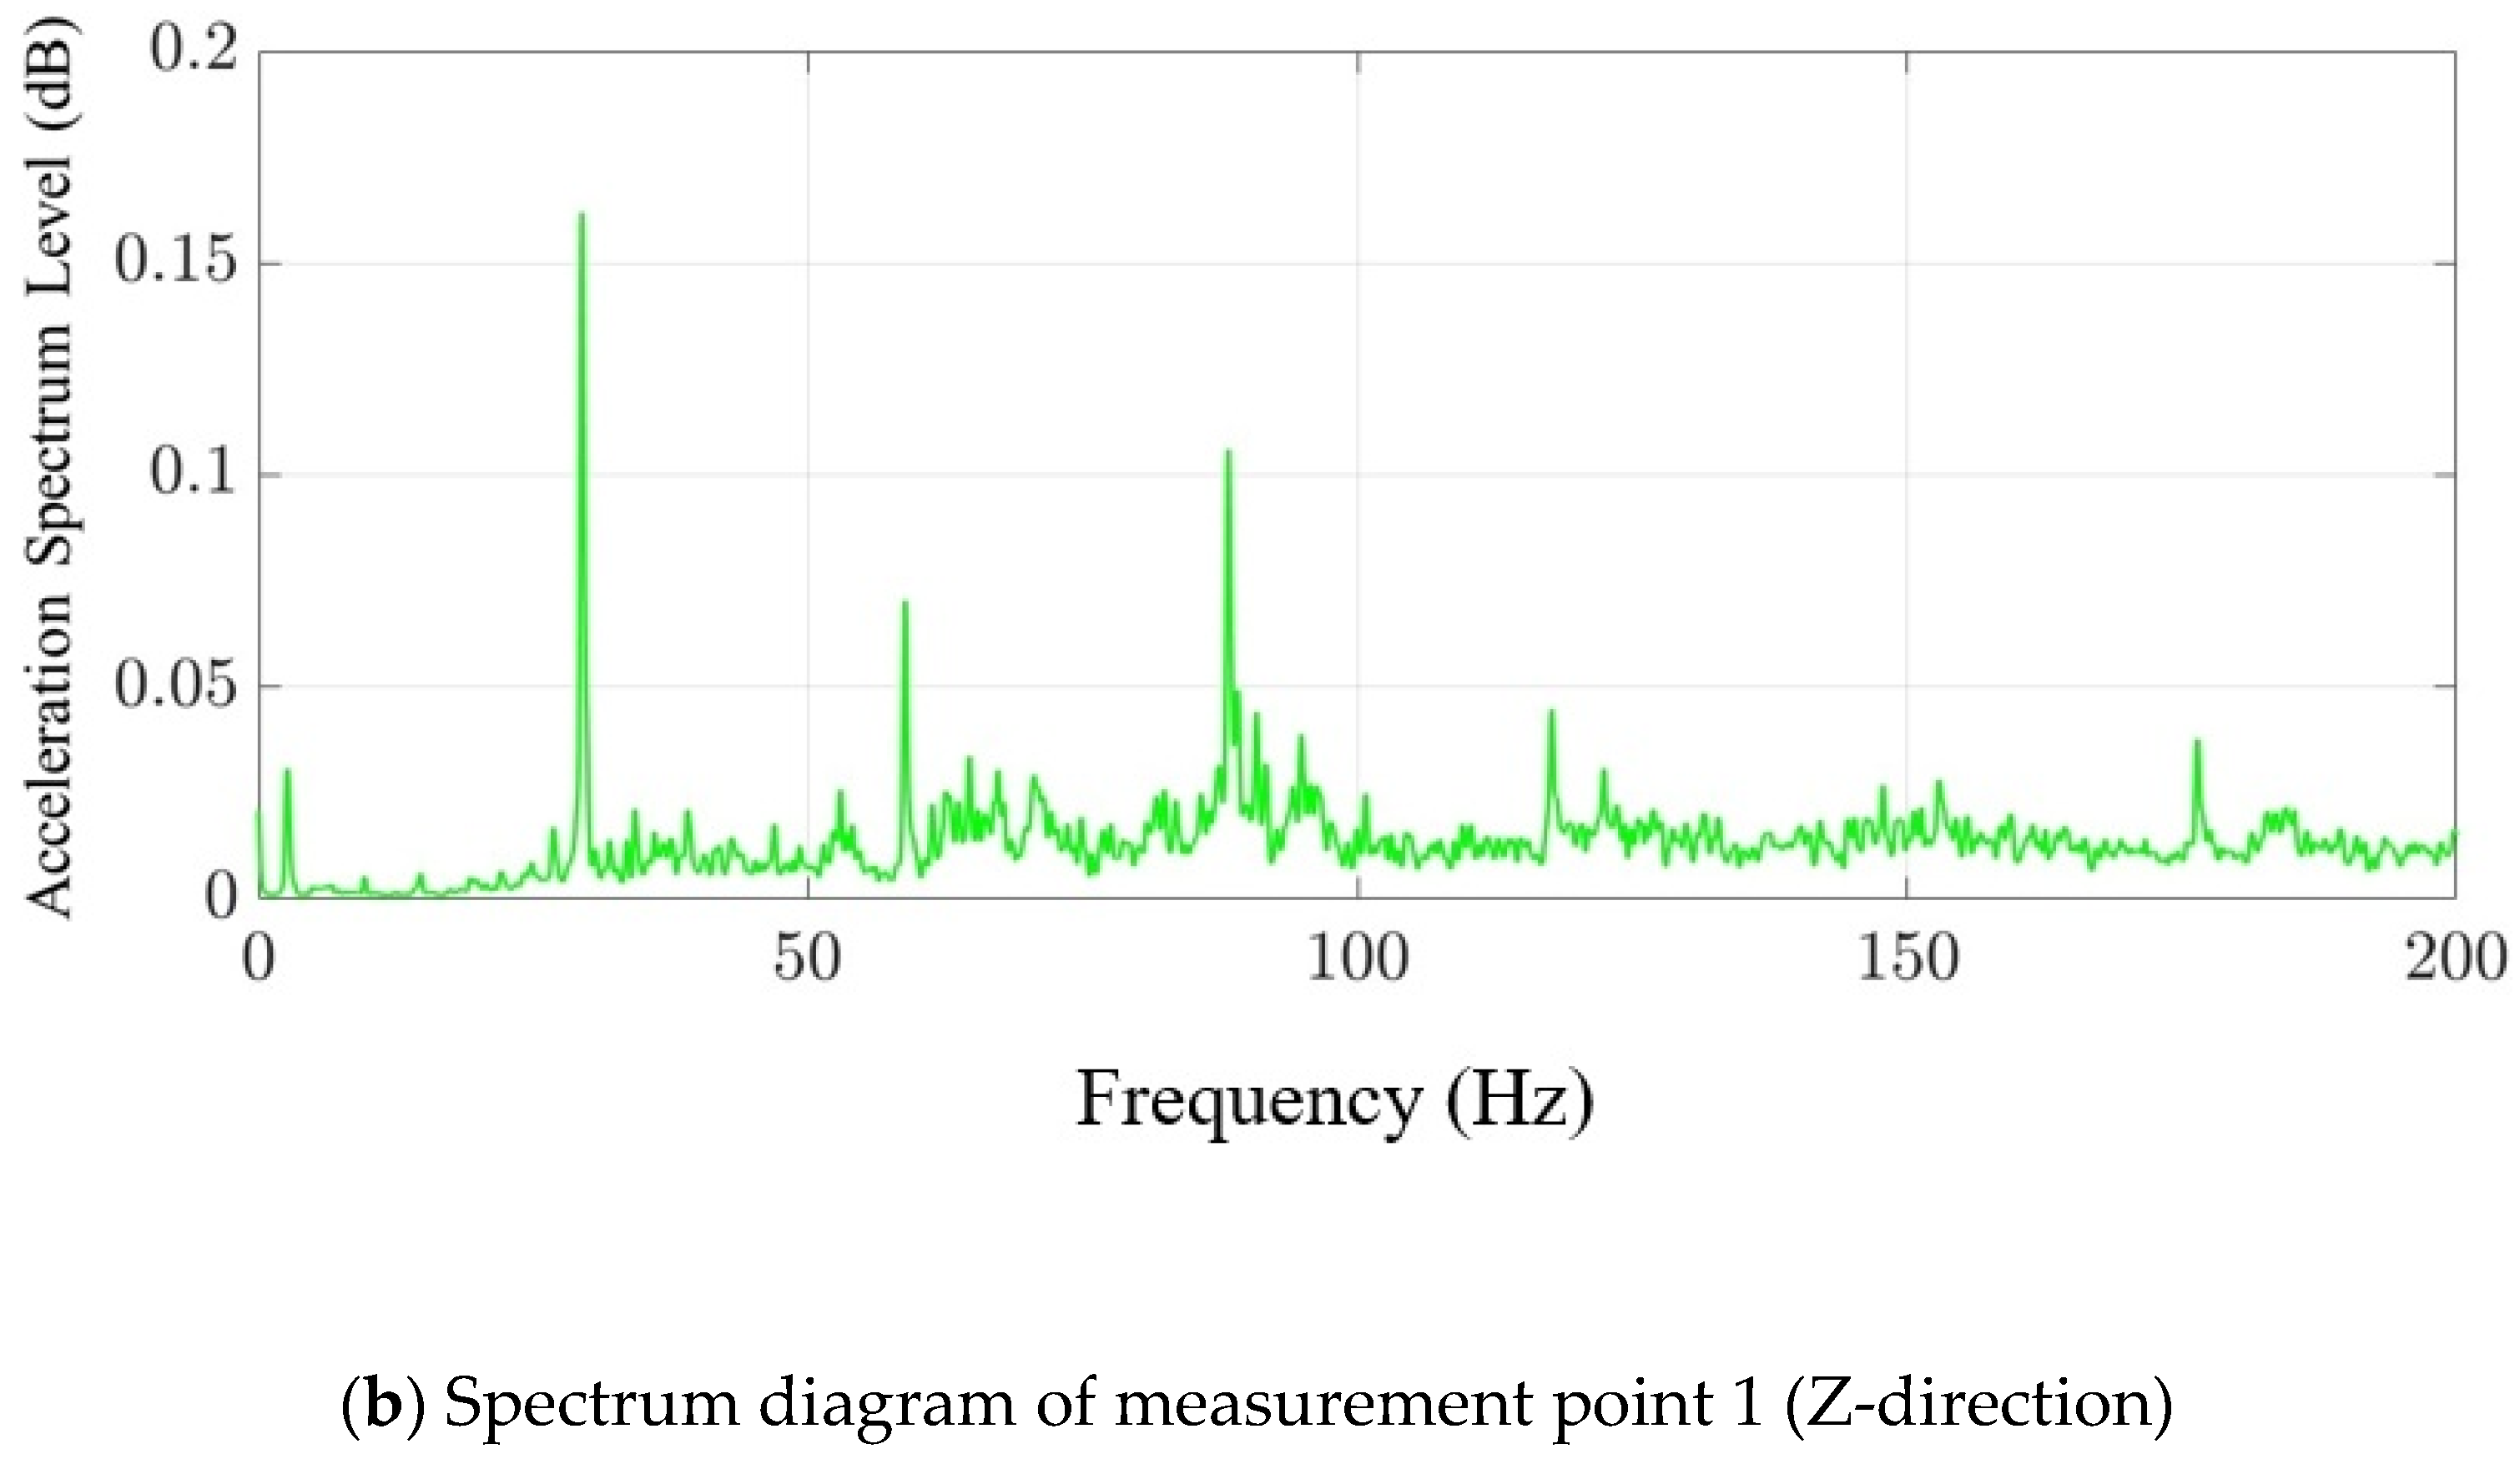
Figure 17 presents the lateral contribution contour plot for chassis frame measurement point 1. For the lateral vibration at this point, the threshing cylinder and the engine are the primary contributing components, and the contour plot clearly shows significant influence regions from these two sources within specific frequency ranges. The PSD analysis results indicate that the main contribution peak frequency corresponds to the theoretical excitation frequency of the threshing cylinder at 58 Hz. This validates the direct impact of the threshing cylinder, as a high-speed rotating component, on the lateral vibration of the chassis frame, with the lateral forces generated by its imbalance or tooth impacts being a significant cause.
Figure 17.
Contribution contour plots from each excitation source for chassis frame measurement point 1 (Z-direction).
Furthermore, this frequency is also close to the second-order harmonic of the engine’s fundamental excitation frequency (29.3 Hz), which is approximately 58.6 Hz. This second-order harmonic resonance effect implies that the excitation frequency of the threshing cylinder is coupled with a harmonic frequency of the engine, leading to a marked intensification of the chassis frame’s lateral vibration, especially when the threshing cylinder and engine operate concurrently. This resonance phenomenon suggests that in designing for lateral vibration reduction, it is crucial not only to consider the characteristics of individual excitation sources but also to comprehensively analyze the potential frequency coupling relationships between different sources to avoid or suppress harmonic resonance.
- (3)
- Longitudinal Vibration (Y-direction):
The longitudinal vibration at measurement point 1 is primarily influenced by contributions from the cutting header, engine, and vibrating screen, as shown in Figure 18. The contribution contour plot indicates that all three excitation sources contribute to the longitudinal vibration at different frequencies, although their distribution characteristics vary. The PSD analysis reveals that the primary peak frequencies are 29 Hz and 58.6 Hz, corresponding to the excitation frequencies of the engine and the threshing cylinder, respectively, which indicates that these components play a significant role in longitudinal excitation. It is noteworthy that the special cantilevered structure of the cutting header’s conveyor trough, due to its own structural characteristics or its connection properties with the frame, may produce an amplification effect under longitudinal excitation. This could significantly increase the effect of the engine’s contribution to longitudinal vibration, making it a more prominent factor in this direction.
Figure 18.
Contribution contour plots from each excitation source for chassis frame measurement point 1 (Y-direction).
The contributions of each excitation source and their primary excitation frequencies to measurement point 1 are summarized in Table 5.
Table 5.
Summary of primary excitation sources and frequencies for triaxial vibration at measurement point 1.
3.4. Model Limitations
While the improved OTPA method significantly enhances the accuracy and stability of transfer path analysis, certain inherent limitations and barriers remain, both in the methodology itself and in its practical application:
- (1)
- Linearity Assumption: The OTPA method assumes the system is linear. A combine harvester, with its multiple joints and varying loads, may exhibit non-linear characteristics that are not fully captured by this model. Future work could explore non-linear TPA techniques to address this.
- (2)
- Source Independence and Coupling: The sequential activation test and OTPA assume that excitation sources are independent. In reality, engaging a component like the threshing cylinder can alter the engine’s load and its vibration characteristics. This physical coupling can lead to incomplete source decoupling in the model.
- (3)
- Operating Conditions: The study was conducted under stationary and idle conditions to minimize external variables. The vibration behavior under full-load, dynamic field conditions will likely differ. Future studies should aim to conduct tests under more representative operational scenarios.
- (4)
- Absence of a Detailed Analytical Model: This study did not construct a detailed analytical vibrational model of the system. The primary reason is the immense complexity of the combine harvester chassis, a large, welded structure with numerous components and connections. Developing an accurate analytical model would require significant simplifications, which could compromise its predictive power. Nevertheless, we acknowledge that developing a simplified analytical model in future work could provide additional physical insights and serve as a valuable tool for cross-validating the FEM and experimental findings.
4. Conclusions
- (1)
- This study developed and validated a robust diagnostic framework based on an improved Operational Transfer Path Analysis (OTPA) to decouple and quantify multi-source vibrations in a combine harvester chassis. The primary contribution of this work lies in demonstrating that an SVD-enhanced OTPA methodology can effectively address the challenge of highly correlated vibration sources inherent in such complex agricultural machinery, providing clear, actionable insights for structural optimization. Future research should be conducted to further enhance the vibration control of the combine harvester and to gain a more comprehensive understanding of the dynamic characteristics of the chassis frame. For example, detailed experimental modal analysis should be performed to clearly determine the critical modal damping ratio. This will provide a more precise basis for selecting and designing vibration suppression solutions.
- (2)
- The analysis quantitatively identified the ‘cutting header → hydraulic cylinder → chassis frame’ path as the most critical contributor to vertical vibration (117.6 dB). Furthermore, a coupled resonance between the threshing cylinder and the engine’s second-order harmonic was found to be the main driver of lateral vibration. These findings are broadly consistent with related research that identifies the engine and primary working units as major vibration sources [45]. However, our work extends these findings by providing quantitative detail on the specific transmission paths and coupling phenomena, thereby offering more precise targets for engineering interventions.
- (3)
- From a methodological standpoint, the use of SVD to regularize the input matrix proved essential for achieving stable and reliable transfer functions, overcoming a common limitation of traditional OTPA, as noted in the literature [42]. The high fidelity of the reconstructed signal against the measured signal validates the effectiveness of this approach. However, minor discrepancies persist, likely due to unmodeled nonlinearities or background noise, indicating a limitation of the linear system assumption. This highlights that while the improved OTPA is a powerful diagnostic tool, its application requires careful sensor placement and an awareness of potential non-linear effects, a challenge common in all TPA-based methods [41].
Author Contributions
H.W. conceived the project, consulted the literature and collected the data, wrote the manuscript, and prepared the figures. Z.T., L.L., H.Z., J.G. and Q.H. revised the manuscript. All authors have read and agreed to the published version of the manuscript.
Funding
This research work was supported by the Taizhou Science and Technology Support Programme (Agriculture) Project: Key Technology and Equipment for Efficient Harvesting of Pea Seedlings Growing in Disorder in the Field (TN202315); the Postgraduate Research & Practice Innovation Program of Jiangsu Province (KYCX25_4246); the Postgraduate Research & Practice Innovation Program of Jiangsu Province (SJCX25_2455); and the Key Laboratory of Modern Agricultural Equipment and Technology of Ministry of Education, Jiangsu University (MAET202326).
Institutional Review Board Statement
Not applicable.
Informed Consent Statement
Not applicable.
Data Availability Statement
The data used to support the findings of this study are available from the corresponding author upon request.
Conflicts of Interest
The authors declare no conflicts of interest.
References
- Chen, J.; Lian, Y.; Zou, R.; Zhang, S.; Ning, X.; Han, M. Real-time grain breakage sensing for rice combine harvesters using machine vision technology. Int. J. Agric. Biol. Eng. 2020, 13, 194–199. [Google Scholar] [CrossRef] [Scilit]
- Li, Y.; Xu, L.; Lv, L.; Shi, Y.; Yu, X. Study on Modeling Method of a Multi-Parameter Control System for Threshing and Cleaning Devices in the Grain Combine Harvester. Agriculture 2022, 12, 1483. [Google Scholar] [CrossRef] [Scilit]
- Liang, Z.; Qin, Y.; Su, Z. Establishment of a Feeding Rate Prediction Model for Combine Harvesters. Agriculture 2024, 14, 589. [Google Scholar] [CrossRef] [Scilit]
- Hu, J.; Pan, J.; Dai, B.; Chai, X.; Sun, Y.; Xu, L. Development of an Attitude Adjustment Crawler Chassis for Combine Harvester and Experiment of Adaptive Leveling System. Agronomy 2022, 12, 717. [Google Scholar] [CrossRef] [Scilit]
- Chen, C.; Cao, G.; Zhang, J.; Hu, J. Dynamic Monitoring of Harvester Working Progress Based on Traveling Trajectory and Header Status. Eng. Agrícola 2023, 43, e20220196. [Google Scholar] [CrossRef] [Scilit]
- Chai, X.; Hu, J.; Ma, T.; Liu, P.; Shi, M.; Zhu, L.; Zhang, M.; Xu, L. Construction and Characteristic Analysis of Dynamic Stress Coupling Simulation Models for the Attitude-Adjustable Chassis of a Combine Harvester. Agronomy 2024, 14, 1874. [Google Scholar] [CrossRef] [Scilit]
- Chandio, F.A.; Li, Y.M.; Ma, Z.; Ahmad, F.; Syed, T.N.; Shaikh, S.A.; Tunio, M.H. Influences of moisture content and compressive loading speed on the mechanical properties of maize grain orientations. Int. J. Agric. Biol. Eng. 2021, 14, 41–49. [Google Scholar] [CrossRef] [Scilit]
- She, D.; Yang, Z.; Duan, Y.; Pecht, M.G. A meta transfer learning-driven few-shot fault diagnosis method for combine harvester gearboxes. Comput. Electron. Agric. 2024, 227, 109605. [Google Scholar] [CrossRef] [Scilit]
- Huang, J.; Tan, L.; Tian, K.; Zhang, B.; Ji, A.; Liu, H.; Shen, C. Formation mechanism for the laying angle of hemp harvester based on ANSYS-ADAMS. Int. J. Agric. Biol. Eng. 2023, 16, 109–115. [Google Scholar] [CrossRef] [Scilit]
- Qing, Y.; Li, Y.; Xu, L.; Ma, Z. Screen Oilseed Rape (Brassica napus) Suitable for Low-Loss Mechanized Harvesting. Agriculture 2021, 11, 504. [Google Scholar] [CrossRef] [Scilit]
- Li, Y.; Xu, L.; Gao, Z.; Lu, E.; Li, Y. Effect of Vibration on Rapeseed Header Loss and Optimization of Header Frame. Am. Soc. Agric. Biol. Eng. 2021, 64, 1247–1258. [Google Scholar] [CrossRef] [Scilit]
- Dai, D.; Chen, D.; Wang, S.; Li, S.; Mao, X.; Zhang, B.; Wang, Z.; Ma, Z. Compilation and Extrapolation of Load Spectrum of Tractor Ground Vibration Load Based on CEEMDAN-POT Model. Agriculture 2023, 13, 125. [Google Scholar] [CrossRef] [Scilit]
- Gao, J.; Liu, Z.; Gu, W.; Zhang, F.; Zhu, L.; Xu, J. Modal Analysis and Optimization of Grain Combine Harvester Undercarriage Frame. Mach. Des. Res. 2023, 39, 199–205. [Google Scholar]
- Khanali, M.; Jafari, A.; Mobli, H.; Rajabipour, A. Analysis and design optimization of a frontal combine harvester axle using finite element and experimental methods. J. Food Agric. Environ. 2010, 8, 359–364. [Google Scholar]
- Rezaei, A.; Masoudi, H.; Dizaji, H.Z.; Ferdavani, M.E.K. Modelling, analysis, and optimisation of the rear axle of cereal combine harvester under real loads using finite elements method. J. Agric. Eng. 2023, 54. [Google Scholar] [CrossRef] [Scilit]
- McCoy, M.L.; Moradi, R.; Lankarani, H.M. Analysis of fatigue resistance of continuous and non-continuous welded rectangular frame intersections by finite element method. J. Mech. Sci. Technol. 2011, 25, 1175–1183. [Google Scholar] [CrossRef] [Scilit]
- Yousif, L.A.; Awad, S.E.A.E. Performance Evaluation of Combine Harvester and the PTO Tractor Operated Thresher for Stationary Threshing of Sorghum. Agric. Mech. Asia Afr. Lat. Am. 2012, 43, 52–56. [Google Scholar]
- Janotta, R.; Podsedek, S.; Bartoszuk, M. The Concept of a Mechatronic System for Monitoring the Temperature of Bearings in a Combine Harvester. In Proceedings of the 14th International Conference Mechatronic Systems and Materials (MSM), Zakopane, Poland, 4–6 June 2018. [Google Scholar]
- Ma, Z.; Zhang, Z.; Zhang, Z.; Song, Z.; Liu, Y.; Li, Y.; Xu, L. Durable Testing and Analysis of a Cleaning Sieve Based on Vibration and Strain Signals. Agriculture 2023, 13, 2232. [Google Scholar] [CrossRef] [Scilit]
- Liu, W.J.; Zeng, S.; Chen, X.G. Vortex Cleaning Device for Rice Harvester: Design and Bench Test. Agriculture 2024, 14, 866. [Google Scholar] [CrossRef] [Scilit]
- Futatsuka, M.; Maeda, S.; Inaoka, T.; Nagano, M.; Shono, M.; Miyakita, T. Whole-body vibration and health effects in the agricultural machinery drivers. Ind. Health 1998, 36, 127–132. [Google Scholar] [CrossRef] [Scilit] [PubMed]
- Merkevicius, S.; Butkus, R.; Jotautiene, E.; Vasiliauskas, G. Prognostics of vibration induced risk to operators of agricultural machinery. J. Vibroeng. 2012, 14, 381–387. [Google Scholar]
- Mohammod, A.L.I.; Lee, Y.-S.; Milon, C.; Ali, K.N.; Myat, S.K.; Kamal, R.; Nur, K.M.S.; Daehyun, L.E.E.; Sun-Ok, C. Analysis of Driving Stability and Vibration of a 20-kW Self-Propelled 1-Row Chinese Cabbage Harvester. J. Biosyst. Eng. 2021, 46, 48–59. [Google Scholar] [CrossRef] [Scilit]
- Qian, P.; Lu, T.; Shen, C.; Chen, S. Influence of vibration on the grain flow sensor during the harvest and the difference elimination method. Int. J. Agric. Biol. Eng. 2021, 14, 149–162. [Google Scholar] [CrossRef] [Scilit]
- Yu, Z.W.; Li, Y.M.; Du, X.X.; Liu, Y.B. Threshing cylinder unbalance detection using a signal extraction method based on parameter-adaptive variational mode decomposition. Biosyst. Eng. 2024, 244, 26–41. [Google Scholar] [CrossRef] [Scilit]
- Wang, J.; Xu, C.; Xu, Y.; Wang, J.; Zhou, W.; Wang, Q.; Tang, H. Resonance Analysis and Vibration Reduction Optimization of Agricultural Machinery Frame-Taking Vegetable Precision Seeder as an Example. Processes 2021, 9, 1979. [Google Scholar] [CrossRef] [Scilit]
- Zhang, H.; Tang, Z.; Li, Y.; Liu, X.; Ren, H. Lightweight Threshing Rack under Multisource Excitation Based on Modal Optimization Method. Adv. Mater. Sci. Eng. 2020, 2020, 2029501. [Google Scholar] [CrossRef] [Scilit]
- Wang, X.; Hong, T.; Fang, W.; Chen, X. Optimized Design for Vibration Reduction in a Residual Film Recovery Machine Frame Based on Modal Analysis. Agriculture 2024, 14, 543. [Google Scholar] [CrossRef] [Scilit]
- Ji, K.; Li, Y.; Liu, Y.; Yu, Z.; Cheng, J. Vibration Signal Extraction and Analysis of Combine Harvester Based on Low-Pass Filter-Eemd Combination. Eng. Agric. 2024, 44, e20240006. [Google Scholar] [CrossRef] [Scilit]
- Yao, Y.; Li, X.; Yang, Z.; Li, L.; Geng, D.; Huang, P.; Li, Y.; Song, Z. Vibration Characteristics of Corn Combine Harvester with the Time-Varying Mass System under Non-Stationary Random Vibration. Agriculture 2022, 12, 1963. [Google Scholar] [CrossRef] [Scilit]
- Li, Y.; Tang, Z.; Ren, H.; Zhou, Y. Vibration Response of Combine Harvester Chassis Undergoing Multisource Excitation Force Distribution. Math. Probl. Eng. 2021, 2021, 8856094. [Google Scholar] [CrossRef] [Scilit]
- Tang, H.; Xu, C.; Zhu, J.; Guan, R.; Wang, J. Vibration analysis and topology optimization of the header of full-feeding rice combine harvester. Int. J. Agric. Biol. Eng. 2023, 16, 96–108. [Google Scholar] [CrossRef] [Scilit]
- Liao, M.; Sen, T.; Elasser, Y.; Al Hassan, H.A.; Pigney, A.; Knapp, E.; Chen, M.J. UAV Fleet Charging on Telecom Towers with Differential Capacitive Wireless Power Transfer. IEEE Trans. Power Electron. 2025, 40, 6370–6384. [Google Scholar] [CrossRef] [Scilit]
- Gao, J.; Zhang, Z.; He, Y.; Liu, J.; Li, Y. Operational transfer Path analysis based on Tikhonov regularization and particle swarm optimization algorithm. J. Vib. Control 2024, 10775463241285472. [Google Scholar] [CrossRef] [Scilit]
- Kong, L.; Zhao, X.; Yuan, X.; Yu, Q.; Shi, P.; Zhou, C.; Zhang, D. A novel vibration transfer path analysis for electric vehicle driving motor controllers under strong signal crosstalk. Mech. Syst. Signal Process. 2025, 223, 111919. [Google Scholar] [CrossRef] [Scilit]
- Li, S.; Chen, K. Analysis of Influence of Electric Drive Assembly on Vehicle Interior Noise Based on Order and Transfer Path Analysis. Noise Vib. Control 2023, 43, 203–209. [Google Scholar]
- Li, Y.; Wang, Y.; Wada, J. Transfer path analysis of a railway vehicle based on global transfer direct transfer. Int. J. Heavy Veh. Syst. 2024, 31, 1–31. [Google Scholar] [CrossRef] [Scilit]
- Oh, J.; Yoo, D.; Kim, C.; Oh, H.; Ryu, Y.; Lee, K.-W.; Sung, D.-U. A hybrid fault diagnostic approach using operational transfer path analysis and denoising deep learning with remote sensors: Application to electric vehicles. Expert Syst. Appl. 2025, 270, 126470. [Google Scholar] [CrossRef] [Scilit]
- Kong, L.; Zhao, X.; Yuan, X.; Yu, Q.; Zhou, C.; Yang, Y.; Li, M. A novel operational transfer path analysis based on the complex-valued crosstalk elimination method. Measurement 2025, 253, 117813. [Google Scholar] [CrossRef] [Scilit]
- Xie, M.; Wang, H.; Liu, Z.; Ma, S.; Wu, X.; Dong, Y. Vibration source analysis and structural optimization design of rotary table based on OTPA. PLoS ONE 2024, 19, e0305351. [Google Scholar] [CrossRef] [Scilit]
- Thompson, D.; Squicciarini, G.; Zhang, J.; Lopez Arteaga, I.; Zea, E.; Dittrich, M.; Jansen, E.; Arcas, K.; Cierco, E.; Magrans, F.X.; et al. Assessment of measurement-based methods for separating wheel and track contributions to railway rolling noise. Appl. Acoust. 2018, 140, 48–62. [Google Scholar] [CrossRef] [Scilit]
- Roozen, N.B.; Leclère, Q. On the use of artificial excitation in operational transfer path analysis. Appl. Acoust. 2013, 74, 1167–1174. [Google Scholar] [CrossRef] [Scilit]
- Zhang, B.; Su, X. Research on decoupled transfer path analysis method and its application in hybrid mechanical systems. J. Vib. Control 2024, 31, 1560–1573. [Google Scholar] [CrossRef] [Scilit]
- Gao, P.; Yan, Q.; Liu, H.; Xiang, C.; Chen, K. Research on fault characteristics and signal transfer path mechanism of the gear transmission system. Mech. Syst. Signal Process. 2025, 228, 112471. [Google Scholar] [CrossRef] [Scilit]
- Wang, B.; Chen, S.; Wang, G.; Tang, Z.; Ding, H. Damping Optimization Method of Combine Harvester Frame Undergoing Multi-Source Excitation. Agriculture 2024, 14, 815. [Google Scholar] [CrossRef] [Scilit]
- Ding, B.; Liang, Z.; Qi, Y.; Ye, Z.; Zhou, J. Improving Cleaning Performance of Rice Combine Harvesters by DEM–CFD Coupling Technology. Agriculture 2022, 12, 1457. [Google Scholar] [CrossRef] [Scilit]
- Ji, K.; Li, Y.; Liang, Z.; Liu, Y.; Cheng, J.; Wang, H.; Zhu, R.; Xia, S.; Zheng, G. Device and Method Suitable for Matching and Adjusting Reel Speed and Forward Speed of Multi-Crop Harvesting. Agriculture 2022, 12, 213. [Google Scholar] [CrossRef] [Scilit]
- Liang, Z.; Li, J.; Liang, J.; Shao, Y.; Zhou, T.; Si, Z.; Li, Y. Investigation into Experimental and DEM Simulation of Guide Blade Optimum Arrangement in Multi-Rotor Combine Harvesters. Agriculture 2022, 12, 435. [Google Scholar] [CrossRef] [Scilit]
- Yu, Z.; Li, Y.; Xu, L.; Du, X.; Ji, K. Unbalanced variation after assembly and double-speed influence coefficient method in the threshing drum. Int. J. Agric. Biol. Eng. 2023, 16, 1–10. [Google Scholar] [CrossRef] [Scilit]
- Liu, Y.B.; Li, Y.M.; Ji, K.Z.; Yu, Z.W.; Ma, Z.; Xu, L.Z.; Niu, C.H. Development of a hydraulic variable-diameter threshing drum control system for combine harvester part I: Adaptive monitoring method. Biosyst. Eng. 2025, 250, 174–182. [Google Scholar] [CrossRef] [Scilit]
- Zhou, Y. Vibration Mechanism and Response of Crawler Combine Harvester Frame Under Multi-Source Excitation. Master’s Thesis, Jiangsu University, Zhenjiang, China, 2020. [Google Scholar]
- Ma, G.; Chen, Y.; Shen, D.; Yang, J.; Tan, P. Vibration source analysis of rotating machinery based on working condition transmission path. J. Vib. Shock. 2022, 41, 276–281. [Google Scholar]
- Peng, L.; Han, J.; Nie, J.; Xiao, X.; Mi, C. Transfer Path Contribution to Floor Vibration of Metro Vehicles Based on Operational Transfer Path Analysis Method. Chin. J. Mech. Eng. 2022, 35, 23. [Google Scholar] [CrossRef] [Scilit]
- Liao, M.A.; Li, H.R.; Wang, P.; Chen, Y.A.; Chen, M.J. Machine Learning Methods for Power Flow Control of Multi-Active-Bridge Converters. In Proceedings of the 22nd IEEE Workshop on Control and Modelling of Power Electronics (COMPEL), Electr Network, Knoxville, TN, USA, 2–5 November 2021. [Google Scholar]
- Lu, M.H.; Jen, M.U.; de Klerk, D. Case study: Separating source contributions of vehicle interior noise by operational transfer path analysis. Noise Control Eng. J. 2021, 69, 39–52. [Google Scholar] [CrossRef] [Scilit]

Disclaimer/Publisher’s Note: The statements, opinions and data contained in all publications are solely those of the individual author(s) and contributor(s) and not of MDPI and/or the editor(s). MDPI and/or the editor(s) disclaim responsibility for any injury to people or property resulting from any ideas, methods, instructions or products referred to in the content. |
© 2025 by the authors. Licensee MDPI, Basel, Switzerland. This article is an open access article distributed under the terms and conditions of the Creative Commons Attribution (CC BY) license (https://creativecommons.org/licenses/by/4.0/).