


Abstract
Recommender systems position themselves as powerful tools in the support of relevance and personalization, presenting remarkable potential in the area of marketing. The cold-start customer problematic presents a challenge within this topic, leading to the need of distinguishing user features and preferences based on a restricted set of transactional information. This paper proposes a hybrid recommender system that aims to leverage transactional and portfolio information as indicating characteristics of customer behaviour. Four independent systems are combined through a parallelised weighted hybrid design. The first individual system utilises the price, target age, and brand of each product to develop a content-based recommender system, identifying item similarities. Secondly, a keyword-based content system uses product titles and descriptions to identify related groups of items. The third system utilises transactional data, defining similarity between products based on purchasing patterns, categorised as a collaborative model. The fourth system distinguishes itself from the previous approaches by leveraging association rules, using transactional information to establish antecedent and precedence relationships between items through a market basket analysis. Two datasets were analysed: product portfolio and transactional datasets. The product portfolio had 17,118 unique products and the included 4,408,825 instances from 2 June 2021 until 2 June 2022. Although the collaborative system demonstrated the best evaluation metrics when comparing all systems individually, the hybridisation of the four systems surpassed each of the individual systems in performance, with a 8.9% hit rate, 6.6% portfolio coverage, and with closer targeting of customer preferences and smaller bias.
1. Introduction
Digital marketing is the result of an era of information and technology. New opportunities bring along responsibilities; the ability to reach the world within a few clicks leads to a need to do so in a timely and relevant manner, respecting regulations such as the General Data Protection Regulation (GDPR), privacy and human rights [1]. Thus, there is an ever increasing demand for more relevant, personalised, engaging and entertaining methods of marketing. Simultaneously, the trend has been to automatise and simplify these methods, delegating analytics to machines and freeing human resources to more creative tasks [2,3,4].
Machine Learning (ML) positions itself as a valuable tool able to extract information from large amounts of data, thriving from volume, velocity, variety and veracity, inherent characteristics of big data [5]. ML is capable of exceeding human capacity in several tasks, being extremely adaptable and fast responding, often used for classification, regression, and prediction tasks [4,6].
Within the spectrum of ML applications for digital marketing, recommender systems (RS) exhibit great utility and potential [7]. These systems seek to understand the connection between users and items, identifying patterns among them in order to predict user preferences [8]. By obtaining this information through complex models, RS provide relevant recommendations, playing a role towards responsible, functional, pertinent and non-invasive marketing.
RS rely on the quantity and quality of data, since a lack of information disrupts the analytical power of ML tools. With an increased challenge of providing suitable recommendations, the cold-start issue arises [9]. Cold-start is defined by the absence of sufficient data to fulfil model requirements, either regarding user or item data. Considering the digital marketing scenario, cold-start often occurs in regard to recent customers and products. When presented with a full non-existence of data, the case is referred to as frozen-start [10]. The frozen-start case distinguishes itself from the exclusively cold-start case due to the inability of developing customized recommendations, as there is no characterising feature.
Trends within the area of digital marketing greatly impact RS’s requirements. Ref. [11] explored the concept of hyper-relevance within marketing, predicting “(…) a post-marketing utopia where old forms of marketing—the disruptive, irrelevant, and corporate kind—have been replaced by something new and different, still performed by marketers but no longer marketing”. Hyper-relevance reinforces the challenge of treating cold-start cases, as achieving accurate understanding and assuming a relevant role becomes increasingly difficult with the lack of data.
This paper’s focal point is to provide recommendations to cold-start users given the challenge and potential this area presents. It is required to perceive the users’ main distinguishing features, identifying connections between these characteristics and user preferences. The user cold-start limitation is typically evaded through the use of extensive item information and explicit ratings; the developed RS distinguishes itself from the current state of the art due to utilizing a limited set of item and transactional information. Considering the paper’s objectives, frozen-start cases will be excluded from the analysis due to the inability to provide customisation.
This paper is organised as follows: Section 2 presents the latest developments within the area of digital marketing, followed by a review of recommender systems and concluding with a focus on the cold-start problem. Section 3 explores the problem and data description. Section 4 describes the adopted methodology in detail. Section 5 presents the obtained results, providing a comparison and critical analysis. Finally, Section 6 presents the main conclusions and opportunities for future work.
2. Related Work
The goal of RS is to provide relevant recommendations in a responsive, dynamic manner. These systems rely heavily on the quantity and quality of the data used to make inferences. The most commonly used approaches include content, collaborative, demographic, knowledge, and community-based RS [12]. Furthermore, the development of hybrid, adaptable tools is often necessary to predict customers’ preferences [13]. Table 1 summarizes the related work about RS.
Table 1.
Summarization of the related work about Recommendation Systems.
Content-based RS utilise descriptive data to find similarities between items. For example, Ref. [14] explored a content-based movie recommender utilising movie descriptions and metadata, such as genre and year of release, extracting similarity scores through cosine similarity and further refining the recommendations. Ref. [15] further explored movie recommendations by characterising a content-based RS. Semantic descriptions were leveraged to extract relevant information and find connections between items. By creating user profiles, the relationships between users and items were identified, originating recommendations.
Collaborative RS support the recommendations on the behaviour of related users. For example, Ref. [16] used this type of system based on two different perspectives: item and user-based. Item-based filtering identifies items that have been purchased by the same users, while user-based filtering seeks users who purchase similar items. These relationships are used to extract similarity measures.
Demographic-based RS utilise users’ demographic data in order to provide recommendations. Ref. [17] adopted this approach, identifying user relationships through demographic data to predict consumer behaviour. This process explores the concept that users sharing demographic characteristics tend to have similar preferences and requirements. However, Ref. [17] reinforced the importance of combining demographic-based with collaborative systems to fine-tune the results and avoid establishing misleading connections.
Knowledge-based RS leverage specific case knowledge to provide recommendations, such as demonstrated in the model presented by Ref. [18]. The model’s methodology consisted of an initial case construction based on provided information, followed by the case selection phase that identifies similarities between various cases. Following, a case classification occurs, leveraging existing knowledge to classify the input. The final stage is the case customisation, where user inputs feed the system and provide further knowledge. This RS is highly dependent on data quality and deeply limited to the range of knowledge provided to the model.
Community-based systems operate under the premise that users with social connections may share preferences, due to the tendency to conform and obtain social approval, a phenomenon known as conformity [32]. Thus, access to community structures is vital to develop this type of RS. For example, Ref. [19] explored community-based RS, beginning by grouping users into overlapping communities based on the existing connections, followed by the addition of community preference into the model through a collaborative approach, providing predictions for each user based on their associated communities.
Hybrid models combine the effects of multiple systems, allowing to bypass the limitations of each individual system. For example, Ref. [20] proposed the application of a hybrid RS combining content, collaborative, and demographic filtering, performing all three in parallel, combining them through a weighted sum and a switching algorithm. Ref. [21] explored a different hybridisation design through a set of models processing outputs of previous models, denominated as a pipelined, meta-level design. Using a knowledge-based model as the first system, a content-based system follows using the previous output as an input, providing a refined set of recommendations. Another example of use of hybrid RS is Ref. [22], who presented a cascade-hybrid RS composed of a content-based recommender followed by a user-based or item-based collaborative RS, depending on whether the user is considered high or low interaction, respectively. This study demonstrated the importance of combining various methods to achieve a satisfactory analysis, while emphasising the necessity of developing models focused on the cold-start cases.
Typically adopted evaluation metrics, prevalent in the presented articles, include the root mean square error, regarding the error associated with the predicted rating [16,19,20,22], the precision, reflecting the percentage of relevant items recommended from list of recommended items [14,16], the recall, regarding the percentage of relevant items recommended from list of relevant items [21], the hit rate, indicating the percentage of recommendations where one item was relevant [21] and the coverage, reflecting the percentage of the total items that were recommended by the system [14,22]. The use of these metrics allows for the comparison of different models and adjustment of hyper parameters during the model definition phase, assessing performance.
Cold-start situations heavily impact the performance of RS, leading to a necessity of developing models adapted to these cases. Ref. [9] defined the cold-start problem for two situations: cold-start for new users or new items. The case to be tackled in this paper is the recent user cold-start, regarding the existence of insufficient information and interactions associated with certain users. Within marketing, this issue happens when customers have not made enough purchases or interactions with the brand to enable the extraction of relevant information about the user.
Cold-start RS, although similar to a typical RS, require additional complexity in order to overcome the lack of data. For example, the use of feature engineering enables the increase of the number of inputs to the model [25], while segmentation can aid in behaviour prediction [26], thus increasing performance. Furthermore, exploring additional ML tools can further expand the potential of RS [27]. For example, Ref. [28] proposed the use of a multi clustering recommendation system to predict new customer behaviour. The approach starts by clustering items, followed by a customer feature engineering, allowing the segmentation of users and finalising with item recommendations. The algorithm was proved to increase buyers’ attention and addressed the issue of cold-start through the prediction of new users’ behaviour. Regarding the application of ML tools, Ref. [23] used a multi-level fuzzy RS, analysing several continuous inputs in order to make inferences regarding the similarity between users. This system was found to be valuable for extracting more information from cold-start cases. Additionally, Ref. [24] suggested the inclusion of Market Basket Analysis (MBA) [33] using pairwise association rules, resulting in a RS independent of complex user and item information. This approach identifies related items based on the behaviour of a population of users, building a collective model of preferences. This circumvents the cold-start problematic, preventing biased recommendations.
ColdGAN [29] is a GAN-based recommendation system that addresses the problem of new user cold-start recommendation. It uses generative networks to predict item ratings for cold-start users based on limited rating behaviour data. The system is evaluated by a discriminative network to ensure accuracy. A novel rejuvenation function and relevant item loss are also incorporated to enhance predictions. ColdGAN outperforms many state-of-the-art recommendation systems, and its rejuvenation function and relevant item loss effectively guide the generative network in inferring item ratings for new users. Ref. [30] proposed a new method called Sparsity and Cold Start Aware Hybrid Recommended System (SCSHRS), which was developed to address these issues. The proposed method has been tested on MovieLens-20 M, Last.FM, and Book-Crossing data sets and compared to prevailing techniques. The SCSHRS system achieved a Mean Absolute Percentage Error of 40%, precision (0.16), recall (0.08), F-measure (0.1), and Normalized Discounted Cumulative Gain (0.65). Meta-learning is effective for user cold-start problem in recommender systems, but many are gradient-based and require user demographic information. This raises privacy concerns and can be difficult to satisfy in rare scenarios. Additionally, these systems rarely capture user preferences over different item attributes. In Ref. [31] a new system called HyperRS is proposed, which does not rely on demographic information for personalized recommendations. Instead, a hypernetwork generates all weights in the underlying recommender system, allowing weights to adapt quickly to capture user interest in item attributes and their contents. Experimental results show that HyperRS outperforms state-of-the-art meta-learning recommender systems for user cold-start problems.
The presented paper positions itself as a highly adaptable approach to providing recommendations for cold-start users. The main contributions of this paper include the parallelisation of content, collaborative and MBA approaches, allowing to leverage each system while preventing the amplification of bias. Moreover, the developed model enables the extraction of information from a limited selection of reliable data, exploring the topic of hyper-relevance using a robust, stable model.
3. Problem and Data Description
The current section aims to present a detailed description of the available data, containing a brief problem characterisation.
3.1. Data Characterisation
The data used to support this study comes from a large, well established retailer. The retailer’s offer is characterised by short life cycle products with notable seasonality. Moreover, customers are typically associated with a continuous behavioural transformation, rarely repurchasing items. The market is also highly affected by trends and external events.
It was provided access to the retailer’s product portfolios and transactional data, as well as a list of recommendations recently made. Due to the absence of demographic data or descriptive user information, the adopted approach will be item-based.
3.1.1. Product Portfolio Datasets
The product portfolio datasets, referring to the Portuguese and Spanish market, include the identification of each product, the product’s title, and price. It should be noted that the Portuguese dataset contains 13,633 products while the Spanish contains 15,635 products. When merging both portfolio datasets, a total of 17,118 unique products are identified.
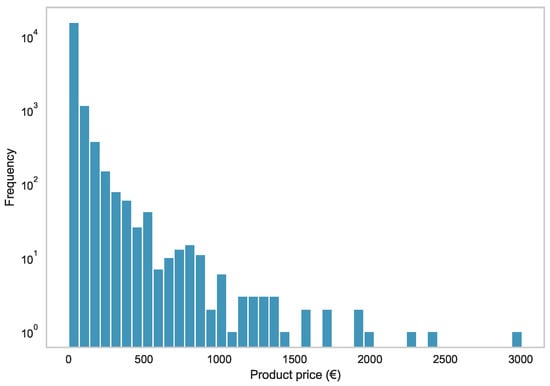
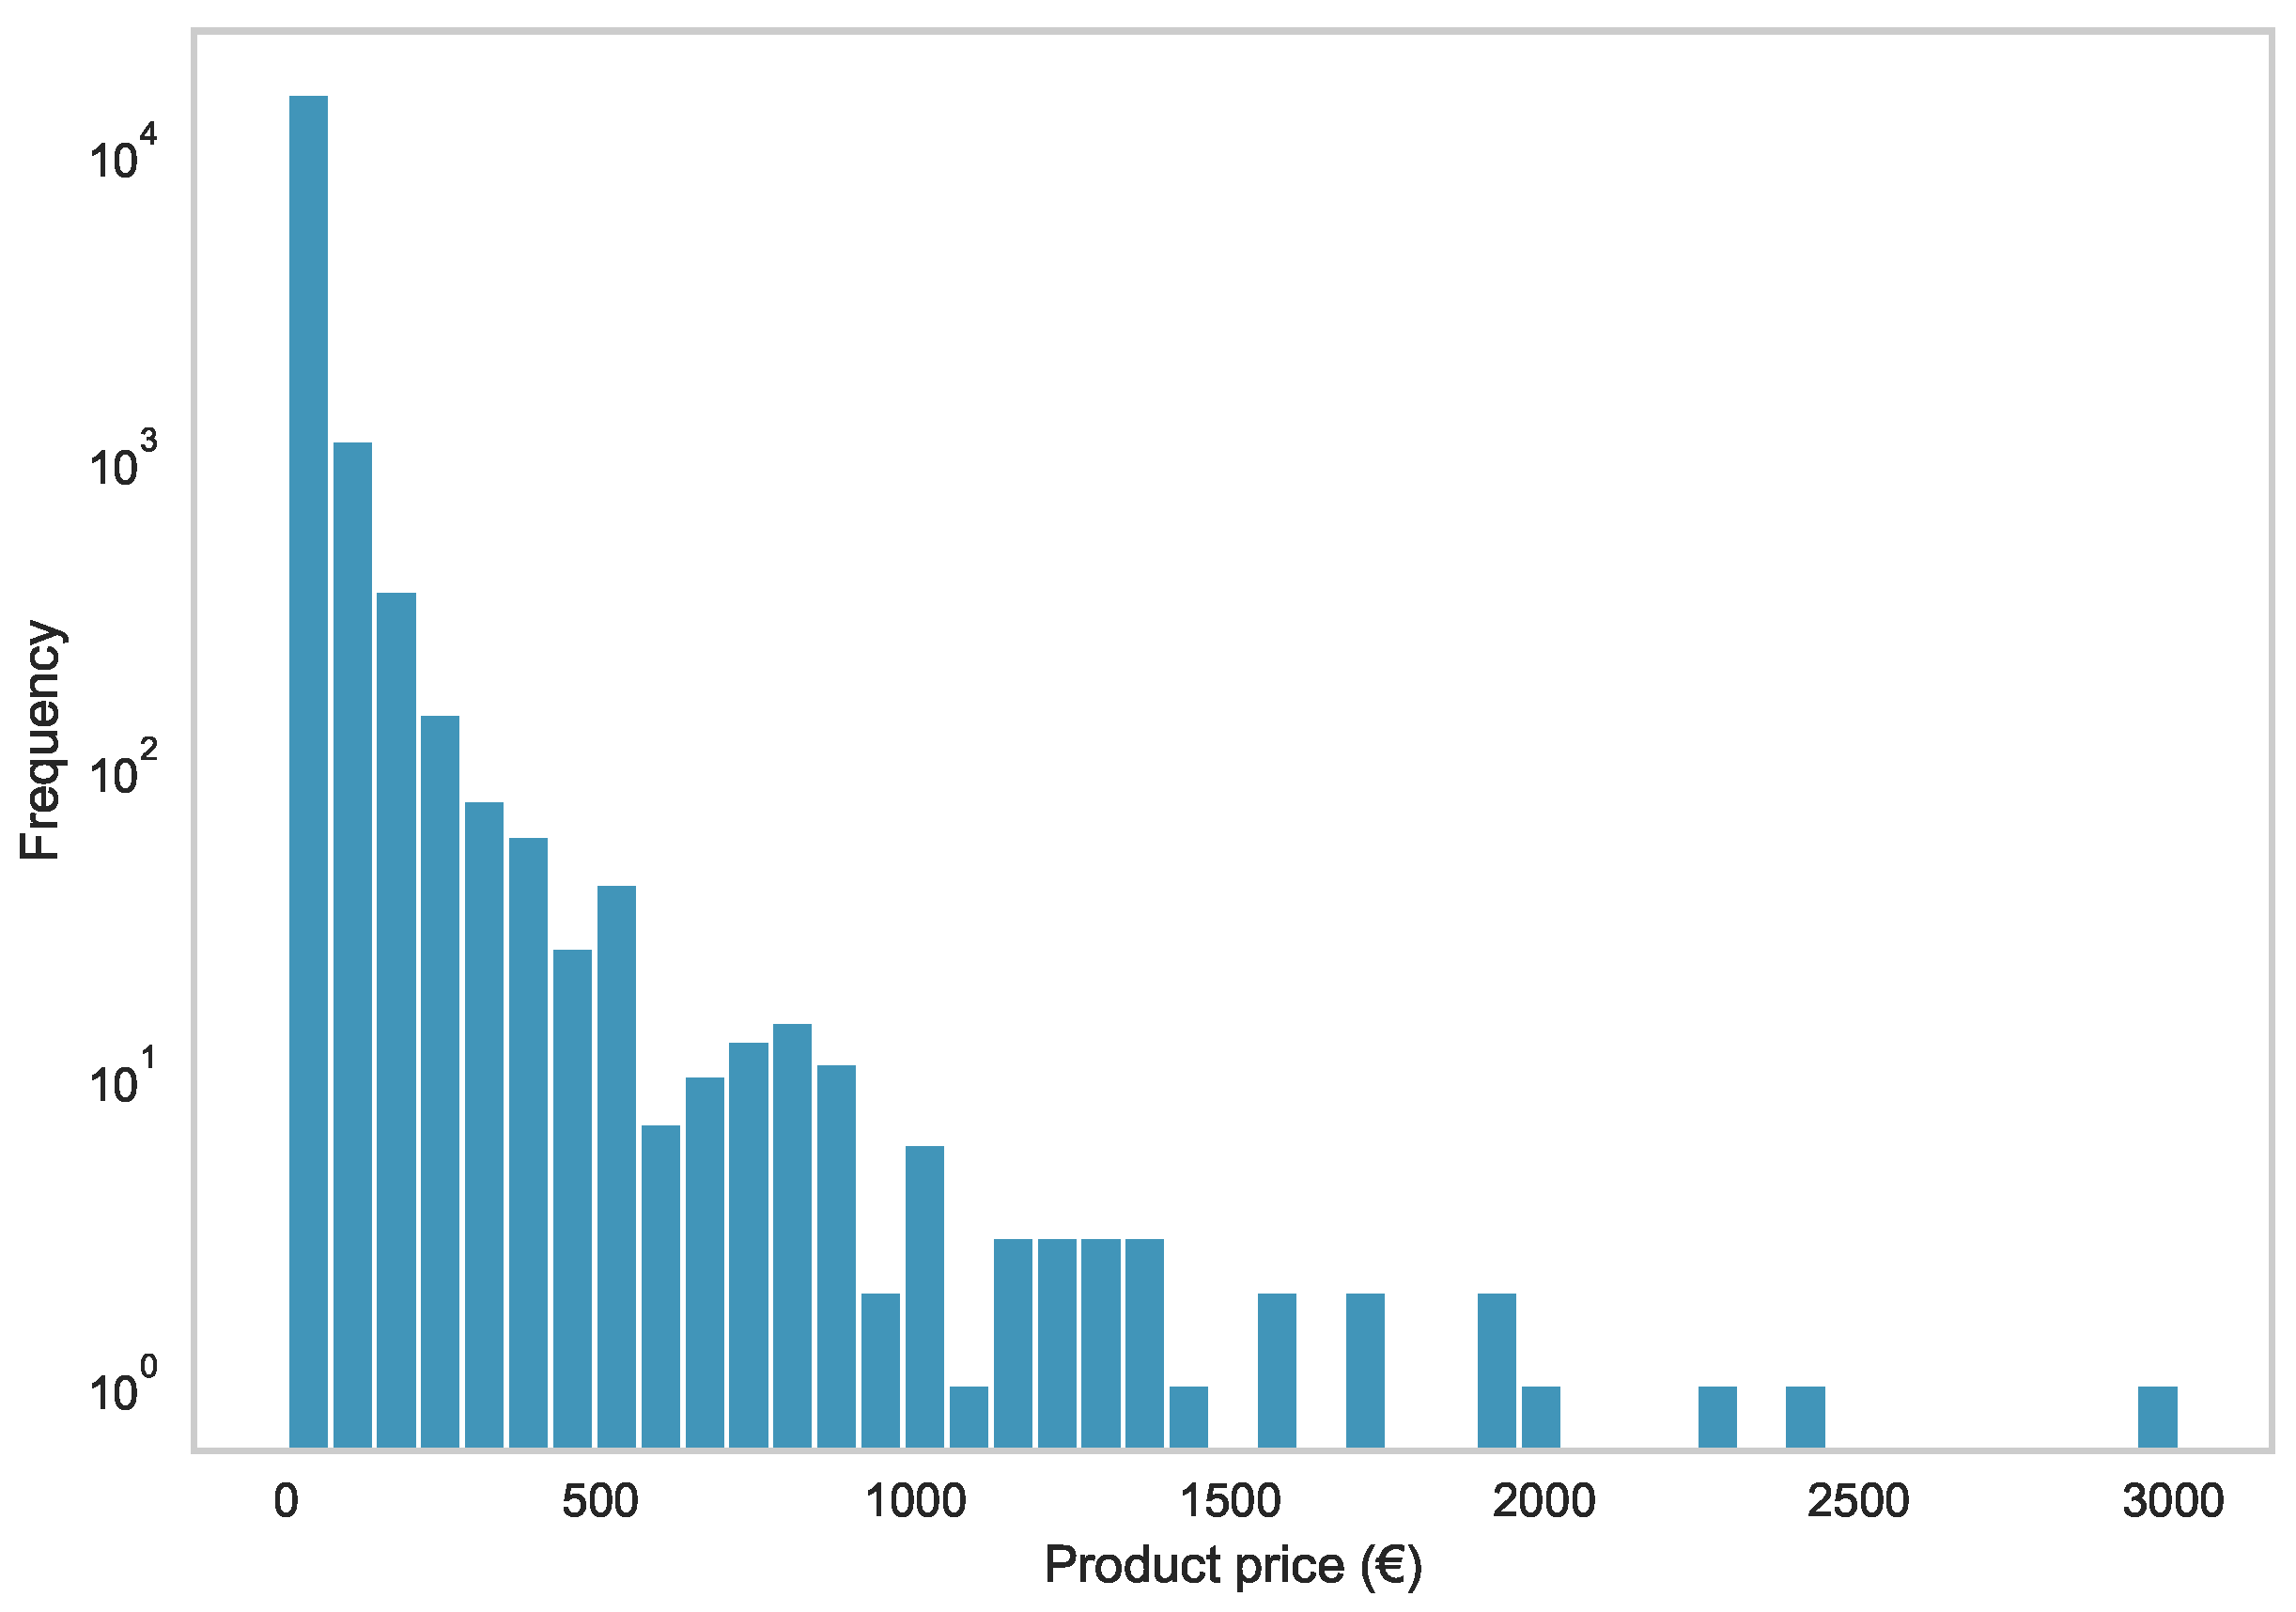
There is a high concentration of products priced under EUR 42.49, representing 75% of the total number of products. A high variability of prices is observed, with items reaching up to EUR 2999.00, as presented in Table 2 and Figure 1.
Table 2.
Product price analytics.
Figure 1.
Histogram of product prices.
When analysing the product titles, it is possible to observe the existence of 10,478 and 11,763 unique words within the Portuguese and Spanish portfolios, respectively. In both portfolios, product titles are constituted, on average, by seven words. Thus, product titles are positioned as potential elements to characterise products and identify similarities among them.
3.1.2. Transactional Dataset
The transactional dataset included 4,408,825 instances, including the client, the purchased item, and the transaction’s date and time. The covered time horizon is 12 months, from the 2nd of June 2021 until the 2nd of June 2022. Considering the short product life cycle and the dynamic customer positioning, 12 months is considered a reasonable amount to understand customer behaviour while avoiding obsolescence.
The transactional dataset reveals the existence of 556,785 users considered cold-start users, as they are associated with three or fewer transactions within the last twelve months, considered recent enough to be pertinent indicators of user behaviour. Purchases occurring before the indicated time frame are considered obsolete due to the retailer’s context. They represent 58.9% of the total number of users, i.e., 945,080. It can be concluded that, for the business under analysis, the cold-start topic is highly relevant given that the majority of customers are considered to be cold-start users.
It should be noted that not all products existent in the transactional dataset are present in the product portfolios. The transactional data contains a total of 38,686 unique products, while 60% of this value, i.e., 23,223 products, are not present in the product portfolio or the company’s website. This phenomenon may be caused by the short product life cycle, leading to portfolios quickly becoming outdated or recently purchased items being removed from the portfolio, as well as the existence of items exclusive to the physical stores, not being displayed online.
4. Methodology
The project’s aim is to address the cold-start problematic through the development of a RS adapted to a specific business case. Considering the large offer and the short life-cycle of the portfolio’s products sold by the retailer used as business case, adaptability and responsiveness will be highly valued in the developed system. Cross Industry Standard Process for Data Mining (CRISP-DM) [34,35] was used.
4.1. Data Preparation
The portfolio and interactions datasets, characterised in the previous chapter, are the basis for the data pre-processing task. Considering the interactions dataset, the values regarding transactional dates are scaled between 0 and 1, 1 regarding the most recent transaction, therefore converting the date into a continuous variable. Given the limited range of information in the portfolio dataset, additional data is obtained through the process of web scraping, using the product ID as an input to find the product’s web page and importing the brand, age range, and description associated with each product.
The product description and the title are merged, resulting in a textual element that is processed using NLP. The first step is to remove symbols from the text, including commas and dashes, as well as numbers; additionally, all words containing two or fewer characters are removed. Secondly, lemmatisation is performed to extract the base of each word and stemming is applied, transforming each word into its stemmed form. At this stage, all accents are removed. Thirdly, a stopword list is defined, including the list of product brands. The removal of all accents and stemming is performed on the list.
Subsequently, a TF-IDF (term frequency-inverse document frequency) [36] vectorizer is applied to the word list, resulting in a tokenised dataframe excluding all stopwords. This method allows for the creation of a dataframe where each column represents a token and the relevance of each token in characterising each product is indicated by an assigned value. Considering the high amount of tokens originally obtained, a single value decomposition (SVD) was performed, reducing dimensionality. From the resulting matrix a correlation matrix is extracted, using the linear kernel, to be used posteriorly as an input to a content RS. The linear kernel is selected due to the pertinence of the dimensionality within the textual analysis, considering that high similarities in short descriptions are less relevant than high similarities in long descriptions.
4.2. Content-Based Recommender System Model
Two content-based RS are developed, focused on product descriptors. The first content-based RS (1CR) is supported by the portfolio and scraped data. Thus, each product is characterized by price, age range, and brand. The second content-based RS (2CR) uses the keyword-based correlation matrix described in Section 4.1.
Regarding the 1CR model, the first step is to prepare the input variables. The price will be used as a continuous variable. The age range, originally a categorical variable, will be transformed into a ordinal variable. The brand, originally a categorical variable, will be converted into a numerical representation using one-hot encoding. One-hot encoding allows to represent categorical variables as binary vectors. During the training phase, combinations of the various presented inputs will be evaluated, analysing the effect of this hyper-parameter.
Using the price, age range, and brand information, the cosine correlation coefficient between items is calculated. Then, selecting a user, each of the user’s previously purchased products are considered one by one, extracting similarity indexes based on the cosine correlation coefficients between items. The size of this matrix will be evaluated during the training phase, enabling the selection of a specific number of items with the higher correlation coefficients, with this number being considered a hyper-parameter.
The model includes a time-decay perspective, prioritising recent purchases. Therefore, products purchased more recently are associated with higher similarity indexes, i.e., the similarity coefficient is reduced in proportion to the scaled date of the purchase.
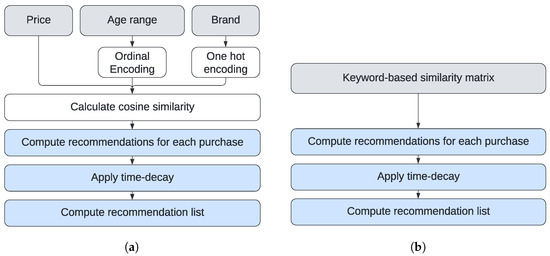
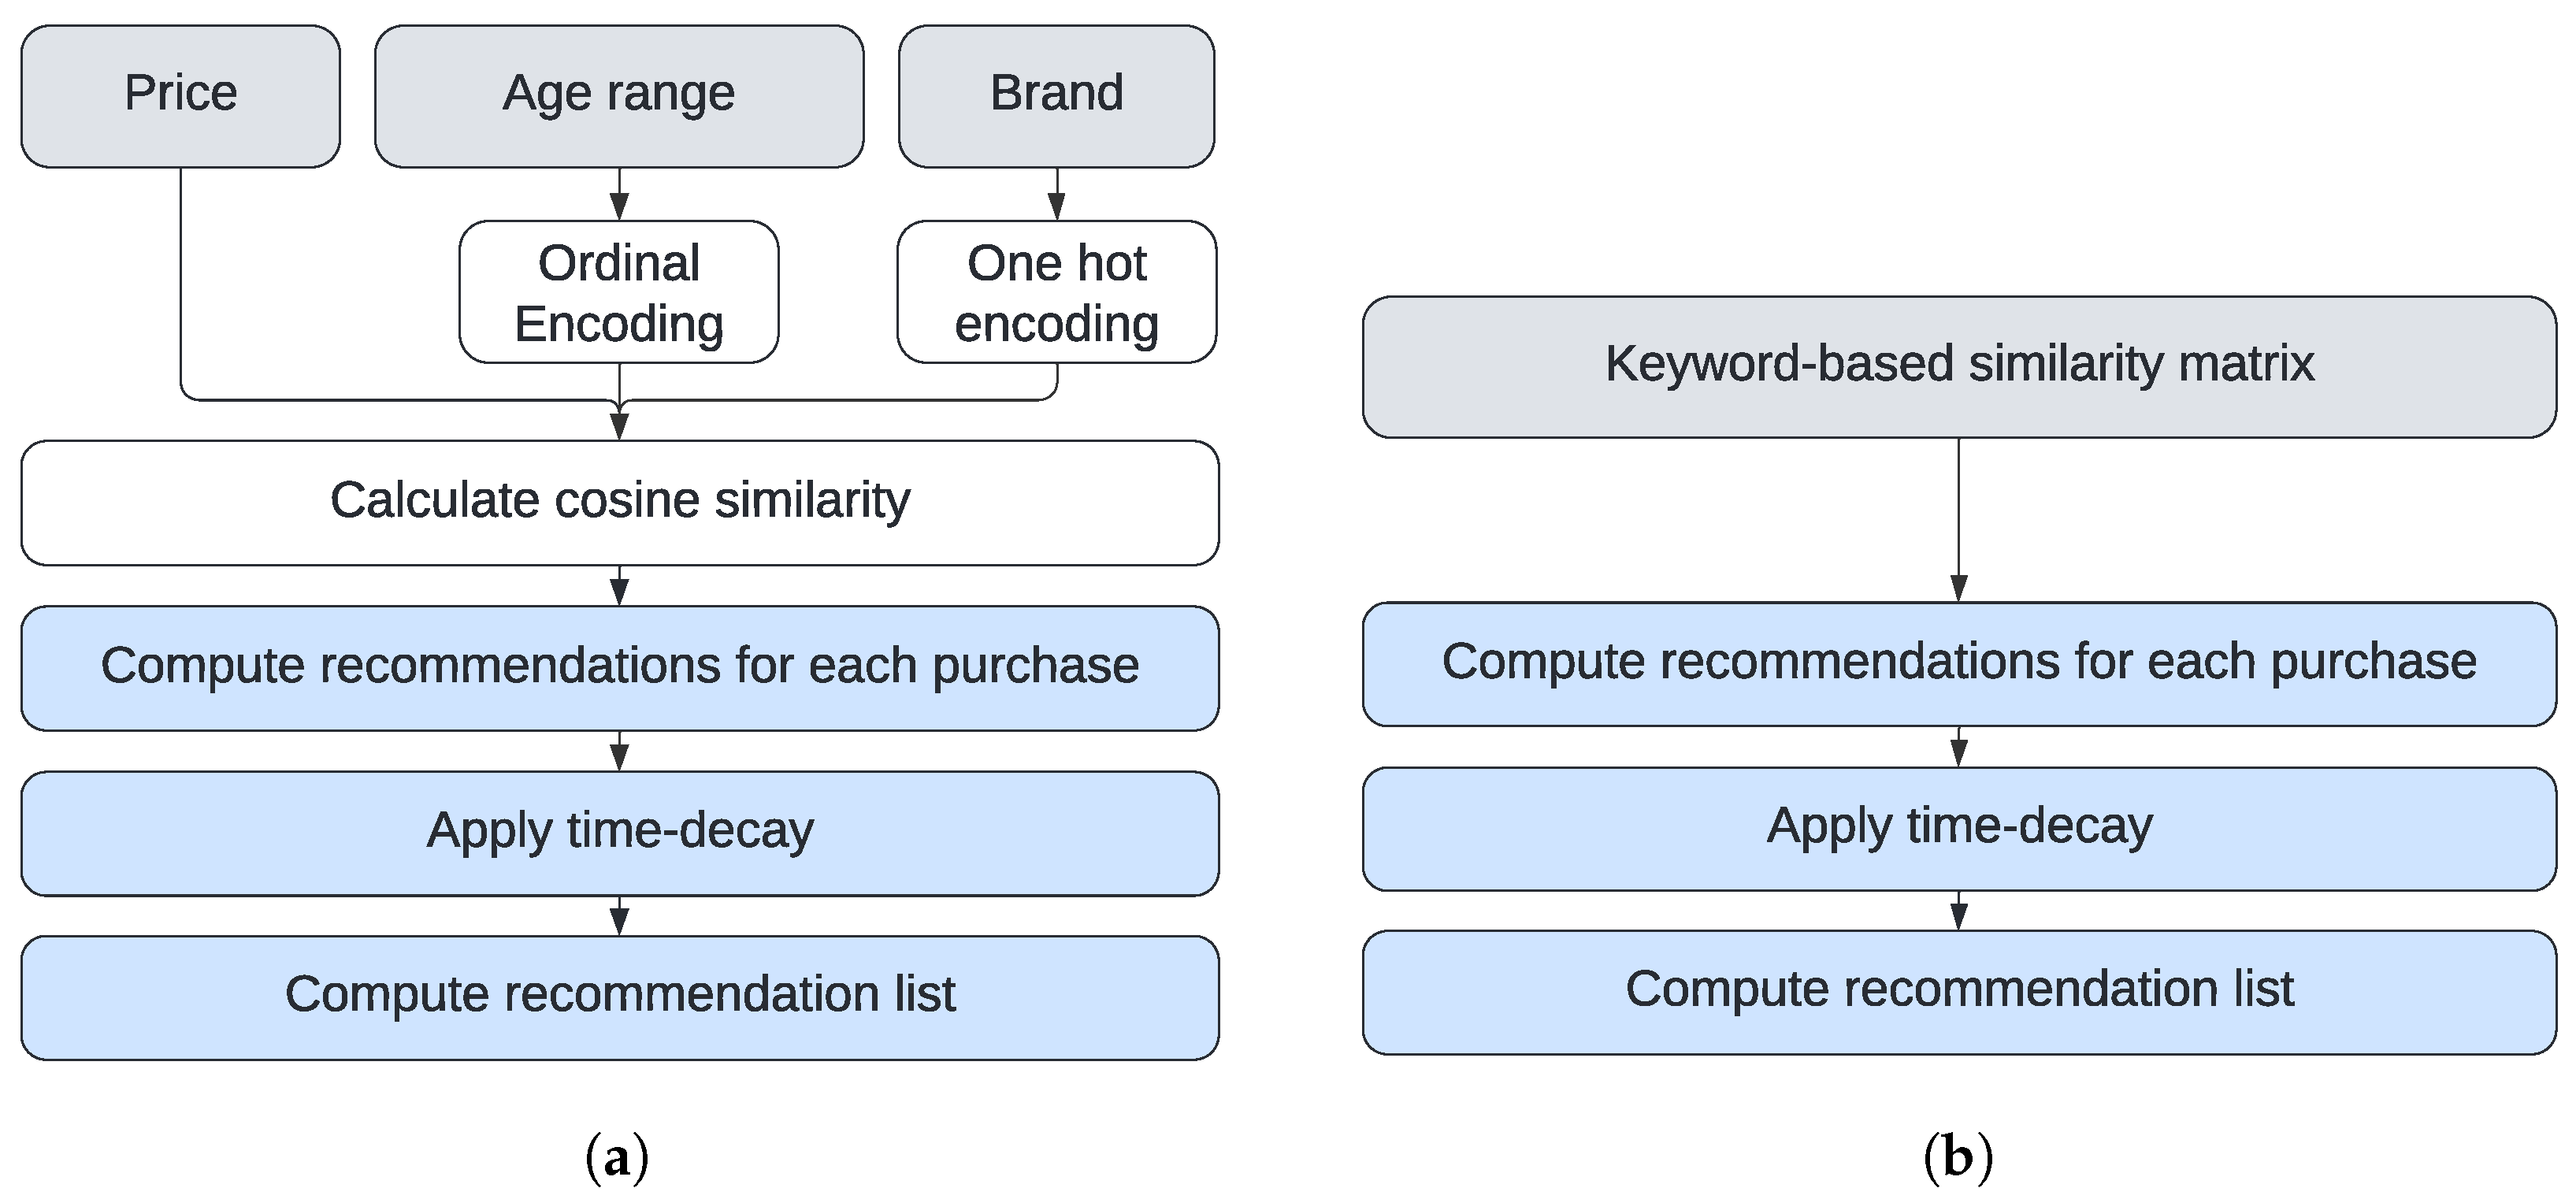
Given that each product purchased by the customer resulted in a different list of similarity indexes, the various outputs are combined, calculating the average similarity coefficient for each product present in the recommendation list. The 1CR approach is summarized in Figure 2a.
Figure 2.
Diagram of the content-based approaches. (a) Diagram of the 1CR approach. (b) Diagram of the 2CR approach.
The 2CR model, based on the keyword-based correlation matrix, followed a similar methodology to the 1CR model, extracting from the correlation matrix a list of similarity indexes for each product purchased by the user, joining all lists and taking into consideration the time-decay. The 2CR approach is summarized in Figure 2b.
4.3. Collaborative-Based Recommender System Model
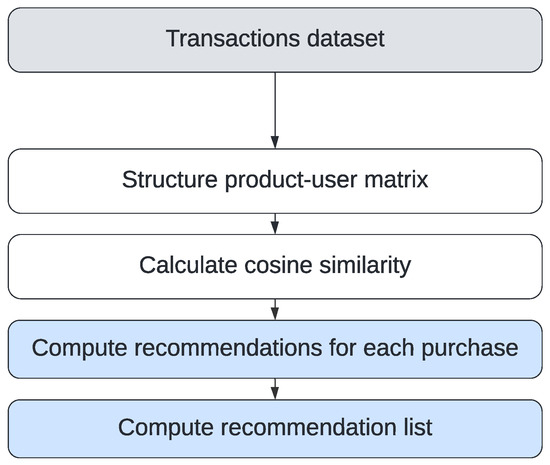
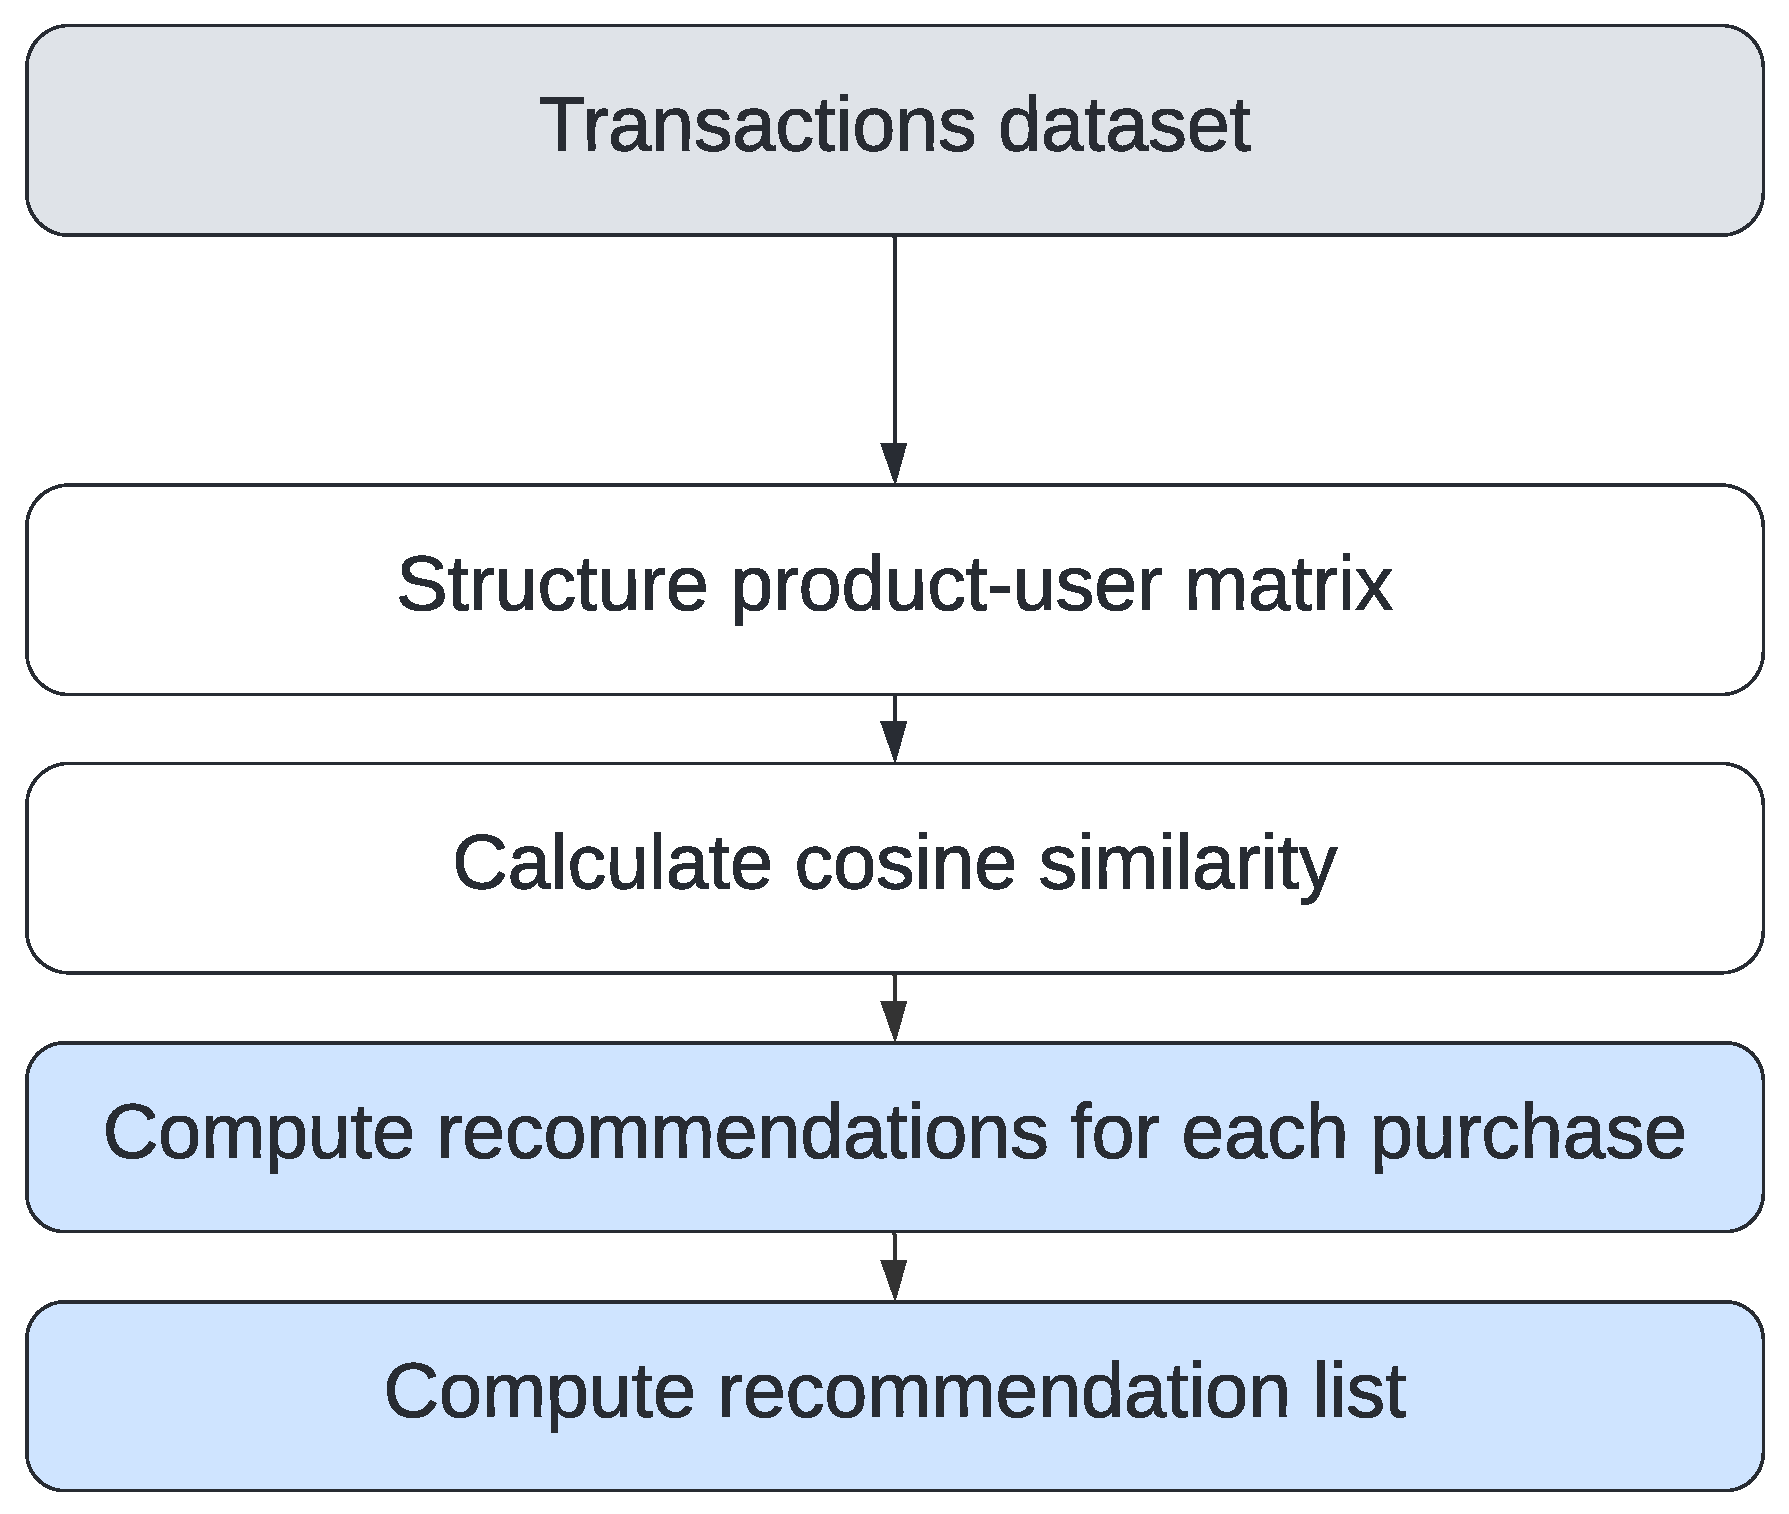
The collaborative-based RS (CR) leverages information regarding products frequently purchased by the same user in order to predict future purchases, therefore being fully based on the transactions dataset. This approach complements the previous model given the content limitations, with only 46.6% of all products existent in the transactional dataset being present in the portfolio and website.
The adopted system is an item-based collaborative RS. Considering that the scaled transactional date will be considered as an implicit rating, with recent transactions indicating a stronger preference, this method incorporates a time-decay aspect within the similarity matrix rather than introducing it in the final matrix.
The first phase is to create a product-user matrix based on the scaled transactional dates. The similarity coefficients are calculated through cosine correlation, providing the basis for returning recommendations. For each user, a list of similarity indexes will be extracted from each of the previously purchased items. The size of this list is considered a hyper-parameter and will be evaluated during the training phase. The obtained lists are combined by calculating the average similarity coefficients for each product in the list. The CR approach is presented in Figure 3.
Figure 3.
Diagram of the collaborative recommender system approach.
4.4. Market Basket Analysis Model
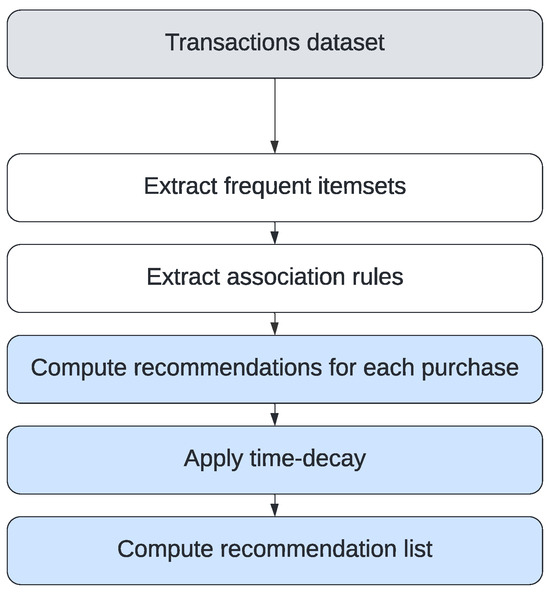
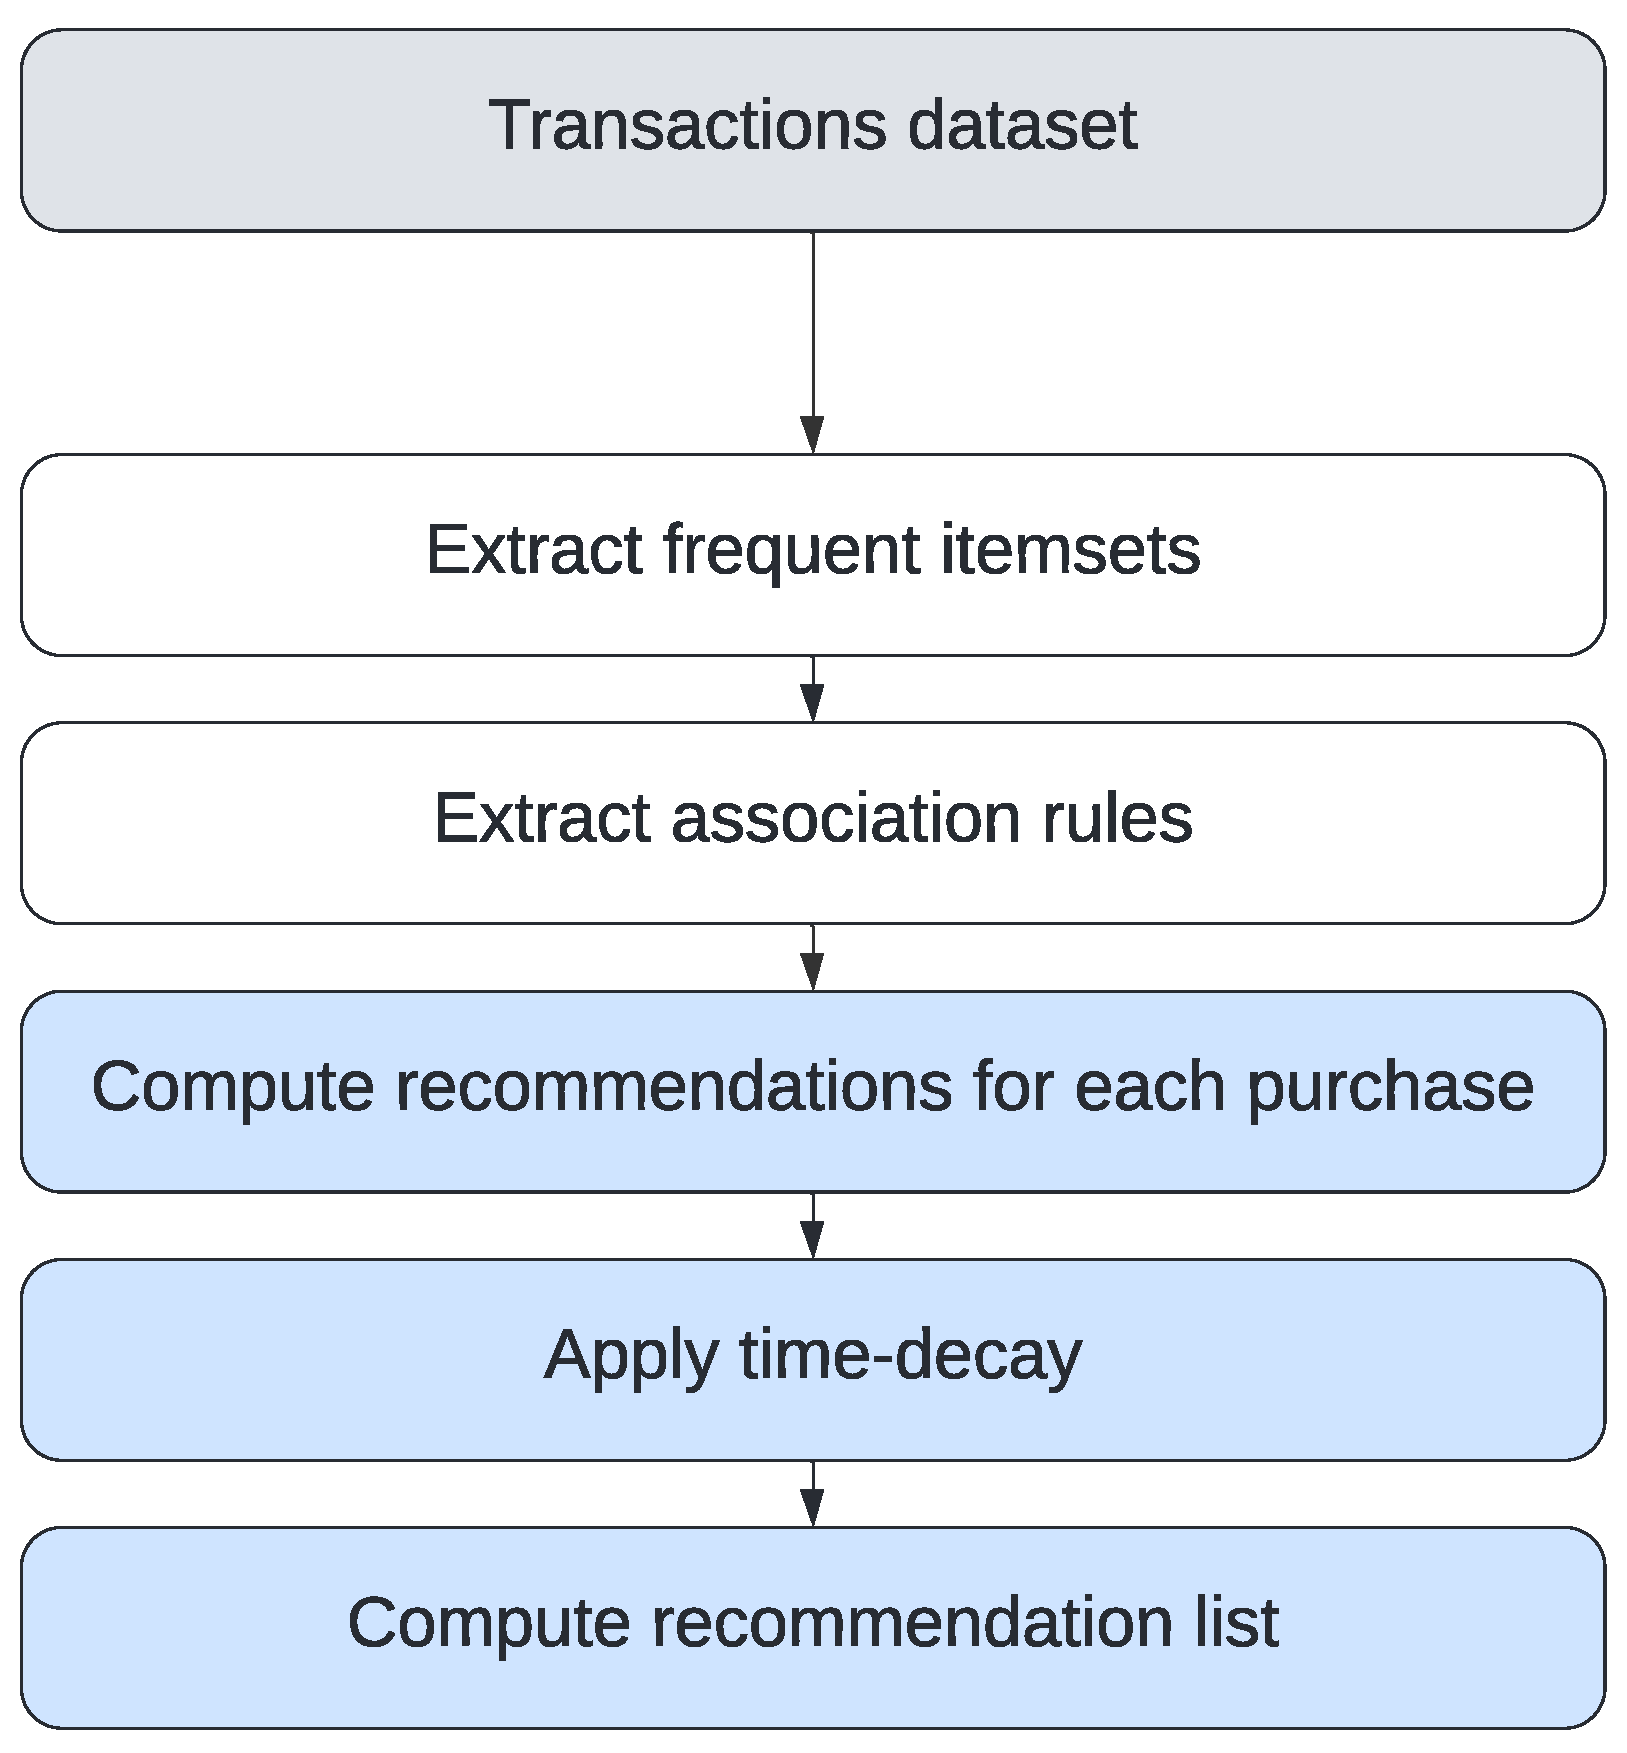
The MBA-based RS (MR) is structured based on the transactional data. This analysis begins by combining the transactions of individual customers, considering each group of transactions as one basket and removing baskets of one item only from the analysis. Through this selection, it is possible to extract information regarding products frequently purchased by the same customer.
This model can be applied given any set of transactional data and is independent of ratings or feedback, only considering the existence of interactions. The approach is presented in Figure 4.
Figure 4.
Diagram of the MBA recommender system approach.
A minimum support of 0.01% and a minimum confidence of 0.1% are considered to perform the market basket analysis, extracting the frequent item sets association rules. The previously purchased items by a particular user are identified in the “antecedents” column of the association rule, selecting the respective “consequent” products as the recommendation, while using “confidence” as the value to represent the degree of relationship between items. The time-decay aspect is considered by multiplying the “confidence” value by the scaled date of transaction of the respective “antecedent” item. For each purchased item, considered an “antecedent”, the list of the respective “consequent” will be selected as recommended items. The final recommendation list for each customer is obtained by calculating the average similarity coefficient of the various recommended items obtained from each of the customer’s purchases.
4.5. Hybrid Recommender System Model
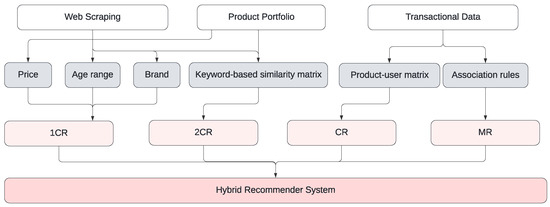
For the final hybrid RS, combinations of all four of the previously described models are explored. By considering product content, user–item interactions and association rules, the hybrid system circumvents the limitations of the cold-start cases, benefiting from the extraction of different types of information, thus improving relevance and accuracy. Additionally, by extracting recommendations from each individually purchased product with an item-based approach, the total number of purchases is irrelevant and not a limiting factor for the model, making the system ideal for cold-start users. Moreover, the consideration of time-decay allowed for the extraction of current, relevant, and dynamic recommendations.
The adopted system design is a weighted hybrid design. This selection is based on simplicity and speed, while also considering the reach limitations of each individual recommender within a cold-start context. The weights associated with each system are defined after an analysis of the impact of each individual system during the training phase, to be considered as hyper-parameters. Products with high similarity coefficients in several systems result in higher overall similarity coefficients, increasing the robustness of the RS. Considering the system’s requirements, the six products associated with the highest similarity coefficient are extracted, obtaining a recommendation list for a particular user. An overview of the structure of the hybrid RS is presented in Figure 5.
Figure 5.
Diagram of the hybrid recommender system approach.
4.6. Evaluation
The selection of the most adequate evaluation metrics is based on the commonly adopted metrics in the revised literature, considering that the transactional dataset contains no explicit or implicit rating. Therefore, the proposed system is evaluated through a set of defined metrics: Hit Rate, Portfolio Coverage, Average Price, and Standard Deviation of Price. These metrics are the basis for the adjustment of hyper-parameters, i.e., the selection of inputs, matrix sizes considered in intermediate calculations, and the weighted sum in the hybridisation step.
The Hit Rate, computed using expression (1), is defined as the percentage of predicted purchases. This measure aids in understanding the relevance of the RS’s output through its predictive power, although it does not consider the direct effect of the recommendation, given that the user did not receive it.
The ability to cover a high percentage of the portfolio is an important measure of a RS, as it indicates the reach of the system. The portfolio coverage was thus calculated using expression (2). A high Portfolio Coverage results in a broader range of recommended items, introducing novelty and variety from the user’s perspective, thus avoiding a repetitive and general recommendation.
The Average Price and Standard Deviation of Price measures serve to understand eventual trends of biases existent in the model when comparing with the metrics of the dataset. Additionally, the computational time is considered throughout the comparison of various compositions due to the necessity of providing recommendations on a regular basis—speed being a significant factor to consider.
4.6.1. Baseline Recommender System
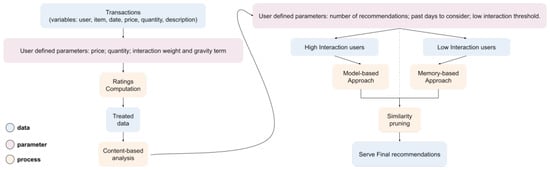
The RS previously applied to the business case is presented in detail in Ref. [22], consisting of a cascade-hybrid recommender system customisable for each particular retailer. This will be considered the baseline RS, providing guideline values for the evaluation metrics. A diagram summarizing the cascade-hybrid approach is presented in Figure 6. The recommender’s first level, culminating in the content-based approach, consists of filtering and ranking functions, providing an initial filtration of items. The second level further ranks the items using alternative collaborative filtering approaches for high and low interaction users, either model-based or memory-based, resulting in the final recommendation list.
Figure 6.
Diagram of the cascade-hybrid recommender system [22].
Further detailing the adopted methodology, the content-based approach employs Natural Language Processing (NLP), analysing item descriptions. The pre-computing process includes three phases. Firstly, a vectorised keyword representation is formulated to extract and represent features. Secondly, a user-specific model analyses previous transactions, associating each user with a series of items; similarity between items is calculated based on the cosine distance metric. Finally, the previously extracted information is used to provide item recommendations for specific users.
With a focus on the cold-start user segment, a memory-based system was developed comprising item classification using the K-nearest neighbours algorithm—a supervised learning classifier. This algorithm adopts the inverse logic of the model-based approach, identifying the similarity between items based on transactional data, categorised as item-based collaborative filtering. Relying only on identified relations between items previously purchased by a particular user, a low number of interactions causes a low impact in the RS’s performance, proving itself suitable for cold-start users.
Additionally, the model includes a time-decay approach for the computation of implicit ratings. This rating contemplates the number of units purchased and the price of the product, introducing the time-decay element that rewards recent events. The consideration of the number of purchased units increases the rating for items that were purchased multiple times, while the product’s price contemplates the user’s willingness to purchased higher priced products as an indicator of a stronger preference. The time-decay element adjusts the ratings according to the decay of the relevance of ratings, dependant on each specific market.
4.6.2. Training and Testing Phases
Different versions of the recommender are tested during the training phase, using a sample of 1000 cold-start users, which is roughly equivalent to the number of cold-start users whose last purchased occurred within one day. The first step consists of evaluating the impact of variations in the input data for each individual system. Secondly, the variation of the similarity coefficient matrix size to consider in intermediate phases was explored. At a final stage, the variation of the relative model weight was explored for each individual system.
The testing phase consisted of selecting a sample of 1000 recommendations generated for cold-start users by the baseline RS and comparing it to the recommendations generated by the developed RS. The performance of the RS is assessed through this comparison.
5. Results and Discussion
The final RS is defined through the evaluation and comparison of a series of experiments, considering various combinations of hyper-parameters, as presented in Section 4. The defined evaluation metrics are the following: Hit Rate, Portfolio Coverage, Average Price and Standard Deviation of Price.
Regarding the first step of the training phase, based on the input data, a variation in the content-based inputs and the number of days to consider from the transactional dataset is performed, presented in Table 3. It is concluded that, regarding the 1CR, the full combination of inputs provided the best performance based on the hit rate, 1.8%, with the highest impact resulting from the brand category, the lack of this variable resulting in a hit rate of 0.5%. The 2CR, using as input the correlation matrix extracted from descriptive keywords, exhibited low predictive power, with a hit rate of 0.4%, indicating a possible user preference for a higher variety of products. The CR demonstrated a slight increase of hit rate through the increase of the transactional dataset’s size, from 2.2% to 2.8%, although the computational cost is significant, increasing from 37 s to 806 s. The MR demonstrated low sensitivity versus the size of the transitional dataset, with the highest hit rate, 3.0%, being associated with three days worth of transactional data.
Table 3.
Evaluation of input combinations.
The second step involves the exploration of higher similarity coefficient matrix size, considering each model individually, represented in Table 4. It can be concluded that an increase in the matrix size causes only small improvements in the hit rate for the 1CR, from 1.9% to 2.0%, at a high computational cost, from 60 s to 1058 s. Regarding the 2CR, a considerable increase in the hit rate is observed, from 0.9% to 2.3%, although the computational time also increases substantially, from 60 s to 974 s. For the CR and MR, a significant increase in hit rate and portfolio coverage was observed when using the full intermediate matrices, reaching 5.1% and 4.6% in hit rate and 9.4% and 6.3% in portfolio coverage, with a relatively small a trade-off in computational time, reaching 543 s and 88 s.
Table 4.
Evaluation of similarity coefficient matrix size.
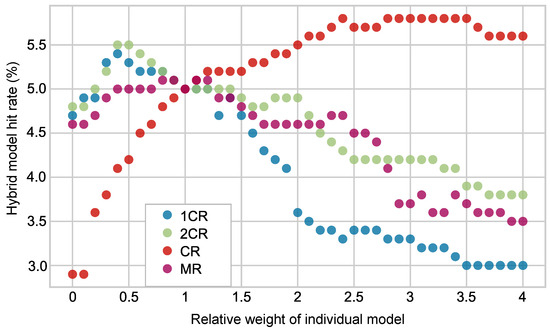
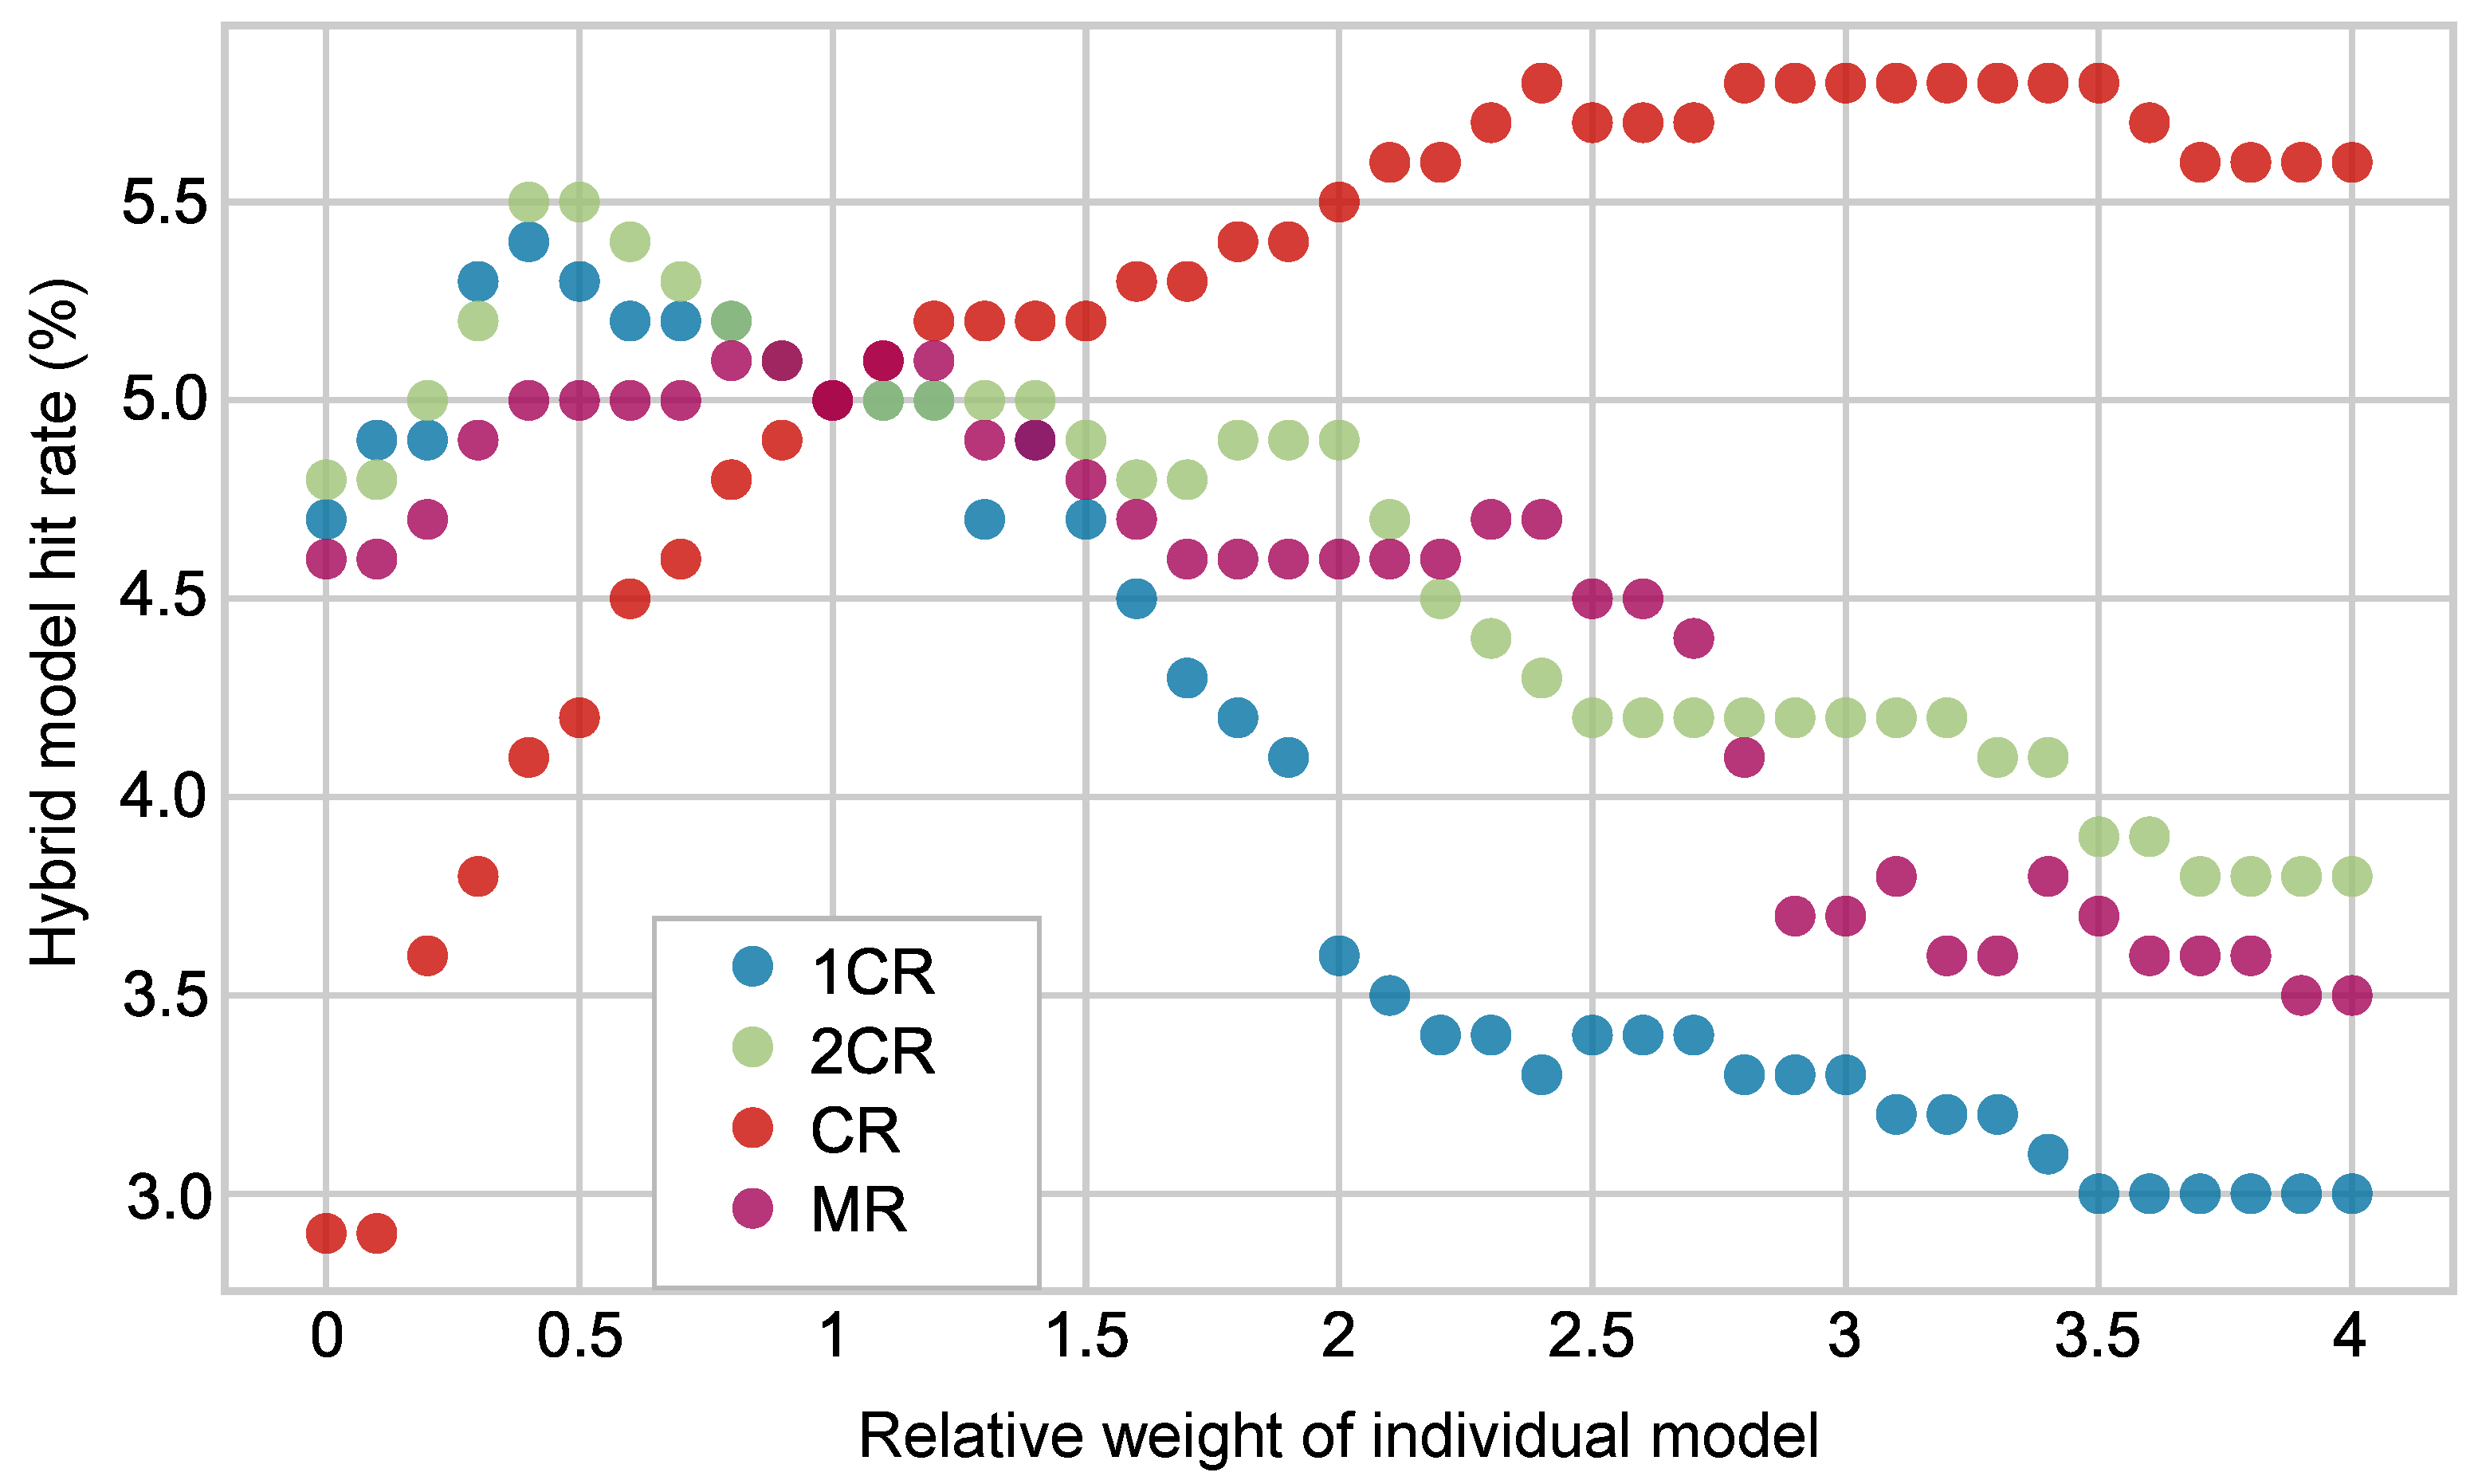
When exploring the hybridisation step, an initial computational study was performed to predict the impact of each individual RS in the final hybrid system. Figure 7 reproduces the results of the study, where the relative weight of each individual model varied from 0 to 4, evaluating the impact of this variation in the model hit rate. Expressing each weight in the corresponding percentage, 0 is equivalent to 0%, 1 to 25%, 2 to 40%, 3 to 50%, and 4 to 57%. It can be concluded that the 1CR and 2CR are associated with a higher performance when its weight is lower than the remaining systems, although it is higher than zero. The CR performs better at a higher weight and the MR performs well at a weight around one. Considering the obtained results, a possible distribution of each system has been defined as 15% for the 1CR, 15% for the 2CR, 45% for the CR, and 25% for the MR. Through the exploration of the hybrid RS, it could be observed that the hybridisation unavoidably results in higher computational times, although the impact in the rest of the evaluation metrics is positive, leading to a considerable increase in hit rate and a small decrease portfolio coverage.
Figure 7.
Impact of the variation of the relative weight of each individual model in the hybrid model hit rate.
Through the comparison of the various combinations evaluated through the training sample, the final hybrid RS was defined as using the transactional dataset including the three most recent days, intermediate similarity coefficient matrices of size 1000 for the 1CR and 2CR, and the full matrices for the CR and MR, combined using a weighted parallelised design, attributing the weights of 15% to the 1CR, 15% to the 2CR, 45% to the CR and 25% to the MR. Our study concluded that the 1CR and 2CR are associated with a higher performance when its weight is lower than the remaining systems. The CR performs better at a higher weight and the MR performs well at a medium weight.
The comparison with the baseline was performed using the recommendations dataset. Selecting a random sample containing 1000 cold-start users from the recommendations dataset, the testing sample, the first six recommendations were compared with the customer’s actual next purchase, thus extracting the evaluation metrics presented in Table 5. The same testing sample was used to obtain recommendations from the developed hybrid RS, resulting in the evaluation metrics presented in Table 6. It can be concluded that the developed hybrid RS resulted in over a five-fold increase in the hit rate, at the cost of a decrease of portfolio coverage of almost four-fold. The final RS presented a higher average price and standard deviation of price, indicating a possible tendency in the previously adopted RS of selecting products from a particular price range.
Table 5.
Evaluation of baseline.
Table 6.
Evaluation of final RS.
6. Conclusions and Future Work
The aim of the presented study was to propose an approach capable of improving recommendations for cold-start users, overcoming a recurrent issue that contains no single, global solution. The selected business case suffered particularly from this problem, with 58.9 % of the customers having only made 3 or fewer purchases in the last 12 months of the analysed data, with a short product life cycle intensifying the issue. It was assumed that the customers’ behaviour is relatively consistent (previous behaviour is a good predictor of future behaviour). The developed hybrid RS tackled the cold-start user problem through the combination of various techniques, resulting in a responsive, robust, and adaptable model, leveraging quality data to distinguish hidden patterns and obtain user-focused recommendations. The broad range and high recency of the data fuelling the RS results in robustness of model. The RS is adaptable to different business cases due to the simplified design and the usage of typically reliable and easily obtainable data.
The development of the RS showed the impact of employing a time-decay aspect into the model. Transactional data decline in relevance at an extremely high rate, due to both a constant increase and substitution of products within the portfolio, but also a progression of user behaviour and preference, notable in the market under analysis. Moreover, the model’s flexibility and its ability of providing a high variety of recommendations is meaningful from a customer relationship management point of view, providing a sense of novelty to the customer while being highly responsive to the user characteristics. On that topic, there is typically a trade-off between a higher hit rate and a higher portfolio coverage, requiring a prior definition of priorities and adjustment of the RS accordingly.
In terms of limitations, the model only considers the latest three days of the transactional dataset, focusing on trends and seasonality rather than a long-term view. The model cannot be manually adjusted (for example, forcing it to recommend Christmas presents in December). It is solely a recommendation system, with no operational idea, commission maximization, commercial pressure, etc.
The hybrid RS proposed can have significant managerial implications. By effectively addressing the cold start problem of new users, the hybrid RS will enable to quickly engage new users. This means a reduction in the time it takes for users to find relevant content or products, which results in higher user satisfaction and retention rates. In addition, the promising results of this study show that the proposed system will enable companies to tailor their offerings to better meet users’ needs and preferences. This, in turn, can result in increased conversions, higher sales, and a better return on investment for marketing campaigns.
In what regards future work, further adaptations of the RS may be performed, adjusting the model to specific business requirements. Possible adjustments to the recommendation may include setting limits on product prices or number of previous purchases per product, providing recommendations within a certain price range or maturity level. Different combinations of the developed models may be explored, adapting the weights of the parallelised hybrid design, while additional products may be added to the final recommendation list, such as the inclusion of a randomly selected product within the recommendation list.
Moreover, additional evaluation methods are required to better measure the impact of the developed RS obtained through the online testing exercise. The introduction of the opening and the click-through rate are highly relevant for understanding the captivating power of the recommendations, demonstrating relevance regardless of whether or not the recommendation leads to a subsequent purchase.
Additionally, it must be mentioned the importance of a continuous adjustment of the model in order for the system to sustain its relevance. Further hybridisation designs may be studied to further improve the presented RS, while supplementary methods may extract additional information from the existing data. Although perfection is impossible to reach and no recommender will ever be complete, the ability to strive for deeper understanding and surpass previous achievements is unlimited.
To conclude, it is also important to emphasise that while validating our recommender system within a specific setting demonstrated its potential and initial effectiveness, it is important to recognise the limitations arising from this restricted validation. In order to establish the robustness, generalisability and adaptability of the system, future efforts should focus on broader testing and validation in different settings.
Author Contributions
Conceptualization, L.F. and I.P.; methodology, L.F.; software, L.F.; validation, V.M., I.P. and E.e.O.; formal analysis, V.M., I.P. and E.e.O.; investigation, L.F.; resources, L.F. and I.P.; data curation, L.F. and I.P.; writing—original draft preparation, L.F.; writing—review and editing, V.M., I.P. and E.e.O.; visualization, L.F.; supervision, V.M., I.P. and E.e.O.; project administration, I.P.; funding acquisition, I.P. All authors have read and agreed to the published version of the manuscript.
Funding
This research received no external funding.
Institutional Review Board Statement
Not applicable.
Informed Consent Statement
Not applicable.
Data Availability Statement
Data is owned by E-goi and it is available on request due to privacy.
Acknowledgments
The authors gratefully acknowledge the Portuguese company E-goi for trusting and allowing us to develop this project, with particular acknowledgement to Fábio Fernandes for the continuous support and endorsement of the project, and to Duarte Coelho, Miguel Rebelo, and Carolina Araújo for the provided suggestions and technical support.
Conflicts of Interest
Authors Leonor Fernandes and Ivo Pereira were employed by the company E-goi. The remaining authors declare that the research was conducted in the absence of any commercial or financial relationships that could be construed as a potential conflict of interest.
Abbreviations
The following abbreviations are used in this manuscript:
| GDPR | General Data Protection Regulation |
| MBA | Market Basket Analysis |
| ML | Machine Learning |
| NLP | Natural Language Processing |
| RS | Recommender Systems |
| SVD | Single Value Decomposition |
| TF-IDF | Term Frequency-Inverse Document Frequency |
References
- Dash, G.; Chakraborty, D. Digital Transformation of Marketing Strategies during a Pandemic: Evidence from an Emerging Economy during COVID-19. Sustainability 2021, 13, 6735. [Google Scholar] [CrossRef] [Scilit]
- Alantari, H.; Currim, I.; Deng, Y.; Singh, S. An empirical comparison of machine learning methods for text-based sentiment analysis of online consumer reviews. Int. J. Res. Mark. 2022, 39, 1–19. [Google Scholar] [CrossRef] [Scilit]
- Duarte, V.; Zuniga-Jara, S.; Contreras, S. Machine Learning and Marketing: A Literature Review; SSRN Scholarly Paper ID 4006436; Social Science Research Network: Rochester, NY, USA, 2022. [Google Scholar] [CrossRef] [Scilit]
- Paulo, M.; Miguéis, V.L.; Pereira, I. Leveraging email marketing: Using the subject line to anticipate the open rate. Expert Syst. Appl. 2022, 207, 117974. [Google Scholar] [CrossRef] [Scilit]
- Liu, Z.; Ma, B.; Liu, Q.; Xu, J.; Zheng, B. Heterogeneous Graph Neural Networks for Large-Scale Bid Keyword Matching. In Proceedings of the International Conference on Information and Knowledge Management, Queensland, Australia, 1–5 November 2021; pp. 3976–3985. [Google Scholar] [CrossRef] [Scilit]
- Farmania, A.; Elsyah, R.D.; Tuori, M.A. Transformation of CRM Activities into e-CRM: The Generating e-Loyalty and Open Innovation. J. Open Innov. Technol. Mark. Complex. 2021, 7, 109. [Google Scholar] [CrossRef] [Scilit]
- Rust, R.T.; Huang, M.H. The Feeling Economy How Artificial Intelligence Is Creating the Era of Empathy. Revija za Socijalnu Politiku 2021, 28, 438–441. [Google Scholar]
- Sawaftah, D.; Aljarah, A.; Lahuerta-Otero, E. Power Brand Defense Up, My Friend! Stimulating Brand Defense through Digital Content Marketing. Sustainability 2021, 13, 10266. [Google Scholar] [CrossRef] [Scilit]
- Viktoratos, I.; Tsadiras, A. A Machine Learning Approach for Solving the Frozen User Cold-Start Problem in Personalized Mobile Advertising Systems. Algorithms 2022, 15, 72. [Google Scholar] [CrossRef] [Scilit]
- Padilla, N.; Ascarza, E. Overcoming the Cold Start Problem of Customer Relationship Management Using a Probabilistic Machine Learning Approach. J. Mark. Res. 2021, 58, 981–1006. [Google Scholar] [CrossRef] [Scilit]
- Darmody, A.; Zwick, D. Manipulate to empower: Hyper-relevance and the contradictions of marketing in the age of surveillance capitalism. Big Data Soc. 2020, 7, 2053951720904112. [Google Scholar] [CrossRef] [Scilit]
- Ricci, F.; Rokach, L.; Shapira, B. Recommender Systems Handbook, 2nd ed.; Springer: New York, NY, USA, 2015. [Google Scholar]
- van Capelleveen, G.; Amrit, C.; Yazan, D.M.; Zijm, H. The recommender canvas: A model for developing and documenting recommender system design. Expert Syst. Appl. 2019, 129, 97–117. [Google Scholar] [CrossRef] [Scilit]
- Singla, R.; Gupta, S.; Gupta, A.; Vishwakarma, D.K. FLEX: A Content Based Movie Recommender. In Proceedings of the 2020 International Conference for Emerging Technology (INCET), Belgaum, India, 5–7 June 2020; pp. 1–4. [Google Scholar] [CrossRef] [Scilit]
- Deldjoo, Y.; Schedl, M.; Elahi, M. Movie Genome Recommender: A Novel Recommender System Based on Multimedia Content. In Proceedings of the 2019 International Conference on Content-Based Multimedia Indexing (CBMI), Dublin, Ireland, 4–6 September 2019; pp. 1–4. [Google Scholar] [CrossRef] [Scilit]
- Shakirova, E. Collaborative filtering for music recommender system. In Proceedings of the 2017 IEEE Conference of Russian Young Researchers in Electrical and Electronic Engineering (EIConRus), St. Petersburg and Moscow, Russia, 1–3 February 2017; pp. 548–550. [Google Scholar] [CrossRef] [Scilit]
- Son, L.H. HU-FCF: A hybrid user-based fuzzy collaborative filtering method in Recommender Systems. Expert Syst. Appl. Int. J. 2014, 41, 6861–6870. [Google Scholar] [CrossRef] [Scilit]
- Laseno, F.U.D.; Hendradjaya, B. Knowledge-Based Filtering Recommender System to Propose Design Elements of Serious Game. In Proceedings of the 2019 International Conference on Electrical Engineering and Informatics (ICEEI), Bandung, Indonesia, 9–10 July 2019; pp. 158–163. [Google Scholar] [CrossRef] [Scilit]
- Liang, B.; Xu, B.; Wu, X.; Wu, D.; Yang, D.; Xiao, Y.; Wang, W. A Community-Based Collaborative Filtering Method for Social Recommender Systems. In Proceedings of the 2019 IEEE International Conference on Web Services (ICWS), Milan, Italy, 8–13 July 2019; pp. 159–162. [Google Scholar] [CrossRef] [Scilit]
- Kbaier, M.E.B.H.; Masri, H.; Krichen, S. A Personalized Hybrid Tourism Recommender System. In Proceedings of the 2017 IEEE/ACS 14th International Conference on Computer Systems and Applications (AICCSA), Hammamet, Tunisia, 30 October–3 November 2017; pp. 244–250. [Google Scholar] [CrossRef] [Scilit]
- Gatzioura, A.; Vinagre, J.; Jorge, A.M.; Sànchez-Marrè, M. A Hybrid Recommender System for Improving Automatic Playlist Continuation. IEEE Trans. Knowl. Data Eng. 2021, 33, 1819–1830. [Google Scholar] [CrossRef] [Scilit]
- Rebelo, M.; Coelho, D.; Pereira, I.; Fernandes, F. A New Cascade-Hybrid Recommender System Approach for the Retail Market. In International Conference on Innovations in Bio-Inspired Computing and Applications; Springer International Publishing: Cham, Switerland, 2022; Volume 419, pp. 371–380. ISBN 9783030962982. [Google Scholar] [CrossRef] [Scilit]
- Shojaei, M.; Saneifar, H. MFSR: A novel multi-level fuzzy similarity measure for recommender systems. Expert Syst. Appl. 2021, 177, 114969. [Google Scholar] [CrossRef] [Scilit]
- Osadchiy, T.; Poliakov, I.; Olivier, P.; Rowland, M.; Foster, E. Recommender system based on pairwise association rules. Expert Syst. Appl. 2019, 115, 535–542. [Google Scholar] [CrossRef] [Scilit]
- Lu, W.; Altenbek, G. A recommendation algorithm based on fine-grained feature analysis. Expert Syst. Appl. 2021, 163, 113759. [Google Scholar] [CrossRef] [Scilit]
- Griva, A.; Bardaki, C.; Pramatari, K.; Papakiriakopoulos, D. Retail business analytics: Customer visit segmentation using market basket data. Expert Syst. Appl. 2018, 100, 1–16. [Google Scholar] [CrossRef] [Scilit]
- Portugal, I.; Alencar, P.; Cowan, D. The use of machine learning algorithms in recommender systems: A systematic review. Expert Syst. Appl. 2018, 97, 205–227. [Google Scholar] [CrossRef] [Scilit]
- Bellini, P.; Palesi, L.A.I.; Nesi, P.; Pantaleo, G. Multi Clustering Recommendation System for Fashion Retail. Multimed. Tools Appl. 2023, 82, 9989–10016. [Google Scholar] [CrossRef] [Scilit]
- Chen, C.C.; Lai, P.L.; Chen, C.Y. ColdGAN: An effective cold-start recommendation system for new users based on generative adversarial networks. Appl. Intell. 2023, 53, 8302–8317. [Google Scholar] [CrossRef] [Scilit]
- Patro, S.G.K.; Mishra, B.K.; Panda, S.K.; Kumar, R.; Long, H.V.; Taniar, D. Cold start aware hybrid recommender system approach for E-commerce users. Soft Comput. 2023, 27, 2071–2091. [Google Scholar] [CrossRef] [Scilit]
- Lu, Y.; Nakamura, K.; Ichise, R. HyperRS: Hypernetwork-Based Recommender System for the User Cold-Start Problem. IEEE Access 2023, 11, 5453–5463. [Google Scholar] [CrossRef] [Scilit]
- Whiten, A. Chapter Two—Conformity and over-imitation: An integrative review of variant forms of hyper-reliance on social learning. In Advances in the Study of Behavior; Naguib, M., Barrett, L., Healy, S.D., Podos, J., Simmons, L.W., Zuk, M., Eds.; Academic Press: Cambridge, MA, USA, 2019; Volume 51, pp. 31–75. [Google Scholar] [CrossRef] [Scilit]
- Paranavithana, I.; Rupasinghe, T.; Prior, D. Unsupervised Learning and Market Basket Analysis in Market Segmentation. In Proceedings of the World Congress on Engineering (WCE 2021), London, UK, 7–9 July 2021. [Google Scholar]
- Wirth, R.; Hipp, J. CRISP-DM: Towards a standard process model for data mining. In Proceedings of the 4th International Conference on the Practical Applications of Knowledge Discovery and Data Mining, Manchester, UK, 11–13 April 2000; Volume 1, pp. 29–39. [Google Scholar]
- Martínez-Plumed, F.; Contreras-Ochando, L.; Ferri, C.; Hernández-Orallo, J.; Kull, M.; Lachiche, N.; Ramírez-Quintana, M.J.; Flach, P. CRISP-DM Twenty Years Later: From Data Mining Processes to Data Science Trajectories. IEEE Trans. Knowl. Data Eng. 2021, 33, 3048–3061. [Google Scholar] [CrossRef] [Scilit]
- Sparck Jones, K. A statistical interpretation of term specificity and its application in retrieval. J. Doc. 1972, 28, 11–21. [Google Scholar] [CrossRef] [Scilit]

Disclaimer/Publisher’s Note: The statements, opinions and data contained in all publications are solely those of the individual author(s) and contributor(s) and not of MDPI and/or the editor(s). MDPI and/or the editor(s) disclaim responsibility for any injury to people or property resulting from any ideas, methods, instructions or products referred to in the content. |
© 2023 by the authors. Licensee MDPI, Basel, Switzerland. This article is an open access article distributed under the terms and conditions of the Creative Commons Attribution (CC BY) license (https://creativecommons.org/licenses/by/4.0/).