Abstract
The effectiveness of a cruise ship’s emergency evacuation is greatly influenced by the way people interact; this paper uses the social force model to simulate two different evacuation scenarios considering the impact of small groups. It uses an agent to simulate the behavior of a single occupant, and leverages the social force model to quantify the effect of group behavior on the group members. According to the influence of the group on the members, this paper corrects the expected speed of the members to determine the speed of crowd evacuation. It uses the SAFEGUARD cruise ship as the evacuation platform to simulate the process of evacuating the passengers to the boarding station and assembly station, respectively, and calculates the evacuation time, congestion area, and congestion duration of passengers under the action of groups. The simulation results of the two scenarios show that the group effect increases the average evacuation time by 15.29% and 21.79%, and increases the average detour distance by 24.54% and 17.89%, respectively.
1. Introduction:
The cruise industry is experiencing growth due to the rapid development of the marine tourism industry. Large cruise ships are characterized by their high passenger capacity, intricate internal structure, limited passageways, and limited exits. In the event of an emergency such as fire or flooding on a large cruise ship, heavy casualties may be caused, and passengers have to abandon the ship and board the lifeboat. For example, in 2021, a fire broke out on the luxury cruise ship Omar Khayyam on the Nile River in Egypt, causing the entire ship to be engulfed in flames and passengers were forced to abandon the ship. Fortunately, due to timely evacuation, there were no casualties. In 2021, a passenger ship caught fire while in transit in Bangladesh, leading to several casualties. At least 38 people died and over 200 were injured as a result of delayed rescue efforts and evacuation. Thus, establishing a model for passenger evacuation is crucial in effectively assessing and enhancing the safety of such evacuations on cruise ships.
Many scientists conducted research on ship evacuation routes, taking into account the effects of personnel loads and evacuation distances. Zheng et al. [1] used the shortest path and genetic algorithms to acquire optimal evacuation plans with the goal of reducing congestion. Yu et al. [2] used the equivalent shortest path algorithm to determine the optimal evacuation path for passenger ship personnel, fully considering the ease of passage in each section. Liao et al. [3] optimized the evacuation routes of pedestrians departing from different locations using a genetic algorithm and found that the shortest path is not necessarily the optimal path for ship personnel evacuation. Qiao et al. [4] proposed a method for determining the optimal evacuation path considering distance factors, channel congestion levels, and personnel behavior, which significantly improved passenger evacuation efficiency. Guo [5] established an evacuation model for small groups of people, obtaining the optimal route for the point-to-point flow of small groups and improving evacuation efficiency. However, these studies mainly focus on the optimal paths for passenger evacuation, and insufficient research was conducted on the selection of quasi-safe areas for ship personnel evacuation.
The macro model focuses on the overall pedestrian flow in crowd evacuation activities. It draws on the laws of fluid mechanics and mainly studies the relationship between the macroscopic statistical parameters (speed, flow, and density) of pedestrian flow. For the evacuation scenario, it mainly focuses on the configuration of the evacuation space and the distribution of people, without considering the details of the interaction between personnel and the influence of various elements in the facility on the movement of people, and focuses on analyzing the overall movement law of the pedestrian flow. Henderson first proposed a research model of microfluid dynamics [6], treating pedestrians as gas molecules and the movement of pedestrian flow as the movement of liquid. Q.Y. Hao et al. [7] proposed a gas model. Microscopic models focus on the individual behavior of pedestrians in crowd evacuation activities, considering various elements in the evacuation scenario. They specifically observe, record, extract, and analyze the microscopic characteristics of pedestrian groups in the scene. These models describe individual behavior in evacuation activities using mathematical formulas, logical judgments, or evolutionary rules. The microscopic models for cruise ship evacuation include Helbing’s social force model [8], the cellular automaton model [9,10], and the agent-based model [11,12]. The social force model converts the environmental impact on individuals into the force exerted on pedestrians by the environment and quantifies the influence of environmental information on pedestrian movement speed as the magnitude of the force. Previous studies [13,14,15] improved the classical social force model by optimizing the effects of crowd density and visual perception on personnel evacuation. Hu et al. [16] applied the microscopic model to simulate passenger evacuation in ship environments, specifically simulating the evacuation process during emergency situations. Wan et al. [17] used computer simulations to analyze the spatiotemporal patterns of pedestrian movement, considering factors such as panic and herd behavior, and proposed an improved social force pedestrian flow model. This model effectively captures the evacuation patterns of onlookers and assesses the safety of personnel evacuation. The aforementioned studies primarily focus on the influence of individual characteristics on crowd evacuation dynamics, with relatively limited consideration of the constraints and effects of small group tendencies within the crowd on overall evacuation.
During the evacuation process in various scenarios, pedestrian congestion occurs when individuals gather in a specific area, leading to increased crowd density and resulting in congestion and decreased pedestrian speed. As a result, many scholars conducted studies on localized congestion during evacuations. Zhang et al. [18] established a multi-objective and multi-level evacuation model for passenger ships using the fundamental theories of cellular automata. This model can simulate the evacuation process, accurately monitor changes in crowd density, and observe congestion. Cheng et al. [19] quantitatively analyzed the possibility of congestion propagation between grids and real-time variations in congestion locations using dynamic Bayesian networks. They applied measures to block congestion propagation paths and guided evacuees from the source to suppress congestion spread. Guo et al. [20] analyzed congestion areas in the evacuation process of a specific passenger ship using International Maritime Organization (IMO) standards. These studies focused on monitoring localized congestion areas and mitigating congestion. However, the influence of group factors on congestion areas and the duration of congestion was not sufficiently researched.
Studying the role of small groups in cruise ship evacuation is crucial as emergency evacuations involve both individuals evacuating independently and small groups of people. Several scholars conducted detailed research on the problem of congestion caused by group-behaved factors. For instance, Li et al. [21] established a behavior simulation model based on social force modeling to investigate the behavior of individuals in small groups in multi-exit venues, finding that the presence of small group factors hampers the evacuation process and reduces efficiency. Haghani M et al. [22] studied the influence of group size and horizontal pressure on group behavior through experiments, revealing that group size has a significant impact on pre-evacuation time and decision-making time. Zheng et al. [23] incorporated rules for conformity behavior and small group behavior into a cellular automaton model, discovering that small-scale small groups can facilitate orderly evacuation and improve efficiency, although excessive crowd density within groups leads to congestion and reduces efficiency. K. Kostas et al. [24] used the velos platform to simulate and analyze how crews assist passengers in evacuating and how passengers are divided into different groups, and investigated the effect of orderly command and small groups on improving evacuation efficiency. Ginnis, A.I. [25] used the enhanced crowd modeling approach employed in VELOS to model the social conventions of panic aspects and social conventions of inter-relations for evacuated people to simulate the reality of crowd behavior in emergency situations so that ships can be evaluated and analyzed for evacuation. Lu et al. [26] conducted evacuation simulations and established an extended cellular automaton (CA) model, finding that increased crowd density intensifies the negative impact of group behavior on evacuation. Fu et al. [27] investigated the relationship between assembly time, crowd velocity, and evacuation density, and concluded that larger group size exacerbates the negative impact on evacuation time. The focus of previous studies lies in the relationship between group dynamics and evacuation efficiency, pre-evacuation time, decision-making time, and crowd density. However, the impact of group factors on the evacuation of cruise ship personnel remains insufficiently studied. Therefore, this paper compares the impacts of the presence or absence of group effects on personnel evacuation from cruise ships.
The remainder of this study is structured as follows. Section 2 is devoted to the analysis of small group forces. Section 3 defines two evacuation methods and corrects the group evacuation speed. Section 4 presents the data of the cruise ship model and sets the initial parameters of the cruise ship simulation model. In Section 5, the two evacuation methods of the cruise ship are simulated with and without group effects, and the results are compared and discussed to analyze the effects of group effects on the evacuation parameters and congestion. Section 6 summarizes the research content of this paper.
2. Analysis of Small Group Behavior
In an unexpected situation, small group behavior is impacted by emotions, thoughts, choices, and the environment of other individual members within the group. In the process of evacuation, individuals tend to exhibit social behavior by giving priority to other group members, choosing evacuation speeds and paths that are consistent with their peers, and selecting the same evacuation exits. Additionally, during evacuation, group members actively adjust their movement speed to avoid getting separated from each other, resulting in almost all members arriving at the assembly area. If a member of the group deviates from the group, other members in the small group will spontaneously pause at their original location or return to search for the lost member. Helbing et al. [28] used the principle of mutual forces in mechanics to analyze the different forces that people are subjected to during movement. In the process of searching for and approaching the group partners, the members of a small group will mainly be affected by the driving force of the pedestrians themselves, the attraction and repulsion between pedestrians, and the repulsion force between pedestrians and obstacles.
2.1. Members’ Own Driving Forces
Self-propulsion is a type of inertia force that refers to pedestrians being driven and spontaneously moving towards their destination, and its main manifestation is that the pedestrian speed is expected to approach the maximum evacuation speed [29]. The self-propulsion of members can be expressed as Equation (1).
where is the nth member of the moment t your own driving force, is the quality of the nth member, respectively, and , , indicates the desired speed and the actual speed of the nth member at the moment t and hesitation time. is the expected direction of movement of the nth member at the moment by the real position of the member at the moment and the evacuation safety channel position , as shown in Equation (2).
2.2. People Forces
During the evacuation process, members of the group are often influenced by both internal members and external obstacles, internal group members’ attraction or avoidance behavior towards each other, or external stimuli [30,31]. The interaction force between group members is characterized by the attraction among internal members and the repulsion from external ones in order to prevent collisions, as shown in Equations (3) and (4)
where indicates the interaction force between personnel n and personnel m at the moment t, indicates the sum of the radius of personnel m and personnel n, and indicates the distance between personnel m and personnel n circle center. indicates the normal vector of personnel m and personnel n connecting direction. and ; for the given constants, indicates the velocity difference between personnel m and personnel n in the tangential direction.
With the step function to express the personnel m and personnel linear distance, stands for the personnel of the radius value and the difference between the two distances from the center of the circle. When the difference is less than 0, there is no interaction force between persons, as shown in the following Equation (5):
2.3. Obstacle Repulsion Force
This force is similar to the repulsive force between non-group members. During the evacuation process, group members will spontaneously avoid obstacles, which generates a repulsive force between the members and obstacles. This can be expressed as follows:
where is the interacting forces between the ith member and obstacle at moment , is the distance between member ith and obstacle in the normal vector direction, is the normal unit vector in the direction of the line between pedestrian ith and obstacle , and is the tangential unit vector in the direction of the line between pedestrian and obstacle .
3. Cruise Ship Personnel Evacuation Model Establishment
3.1. Cruise Ship Personnel Evacuation Stages and Evacuation Methods
According to the International Maritime Organization (IMO) MSC.1/Circ1533 circular [32] on the evacuation guidelines for new passenger ships and existing passenger ships issued by MSC, during the emergency situations, the area where passengers gather in an emergency is called the assembly station, and the boarding station is an area where passengers can board lifeboats. Each assembly station can serve multiple boarding stations and should be located close to them. On a cruise ship in an emergency, the crew instructs and directs passengers to follow emergency procedures. The crew first evacuates them to the assembly stations and then guides them to their respective boarding stations, and if necessary, organizes them to abandon ship procedures to board lifeboats. The emergency evacuation process on the cruise ship is divided into three parts as follows:
(1) Response duration (R): It is the duration that takes for people to react to the station. This duration begins upon initial notification (e.g., alarm) of an emergency and ends when the passenger accepted the situation and begins to move towards an assembly station.
(2) Total travel duration (T): it refers to the duration it takes for passengers to evacuate from an initial unsafe location to a relatively safe assembly station.
(3) Embarkation and launching duration (E): the maximum allowed duration is 30 min.
Therefore, the time to assemble is a crucial part of the evacuation process, which is vital for accurately assessing the safety performance of the cruise ship evacuations. The International Maritime Organization (IMO) established a time control standard for the emergency evacuation phase as described in Equation (8).
Among them, n represents the maximum allowed evacuation time. For passenger ships, it is 60 min for those with less than three levels, and 80 min for large ships with more than three levels. Therefore, the time taken to assemble is a crucial factor in determining the evacuation time, which is very important for accurately evaluating the safety performance of the evacuation personnel.
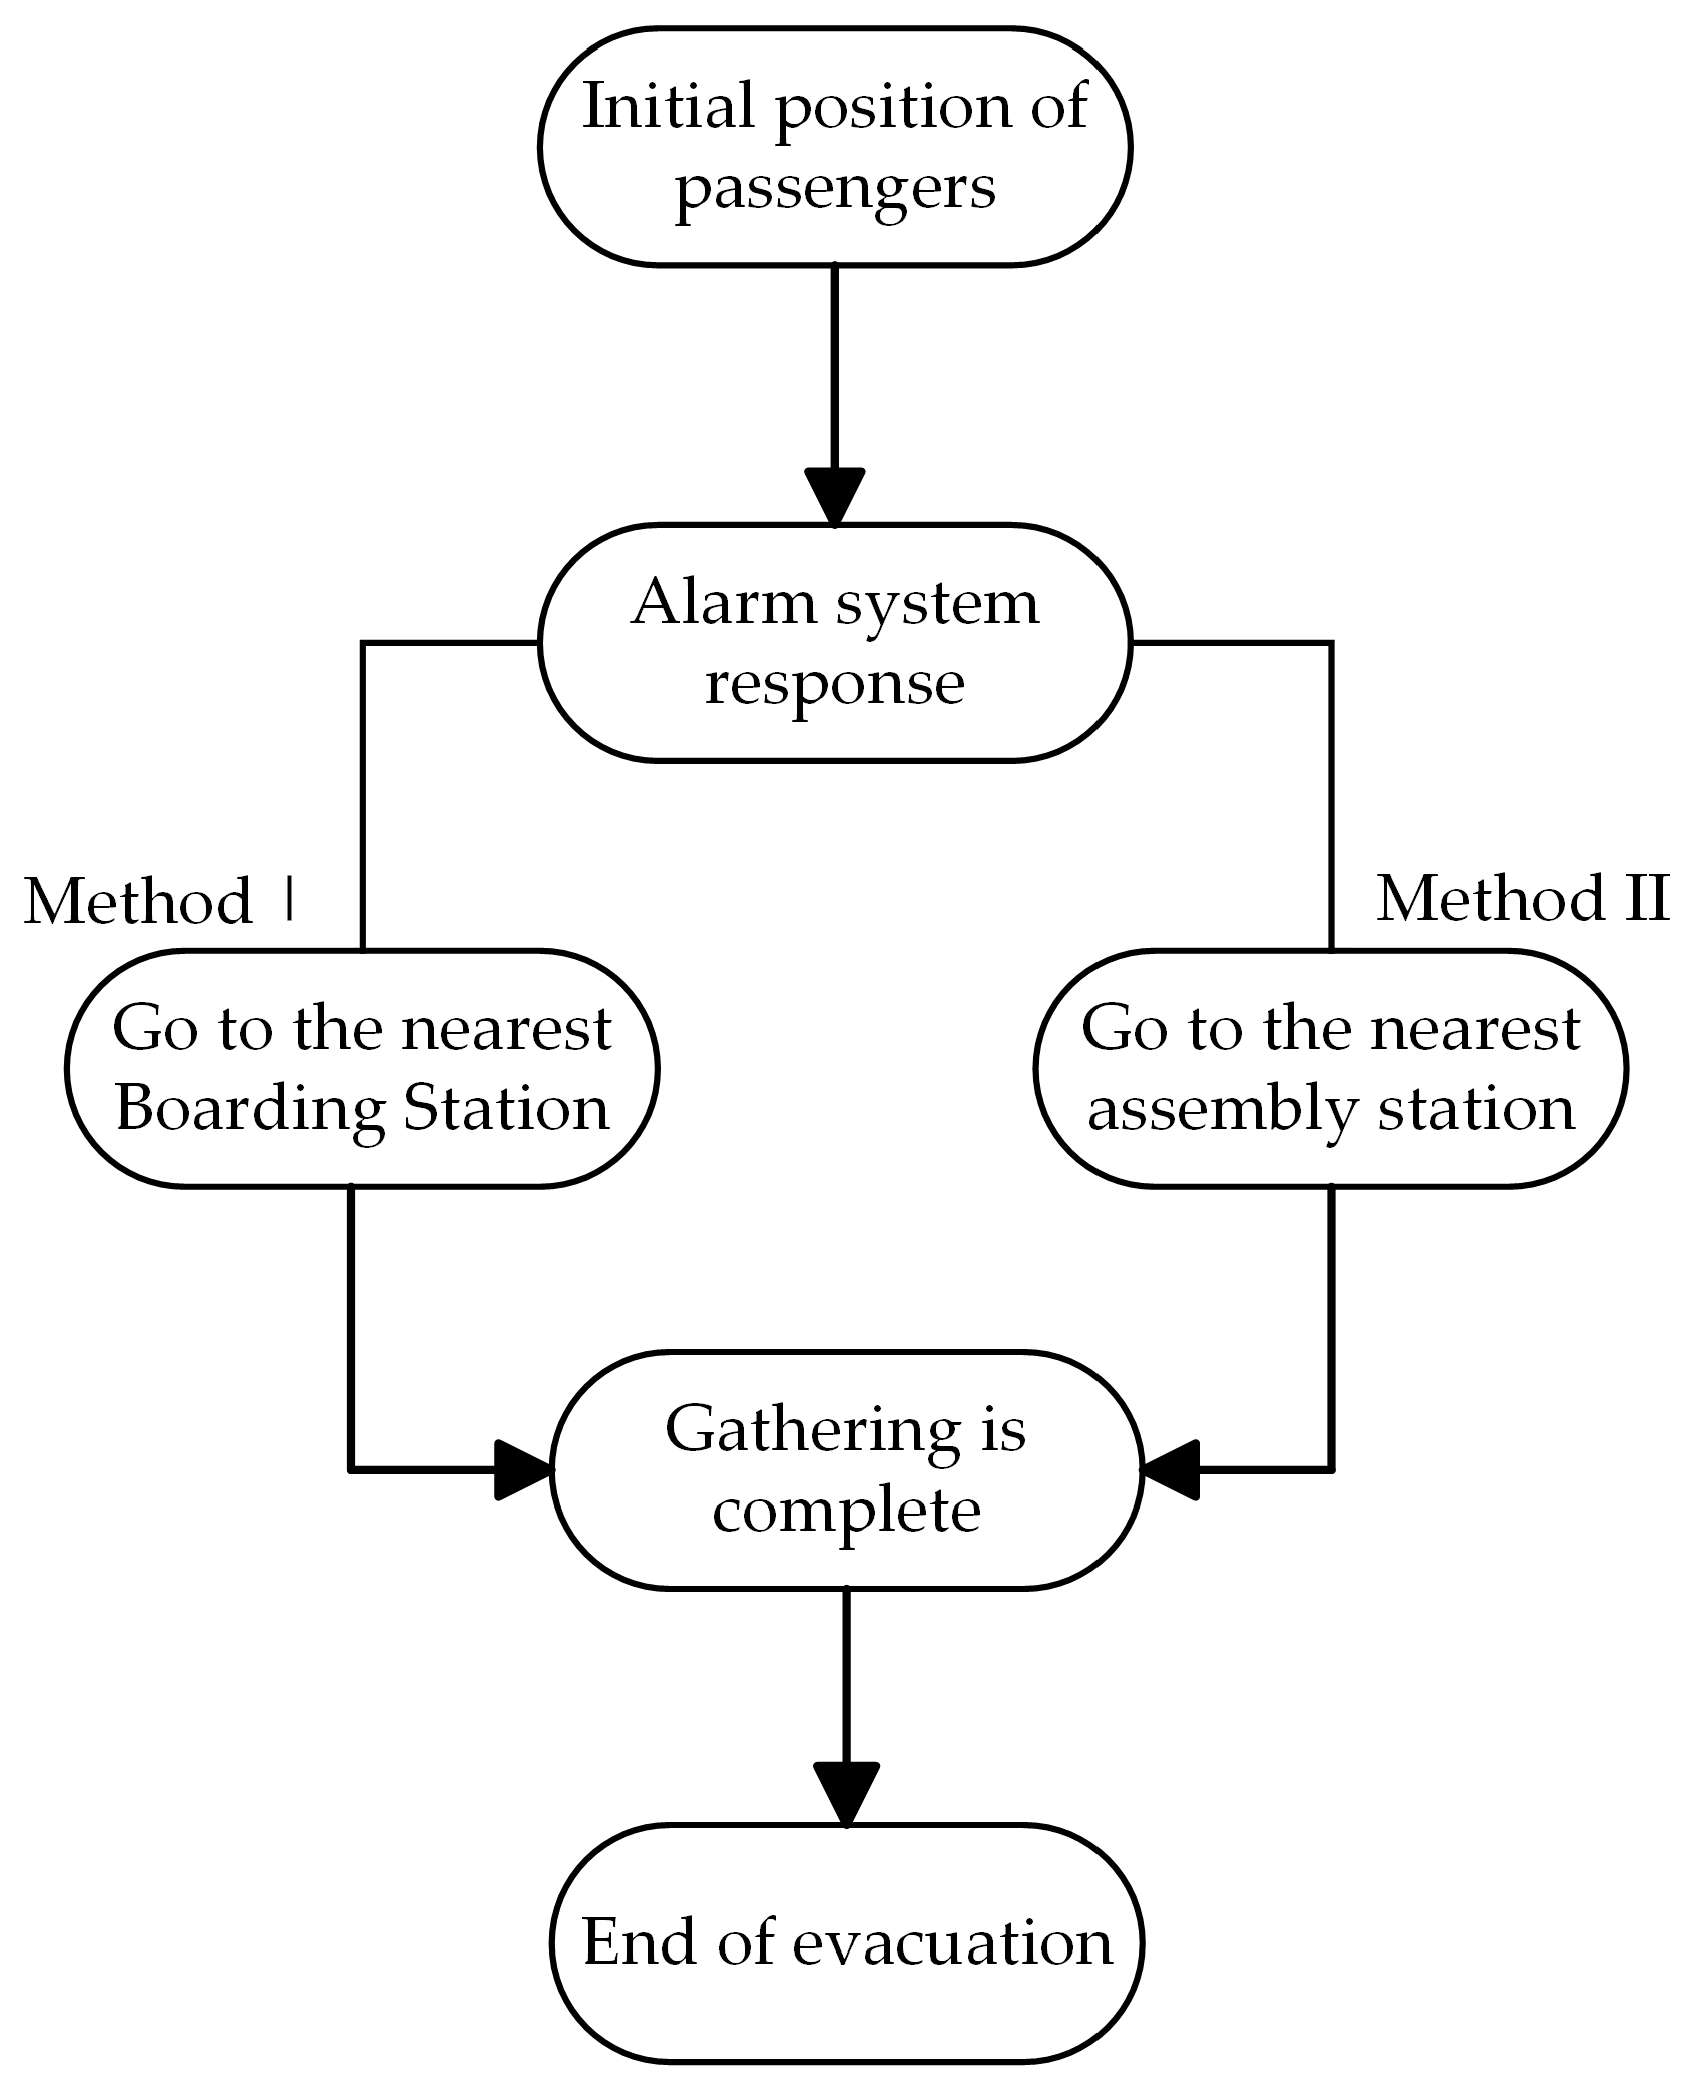
As shown in Figure 1, the passenger assembly method is divided into two categories in this paper:

Figure 1.
Two ways of evacuating passengers.
Evacuation method I: in the event of an escalation of incidents on the cruise ship, it requires immediate action to abandon the ship and direct passengers to move directly from their initial location to the boarding stations.
Evacuation method II: if the accident on the cruise ship does not exceed the accident limit range, and the cruise ship still has the ability to safely return, arrange for passengers to evacuate to the nearest assembly station.
3.2. Crowd Evacuation Speed Determination
In many emergency situations, the movement speed of a crowd is crucial for evacuation. The crowd is composed of individual passengers and various sized small groups. This study aims to analyze the speed of individual passengers, adjust the movement speed of members in small groups, and ultimately determine the overall movement speed of the evacuating crowd in order to construct an evacuation model for cruise ships.
(1) The calculation of individual evacuation speed includes self-propulsion, personnel force, repulsive forces between pedestrians and obstacles, and disturbance force [33,34]. Therefore, the kinematic equation for n personnel at moment is represented by Equation (9).
where is the disturbance force received by the nth passenger at moment , is the individual evacuation speed, and indicates the actual moving speed of person nth at time t.
(2) Speed correction for small groups: During the evacuation process, group members will spontaneously adjust their own movement speed in order to stay together with other group members and avoid getting separated. As a result, the expected speeds of group members remain relatively consistent, leading to similar arrival times at the assembly point.
The expected speed of person n during the evacuation process of small group members is represented by Equation (10).
where indicates the expected speed of the nth person at time t, k and j, respectively, indicate the number of people that belong to group i and other members of the small group, and indicates the expected speed of the other member j at time t.
(3) Determination of crowd evacuation speed: During the cruise ship evacuation, the crowd is composed of numerous individual passengers and different numbers of small groups. The expected speed of passenger is represented by .
where denotes small groups.
4. Cruise Ship Evacuation Simulation Model Construction
The interior of a large cruise ship can be divided into several areas according to different functions, and the internal structures of these areas differ greatly, such as cabins, corners, staircases, aisles, restaurants, and assembly areas A, B, C, and D. Among them, assembly stations B and C have the function of boarding stations. To guarantee evacuation data accuracy and personnel evacuation model rationality, this paper analyzes the spatial layout of the cruise ship, the characteristics of the personnel movement speed, and the distribution of the number of people in each area of the cruise ship.
4.1. Cruise Ship Model Data
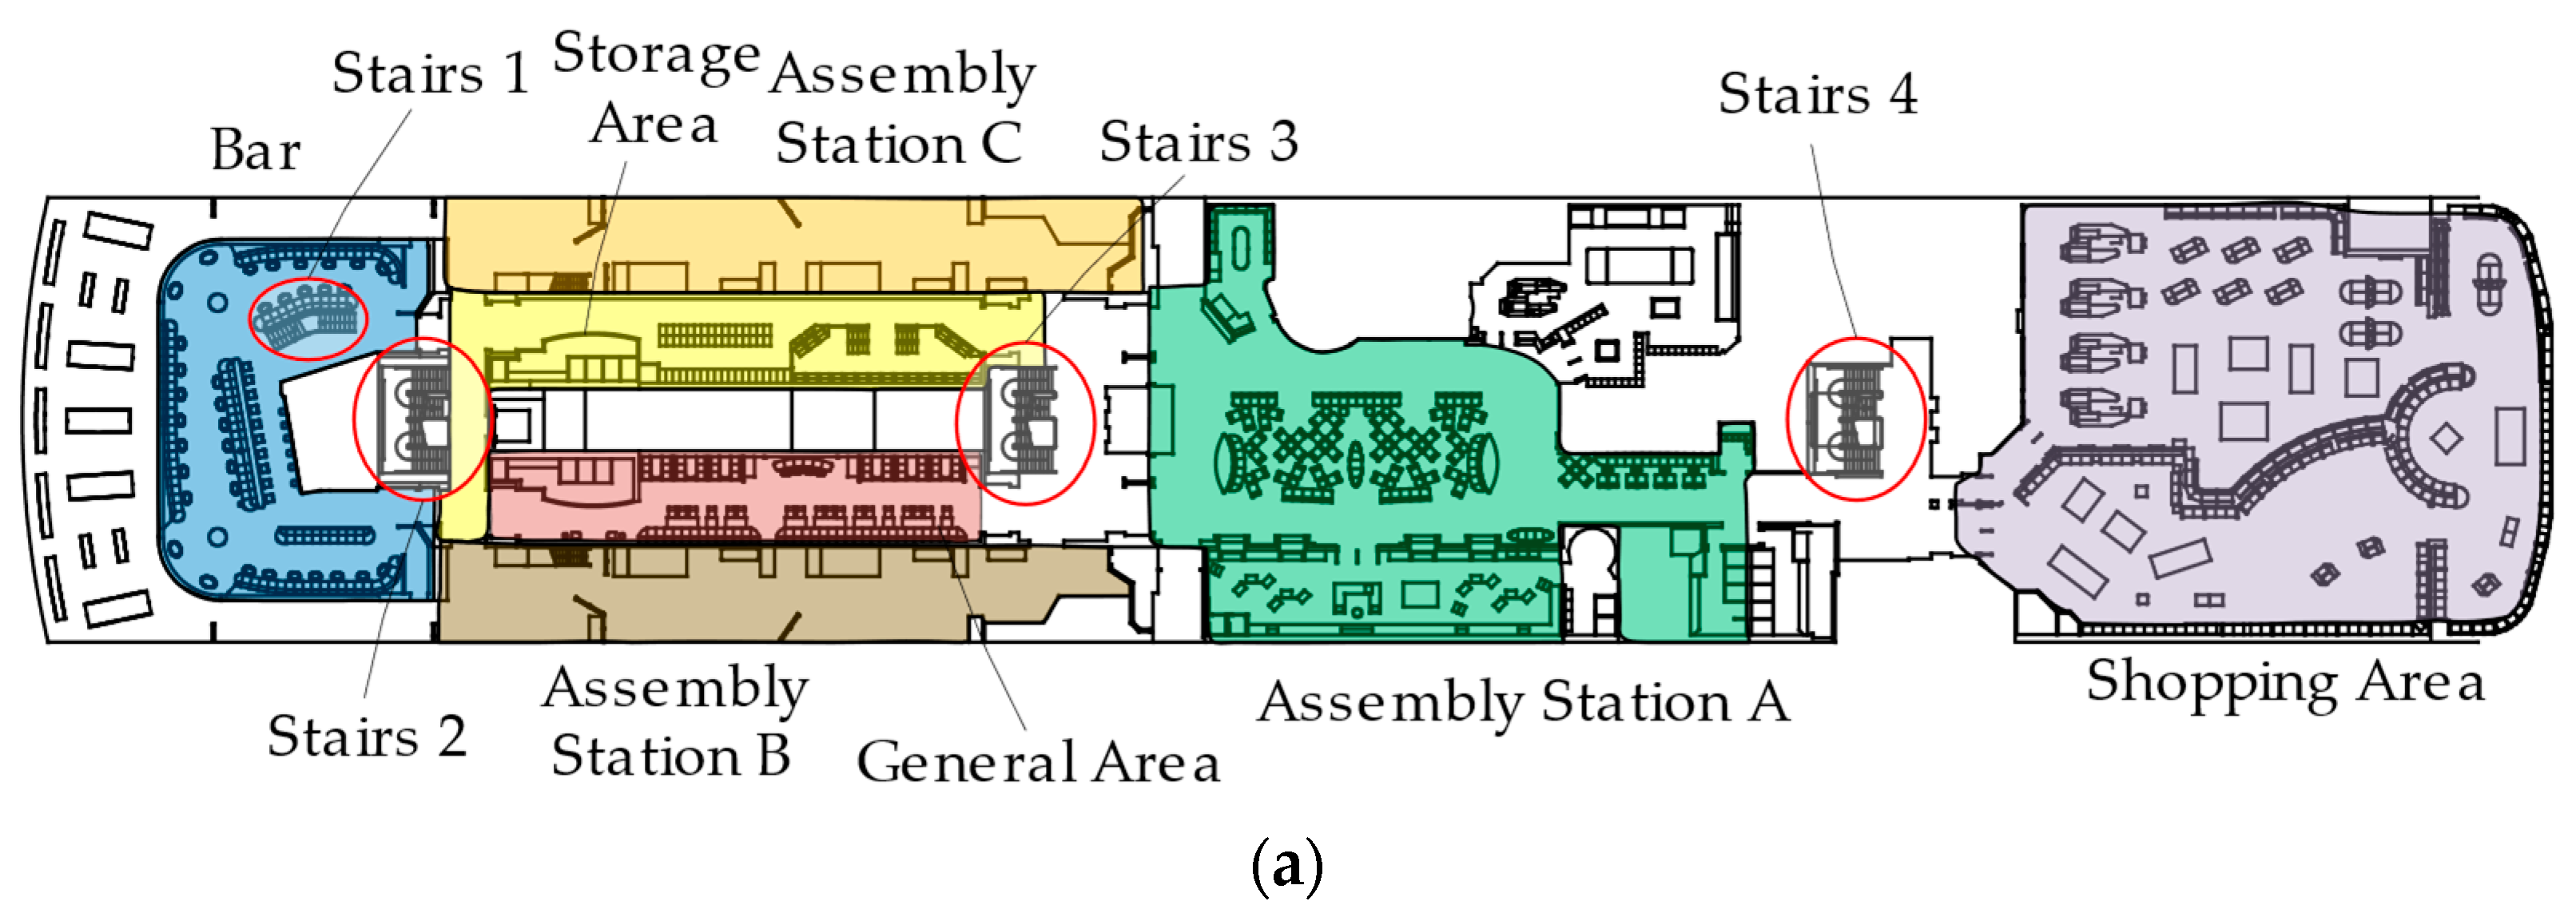
The European SAFEGUARD project is used as a model for cruise ship evacuation in this paper. The vessel comprises three decks. The first and second decks are 138 m in length, 24 m in width, and 3 m in height. The third deck measures 138 m in length, 24 m in width, and 3 m in height. The ship measures 42 m in length, 15 m in width, and has a depth of 2.8 m. Figure 2 depicts the spatial layout of the cruise ship, including the distribution of its various functional areas, stair connections, and channel distribution positions.
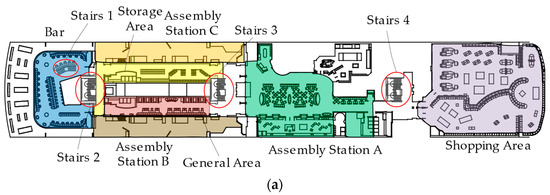
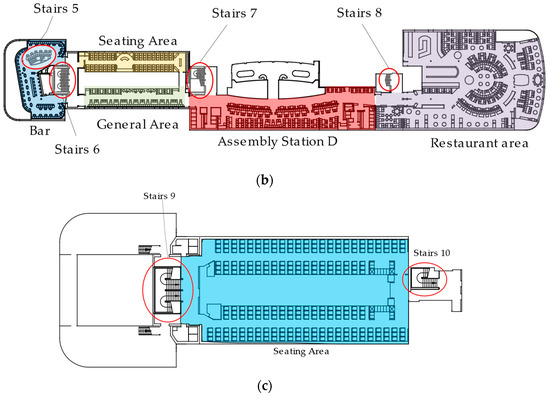
Figure 2.
Cruise ship layout on three levels: (a) Cruise ship interior layout on level 1; (b) Cruise ship interior layout on level 2; (c) Cruise ship interior layout on level 3.
In addition, several staircases are utilized to connect each two decks, with the specific connection methods, widths, and heights detailed in Table 1.

Table 1.
Connections between each deck.
4.2. Initial Personnel Distribution of Each Functional Area
This example shows the initial distribution of passengers on a passenger cruise ship based on the validation dataset [35,36,37] provided by the European Union’s Seventh Framework Project Safeguard. The initial personnel distribution of the model evacuation is shown in Table 2 below. In evacuation mode I, personnel need to evacuate to the nearest boarding station. Therefore, except for the initial positions of staging stations B and C, which have boarding functions, all other personnel should evacuate to the boarding station. By calculation, in evacuation mode I, the total number of people evacuated to the boarding station is 1580. In evacuation mode II, passengers evacuate from the initial location to the nearest assembly station; in this mode, 1220 people were evacuated in total.
Table 2.
Initial personnel distribution by functional area.
4.3. Determination of Evacuation Speed
In the evacuation process of cruise ships, the passenger characteristics significantly impact the movement speed of each functional area. Among these characteristics, age and gender are particularly influential factors. In this paper, different movement speed is set based on the passenger characteristics of each functional area, and the age range of general passengers is from 20 to 65 years old, and for special passengers, the range is under 20 years or over 65 years old.
Among them, the cruise lines are summarized based on the 2016–2018 Global Cruise Crew Consumer Survey Report (see Figure 3) compiled by the Cruise Lines International Association (CLIA) and the characteristics of cruise cabin crew members surveyed by Wang [38]. The age composition characteristics of the total crew and each functional area are shown in Table 3, and the ratio of male to female cruise crew members is approximately 1:1.
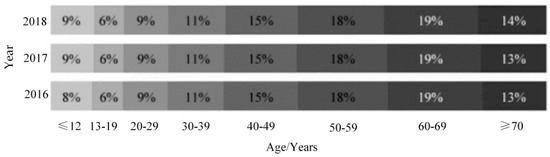
Figure 3.
Age profile of global cruise ship occupants, 2016–2018.
Table 3.
Percentage distribution of passengers in different age ranges in each functional area (unit: %).
Using the composition characteristics of passengers in each functional area summarized in Table 3, combined with the classification of passenger types and walking speeds in the International Maritime Organization (IMO) “Guide”, the evacuation speed of passengers in each functional area is determined. Taking the bar area as an example, the age of general passengers in the bar is divided into three categories: 20–30 years old, 30–50 years old, and 50–65 years old. Based on the proportion of occupants in each age group presented in Figure 3, we obtained the occupancy ratio for different classes.
where is the proportion of passengers aged 20–30 years old in the bar area, is the total proportion of general passengers in the bar area, and are the proportions of occupants in the two age groups in the CLIA statistics.
Based on Equation (13), the calculation was obtained = 0.13.
Table 3 shows the proportion of passengers of different age groups in each functional area. According to the evacuation speed range of age group and gender passengers stipulated by IMO in the “Guidelines”, this paper sets the average evacuation speed of passengers of different gender and age groups, and the specific parameters are shown in Table 4.
Table 4.
Average evacuation speed of occupants for passengers ages and genders (unit: m/s).
4.4. Passenger Information Parameters
The size and proportion of passenger groups are set according to the cruise ship statistical data collected by Wang X et al. [39]. The number of small groups is divided into a single group, two-person group, three-person group, and four-person group. The passenger diameter is 0.4 × 0.4 m, and the specific parameters are shown in Table 5 below.
Table 5.
Small group information.
5. Cruise Ship Emergency Evacuation Simulation and Analysis
5.1. Modeling Steps Based on Social Force Model
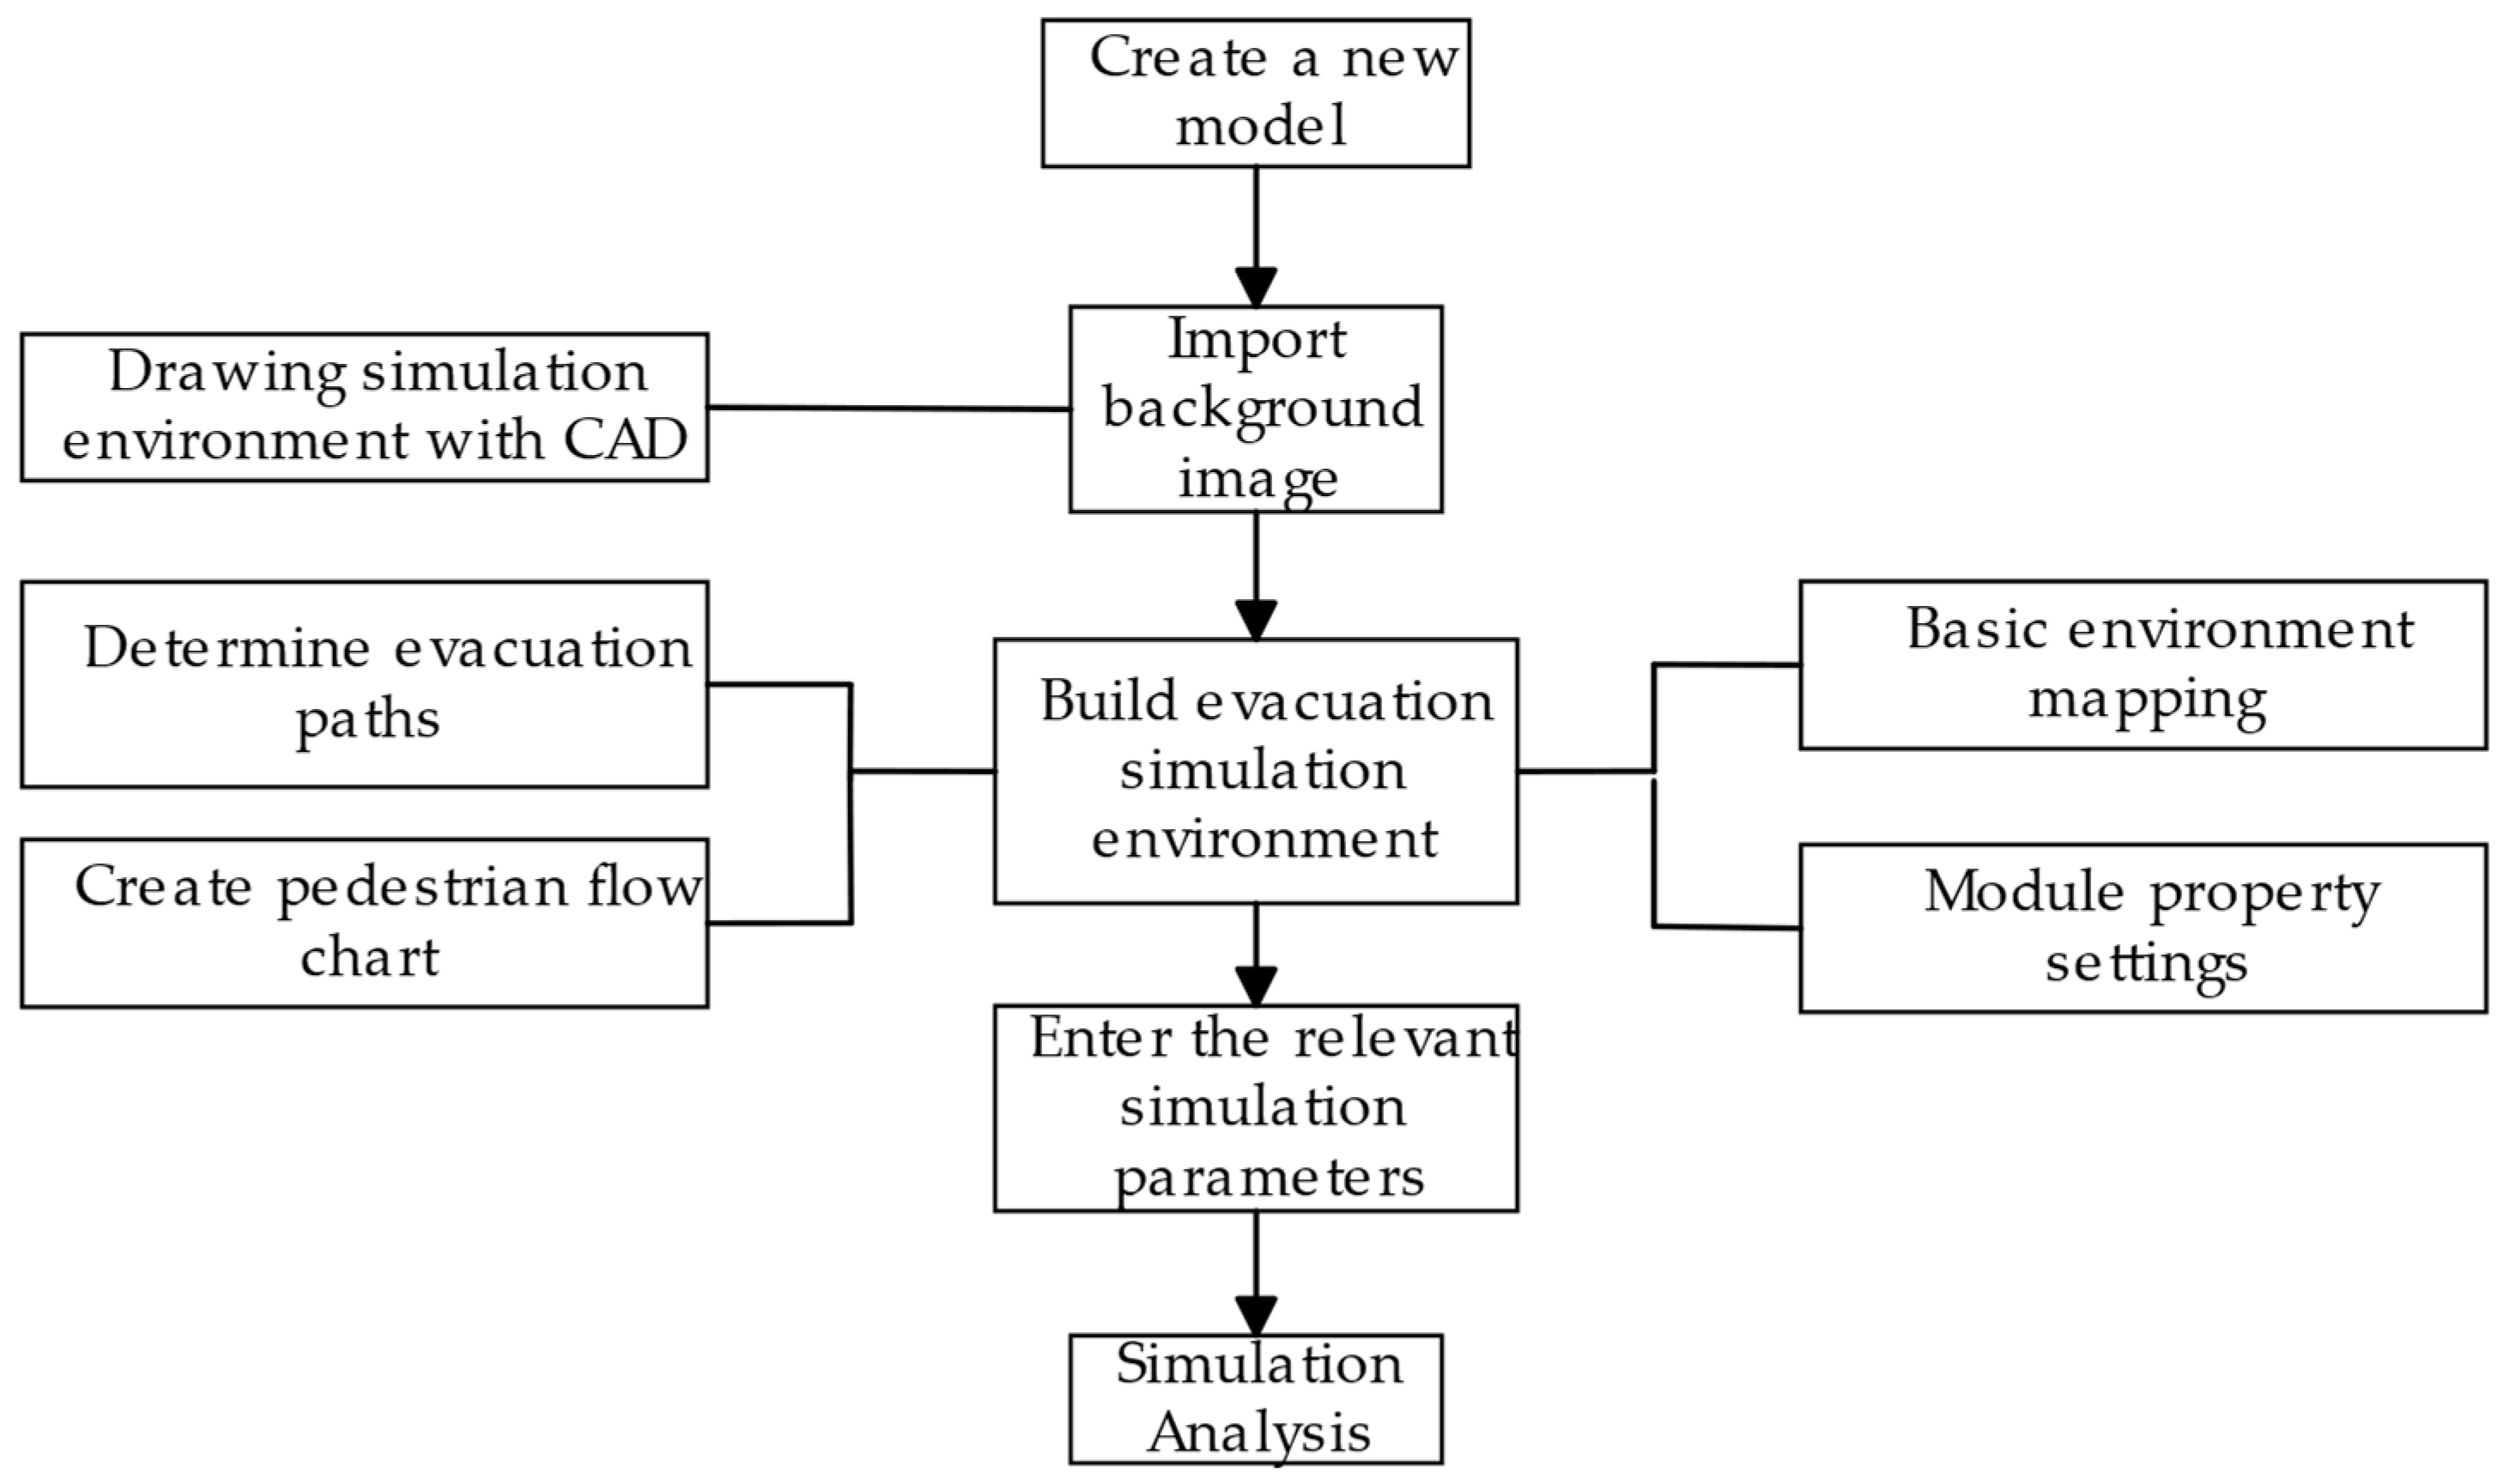
The main steps of modeling simulation using the pedestrian library mainly include the following steps, as shown in Figure 4.

Figure 4.
Flowchart for personnel emergency evacuation simulation.
(1) Create a cruise ship model. The CAD drawings of the cruise ship are imported as a base map to create the model scene. Following this, the architectural environment, including walls, stairs, target lines, and evacuation routes, is established. Finally, a passenger flow chart is developed.
(2) Parameter setting. Set parameters such as passenger diameter, correction speed, passenger characteristics, small group ratio, etc.
(3) Statistics. This includes changes in pedestrian density and the number of passengers evacuated using two different evacuation methods in a given area.
(4) Model tuning. The model constructed is used to run simulation experiments, set different parameters for comparison, and finally analyze and summarize the data obtained.
5.2. Evacuation Time of Two Evacuation Methods without Groups
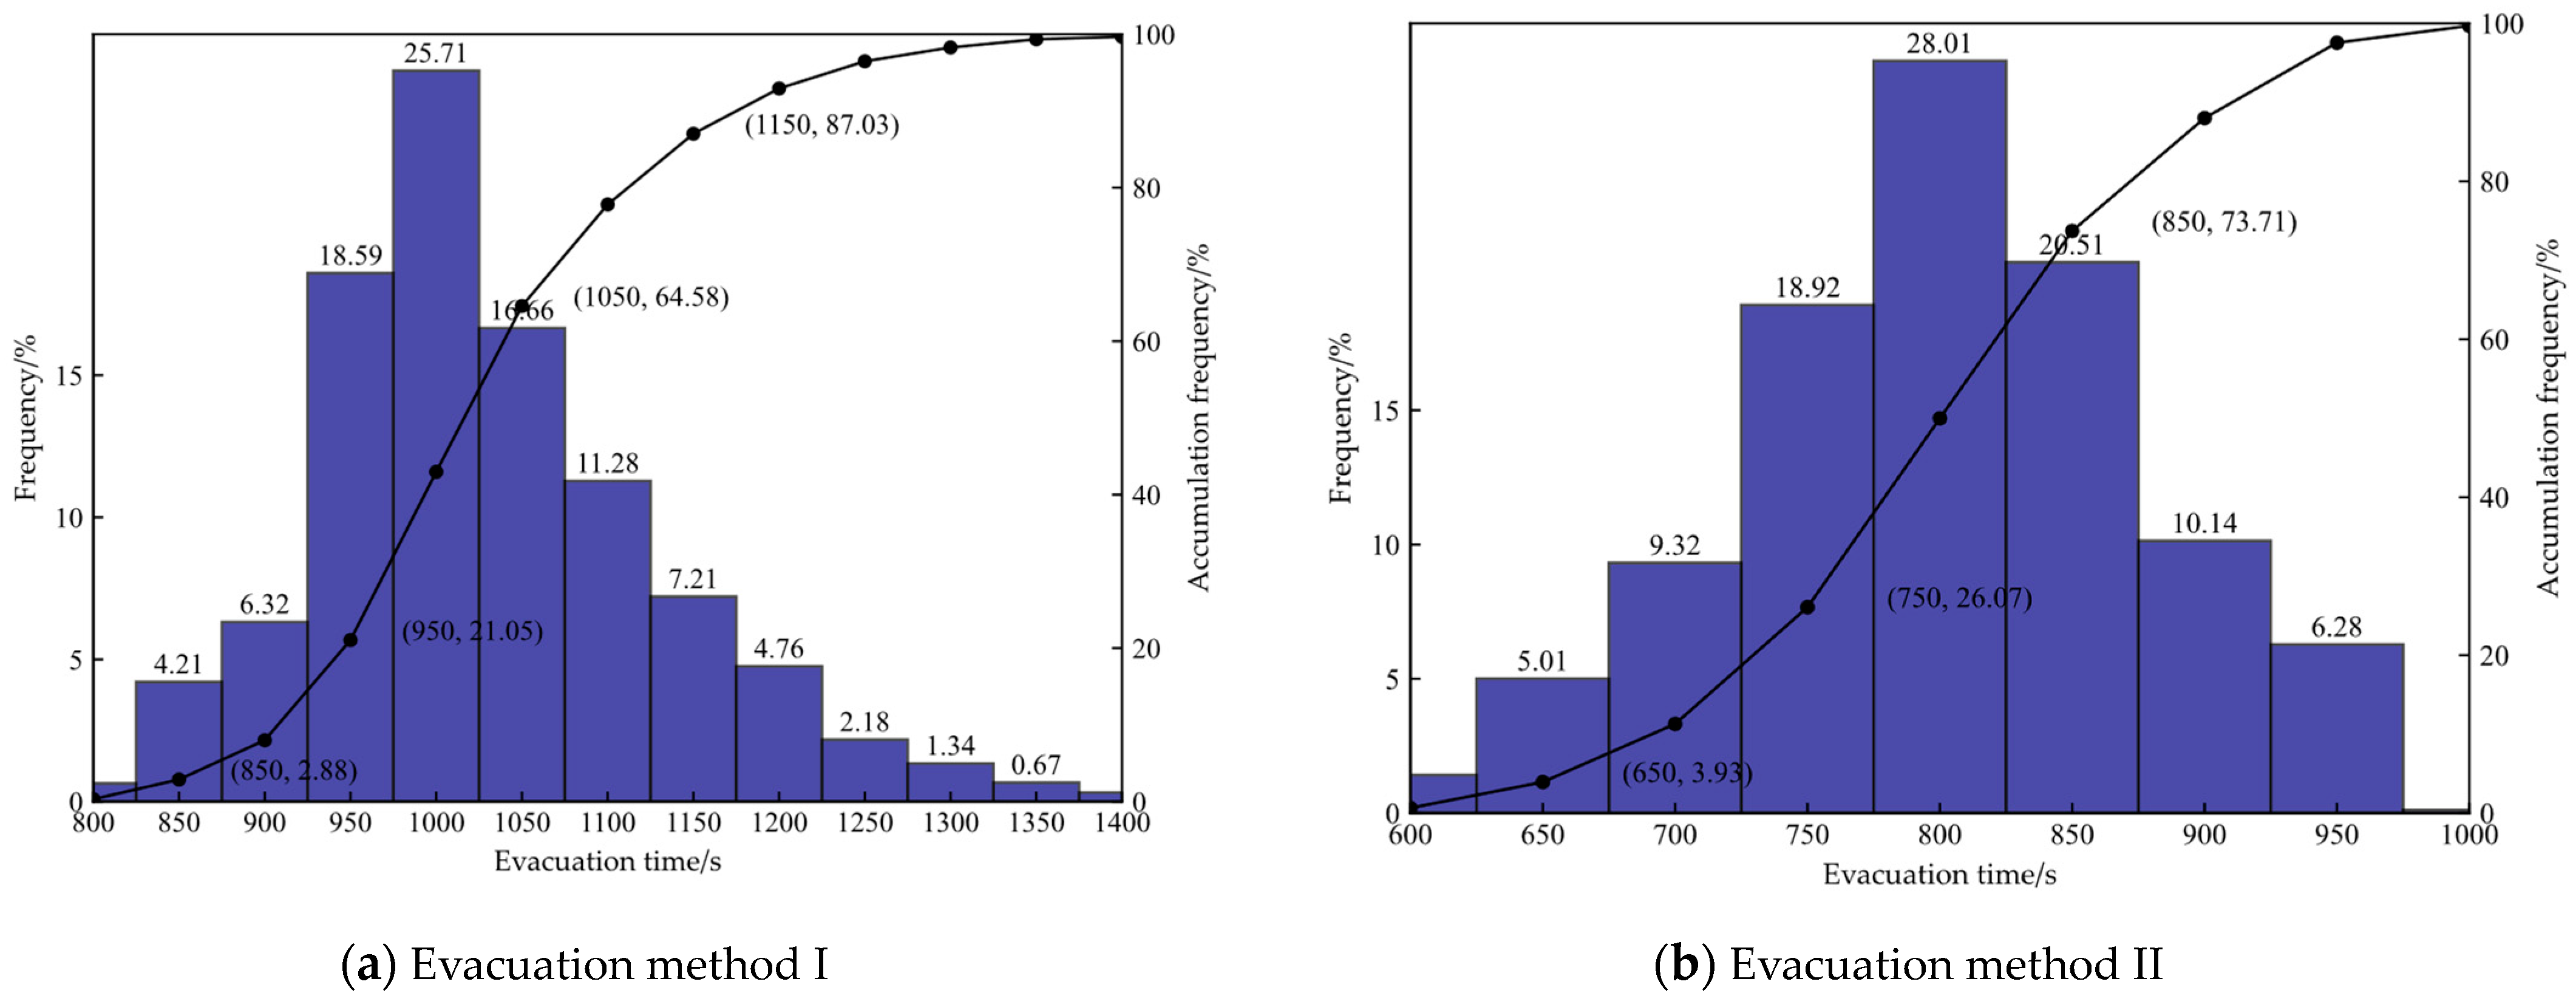
This paper refers to the Monte Carlo method to repeatedly simulate each evacuation situation 500 times, and then conduct statistical analysis on the obtained data. Based on the cruise evacuation model without group interaction, the evacuation time and cumulative distribution function of passengers can be obtained by using Anylogic 8.8.1 simulation software, as shown in Figure 5. The 95% quantiles evacuation times for evacuation methods I and II were 1052 s and 861 s, respectively. Using the 95th percentile passenger assembly time as a representative, the assembly time for evacuation method II was 18.15% shorter than that of evacuation method I.
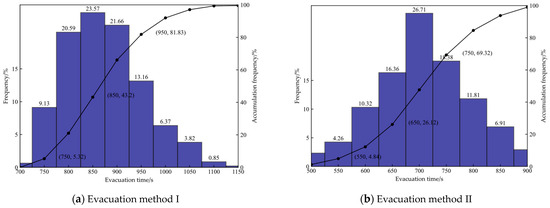
Figure 5.
Frequency distribution of evacuation time without groups.
In addition, through Figure 5, it can be found that the 90% confidence intervals of passenger assembly time for evacuation mode I to II are 842~1052 s and 741~861 s, respectively. Through the analysis, it can be seen that the passenger assembly time for evacuation mode I has a large range of variation, while the passenger assembly time of evacuation mode II has a small range of variation.
The mean, maximum, minimum, deviation, median, and 0.05 (P5), 0.50 (P50), and 0.95 (P95) percentiles of passenger evacuation times under different evacuation methods without group interaction are shown in Table 6.
Table 6.
Important parameters for evacuation without groups.
Therefore, in the event of an emergency on a cruise ship, the staff should choose the appropriate evacuation method. Under the condition of ensuring a safe return to port, evacuation method I can be selected, which involves notifying passengers to proceed to the nearest boarding station with boarding capabilities, although this method has a longer evacuation time. However, if the cruise ship still has the ability to safely return to port, evacuation method II can be chosen, which involves notifying passengers to proceed to the nearest assembly station. This method has higher efficiency and can effectively reduce the risk of accidents. Therefore, in the event of an emergency, the severity of the incident should be taken into consideration.
5.3. Congestion Area and Duration of Congestion for Two Evacuation Methods without Groups
During the process of evacuating a cruise ship, congested areas have a significant impact on the efficiency of evacuation. According to the International Maritime Organization’s MSC.1/Circ.1533, to determine if an area is congested, we check its population density. If the density exceeds four people per square meter, it is determined that the area is a congestion area. Additionally, if the congestion in this area accounts for more than 10% of the total evacuation time, it is regarded as having a substantial impact on the ship’s evacuation.
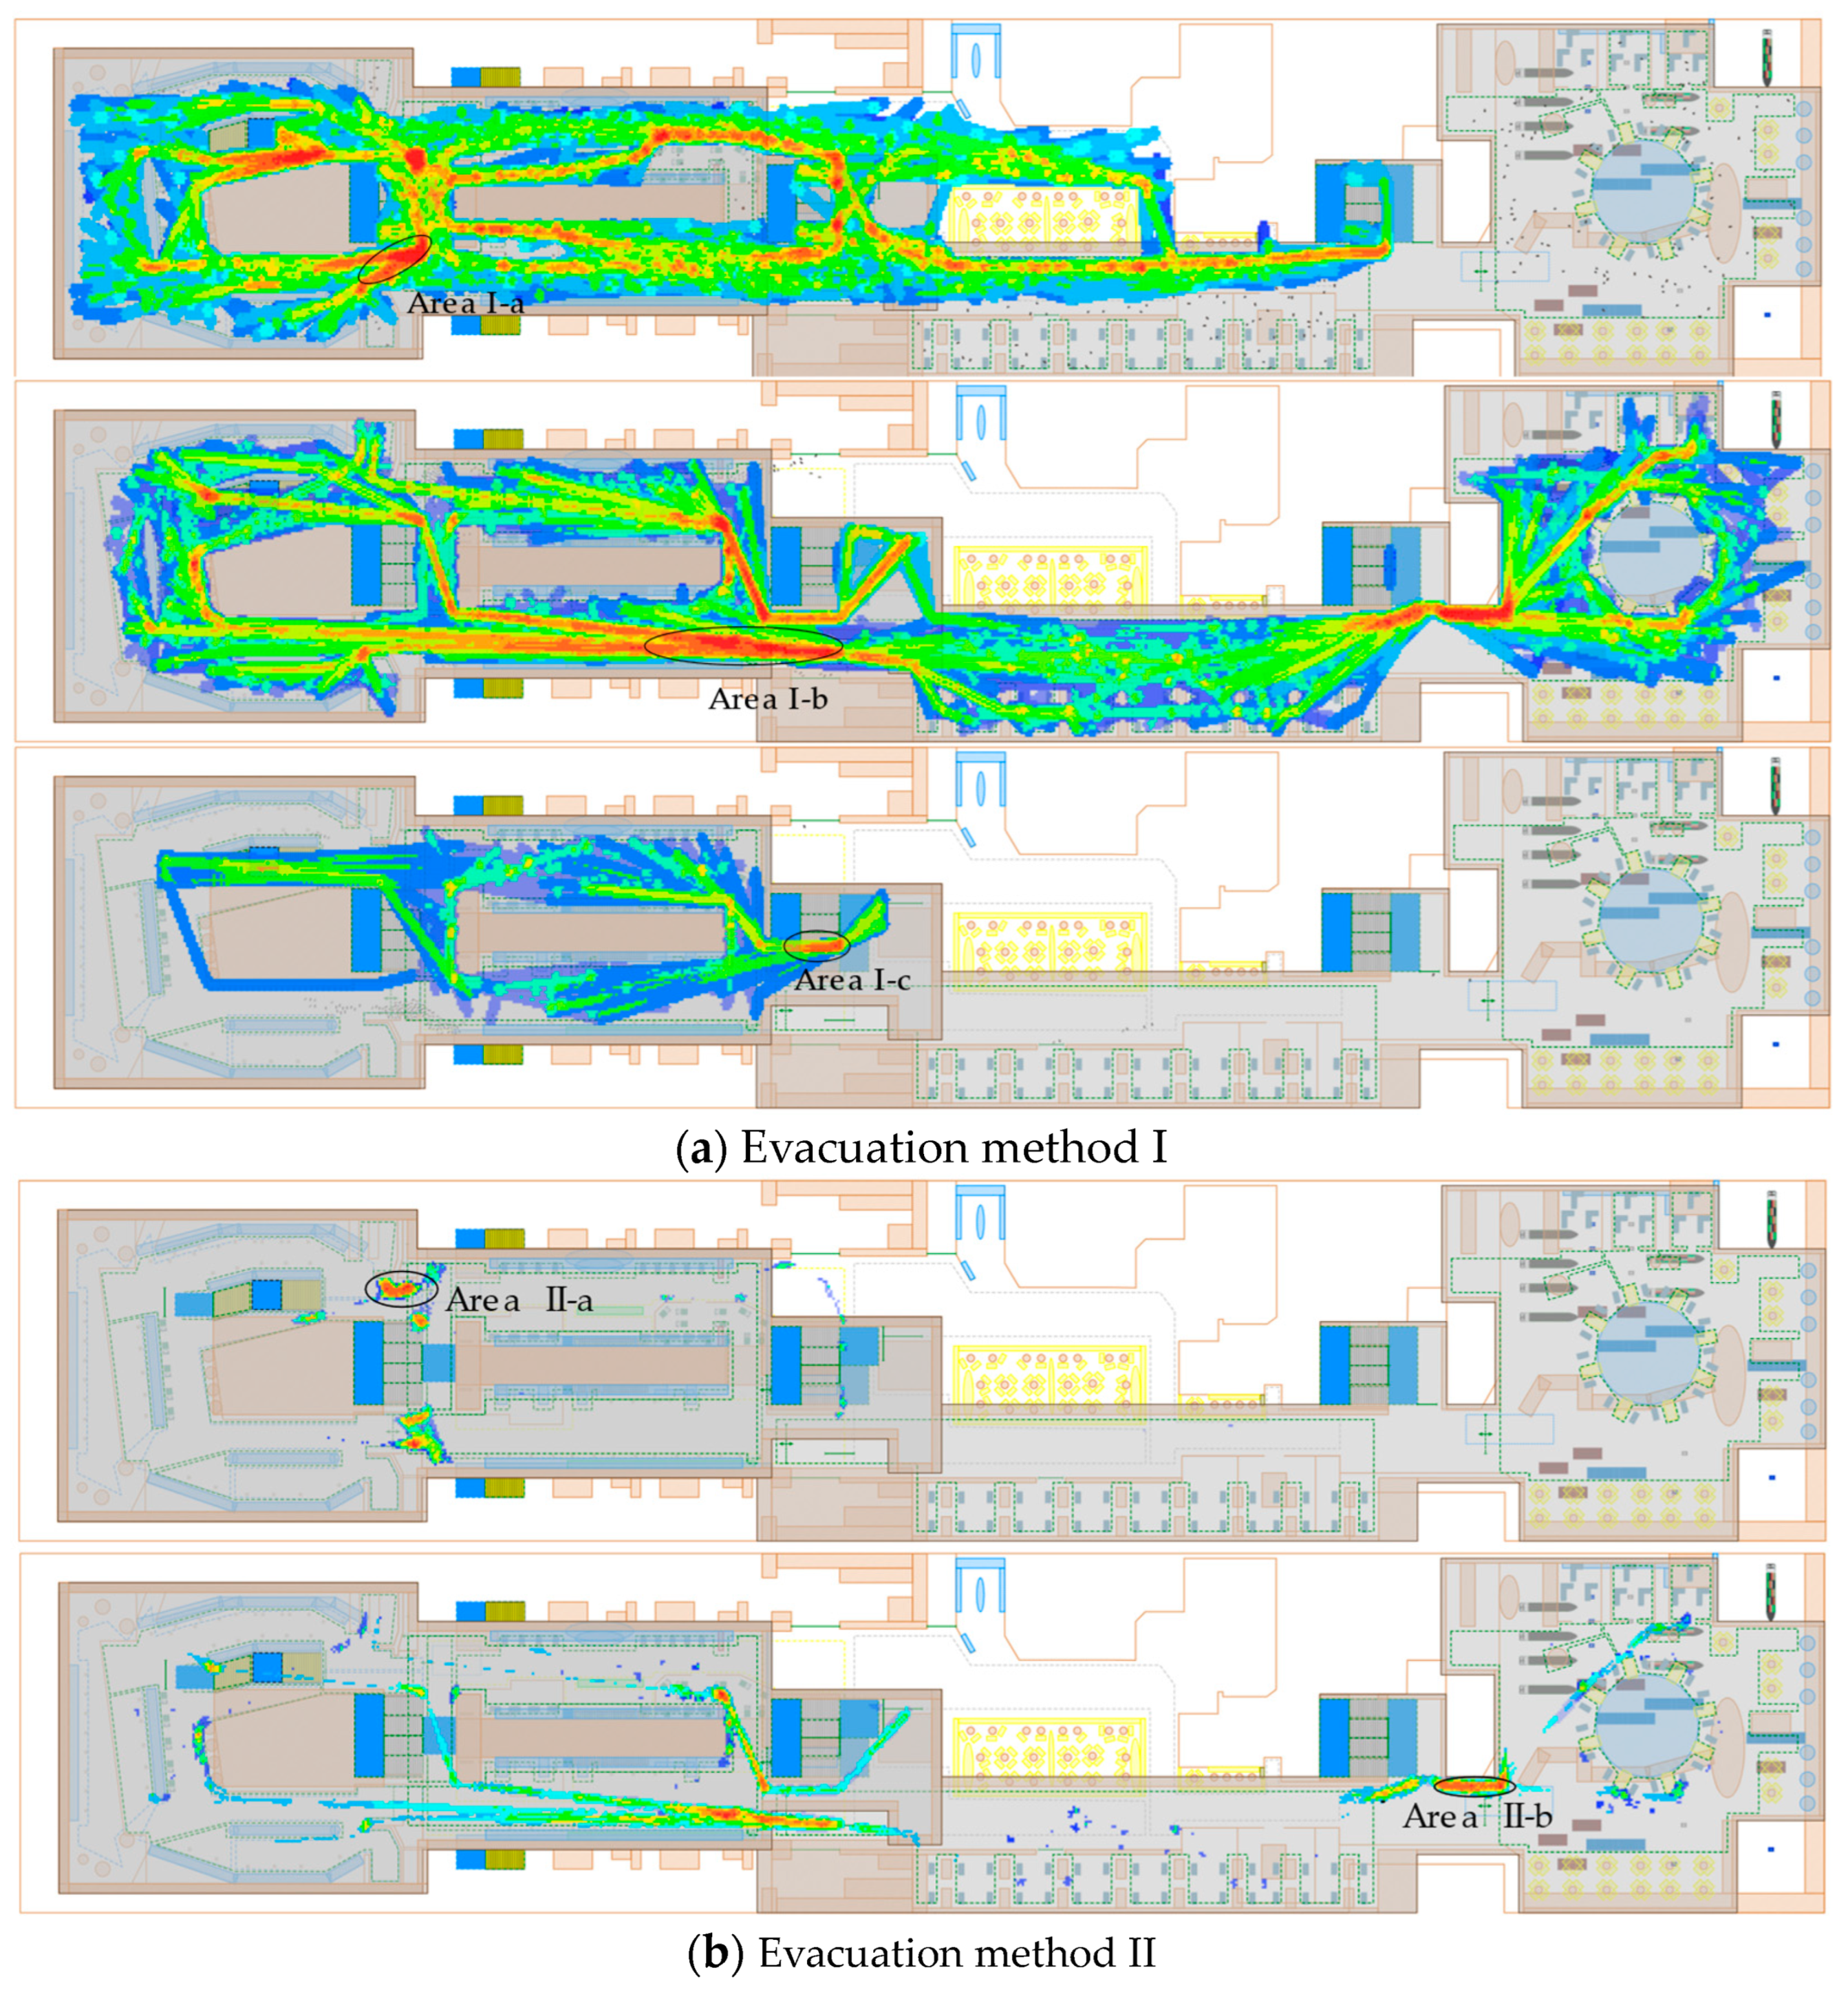
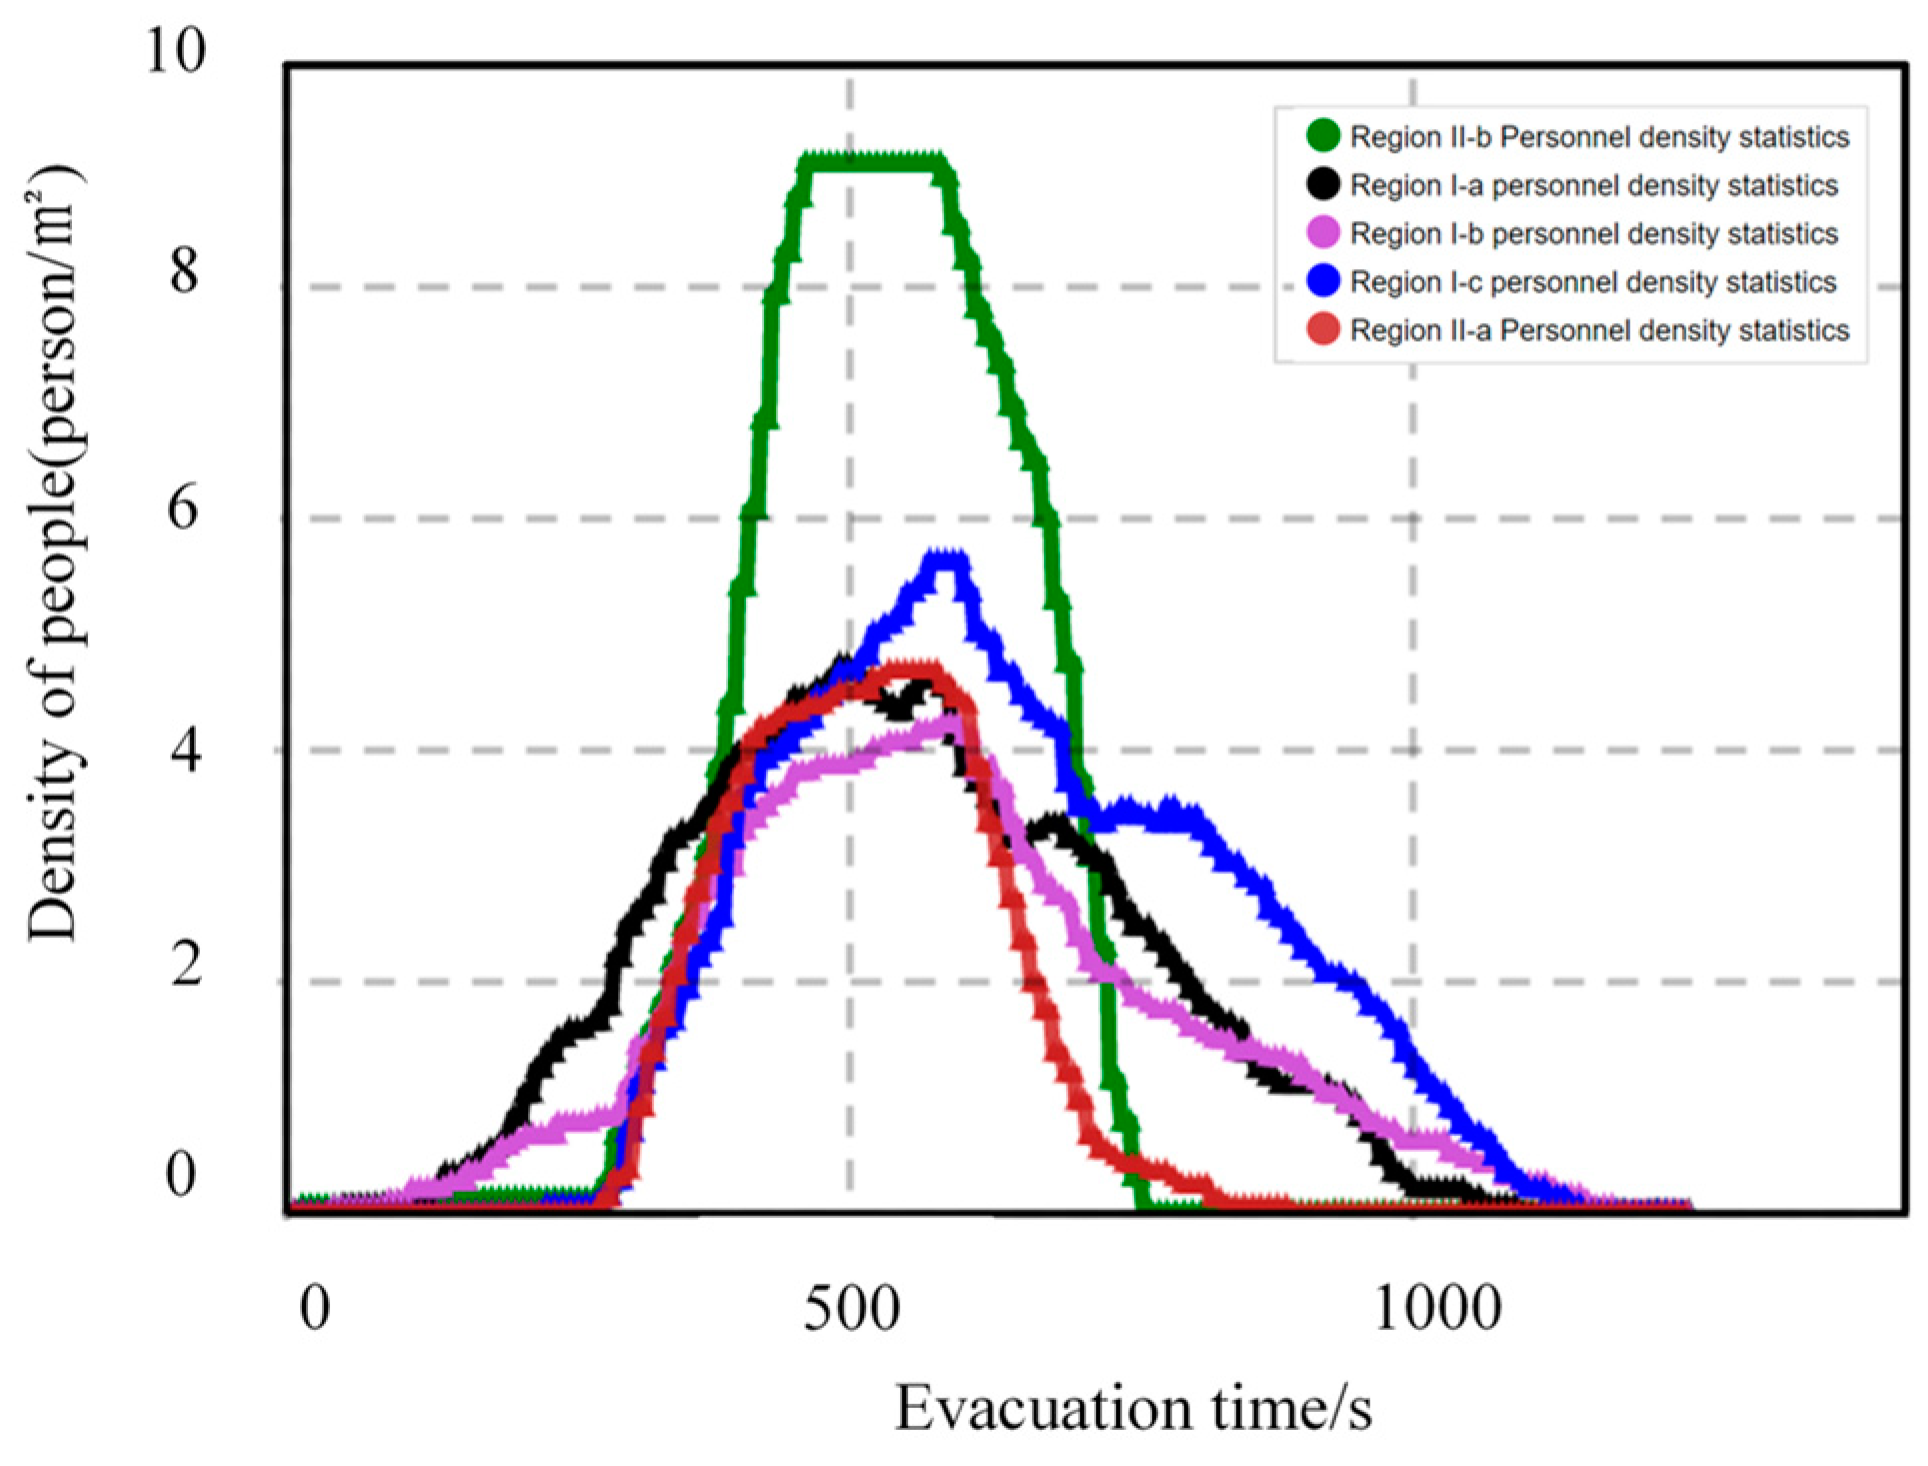
At t = 170 s, the personnel density thermal map for the evacuation of the cruise ship without grouping is shown in Figure 6. Based on the congestion determination method above, there are congested areas in evacuation mode I, including areas I-a, I-b, and I-c as shown in Figure 5a, and there are congested areas in evacuation mode II, including areas II-a and II-b as shown in Figure 5b. Figure 7 displays the variation in personnel density in specific areas without any group effect. The congestion duration of Area I-a ranges from 365 to 651 s, while for Area I-b it ranges from 482 to 671 s. For Area I-c, the congestion lasts from 382 to 805s. Area II-a experiences congestion for a duration of 372 to 641 s, while Area II-b experiences congestion for 410 to 724 s.
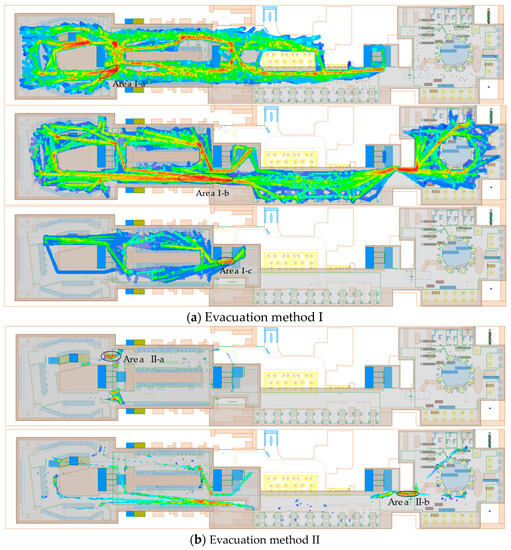
Figure 6.
The personnel thermal distribution map of congested areas during cruise ship evacuation.

Figure 7.
The variation in crowd density with time in congested areas without groups.
Table 7 presents the continuous congestion time data without group interaction. The data show that the maximum congestion density in the five selected areas exceeds four people/m2, and the maximum congestion density is area II-b. Additionally, the continuous congestion time in all five areas accounts for over 10% of the total evacuation time, with some areas even exceeding 40%. Among them, region II-b has the largest ratio of congestion time to total evacuation time. These data indicate that congested areas during the evacuation process have a significant impact, so it is necessary to prioritize control and properly guide passengers in these congested areas [38].
Table 7.
Continuous congestion time in the area without groups.
5.4. Evacuation Time of Two Evacuation Methods with Groups
Based on the cruise evacuation model with group action, the evacuation time and cumulative distribution function of passengers can be obtained by using Anylogic 8.8.1 simulation software, and the results are shown in Figure 8.

Figure 8.
Frequency distribution of evacuation time with groups.
The results are shown in Figure 8. The 95th percentile of passenger evacuation time for evacuation modes I and II are 1237 s and 932 s, respectively. Represented by the 95th quantile of assembly time, it can be observed that the passenger assembly time for evacuation method II is 32.73% lower than that for evacuation method I.
In addition, Figure 8 indicates that the 90% confidence intervals for passenger assembly times in evacuation modes I to II were 981~1237 s and 811~932 s. Evacuation mode I and II had the highest number of evacuees in the time periods 975~1025 s and 775~825 s, respectively. Furthermore, it was also found that the evacuation time of passengers varied more in evacuation mode I and less in evacuation mode II. The range of variation is small in evacuation mode II.
The mean, maximum, minimum, deviation, and median data of the evacuation time of passengers without group effect are shown in Table 8.
Table 8.
Important parameters of evacuation time with groups.
5.5. Congestion Area and Duration of Congestion for Two Evacuation Methods with Groups
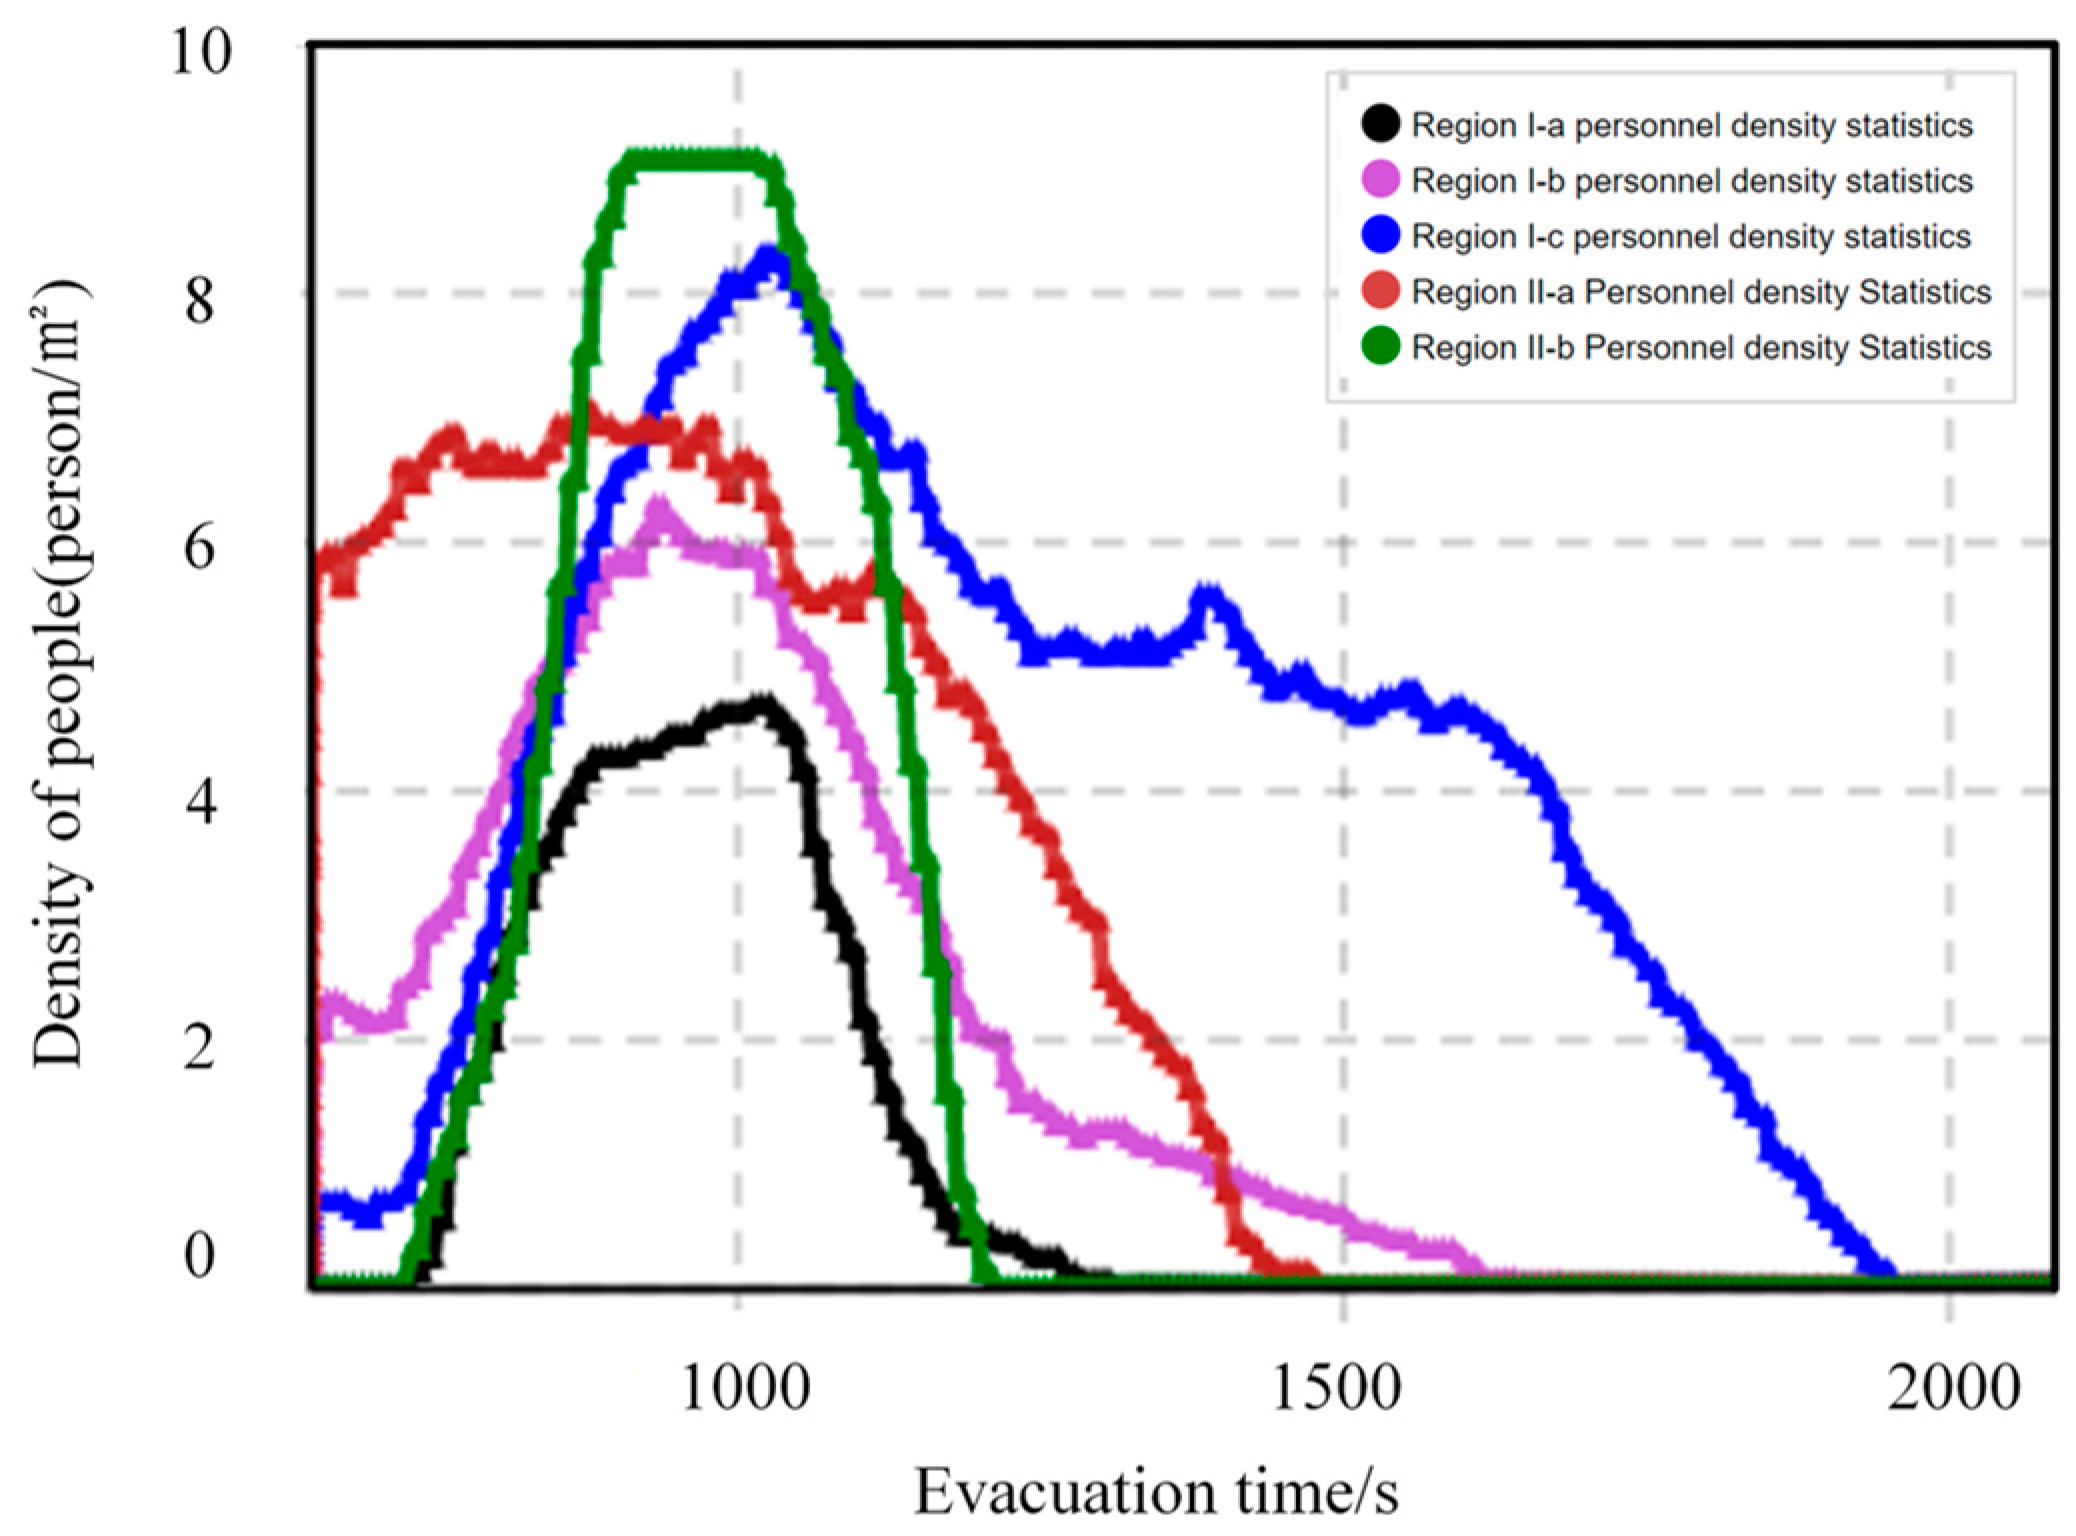
The same as the evacuation of the congested area of the cruise ship personnel without group, the change in the personnel density of a specific area with the evacuation time is shown in Figure 9, where the congestion duration in Area I-a ranges from 408 to 801 s, in Area I-b ranges from 508 to 798 s, in Area I-c ranges from 491 to 1050 s, in Area II-a ranges from 510 to 756 s, and in Area II-b ranges from 495 to 830 s.

Figure 9.
Variation in congestion density with time in the congested area with group.
The percentage of the total evacuation time occupied by the continuous congestion time in the affected region is shown in Table 9. It can be seen that the continuous congestion time of the five selected congestion areas accounts for more than 10% of the total evacuation time, and even some areas exceeding 40%. Among them, the largest proportion is found in region B of evacuation mode II, with a value of 43.76%, while the smallest proportion is observed in region B of evacuation mode I. Furthermore, all five regions have a maximum congestion density exceeding four persons per square meter. These data indicate the significant impact of congested areas on the overall evacuation process. Therefore, it is recommended to assign personnel to these congested areas for guidance and to alleviate congestion based on the different evacuation modes.
Table 9.
Continuous congestion time in the area with group.
5.6. Comparison of Important Parameters with and without Groups Evacuation
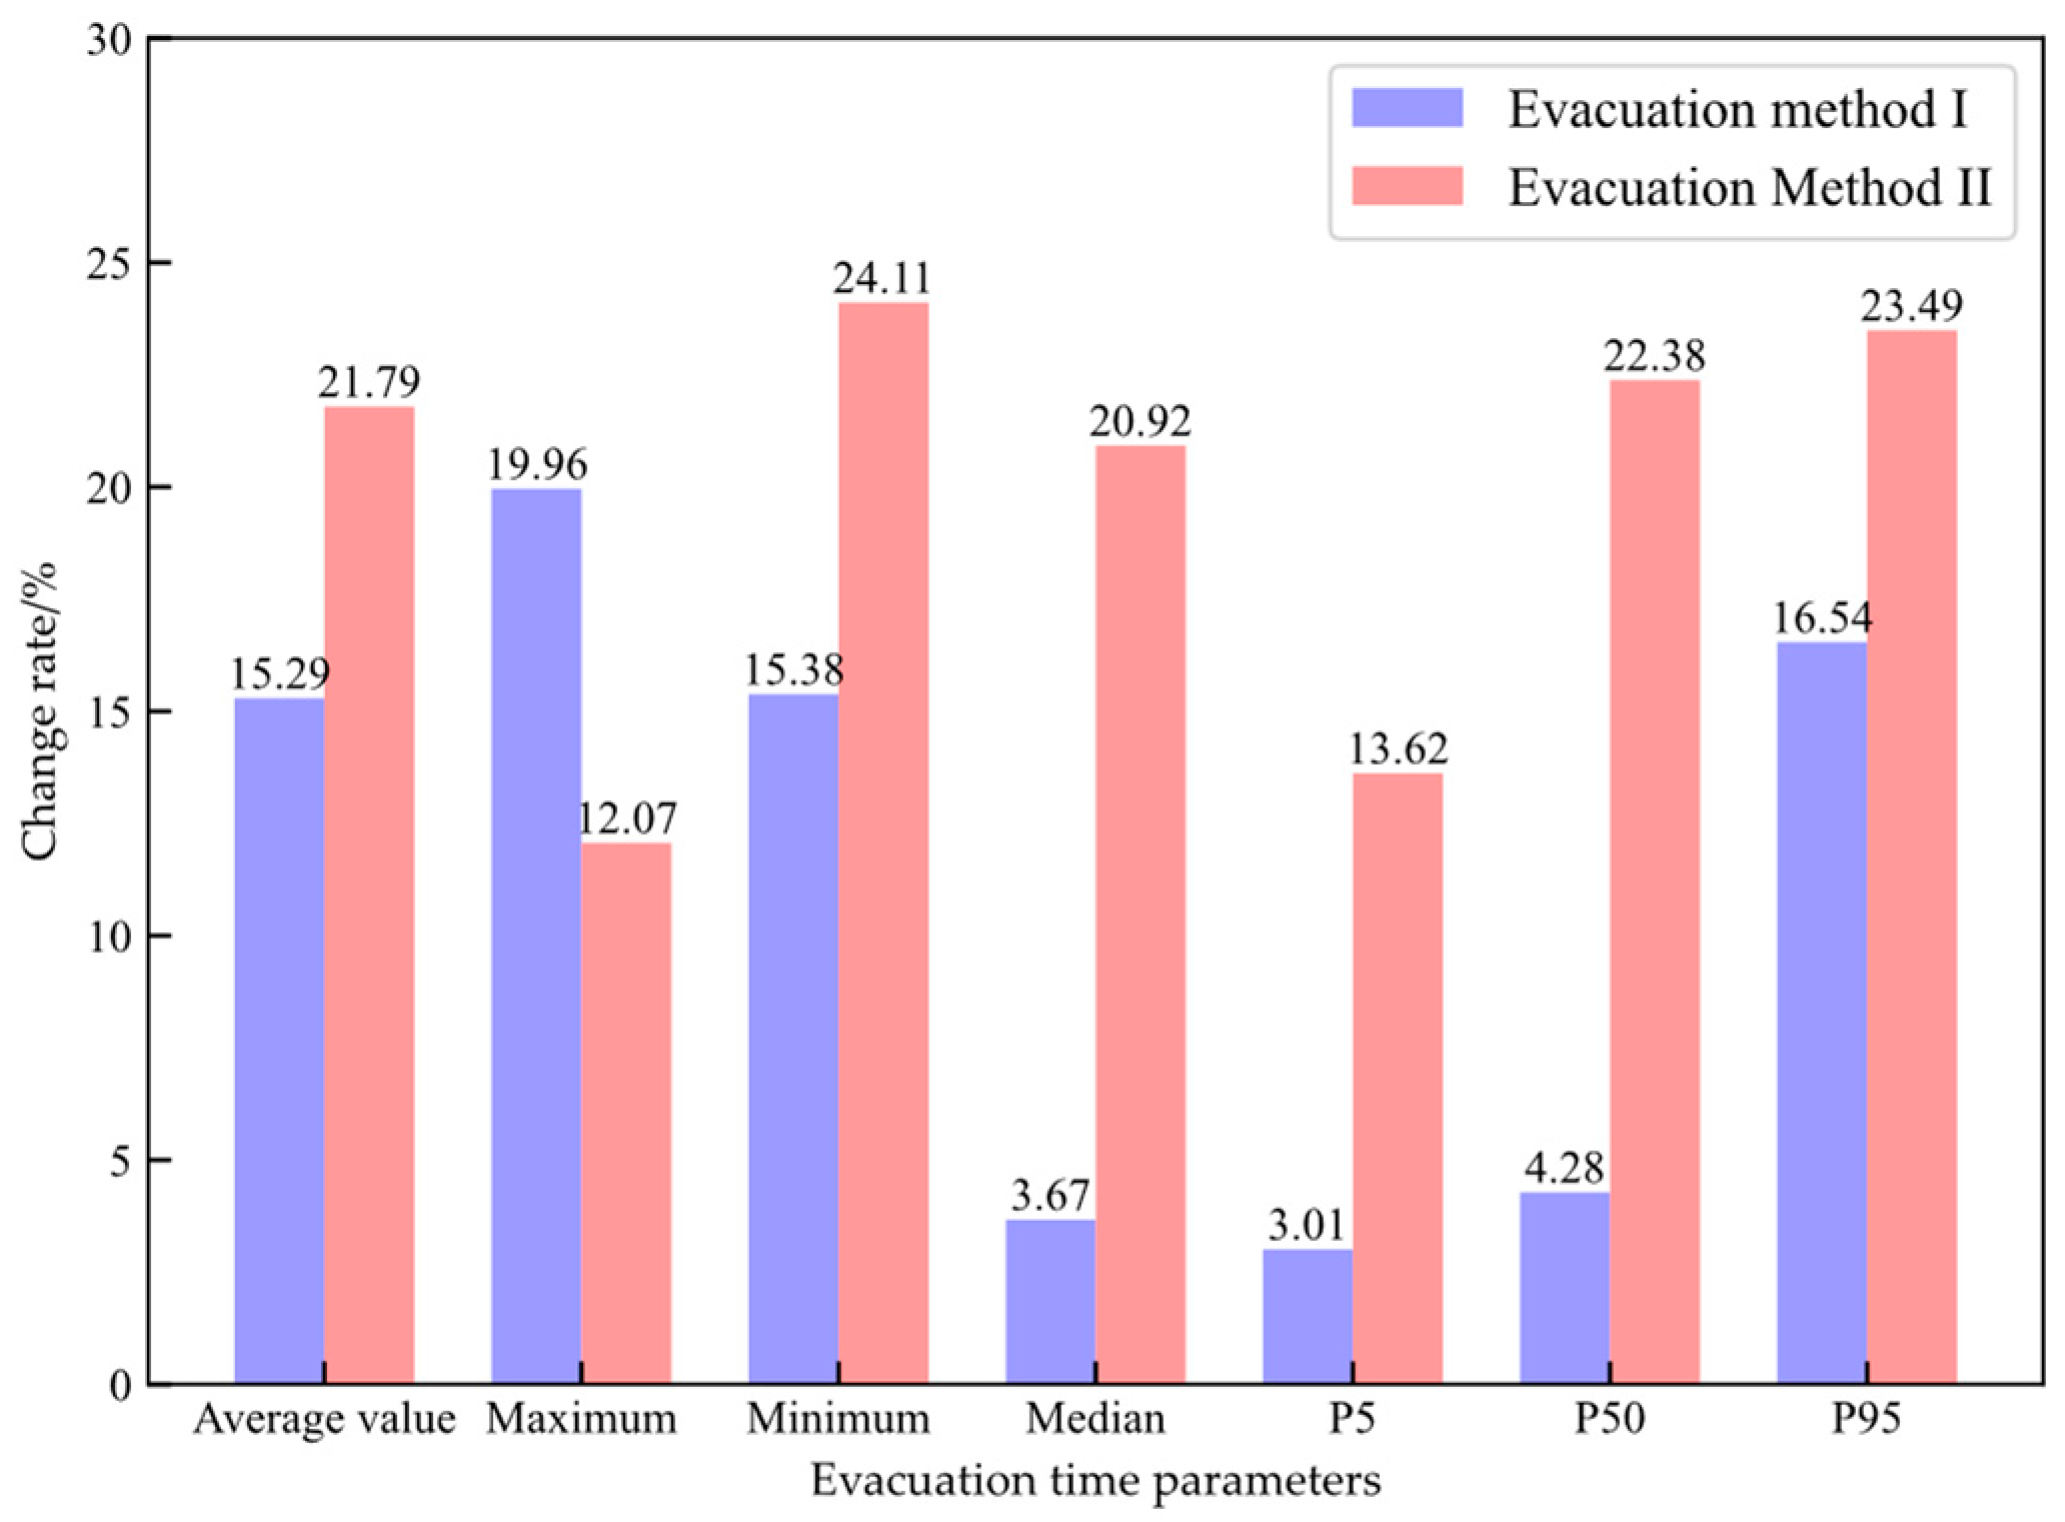
The comparison of important statistical parameters with and without group assembly time is shown in Figure 10. It can be seen from the figure t the effect of group action on the evacuation time of the two evacuation methods, where the average of the evacuation time for methods I and II increased by 15.29% and 21.79%, respectively, as compared to without group action, which had the greatest impact.
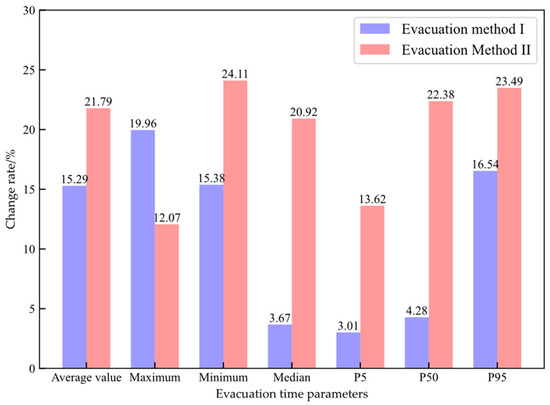
Figure 10.
Variation in evacuation parameters with and without groups effect.
5.7. Comparison of Congestion Duration with and without Groups
According to Figure 11, it can be observed that regions I-a, I-b, I-c, and II-b increased by 37.41%, 44.53%, 32.15%, and 6.69%, respectively, compared to the non-group situation. However, region II-a decreased by 8.55%. This indicates that group effects have different impacts on different evacuation methods.
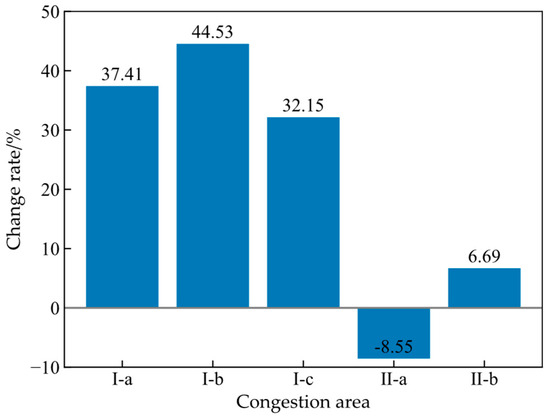
Figure 11.
The rate of change in sustained congestion time under the effect of more no clusters.
From Table 10, we can see that the time of starting congestion in area II-a without group is 372 s and lasts 269 s. The time of starting congestion with group action is 510 s and lasts 246 s. The data show that the group effect slows down the congestion formation in area I-b and also reduces the duration of congestion, which has a positive effect on evacuation. This is because members of the group tend to leave in pairs, but the response time of each passenger is different, and passengers who respond quickly need to wait for other group members, causing the congestion start time in this area to be delayed and the congestion duration to be shortened.
Table 10.
Comparison of congestion durations with and without group.
From Table 10, we can see that the start of congestion in the area II-c without group is 482 s and lasts 189 s. The start of congestion with group effect is 508 s and lasts 290 s. These data indicate that the group effect slows down the formation of congestion in I-b, while also increasing the duration of congestion. This is due to the response time of group is the maximum response time among group members, this waiting behavior hinders the movement of other passengers, thus causing congestion situation increases, which has a negative effect on evacuation.
In summary, considering the differences in congestion formation and duration with and without groups in different regions, it can be concluded that the effect of groups on congestion formation and duration is not singular.
5.8. Comparison of Bypassing Distance with and without Groups
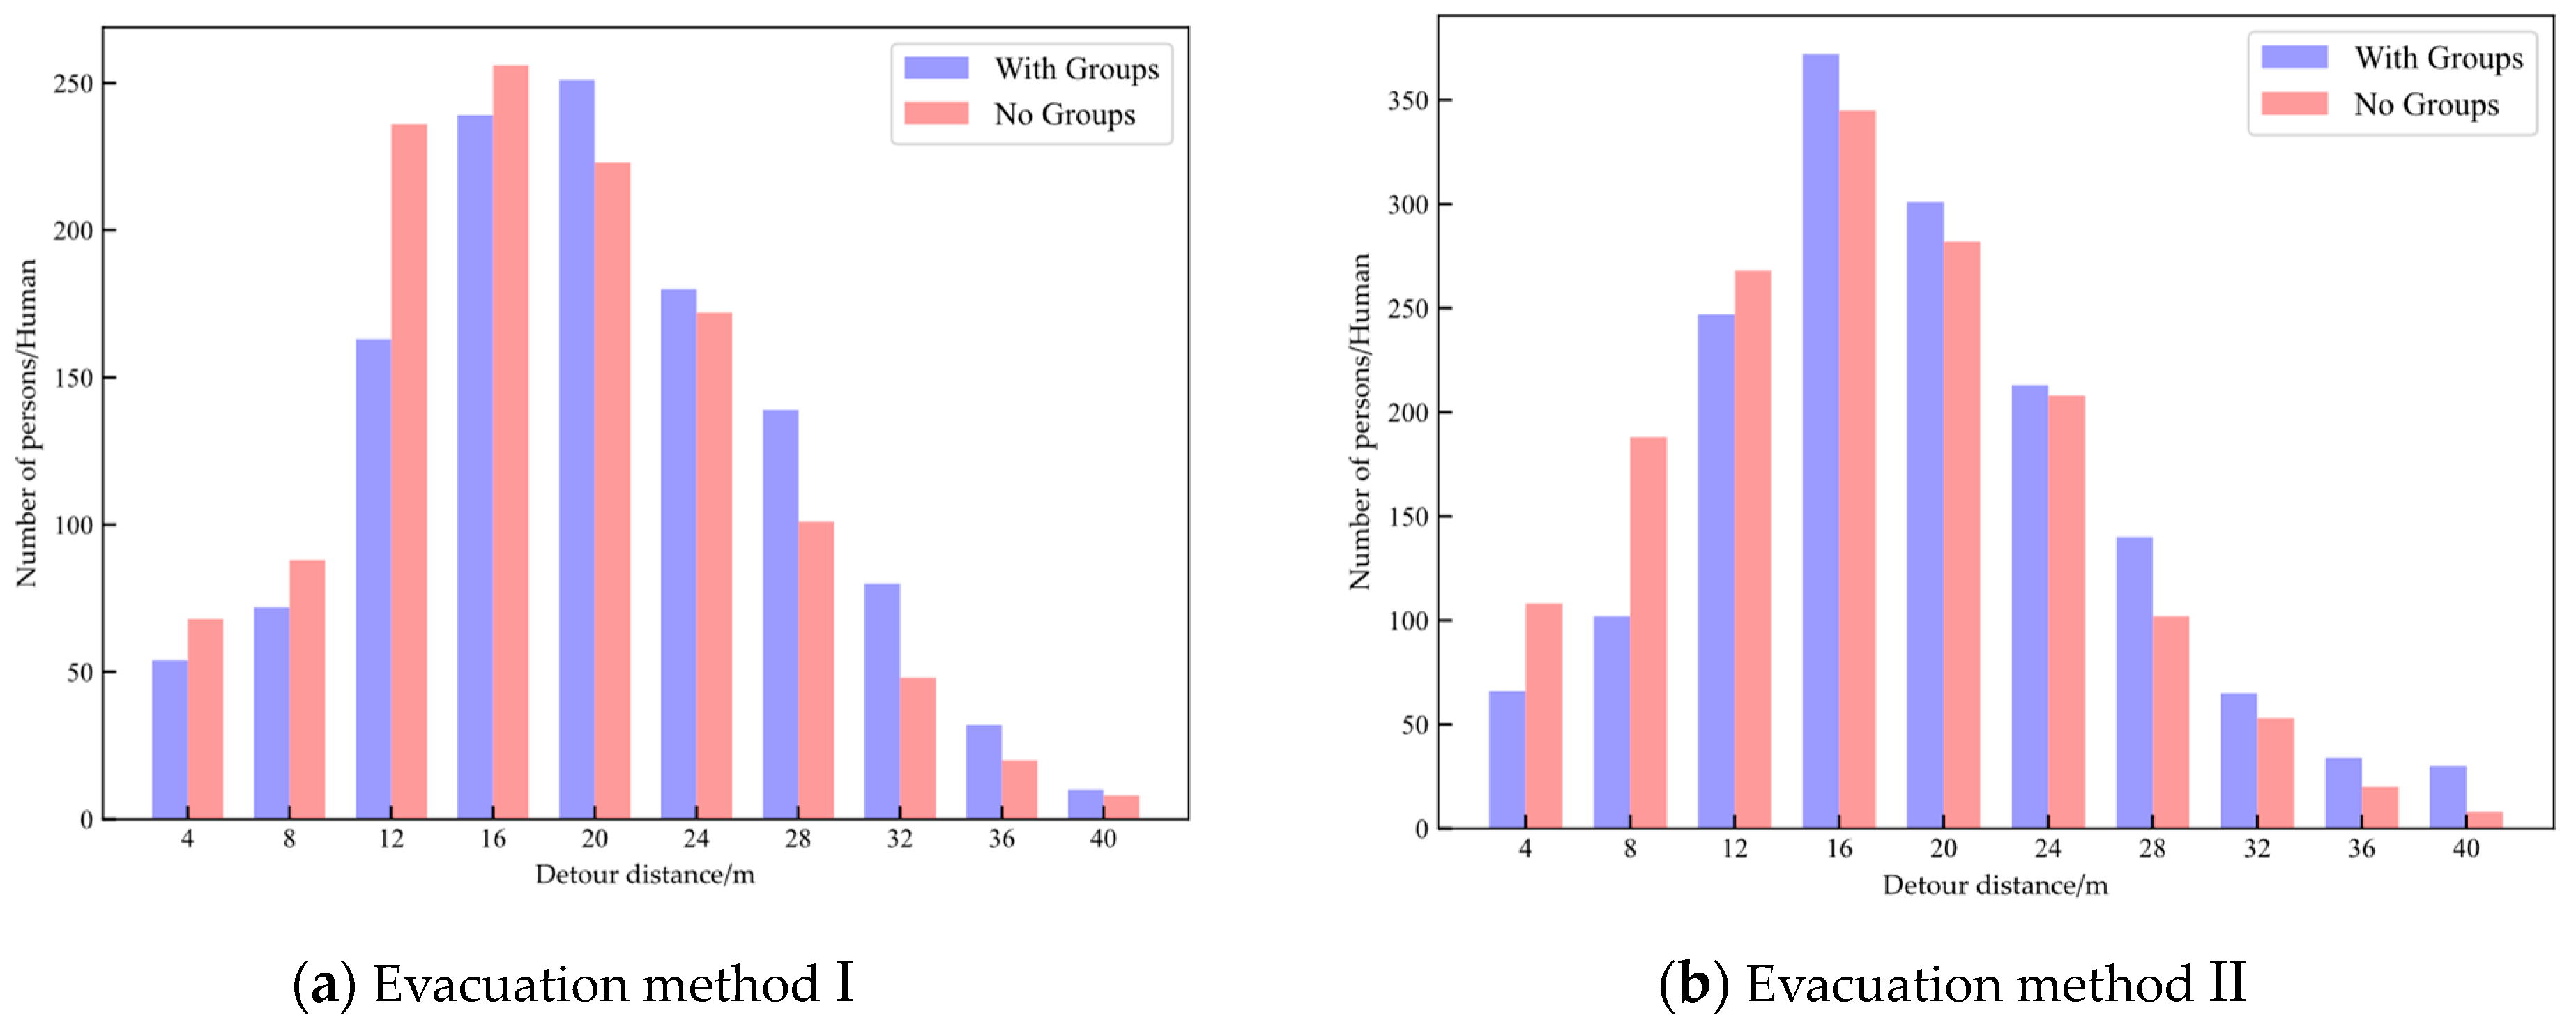
Influenced by the behavior of small groups, detouring behavior occurs during the evacuation of passengers. The detour distance, which is the difference between the actual distance people move from the starting position to the destination and the straight-line distance, is used to measure the detour phenomenon in the evacuation process. The detour distances for evacuation methods I and II with and without groups are shown in Figure 10 and Figure 11, respectively.
From Figure 12, it can be seen that in Evacuation mode I, the average detour distance for individuals without groups is 14.38 m, while for individuals with groups, it is 17.91 m. This small group behavior results in a 24.54% increase in the average detour distance for passengers. In Evacuation mode II, the average detour distance without groups is 18.70 m and with groups is 22.05 m. The small group behavior increases the average detour distance for passengers by 17.89%.
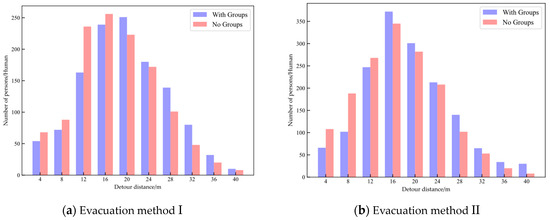
Figure 12.
Detour distance with and without groups.
From the simulation results, under the effect of small group behavior during evacuation, the personnel behaved as looking for companions, resulting in inconsistent or even opposite movements compared to others. This behavior hinders the evacuation of other personnel and increases the overall average detour distance during evacuation, thus making the evacuation behavior of cruise passengers more disorderly, increasing the overall evacuation time and decreasing the evacuation efficiency.
6. Conclusions and Discussion
Based on the basic social force model, this study considers the evacuation characteristics of different passengers, including evacuation speed, response time, and initial distribution. A simulation model of passenger evacuation on a cruise ship is constructed using Anylogic 8.8.1 software. Two different evacuation methods and the impact of group behavior on passenger evacuation time and congestion areas are studied. The simulation results are as follows:
(1) After an emergency occurs, there is a significant difference in the time required for passengers to reach their destination under the two evacuation methods. Method II, which involves reaching the closest assembly point, has a shorter evacuation time. Therefore, cruise ship personnel should choose the appropriate evacuation method based on the urgency of the accident to achieve a reasonable evacuation time.
(2) Group behavior inhibits the efficiency of assembly for passengers under different evacuation methods, and it increases the variation range of assembly time. Moreover, the congestion area of passenger ships with and without group influence is the same, while the influence of group factors on the formation moment and duration of congestion area is more complicated, mainly related to the location of congestion area and the response time of group members.
(3) Under the effect of the group factor, due to the behavior of small groups waiting for their group members to leave, the response time of the group becomes the maximum response time among all members within the group. As a result, passengers do not evacuate simultaneously, and group effects reduce the duration of congestion. When the group is located near the gathering station, this group waiting behavior will prevent the rear passengers from evacuating and cause the congestion duration to increase.
(4) Group behavior increases the average detour distance for personnel, which greatly increases the disorderliness of emergency evacuation on the cruise ship and lowers the overall evacuation efficiency.
The limitation of this paper is that in exploring the influence of small groups on evacuation time and congestion area, only the influence of a specific proportion of group factors on evacuation is proposed, but the specific trend of the influence of small group sizes of two, three, and four people on evacuation time is not confirmed.
Of course, further research could be conducted to expand the scope of the study. In future research, it is expected that further experimental studies will be conducted from the perspective of small group size to expand the existing data and summarize the law of small group size influence on evacuation efficiency.
Author Contributions
Conceptualization, X.Z. and Z.X.; methodology, X.Z. and Z.X.; software, X.Z. and Z.X.; formal analysis, X.Z.; resources, S.W.; writing—original draft preparation, X.Z.; writing—review and editing, H.Z.; supervision, H.Z.; project administration, H.Z. and W.Z.; Funding acquisition, S.W.; Validation, W.Z.; All authors have read and agreed to the published version of the manuscript.
Funding
This research received no external funding.
Institutional Review Board Statement
Not applicable.
Informed Consent Statement
Not applicable.
Data Availability Statement
Not applicable.
Acknowledgments
We express our gratitude to Shibo Yin.
Conflicts of Interest
The authors declare no conflict of interest.
References
- Zheng, M.; Zheng, H. Research on Ship Evacuation Scheme Based on Graph Theory Algorithm. Comput. Simul. 2018, 35, 403–407. [Google Scholar]
- Yu, W.B.; Wu, X.G.; Wang, T.; Chen, L. Zhou, W. Research on the passage and escape routes of ships based on the shortest path algorithm. Chin. Ship Res. 2008, 3, 16–20. [Google Scholar]
- Liao, Q.M.; Huang, S.; Wang, Y.; Zheng, M. Accessibility analysis of ship evacuation network model. J. Shanghai Jiao Tong Univ. 2015, 49, 227–231. [Google Scholar]
- Qiao, Y.; Han, D.; Shen, J.; Wang, G. A study on the Route Selection Problem for Ship Evacuation. In Proceedings of the IEEE International Conference on Systems, Man and Cybernetics, San Diego, CA, USA, 5–8 October 2014; pp. 1958–1962. [Google Scholar] [CrossRef]
- Guo, B. The Research on Models of People’s Flowing in the Large-Scale Marine; Harbin Engineering University: Harbin, China, 2008. [Google Scholar]
- Henderson, L.F. The Statistics of Crowd Fluids. Nature 1971, 229, 381–383. [Google Scholar] [CrossRef]
- Hao, Q.Y.; Jiang, R.; Hu, M.B.; Jia, B.; Wu, Q.S. Pedestrian flow dynamics in a lattice gas model coupled with an evolutionary game. Phys. Rev. E 2011, 84, 036107. [Google Scholar] [CrossRef]
- Helbing, D.; Molnar, P. Social force model for pedestrian dynamics. Phys. Rev. E 1995, 51, 4282. [Google Scholar] [CrossRef]
- Klupfel, H.; Meyer-Konig, M.; Wahle, J. Schreckenberg, M. Microscopic Simulation of Evacuation Processes on Passenger Ships. In Theoretical and Practical Issues on Cellular Automata; Bandim, S., Worsch, T., Eds.; Springer: Berlin/Heidelberg, Germany, 2000; pp. 63–71. [Google Scholar]
- Blue, V.; Adler, J. Cellular automata microsimulation of bi-directional pedestrian flows. Transp. Res. Rec. 2000, 1678, 135–141. [Google Scholar] [CrossRef]
- Mostafizi, A.; Wang, H.; Cox, D.; Dong, S. An agent-based vertical evacuation model for a nearfield tsunami: Choice behavior, logical shelter locations, and life safety. Int. J. Disaster Risk Reduct. 2019, 34, 467–479. [Google Scholar] [CrossRef]
- Reynolds, C. Flocks, herds and schools: A distributed behavioral model. Comput. Graph. 1987, 21, 25–34. [Google Scholar] [CrossRef]
- Wu, W.H.; Chen, M.Y.; Li, J.H.; Liu, B.L.; Wang, X.L.; Zheng, X.P. Visual information based social force model for crowd evacuation. Tsinghua Sci. Technol. 2022, 27, 619–629. [Google Scholar] [CrossRef]
- Jiang, Y.Q.; Chen, B.K.; Li, X.; Ding, Z.J. Dynamic navigation field in the social force model for pedestrian evacuation. Appl. Math. Model. 2020, 80, 815–826. [Google Scholar] [CrossRef]
- Marlow, F.; Jacob, J.; Sagaut, P. A multidisciplinary model coupling Lattice-Boltzmann-based CFD and a Social Force Model for the simulation of pollutant dispersion in evacuation situations. Build. Environ. 2021, 205, 108212. [Google Scholar] [CrossRef]
- Hu, M.; Cai, W. Evacuation simulation and layout optimization of cruise ship based on cellular automata. Int. J. Comput. Appl. 2020, 42, 36–44. [Google Scholar] [CrossRef]
- Wan, Y.; Hu, T.; He, B.; Yang, B. Research on micro-simulation of pedestrian flow based on improved social force model. Intell. Build. Smart City 2021, 14–15. [Google Scholar]
- Zhang, T. Evacuation Model and Bottleneck Identification of Passenger Ships in Emergency Situations. J. Qingdao Ocean Seam. Vocat. Coll. 2016, 37, 16–20. [Google Scholar]
- Cheng, X.Y.; Qu, X.P.; Zhang, X.Y.; Deng, Y.J. Analysis of the propagation mechanism of frequent congestion based on dynamic Bayesian network. J. South China Univ. Technol. 2022, 50, 25–34. [Google Scholar]
- Guo, L.; Lu, C.X. Empirical research on evacuation of passenger ships under normal conditions based on IMO standards. Sci. Technol. Eng. 2011, 11, 1022–1029. [Google Scholar]
- Li, N.; Wang, J.H.; Wang, Y.; Zhang, L. Research on Evacuation of Small Group Behavior of Personnel in Multiple Exit Venues in Accidents. Comput. Simul. 2017, 34, 402–406. [Google Scholar]
- Haghani, M.; Sarvi, M.; Shahhoseini, Z. Dynamics of Social Groups’ Decision-Making in Evacuations. Transp. Res. 2019, 104, 135–157. [Google Scholar] [CrossRef]
- Zheng, M.R. A study on simulation of personnel evacuation behavior based on meta cellular automata. J. Shaanxi Inst. Technol. 2016, 32, 39–44+50. [Google Scholar]
- Kostas, K.; Ginis, A.A.; Politis, K.; Kaklis, P.D. Use of VELOS Platform for Modelling and Accessing Crew Assistance and Passenger Grouping in Ship-Evacuation analysis. In Sustainable Maritime Transportation and Exploitation of Sea Resources; Rizzuto, E., Guedes Soares, C., Eds.; CRC Press: Boca Raton, FL, USA; Taylor & Francis: Abingdon, UK, 2011; Volume 2, pp. 729–736. [Google Scholar]
- Ginnis Al Kostas, K.V.; Politis, C.G.; Kaklis, P.D. VELOS—A VR Environment for Ship Applications: Current Status and Planned Extensions. In Virtual Realities; Brunnett, G., Coquillart, S., van Liere, R., Welch, G., Váša, L., Eds.; Lecture Notes in Computer Science; Springer: Cham, Switzerland, 2015; Volume 8844. [Google Scholar]
- Lu, L.L.; Chan, C.Y.; Wang, J.; Wang, W. A study of pedestrian group behaviors in crowd evacuation based on an extended floor field cellular automaton model. Transp. Res. Part C-Emerg. Technol. 2017, 81, 317–329. [Google Scholar] [CrossRef]
- Fu, L.B.; Cao, S.C.; Song, W.G.; Fang, J. The influence of emergency signage on building evacuation behavior: An experimental study. Fire Mater. 2019, 43, 22–33. [Google Scholar] [CrossRef]
- Helbing, D.; Farkas, I.; Vicsek, T. Simulating dynamical features of escape panic. Nature 2000, 407, 487–490. [Google Scholar] [CrossRef] [PubMed]
- Wang, Z.J.; Chen, F.; Shi, Z.H. Agent-based realization of social force model and simulation of pedestrians in subway passageway. J. South China Univ. Technol. 2013, 41, 90–95. [Google Scholar]
- Xu, B.; Liu, H. Crowd Evacuation Simulation Method Combining Social Force and Artificial Bee Colony. Small Microcomput. Syst. 2016, 37, 1725–1729. [Google Scholar]
- Wang, K.; Sheng, W.; Duan, R.N. Simulation research on personnel evacuation at the exit of university teaching buildings based on Pathfinder. China Saf. Prod. Sci. Technol. 2016, 12, 180–186. [Google Scholar]
- IMO MSC.1/Circ.1533; Revised Guidelines on Evacuation Analysis for the New and Existing Passenger Ships. International Maritime Organization: London, UK, 2016.
- Zhang, P.H.; Huang, X.Y.; Wan, H.H.; Liu, M. Dynamic Model of Personnel Cluster Flow Based on Agent Technology [India]. J. Shenyang Jianzhu Univ. 2005, 21, 358362. [Google Scholar]
- Chen, S.K.; Di, Y.; Shi, R.D.; Li, J.; Wang, B. Simulation and analysis on impacts and evacuation during the process of fire on metro platforms. J. Transp. Syst. Eng. Inf. Technol. 2017, 17, 241–248. [Google Scholar]
- Galea, E.R.; Deere, S.; Brown, R.; Filippidis, L. An Experimental Validation of an Evacuation Model using Data Sets Generated from Two Large Passenger Ships. J. Ship Res. 2013, 57. [Google Scholar] [CrossRef]
- Brown, R.; Galea, E.R.; Deere, S.; Filippidis, L. Passenger Response Time Data-Sets for Large Passenger Ferries and Cruise Ships Derived from Sea Trials. Int. J. Marit. Eng. 2013, 155, 33–48. [Google Scholar]
- Deere, S.J.; Galea, E.R.; Filippidis, L.; Brown, R. Data Collection Methodologies Used in the SAFEGUARD Project to Collect Human Factors Data. In Proceedings of the RINA Safeguard: Passenger Evacuation Seminar, London, UK, 30 November 2012. [Google Scholar]
- Wang, R.X. Characterization of China’s Cruise Tourists Based on Demographic Data; Xiamen University: Xiamen, China, 2018. [Google Scholar]
- Wang, X.; Liu, Z.; Zhao, Z.; Wang, J.; Wang, H. Passengers’ Likely Behavior Based on Demographic Difference During an Emergency Evacuation in a Ro-Ro Passenger Ship. Saf. Sci. 2020, 129, 104803. [Google Scholar] [CrossRef]


Disclaimer/Publisher’s Note: The statements, opinions and data contained in all publications are solely those of the individual author(s) and contributor(s) and not of MDPI and/or the editor(s). MDPI and/or the editor(s) disclaim responsibility for any injury to people or property resulting from any ideas, methods, instructions or products referred to in the content. |
© 2023 by the authors. Licensee MDPI, Basel, Switzerland. This article is an open access article distributed under the terms and conditions of the Creative Commons Attribution (CC BY) license (https://creativecommons.org/licenses/by/4.0/).