1. Introduction
In an increasingly competitive business environment, companies must evaluate their competitive stance concerning their counterparts. Distinctive market positioning must be accomplished by adding value to the product, eliminating waste, as well as improving productivity [
1].
Lean philosophy was developed to optimize resource utilization by minimizing inefficiencies. It has garnered heightened significance within the current setting of international industrial competition [
2,
3]. The main objectives of the Lean philosophy in a company are cost reduction while upholding product/service quality, waste elimination, customer satisfaction, and the establishment of streamlined organizational efficiency and efficacy. Lean philosophy has progressively begun to be adopted by companies in search of greater efficiency in their performance [
4]. While certain Small and Medium Enterprises (SMEs) acknowledge the operational advantages inherent in Lean practices and tools, it remains evident that the adoption of such techniques is constrained by the lack of information, unclear demonstrable outcomes, and the shortage of required human and financial resources [
5]. Consequently, these SMEs fall short of realizing their full operational potential.
Additionally, a gap was identified in the literature related to the tailored implementation of Lean philosophy, specifically to the optimization of vehicle seat upholstery maintenance and repair processes. Thus, this study considers the application of Lean tools to optimize the activity of a Portuguese Small Enterprise (SE) in the upholstery industry. This SE recognizes in the Lean philosophy a suitable approach to increase efficiency in production processes, despite the restricted knowledge about this philosophy and its tools that are limited to collaborators on the medium management board. Thus, the importance of this case study lies in the possibility of helping this SE achieve its competitive potential through the optimization of its activities. For this purpose, Lean tools will be used to identify situations that overload the process with inefficiency and/or waste and rectify the problems identified. Henceforth, this study makes the following contributions:
The process improvement of the company under study—by using Lean tools, the company will increase its productivity; streamline its activity; and, ultimately, contribute to enhancing its competitiveness in its market.
Show that SMEs can benefit in optimizing activities from the implementation of Lean philosophy and its tools.
Complement the lack of studies of this nature in the upholstery industry, and the lack of studies on the optimization of the vehicle seat upholstery productive process through Lean tools.
Provide the literature with ideas and solutions for common wastes and inefficiency in productive processes, developed with Lean tools and Excel, which can be adapted according to each situation.
For this purpose, this article starts with a literature review that allows a proper knowledge of the Lean tools most suitable for this purpose. Next, the case study is presented. An initial survey of the operations is described. Afterward, we present a section dedicated to each Improvement Opportunity (IO) identified in the company’s activity. The results of the implementation of Lean tools are presented and discussed. Finally, some limitations and proposals for future works are detailed and a conclusion is presented.
2. Theoretical Foundation
This article’s portion is dedicated to presenting a theoretical foundation of the article’s subject matter. First, a review of Lean philosophy will be presented as well as some of its tools, namely, the tools used in the development of this study. Additionally, to outline the lack of studies of Lean implementation in the vehicle seat upholstery industry, this subject matter is also reviewed and presented. It will also display a review of some Quality Tools that were used.
2.1. Lean Philosophy
The term Lean Production was first used by John Krafcik, a researcher at the International Motor Vehicle Program, according to whom production can be characterized as Lean since it uses less human effort in the factories and, fewer engineering hours for the development of a new product (and in less time) while at the same time keeping a smaller amount of stock, and managing to provide fewer defects and a greater variety of products [
6]. Therefore, Lean Manufacturing (LM) prioritizes robust operations that are responsive, flexible, predictable, and consistent, thereby generating production that is focused on continuous improvement through a workforce driven by measures that are production-based, and aligned with customer performance criteria, needs, and expectations [
7]. It focuses on a highly responsive approach to customer demand by reducing waste and aiming to produce products and services at a low cost and as fast as required by the customer [
8].
The LM is based on the Toyota Production System (TPS), a production system developed by Toyota at a time when the Japanese automotive industry was suffering the consequences of World War II and facing a lack of resources, money, and skilled labor [
2]. Toyota was founded around 1918, with the drive and innovation of Sakichi Toyoda, Kiichiro Toyoda, and Eiji Toyoda, as well as Taiichi Ohno, a mechanical engineer [
9]. Sakichi Toyoda contributed by inventing a motorized loom with a specific mechanism designed to stop production if there was a break in the yarn being worked on the loom [
10]. This mechanism would later serve as the foundation for Jidoka, one of the main pillars on which the TPS would be built. Jidoka is a concept that features intelligent capabilities where machines automatically stop a process in case of an abnormality, problem, equipment malfunction, or quality problems, among others [
11]. Later, Kiichiro Toyoda realized that it was necessary to create a fast and flexible production process to meet the requirements and demands of customers, with high quality and reasonable price. The idea behind this approach was that, in the market, each customer buys a different car; therefore, in manufacturing, cars should be made one at a time. To do this, Kiichiro Toyoda began by preparing the system to produce according to a Just-in-Time (JIT) methodology. JIT means being able to purchase products at the right time and quantity to eliminate waste, uneven production, and unreasonableness while improving efficiency [
10,
12].
Around the 1950s, Eiji Toyoda became the general director of production and was sent to visit Ford and General Motors, bringing back ideas of implementing mass production for Toyota. However, monetary constraints and the low volume in the Japanese market did not justify large batch sizes. Thus, later, the person who would give a crucial push in the development of TPS and its ability to produce a large variety in small batches economically would be Taiichi Ohno. One of Ohno’s most notorious contributions concerns a “Kanban supermarket” for controlling material replenishment. The result was a production system able to produce a considerable variety of cars in low volumes and at a competitive cost, changing the conventional mass production way of thinking and a production system that would turn out to be a reference for production all over the world [
9].
The TPS was named as the first system to work under Lean guidelines, and as such, LM is considered a successor to TPS, adding some principles to set standards to increase the performance of an organization [
10]. Those principles are presented in
Table 1. In terms of wastes that affect a productive process, initially, the Lean philosophy identified seven wastes; however, an eighth source of waste is now also considered. These wastes are presented in
Table 2.
2.2. Lean Tools
In this article, considering the IO identified in the company’s activity, and the developed proposal for their enhancement, the following tools were used: Gemba, Value Stream Mapping (VSM), Spaghetti Diagram, 5S, Standardized Work, Kaizen, Kanban, and Poka-Yoke.
2.2.1. Gemba
Gemba is a term that refers to the actual place and environment where materials, products, and product development take place [
15]. The antecedents of Gemba go back to Taiichi Ohno and Shigeo Shingo in LM, who documented many instances where they had visited the workplace to obtain clear insights into problematic issues and associated practices [
17]. Thus, this Lean tool consists of knowing each operation and its metrics properly, i.e., understanding the real situation, which requires going to the Gemba; this allows for enhancing competitive advantage because, by closely monitoring operations, the person in charge can quickly know where they stand and obtain valuable insights into production cycle times, waiting times, inventory, and reworks [
15,
17,
18].
2.2.2. Value Stream Mapping (VSM)
VSM allows one to describe the flow of the entire production process, including the flow of materials, the flow of information, and the flow of products from suppliers to customers [
19]. For this reason, it allows one to visualize, identify and quantify activities as Value Added (VA), Non-Value Added (NVA), and Necessary Non-Value Added (NNVA) activities. VA refers to the actual part of the process that translates into effective output and actual production for which the customer pays and integrates activities of information transformation, engineering transformation, and accounting, among others. NVA activities refer to pure waste and NNVA activities refer to those that are necessary even if they do not add value from the customer’s perspective (for example, inspections, control systems to check that procedures are being followed, and documentation, among other activities) [
15].
When value streams are analyzed, it is possible to identify activities that do not create value (NA and NNVA, that is, waste); identify that these activities consume most of the time and resources; and find, through their elimination, that is is possible to bring radical improvements in time and cost and ensure a continuous flow of value-creating processes [
20]. For this purpose, the premise behind this tool is the elaboration of a VSM of the Current State of the operations, analyzing the real value of the product, followed by redesign (using analysis to reduce waste, shorten delivery times, and improve material flow) and, finally, the development of a VSM of the Future State of operations [
3].
2.2.3. Spaghetti Diagram
A Spaghetti Diagram, Spaghetti Chart, Spaghetti Model, or Spaghetti Plot is a method to view the movement of an object (worker, material, and so on) in a system (production area, part of a building or a workshop, for example) with the help of lines. The lines are drawn in a certain layout, with various colors or types of lines depending on the different flows, and to help identify the movement lengths, number of movements, overlapping and crossing movements, and their characteristics according to the chosen classification. The new layout should have lines as short as possible and without many intersections [
21,
22].
This tool, therefore, allows capturing the existing condition and visually displaying what happens in the process, thereby identifying opportunities for reducing and/or eliminating waste as well as identifying inefficient movements and ineffective areas, downsizing the number of staff, and making changes to the work organization or the workstation layout [
15,
21].
2.2.4. 5S
The 5S tool is a workplace organization technique used to organize and create quality in the workplace, representing a tool for cleaning and organization to improve efficiency by eliminating waste [
23]. It is based on five Japanese words beginning with the letter “s”, which are presented and explained in
Table 3 based on data available in [
24].
The continuous implementation of the 5S methodology reveals several advantages, such as [
25] improved quality of products and services; clean and productive work environment; improved maintenance and safety; cost reduction; increasing effectiveness in the processes; discipline and better engagement in the workplace; improved sense of responsibility and teamwork; better equipment reliability; reduced waste; less space for storage; less wasted labor time; and reduced production and setup times, among others.
2.2.5. Standardized Work
Standardized Work is a system of detailed and documented descriptions by which operators develop and follow a sequence of tasks that are repeated within a job used to maintain order and consistency in operations and reduce process variation by defining a baseline for continuous improvement [
26]. The application of a standard operation method —in other words, a work instruction—is one of the safest and most effective ways to use resources such as people, machines, and materials efficiently; to make operations sustainable; and, overall, to allow greater documentation and recording of each procedure, reduction in process variability, and ease in training new workers [
20,
27].
2.2.6. Kaizen
Kaizen consists of two words, Kai, which means development, and Zen, which means continuous; thus, Kaizen is the Japanese word for “continuous improvement”. It refers to a philosophy that ensures not only continuous improvement towards the perfection of the activity but also addresses measures to be taken to reduce and/or eliminate inefficiencies that are identified, through logic and systematic thinking, aiding in boosting production, quality effectiveness, resolving environmental challenges, and establishing a problem-solving culture [
2,
20,
28].
Kaizen equips workers with individual skills for effective work in small groups to solve problems; document processes; and improve data collection, analysis, and self-management within the small group. This way, it drives decisions or proposal-making by employees, fostering debate and the involvement of all; helps the organization achieve its goals by increasing its objectives, profits, efficiency, productivity, and competitiveness; and reduces Muda and expenses through the involvement of each employee [
15,
29].
2.2.7. Kanban
A Kanban is a system of moving parts, products, or materials, whereby the movement between workstations on a production line is based on the use of cards (when a card is allocated to each item in production, the set of cards, is called a Kanban System) [
3]. It is essentially cards that instruct the production line to produce a certain quantity of a certain item on the premise that parts are only delivered to the production line when they are needed for production [
15]. This allows the elimination of storage in the production area between work phases. An E-Kanban System replaces of the physical cards with an electronic notification (either a notification on a computer or a smart device like a barcode scanner, for example) [
30].
A Kanban process must be executed following three key principles [
31]:
Visualize the workflow: by creating a visual model of the work and its flow, splitting the work into pieces, writing each item on a card, and putting the card on a Kanban board, it is possible to observe the flow and increase communication and collaboration.
Limit the work-in-progress: by limiting how much unfinished work is in process, the team can reduce the time it takes for an item to travel through the Kanban pipeline, avoiding problems caused by task switching and providing agility by enabling new incoming tasks to be effectively prioritized.
Focus on flow: smooth the flow of work and make sure the team is focused on getting work completed.
2.2.8. Poka-Yoke
Depending on the type of industry, the human factor is recognized as the cause of up to 80% of failures, which means that humans more or less directly contribute to a significant part of the failures. Thus, Poka-Yoke was developed by Shigeo Shingo, with the premise of using simple, inexpensive but effective techniques to avoid human error [
32]. So, this tool refers to any idea, device, mechanism, or solution that allows for the detection of errors, which later become defects that decrease the final quality of the product [
18,
33].
Poka-Yoke’s main advantage is that it works as process control, which allows feedback and, therefore, decision-making and undertaking immediate actions, which can generate a corrective measure [
34]. In other words, it ensures that the appropriate conditions exist before moving on to the next stage, thereby preventing errors from occurring at all and, avoiding their propagation throughout the process [
35].
2.3. Lean Implementation in the Upholstery Manufacturing Industry
When searching the literature for case studies that addressed the topic, several interesting and relevant studies were identified, which are presented in
Table 4.
As it can be concluded from this subsection, it appears that in the literature there are few studies of the implementation of Lean tools for production optimization in the upholstery industry and, more specifically, regarding the upholstery maintenance/production of vehicle seats as most of the studies found address productive processes in the furniture industry. However, the case studies identified and presented provide an important basis for the best tools—namely, 5S, Standardized Work, Kanban, Kaizen, VSM, and layout studies (Spaghetti Diagram)—and how to proceed in terms of implementation steps. They also provide a guiding thread of methodology to follow in a practical approach similar to the one carried out in these studies. Moreover, the reviewed studies provide a guide in as to what kind of results to expect from the implementation of the named tools and Lean practices mainly, the reduction of waste and, consequently, of the production Lead Time, while improving workers’ motivation through a clean and organized workplace and improving work ergonomics and safety.
2.4. Quality Tools
In this article, three Quality Tools were used: Flowchart and Checklist, which areboth part of the Seven Quality Tools, i.e., appropriate tools that do not require formal training in statistics and can be used to solve a large part of quality-related problems; GUT Matrix.
2.4.1. Flowchart
The Flowchart is an aid diagram to allow better understanding of the problems, clarifying the archetype of their solutions, that is, through the illustrative example of the process, it is possible to observe the general picture and the context of a project or situation. It contains inputs, activities, decision points, and outputs to represent the main objective of the process and shows the process from start to end, which is stopped if any product defect occurs. Moreover, it helps to study, plan, improve, and communicate complex processes simply and clearly to handle defects and quality problems [
40,
41].
2.4.2. Checklist
This tool refers to the collection of process data. It is used to systematize and facilitate the collection of data on a potential quality problem and one of its main applications concerns the collection of information on an attribute during inspections to identify defects in production. The Checklist sets up a reliable, compelling, and conservative approach that can be applied in the auditing of quality assurance for checking on and following the steps in particular processes, and it helps the user to organize the data for later usage [
40,
41].
2.4.3. GUT Matrix
This tool is used for prioritization actions in planning and decision-making, by ranking problems against three criteria [
42]: Gravity, Urgency, and Tendency. The Gravity criterion refers to the possible damage or losses that may occur as a result of an incorrectly addressed situation, i.e., it refers to the intensity and depth of the damage that the problem can reach if there is no intervention. The Urgency criterion is related to the time available to correct or solve a given problem before the results of the situation become undesirable and harmful. The Tendency criterion refers to the pattern or tendency of worsening the situation, i.e., the development that the problem will have in the absence of intervention [
42,
43].
The premise of the GUT Matrix is based on the classification of problems concerning each of the mentioned criteria according to the classification presented in
Table 5; subsequently, the GUT calculation is performed. This calculation is the multiplication of the classification given to each criterion, thus indicating the higher or lower priority of the problem compared with the others [
42,
43].
3. Case Study
The SE in question specializes in the maintenance, renovation, and/or repair of upholstery for light motor vehicles and heavy motor passenger transport vehicles from various industries.
3.1. Problems Identified
After analyzing and characterizing this SE’s activity, simultaneously with a visit to the Gemba and observing operations on the shop floor, two major critical problems for the company’s productivity and efficiency were identified, which will generically be named Problem Nº1 and Problem Nº2 because they refer to two different subject matters—one refers to stock control and the other to non-productive time—but both represent key problematic issues that directly affect the company’s performance and its production rate. Also, as both problems were solved through different methodologies, this name distinction was found to be the most adequate.
3.1.1. Problem Nº1
The first problem, Problem Nº1, refers to the lack of rigorous control of the number of stocks in the company. This SE’s stocks are mainly fabrics and foams, however, many other categories of products are parts of its inventory and are used/consumed daily by the employees throughout the production process until the final product is ready to be delivered to the customer. Nevertheless, the products are not controlled in terms of time or quantity, which means that no control allows verifying the stocks of a given product at any time or at the beginning of a project. This leads to the existence of one of the seven wastes: “Overstocking” (as well as the opposite situation of insufficient stock)—due to the lack of accurate stock control, the company ends up ordering more or less than the necessary amount to supply a project. In addition, some fabrics have a simple identification label, however, the remaining products (which are over 900 products), do not have any identification or reference. This lack of a rigorous label for all of the products leads to another Lean waste: “Movements”. The Worksheet is grouped into a sample of fabric which is the one that must be used in the project; according to this sample, the workers orient themselves by moving to the fabric shelves and looking for a similar fabric. The lack of a label means that workers have to move unnecessarily between shelves to find the fabric corresponding to the sample (which is also a waste of time). Problem Nº1 will be solved through the development of a Decision Support System (DDS) for stock control and management.
3.1.2. Problem Nº2
The second problem, Problem Nº2, concerns the light motor vehicle section, in which, according to a productivity study carried out by the company, there is about 40% of non-productive time. So, this study will use Lean tools to reduce this percentage, studying the most critical productive process in this section. In terms of the seven wastes, this productive process verifies the existence of the “Waiting” waste—in all the unnecessary waiting times; “Transportation” waste—in all the unnecessary displacements; and two specific situations of the process including the “Defects” and “Movements” wastes, which will be detailed in a further section.
4. Improvement Proposals
This section will first present and elaborate on the DDS for stock control. Next, Lean tools will be used to characterize the SE’s Current State and, subsequently, opportunities will be identified. The Future State of operations will be analyzed and, using Lean tools, improvement proposals will be explored for the identified opportunities.
4.1. DDS for Stock Control
The DDS for stock control was developed using Microsoft Excel software, a tool used for data analysis and visualization, because it is a tool already used by companies in their everyday activity and manages to meet the necessary functions for stock control without implying a monetary investment while also being easy to understand and used by everyone regardless of their academic background or professional experience. For this purpose, a dashboard was created that contemplates the option to head to three different controls that complement each other: “Weekly Control”; “New Project”; and “Creation of a New Reference”. This dashboard also contemplates the option of heading to an Instructions page where everything is explained (how to use the DDS and information about the Coding Standard developed).
For these controls to be carried out, the first step in the preparation of DDS was the creation of an “Inventory” sheet. This sheet contemplates a dynamic table with the following columns/information: “Category”; “Supplier”; “Product Description”; “Reference Code”; and “Contact”. The “Category” column was created to group the products so that they are easier to control and simpler to monitor and code; thus, 17 main categories were created. The “Supplier” column is a list of the suppliers of each product. The column “Product Description” refers to the complete exposition of each product according to its characteristics and specifications, for example, color and measurements. The “Contact” column presents the telephone number or email of the suppliers of each product. Finally, the column “Reference Code” was filled using the following standard: the initials of the Category, the initials of the Supplier, and the initials of the Product Description, with each set of initials being separated by a dot and, to these, numeric specifications were added. This coding will reduce the waste “Movements” identified in
Section 3.1.1 because by knowing exactly which product the worker has to look at, there will be less displacements between the fabric shelves looking for the fabric corresponding to the sample attached to the Worksheet.
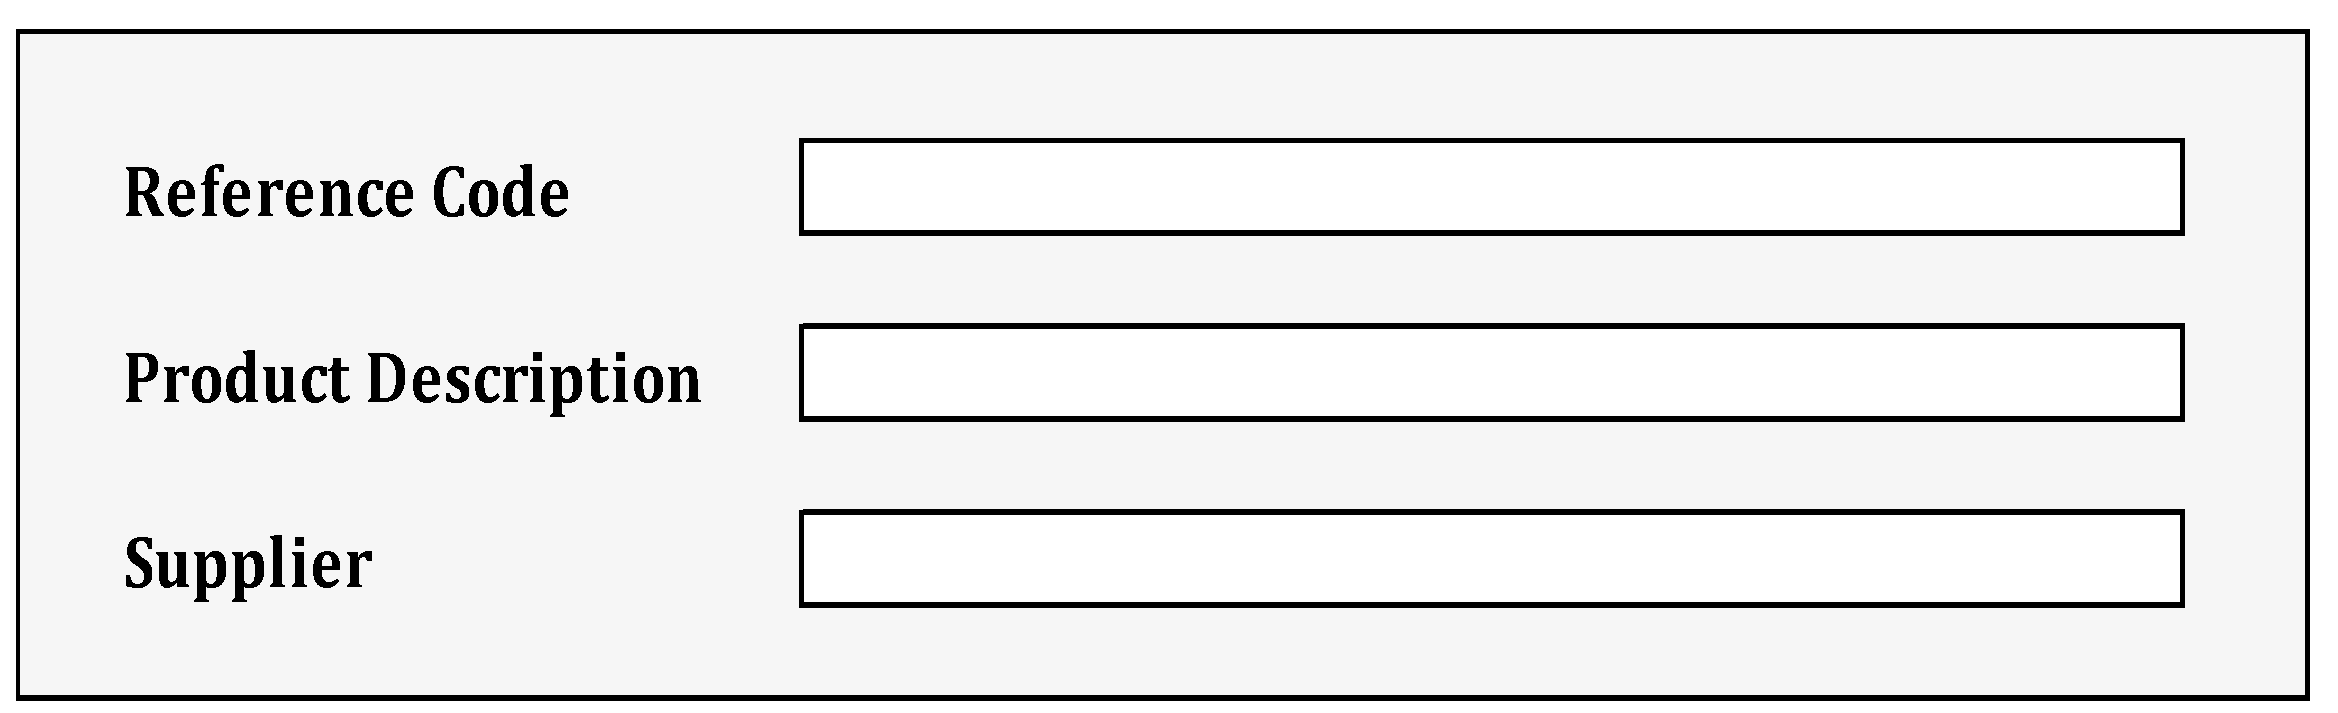
This “Inventory” sheet was developed so that each product can be identified by the generated reference code and thus controlled in Excel by always referring to the respective code. For everything to work correctly, it is proposed to label all products in stock on a simple label, such as the one proposed in
Figure 1.
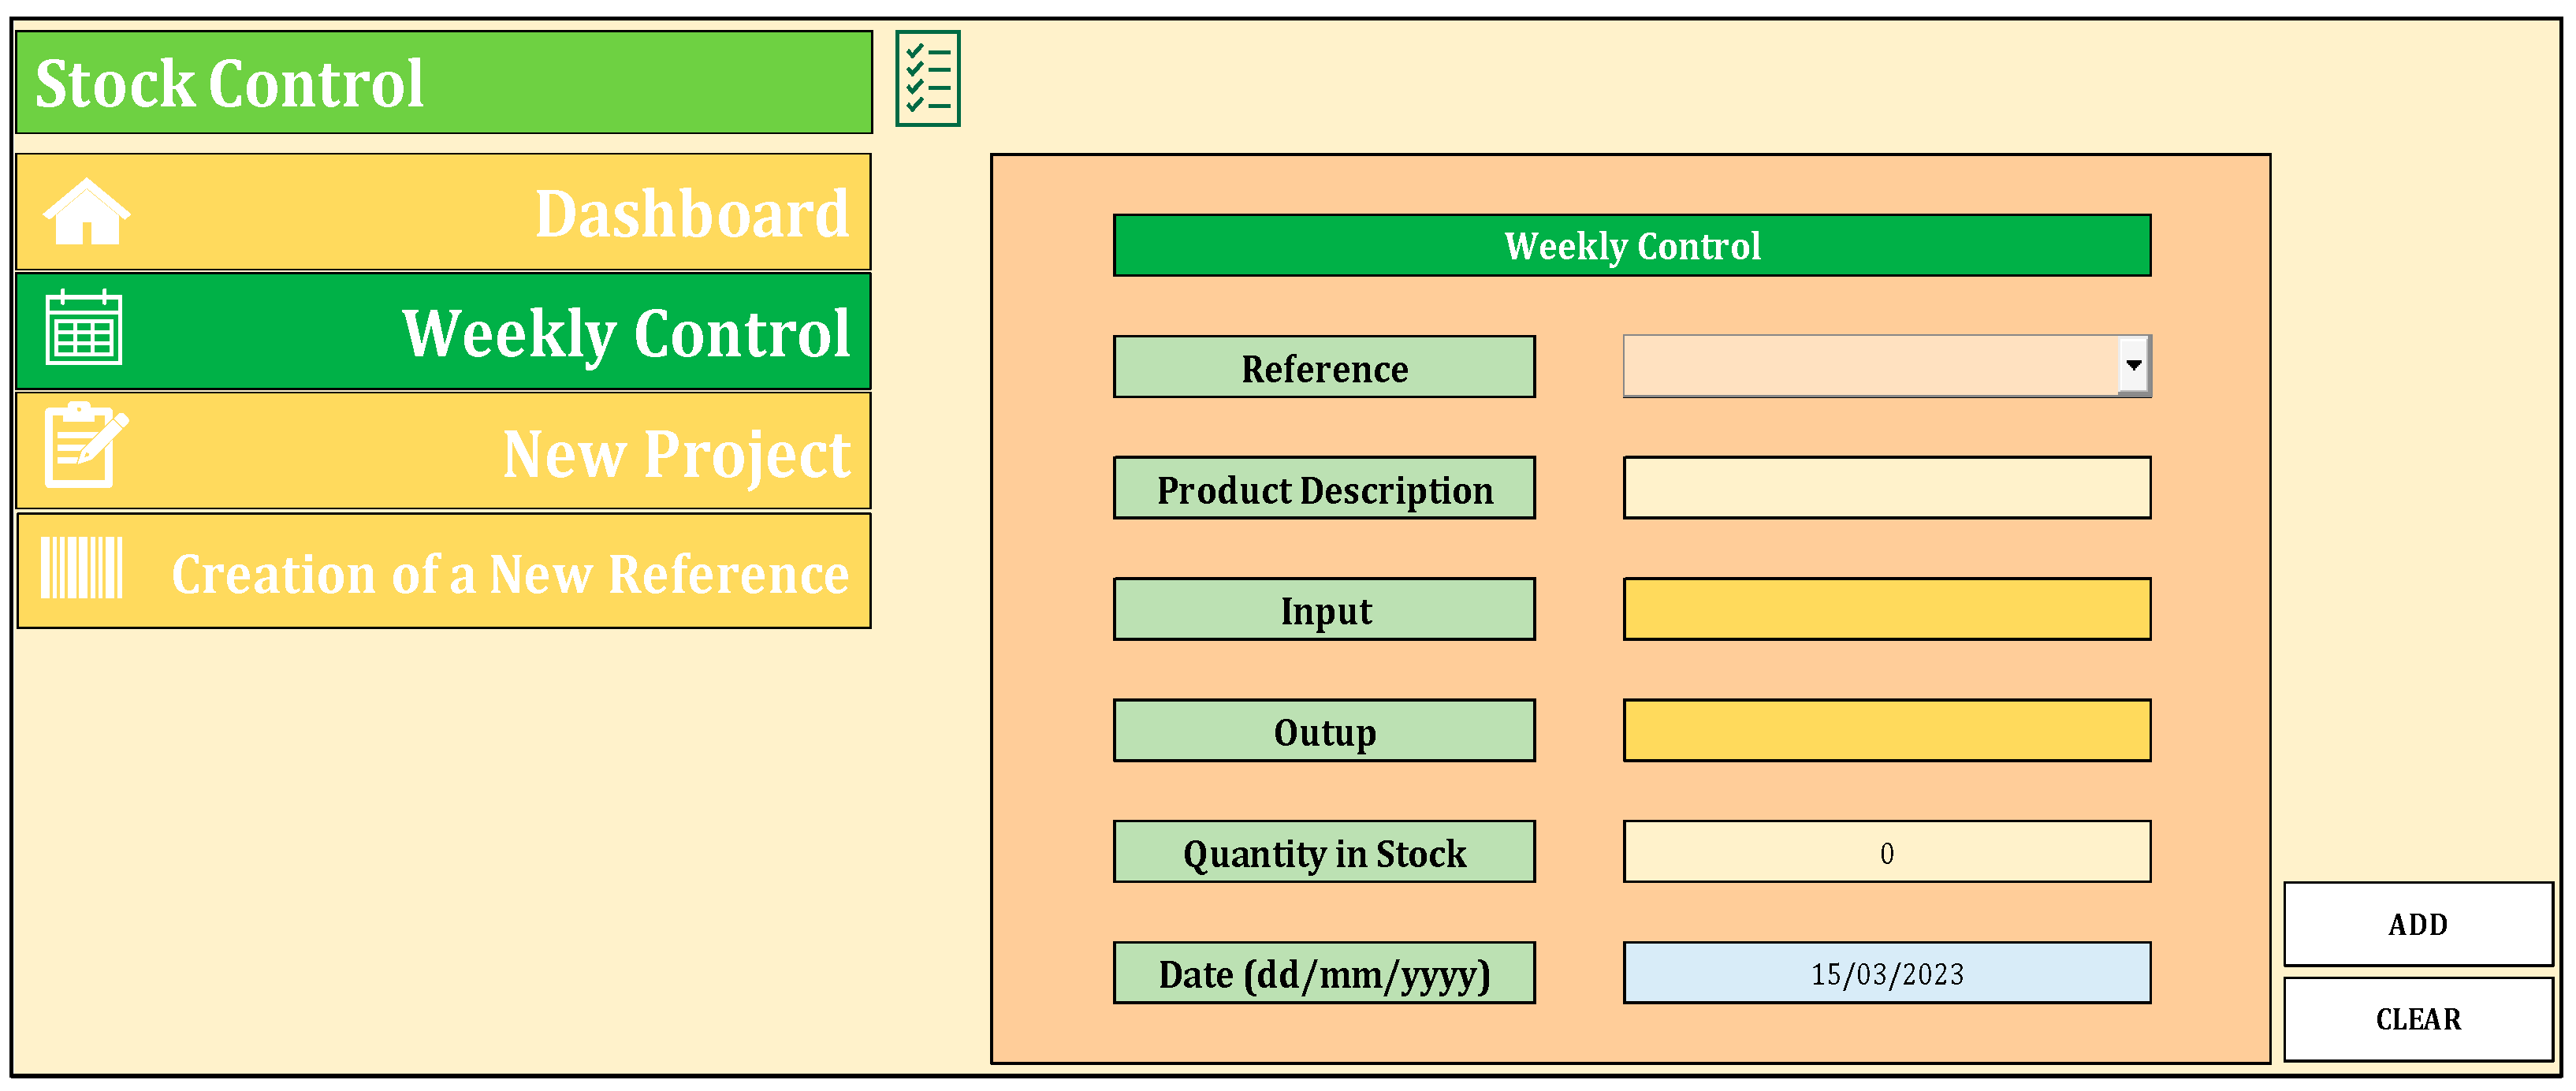
4.1.1. Weekly Control
“Weekly Control”, whose interface is shown in
Figure 2, is associated with the implementation of a Control Sheet (CS) in every storage zone that the SE has.
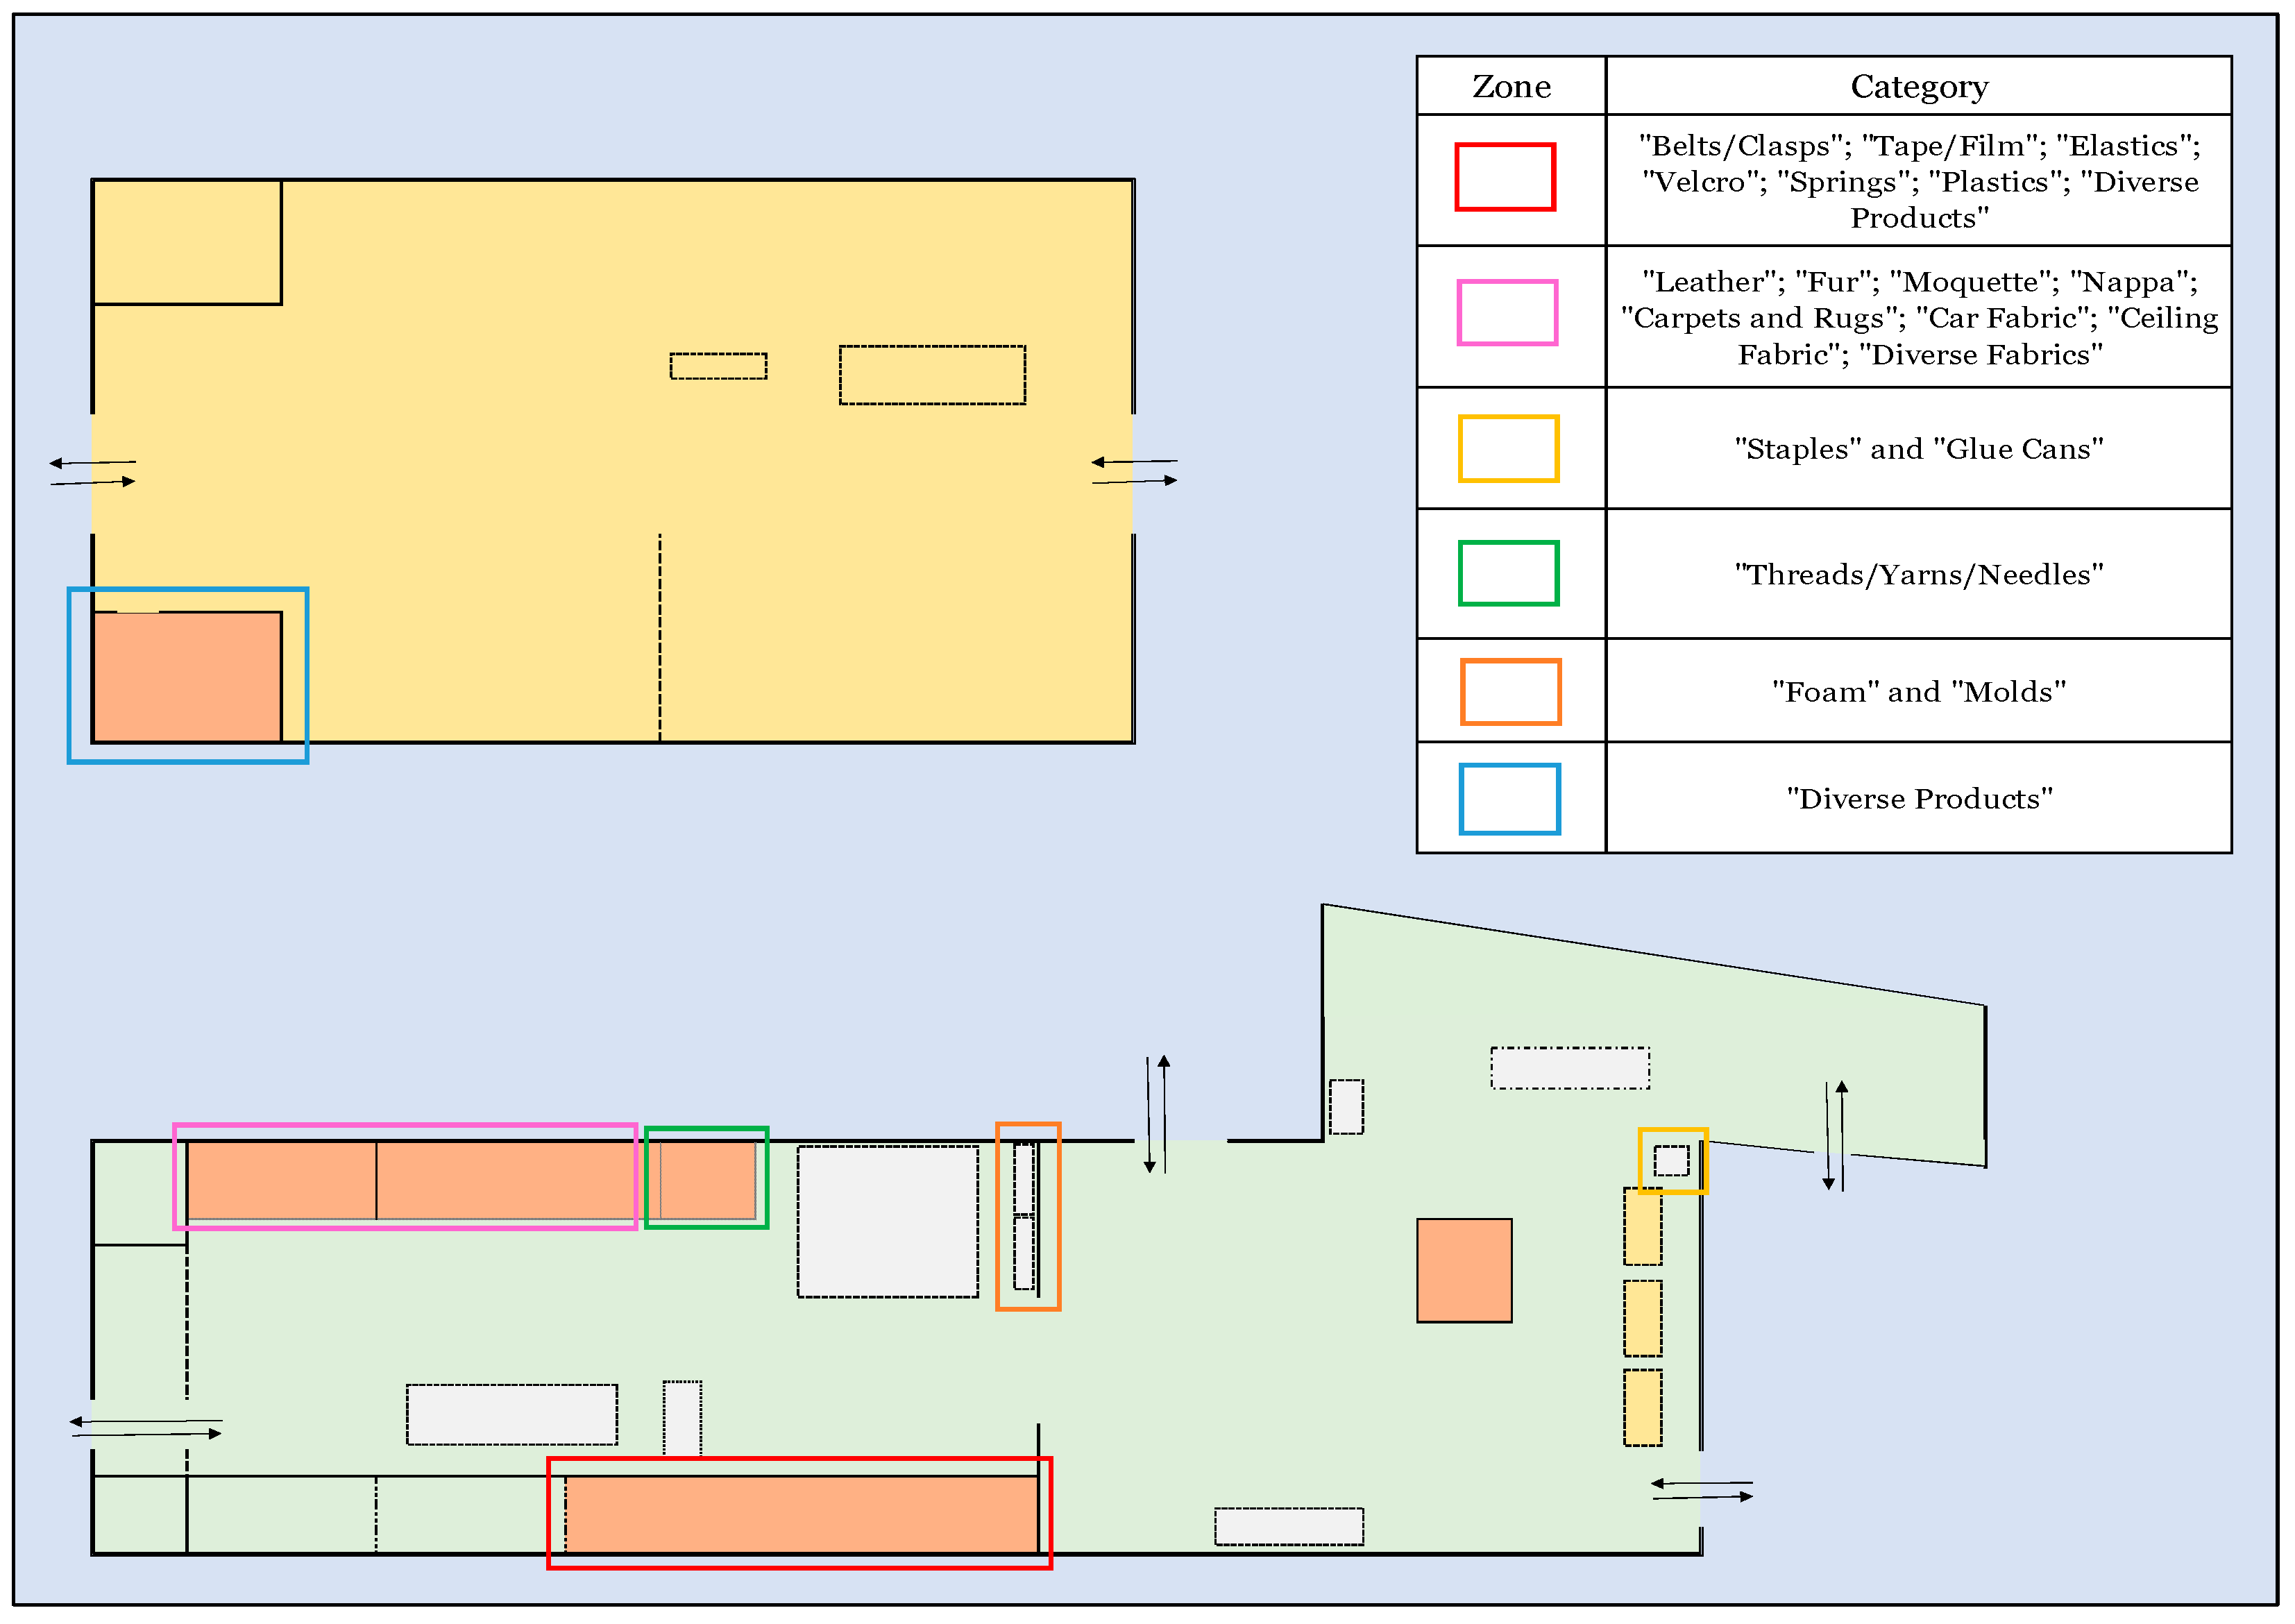
The proposed CS contains the following information: “Date” (dd/mm/yyyy); “Worker” (signature); “Category”; “Reference Code”; and “Output”, which should be filled in each time a worker removes any quantity that is in storage; and a column named “Check” to be filled by the person responsible for stock control when adding this information in the DDS, in the “Weekly Control”. To streamline the use of the CS by workers, a map of the storage areas of the different categories was created, which is presented in
Appendix A. This map should be placed in each work area to allow each worker to have a quick source of information regarding where the material they are looking for is located according to the material’s category. Weekly, a named, responsible individual should survey the outputs registered in the CS, and enter this value associated with the date in the DDS as well as any entry that has existed for that product. This way, a “History” sheet will also be created and regularly updated.
The first step was the elaboration of the interface shown in
Figure 2; afterwards, functions were assigned to each cell. In the “Reference” cell of
Figure 2, the reference code corresponding to the withdrawn or added product should be selected. For this purpose, a searchable list was created (with a combo box, “ActiveX Control”). The “Product Description” (in
Figure 2) cell has the function of automatically displaying the product description associated with the code entered in the “Reference” cell using the XLOOKUP command. The purpose of this cell is to minimize errors, for example, entering a quantity for the wrong product. The “Input” and “Output” cells (from
Figure 2) are meant to be filled with the quantities consumed and/or acquired during the week. The “Quantity in Stock” cell in
Figure 2 will allow the visualization of the quantity in stock through the sum of the quantities, with reference to the respective code in the “History” sheet, using a SUMIF command. The buttons “CLEAR” and “ADD” were created with the Excel Macros option.
To use this control, the user must follow the following order of application:
Select the reference code of the product being controlled;
Select the date;
Enter the input value if any quantity was purchased, or the value “0”;
Enter the output value, i.e., the consumption of the week;
Click on the “Add” button;
Automatically, an updated stock quantity will appear (and the information will be added to a “History” of inputs and outputs sheet);
Click on the “CLEAR” button;
Insert new reference code;
Repeat steps 1 to 7.
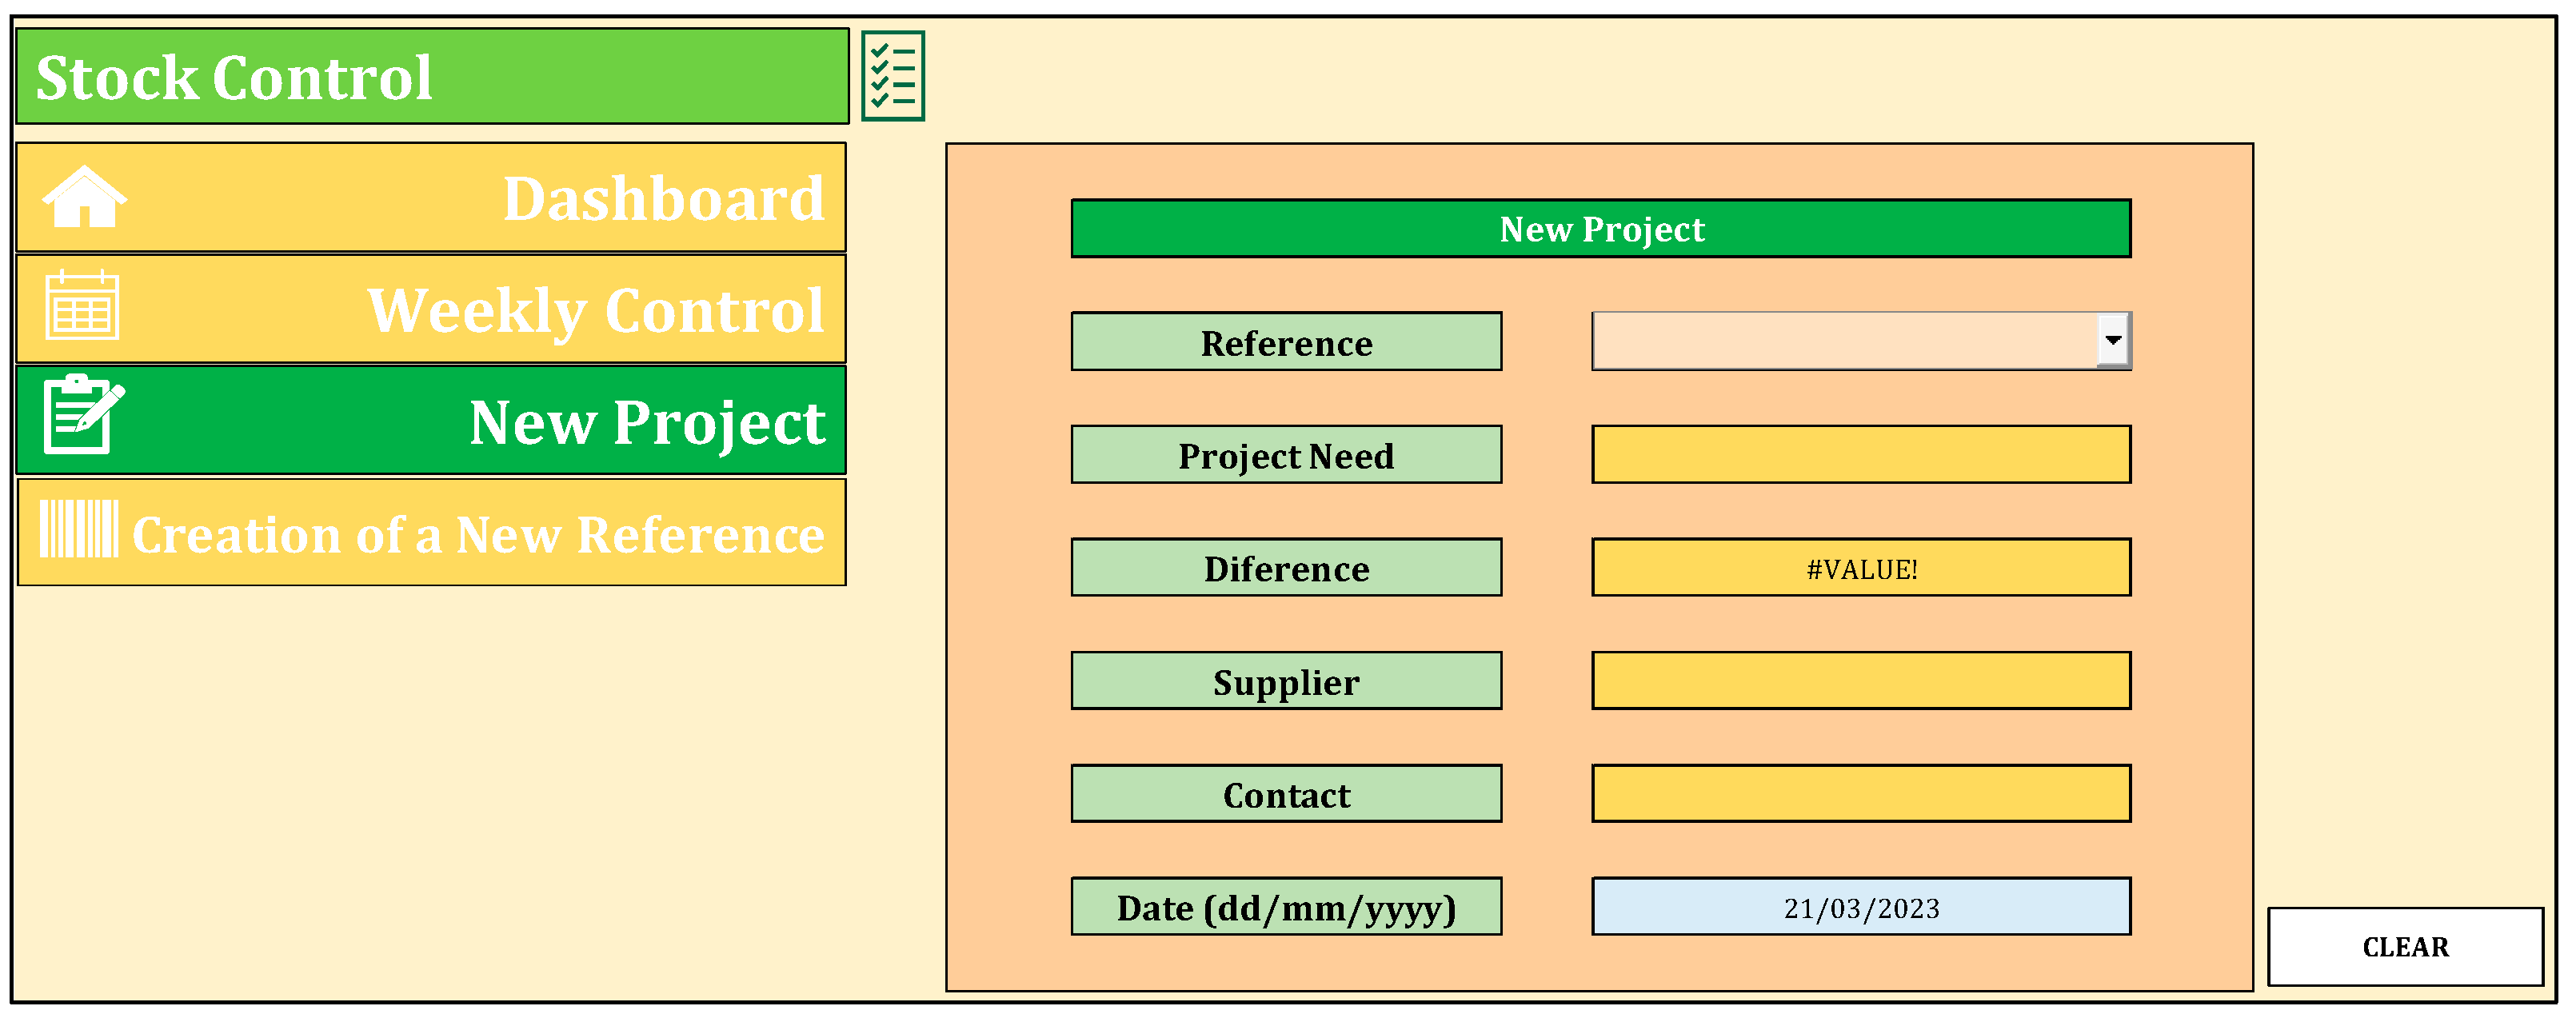
4.1.2. New Project
The “New Project” control, whose interface is shown in
Figure 3, refers to the arrival of a new project. In this case, in the company, a planning meeting is held where the SE estimates the needs of the project. Thus, the DDS in this control will compare these needs with the stocks, automatically returning the missing quantity (if that is the case) according to the “History” sheet.
This control will eliminate the waste “Overstocking” identified in
Section 3.1.1 because the exact quantities needed to supply a project will be known, i.e., nothing will be ordered in excess. The lack of stock in the middle of the project will also be eliminated.
The “Reference” cell from
Figure 3 refers to the introduction of the reference code of the product whose need to order is to be assessed; as in “Weekly Control”, it was developed using a searchable list. The “Project Need” cell is purely a fill-in cell, with the estimated value from the planning meeting. The “Difference” cell will indicate the missing quantity, i.e., it will find out what the existence in stock is (according to the “History” on inputs and outputs created by the “Weekly Control”) and compare this value with the need of the project. For this purpose, it uses IF, SUMIF, and XLOOKUP commands. To this cell, Conditional Formatting was also added so that it assumes the color green if there is no quantity missing or the color red if a greater quantity is needed than there is in stock. The cells “Suppliers” and “Contact” are filled automatically when the reference code is selected using an XLOOKUP command. These cells were developed to speed up the ordering process of the missing quantities.
To use this control, the user must follow the following order of application:
Choose the reference code of the product whose quantity one is evaluating;
Select the date;
Enter the required quantity of the product in question for the project;
The quantity to be ordered will automatically appear, as well as the supplier associated with that product and its contact;
Select the “CLEAR” button;
Repeat the previous steps for the products whose need for the project is to be analyzed against the quantity in stock.
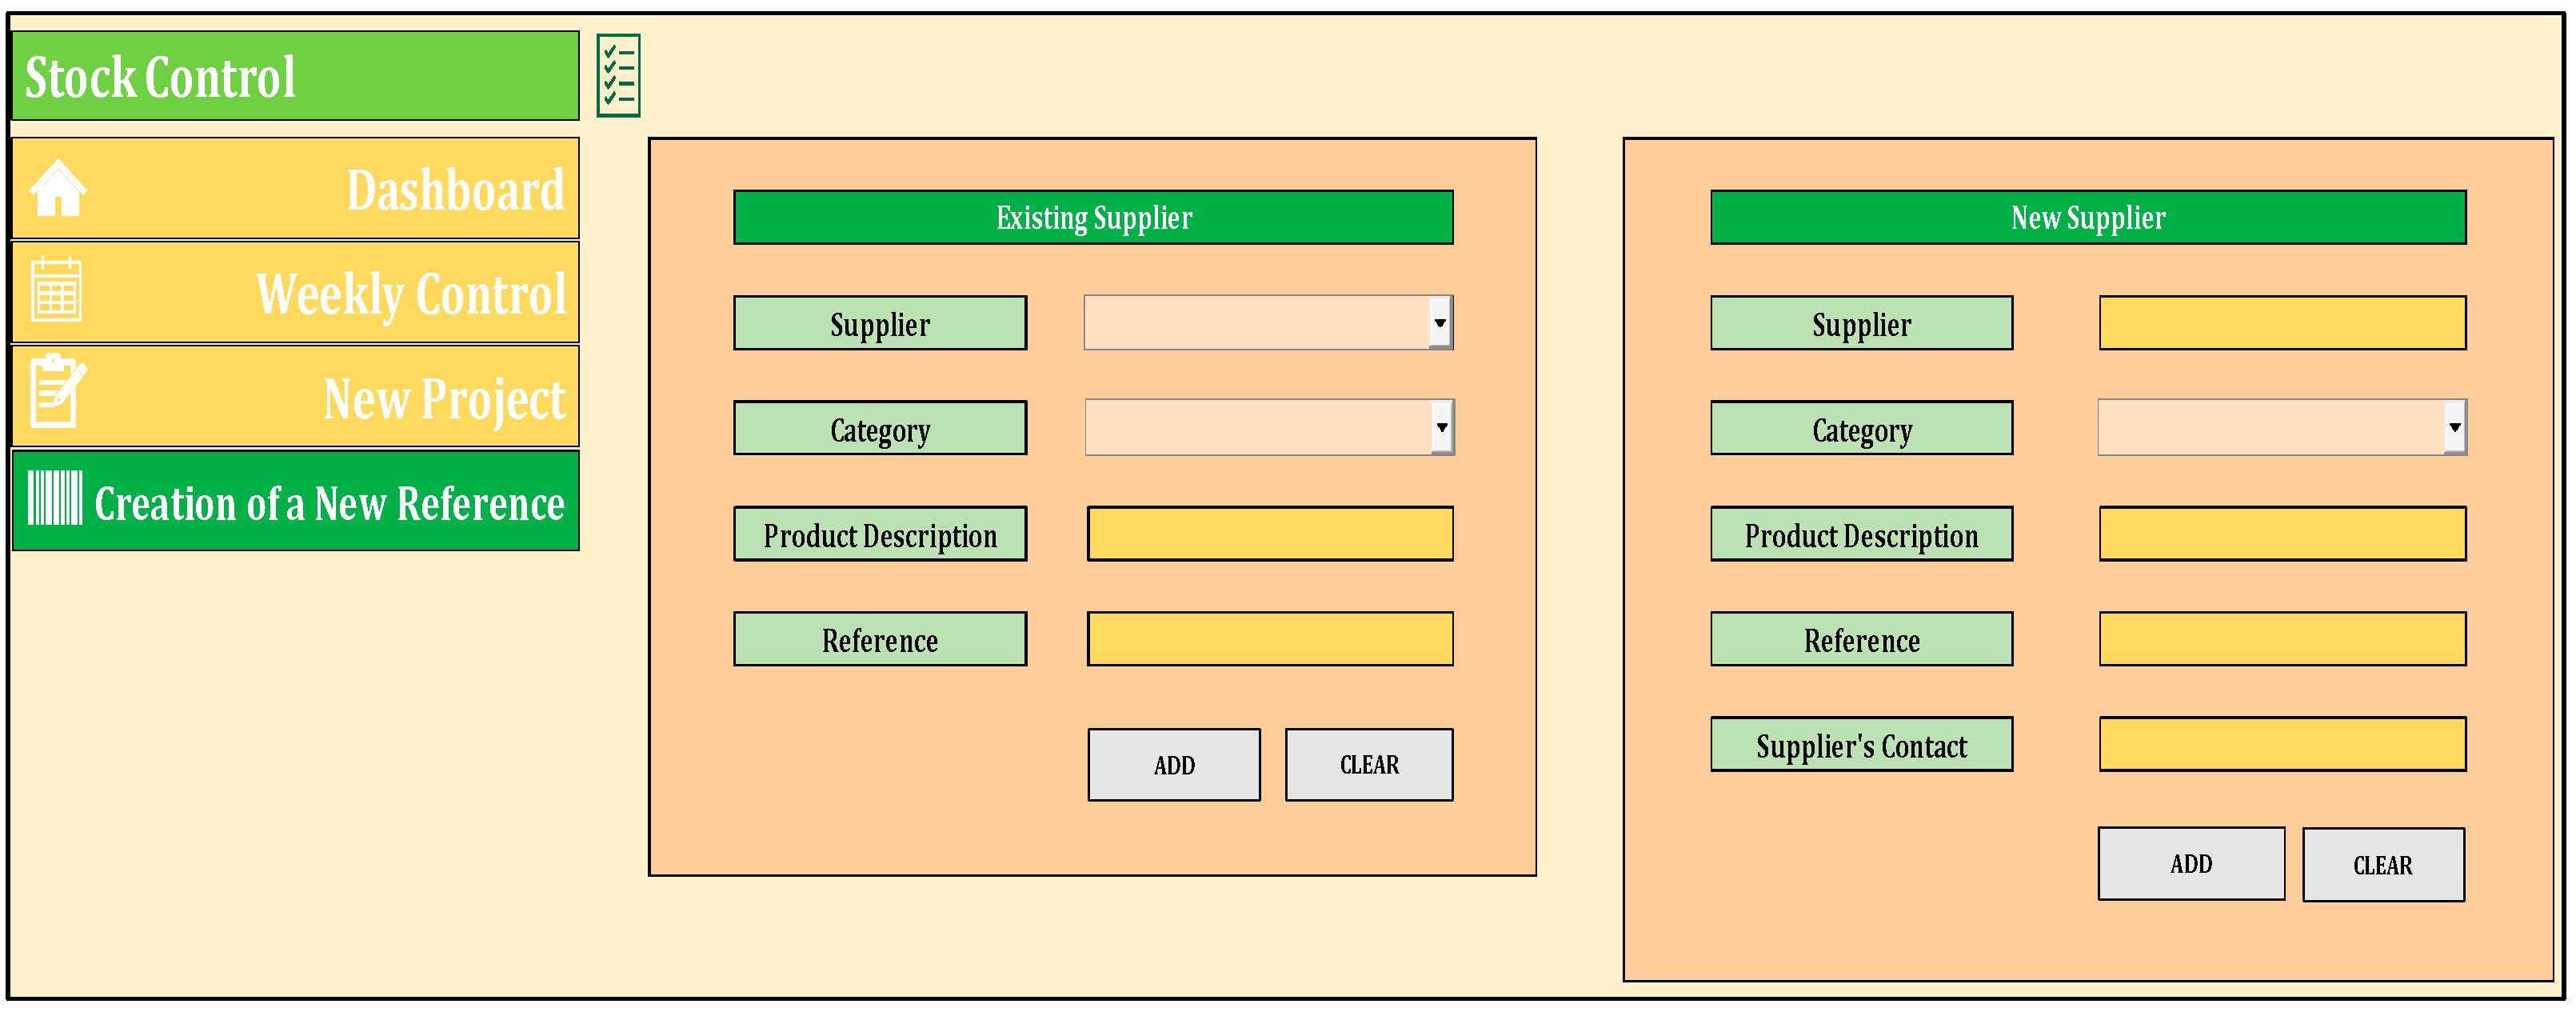
4.1.3. Creation of a New Reference
The “Creation of a New Reference” control, whose interface is shown in
Figure 4, should be used when the company is faced with the need to purchase a product that it has never used. So, since the DDS always refers to the product reference code, a reference will have to be generated to refer to the new product that is to be acquired.
Two different possibilities were considered for this control: the new product will be purchased from a supplier that the company has already used, which therefore already exists in the DDS database, or the new project will be purchased from a supplier that is completely new to the company and, therefore, their name and contact details must be added to the DDS database. In the first situation, since the supplier will already be in the DDS database for the “Supplier” cell, a searchable list was created. Since the coding of the product is linked to its category for the “Category” cell, a searchable list was also created. The “Product Description” cell is merely a fill-in cell, where the user must detail the new product characteristics. The “Reference” cell is also purely for filling in, according to the code standard proposed. In the second situation, since the supplier that the company will use to purchase the new product will also be new, the “Supplier” and “Supplier’s Contact” cells are fillable, to add the information to the DDS database.
To use this control, the user must follow the following order of application:
Select the supplier (in the first case) or enter the new supplier’s name and contact (in the second case);
Select the category of the new product;
Describe the characteristics of the product;
Insert the reference code according to the coding standard;
Click on the “ADD” button;
Click on the “CLEAR” button;
This reference will be ready for use (as well as the data of the new supplier in the second case);
Repeat steps 1–7 to create another reference.
4.2. VSM
In Gemba, by observing and analyzing the productive process, a Flowchart of it was developed. Then, to analyze where waste and improvement opportunities existed, the production process of the Flowchart (the most critical process of the most representative product repaired in this work section—a seat) was subdivided into various steps. Afterwards, each step was detailed in terms of the activities that comprise it, movements made, and existing wait, and each activity was then classified as VA, NVA, and/or NNVA according to the criteria presented in
Section 2.2.2. The cycle time of the different phases as well as the waits were measured by direct observation; timing; and, where timing was not possible, by estimation indicated by the workers of the light motor vehicle section. With this information, the VSM of the Current State was developed, from which the values presented in
Table 6 were obtained.
The Lead Time corresponds to approximately 8 h and 17 min. This is the total time that it currently takes to repair and renovate a seat upholstery in the SE allocated to the study. Although, in this section, more products than the seats are renovated, maintained, and/or repaired, to visualize the current situation, it will be considered that the company, in the light motor vehicle work section, only works on the repair and maintenance of the vehicle’s seat upholstery. Knowing that a month has 22 working days and that the company only works on one 8 h shift, in a month, the SE works 633.600 s. Thus, theoretically, the SE would currently be repairing about 21 seats per month according to Equation (1).
Given the Current State, proposals for improvements to reduce and/or eliminate NNVAs and eliminate NVAs were investigated and explored. These proposals will be detailed in the next subsection according to the Lean tool that allows their reduction and/or elimination. Given these proposals, each cycle time will take new values. With those values, the VSM of the Future State was developed, from which the values presented in
Table 7 were obtained.
The Lead Time of a seat upholstery in the Future State is approximately, 6 h and 7 min according to
Table 7. Similarly to what was done for the Current State, it will be considered that the SE, in the light motor vehicle section, only operates in the repair of the vehicle’s seat upholstery. Attending to this consideration, in the Future State, the SE would repair about 28 seats per month according to Equation (2).
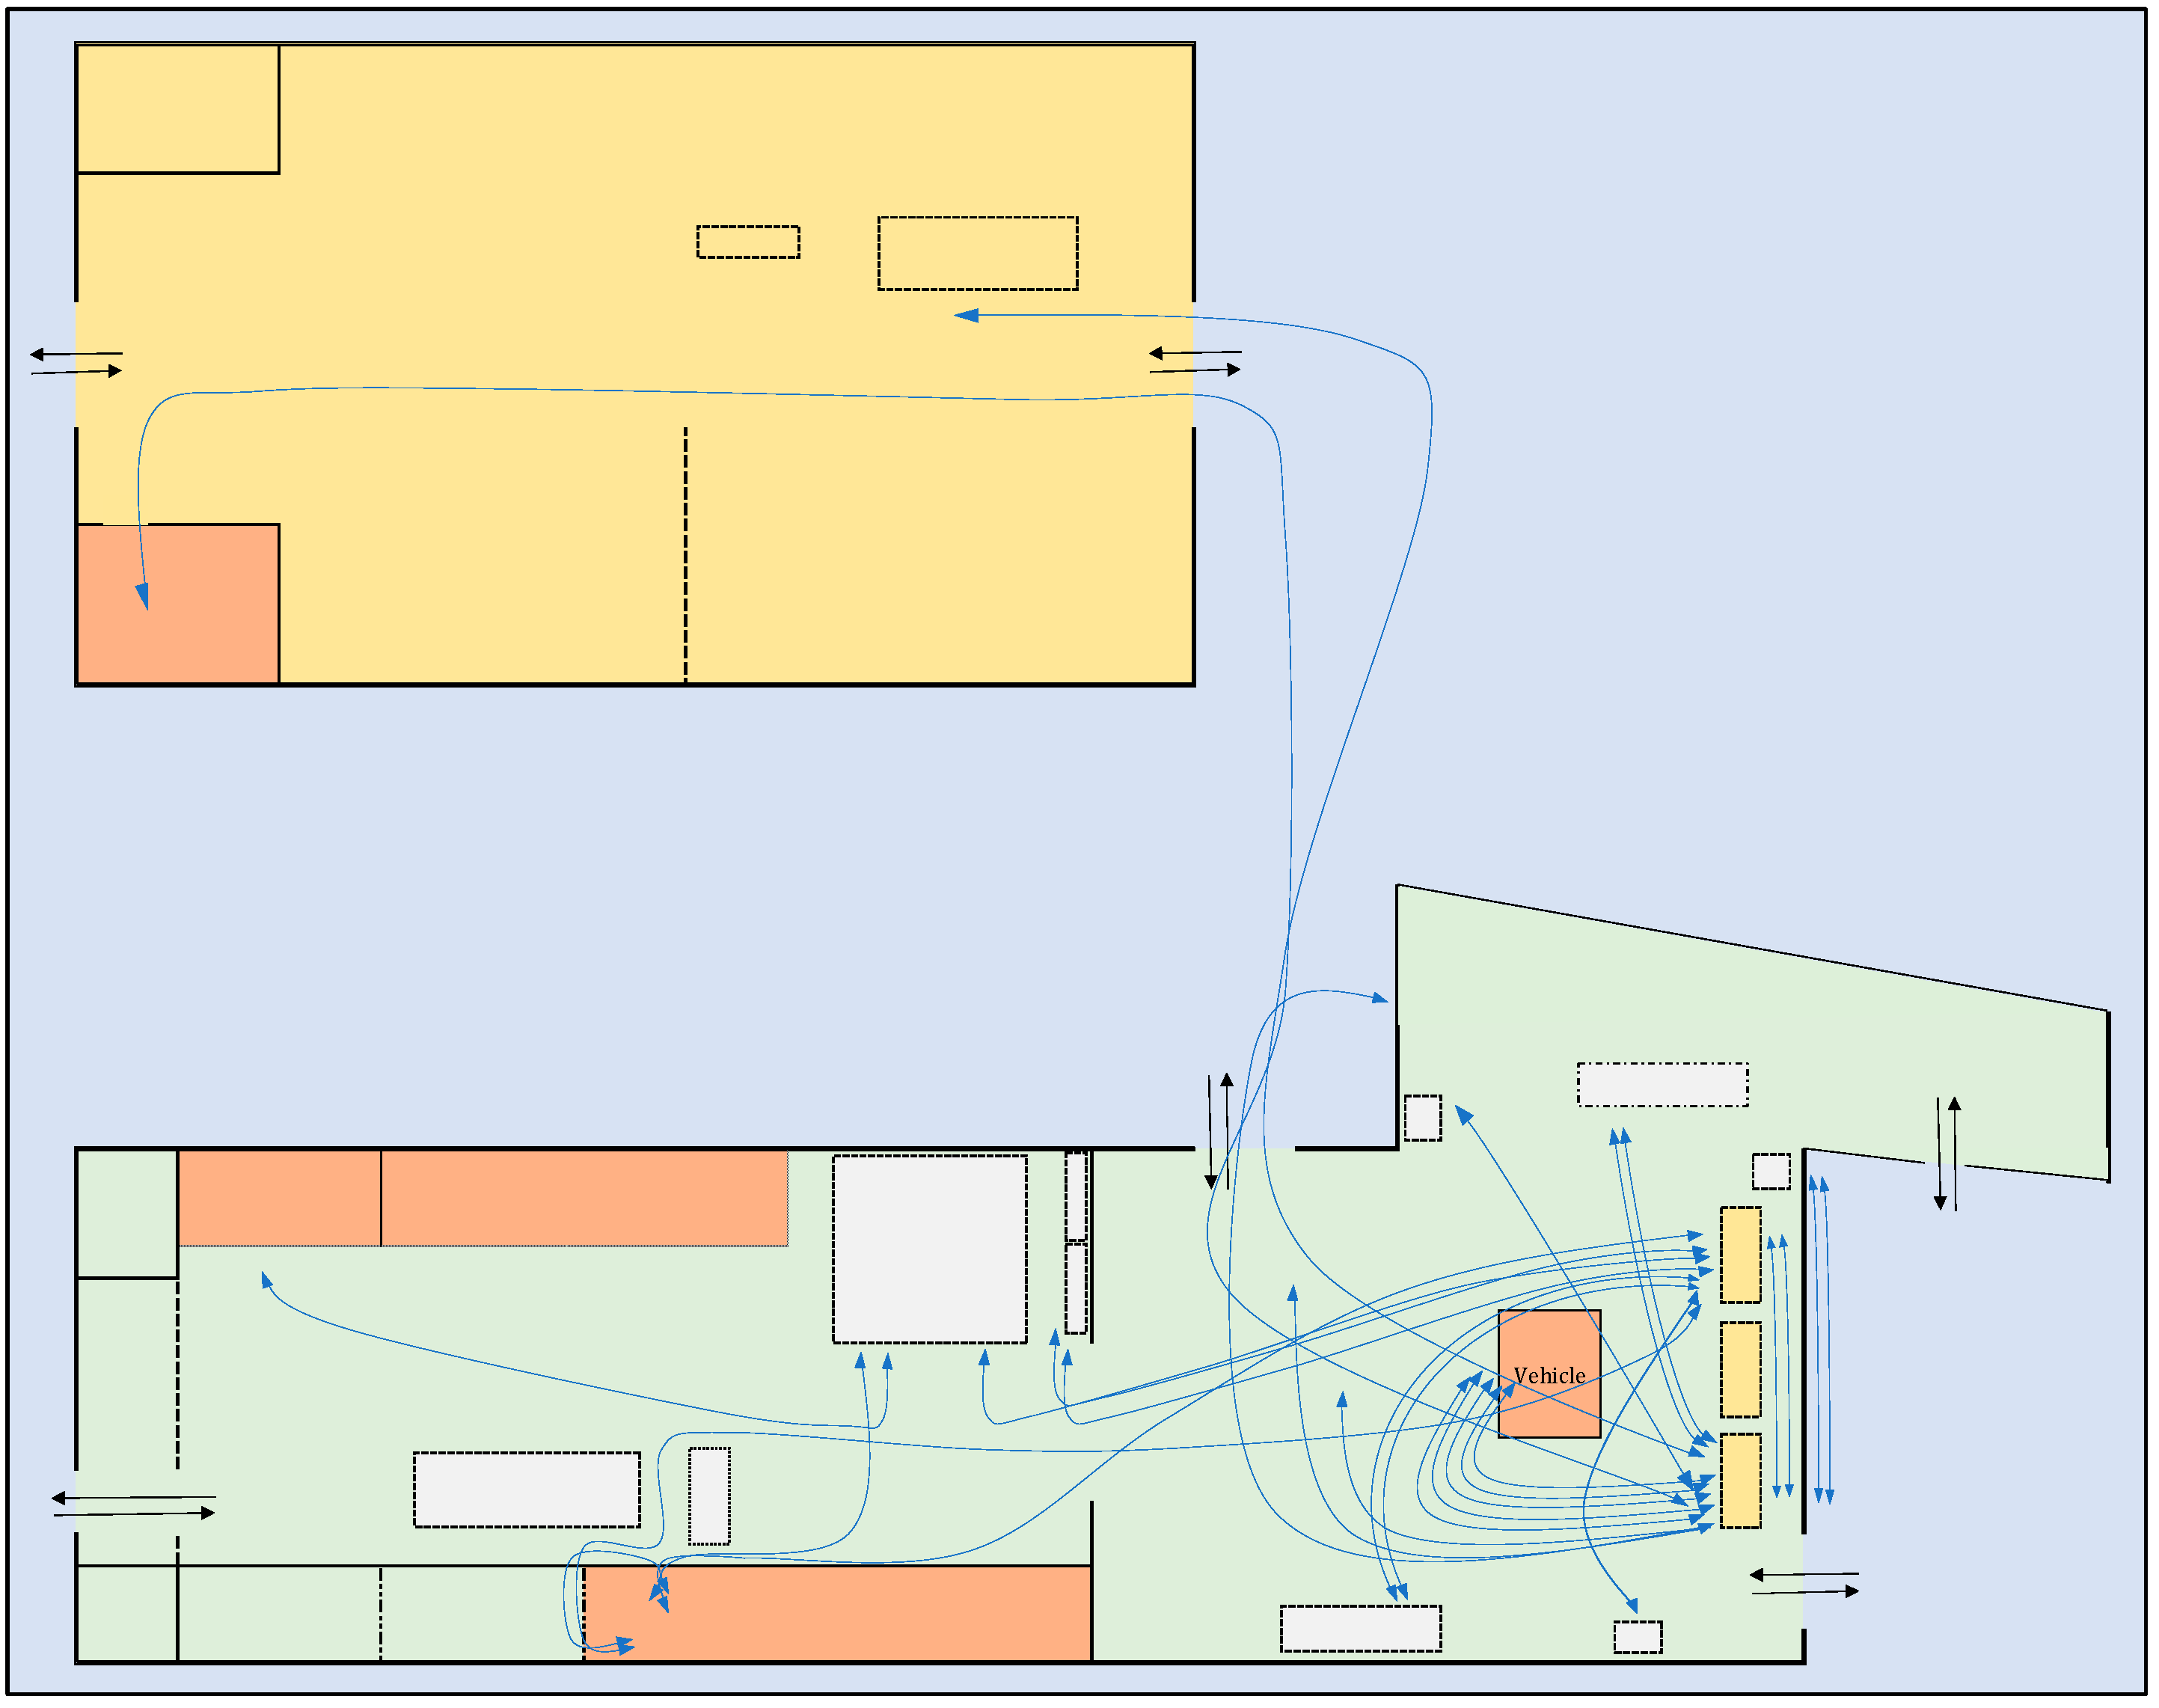
4.3. Spaghetti Diagram
After the specification of each step of the process, a high number of displacements were classified as NVA and NNVA; thus, regarding the waste “Transportation” identified in
Section 3.1.2, the Current State Spaghetti Diagram was elaborated. This allows a visualization of all the displacements made through the representation of the flow of people verified in the productive process of a seat, as shown in
Figure 5.
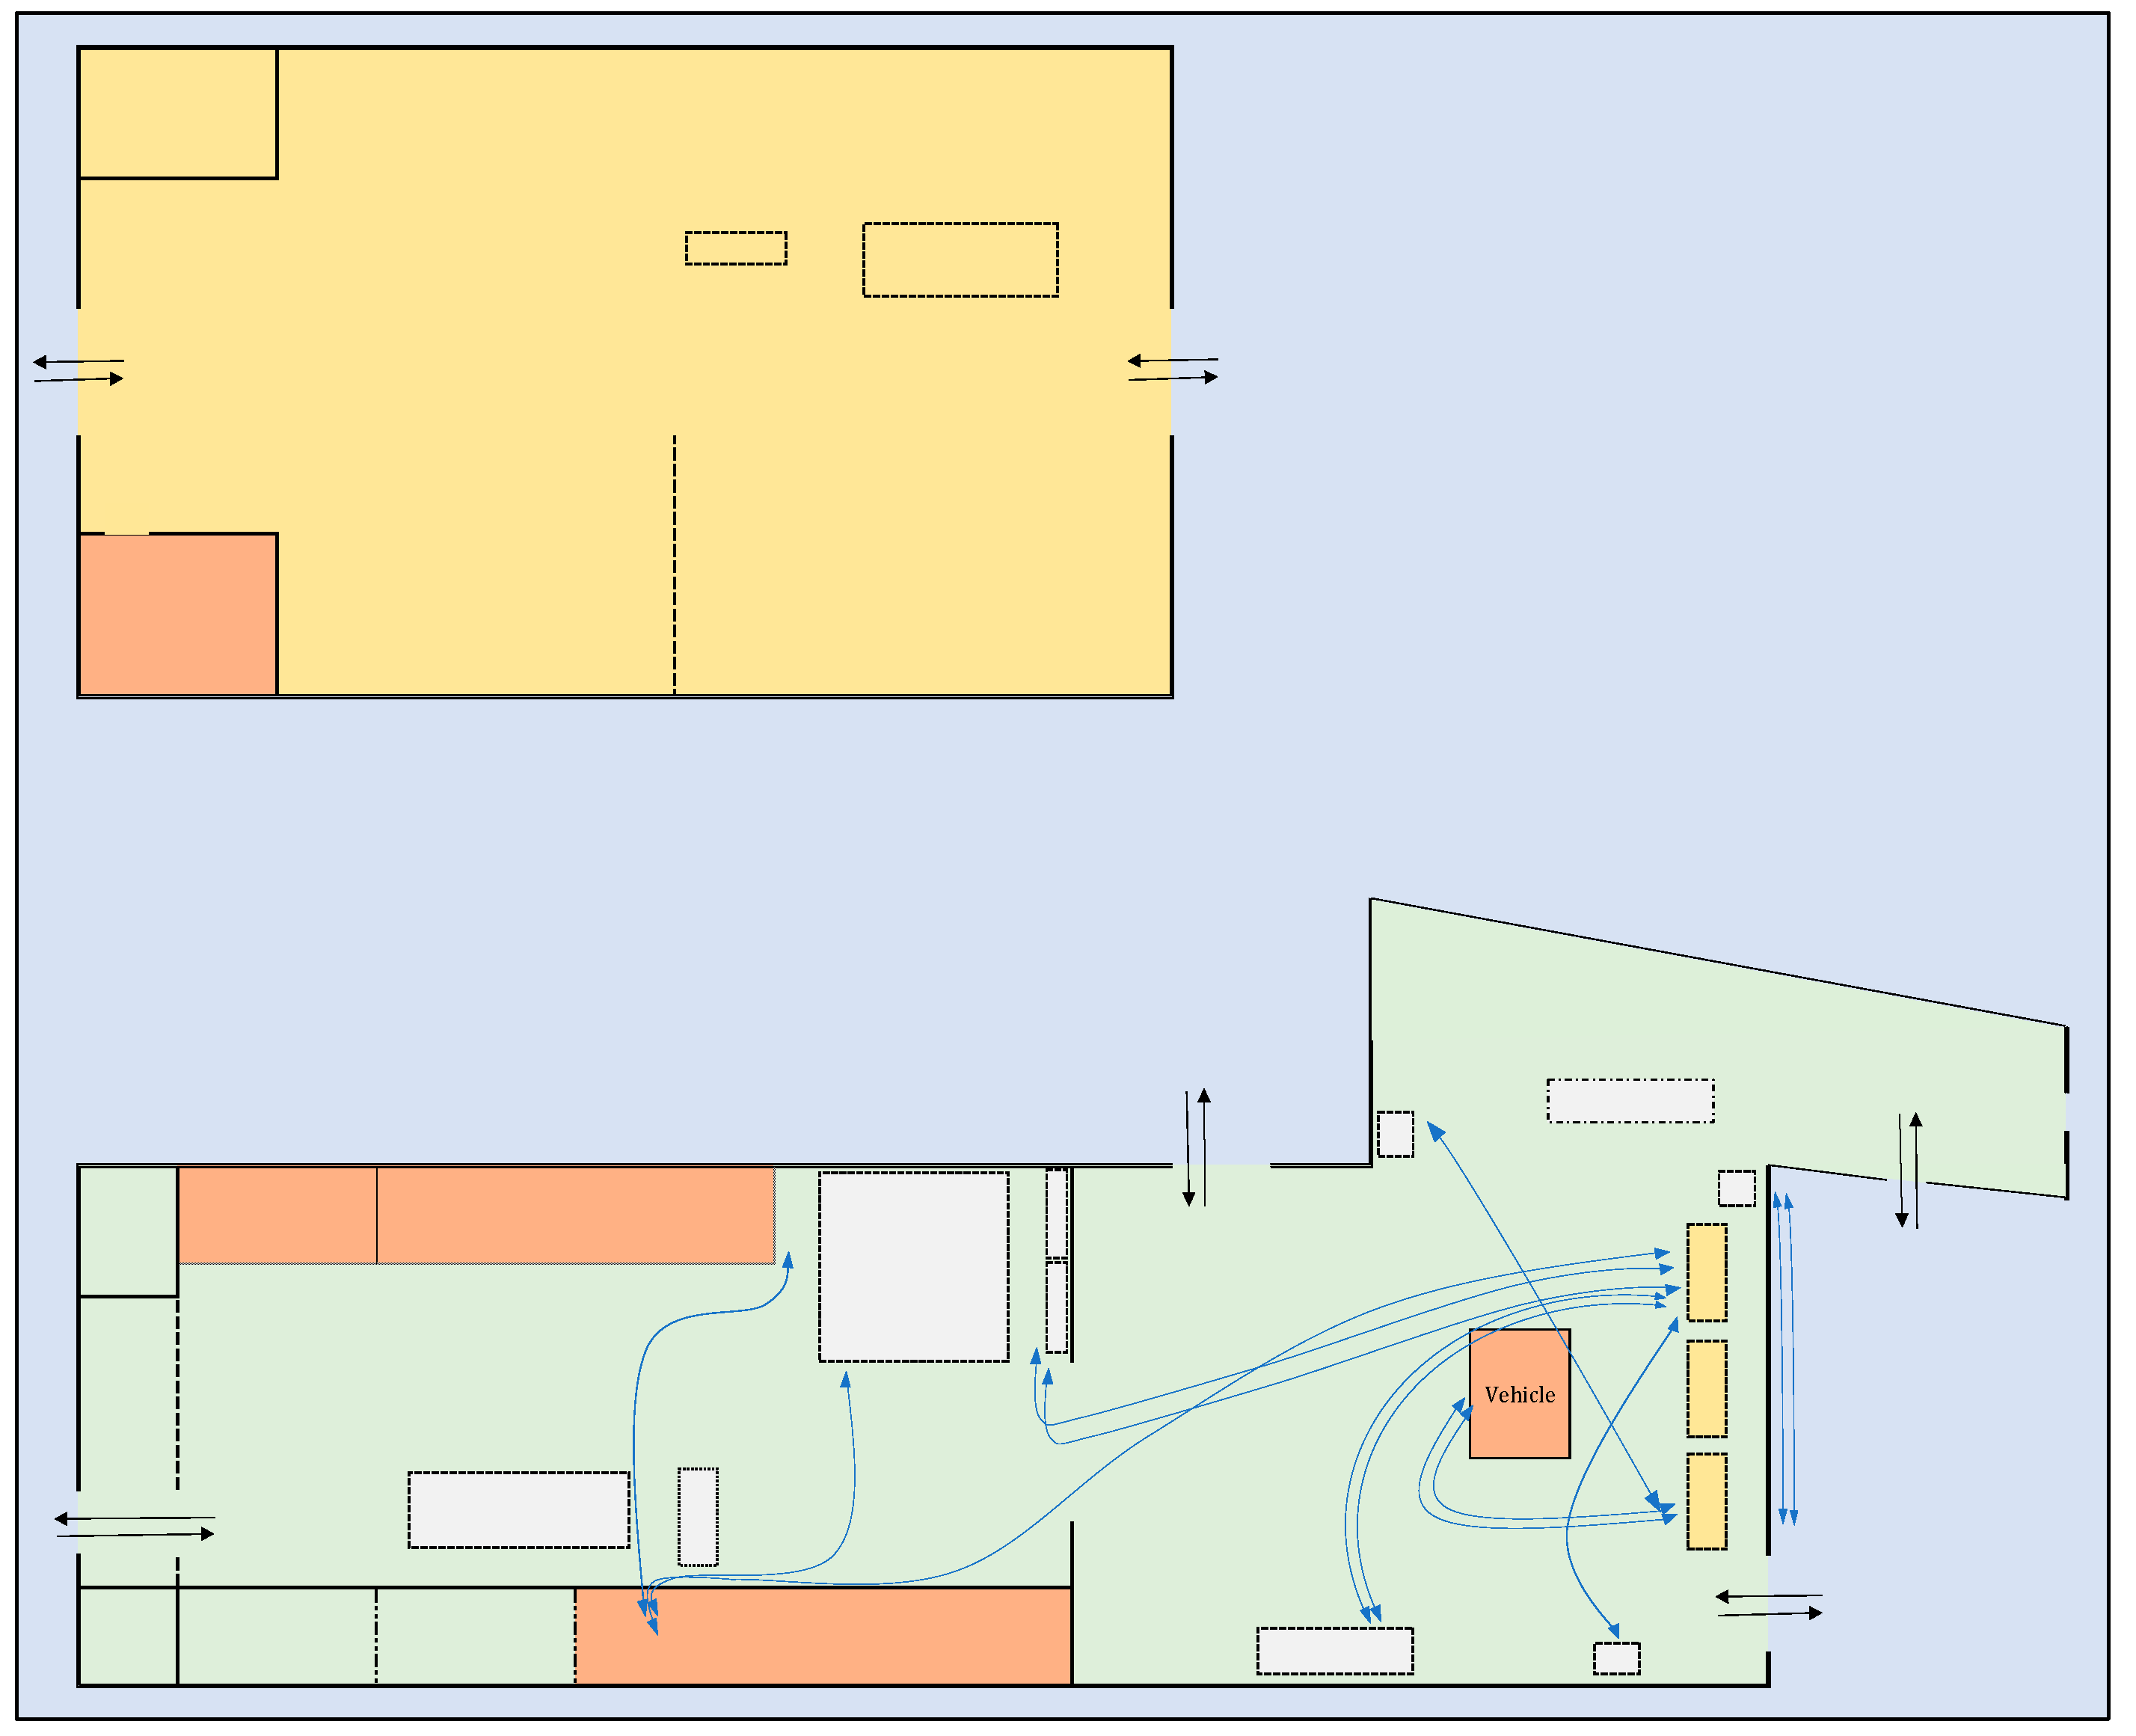
Following the opportunities for improvement that will be detailed and proposed in the following subsections through the use of various Lean tools, it is also possible to elaborate on the Future State Spaghetti Diagram, which is presented in
Figure 6.
4.4. Improvement Opportunities
In the light motor section, as already explained, several upholstery components are repaired. However, this study analyzes the productive process of repairing and maintenance of the most representative product in terms of sales—the vehicle seat. This process starts with the dismantling of the seat from the vehicle, followed by the removal of all accessories and original seat capes. Then the structure is painted. Some foams might arrive somewhat humid and wet, so there is also a phase of drying. After the foam is dried, the workers proceed with its maintenance and repair. Afterward, the cutting and sewing of the new covers take place. With these new capes, the structure is assembled, the seat is cleaned and laundered, and it is assembled back into the vehicle. Lastly, there is the cleaning and washing of the vehicle and quality control. Several IOs were identified. To present all the opportunities explored coherently,
Table 8 is elaborated to clarify the IO and the Lean tool from which it is proposed to reduce and/or eliminate the critical point.
4.4.1. 5S
IO 1.1 (as well as IO 27.1) concerns the displacement that exists when the worker who is disassembling/assembling the seat needs a tool that is not next to them but on their workstation. As it will be explained in
Section 4.4.2, this is proposed as a work instruction, so that the worker takes the mobile toolbox (which each worker has) with them to the vehicle when disassembling/assembling the seat. For this to be possible, the storage and organization of the shelves (behind every workstation) and the mobile toolbox is proposed according to the 5S philosophy: the individual shelves should be arranged so that the tools are arranged according to their use in each phase of the process and it is also proposed to mark on the shelves the areas referring to each phase.
IO 14.1 (as well as IO 15.1, IO 18.1, and IO 19.1) refers to the displacements when looking for a suitable foam to repair the original upholstery. For this situation, as will be explained in
Section 4.4.2, a work instruction is proposed. Associated with this instruction, several 5S measures should be considered: the creation of individual storage boxes for leftovers, exchanging the leftover box into a leftover shelf, and tidying and organizing the foam shelves. First, it is proposed to place individual leftover boxes on each workstation, where the leftovers are placed directly after using the foam boards. In this space, it is also proposed to place the cans of glue in use as well as boxes of staples that each bench must have (also solving IO 23). In Gemba, next to the workstations, there is a wooden box where the leftover foam is currently placed and, later, where the workers search for leftovers that can still be used. However, this method does not allow visualization of the leftovers at the bottom of the box, representing a waste of material. Therefore, it is proposed to replace this box with a shelf, which will also function as a shelf for stocks of staples and glue cans, to also provide a solution to IO 24 and IO 17. Finally, workers must move to the foam shelves. For these shelves an organization scheme is proposed that follows the fundamentals of the 5S methodology, where the foam boards are arranged and placed on the shelves according to their density and applications (the areas should be properly identified). These shelves should also be used to store vehicle seat molds (as will be explained in
Section 4.4.3).
Regarding IO 22.1, as will be explained in
Section 4.4.3, it is proposed to create a shelf where the stocks related to the Sewing stage are arranged and organized by a 5S methodology, for example, the ordination of needles and lines from thinnest to thickest.
To ensure that these practices are maintained they should be audited, according to the checklists (an example of the checklists created, namely, for the 5S concerning the workstation shelves, is presented in
Appendix B). The frequency of these audits should be established, ideally, weekly. With periodic audits, it is possible to track and monitor the status of each 5S practice, through the “Total Rating” value. The “Total Rating” should be assigned according to the scale adapted from [
44]:
Score 0—No problem found;
Score 1—Acceptable;
Score 2—Amenable to Acceptance;
Score 3—Acceptable within certain situations (e.g., the place on the shelf where the stock of staples should be is partially occupied with leftover foams, as new stock has not yet been purchased—these situations should be rectified as soon as possible);
Score 4—Rejected;
Score 5—Critical.
Through the sum of the score given to each parameter of the audit (the “Total Rating”), there is the ability to check for fluctuations in the practice of the proposed 5S measures as well as to ascertain what should be done so that the “Total Rating” value remains at a satisfactory and adequate level that conveys the organization and tidiness in the company. The ideal “Total Rating” value should be within range. The lower limit of the ranges is calculated assuming a score of 0 (the ideal scenario) on all parameters. The upper limit of the ranges shown is calculated assuming a score of 2 (the minimum acceptable value as a score of 3 is only acceptable in specific situations) on all parameters.
4.4.2. Standardized Work
Some of the situations identified in
Table 8 refer to opportunities whose solution is proposed through the implementation of work instructions from the perspective of task standardization. The aim of these instructions is that the workers perform their work more properly to reduce and/or eliminate some cycle times and/or waste.
IO 1 (as well as IO 27) concerns the movement that occurs between the vehicle on which the employee is working and his workstation, to fetch the necessary tools for the disassembly/assembly of the seat. Therefore, the first work instruction proposed is for the employee to take the mobile toolbox with him when he goes to disassemble/assemble the seat (moving the box according to the position of the seat in the vehicle).
IO 3 (as well as IO 26) concerns the waiting that exists when one employee needs the help of another employee to carry the seat from the vehicle that was dismantled to their workstation (and the opposite situation of transporting the repaired seat to the vehicle for assembly). Thus, the second work instruction proposed defines the use of a transportation trolley to move the disassembled seat to the workstation without the need for assistance from another employee who, in this way, will not have to interrupt their work (and to perform the opposite transport when assembling). In addition, a transport trolley must always be kept near the workstation in the light motor vehicle section. This measure will also allow ergonomic improvements.
IO 14, IO 15, IO 18, and IO 19, concern displacements between the workstations and the foam shelves when a damaged foam is to be repaired. In these situations, the worker has to move to the shelf and look for foam with the characteristics required for the damage they are repairing. There is also a shelf where the leftovers that remain are placed, as well as a leftover box under each bench (assuming the creation of the leftover box according to IO 14.1 explained in
Section 4.4.1). Thus, the third work instruction proposed is to first check the leftover box under the respective bench; then, the leftover shelf is checked, and only if none of these contain a foam board with the required characteristics, move to the foam shelves.
IO 21 concerns the situation in which the employee responsible for Cutting and Sewing the covers moves between the workstation and the fabric shelves to collect the fabric needed for the work. Therefore, a work instruction delegating this task to another employee, such as the Team Leader, who, as soon as they receive the order, places the roll of fabric needed for the job, in the Cutting area. The transport of the roll of fabric should also be carried out using a transport trolley, producing an ergonomic improvement.
These work instructions must be standardized so that the travel and waiting related to the IO explained can be eliminated, and/or reduced. Therefore, it is proposed that training be provided to the workers, as well as the placement of these instructions in the Gemba.
4.4.3. Kaizen
IO 2 concerns the waiting that occurs for another employee due to the complexity of a seat and the need for assistance in disassembling the seat from the vehicle (IO 28 concerns the same wait but in the assembly). To rectify this situation, it is proposed to create a Particularities Register. In other words, it is proposed that the particularities in the disassembly/assembly of a seat are reported to the Team Leader and that associated with the type of car and model of the seat, the details that made the mentioned phases difficult are recorded. Upon the arrival of a new project, the Team Leader should look in the Particularities Register to see if there is any note regarding the vehicle associated with the order, and if so, leave the particularities noted in the Worksheet or inform the employee responsible for that project about them.
IO 4, IO 5, IO 16, and IO 25 concern waits and displacements that occur due to the lack of tools needed or because they are being used in Pavilion 2. To prevent this from happening, it is proposed to duplicate certain tools needed in each workstation (because every workstation works on a different project where all tools are needed), such as the foam saw and the pliers.
IO 6 refers to the movement between the workbenches and the Cutting section for the delivery of old covers to be molded and cut. IO 20 refers to the movement between the workbenches and the work-in-progress storage area, as employees will move on to another project while waiting for the new covers. For these two IOs, it is proposed to create molds of the various types of seats that arrive at the company and are repaired. By creating a mold (in cardboard or another suitable material), a work reorganization is also possible to reduce the total Lead Time—the Cutting and Sewing phases can be carried out when the vehicle arrives at the company while the workstation’s workers repair and maintain the vehicle’s upholstery.
IO 7 refers to the waiting time for the paint to be ready for use. It is proposed that the preparation of the paint and the respective waiting until it is ready to be used is carried out immediately after disassembly of the vehicle seat.
IO 8, IO 9, IO 10, IO 11, IO 12, and IO 13 concern the natural sun-drying process of humid foams. This phase of the process is influenced by the weather conditions and may take more or less time accordingly. Therefore, what is proposed to make the process continuous and not dependent on external environmental causes, is the use of a tool that each worker already possesses: the hot-air blowing machine.
IO 22 refers to the displacement that exists between the Sewing and the upper floor storage room. It is proposed that all fabric stock gets moved to a shelf next to the fabric shelves, together with all stocks related to sewing machines and the Sewing phase in general. This will reduce the amount of moving around and, in line with the 5S philosophy and continuous improvement, the storage and organization of the Sewing phase will be more efficient since everything related to this stage will be in the same place. This will also allow an ergonomic improvement because, currently, to bring a box of lines from the upper floor to the sewing room, workers must go through stairs with small lengths which is a danger and may cause work accidents.
Finally, IO 29, which refers to the movement between the vehicle and the bench to collect the product and cloth necessary for the internal cleaning of the vehicle, is reflected in an extra movement. To solve this situation, it is proposed to place these items next to the vacuum cleaner. The trip to the vacuum cleaner is certain to occur; however, in this trip, other items necessary for the internal cleaning of the vehicle can also be collected, thus organizing the shop floor according to the stages/phases of the process. Workers should return the product, cloth, and vacuum cleaner to the appropriate place after use.
4.4.4. Kanban
IO 31 refers to one of the specific situations mentioned in
Section 3.1.2, where the “Movements” waste is identified. It concerns the working moments lost between projects, due to the high time looking for a new project to start. Through observation of work at the Gemba, it was found that workers lost a considerable amount of time to start a different project because the workers had to go to the different Worksheets arranged in the different seats and try to figure out which project had the highest urgency. Thus, to solve IO 31, it is proposed to implement the Kanban poster of
Figure 7 on the shop floor, namely, in the light motor vehicle section.
The proposed Kanban should be displayed on the shop floor, for example, using a cork board, to which the Worksheets must be affixed using pins, according to their urgency, which, in turn, depends on the days until delivery. It should be noted that the Worksheets should be placed from the most urgent to the least urgent in a left to right direction. When a worker wants to start a new project, they should observe the line related to the red card, remove the Worksheet from the most urgent one and post it in the “In Progress” area and on the respective workstation.
4.4.5. Poka-Yoke
IO 30 refers to another particular situation mentioned in
Section 3.1.2, where the “Defects” waste is identified. This waste occurs due to the lack of a Quality Control step implemented between sewing and placing the new capes on the seat. This leads to the possibility that when placing a new cover, the workers may notice a quality flaw and have to remove it informing the need to make another or rectify the non-conforming cover, which involves repeating several steps that add about 4 extra hours to the process. So, the implementation of a rigorous step of Quality Control between the mentioned phases is proposed as well as the use of the Poka-Yoke proposed in
Figure 8.
The proposed Poka-Yoke is a simple foam mold that can fill the covers so that they take the shape of the seat structure and allow the visualization of stitching or cutting defects at the edges (which, due to the Poka-Yoke, will be stretched). This Poka-Yoke should only be used by one person so that there is no need to stop the work of the workstations; should be kept in the same place at all times; and, according to the 5S philosophy, after use, it should be returned to its place so that it does not mix with the foams used in the upholstery. It should also be noted that the foam should be of a low density and medium size so that it can be adapted to various seat molds with different sizes and shapes.
4.4.6. Action Plan
The first step that the SE should take is the labeling of all existing products followed by the implementation of the DDS as well as strict stock control using the CS.
Given that the opportunities for improvement identified for Problem Nº2 are reflected in a long list of proposed measures to increase the company’s efficiency, an Action Plan was drawn up using the tool GUT Matrix. This allows the company to understand what immediate actions to take and, in general, to serve as a guide in the implementation of the proposals. In this sense, each situation was classified according to the aspects of the GUT Matrix and ordered in descending order concerning the GUT value. This ranking is shown in
Table 9.
These classifications were based on, for example, the possibilities of situations to induce work injuries and their frequency. It is relevant to mention that the theoretical results presented in
Table 7 are only achievable in the short medium term (due to the need to create large information registers and the need for a wide variety of molds) and, to achieve them, it is crucial to implement each of the situations exposed in the GUT Matrix presented, regardless of their priority to the others.
5. Results and Discussion
Regarding Problem Nº1, the main results obtained from the DDS for stock control are as follows: the knowledge, at any time, of how much there is in stock of every product—with the implementation of the Control Sheet and the “Weekly Control”; the elimination of the waste “Overstocking” (and opposite situation of lack of stock)—with the “New Project” control; and the reduction in the “Movements” waste—due to the coding of all the products that the company possesses.
Regarding Problem Nº2, comparing the values presented in
Table 6 and
Table 7 (the Current State and Future State values), it is possible to verify that through the implementation of the Standardized Work, 5S, and Kaizen tools, it is possible to obtain a complete elimination of the activities classified as NVA (pure waste) according to Equation (3), and a reduction of about 47% of the necessary waste (NNVA) according to Equation (4). This way, is possible to reduce the total Lead Time by about 26% (Equation (5)), which, consequently, allows a theoretical increase in production of approximately 33% (Equation (6)), considering that the company only repairs seats in the light motor vehicle section.
It should be noted that this study refers to the most critical process of seat repairing, i.e., considering some steps that do not happen every time an upholstery is maintained and repaired, namely, the painting of the seat structure, which only happens if the customer specifies it, and the drying of the foam, which only occurs if the foam is damp. Thus, in Gemba, in most repairs, these two steps are not considered, which means that the increase in production will be higher than 33% as well as the monetary return associated with it. Also, through the implementation of the proposed Kanban, it is possible to reduce the lost time between projects, as well as streamline the operation of the shop floor. The implementation of the proposed Poka-Yoke (associated with the implementation of a fixed Quality Control) will allow the reduction of defects and the extra time associated with their rectification.
It is relevant to mention that, despite the lack of literature regarding vehicle seat productive process optimization, it is similar to an upholstered furniture process optimization, and the results obtained were similar to the ones obtained in optimization studies in said industry. Some examples of those studies were presented in
Section 2.3 and a comparison between the results presented in this study with the ones found in the literature can be made:
Similar to [
36], it accomplished a reduction in walking distance and ergonomic improvements (through the 5S measures and work instructions proposed);
Similar to [
37], it accomplished a reduction in time spent on activities caused by the inefficient organization of the Gemba (through the Kanban poster proposed) and the elimination of factors causing defects (through the Poka-Yoke developed);
Similar to [
38], a decrease in NVA and a decrease in the process Lead Time was obtained (using 5S, Standardized Work, and Kaizen measures);
Similar to [
20], the walking times were reduced and there was an improvement in the time spent searching for materials (through the codification of all products developed as well as the code standard proposed), a reduction in operating time, and a reduction in waiting time (using 5S, Standardized Work, and Kaizen measures);
Similar to [
39], this study accomplished an improvement in work safety (through 5S measures and work instructions based on Standardized Work), reduction in stock levels (as it eliminated the waste of Overstocking and lack of stocks through the development of the DDS for stock control), and a reduction in the Lead Time, including the time looking for tools and elimination of unnecessary travel or movements.
The DDS developed for stock control presents a methodology that can be adopted by companies of all industries and dimensions, as it allows for a simple solution to control quantities in stock at all times, only needing to adapt the information on the database. The Control Sheet, as well as the code standard and the simple label proposed, can also be used by any company. In the upholstered furniture industry, this DDS most likely does not need any adaptation; in other industries, the only change necessary would be the division of stocks into other categories according to the product used in all kinds of productive processes and activities.
Regarding the ideas and solutions proposed using the Lean tools, all can also be adapted and used in different industries, namely, the way the tools are used to eliminate, for example, unnecessary movements and unnecessary waiting times, which happens in all processes; however, most importantly, they can provide a guide for SMEs of the upholstery industry on how to improve efficiency in their activity and how Lean tools can be implemented in their everyday life without much monetary investment. It is also very important to notice the contribution this paper gives to a simple Poka-Yoke for companies involved in vehicle seat upholstery production/maintenance, which can make a great difference in not only quality rates but also in competitiveness towards the market and demand satisfaction.
6. Conclusions
The case study shows the integration of Lean tools within a small enterprise of the vehicle seat upholstery production/maintenance sector to optimize its operational processes. The study involved the application of several Lean tools, including Value Stream Mapping (VSM), Spaghetti Diagram, 5S, Standardized Work, Kaizen, Kanban, and Poka-Yoke within the SE. These tools were employed to achieve multiple outcomes, such as waste reduction by 47% and a reduction in process Lead Time by 26%, resulting in a 33% production increase while enhancing worker safety and a corresponding boost in competitive advantage. It was also verified that rigorous real-time stock control can be achieved with a simple and expedite Excel spreadsheet without necessitating extensive training or financial investment (due to the widespread use of this software). The study highlights the potential for Lean tool adoption to optimize production within SMEs, thereby addressing a gap in the literature pertinent to vehicle seat upholstery maintenance. It contributes a comprehensive literature review, offering insights into the broader upholstery industry and serving as a pragmatic guide for solving common industry challenges through the use of Lean tools and simple spreadsheets for stock control. Some limitations were found throughout this study, namely, the efficiency of the developed Excel-based stock control system that is directly dependent on up-to-date data. Some estimated cycle times within the Value Stream Mapping process are notable constraints, notwithstanding the inputs from Gemba workers. Further research work and studies will focus on assessing the feasibility of incorporating the Heijunka tool for weekly planning in companies concurrently repairing multiple distinct products with varying characteristics and production Lead Times. Moreover, the appropriateness of more precise stock control methods like Material Requirement Planning should be analyzed, taking into account the enduring relevance of upholstery manufacturing materials.
Author Contributions
Conceptualization, E.S. and T.M.L.; methodology, E.S. and T.M.L.; software, E.S.; validation, T.M.L.; formal analysis, T.M.L.; investigation, E.S.; resources, E.S. and T.M.L.; data curation, E.S.; writing—original draft preparation, E.S.; writing—review and editing, E.S., T.M.L. and P.D.G.; visualization, E.S., T.M.L. and P.D.G.; supervision, T.M.L. All authors have read and agreed to the published version of the manuscript.
Funding
This work was supported in part by Fundação para a Ciência e Tecnologia (FCT) and C-MAST (Centre for Mechanical and Aerospace Science and Technologies), under project UIDB/00151/2020.
Institutional Review Board Statement
Not applicable.
Informed Consent Statement
Not applicable.
Data Availability Statement
Not applicable.
Acknowledgments
The authors acknowledge the company involved for the availability to perform this study about their activity and operation.
Conflicts of Interest
The authors declare no conflict of interest.
Appendix A
Figure A1.
Map of the storage areas of the different categories.
Figure A1.
Map of the storage areas of the different categories.
Appendix B
Figure A2.
Checklist for the 5S concerning the workstation shelves.
Figure A2.
Checklist for the 5S concerning the workstation shelves.
References
- Rahmanasari, D.; Sutopo, W.; Rohani, J.M. Implementation of Lean Manufacturing Process to Reduce Waste: A Case Study. In Proceedings of the 6th International Conference on Industrial, Mechanical, Electrical and Chemical Engineering—ICIMECE 2020, Solo, Indonesia, 20 October 2020. [Google Scholar] [CrossRef]
- Kumar, N.; Hasan, S.S.; Srivastava, K.; Akhtar, R.; Yadav, R.K.; Choubey, V.K. Lean manufacturing techniques and its implementation: A review. Mater. Today Proc. 2022, 21, 805–817. [Google Scholar] [CrossRef]
- Gupta, S.; Jain, S.K. A literature review of lean manufacturing. Int. J. Manag. Sci. Eng. Manag. 2013, 8, 241–249. [Google Scholar] [CrossRef]
- Deshmukh, M.; Gangele, A.; Gope, D.K.; Dewangan, S. Study and implementation of lean manufacturing strategies: A literature review. Mater. Today Proc. 2022, 62, 1489–1495. [Google Scholar] [CrossRef]
- Matt, D.T.; Rauch, E. Implementation of Lean Production in small-sized Enterprises. In Proceedings of the 8th CIRP Conference on Intelligent Computation in Manufacturing Engineering, Bolzano, Italy, 18–20 July 2012. [Google Scholar] [CrossRef]
- Womack, J.P.; Jones, D.T.; Roos, D. The Machine That Changed the World, 1st ed.; Macmillan Publishing Company: New York, NY, USA, 1990; p. 10022. [Google Scholar]
- Feld, W.M. Lean Manufacturing: Tools, Techniques, and How to Use Them, 1st ed.; St. Lucie Press: Boca Raton, FL, USA, 2000; p. 33431. [Google Scholar]
- Bhamu, J.; Sangwan, K.S. Lean manufacturing: A literature review and research issues. Int. J. Op. Prod. Manag. 2014, 34, 876–940. [Google Scholar] [CrossRef]
- Holweg, M. The genealogy of lean production. J. Oper. Manag. 2007, 25, 420–437. [Google Scholar] [CrossRef]
- Dekier, L. The Origins and Evolution of Lean Management System. J. Int. Stud. 2012, 5, 46–51. Available online: https://jois.eu/files/DekierV_5_N1.pdf (accessed on 1 June 2023). [CrossRef]
- Romero, D.; Gaiardelli, P.; Powell, D.; Wuest, T.; Thurer, M. Rethinking Jidoka Systems under Automation and Learning Perspectives in the Digital Lean Manufacturing World. IFAC Conf. Pap. Arch. 2019, 52, 899–903. [Google Scholar] [CrossRef]
- Ohno, T. Toyota Production System: Beyond Large-Scale Production, 1st ed.; Diamon, Inc.: Tokyo, Japan, 1988. [Google Scholar]
- Dilanthi, M.G.S. Conceptual Evolution of Lean Manufacturing: A Review of Literature. Int. J. Econ. Com. Manag. 2015, 3, 574–585. Available online: https://papers.ssrn.com/sol3/papers.cfm?abstract_id=2678896 (accessed on 1 June 2023).
- Akanbi, O.A.; Oyedolapo, O.; Steven, G.J. Chapter 12—Lean Principles in Construction. In Sustainable Construction Technologies; Tam, T.Y., Le, K.N., Eds.; Butterworth-Heinemann: Oxford, UK, 2019; pp. 317–348. [Google Scholar] [CrossRef]
- Liker, J.K. The Toyota Way: 14 Management Principles from the World’s Greatest Manufacturer, 1st ed.; McGraw-Hill: New York, NY, USA, 2004. [Google Scholar]
- Ahmed, S.; Chowdhury, S.I. Increase the efficiency and productivity of sewing section through low performing operators improvement by using eight wastes of Lean methodology. Glob. J. Res. Eng. Gen. Eng. 2018, 18, 43–60. Available online: https://www.researchgate.net/publication/338689363_Increase_the_Efficiency_and_Productivity_of_Sewing_Section_through_Low_Performing_Operators_Improvement_by_using_Eight_Wastes_of_Lean_Methodology (accessed on 1 June 2023).
- Taggart, M.; Willis, C.; Hanahoe, J. Not Seeing The Wood For The Trees—A Gemba Walk Through a Timber Framed Housing Development. In Proceedings of the 27th Annual Conference of the International. Group for Lean Construction (IGLC), Dublin, Ireland, 27 July 2019. [Google Scholar] [CrossRef]
- García-Alcaraz, J.L.; García, A.S.M.; Díaz-Reza, J.R.; Macías, E.J.; Lardies, C.J.; Fernández, J.B. Effect of lean manufacturing tools on sustainability: The case of Mexican maquiladoras. Envir. Sci. Pollut. Res. 2022, 29, 39622–39637. [Google Scholar] [CrossRef]
- Setiawan, I.; Hernadewita, H. Reducing Production Process Lead Time Using Value Stream Mapping and Kaizen Approaches: A Case Study in the Musical Instrument Industry. AIP Conf. Proc. 2022, 2470, 020005-1–020005-9. [Google Scholar] [CrossRef]
- Guzel, D.; Asiabi, A.S. Increasing Productivity of Furniture Factory with Lean Manufacturing Techniques (Case Study). Technol. J. 2022, 1, 82–92. [Google Scholar] [CrossRef]
- Senderská, K.; Mares, A.; Václav, S. Spaghetti Diagram Application for Workers’ Movement Analysis. Sci. Bull. Ser. D 2017, 79, 139–150. Available online: https://www.researchgate.net/publication/316634571_Spaghetti_diagram_application_for_workers%27_movement_analysis (accessed on 1 June 2023).
- Sojka, V.; Lepsik, P. Re-layout of workshop based on material and people flows. In Proceedings of the 19th International Bata Conference for Ph.D. Students and Young Researchers (DOKBAT), Zlín, Czech Republic, 6–7 September 2019. [Google Scholar] [CrossRef]
- Singh, S.; Kumar, K. A study of lean construction and visual management tools through cluster analysis. Ain Shams Eng. J. 2021, 12, 1153–1162. [Google Scholar] [CrossRef]
- Shahriar, M.M.; Parvez, M.S.; Islam, M.A.; Talapatra, S. Implementation of 5S in a plastic bag manufacturing industry: A case study. Clean. Eng. Technol. 2022, 8, 100488. [Google Scholar] [CrossRef]
- Veres, C.; Marian, L.; Moica, S.; Al-Akel, K. Case Study Concerning 5S Method Impact in an Automotive Company. In Proceedings of the 11th International Conference Interdisciplinarity in Engineering, INTER-ENG 2017, Tirgu Mures, Romania, 5–6 October 2018. [Google Scholar] [CrossRef]
- Claudio, D.; Cosgriff, V.; Nino, V.; Valladares, L. An Agile Standardized Work Procedure for Cleaning the Operating Room. J. Ind. Eng. Manag. 2021, 14, 701–717. Available online: http://www.jiem.org/index.php/jiem/article/view/3440 (accessed on 1 June 2023). [CrossRef]
- Marinelli, M.; Deshmukh, A.A.; Janardhanan, M.; Nielsen, I. Lean manufacturing and Industry 4.0 combinative application: Practices and perceived benefits. IFAC Pap. Online 2021, 41, 288–293. [Google Scholar] [CrossRef]
- Naeemah, A.J.; Wong, K.Y. Positive impacts of lean manufacturing tools on sustainability aspects: A systematic review. J. Ind. Prod. Eng. 2022, 39, 552–571. [Google Scholar] [CrossRef]
- Androniceanu, A.; Enache, I.-C.; Valter, E.-N.; Raduica, F.-F. Increasing Energy Efficiency Based on the Kaizen Approach. Energies 2023, 16, 1930. [Google Scholar] [CrossRef]
- Sly, D. Internet-Based eKanban/eKitting Involving Suppliers. Procedia Manuf. 2018, 17, 484–490. [Google Scholar] [CrossRef]
- Saltz, J.; Heckman, R. Exploring Which Agile Principle Students Internalize When Using a Kanban Process Methodology. J. Inf. Syst. Edu. 2020, 31, 51–60. Available online: http://jise.org/Volume31/n1/JISEv31n1p51.html (accessed on 1 June 2023).
- Belu, N.; Ionescu, L.M.; Misztal, A.; Mazare, A. Poka Yoke System Based on Image Analysis and Object Recognition. IOP Conf Ser. Mater. Sci. Eng. 2015, 95, 012138. [Google Scholar] [CrossRef]
- Palange, A.; Dhatrak, P. Lean manufacturing a vital tool to enhance productivity in manufacturing. Mater. Today Proc. 2021, 46, 729–736. [Google Scholar] [CrossRef]
- Rodríguez, J.C.C.; Victoria, A.A.L.; Mendieta, E.B.; Nathaly, C.A.; Maria, E.; Ariana, R.C.; Xiomara, S.L. Implementation of Lean Manufacturing Tools to the Kid’s Footwear Company. In Proceedings of the LACCEI international Multi-conference for Engineering, Education, and Technology, Boca Raton, FL, USA, 18–22 July 2022. [Google Scholar] [CrossRef]
- Ukey, P.; Deshmukh, A.; Arora, A. Implementation of Lean Tools in Apparel Industry for Improving Productivity. Proc. Eng. Sci. 2021, 3, 241–246. [Google Scholar] [CrossRef]
- Hunter, S.L. The Toyota production system applied to the upholstery furniture manufacturing industry. Mater. Manuf. Process. 2008, 23, 629–634. [Google Scholar] [CrossRef]
- Stalhofer, E.M.; Luz, R.P.d.; Pessa, S.L.R.; Laperuta, D.G.; Luz, J.G.d. Implementation of Lean tools in small and medium-sized enter-prizes: A case study in the furniture industry. Espacios 2016, 37. Available online: https://www.researchgate.net/publication/316599008_Implementation_of_Lean_tools_in_small_and_medium_sized_enter-prises_A_case_study_in_a_furniture_industry (accessed on 1 June 2023).
- Talapatra, S.; Shefa, J. Application of Value Stream Mapping to Improve Financial Performance of a Production Floor: A Case Study. In Proceedings of the 9th International Conference on Industrial Engineering and Operations Management IEOM 2019, Bangkok, Thailand, 5–7 March 2019; Available online: http://ieomsociety.org/ieom2019/papers/234.pdf (accessed on 1 June 2023).
- Pascu, C.I.; Malciu, R.; Nicolicescu, C.; Gheorghe, S. Implementation of the Lean Manufacturing 6S Technique—Case Study. In Proceedings of the International Conference of Mechanical Engineering (ICOME-2022), Craiova, Romania, 18–20 May 2022. [Google Scholar] [CrossRef]
- Al-Saedi, A.; Paslawski, J.; Nowotarski, P. Quality Management to continuous improvements in process of Ready Mix Concrete production. In Proceedings of the 2nd International Conference on Sustainable Engineering Techniques ICSET 2019, Baghdad, Iraq, 6–7 March 2019. [Google Scholar] [CrossRef]
- Abdel-Hamid, M.; Abdelhaleem, H.M. Improving the Construction Industry Quality Using the Seven Basic Quality Control Tools. J. Miner. Mater. Charact. Eng. 2019, 7, 412–420. [Google Scholar] [CrossRef]
- Barbosa, M.T.G.; Rosse, V.J.; Laurindo, N.G. Thermography evaluation strategy proposal due to moisture damage on building facades. J. Build. Eng. 2021, 34, 102555. [Google Scholar] [CrossRef]
- Mello, J.A.V.B.; Pinto, B.G.J.; Mello, A.J.R. SWOT analysis and GUT matrix for business management and problem-solving: An application in a Brazilian case study. Manag. Lett. 2022, 22, 81–93. [Google Scholar] [CrossRef]
- Beno, J.; Rao, M.V.; Beno, J.; Das, S.K. Process Control Inspection using 5s Method and Computation with Pareto Analysis. In Proceedings of the 2021 International Conference on Advances in Computing, Communication and Control (ICAC3), Mumbai, India, 3–4 December 2021. [Google Scholar] [CrossRef]
| Disclaimer/Publisher’s Note: The statements, opinions and data contained in all publications are solely those of the individual author(s) and contributor(s) and not of MDPI and/or the editor(s). MDPI and/or the editor(s) disclaim responsibility for any injury to people or property resulting from any ideas, methods, instructions or products referred to in the content. |
© 2023 by the authors. Licensee MDPI, Basel, Switzerland. This article is an open access article distributed under the terms and conditions of the Creative Commons Attribution (CC BY) license (https://creativecommons.org/licenses/by/4.0/).


