


Abstract
The escalating impacts of climate change and anthropogenic pressures on vulnerable ecosystems demand digital tools that make advanced modeling more accessible to conservation practitioners. This study presents a TRL-4 prototype that integrates a configurable Digital Twin (DT) core with a generative AI conversational interface for conservation-oriented modeling in Doñana National Park, Spain, a UNESCO World Heritage site facing significant environmental challenges. The main contribution is not the training of specific ecological forecasting models, but the validation of an end-to-end workflow that allows users to configure, execute, inspect, and interpret a predictive system through natural language. The prototype supports the prediction of conservation-relevant ecological indicators, including Iberian lynx population dynamics and waterbird abundance, using heterogeneous environmental, climatic, hydrological, and socio-demographic datasets. The architecture connects a structured YAML configuration, heterogeneous environmental and biological datasets, automated machine learning training, database-backed traceability, dashboard visualization, and SHAP-based interpretability. Through representative executions, the prototype demonstrates that non-technical users can select target and explanatory variables, configure preprocessing options, launch model training, generate predictions, and review their outputs without directly editing configuration files or running code. Although the predictive metrics obtained in selected runs remain preliminary and should be interpreted as diagnostics rather than evidence of general forecasting skill, the results show that conversational DTs can substantially reduce technical barriers to ecological modeling. By combining generative AI, cloud infrastructure, reproducible machine learning workflows, and explainable AI, the proposed architecture provides a strong foundation for future conservation decision-support systems that augment expert judgment while preserving human oversight, transparency, and critical interpretation.
1. Introduction
1.1. Context and Motivation
Protected ecosystems worldwide face unprecedented pressures from the combined effects of climate change, accelerating land-use change, habitat fragmentation, invasive species, pollution, and intensifying anthropogenic activities [1,2]. These interacting drivers alter ecosystem functioning, reduce biodiversity, and compromise the capacity of protected areas to maintain essential ecosystem services. Consequently, conservation authorities increasingly require predictive tools capable of anticipating ecosystem responses before irreversible ecological thresholds are reached.
The transition from reactive monitoring to proactive, predictive management has become imperative for biodiversity conservation [3,4]. Doñana National Park in southwestern Spain exemplifies this challenge: as a UNESCO World Heritage site and critical wetland ecosystem hosting over 300 bird species, it experiences severe water stress, illegal groundwater extraction, and climate-driven hydrological variability [5,6]. Traditional management approaches, relying on periodic field surveys and retrospective analysis, are insufficient to anticipate ecosystem state transitions or evaluate intervention scenarios before implementation [7,8].
The ecological complexity of such systems (characterized by nonlinear dynamics, threshold effects, and multi-scale interactions) demands sophisticated modeling frameworks capable of integrating diverse data streams (meteorological, hydrological, biological) and generating actionable forecasts [9]. However, the technical knowledge required to construct and operate such models often limits their practical implementation in conservation contexts [10,11].
1.2. State of the Art
1.2.1. Ecosystem Modeling and DTs
DTs, originating in engineering and manufacturing [12], have recently emerged as promising tools for environmental science [13]. A DT is a virtual representation of a physical system that continuously integrates real-world data to simulate current states and predict future conditions [14]. In ecology, DTs have been explored by researchers working in environmental informatics and ecosystem management for applications including forest monitoring, urban ecosystem management, marine conservation, precision agriculture, and biodiversity assessment [15]. Recent studies have demonstrated the feasibility of DT frameworks for integrating heterogeneous environmental observations with predictive models to support scenario analysis and adaptive management.
Recent work has demonstrated the feasibility of coupling process-based ecological models with data-driven machine learning (ML) approaches to improve predictive accuracy [16]. Hybrid models combining mechanistic understanding with statistical learning can capture both known ecological processes and emergent patterns from observational data [17]. Time-series forecasting techniques, including Autoregressive Integrated Moving Average (ARIMA), Seasonal ARIMA (SARIMA), and ensemble methods such as Random Forest and Gradient Boosting (e.g., XGBoost), have shown efficacy in predicting ecological variables like species abundance, water levels, and phenological events [18,19].
1.2.2. ML for Biodiversity Monitoring and Prediction
The application of ML to ecological forecasting has accelerated in recent years [20,21], driven by the increasing availability of long-term environmental monitoring data, remote sensing products, and high-performance computing. Recent studies have demonstrated that ML techniques can successfully identify complex nonlinear relationships between environmental variables and ecological responses, improving predictions of species distributions, biodiversity dynamics, hydrological conditions, phenology, and ecosystem resilience under changing climate scenarios. Supervised learning algorithms have been successfully applied to predict species distributions [22], population dynamics [23], and habitat suitability under climate scenarios [24]. Tree-based models (Decision Trees, Random Forests) offer interpretability alongside predictive power, which is critical for gaining stakeholder trust in conservation applications [25]. Boosting algorithms like XGBoost have demonstrated superior performance in complex, high-dimensional ecological datasets [26].
Despite these advances, a persistent gap exists between model development in research settings and operational deployment by environmental practitioners [10,27]. Conservation managers often lack the technical expertise or computational resources to configure, execute, and interpret advanced predictive models [28,29].
1.2.3. Generative AI for Scenario Analysis and Decision Support
The recent emergence of Large Language Models (LLMs) and generative AI has introduced new possibilities for human-computer interaction in scientific workflows [30,31]. Generative AI systems can interpret natural language queries, translate them into structured tasks, and synthesize outputs in accessible formats [32,33]. In environmental science, applications have begun to explore generative AI for literature synthesis [34], data annotation [35], and educational tools [36].
However, despite recent advances in generative AI, the integration of conversational interfaces with predictive ecological DT remains largely unexplored. Existing environmental modeling platforms frequently require specialised knowledge of data preprocessing, model configuration, and programming, limiting their adoption by conservation practitioners and environmental managers. Consequently, there is a need for intelligent interfaces capable of translating natural-language requests into reproducible modeling workflows while preserving transparency and user control [37,38]. This represents a significant opportunity for generative AI to democratise access to advanced decision-support tools by bridging the gap between sophisticated modeling infrastructures and the practical needs of conservation stakeholders.
1.3. Research Gap and Proposed Solution
While DT and ML-based predictive models offer substantial potential for ecosystem management, their practical utility is constrained by accessibility barriers. Configuring simulations typically requires expertise in programming, model parameterization, and data preprocessing; skills not commonly held by field ecologists, park managers, or policy-makers [10,11]. Existing Environmental Decision Support Systems (EDSS) often present steep learning curves or rigid interfaces that do not accommodate the exploratory, iterative nature of conservation planning [38,39].
This study proposes an architecture that addresses these limitations by integrating a generative AI conversational interface with a configurable DT core. Unlike existing DT implementations, which generally require users to manually configure model parameters through programming interfaces or specialised software, the proposed architecture enables natural-language configuration while preserving reproducibility through structured YAML specifications. Furthermore, compared with conventional Environmental Decision Support Systems, the proposed framework combines conversational interaction, explainable ML, configuration traceability, and modular cloud deployment within a single architecture, reducing technical barriers without sacrificing transparency or user control.
1.4. Contributions
This work makes the following key contributions:
- Conversational configuration of ecological modeling workflows: We present a generative AI interface that allows users to configure the core of a conservation-oriented DT. It allows users to inspect, modify and validate, and persist a structured YAML file to configure the system without directly editing code or complex files.
- Configurable DT pipeline: We describe a modular prototype that connects data preprocessing, target and feature selection, model training, prediction generation, traceability metadata, and database-backed visualization in a reproducible workflow.
- Explainability for conservation decision support: We incorporate SHAP-based feature attribution to improve transparency of model behaviour. SHAP explanations are intended solely to explain how trained ML models generate predictions and should not be interpreted as evidence of ecological causality or ecosystem mechanisms.
- TRL-4 feasibility assessment in a National Park: We evaluate the system as a Technology Readiness Level 4 (TRL-4) prototype applied to a real conservation context, focusing on functional capability, agent-assisted configuration, and qualitative usefulness rather than claiming operational predictive performance.
1.5. Paper Structure
The remainder of this paper is organized as follows: Section 2 describes the study area, system architecture, configurable modeling pipeline, conversational interface, and prototype infrastructure. Section 3 presents a lightweight evaluation of the agent-assisted configuration workflow, selected model training and prediction capabilities, SHAP-based interpretability, and traceability mechanisms. Section 4 discusses the implications for accessible conservation modeling, the value of explainability, and the limitations of the current prototype with Technology Readiness Level 4 (TRL-4). Section 5 summarizes the main contributions and outlines future work required for operational validation.
2. Materials and Methods
2.1. Study Area: Doñana National Park
Doñana National Park is located in southwestern Spain, at the estuary of the Guadalquivir river. Covering approximately 54,252 hectares of marshland, dunes, and Mediterranean scrubland, Doñana is recognized as a UNESCO World Heritage Site and Biosphere Reserve, hosting one of Europe’s most important wetland ecosystems [5]. The park serves as a critical stopover for migratory birds along the East Atlantic Flyway, supporting over 300 avian species and multiple threatened populations of the Spanish Imperial Eagle (Aquila adalberti) and the Iberian Lynx (Lynx pardinus) [40].
Doñana faces multiple conservation challenges: intensive agriculture in surrounding areas drives illegal groundwater extraction, depleting aquifers that sustain the marsh [41]. Climate change has contributed to a decline in precipitation across much of the Iberian Peninsula, particularly during the summer months, thereby exacerbating drought risk and water scarcity in southern Mediterranean regions [42]; and anthropogenic pressures from tourism, infrastructure development, and pollution threaten ecosystem integrity. These stressors make Doñana an ideal testbed for predictive conservation technologies, as timely interventions informed by robust forecasting can significantly influence management outcomes [6].
2.2. System Architecture Overview
The proposed DT architecture consists of four integrated modules (Figure 1): (1) Data Collection and Preparation, responsible for acquiring, harmonizing, cleaning, and storing heterogeneous environmental and ecological datasets; (2) Backend and Machine Learning Modeling (the DT Core), which performs feature engineering, model training, model selection, prediction generation, and explainability analysis; (3) Configuration agent, a conversational AI interface inside the main backend logic, which enables users to configure modeling workflows using natural language and translates user requests into structured YAML configurations; and (4) Frontend and Visualization, which provides a decision support dashboard with an interactive visualization of historical observations, predictive outputs, model diagnostics, and explainability results. These modules communicate through RESTful APIs and are implemented as independently deployable microservices, providing modularity, scalability, and traceability throughout the modeling workflow. Each module operates as an independently deployable microservice, ensuring modularity, fault isolation, and scalability [43].
Figure 1.
Architecture of the proposed conversational ecological DT showing the four principal modules: (1) Data Collection and Preparation, (2) Backend and Machine Learning Modeling (DT Core), (3) Configuration agent (as a part of the backend and ML layer), and (4) Frontend and Visualization. Data and metadata are exchanged through RESTful APIs, while the PostgreSQL database provides persistent storage and Power BI supports interactive visualization.
2.3. Data Ingestion and Processing
2.3.1. Data Sources
The system integrates heterogeneous environmental, biological, and socio-demographic data sources related to Doñana National Park and its surrounding municipalities. The selection of variables was designed not only to support predictive modeling experiments, but also to increase the visibility of emblematic species and conservation challenges associated with one of Europe’s most important protected wetlands.
- Meteorological and environmental data: Historical climate records were obtained from the Spanish State Meteorological Agency (AEMET), including variables such as precipitation, temperature, relative humidity, and wind speed from monitoring stations within and around Doñana [44]. These data were complemented with measurements from the ICTS Doñana monitoring infrastructure [45], including maximum, mean, and minimum values for air pressure, relative humidity, air temperature, accumulated hail, hail duration, accumulated rainfall, rainfall duration, soil temperature, water level, and water temperature.
- Waterbird census data: Long-term bird census data were collected from the ICTS Doñana infrastructure [46] for a set of iconic waterbird species selected for their ecological relevance and their potential to communicate conservation challenges to a broader audience. The selected species were Northern Pintail (Anas acuta), Greylag Goose (Anser anser), Black Stork (Ciconia nigra), Black-tailed Godwit (Limosa limosa), Eurasian Wigeon (Mareca penelope), Greater Flamingo (Phoenicopterus roseus), Eurasian Spoonbill (Platalea leucorodia), and Glossy Ibis (Plegadis falcinellus). These species provide a recognizable and policy-relevant biological layer for evaluating how the DT can support conservation-oriented exploration [5,47].
- Iberian lynx population data: Population indicators for the Iberian lynx (Lynx pardinus) in Doñana were extracted from EBD-CSIC reports, including total individuals, reproductive females, and cubs born. Unlike many species in Doñana that show declining or unstable trends, the Iberian lynx is subject to an active reintroduction and recovery programme, which has produced an upward population trend. Including this species therefore allows the system to represent a contrasting conservation trajectory and to test how the DT handles species with different ecological and management dynamics.
- Socio-demographic data: Population data for municipalities surrounding the park were obtained from the Spanish National Statistics Institute (INE) [48]. The selected municipalities were Almonte, Hinojos, La Puebla del Río, and Aznalcázar. These data were incorporated to complement environmental variables and to explore whether nearby human population size or population density, calculated using municipal surface area, may be associated with changes in the abundance of selected species.
2.3.2. Data Preprocessing Pipeline
Raw data were obtained from heterogeneous sources and formats, including tabular datasets, spreadsheets, and published technical reports. The preprocessing pipeline, implemented in Python 3.11, performs the following operations:
Step 1: Data extraction and standardization. All datasets are converted to a common tabular structure with standardized column names, date formats, temporal references, and measurement units. While most meteorological, environmental, bird census, and socio-demographic data were available in structured tabular formats, the Iberian lynx population indicators had to be manually extracted from EBD-CSIC reports published since 2000. This manual extraction step was necessary because the relevant information was embedded in document-based reports rather than consistently available as a machine-readable time series.
Step 2: Temporal harmonization. The integrated dataset combines variables with different temporal granularities, including daily environmental measurements, periodic bird censuses, annual socio-demographic records, and irregularly reported lynx population indicators. These sources are harmonized into modeling-ready time series according to the temporal frequency selected in the DT configuration.
Step 3: Missing data imputation. Missing values resulting from the integration of heterogeneous datasets with different temporal resolutions were imputed using linear interpolation between adjacent observations. This deterministic approach was selected because it is computationally efficient, reproducible, and suitable for demonstrating the end-to-end functionality of the DT within its TRL-4 prototype.
We acknowledge that deterministic interpolation may underestimate the natural variability of ecological systems and lead to overconfident predictions when uncertainty is considered. More robust approaches, such as Multiple Imputation by Chained Equations (MICE), better preserve uncertainty by generating multiple plausible datasets [49]. Since the objective of this work is to validate the DT architecture rather than to provide operational ecological forecasts, linear interpolation was considered an appropriate engineering choice. Future versions of the DT will investigate multiple imputation techniques to better represent uncertainty throughout the predictive workflow.
Step 4: Feature engineering. Additional variables are derived to support predictive experiments. Population density measures for nearby municipalities were calculated to enrich the dataset with complementary socio-demographic information that may help explain variations in the selected conservation variables. In contrast, lag features are generated only for the target variable selected in the user-defined configuration during the configuration session. These lagged values are intended to help non-time-series-specific models, such as Random Forest and XGBoost, incorporate temporal dependencies when predicting the target variable.
Step 5: Data persistence. Cleaned and feature-enriched data are stored in a PostgreSQL relational database hosted on AWS RDS, with tables organized by data type, including climate and environmental variables, biological census records, Iberian lynx population indicators, socio-demographic variables, model metadata, and prediction outputs [50].
2.4. Predictive Engine: DT Core
2.4.1. Model Library
The DT’s predictive capability resides in a modular Python library encapsulating seven supervised learning algorithms commonly used for time-series forecasting:
- Moving average (MA): A baseline statistical model computing the arithmetic mean over a sliding temporal window (default: 30 days). Despite its simplicity, MA provides a robust benchmark for evaluating more complex models [51].
- Linear regression (LR): Ordinary least squares regression modeling the target variable as a linear combination of predictors. LR offers interpretability through coefficient inspection, but assumes linearity and homoscedasticity [52].
- Decision tree regressor (DTR): A non-parametric model partitioning feature space via recursive binary splits. DTRs capture non-linear relationships and interactions but are prone to overfitting [53].
- Random forest regressor (RFR): An ensemble of decision trees trained on bootstrap samples with random feature subsets at each split. RFR reduces variance and improves generalization through averaging [54].
- XGBoost regressor (XGB): An optimized gradient boosting algorithm that sequentially trains trees to correct residuals of prior models. XGBoost employs regularization (L1/L2 penalties) to prevent overfitting and supports parallel computation [55].
- Autoregressive integrated moving average (ARIMA): A univariate time-series model capturing temporal autocorrelation through autoregressive (AR) and moving average (MA) components, with differencing (I) to achieve stationarity [56]. Model orders (p, d, q) are selected via Akaike Information Criterion (AIC) minimization.
- Seasonal ARIMA (SARIMA): An extension of ARIMA incorporating seasonal patterns through additional AR, MA, and differencing terms at the seasonal period (e.g., annual cycle: s = 365 days) [51]. SARIMA is particularly effective for variables exhibiting strong seasonality, such as waterbird abundance.
All these models are implemented using scikit-learn 1.3. The current implementation combines classical machine learning algorithms (e.g., Random Forest, Decision Tree, and XGBoost) with statistical time-series models (ARIMA and SARIMA), allowing the DT to automatically select the best-performing model according to the configured evaluation metrics. As several ecological response variables are count data, Generalised Linear Models (GLMs) with Poisson or Negative Binomial distributions, including regularised variants such as LASSO and Elastic Net, represent appropriate benchmark models. Although these were not included in the current TRL-4 prototype, their integration is planned as future work to enable a more comprehensive comparison of predictive approaches for ecological applications.
2.4.2. Training and Model Selection
Training proceeds as follows:
Data splitting. After the target variable is selected (e.g., flamingo count), the dataset is chronologically divided into training, validation, and test sets to respect temporal ordering and avoid data leakage [57]. The default percentages are 70%, 15% and 15%, although they are configurable by the user through the agent.
Cross-validation. Time-series cross-validation (expanding window) is applied within the training set to tune hyperparameters and assess stability [58]. Five folds are used, with each fold adding one year of data to the training window.
Model training. All seven algorithms are trained on the same preprocessed features. For univariate models (ARIMA, SARIMA, MA), only the target variable’s historical values and temporal covariates are used. For multivariable models (LR, DTR, RFR, XGB), all available features (climate, hydrology, lagged variables) serve as predictors.
Performance evaluation. Models are evaluated on the validation set using three metrics:
- Mean absolute error (MAE):
- Root mean squared error (RMSE):
- Mean absolute percentage Error (MAPE):
where denotes observed values and predicted values.
Automatic model selection. The system ranks models by validation RMSE (primary criterion) and MAE (tiebreaker). The best-performing model is serialized (Python pickle or joblib) and registered with a unique identifier, timestamp, and metadata (hyperparameters, feature list) in the database.
2.4.3. Prediction Generation and Traceability
Once trained, models generate forecasts via two modes:
Historical backcasting: For validation, models predict over the test set, enabling comparison with ground truth to assess generalization error.
Future forecasting: For operational use, models predict future states (e.g., water levels for the next 30 days). Univariate models (ARIMA/SARIMA) require only the forecast horizon. Multivariable models require future values of predictor variables, which need to be provided by the user (assumed precipitation scenarios imputed using climatological normals or generated by other forecast models).
All predictions are timestamped and stored in the database for further analysis.
2.5. Conversational AI Architecture and Configuration Management
The conversational interface employs Google’s Gemini 2.5 Flash Lite, a large language model optimized for low-latency, high-throughput applications [59]. Gemini 2.5 Flash Lite was selected for its balance between contextual understanding, response generation quality, and computational cost compared with larger variants such as Flash or Pro. The model is accessed through Google Cloud’s Vertex AI [60], enabling compliance with the European Union’s General Data Protection Regulation (GDPR) concerning user-submitted data.
The interface is implemented using Chainlit, a Python framework for developing conversational AI applications [61]. Chainlit provides session management, message history persistence, and user interface components supporting rich media outputs such as plots and tables. The backend coordinates interactions among the user, the Gemini model, and the DT API.
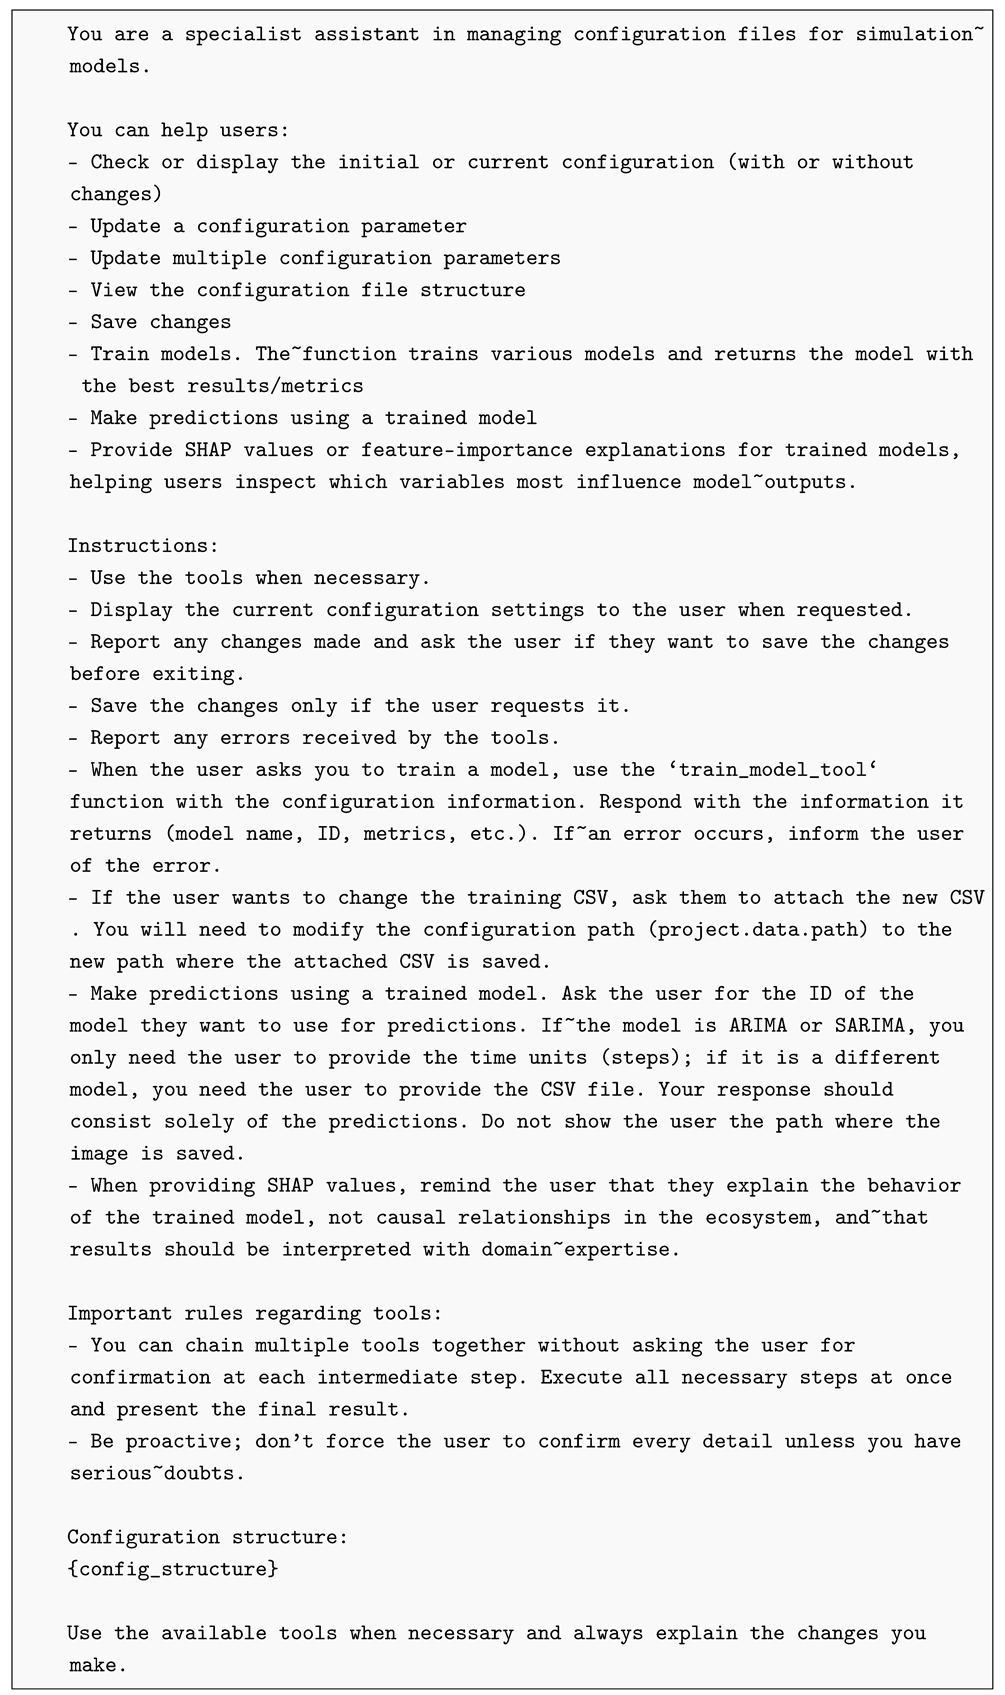
To ensure effective interaction, a structured prompt engineering strategy was developed to facilitate accurate intent recognition and reliable system behavior. The prompt template consists of three main components: (i) a static system prompt defining the agent’s role, capabilities, and operational constraints; (ii) dynamic injection of the YAML configuration template, allowing the model to identify editable parameters; and (iii) tool descriptions enabling function calling capabilities (all this information is detailed on Appendix A). Gemini 2.5 supports structured function invocation through JSON outputs [62], allowing the conversational agent to execute predefined operations such as updating configurations, training new models using the DT core, or generating predictions from existing models. Functions are registered using JSON schemas specifying parameter types, constraints, and valid inputs.
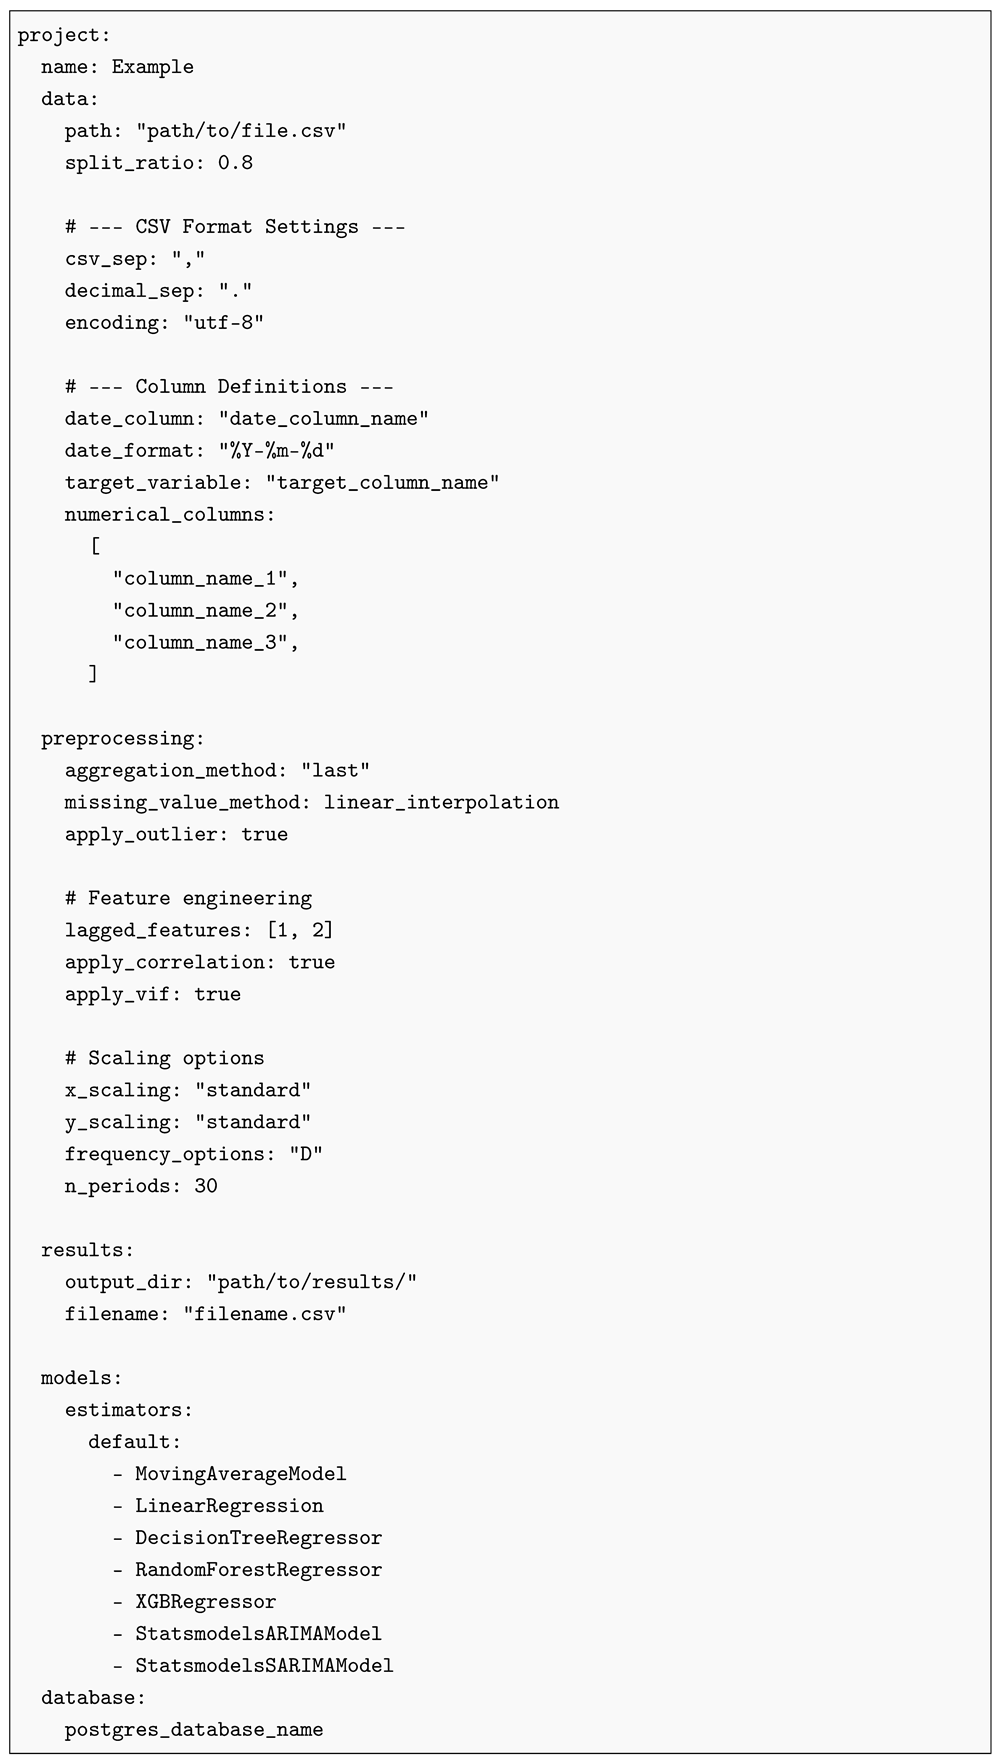
The system maintains a YAML configuration file containing the parameters required for DT operation, including data preprocessing options (e.g., imputation methods, scaling procedures, and outlier detection strategies), target variables, predictive feature variables, time-series frequency (daily, monthly, or annual), and the set of ML models used during the training phase. Users can modify these configurations conversationally through the interface. When an update request is received, the agent validates the proposed modification by checking parameter existence and value constraints, presents the updated configuration to the user, and requests explicit confirmation before applying persistent changes. This human-in-the-loop design reduces the risk of unintended modifications caused by misinterpretation or ambiguous instructions [63].
2.6. Decision Support Dashboard and User Interaction Workflow
Predictions and model output are visualized in Microsoft Power BI, integrated through Microsoft Fabric for cloud-hosted reporting [64]. The dashboard connects securely to the AWS RDS PostgreSQL database through a gateway that enables multiple daily data updates. This infrastructure allows users to analyze generated predictions alongside historical observations and supports data-driven decision-making when evaluating alternative conservation measures.
The dashboard organizes information into several thematic report views according to data type and modeling outputs. Environmental and climate data visualizations provide temporal analyses of meteorological and environmental variables obtained from AEMET and the ICTS Doñana monitoring infrastructure. These include precipitation, air temperature, relative humidity, air pressure, soil temperature, water temperature, and water level measurements, enabling users to inspect environmental trends and seasonal patterns.
Additional views focus on species population and census data for conservation-relevant species. These include monitored waterbird populations from ICTS Doñana and Iberian lynx indicators extracted from EBD-CSIC reports, such as total individuals, reproductive females, and cubs born. The dashboard enables users to examine long-term historical trends and compare the temporal evolution of different species populations.
The platform also incorporates socio-demographic information from municipalities surrounding Doñana, including Almonte, Hinojos, La Puebla del Río, and Aznalcázar. These visualizations provide contextual information regarding nearby human population dynamics and derived indicators such as population density, which can serve as complementary variables during exploratory modeling tasks.
Model prediction views display outputs generated by the trained ML models for selected conservation indicators, particularly species population variables. These visualizations allow users to compare predicted and historical values in an accessible format that facilitates interpretation of model behavior and trends. In the current prototype, these predictions should be interpreted as exploratory outputs of the modeling workflow rather than validated operational forecasts.
The overall interaction workflow combines the conversational interface with the dashboard environment. Users begin by initiating a session through the Chainlit interface, where they receive a welcome message and a summary of the current configuration. Natural-language requests can then be submitted to configure predictive models, for example by specifying target species and selecting environmental or socio-demographic explanatory variables. The conversational agent interprets the request, proposes the corresponding configuration modifications, and requests explicit confirmation before persisting any changes. Once confirmed, the backend triggers model training through the DT API. After training is completed, the selected model, associated identifier, and diagnostic metrics are returned to the user through the conversational interface. Users can subsequently generate predictions and inspect the results either directly within the Chainlit interface through inline matplotlib visualizations or through the Power BI dashboard, which serves as the primary reporting platform for formal analysis and presentation purposes.
2.7. Implementation Details and Infrastructure
2.7.1. Prototype Deployment Architecture
The prototype was deployed using a cloud-based architecture intended to validate integration among the conversational interface, backend services, relational storage, and dashboard layer. The backend and Chainlit frontend were containerized and deployed on two services (agent and DT engine) on AWS Fargate behind an Application Load Balancer. Environmental data, model metadata, configuration records, and prediction outputs were persisted in PostgreSQL using Amazon RDS. The dashboard layer connected to the PostgreSQL database to support inspection of historical observations and generated predictions.
The deployment should be interpreted as a prototype deployment rather than a production-grade operational infrastructure. Features such as autoscaling policies or long-term archival storage are considered deployment extensions and are not treated as evaluated results in this study.
2.7.2. Software Stack
- Backend: Python 3.11, FastAPI 0.120.1, Psycopg2 2.9.10, Pandas 2.3.0, NumPy 1.26.4.
- ML: scikit-learn 1.7.0, XGBoost 3.0.2, statsmodels 0.14.4, matplotlib 3.10.3, SHAP 0.49.1.
- Conversational AI: Chainlit 2.6.2, Google Generative AI SDK 1.26.0.
- AI-generated configuration validation: Pydantic 2.11.7.
- Containerization: Docker 29.0.2.
- Database: PostgreSQL 17.5.
- Deployment: AWS Copilot 1.34.1 CLI for infrastructure-as-code (IaC) provisioning.
2.7.3. Evaluation Protocol
System validation follows the Technology Readiness Level (TRL) framework proposed by NASA [65]. TRL-4 corresponds to the validation of integrated technological components in a laboratory environment, where the emphasis is on demonstrating functional integration rather than operational performance under real-world conditions. Consequently, the objective of this study is to evaluate the successful integration of the conversational AI interface, DT core, predictive modeling pipeline, explainability module, and dashboard infrastructure, rather than to claim operational predictive accuracy suitable for conservation decision-making. The evaluation focuses on four aspects:
Agent-assisted configuration. The present evaluation employs representative user prompts designed to systematically assess the functionality of the conversational interface. These prompts were intentionally selected to validate configuration workflows under controlled and reproducible conditions. The evaluation was not designed as a usability study involving conservation practitioners.
Pipeline execution. The DT core is evaluated through a small number of reproducible training and prediction tasks, used to verify that the configured workflow executes end-to-end and returns model metadata and outputs.
Explainability. SHAP values are generated for models, allowing users to inspect the relative contribution of input variables to individual predictions or aggregate model behavior [66,67].
Traceability. Training runs and predictions are linked to configuration files, model identifiers, timestamps, and data references, supporting auditability and reproducibility.
3. Results
3.1. Overview of Prototype Evaluation
The evaluation was designed to match the actual maturity and evidence available for the system. The results focus on whether the prototype enables non-technical users to configure and execute modeling workflows through a conversational interface. The validation therefore covers four dimensions: agent-assisted configuration, execution of selected training and prediction tasks, SHAP-based interpretation, and traceability of outputs.
This framing is consistent with a TRL-4 prototype, demonstrating successful integration of the different system components and validating the functional feasibility of the proposed architecture within a controlled environment. The platform provides a robust foundation for interactive conservation-oriented DT workflows in Doñana, enabling model training, prediction generation, and integrated data exploration through conversational and dashboard-based interfaces. In this context, the reported quantitative metrics should be interpreted as representative diagnostics of the implemented modeling workflows and as evidence of the platform’s capability to support exploratory ecological analysis and decision-support tasks.
3.2. Agent-Assisted Configuration Workflow
The main functional result of the prototype is the ability to use natural language to configure a modeling workflow that would otherwise require direct manipulation of a YAML file. The configuration file defines the input dataset, date column, target variable, numerical predictors, train–test split, preprocessing options, lagged features, correlation and VIF filters, scaling choices, prediction horizon, enabled estimators, output directory, and database connection. By injecting this structure into the conversational agent prompt, the system constrains the interaction to parameters that the DT core can actually use.
Figure 2 illustrates how the agent exposes the active configuration to the user. This view makes the modeling assumptions inspectable, including the selected target variable, numerical predictors, preprocessing options, lagged features, enabled estimators, and output settings.
Figure 2.
Conversational display of the active DT configuration, including data, preprocessing, model, and output parameters.
The agent supports the following operations:
- Displaying the current configuration and explaining editable fields;
- Updating one or more configuration parameters, such as the target variable, feature set, time frequency, preprocessing method, or enabled models;
- Checking whether requested values are compatible with the known configuration structure;
- Asking for clarification when the request is ambiguous;
- Saving changes only after explicit user confirmation;
- Launching model training from the active configuration;
- Generating predictions from a trained model when the required model identifier and input information are available;
- Reporting tool errors directly to the user instead of hiding failed execution.
A lightweight evaluation set of natural-language tasks was used to measure the agent’s behavior, as shown in Table 1. The task set covers configuration inspection, single-parameter edits, multi-parameter edits, model selection, training requests, prediction requests, and ambiguous instructions. The measured metrics are task completion rate, number of clarification turns, and response time. These metrics evaluate the agent as a useful configuration interface.
Table 1.
Evaluation results of the conversational configuration agent. Each task was tested with 20 different prompts.
3.3. Representative Execution Scenario
3.3.1. Overview of the Modular Workflow Setup
Rather than presenting a single, monolithic case study, this section is structured to demonstrate the modular capabilities of the proposed architecture across its different functional stages. To make the workflow clear from start to finish, the examples are divided into three functional groups:
- Conversational Execution: We use the Iberian lynx dataset to demonstrate how the agent handles configuration, model training, and inline prediction generation.
- Explainability (SHAP): We present SHAP visualizations from an independent execution to illustrate the system’s interpretability module.
- Dashboard Visualization: Finally, we present the Power BI dashboard using waterbird and meteorological data to demonstrate the system’s capacity for persistent, multi-variable visualization and historical data inspection.
3.3.2. Conversational Execution
A representative execution of the proposed workflow is shown in Figure 3 where the user initiates the model training through the conversational interface.
Figure 3.
Conversational display of the model training results. The DT reports the selected predictive model, training status, evaluation metrics, and a summary of the generated model, providing immediate feedback to the user before proceeding to the prediction stage.
The prediction stage of the workflow is illustrated in Figure 4. The conversational agent reports the selected predictive model, its evaluation metrics, the generated prediction, and a graphical representation of the forecast within the same conversational interface, providing users with an integrated view of the prediction results.
Figure 4.
Example of a workflow result in which the agent launched model training, reported the selected model and diagnostic metrics, and generated a one-year-ahead prediction.
Figure 5 presents a representative one-year-ahead prediction generated by the DT for the Iberian lynx population indicator. The objective of this example is to demonstrate the operational workflow of the prototype rather than to claim validated forecasting performance. The prediction illustrates the complete interaction between conversational configuration, automated model selection, model execution, and visual presentation of the results. The observed deviation between the predicted and expected population trajectory highlights the challenges associated with forecasting ecological systems using relatively short and heterogeneous time series. Such deviations emphasise the importance of continued feature engineering, temporal model development, and uncertainty quantification before operational deployment.
Figure 5.
Inline prediction generated by the conversational agent for an Iberian lynx population indicator. The figure illustrates the prototype’s ability to return both numerical and visual outputs directly within the conversational workflow.
3.3.3. Explainability Using SHAP Values
To improve transparency and facilitate model interpretation, the Digital Twin automatically computes SHAP (SHapley Additive exPlanations) values after each successful training process. These explanations are generated independently of the predictive model selected by the workflow and provide both global and local interpretations of the resulting model.
Figure 6 and Figure 7 present representative SHAP outputs obtained from a separate execution of the Digital Twin. These visualizations are generated inline directly within the conversational interface to provide immediate feedback to the user, and are not exported to the external Power BI dashboard. For consistency, the generative AI prompts and LLM version used to configure and launch this execution are identical to those utilized in the previous conversational examples.
Figure 6.
Global feature importance generated automatically by the Digital Twin after model training. Predictor importance is quantified using the mean absolute SHAP values, providing a global interpretation of the relative contribution of each explanatory variable to the trained predictive model. The figure corresponds to a representative execution of the Digital Twin and illustrates the integrated explainability functionality.
Figure 7.
Representative SHAP waterfall plot automatically generated by the Digital Twin for an individual prediction. The plot illustrates how the contribution of each explanatory variable modifies the model baseline to obtain the final prediction, providing a local explanation of the model behaviour. The figure corresponds to an independent execution of the Digital Twin and is included to demonstrate the explainability capabilities integrated into the proposed architecture.
The specific prediction shown in Figure 7 was selected as a representative example because it effectively illustrates the contrasting impact of different temporal lags on the expected output, demonstrating how the model balances opposing temporal dependencies. The objective of this example is to demonstrate the explainability functionality integrated into the proposed architecture rather than to provide a detailed ecological interpretation of a specific conservation use case.
The variables denoted as Total_lag1 and Total_lag2 represent the target variable (Iberian lynx individuals) delayed by one and two periods (years), respectively. These lagged features are explicitly generated during the data preprocessing phase to enable non-time-series-specific regression models, such as XGBoost, to capture temporal autocorrelation. The specific local explanation shown in Figure 7 corresponds to a one-year-ahead annual forecast covering the entire Doñana National Park area. Regarding the user interaction with the Digital Twin, generating these explainability plots does not require complex prompt engineering; the visualizations are triggered by simple natural language requests to the agent, such as asking to “explain the model” or “provide the SHAP values”.
The global SHAP importance analysis (Figure 6) indicates the relative influence of the explanatory variables on the trained model, allowing users to identify the predictors that contribute most strongly to the model behaviour. The corresponding local SHAP explanation Figure 7 illustrates how the contribution of each feature modifies the model’s baseline prediction for a representative observation. Together, these visualizations provide transparent explanations of both the overall model behavior and individual predictions.
3.4. Selected Model Training and Prediction Runs
Table 2 summarizes several representative training runs executed using the DT core. These examples include both mammal and bird population indicators and illustrate the system’s ability to process the configured variables, train the enabled estimators, select a suitable model, and return diagnostic metrics to the user through the conversational interface. The reported errors remain too high to support operational forecasting, particularly given the limited availability, heterogeneity, and temporal sparsity of some biological datasets. Nevertheless, the executions validate the main technical objective of the prototype: enabling users to configure, launch, and inspect predictive modeling workflows in a reproducible and accessible way. The results therefore support the system’s value as a functional decision-support prototype while identifying predictive accuracy as a priority for future work.
Table 2.
Example of model training runs executed through the DT pipeline.
The predictive performance reported in Table 2 should be interpreted within the context of the study’s primary objective, namely the validation of the conversational DT architecture rather than the optimisation of predictive accuracy. The observed MAPE values indicate that further improvements in feature engineering, temporal modeling, and model selection are required before the system can support operational ecological forecasting. Nevertheless, the experiments demonstrate the successful execution of the complete modeling workflow, including conversational configuration, automated training, prediction generation, explainability, and dashboard integration.
3.5. SHAP-Based Interpretability
A distinctive capability of the prototype is the integration of SHAP values for all models. SHAP does not prove causal relationships, but it helps users inspect whether model predictions are influenced by variables that are plausible from a conservation perspective. This is especially relevant in ecological decision-support contexts, where a prediction without interpretability can be difficult for practitioners to trust or challenge.
SHAP summaries can be used to identify which input variables contribute most to model outputs across a dataset, while local explanations can show how variables contributed to an individual prediction. In the Doñana use case, this allows users to examine whether variables such as precipitation, temperature, lagged values of the target variable, or hydrological indicators are driving the model behavior. Such interpretation supports model review, discussion with domain experts, and detection of potentially spurious dependencies.
In one representative run of a model predicting lynx population, the highest mean absolute SHAP values corresponded to lynx population lag 1, rainfall accumulated mean, and air temperature mean. These outputs were used only to inspect model behaviour and were not interpreted as causal ecological relationships.
SHAP therefore improves transparency by making model behaviour more inspectable. Nevertheless, throughout this work SHAP explanations should be interpreted strictly as descriptions of statistical model behaviour. They do not identify ecological mechanisms, causal processes, or biological drivers, and should always be interpreted together with ecological expertise.
3.6. Traceability and Dashboard Outputs
The prototype stores outputs with metadata that support later inspection. Training and prediction records can be linked to the active configuration, model identifier, timestamp, selected variables, preprocessing options, and result files. This traceability is important because conversational systems can otherwise make it difficult to reconstruct how a result was produced.
The dashboard layer provides a practical interface for reviewing historical data and generated predictions. In the current prototype, dashboard visualizations should be treated as decision-support artifacts for exploration and communication, not as validated operational recommendations. Their value lies in allowing users who may not interact directly with Python scripts to review the modeling workflow, model objects, or database tables.
As in the previous modular examples, the modeling workflow populating this dashboard relies on the same standardized conversational prompts and model configuration parameters; no complex prompt engineering is required beyond simple natural language requests. In this specific dashboard view, the predictive models (such as XGBoost and Decision Tree Regressors) are applied to waterbird species (e.g., Anas acuta and Anser anser) as the target variables. The predictors that are modeled in this case include environmental features such as mean temperature, accumulated precipitation, and water levels. Crucially, visualization of these results does not require any manual data export by the user. As described in the system architecture, the Digital Twin backend automatically persists all predictions and metadata directly into the AWS RDS PostgreSQL database, which the Power BI dashboard queries automatically via a secure data gateway.
Figure 8 provides an example of the dashboard layer connected to the prototype database. Although the dashboard is not the main research contribution, it supports traceability and communication by allowing users to inspect historical records, generated predictions, and model output outside the conversational interface, allowing the analysis of trends that may affect the evolution of the variables of interest.
Figure 8.
Example Power BI plots connected to the prototype database. The first view shows the population projections generated for the selected waterbird species. The second panel displays historical records of temperature measurements at the different weather stations of the Doñana National Park.
4. Discussion
4.1. Interpretation of Findings
The prototype demonstrates that a generative AI interface can act as a practical configuration layer for a conservation-oriented DT. Users can interact with the system through natural language while the backend preserves a structured, reproducible configuration. This addresses a real barrier in ecological modeling: many practitioners who could benefit from predictive tools are not comfortable selecting model parameters, running training scripts, or editing configurations using files or complex GUIs.
The findings are consistent with recent DT research, which identifies interoperability, data integration, and stakeholder accessibility as critical barriers to operational environmental DTs. While previous studies have primarily focused on improving predictive performance or integrating sensor infrastructures, comparatively little attention has been devoted to simplifying interaction between environmental practitioners and complex modeling workflows. The proposed conversational interface therefore complements existing DT research by addressing the usability dimension of ecosystem modeling rather than replacing existing predictive methodologies.
The presented results demonstrate that the proposed architecture successfully integrates conversational AI, predictive modeling, explainability, and decision-support visualisation within a single DT framework. Rather than demonstrating operational forecasting capability, the evaluation validates the feasibility of combining these components into an accessible modeling environment capable of supporting transparent and reproducible ecological analyses. This distinction is particularly important because the principal contribution of this work lies in the system architecture and workflow integration rather than in maximising predictive accuracy for any individual ecological indicator.
4.2. Conversational Configuration as Access Infrastructure
Traditional Environmental Decision Support Systems often require users to learn fixed interfaces, domain-specific software, or scripting workflows [37,38]. By packaging state-of-the-art predictive models within an intuitive, conversational interface, the proposed system directly addresses usability barriers by allowing users to express modeling intentions in natural language while the agent maps those intentions onto a constrained YAML schema. This is valuable because the configuration file becomes both a machine-readable execution contract and a human-readable representation of modeling assumptions.
The human-in-the-loop design is central to this contribution. The agent can propose changes, but persistence requires confirmation. Tool errors are reported rather than hidden. Ambiguous requests can be routed to clarification. These design choices are especially important in conservation contexts, where model outputs can influence discussions about scarce resources, ecological risk, and management priorities [63].
4.3. The Role of SHAP in Conservation-Oriented Modeling
SHAP-based explanations strengthen the prototype because they shift the interaction from simply asking for predictions to interrogating model behavior. For conservation practitioners, knowing that a model output changed slightly is often less useful than understanding which variables contributed to that change. Feature attributions can support expert review, reveal unexpected dependencies, and help communicate model behavior to stakeholders.
However, SHAP must be used carefully. It explains the behavior of a trained model, not the causal structure of the ecosystem. A variable with high SHAP importance may be a proxy, a correlated measurement, or a consequence of data collection patterns. For this reason, SHAP outputs should be presented as interpretability aids that support discussion and validation, not as ecological conclusions in themselves [66,67].
4.4. Implications for Ecosystem Management
The system’s most immediate implication is not automated conservation decision-making, but improved access to exploratory modeling. A park manager, analyst, or project partner can configure variables, run models, inspect predictions, and review explanatory outputs without directly operating the underlying code. This may accelerate hypothesis exploration, make modeling assumptions more visible, and support communication between technical and non-technical stakeholders.
The design philosophy of the system, positioning AI as a decision-support tool rather than an autonomous decision-maker, reflects a commitment to preserving human judgment and professional expertise while augmenting analytical capacity [63]. Human-in-the-loop safeguards (parameter confirmation prompts, transparency through SHAP feature importance, comprehensive audit trails) operationalize principles of responsible AI deployment in high-stakes environmental contexts [67,68].
In future operational settings, such a system could contribute to adaptive management by making use of private real-time sensor data, instead of relying on monthly aggregates or public datasets. The training module could also benefit from incorporating better tools to explore hyperparameter spaces, thus leading to better predictions. At the current maturity level, however, the prototype can be used for experimentation, model training, and methodological development.
4.5. Comparison with Existing Approaches
Compared with conventional modeling workflows, the proposed approach emphasizes configurability and accessibility. Rather than replacing established ecological models or specialized Environmental Decision Support Systems, the conversational layer can be understood as an access mechanism that helps users configure and operate modeling components. This distinction is important: the system does not claim to outperform domain-specific hydrological or ecological models. Its contribution lies in connecting configurable modeling, conversational interaction, database persistence, dashboard visualization, and explainability in one prototype.
Compared with broader DT literature [14,15], this work contributes a concrete conservation-oriented implementation pattern. It contributes to filling the gap in the implementation of DT focused on ecosystem conservation by demonstrating feasibility in a complex, multi-stressor ecosystem with heterogeneous data and high conservation stakes. The DT is not presented as a fully autonomous virtual replica of Doñana, but as a configurable data-driven modeling environment that can be updated, queried, and inspected, always keeping a human as a part of the process. This approach mitigates potential risks associated with automated decision-making in an area as sensitive as the protection of endangered species and natural areas of special importance.
4.6. Current Limitations
Several limitations remain. The prototype has been validated in a controlled setting and has not yet been tested as part of routine park-management workflows. Field trials (TRL-5/6) are necessary to assess performance under real circumstances. The user evaluation is also preliminary and should be expanded with a group of conservation practitioners.
Another limitation concerns the treatment of missing observations. The current prototype employs deterministic linear interpolation to generate complete time series for model training. Although appropriate for demonstrating the integrated workflow, this approach does not explicitly represent uncertainty associated with missing data and may underestimate the variability of ecological processes. Future work should evaluate multiple imputation approaches, such as MICE or Bayesian imputation methods, enabling uncertainty introduced during preprocessing to be propagated through model training and prediction intervals [49].
The DT engine is versatile and data-driven, but that also means it may capture correlations without representing real ecological mechanisms. It also forecasts single variables independently, ignoring cross-variable dependencies (e.g., how water level affects flamingo counts). Multivariable time-series models (e.g., Vector Autoregression, Neural ODEs) could capture these interactions [69,70]. Moreover, the models capture correlations but do not explicitly encode ecological processes (e.g., nutrient cycling, predator–prey dynamics). Hybrid models combining mechanistic equations with ML could improve interpretability and extrapolation [16,71].
The representative SHAP outputs demonstrate that explainability is fully integrated into the Digital Twin workflow. By providing both global and local explanations, the system enables users to understand how the trained predictive model generates its forecasts, thereby increasing transparency and supporting informed interpretation of model outputs.
The predictive experiments demonstrate the feasibility of integrating conversational AI with automated ecological modeling while identifying opportunities for further enhancing predictive performance. Future work will explore richer datasets, improved temporal feature engineering, and additional modeling approaches to extend the capabilities of the DT and support increasingly robust conservation decision-making.
4.7. Future Research Directions
Future work should address the following directions:
- Expanded predictive validation: Predictive experiments should be reproduced on selected conservation variables using richer and more complex datasets, together with additional predictive models (e.g., Poisson and Negative Binomial GLMs, LASSO, and Elastic Net). This would help identify the most suitable methods, variables, and data sources for improving predictive performance.
- Integration of remote sensing data: Incorporating satellite-derived data, such as Sentinel-2 vegetation indices or Sentinel-1 soil moisture indicators, could improve spatial resolution and predictive capacity [72,73]. Recent advances in geospatial AI could also support automated feature extraction from imagery [74].
- End-user validation and participatory design: Future work should include controlled user studies involving managers, conservation practitioners, ecologists, and policy stakeholders. In addition to measuring task completion and response quality, future evaluations should assess usability, trust, cognitive workload, perceived usefulness, and impacts on conservation decision-making using established human-computer interaction methodologies.
- Domain-aware conversational agent: The agent should be extended with domain-specific knowledge to improve its ability to guide users, interpret modeling outputs, and identify potential limitations in the results. Retrieval-Augmented Generation (RAG) could be used to incorporate technical documents, project documentation, ecological references, and operational guidelines into the agent’s responses.
- Controlled field deployment and long-term monitoring: Moving beyond TRL-4 will require deployment in a controlled operational setting within Doñana National Park. Longitudinal studies would be needed to assess how the system integrates into daily workflows, how users rely on its outputs over time, and whether it has measurable effects on decision-making processes or conservation outcomes [75].
It should be emphasized that improving predictive accuracy represents the principal research priority for future versions of the DT. The planned developments include richer temporal feature engineering, Bayesian hyperparameter optimisation, probabilistic forecasting, rolling-origin cross-validation, incorporation of remote sensing products, additional statistical models for count data, and uncertainty-aware prediction intervals. These improvements will enable a more rigorous evaluation of predictive performance while preserving the modular conversational architecture introduced in this work.
5. Conclusions
This paper presents a TRL-4 prototype that integrates a configurable DT core with a generative AI conversational interface for conservation-oriented modeling in Doñana National Park. The main contribution of this work is a practical architecture that makes ecological modeling workflows easier to configure, execute, inspect, and explain. Rather than requiring users to directly edit configuration files or operate machine learning scripts, the system allows them to interact with a structured modeling pipeline through natural language.
The prototype demonstrates several advances for conservation technology. First, it provides a modular, cloud-native framework based on AWS Fargate, Amazon RDS, Docker, and dashboard-based visualization, supporting reproducibility, scalability, and maintainability. Second, it connects conversational interaction with a structured YAML configuration, enabling users to select target variables, define explanatory variables, configure preprocessing options, launch model training, generate predictions, and review outputs through database-backed dashboards. Third, it incorporates traceability mechanisms that link predictions to input data, model identifiers, and configuration metadata. Fourth, it adds an interpretability layer through SHAP values, allowing users to examine which variables influence model behaviour and supporting a more transparent dialogue between data scientists and conservation practitioners.
These contributions are relevant because they address one of the persistent barriers to the adoption of predictive modeling in conservation: accessibility. The system does not replace ecological expertise, but it reduces the technical friction involved in configuring and exploring models. In doing so, it can help non-technical stakeholders engage more directly with data-driven analyses, compare modeling assumptions, inspect results, and participate in more informed discussions about conservation scenarios.
As we confront accelerating biodiversity loss and climate disruption, the urgency of equipping conservation practitioners with advanced analytical tools has never been greater. This study offers evidence that conversational DT can become valuable access infrastructure for conservation modeling. The Doñana prototype is a meaningful step toward making predictive and explainable modeling tools more transparent, configurable, and usable by the people who need them. By combining generative AI, cloud infrastructure, traceable machine learning workflows, dashboard visualization, and SHAP-based interpretability, the system provides a strong foundation for future decision-support tools that augment expert judgment rather than replace it. Looking ahead, the main challenge lies in ensuring that predictions remain relevant to specific problems and are integrated into existing conservation efforts. In this endeavor, every innovation must be guided by a singular imperative: serving the flourishing of life on Earth.
The explainability layer improves transparency of model behaviour but does not replace ecological interpretation or establish causal relationships within the ecosystem.
Overall, the proposed architecture demonstrates how conversational Generative Artificial Intelligence (GenAI) can substantially improve the accessibility of DT technologies for biodiversity conservation. Although additional validation using operational datasets and end-user evaluations remains necessary, the proposed framework establishes a scalable and explainable foundation for future conservation-oriented DT systems capable of supporting evidence-based environmental management.
Author Contributions
Conceptualization, E.S.-O. and E.W.-S.; methodology, A.C.-R., M.Á.G.-E. and P.V.-M.; software, I.D.G.-R. and A.C.-R.; validation, M.Á.G.-E. and P.V.-M.; writing-original draft preparation, A.C.-R. and E.S.-O. All authors have read and agreed to the published version of the manuscript.
Funding
This work has been carried out within the framework of the Spain Living Lab project (Grant Reference 1/1/2024-0412093852—SLLC16-01), funded by the Canarian Agency for Research, Innovation and the Information Society (ACIISI), Department of Universities, Science, Innovation and Culture of the Government of the Canary Islands, under the RETECH Programme, contributing to milestones 251, 252 and 253 of Component 16 of the Recovery, Transformation and Resilience Plan (PRTR), and co-funded by the European Union—Next Generation EU.
Data Availability Statement
The data and code supporting the findings of this study are available from the corresponding author (coordinacionit@canariaslivinglab.org) upon reasonable request.
Acknowledgments
The authors would like to thank Antonio Fernández Baldera for the valuable feedback and revisions provided during the preparation of this manuscript.
Conflicts of Interest
Authors Pablo Vicente-Martínez, Adrián Chust-Ros and Ismerai David Gutiérrez-Rodríguez were employed by the company SPV Scala. The remaining authors declare that the research was conducted in the absence of any commercial or financial relationships that could be construed as a potential conflict of interest.
Appendix A. System Prompt and Configuration
Appendix A.1. Configuration Agent System Prompt
The following appendix presents the operational instructions used to guide the functional behavior of the dialogue system. These instructions define the agent’s persona, authorized operations, and procedural constraints, thereby ensuring coherent and systematic performance across the integrated framework. The original prompt was written in Spanish and has been translated to facilitate comprehension.
| Listing A1. Agent System Prompt. |
 |
Appendix A.2. Default Configuration File
The following file template illustrates the default values of the parameters to configure the simulations. This specification establishes the number of agents simulated, the opening hours of the points of interest and other relevant parameters.
| Listing A2. Digital twin core configuration file. |
 |
References
- IPBES. Global Assessment Report on Biodiversity and Ecosystem Services; IPBES Secretariat: Bonn, Germany, 2019. [Google Scholar] [CrossRef]
- Steffen, W.; Richardson, K.; Rockström, J.; Schellnhuber, H.J.; Dube, O.P.; Dutreuil, S.; Lenton, T.M.; Lubchenco, J. The emergence and evolution of Earth System Science. Nat. Rev. Earth Environ. 2020, 1, 54–63. [Google Scholar] [CrossRef] [Scilit]
- Jetz, W.; McGeoch, M.A.; Guralnick, R.; Ferrier, S.; Beck, J.; Costello, M.J.; Fernandez, M.; Geller, G.N.; Keil, P.; Merow, C.; et al. Essential biodiversity variables for mapping and monitoring species populations. Nat. Ecol. Evol. 2019, 3, 539–551. [Google Scholar] [CrossRef] [Scilit]
- González-García, A.; Palomo, I.; González, J.A.; García-Nieto, A.P.; Montes, C.; Martín-López, B. Quantifying spatial supply-demand mismatches in ecosystem services provides insights for land-use planning. Land Use Policy 2020, 94, 104493. [Google Scholar] [CrossRef] [Scilit]
- Rendón, M.A.; Green, A.J.; Aguilera, E.; Almaraz, P. Status, distribution and long-term changes in the waterbird community wintering in Doñana, south-west Spain. Biol. Conserv. 2008, 141, 1371–1388. [Google Scholar] [CrossRef] [Scilit]
- Green, A.J.; Alcorlo, P.; Peeters, E.T.; Morris, E.P.; Espinar, J.L.; Bravo-Utrera, M.A.; Bustamante, J.; Díaz-Delgado, R.; Koelmans, A.A.; Mateo, R.; et al. Creating a safe operating space for wetlands in a changing climate. Front. Ecol. Environ. 2017, 15, 99–107. [Google Scholar] [CrossRef] [Scilit]
- Cabin, R.J. Intelligent Tinkering: Bridging the Gap Between Science and Practice; Island Press: Washington, DC, USA, 2018. [Google Scholar]
- Pennekamp, F.; Iles, A.C.; Garland, J.; Brennan, G.; Brose, U.; Gaedke, U.; Jacob, U.; Kratina, P.; Matthews, B.; Momo, F.; et al. The intrinsic predictability of ecological time series and its potential to guide forecasting. Ecol. Monogr. 2019, 89, e01359. [Google Scholar] [CrossRef] [Scilit]
- Mouquet, N.; Lagadeuc, Y.; Devictor, V.; Doyen, L.; Duputié, A.; Eveillard, D.; Faure, D.; Garnier, E.; Gimenez, O.; Huneman, P.; et al. Predictive ecology in a changing world. J. Appl. Ecol. 2015, 52, 1293–1310. [Google Scholar] [CrossRef] [Scilit]
- Addison, P.F.E.; Rumpff, L.; Bau, S.S.; Carey, J.M.; Chee, Y.E.; Jarrad, F.C.; McBride, M.F.; Burgman, M.A. Practical solutions for making models indispensable in conservation decision-making. Divers. Distrib. 2013, 19, 490–502. [Google Scholar] [CrossRef] [Scilit]
- Rose, D.C.; Sutherland, W.J.; Amano, T.; González-Varo, J.P.; Robertson, R.J.; Simmons, B.I.; Wauchope, H.S.; Kovacs, E.; Durán, A.P.; Vadrot, A.B.; et al. The major barriers to evidence-informed conservation policy and possible solutions. Conserv. Lett. 2018, 11, e12564. [Google Scholar] [CrossRef] [Scilit]
- Grieves, M.; Vickers, J. Digital Twin: Mitigating Unpredictable, Undesirable Emergent Behavior in Complex Systems. In Transdisciplinary Perspectives on Complex Systems; Kahlen, F.J., Flumerfelt, S., Alves, A., Eds.; Springer: Cham, Switzerland, 2016; pp. 85–113. [Google Scholar] [CrossRef] [Scilit]
- Batty, M. Digital twins. Environ. Plan. B Urban Anal. City Sci. 2018, 45, 817–820. [Google Scholar] [CrossRef] [Scilit]
- VanDerHorn, E.; Mahadevan, S. Digital Twin: Generalization, characterization and implementation. Decis. Support Syst. 2021, 145, 113524. [Google Scholar] [CrossRef] [Scilit]
- Jebbor, I.; Benmamoun, Z.; Hachimi, H. Leveraging digital twins and metaverse technologies for sustainable circular operations: A comprehensive literature review. Circ. Econ. Sustain. 2025, 5, 5795–5848. [Google Scholar] [CrossRef] [Scilit]
- Reichstein, M.; Camps-Valls, G.; Stevens, B.; Jung, M.; Denzler, J.; Carvalhais, N.; Prabhat. Deep learning and process understanding for data-driven Earth system science. Nature 2019, 566, 195–204. [Google Scholar] [CrossRef] [Scilit]
- Willard, J.; Jia, X.; Xu, S.; Steinbach, M.; Kumar, V. Integrating scientific knowledge with machine learning for engineering and environmental systems. ACM Comput. Surv. 2022, 55, 1–37. [Google Scholar] [CrossRef] [Scilit]
- Moriasi, D.N.; Gitau, M.W.; Pai, N.; Daggupati, P. Hydrologic and water quality models: Performance measures and evaluation criteria. Trans. ASABE 2015, 58, 1763–1785. [Google Scholar] [CrossRef] [Scilit]
- Harris, D.J.; Taylor, S.D.; White, E.P. Forecasting biodiversity in breeding birds using best practices. PeerJ 2018, 6, e4278. [Google Scholar] [CrossRef] [Scilit]
- Christin, S.; Hervet, É.; Lecomte, N. Applications for deep learning in ecology. Methods Ecol. Evol. 2019, 10, 1632–1644. [Google Scholar] [CrossRef] [Scilit]
- Thakur, M.P.; van der Putten, W.H.; Wilschut, R.A.; Veen, G.F.; Kardol, P.; van Ruijven, J.; Allan, E.; Roscher, C.; van Kleunen, M.; Bezemer, T.M. Plant-soil feedbacks and temporal dynamics of plant diversity-productivity relationships. Trends Ecol. Evol. 2021, 36, 651–661. [Google Scholar] [CrossRef] [Scilit]
- Valavi, R.; Guillera-Arroita, G.; Lahoz-Monfort, J.J.; Elith, J. Predictive performance of presence-only species distribution models: A benchmark study with reproducible code. Ecol. Monogr. 2022, 92, e01486. [Google Scholar] [CrossRef] [Scilit]
- Ward, E.J.; Holmes, E.E.; Thorson, J.T.; Collen, B. Complexity is costly: A meta-analysis of parametric and non-parametric methods for short-term population forecasting. Oikos 2014, 123, 652–661. [Google Scholar] [CrossRef] [Scilit]
- Bellard, C.; Bertelsmeier, C.; Leadley, P.; Thuiller, W.; Courchamp, F. Impacts of climate change on the future of biodiversity. Ecol. Lett. 2012, 15, 365–377. [Google Scholar] [CrossRef] [Scilit]
- Cutler, D.R.; Edwards, T.C., Jr.; Beard, K.H.; Cutler, A.; Hess, K.T.; Gibson, J.; Lawler, J.J. Random forests for classification in ecology. Ecology 2007, 88, 2783–2792. [Google Scholar] [CrossRef] [Scilit]
- Mi, C.; Huettmann, F.; Guo, Y.; Han, X.; Wen, L. Why choose Random Forest to predict rare species distribution with few samples in large undersampled areas? Three Asian crane species models provide supporting evidence. PeerJ 2017, 5, e2849. [Google Scholar] [CrossRef] [Scilit]
- Pullin, A.S.; Knight, T.M. Doing more good than harm—Building an evidence-base for conservation and environmental management. Biol. Conserv. 2009, 142, 931–934. [Google Scholar] [CrossRef] [Scilit]
- Cook, C.N.; Possingham, H.P.; Fuller, R.A. Contribution of systematic reviews to management decisions. Conserv. Biol. 2013, 27, 902–915. [Google Scholar] [CrossRef] [Scilit]
- Cook, C.N.; Mascia, M.B.; Schwartz, M.W.; Possingham, H.P.; Fuller, R.A. Achieving conservation science that bridges the knowledge-action boundary. Conserv. Biol. 2013, 27, 669–678. [Google Scholar] [CrossRef] [Scilit]
- Vaswani, A.; Shazeer, N.; Parmar, N.; Uszkoreit, J.; Jones, L.; Gomez, A.N.; Kaiser, Ł.; Polosukhin, I. Attention is all you need. In Advances in Neural Information Processing Systems 30; Curran Associates, Inc.: Red Hook, NY, USA, 2017; pp. 5998–6008. [Google Scholar]
- Brown, T.B.; Mann, B.; Ryder, N.; Subbiah, M.; Kaplan, J.; Dhariwal, P.; Neelakantan, A.; Shyam, P.; Sastry, G.; Askell, A.; et al. Language models are few-shot learners. In Advances in Neural Information Processing Systems 33; Curran Associates, Inc.: Red Hook, NY, USA, 2020; pp. 1877–1901. [Google Scholar]
- Devlin, J.; Chang, M.W.; Lee, K.; Toutanova, K. BERT: Pre-training of deep bidirectional transformers for language understanding. In Proceedings of the 2019 Conference of the North American Chapter of the Association for Computational Linguistics: Human Language Technologies; Association for Computational Linguistics: Minneapolis, MN, USA, 2019; Volume 1, pp. 4171–4186. [Google Scholar] [CrossRef] [Scilit]
- Raffel, C.; Shazeer, N.; Roberts, A.; Lee, K.; Narang, S.; Matena, M.; Zhou, Y.; Li, W.; Liu, P.J. Exploring the limits of transfer learning with a unified text-to-text transformer. J. Mach. Learn. Res. 2020, 21, 1–67. [Google Scholar]
- Toderas, M. Artificial Intelligence for Sustainability: A Systematic Review and Critical Analysis of AI Applications, Challenges, and Future Directions. Sustainability 2025, 17, 8049. [Google Scholar] [CrossRef] [Scilit]
- Liu, P.; Yuan, W.; Fu, J.; Jiang, Z.; Hayashi, H.; Neubig, G. Pre-train, prompt, and predict: A systematic survey of prompting methods in natural language processing. ACM Comput. Surv. 2023, 55, 1–35. [Google Scholar] [CrossRef] [Scilit]
- Kasneci, E.; Seßler, K.; Küchemann, S.; Bannert, M.; Dementieva, D.; Fischer, F.; Gasser, U.; Groh, G.; Günnemann, S.; Hüllermeier, E.; et al. ChatGPT for good? On opportunities and challenges of large language models for education. Learn. Individ. Differ. 2023, 103, 102274. [Google Scholar] [CrossRef] [Scilit]
- Laniak, G.F.; Olchin, G.; Goodall, J.; Voinov, A.; Hill, M.; Glynn, P.; Whelan, G.; Geller, G.; Quinn, N.; Blind, M.; et al. Integrated environmental modeling: A vision and roadmap for the future. Environ. Model. Softw. 2013, 39, 3–23. [Google Scholar] [CrossRef] [Scilit]
- McIntosh, B.S.; Ascough, J.C.; Twery, M.; Chew, J.; Elmahdi, A.; Haase, D.; Harou, J.J.; Hepting, D.; Cuddy, S.; Jakeman, A.J.; et al. Environmental decision support systems (EDSS) development - Challenges and best practices. Environ. Model. Softw. 2011, 26, 1389–1402. [Google Scholar] [CrossRef] [Scilit]
- Matthies, M.; Giupponi, C.; Ostendorf, B. Environmental decision support systems: Current issues, methods and tools. Environ. Model. Softw. 2007, 22, 123–127. [Google Scholar] [CrossRef] [Scilit]
- Rodríguez-Caro, R.C.; Graciá, E.; Anadón, J.D.; Giménez, A. Maintained effects of fire on individual growth and survival rates in a spur-thighed tortoise population. Eur. J. Wildl. Res. 2013, 59, 911–913. [Google Scholar] [CrossRef] [Scilit]
- Camacho, C.; Negro, J.J.; Elmberg, J.; Fox, A.D.; Nagy, S.; Pain, D.J.; Green, A.J. Groundwater extraction poses extreme threat to Doñana World Heritage Site. Nat. Ecol. Evol. 2022, 6, 654–655. [Google Scholar] [CrossRef] [Scilit]
- Liu, Y.; Tang, Q.; Liu, X.; Wang, G.; Zhang, X.; Leng, G. Recent decrease in summer precipitation over the Iberian Peninsula closely linked to the weakening of local moisture recycling. Hydrol. Earth Syst. Sci. 2022, 26, 1925–1936. [Google Scholar] [CrossRef] [Scilit]
- Newman, S. Building Microservices: Designing Fine-Grained Systems; O’Reilly Media: Sebastopol, CA, USA, 2015. [Google Scholar]
- Agencia Estatal de Meteorología (AEMET). Climate Data Portal. Available online: Https://www.aemet.es/en/datosabiertos (accessed on 15 December 2025).
- ICTS-RBD. Hydromet: Hydrometeorological Data; Singular Scientific and Technical Infrastructure—Doñana Biological Reserve: Seville, Spain, 2026; Available online: https://datos-automaticos.icts-donana.es/en/ (accessed on 14 May 2026).
- ICTS-DOÑANA. Online Database: Aerial Waterbird Census in the Guadalquivir River Marshes; Doñana Biological Station (EBD-CSIC): Seville, Spain, 2026; Available online: https://censos-aereos.icts-donana.es/ (accessed on 14 May 2026).
- Santoro, S.; Green, A.J.; Figuerola, J. Immigration enhances fast growth of a newly established source population. Ecology 2016, 97, 1048–1067. [Google Scholar] [CrossRef]
- Instituto Nacional de Estadística (INE). Base de Datos de Indicadores Urbanos; INE: Madrid, Spain, 2026. Available online: https://www.ine.es/dyngs/DAB/index.htm?cid=1100 (accessed on 15 May 2026).
- Little, R.; Rubin, D. Statistical Analysis with Missing Data, 3rd ed.; John Wiley and Sons: Hoboken, NJ, USA, 2019. [Google Scholar] [CrossRef] [Scilit]
- PostgreSQL Global Development Group. PostgreSQL 15 Documentation. Available online: https://www.postgresql.org/docs/15/ (accessed on 15 December 2025).
- Hyndman, R.J.; Athanasopoulos, G. Forecasting: Principles and Practice, 3rd ed.; OTexts: Melbourne, Australia, 2018; Available online: Https://otexts.com/fpp3/ (accessed on 15 December 2025).
- James, G.; Witten, D.; Hastie, T.; Tibshirani, R. An Introduction to Statistical Learning with Applications in R; Springer: New York, NY, USA, 2013. [Google Scholar] [CrossRef] [Scilit]
- Breiman, L.; Friedman, J.H.; Olshen, R.A.; Stone, C.J. Classification and Regression Trees; Wadsworth International Group: Belmont, CA, USA, 1984. [Google Scholar]
- Breiman, L. Random forests. Mach. Learn. 2001, 45, 5–32. [Google Scholar] [CrossRef] [Scilit]
- Chen, T.; Guestrin, C. XGBoost: A scalable tree boosting system. In Proceedings of the 22nd ACM SIGKDD International Conference on Knowledge Discovery and Data Mining, San Francisco, CA, USA, 13–17 August 2016; pp. 785–794. [Google Scholar]
- Box, G.E.P.; Jenkins, G.M. Time Series Analysis: Forecasting and Control; Holden-Day: San Francisco, CA, USA, 1970. [Google Scholar]
- Bergmeir, C.; Benítez, J.M. On the use of cross-validation for time series predictor evaluation. Inf. Sci. 2012, 191, 192–213. [Google Scholar] [CrossRef] [Scilit]
- Tashman, L.J. Out-of-sample tests of forecasting accuracy: An analysis and review. Int. J. Forecast. 2000, 16, 437–450. [Google Scholar] [CrossRef] [Scilit]
- Gemini Team; Anil, R.; Borgeaud, S.; Alayrac, J.-B.; Yu, J.; Soricut, R.; Schalkwyk, J.; Dai, A.M.; Hauth, A.; Millican, K.; et al. Gemini: A Family of Highly Capable Multimodal Models. arXiv 2024, arXiv:2312.11805. [Google Scholar] [CrossRef] [Scilit]
- Google Cloud. Vertex AI Documentation. Available online: https://docs.cloud.google.com/vertex-ai/docs (accessed on 15 May 2026).
- Chainlit Development Team. Chainlit: Build Production-Ready Conversational AI. Available online: Https://docs.chainlit.io/ (accessed on 20 December 2025).
- Schick, T.; Dwivedi-Yu, J.; Dessì, R.; Raileanu, R.; Lomeli, M.; Zettlemoyer, L.; Cancedda, N.; Scialom, T. Toolformer: Language models can teach themselves to use tools. arXiv 2023, arXiv:2302.04761. [Google Scholar]
- Amershi, S.; Weld, D.; Vorvoreanu, M.; Fourney, A.; Nushi, B.; Collisson, P.; Suh, J.; Iqbal, S.; Bennett, P.N.; Inkpen, K.; et al. Guidelines for human-AI interaction. In Proceedings of the 2019 CHI Conference on Human Factors in Computing Systems, Glasgow, UK, 4–9 May 2019; pp. 1–13. [Google Scholar] [CrossRef] [Scilit]
- Microsoft Corporation. Power BI Documentation. Available online: Https://docs.microsoft.com/en-us/power-bi/ (accessed on 20 December 2025).
- Mankins, J.C. Technology Readiness Levels: A White Paper; Advanced Concepts Office, Office of Space Access and Technology, NASA: Washington, DC, USA, 1995. Available online: http://www.artemisinnovation.com/images/TRL_White_Paper_2004-Edited.pdf (accessed on 15 May 2026).
- Lundberg, S.M.; Lee, S.I. A unified approach to interpreting model predictions. In Advances in Neural Information Processing Systems 30; Curran Associates, Inc.: Red Hook, NY, USA, 2017; pp. 4765–4774. [Google Scholar]
- Arrieta, A.B.; Díaz-Rodríguez, N.; Del Ser, J.; Bennetot, A.; Tabik, S.; Barbado, A.; García, S.; Gil-López, S.; Molina, D.; Benjamins, R.; et al. Explainable Artificial Intelligence (XAI): Concepts, taxonomies, opportunities and challenges toward responsible AI. Inf. Fusion 2020, 58, 82–115. [Google Scholar] [CrossRef] [Scilit]
- Saltelli, A.; Bammer, G.; Bruno, I.; Charters, E.; Di Fiore, M.; Didier, E.; Nelson Espeland, W.; Kay, J.; Lo Piano, S.; Mayo, D.; et al. Five ways to ensure that models serve society: A manifesto. Nature 2020, 582, 482–484. [Google Scholar] [CrossRef] [Scilit]
- Lütkepohl, H. New Introduction to Multiple Time Series Analysis; Springer: Berlin, Germany, 2005. [Google Scholar] [CrossRef]
- Chen, R.T.Q.; Rubanova, Y.; Bettencourt, J.; Duvenaud, D. Neural ordinary differential equations. In Advances in Neural Information Processing Systems 31; Curran Associates, Inc.: Red Hook, NY, USA, 2018; pp. 6571–6583. [Google Scholar]
- Karpatne, A.; Atluri, G.; Faghmous, J.H.; Steinbach, M.; Banerjee, A.; Ganguly, A.; Shekhar, S.; Samatova, N.; Kumar, V. Theory-guided data science: A new paradigm for scientific discovery from data. IEEE Trans. Knowl. Data Eng. 2017, 29, 2318–2331. [Google Scholar] [CrossRef] [Scilit]
- Turner, W.; Rondinini, C.; Pettorelli, N.; Mora, B.; Leidner, A.K.; Szantoi, Z.; Buchanan, G.; Dech, S.; Dwyer, J.; Herold, M.; et al. Free and open-access satellite data are key to biodiversity conservation. Biol. Conserv. 2015, 182, 173–176. [Google Scholar] [CrossRef] [Scilit]
- Pettorelli, N.; Schulte To Bühne, H.; Tulloch, A.; Dubois, G.; Macinnis-Ng, C.; Queirós, A.M.; Keith, D.A.; Wegmann, M.; Schrodt, F.; Stellmes, M.; et al. Satellite remote sensing of ecosystem functions: Opportunities, challenges and way forward. Remote Sens. Ecol. Conserv. 2018, 4, 71–93. [Google Scholar] [CrossRef] [Scilit]
- Zhu, X.X.; Tuia, D.; Mou, L.; Xia, G.S.; Zhang, L.; Xu, F.; Fraundorfer, F. Deep learning in remote sensing: A comprehensive review and list of resources. IEEE Geosci. Remote Sens. Mag. 2017, 5, 8–36. [Google Scholar] [CrossRef] [Scilit]
- Stem, C.; Margoluis, R.; Salafsky, N.; Brown, M. Monitoring and evaluation in conservation: A review of trends and approaches. Conserv. Biol. 2005, 19, 295–309. [Google Scholar] [CrossRef] [Scilit]
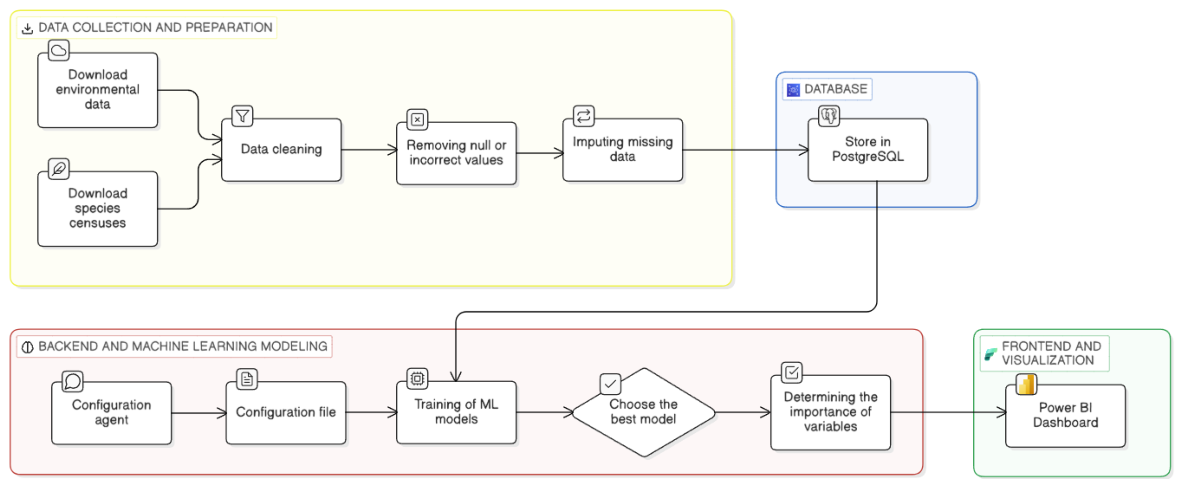
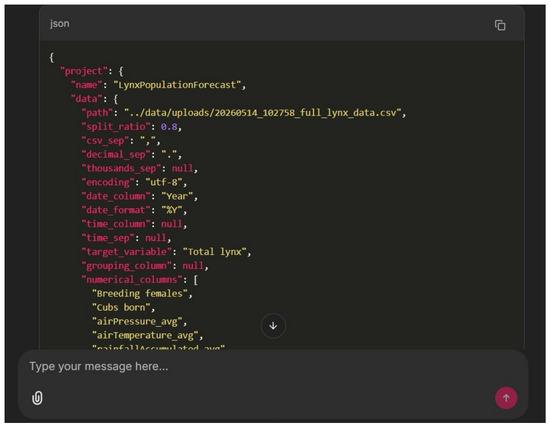
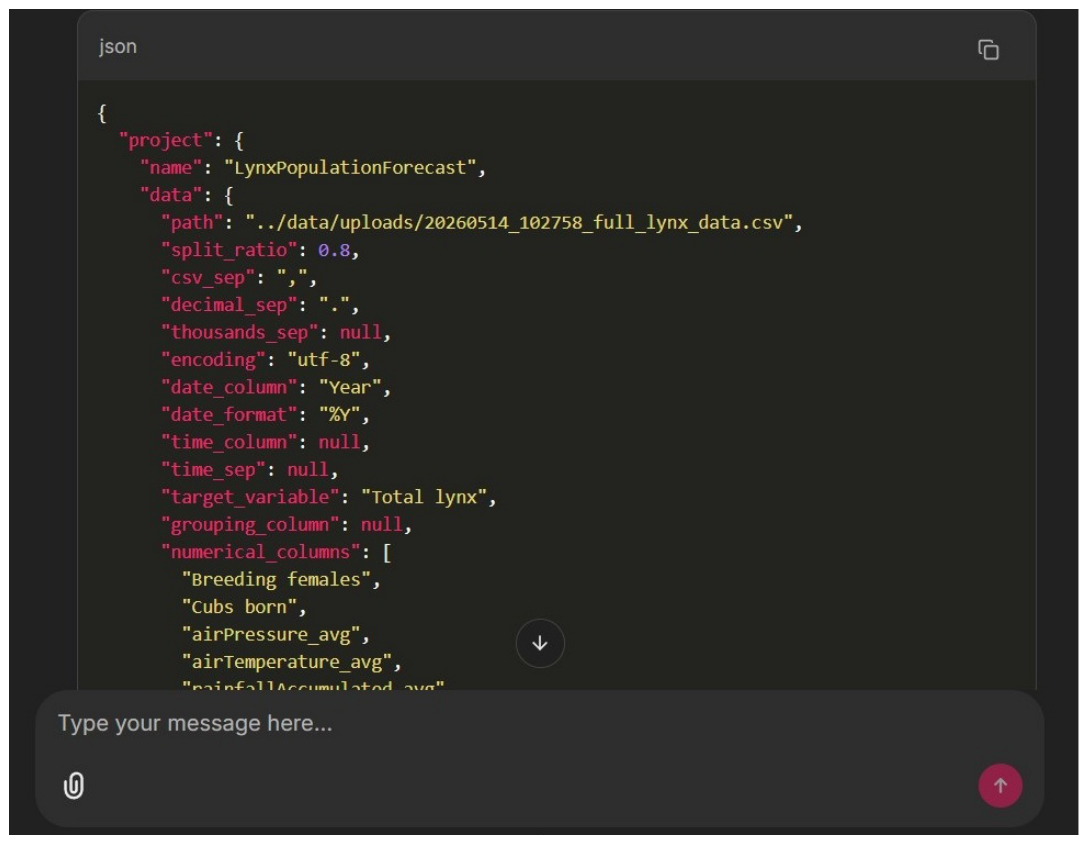
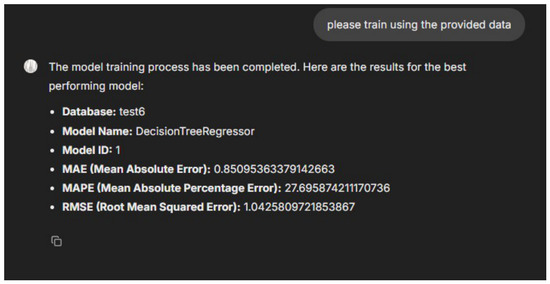
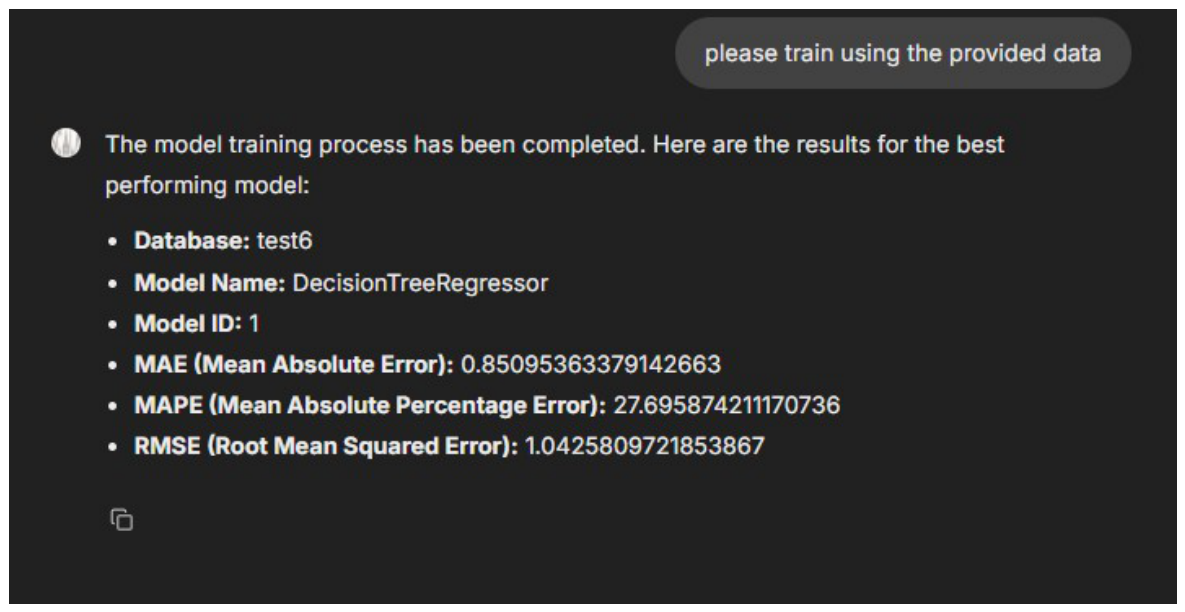
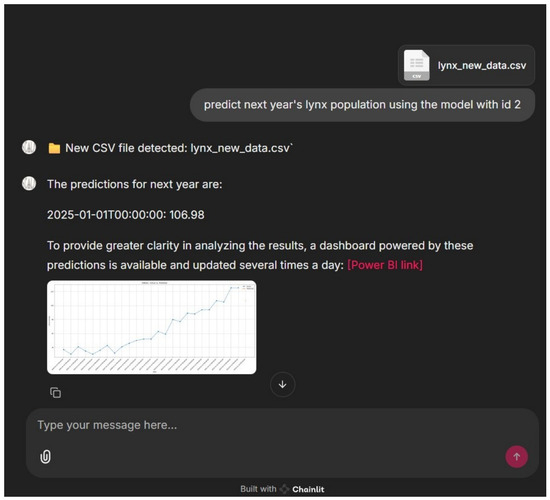
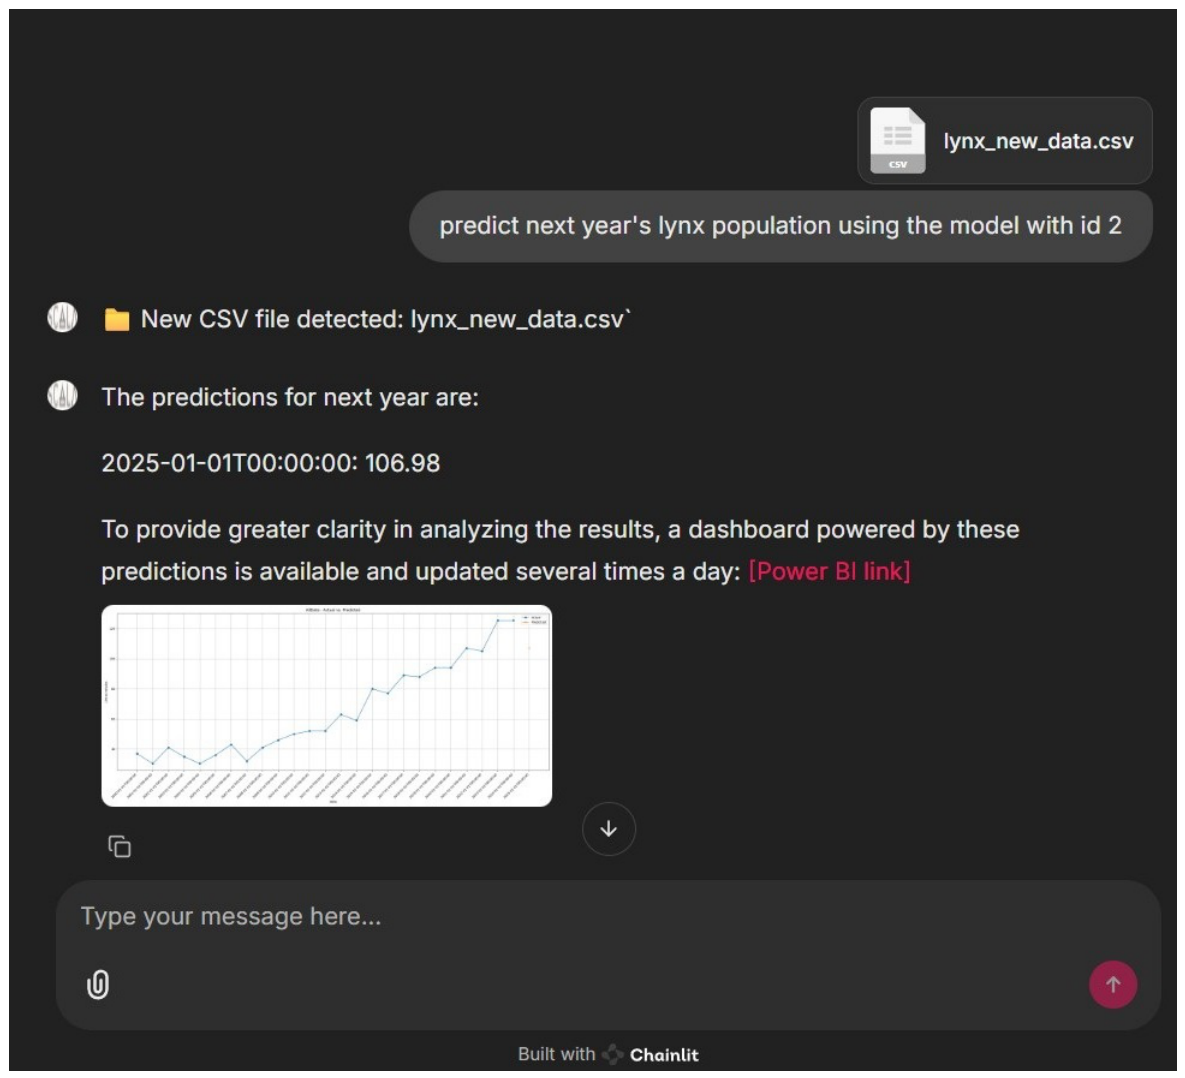
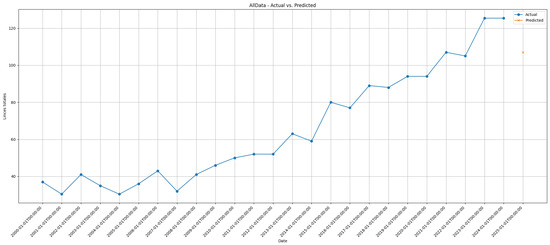
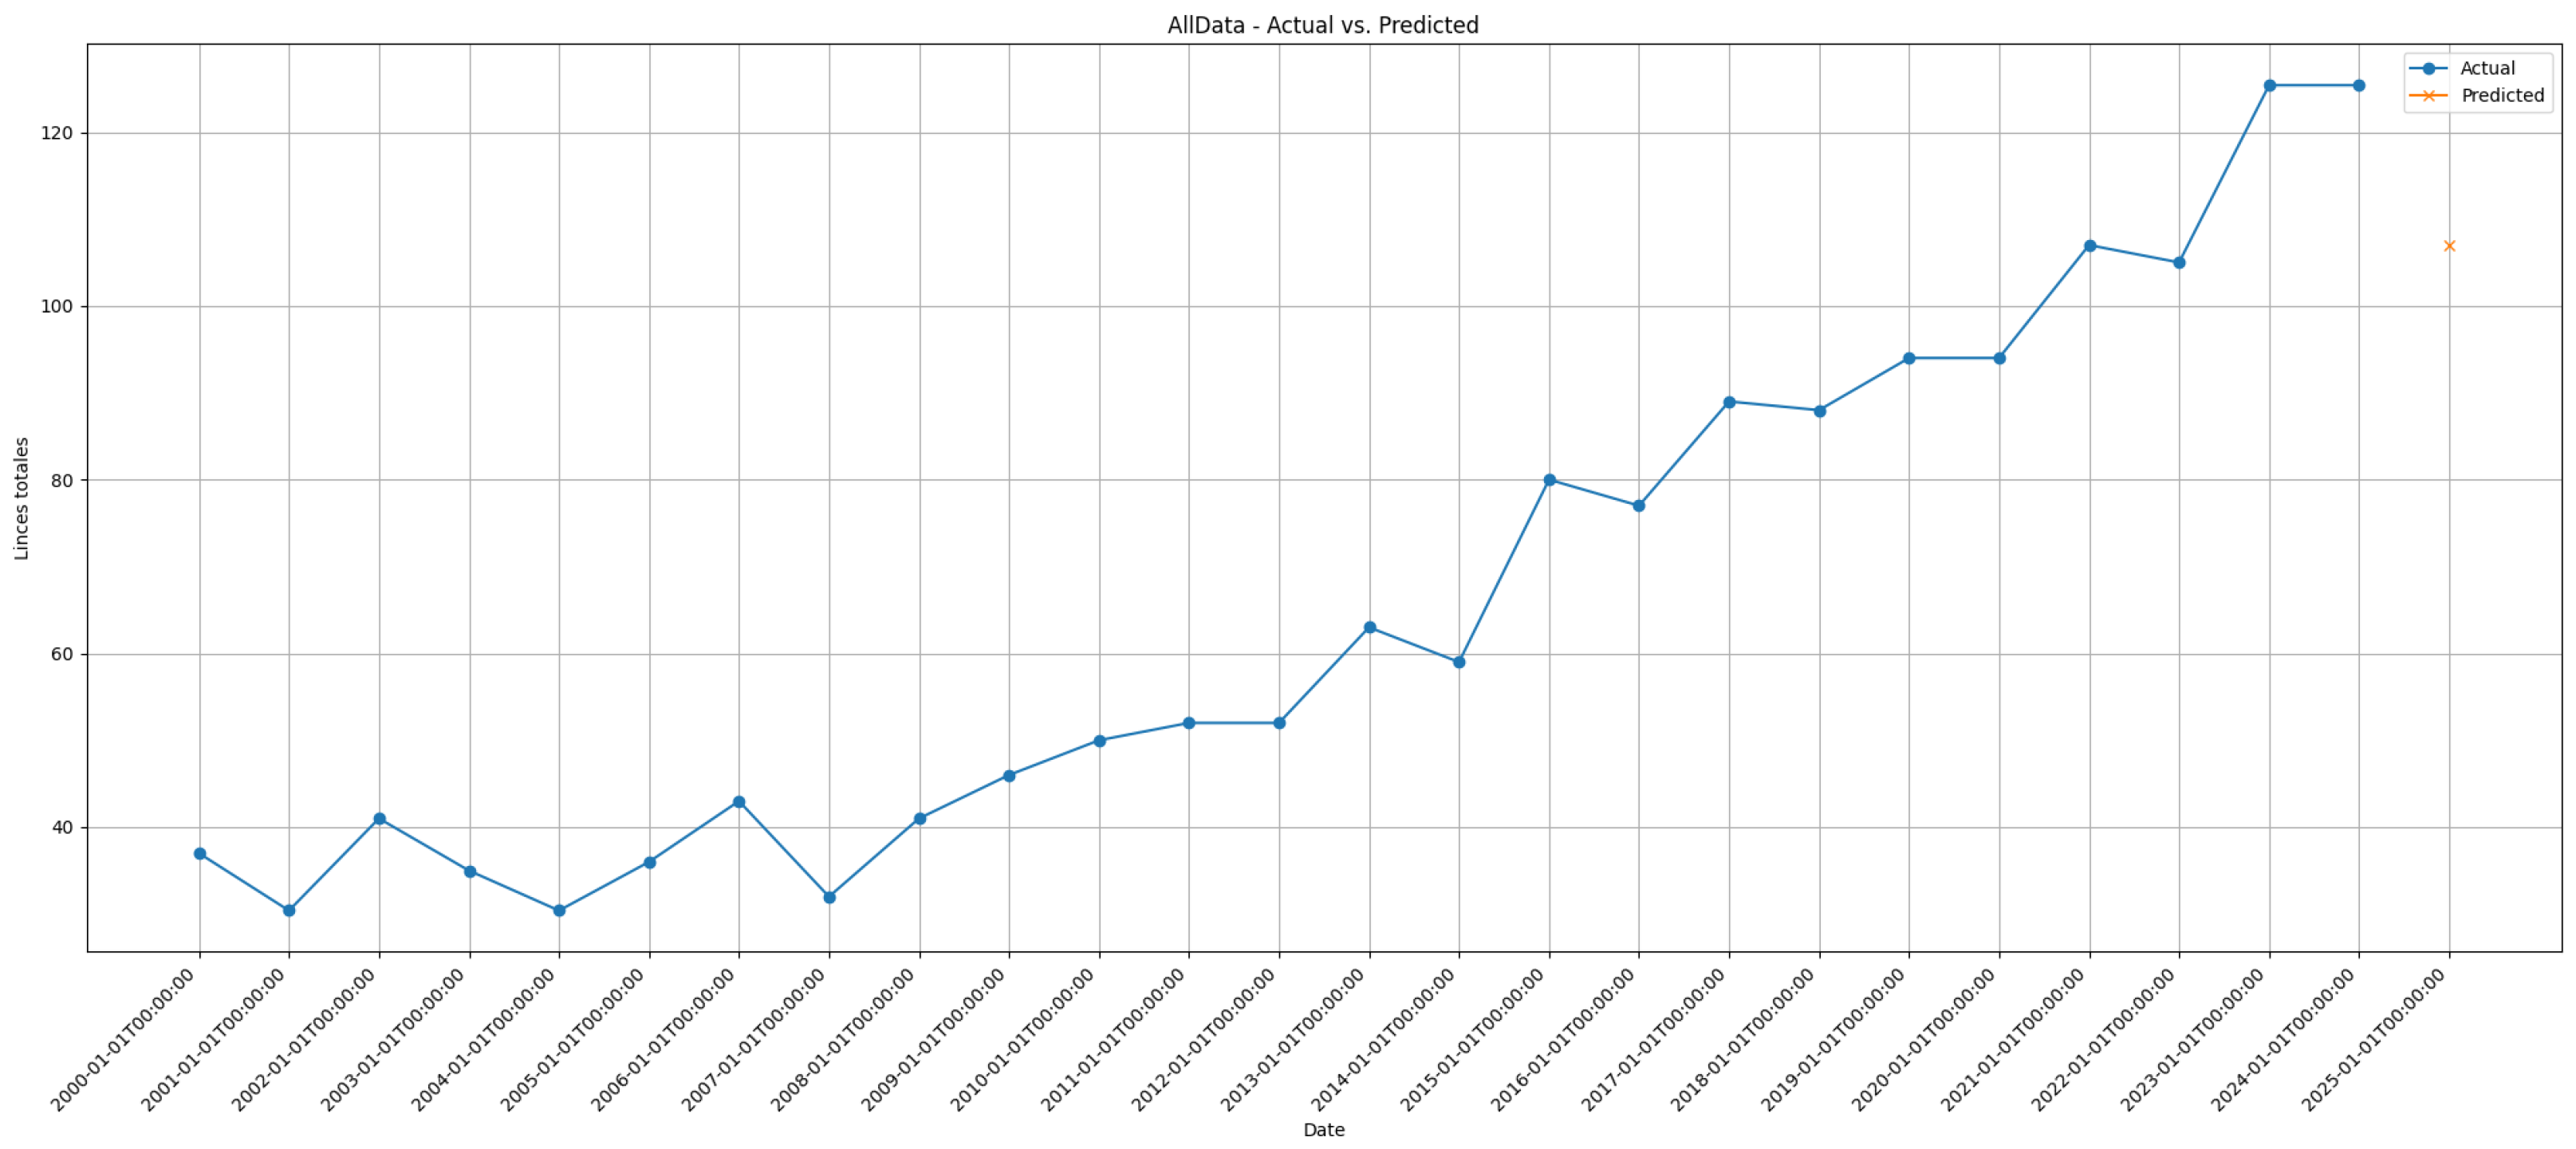
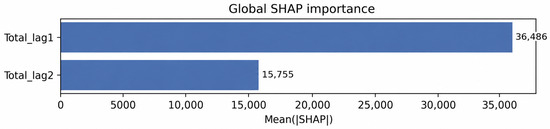
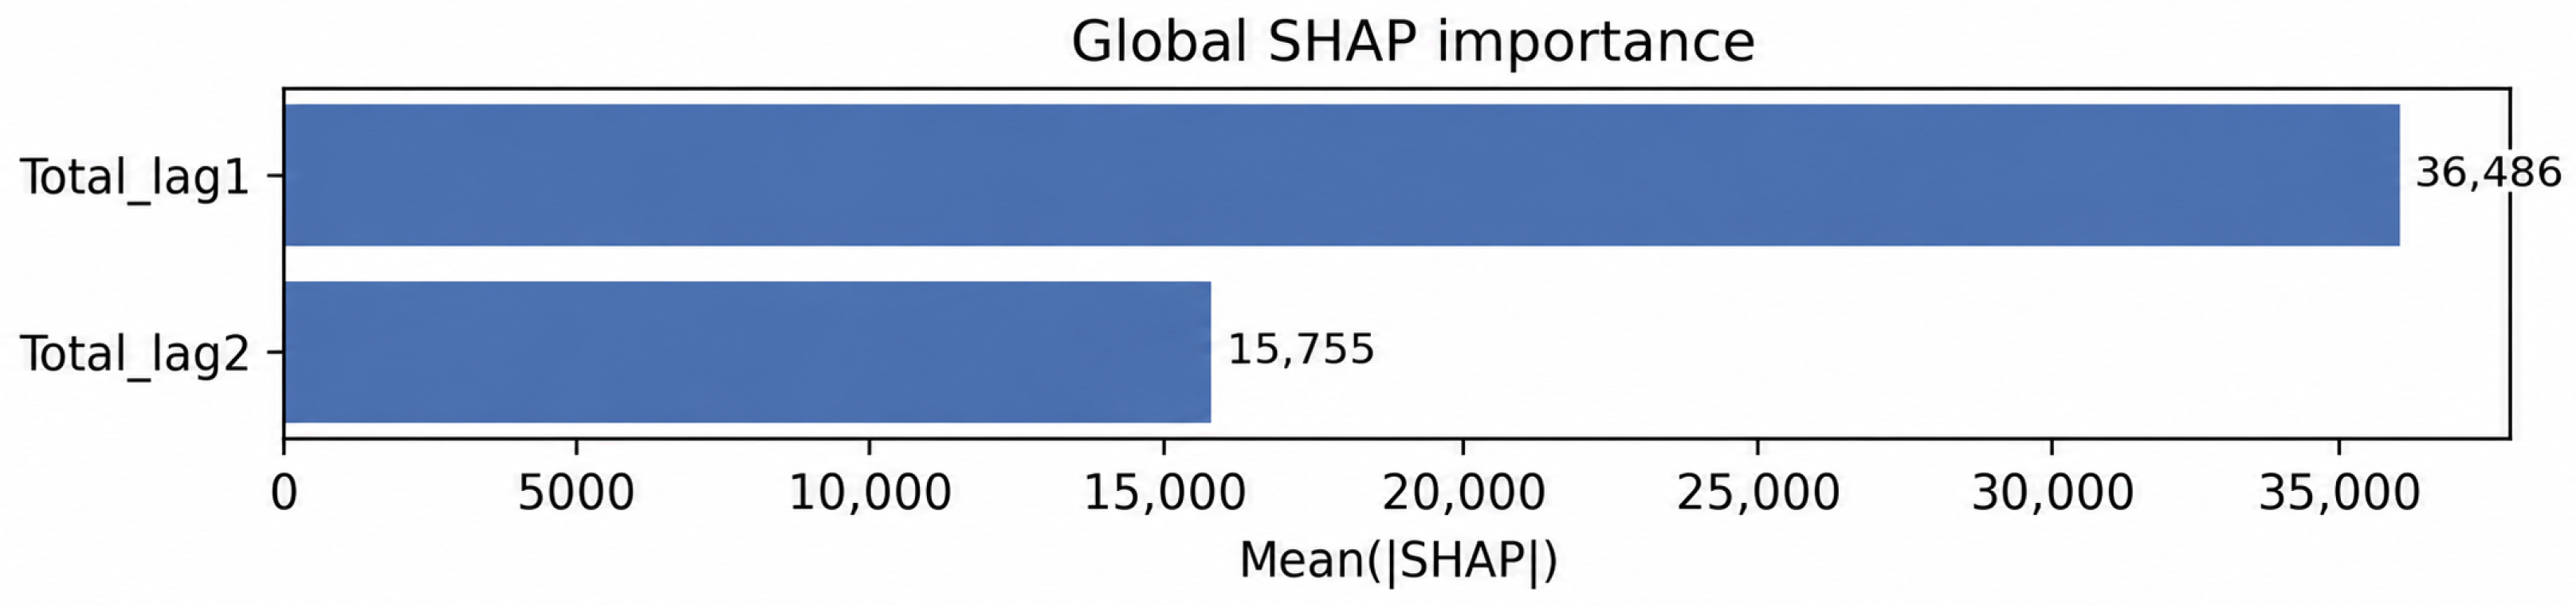
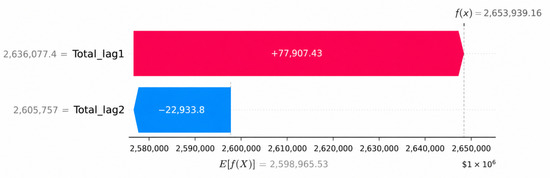
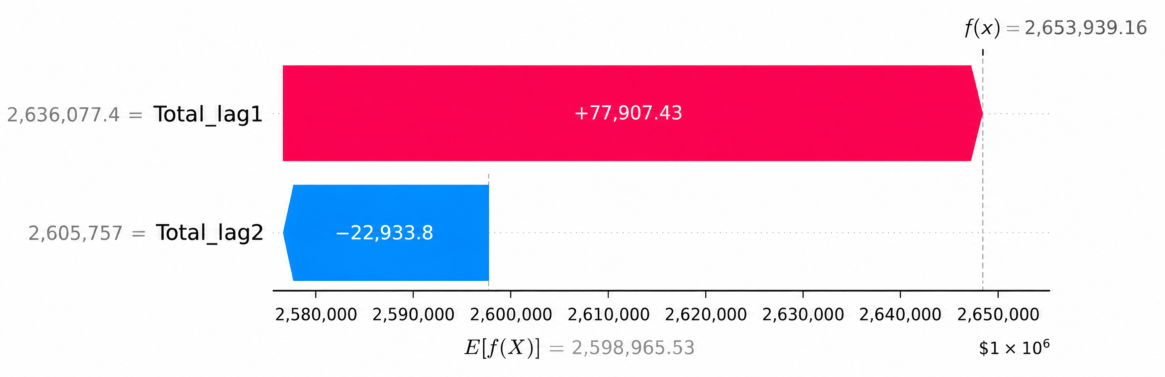
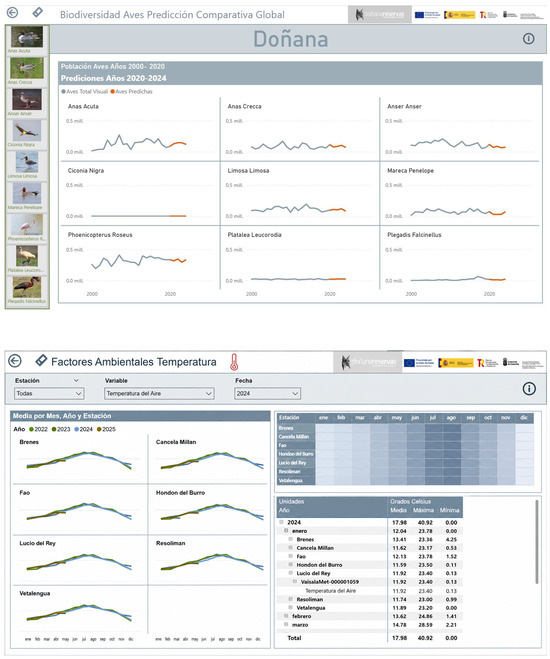
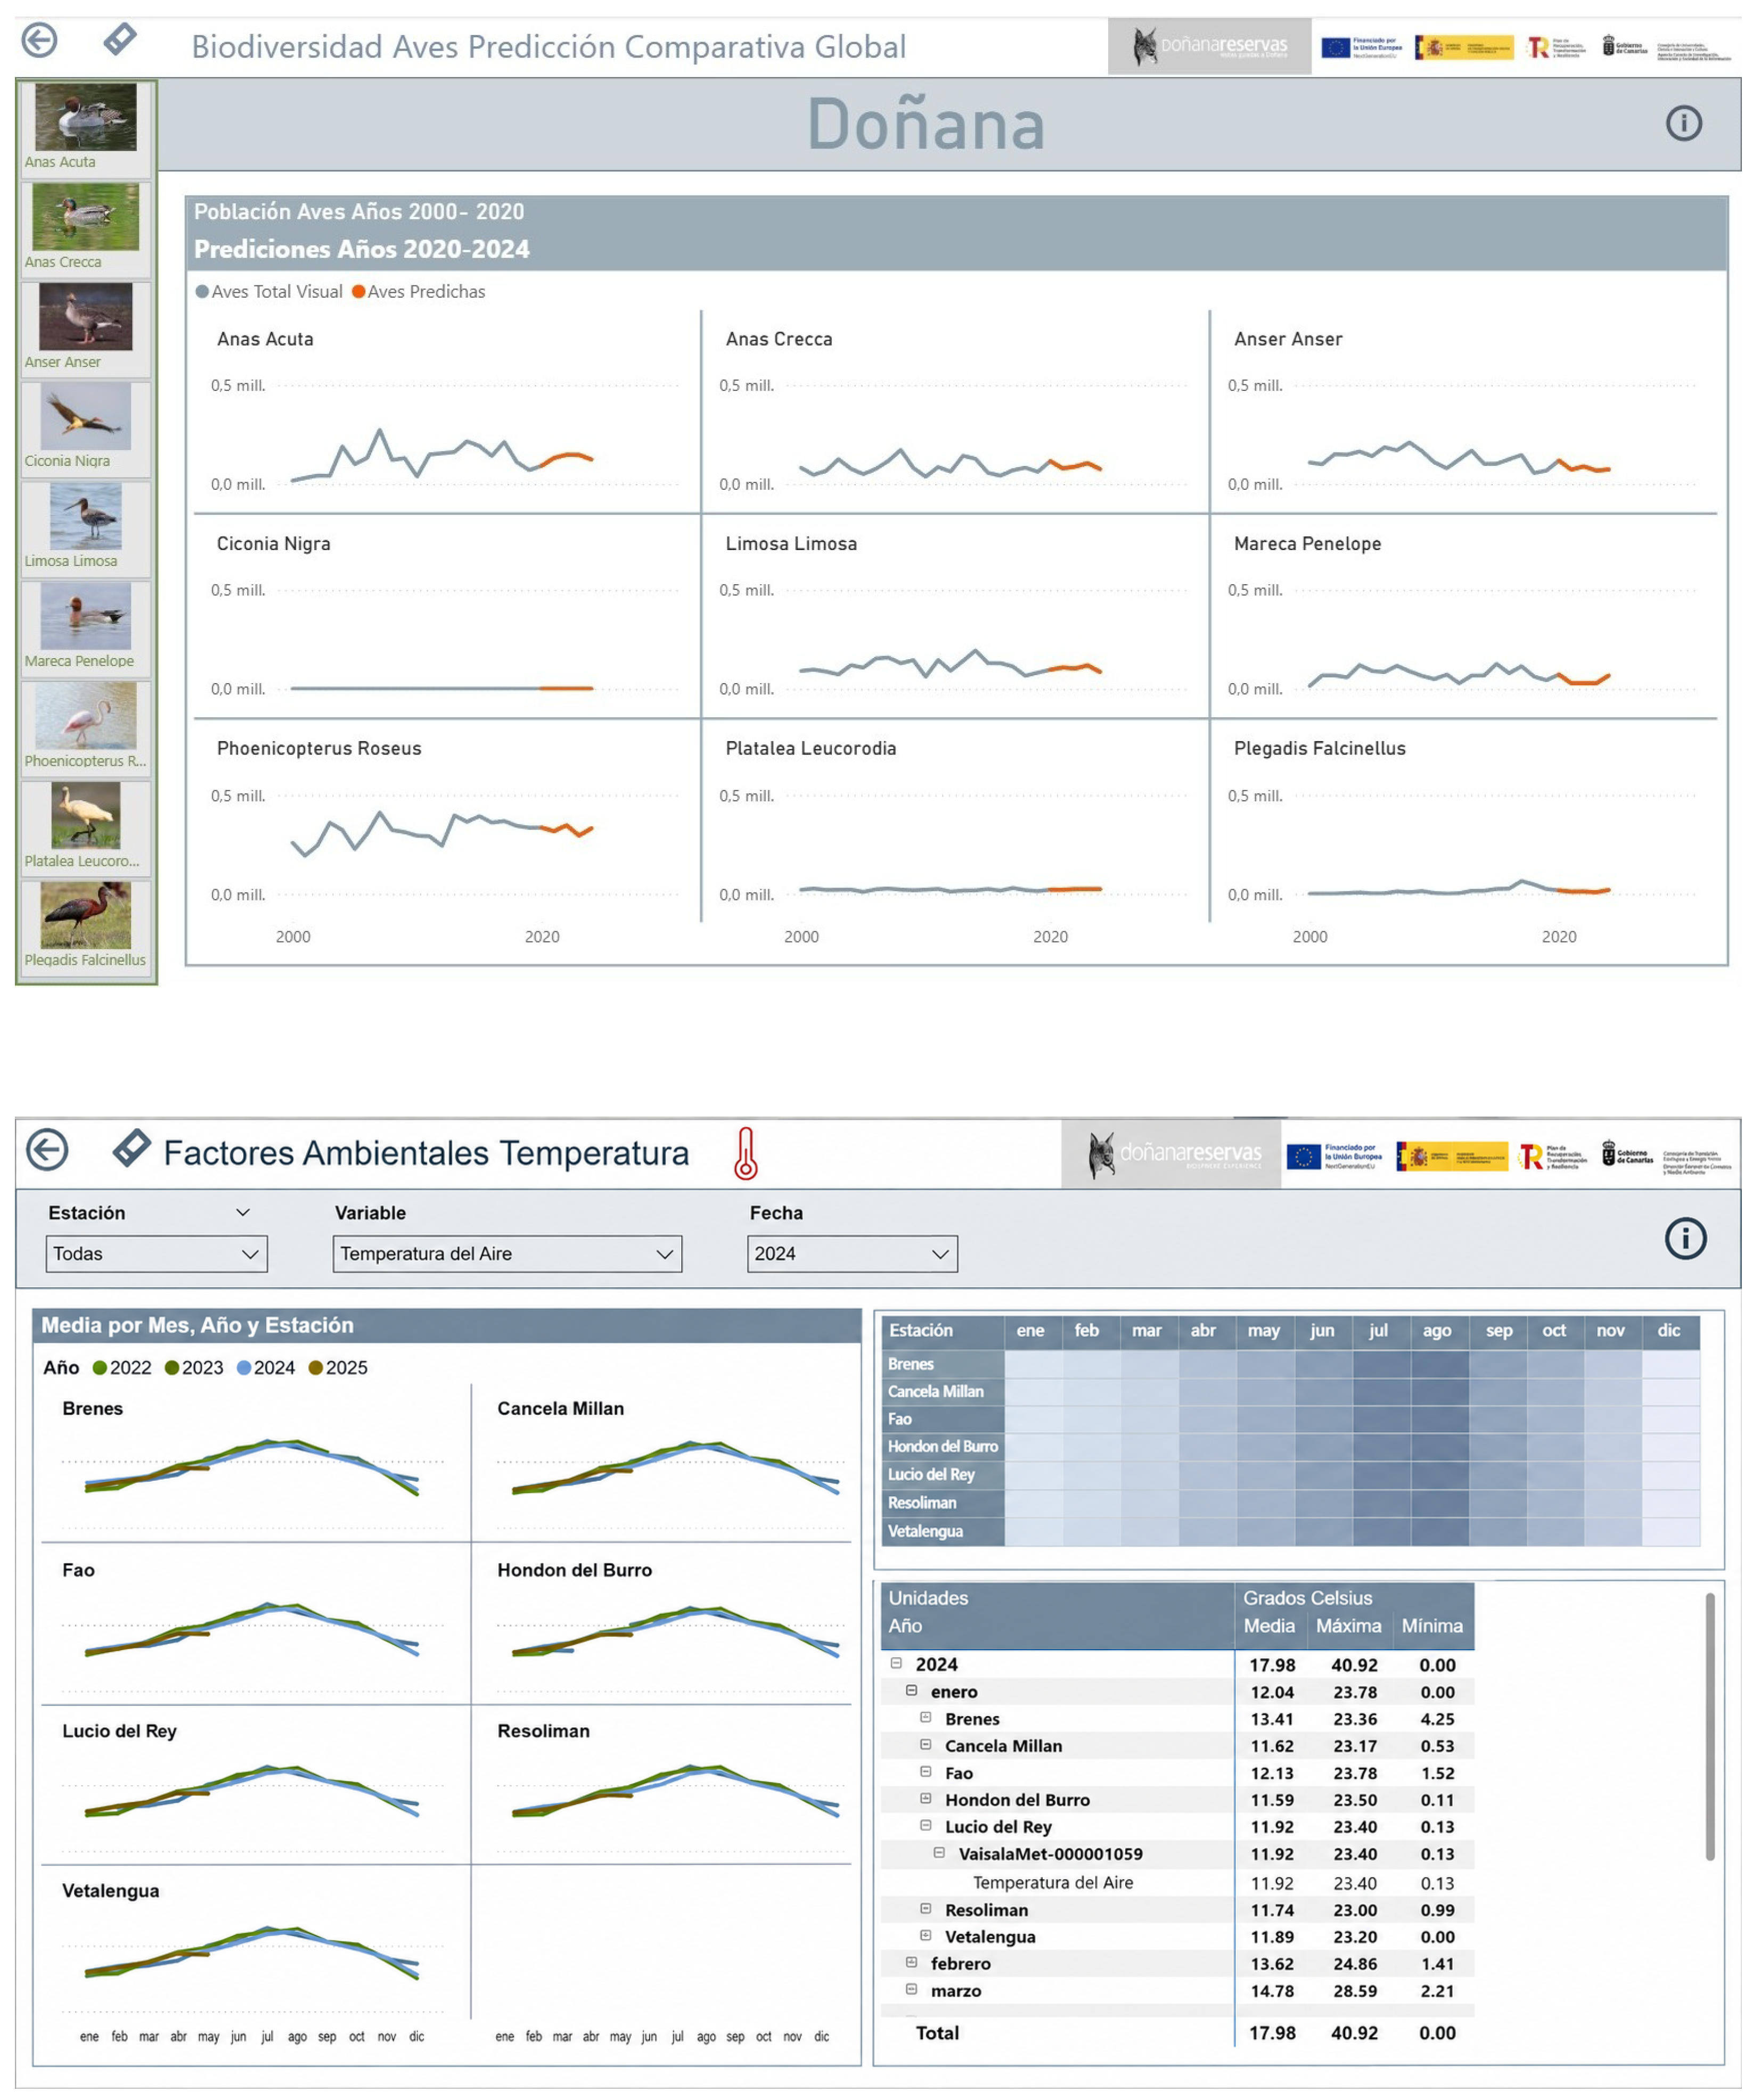

Disclaimer/Publisher’s Note: The statements, opinions and data contained in all publications are solely those of the individual author(s) and contributor(s) and not of MDPI and/or the editor(s). MDPI and/or the editor(s) disclaim responsibility for any injury to people or property resulting from any ideas, methods, instructions or products referred to in the content. |
© 2026 by the authors. Licensee MDPI, Basel, Switzerland. This article is an open access article distributed under the terms and conditions of the Creative Commons Attribution (CC BY) license.