


Abstract
National estimates of the bioenergy potential of livestock manure still rest on static inventories that apply conversion yields to the gross mass of manure, ignoring the fraction that is actually recoverable under each production system and the substrate-specific nature of anaerobic co-digestion. This study develops a category-level predictive model of the technical biogas potential of livestock manure in Peru, projected to 2030, resolving seven livestock categories: dairy and non-dairy cattle, broilers and layers, swine, guinea pigs (Cavia porcellus) and goats. Recoverability is formulated as a time-dependent factor tracking the progressive confinement of production systems; the technical potential is bounded between a mono-digestion floor and a co-digestion ceiling constrained by a co-location criterion that admits synergy only when the co-substrate originates within the same production system; and a greenhouse-gas layer quantifies avoided emissions from methane conversion factors. All coefficients are reported as intervals and propagated jointly by Monte Carlo simulation. Two yield hypotheses are carried throughout: experimental biochemical methane potential and the IPCC-consistent digester ceiling. The national net technical potential is 1975 under mono-digestion (731 ; 95% credible interval 1628–2404 , Monte Carlo ) and 2093 under co-digestion. The gross approach exceeds the recoverable resource by a factor of 3.94, equivalently a contraction of 74.6% (95% CI 68.9–79.1%), and a symmetric Shapley decomposition attributes 76.1% of that contraction to recoverability rather than to conversion yield—a share that is stable across both yield hypotheses. The greenhouse-gas layer yields a result that reverses the expected policy ordering: broilers rank first by recoverable energy but last by avoided methane, whereas swine rank first by mitigation because liquid slurry storage is the only baseline system emitting enough methane for anaerobic digestion to displace. Below a digester leakage of 4.6%, methane abatement is negative at the national scale.
1. Introduction
The transition toward sustainable energy systems and the closing of material cycles under the circular bioeconomy paradigm have placed organic waste at the centre of decarbonization strategies [1,2,3]. Livestock production, an essential component of food security, is one of the largest sources of organic waste worldwide. When poorly managed, livestock manure releases methane and nitrous oxide into the atmosphere while contaminating soils and water bodies [4]. Through anaerobic digestion, this same waste stream can be converted into biogas and a stabilized biofertilizer, linking environmental mitigation with distributed renewable energy generation [5,6,7]. In economies with high rurality and limited electricity access, this coupling is particularly relevant [8,9,10].
In Peru, the livestock and poultry sector accounts for a substantial share of agricultural production value—poultry alone representing approximately one quarter of the total—and supports millions of production units [11]. The country has a cattle population of nearly 5.9 million head [12], approximately 3.4 million swine [13], and is the world’s leading producer of guinea pigs (Cavia porcellus), with more than 17 million animals [14]. This scale coexists with pronounced heterogeneity: poultry production is intensive and geographically concentrated, most cattle are raised extensively in the Andean highlands, and guinea pig production remains based on dispersed family farming [15]. That heterogeneity determines the fraction of manure that can actually be collected.
Estimates of the energy potential of livestock residual biomass typically combine population data, manure generation factors, volatile solids content and specific methane yields, following the IPCC guidelines [4]. For Peru, a recent assessment of agricultural, agro-industrial and livestock residues identified cattle manure as the most abundant livestock residue [16]. Within the Andean region, studies in Ecuador [17] and Chile [18] have evaluated manure biogas potential using inventory approaches and, in the Chilean case, spatial analysis with supply–cost curves. Comparable inventory-based assessments using static recoverability factors exist for Europe [19], Poland [20], South America [21], India [22], Nigeria [23] and Taiwan [24].
Guinea pig manure has received limited attention. The available evidence is largely restricted to co-digestion experiments with Andean lignocellulosic residues [25,26] and low-cost tubular digesters at high altitude, where notably low yields have been reported under psychrophilic conditions [27,28]. Field and laboratory experiences in Peru confirm farm-scale feasibility—systems operated for more than a decade in Lima [29], IBC digesters with physicochemical characterization [30], and batch experiments in Tacna where forage addition increased biogas production approximately fourfold [31]. This evidence remains fragmented, and the stream has never been incorporated into a national assessment.
Our research group has designed and monitored several field-scale biodigester systems in Peru, including the Chillón Valley system [32,33], the cattle–guinea pig co-digestion plant at Villa Asís with integrated pH and electrical conductivity control [34], industrial biodigesters for sugarcane filter cake [35], and thermo-economic circular economy models for regional biogas and biofertilizer production [36]. These projects provide primary data supporting the model developed here.
A systematic review of 97 geographically bounded biogas potential studies [37] concluded that most existing assessments rely on static linear models and recommended that prospective studies incorporate co-digestion, technological development and uncertainty analysis. Three limitations follow. First, static inventories provide a snapshot while ignoring the ongoing intensification of production systems, which continuously modifies the recoverable resource. Second, conversion yields are applied to gross manure mass without distinguishing the recoverable fraction: treating manure from extensively grazing highland cattle as fully available is physically unrealistic. Third, substrate conversion is treated as monolithic, although co-digestion synergy is substrate-specific and depends on co-substrate co-location, so that assuming universal co-digestion introduces an overestimation of opposite sign.
To overcome these limitations, this study formulates manure recoverability as a time-dependent factor weighting the confined fraction of each livestock category according to its projected intensification trajectory, and constrains the technical potential from below by a mono-digestion scenario and from above by a co-digestion scenario subject to an explicit co-location criterion. Building on the predictive multi-residue framework previously validated for the sugarcane agroindustry [1], the model additionally incorporates a greenhouse-gas layer based on methane conversion factors, which allows the energy and mitigation rankings of each category to be compared directly. Although recent frameworks consider biomass availability and competing uses—the static classification proposed by Steindl et al. [38], or the constraint-severity analysis of Einarsson and Persson [39], which recognizes that constraints evolve but models them statically—none formulates recoverability as a continuous function of time, none imposes a co-substrate co-location constraint, and none reports both an energy and an emission balance under joint uncertainty propagation.
The objective is therefore not a first inventory of Peru’s livestock biogas resource, which already exists, but a methodological reassessment delivering a dynamic, stratified and physically consistent estimate of what can actually be recovered, together with its climate consequence. Section 2 describes the model, the recoverability stratification, the two yield hypotheses, the greenhouse-gas layer and the uncertainty treatment. Section 3 presents the results by category and scenario. Section 4 summarizes the implications for energy and climate planning.
2. Materials and Methods
2.1. Scope, System Boundary and Livestock Categories
The analysis is restricted to Peru’s primary livestock sector and to the anaerobic digestion pathway, the only conversion route physically appropriate for wet, highly biodegradable fresh manure. Fishery and agro-industrial residues fall outside the scope of this study, although co-digestion with manure will, in some cases, be what makes biogas plants viable in the livestock sector. Whenever co-substrates are considered they are restricted to materials intrinsic to the production system, avoiding boundary expansion and double counting with agro-industrial inventories.
The inventory resolves seven livestock categories: dairy cattle, non-dairy cattle, broilers, layers, swine, guinea pigs (Cavia porcellus) and goats. Cattle and poultry are disaggregated because recoverability, excretion rate and methane yield differ substantially between their respective subherds, and because aggregating them conceals the fact that the confined cattle fraction corresponds almost exclusively to the milking herd.
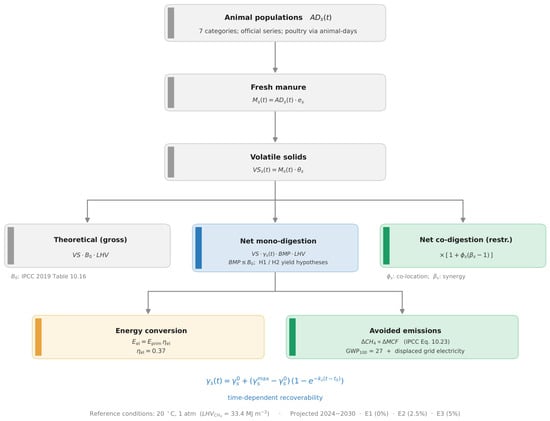
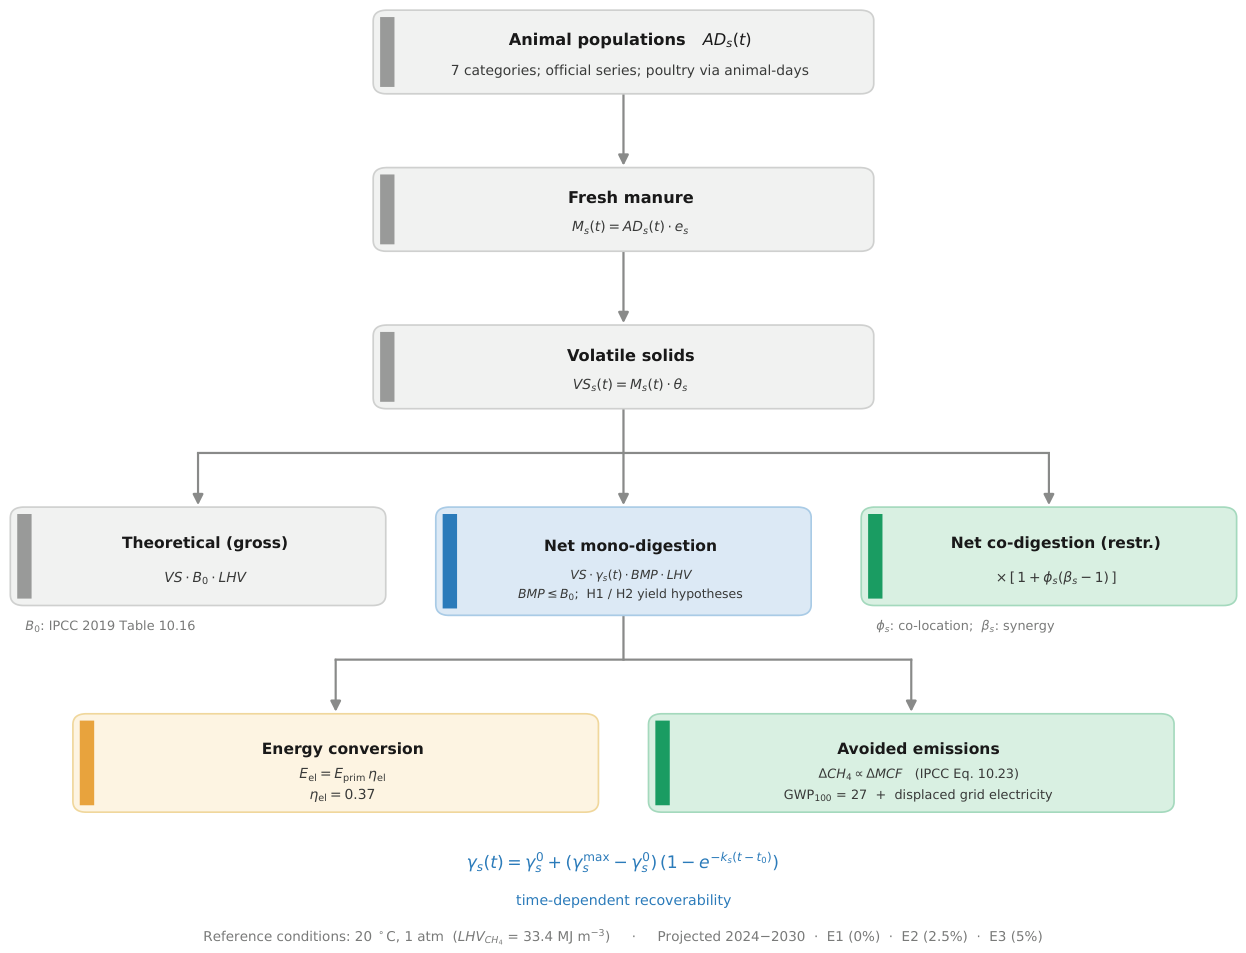
The model is a three-layer cascade—theoretical (gross) potential → net technical potential under mono-digestion → net technical potential under co-digestion—projected to 2030, with two additional output layers: electrical conversion and avoided emissions. The framework is summarized in Figure 1.
Figure 1.
Architecture of the model, from livestock populations to manure generation and volatile solids production, and subsequently to the theoretical (gross), net technical mono-digestion and net technical co-digestion potentials, with the electrical conversion and avoided-emission outputs. Table 10.16 and Eq. 10.23 refer to IPCC 2019 [4]. Gray, blue, green, and orange identify the main model stages. All methane volumes are referenced to 20 °C and 1 atm.
Each layer is obtained by multiplying the previous one by a coefficient with explicit physical interpretation: for the organic fraction, for the maximum methane potential, for the recoverable fraction, for the realized yield, and for co-digestion synergy, so that differences between successive layers are interpretable directly.
2.2. Activity Layer
Population data were obtained from the Integrated Agricultural Statistics System (SIEA) of the Ministry of Agrarian Development and Irrigation (MIDAGRI) and from the National Agricultural Survey (ENA). Table 1 reports the reference populations and production cycles.
Table 1.
Reference animal populations and production cycles used in the activity layer. Cattle and poultry are disaggregated into dairy/non-dairy and broiler/layer categories, respectively.
Cattle and guinea pigs account for the largest standing populations, whereas the poultry industry renews its stock several times per year, so that standing population is not an appropriate activity metric and must be converted into animal-days using Equation (1). Because the most recent comprehensive agricultural census dates from 2012, the model relies on the annual SIEA series and the ENA sample survey, and the guinea pig population is reported as a range reflecting discrepancies among official sources.
where is the number of animal-days for category s in year t, denotes annual placements (broilers) or standing population, and is the production cycle in days. For categories inventoried by standing stock, .
2.3. Manure Generation and Physicochemical Characterization
Annual fresh manure and volatile solids production are obtained from Equations (2) and (3). Table 2 compiles the coefficients.
where is the annual mass of fresh manure [kg ], the daily excretion rate [kg ] and the volatile solids fraction of fresh manure [kg VS ].
Table 2.
Manure generation coefficients. All values are reported as minimum–mode–maximum and are propagated as triangular distributions in the Monte Carlo simulation (Table S2).
Two contrasting regimes are apparent: cattle and swine manures are characterized by high moisture and low volatile solids fractions (), whereas poultry, goat and guinea pig manures are drier and richer in volatile solids (). Categories with smaller populations may therefore contribute comparable amounts of methanogenic substrate.
Both and are reported as intervals and propagated as triangular distributions. The excretion-rate route is retained as the reference because it admits category-specific Peruvian data, but its consistency with the IPCC formulation was verified independently. The IPCC [4] expresses volatile solids excretion per unit live weight (Tables 10.13A and 10A.1-3); with the live weights of Table 10.5 for Latin America, the coefficients of Table 2 imply excretion rates of 7.2 and 5.1 kg VS per 1000 kg of live weight per day for dairy and non-dairy cattle, and between 8.6 and 23.3 for the remaining categories, all of which fall within the ranges reported by the IPCC for the corresponding animal types. Table S1 of the Supplementary Material reports the implied rates for all seven categories.
2.4. Specific Methane Yield and the Two Yield Hypotheses
The biochemical methane potential (BMP), the specific methane yield per unit of volatile solids, is the central conversion parameter. Its experimental determination follows standardized batch protocols [47,48,49,50], and its theoretical limit derives stoichiometrically from elemental composition through the Buswell equation [51,52].
The ultimate methane production capacity [ C kg ] is taken from Table 10.16 of the 2019 IPCC Refinement [4], using the Latin America rows. For swine, the developing-country default originates in the earlier IPCC/IGES Good Practice Guidance [53]; that source is cited explicitly where used, since the two documents are distinct and the 2019 Refinement does not reproduce the same range. A uncertainty is applied to all values, as reported in that source.
Because the IPCC does not tabulate BMP—it tabulates and methane conversion factors—two yield hypotheses are carried through the entire analysis:
Hypothesis 1.
The realized BMP reported in the experimental literature for each category: cattle [54,55,56], swine [57,58,59], poultry [60,61,62,63], goats and sheep [64,65,66,67] and guinea pigs [25].
Hypothesis 2.
The IPCC-consistent digester ceiling , where is the maximum fraction of attainable under mesophilic anaerobic digestion and discounts the methane already lost during storage before collection.
The physical constraint is enforced under both hypotheses. Table 3 reports the adopted values and the ratio , which makes the relative conservatism of each category explicit.
Table 3.
Ultimate methane production capacity (IPCC 2019 [4] Table 10.16, Latin America rows; swine from the IPCC/IGES 2000 [53] Good Practice Guidance, which is the source of the developing-country default) and realized biochemical methane potential under the two yield hypotheses. H1: experimental literature; H2: . under H1. The constraint is enforced in both hypotheses.
The ratio ranges from 0.52 to 0.94 under H1. The low value for swine reflects the fact that the developing-country default of 0.29 C kg has itself been argued to be high relative to measured anaerobic biodegradability [53], so the gap should be read as conservatism in the denominator rather than as poor digester performance.
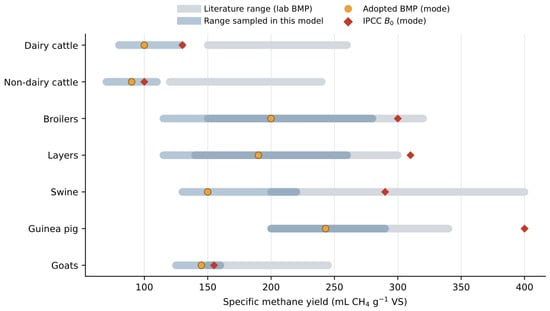
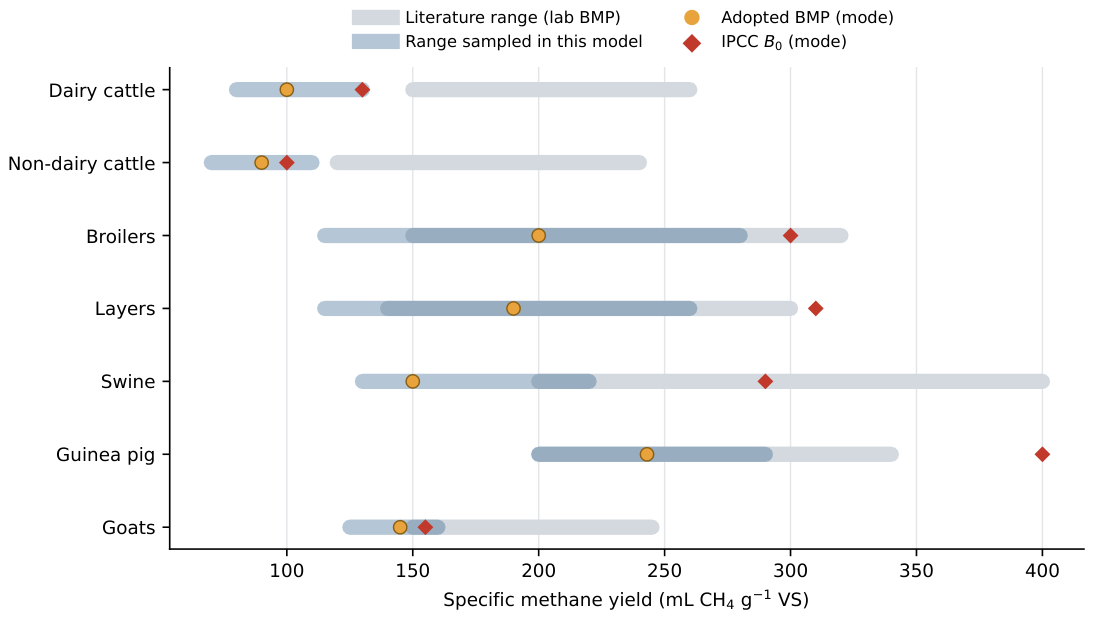
The physicochemical characterization adopted for guinea pig manure is consistent with Peruvian reports: volatile solids of 68.4–81.7% on a dry matter basis, a C/N ratio of 11.6–23.5, and a methane content of 72.3% in the only characterization reporting biogas composition [30,31,45]. Figure 2 compares the adopted values with the laboratory ranges reported in the literature.
Figure 2.
Laboratory biochemical methane potential reported in the literature for each livestock category, the interval sampled in this model, the adopted mode, and the IPCC value. The adopted values lie within the reported experimental ranges in all seven categories and satisfy .
Figure 2 shows that the adopted values sit in the lower half of the reported experimental ranges in every category, consistent with Peruvian production being largely based on Creole livestock under extensive management and low-quality diets, conditions under which realized yields fall well below those obtained in optimized laboratory assays. The estimates presented here should therefore be read as conservative. Two features of the figure are worth noting: the adopted value lies within the reported range in all seven categories, and the constraint is satisfied throughout, including in goats, where the IPCC capacity is low enough for the two quantities to approach one another.
2.5. Theoretical (Gross) Potential
The theoretical potential—the quantity directly comparable with existing gross national inventories such as [16]—is given by Equation (4):
The IPCC expresses as methane volumes at 1 atm and 20 °C, consistent with the density kg heating value must therefore be referred to the same conditions: MJ , not the 35.8 MJ value corresponding to 0 °C. All three energy layers are expressed as primary energy (); electrical generation follows as with . No thermal conversion pathway is considered. This layer accounts for the entire volatile solids inventory at maximum yield and is an absolute upper bound, not an estimate.
2.6. Net Technical Potential and Manure Recoverability
The technical potential incorporates the two terms absent from gross inventories:
where is the manure recoverability factor—the fraction of generated manure that can be collected for anaerobic digestion given the production system—and is the realized mono-digestion yield. The two terms answer non-overlapping questions: quantifies how much substrate is physically recoverable, how much methane yield is realized. Livestock under extensive management deposit manure diffusely across pastures and rangelands; the corresponding manure management category in the IPCC classification is pasture/range/paddock, for which no collection is assumed [4].
Recoverability is not constant over time. Poultry production has undergone progressive industrialization and guinea pig production has shifted toward commercial confinement, increasing the recoverable fraction. This evolution is represented as an asymptotic approach to a category-specific limit:
where is the base-year recoverability, the asymptotic maximum, the transition rate and . Values of are derived from production-system shares observed between the 2012 Agricultural Census and the ENA survey; Table 4 reports them with their structural justification and Table S1 gives the full derivation.
Table 4.
Recoverability parameters by category. is reported as minimum–mode–maximum and is derived from production-system shares (2012 Agricultural Census and ENA survey); the full derivation is given in Table S1.
Because is calibrated on two observation points only, it is an exactly determined fit with no residual degrees of freedom available for validation, and should be read as a structured hypothesis on the pace of confinement rather than as a statistically estimated parameter. Equation (6) also tracks structural confinement only: deliberate improvements in manure handling within an existing production system are not represented, so the projected trajectories are conservative with respect to any policy actively promoting collection infrastructure.
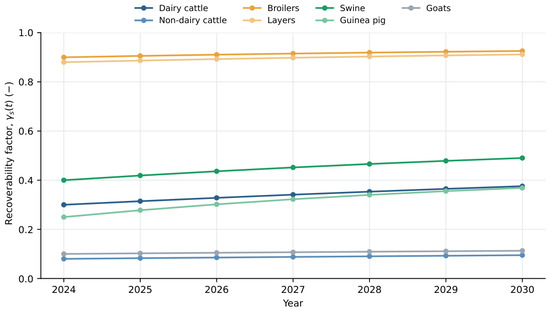
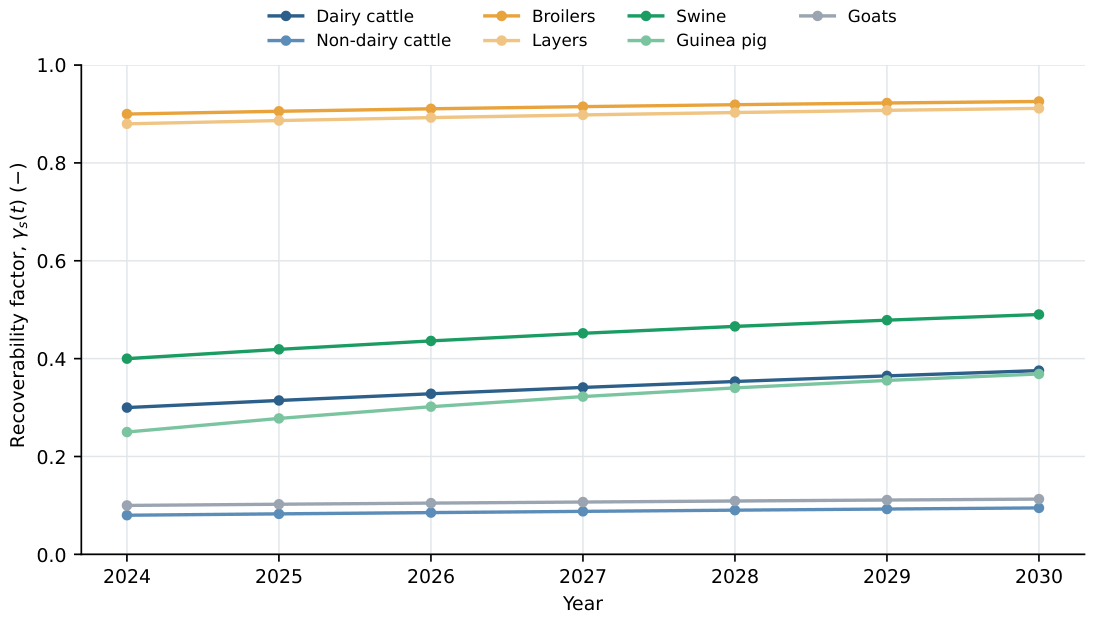
The gradient of —from 0.08 in goats to 0.90 in broilers—encapsulates the central logic of the model: real availability depends not on how much manure is generated but on the degree of confinement of the system. Categories with large manure output under extensive management retain a small recoverable fraction, whereas poultry retains almost its full potential. These trajectories are shown in Figure 3.
Figure 3.
Trajectories of the recoverability factor by livestock category, 2024–2030, according to Equation (6).
Broilers and layers start high and saturate rapidly; non-dairy cattle and goats remain low with almost flat slopes, reflecting the slow transition away from extensive grazing; guinea pigs show the steepest relative growth, consistent with the incipient commercialization of their production system. It is this interspecies divergence that a static inventory cannot capture.
2.7. Mono- and Co-Digestion Configurations
The co-digestion ceiling admits synergistic gains only over the fraction of manure intrinsically co-located with a co-substrate within the production system:
where is the co-located fraction and the methane yield synergy ratio. If the expression reduces to mono-digestion; if it represents full co-digestion. The synergistic effect of co-digestion and its dependence on the C/N ratio and co-substrate availability are widely documented [67,68,69,70,71,72]. The formulation prevents the implicit overestimation associated with assuming unlimited co-substrate availability. Table 5 reports and for every category together with the assumed co-located co-substrate.
Table 5.
Co-digestion parameters by category. is the fraction of recoverable manure co-located with an internally available co-substrate; is the methane yield synergy ratio; .
The contrast between broilers and layers illustrates the mechanism: broiler sheds generate rice-husk litter intrinsic to the system, whereas cage-based layer systems generate none, so the co-digestion gain differs even though both belong to the poultry industry. For guinea pigs is high because forage (chala) is an intrinsic component of the system [29,31], with deliberately below the laboratory maxima, since farm-scale synergy is constrained by the achievable mixture ratio rather than by the experimental optimum [56,68]. The goat case illustrates the co-location constraint: although external co-substrates raise yields substantially—from 196 to 467 mL C g with potato processing residues in sheep manure [67]—such substrates are not co-located in extensive grazing systems, so remains low.
2.8. Aggregation and Derived Metrics
National potentials are obtained by summation over categories:
Two derived metrics are defined. The co-digestion gain, Equation (9), and the contraction of the gross approach, Equation (10). The latter is referred to the theoretical bound and is therefore a contraction, not an overestimation ratio; the corresponding overestimation factor is and is reported alongside it to avoid ambiguity.
2.9. Estimation of Avoided Greenhouse-Gas Emissions
The recoverable stream is diverted from its current management system to a digester, changing its methane conversion factor. The avoided methane follows from the IPCC methane-emission formulation:
where is the methane conversion factor of the currently dominant management system, taken from Table 10.17 and Annex 10A.3 of the IPCC guidelines according to the system distribution in Tables 10A.6-9, and is the digester leakage, for which the IPCC range is 1–13.17%. A central value of 5.0% is adopted and the sensitivity to this parameter is reported explicitly, since the sign of the balance depends on it. Methane is converted to carbon dioxide equivalent with (AR6, non-fossil methane). The displacement of grid electricity is added as , with kg Ceq for the national interconnected system.
2.10. Projection and Uncertainty Propagation
Three population growth scenarios are defined: conservative (E1, ), moderate (E2, ) and optimistic (E3, ), following the structure validated in [1]:
with n the number of years from the base year. In contrast to static approaches, evolves within each projection according to Equation (6), so the trajectory combines population growth with the transition toward confinement.
Uncertainty is propagated jointly by Monte Carlo simulation (N = 100,000, seed 42), sampling triangular distributions supported on the intervals of Table S1 for , , , , , and . The intervals of represent epistemic uncertainty in the confined fraction at the base year, not the temporal trajectory . Table S2 specifies the distributions and states which parameters were propagated. A one-at-a-time sensitivity analysis is performed over the same intervals, so that the tornado diagram and the Monte Carlo simulation are mutually consistent by construction; the median, coefficient of variation and 95% credible interval are reported for every aggregate quantity, including the contraction metric itself. The scenario trajectories reported below are computed deterministically with the central value of every coefficient and are therefore central estimates rather than ensemble means; the joint propagation is reported separately as an interval on the aggregate quantities.
2.11. Validation Strategy
In the absence of a national time series of measured manure-based biogas production, validation rests on three anchors: consistency of coefficients with the IPCC 2019 default values [4]; comparison of the gross layer against the existing national estimate [16] and Andean regional benchmarks [17,18]; and comparison of the guinea pig line against published Peruvian experimental evidence [30,31] together with production data from the Chillón Valley and Villa Asís systems [32,33,34] and an independent Peruvian farm-scale case [8]. Agreement is summarized using the relative percentage error (RPE):
2.12. Parameterization of the Guinea Pig Manure Stream
Palacios Toribio et al. [30] characterized Cavia porcellus manure in a 1 IBC reactor, reporting an organic fraction of 81.7%, a C/N ratio of 23.5, and a biogas composition with 72.3% methane and a calorific value of approximately 26.8 MJ . Murray-Núñez et al. [45] report an organic matter content of 68.4% and a C/N ratio of 11.6 for whole excreta. These values constrain the characterization adopted in Table 2 and Table 3.
Because the available Peruvian characterization corresponds to co-digestion assays with forage rather than controlled mono-digestion, the mono-digestion yield required in Equation (5) is inferred from the synergy ratio as . This choice keeps the mono-digestion yield below the upper bound, reproduces the reported co-digestion yield when , and avoids the double counting of synergy that would arise if the co-digestion yield were used as the mono-digestion baseline. The synergy coefficient is supported by batch assays in which forage addition increased biogas production from 104 to 452 L [31] and by long-term farm-scale operation co-digesting guinea pig manure with co-located maize residues [29]. Evidence from high-altitude tubular digesters [27,28] confirms that psychrophilic yields are low, consistent with the conservative coefficients adopted.
3. Results and Discussion
3.1. Manure Generation and Volatile Solids
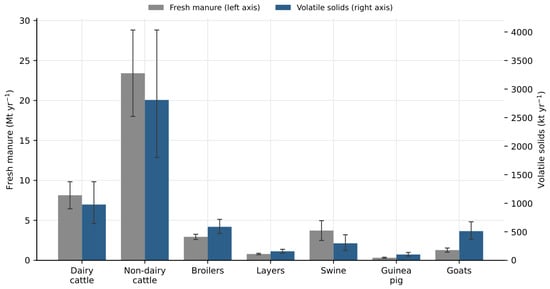
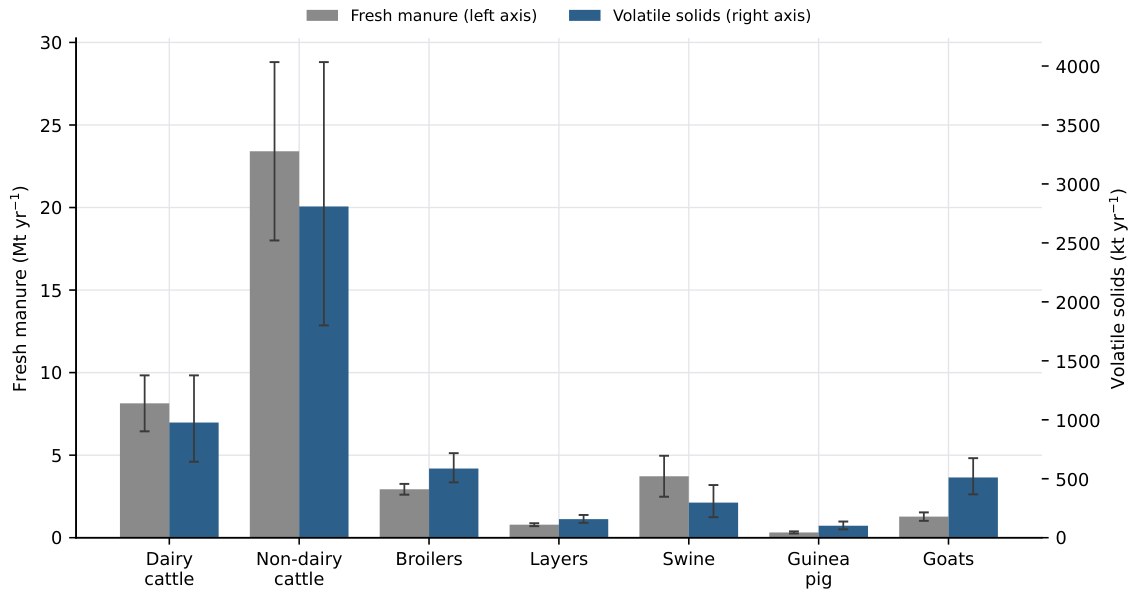
National volatile solids generation amounts to 5440 kt VS from 40.6 Mt of fresh manure. Figure 4 contrasts both quantities by category with their propagated uncertainty.
Figure 4.
Annual generation of fresh manure (left axis) and volatile solids (right axis) by livestock category in Peru. Error bars propagate the intervals of and (Table 2).
Non-dairy cattle dominate fresh manure mass, but the gap between fresh manure and volatile solids is far larger in cattle and swine—moist manure systems—than in poultry, goats or guinea pigs, whose higher volatile solids concentration brings both quantities closer together. This tension between bulk abundance and substrate concentration, combined with recoverability, is what subsequent layers translate into usable potential.
3.2. Theoretical Potential and Comparison with the National Benchmark
The theoretical potential amounts to 7783 (2880 ). The combined cattle contribution is 3784 , equivalent to 1400 , against the ≈ reported for cattle manure by [16], with an RPE of 19%.
The originally reported near-coincidence with that benchmark is not reproduced here, and the discrepancy is informative rather than problematic. It decomposes into three traceable components: the correction of the reference conditions of the lower heating value (), the adoption of region-specific values instead of a uniform one, and the disaggregation of the cattle herd into dairy and non-dairy categories with distinct excretion rates. The earlier agreement therefore rested on a combination of choices that partly compensated one another, whereas the present divergence is attributable to identifiable methodological changes. Validation of the gross layer accordingly rests on coefficient traceability rather than on numerical coincidence.
3.3. Net Technical Potential
Introducing reduces the national mono-digestion potential to 1975 (731 ). Table 6 disaggregates the three layers by category.
Table 6.
Volatile solids generation and biogas potential by category (base year 2024, hypothesis H1, primary energy). Methane volumes at IPCC reference conditions (20 °C, 1 atm; MJ ).
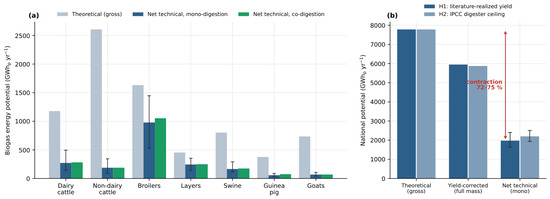
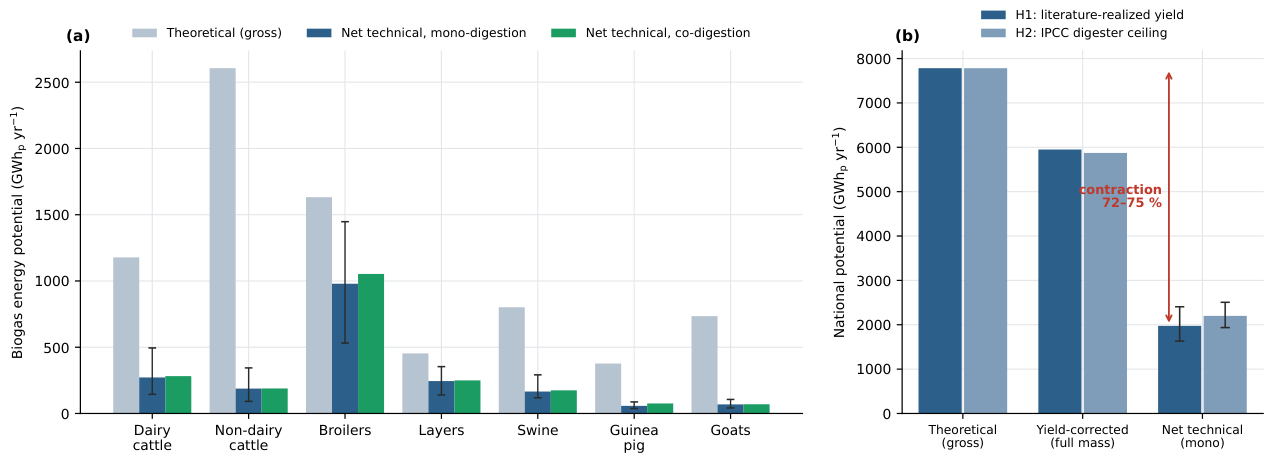
The contraction of the gross approach reaches 74.6% under H1 and 71.7% under H2, equivalently a gross-to-net ratio of 3.94 and 3.54 respectively: the exploitable resource is of the order of 25% of the gross value. The correction is driven by non-dairy cattle, whose contribution falls from 2606 to 188 once dispersed manure under extensive grazing is discounted, and by goats. Figure 5 shows the category-level reassignment and the national aggregate under both yield hypotheses.
Figure 5.
(a) Biogas energy potential by category in the three model layers under hypothesis H1; error bars propagate the intervals of and . (b) National aggregate for the three layers under both yield hypotheses, with the 95% credible interval of the net layer and the resulting contraction range. Black error bars indicate the uncertainty range of the net technical potential estimates.
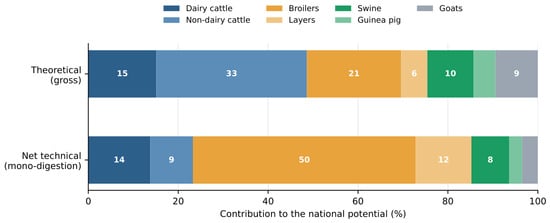
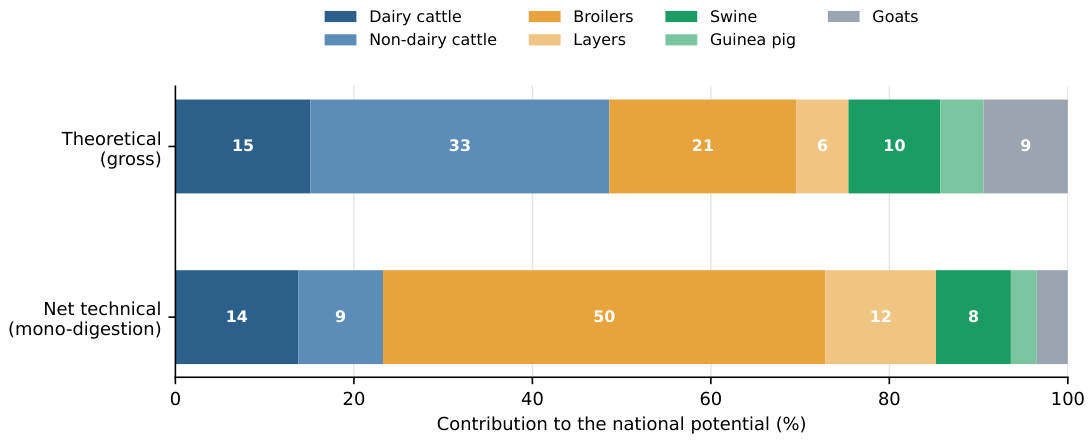
The disproportion between the theoretical and net bars is greatest for non-dairy cattle and goats and smallest for broilers, which retain most of their theoretical potential. The result is a reordering of the hierarchy: cattle account for 49% of the gross potential but 23% of the net potential, whereas poultry rise from 27% to 62%. Figure 6 makes the redistribution explicit.
Figure 6.
Contribution of each livestock category to the gross (theoretical) and net (technical, mono-digestion) potential, base year 2024.
This reordering has a direct operational consequence: energy valorization interventions yield more when targeted at confined poultry systems than at the dispersed cattle herd, even though the latter dominates gross manure generation.
3.4. Mono- Versus Co-Digestion
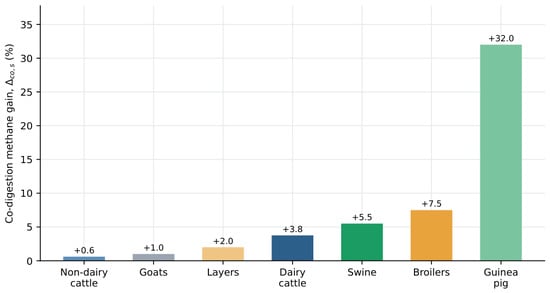
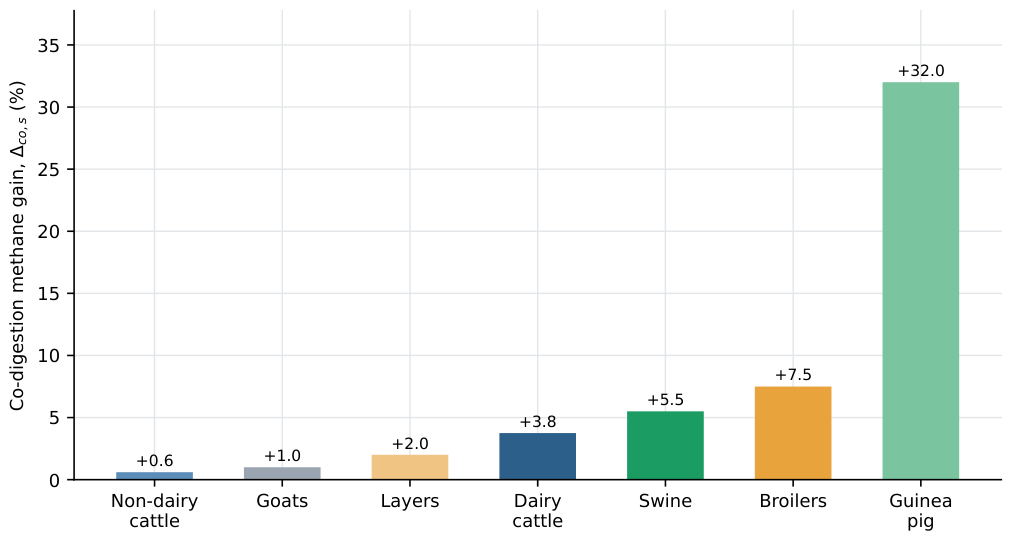
Co-digestion raises the net potential from 1975 to 2093 , an increase of . The gain concentrates in guinea pigs, where the system’s own co-substrate makes co-digestion realistic (32%), and is suppressed in extensively raised categories. Figure 7 breaks the gain down by category.
Figure 7.
Relative methane gain from co-digestion by livestock category, base year 2024.
Since is a direct function of the assumed co-location and synergy and is independent of the absolute value of , its magnitude should be read as a consequence of the co-substrate restriction mechanism rather than as a potential discovered by the model. The contrast between broilers and layers—categories belonging to the same industry but differing in litter availability—shows that co-digestion is neither uniform nor free: it is substantial where the co-substrate belongs to the production system and negligible where it does not.
3.5. Projection to 2030
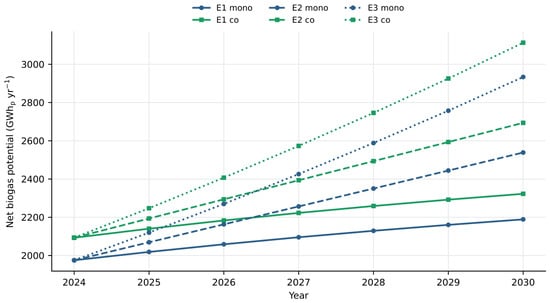
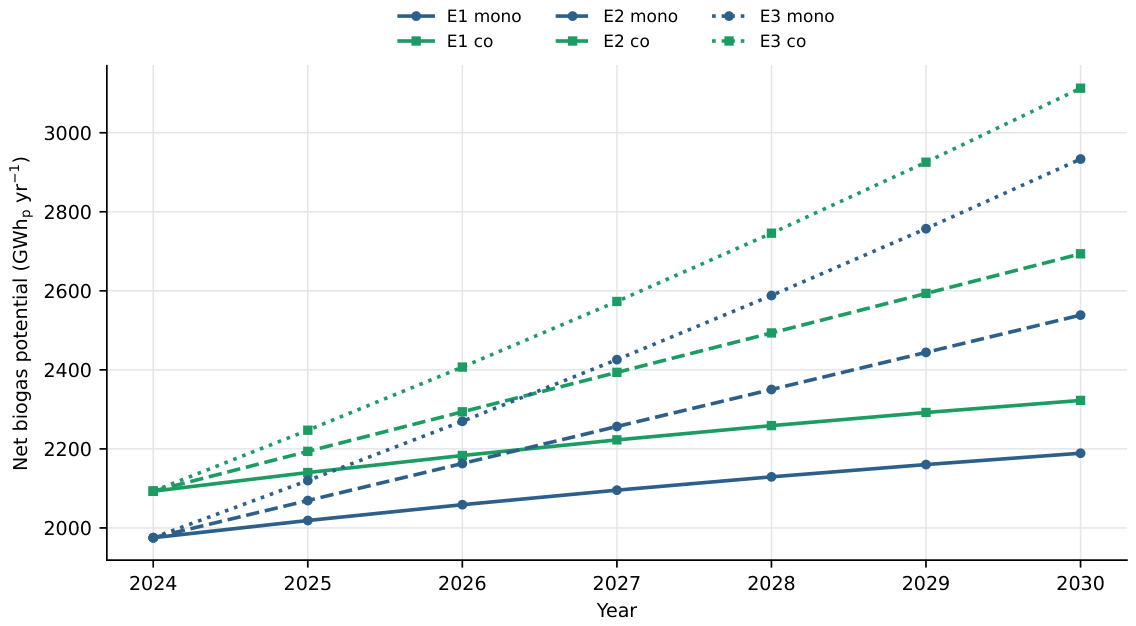
Table 7 and Figure 8 report the annual trajectories and cumulative values under the three growth scenarios combined with the evolving .
Table 7.
Projected net biogas potential to 2030 under the three population growth scenarios (hypothesis H1, dynamic ). The base year is common to the three scenarios, at 1975 under mono-digestion and 2093 under co-digestion. The annual trajectories are shown in Figure 8 and are not repeated here.
Figure 8.
Projected net biogas potential under mono- and co-digestion to 2030, scenarios E1–E3, hypothesis H1. Trajectories are central estimates computed with the central values of all coefficients and are not Monte Carlo means.
Table 7 reports the endpoints and the cumulative totals, which are the magnitudes relevant for planning and cannot be read off a trajectory plot. Two features stand out. The resource grows even under a constant livestock population, by 9.8% between 2024 and 2030, because the confinement transition operates independently of herd size; this is the component that a static inventory cannot capture. And the spread between growth scenarios widens monotonically rather than converging, because population growth and confinement compound multiplicatively in Equation (5): a larger herd is also a herd from which a larger fraction is recoverable.
The net mono-digestion potential grows from 1975 in 2024 to 2189–2934 in 2030 depending on the scenario, and the separation between scenarios widens over time. Under constant population (E1), a single-snapshot inventory would understate the 2030 resource by 9.8%, computed as . Together with the present-day contraction, this constitutes a bias in both temporal directions that no static inventory can quantify, since both terms arise from recoverability changing over time. Static availability frameworks [19,20,38,39] acknowledge the temporal variability of constraints but hold it constant as a parameter.
The six trajectories of Figure 8 are central estimates, not ensemble means; the three scenarios share identical conversion and recoverability coefficients and differ only in the population growth rate g, so parametric uncertainty displaces them jointly rather than independently and the ordering E1 < E2 < E3 is preserved in every realization. Individual uncertainty bands per scenario would therefore misrepresent the propagation as admitting crossings between trajectories. The between-scenario separation is, for the same reason, a more robust output of the model than the absolute level of any single trajectory, and the joint propagation of the absolute level is reported below.
3.6. Sensitivity and Joint Uncertainty
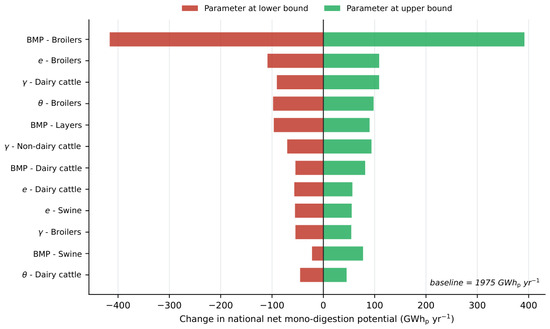
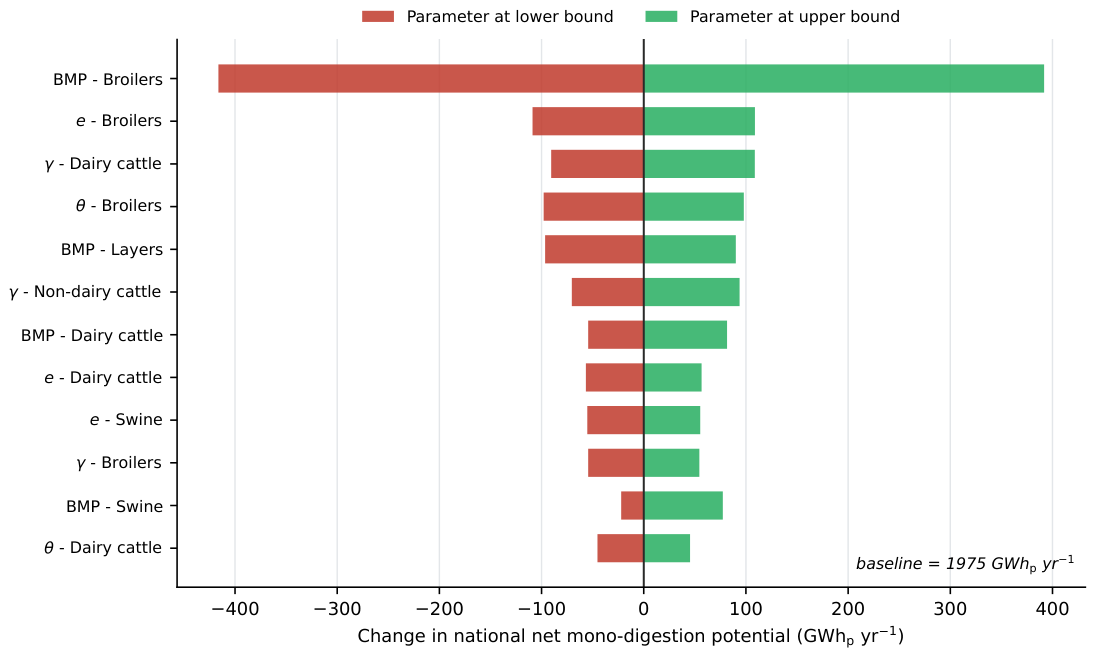
The sensitivity of the national net mono-digestion potential was evaluated by varying each parameter within the intervals of Table S1—the same intervals used in the Monte Carlo simulation. Figure 9 presents the resulting tornado diagram.
Figure 9.
One-at-a-time sensitivity of the national net mono-digestion potential. Parameter intervals are those of Table S1, identical to the support of the Monte Carlo distributions.
The dominant parameter is the biochemical methane potential of broilers, whose interval shifts the national potential by 808 , followed by the methane potential of dairy cattle at 218 . Recoverability parameters rank lower once the cattle herd is disaggregated, because the confined subherd carries a small mass and the extensive subherd a small recoverable fraction. This has a direct implication for future work: model uncertainty is most effectively reduced by experimentally characterizing the methane potential of Peruvian poultry manure, not by refining recoverability coefficients. The result is also internally coherent with the hierarchy inversion of Figure 5 and Figure 6: the categories that dominate the net potential are the same ones whose parameters dominate its uncertainty.
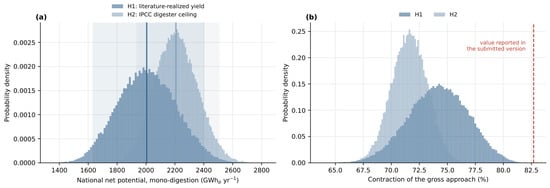
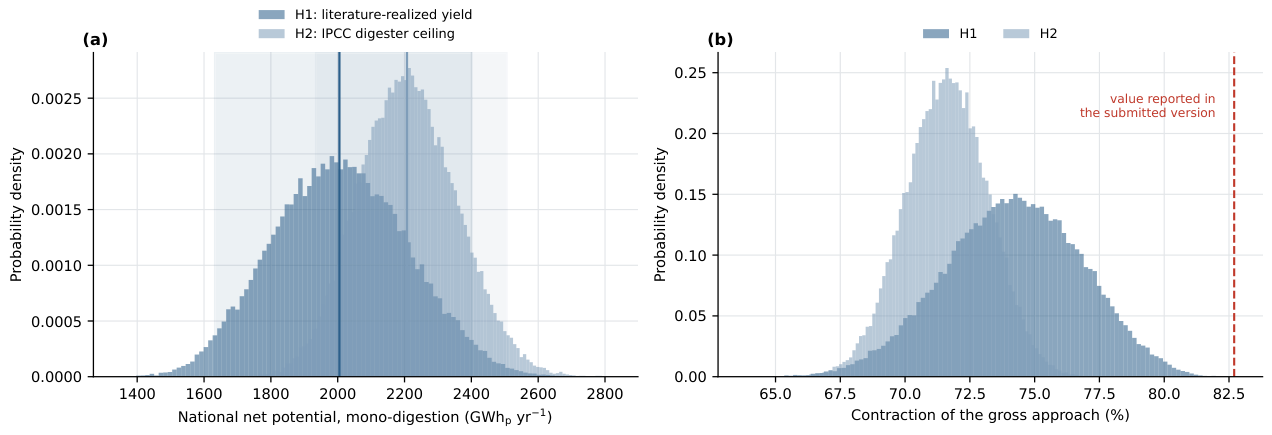
Figure 10 summarizes the joint propagation.
Figure 10.
(a) Distribution of the national net mono-digestion potential under joint Monte Carlo propagation (N = 100,000) for both yield hypotheses; vertical lines mark the medians and shaded bands the 95% credible intervals. (b) Distribution of the contraction metric.
The net mono-digestion potential lies within a 95% credible interval of 1628–2404 (median 2007; coefficient of variation 10.0%), and the co-digestion potential within 1723–2551 . Two features of this interval are worth stating explicitly. Its ensemble median (2007 ) exceeds the deterministic central estimate of the base year (1975 , Table 6) by 1.6%, as expected in a multiplicative model whose propagated distribution is skewed to the right; central estimates and ensemble means are therefore not interchangeable and are reported as distinct quantities throughout. And its width, 776 , exceeds the full E1–E3 spread of the 2030 projection (745 ), which is why the uncertainty of the absolute level is reported here as an aggregate interval rather than superimposed on the scenario trajectories. The contraction metric itself has a median of 74.2% with a 95% credible interval of 68.9–79.1%. The variance decomposition assigns 78% of the variance to broilers and 9% to dairy cattle, converging with the tornado hierarchy. Because , and are propagated here—and were held fixed in preliminary formulations—the reported interval is wider than an interval restricted to conversion and recoverability parameters, and should be read as a more complete rather than a less precise characterization of the uncertainty.
3.7. Decomposition of the Contraction
The contraction arises from two multiplicative effects: the gap between the maximum IPCC yield and the realized yield, and recoverability. Because a sequential decomposition depends on the order in which the effects are applied, both orders are reported together with the symmetric Shapley attribution, which is order-independent and additive to 100% (Table 8).
Table 8.
Symmetric (Shapley) decomposition of the gap between the theoretical bound and the net mono-digestion potential. The two sequential paths are reported to make the path dependence explicit; only the Shapley shares are order-independent and therefore additive to 100%.
Recoverability accounts for 76.1% of the 5808 gap under H1 and 76.5% under H2, against 23.9% and 23.5% for conversion yield. The attribution is therefore stable both across yield hypotheses and across decomposition orders, which is a stronger statement than either sequential figure taken alone. Two consequences follow. First, the dimension introduced by this model is also the one carrying the greatest quantitative weight. Second, the two effects differ in policy character: the conversion ceiling is a biological constraint that is difficult to modify, whereas recoverability is a management variable—the confined fraction of each production system can be increased through formalization and handling infrastructure.
3.8. Avoided Greenhouse-Gas Emissions
Table 9 reports the greenhouse-gas balance of the recoverable stream.
Table 9.
Greenhouse-gas balance of the recoverable manure stream (base year 2024, hypothesis H1). Baseline and digester methane are computed with IPCC Equation 10.23 ( kg ), and (AR6). Negative values indicate that anaerobic digestion increases methane emissions relative to the current management system.
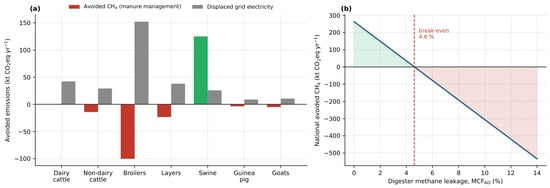
The national methane balance is −21.5 kt Ceq at the central digester leakage of 5.0%. The negative sign is not an artefact. For manure currently deposited on pasture or managed dry, the baseline methane conversion factor is 1–2%, so a digester leaking more than that increases methane emissions relative to the current system. The national break-even leakage is 4.6%, and the balance ranges from to kt Ceq across the IPCC leakage range for anaerobic digesters. Figure 11 shows the balance by category and its dependence on leakage.
Figure 11.
Greenhouse gas balance of anaerobic digestion deployment. (a) Avoided methane from manure management and displaced grid electricity by livestock category; the green bar highlights swine, the only category with a net positive avoided-C contribution, whereas red bars indicate net C penalties relative to baseline manure management. (b) National avoided C as a function of digester methane leakage, ; the blue line represents the national C balance, the green- and red-shaded areas denote the net climate-benefit and net climate-penalty regions, respectively, and the red dashed line marks the break-even leakage of 4.6%.
Figure 11a shows that the methane term is negative in six of the seven categories and positive only in swine, whereas the grid-displacement term is positive everywhere and largest where the recoverable energy is largest. Figure 11b shows that the sign of the national methane balance is governed by a single operational variable: the balance is positive below a leakage of 4.6% and negative above it, so the climate outcome of a digestion programme is decided by construction and maintenance quality rather than by the size of the resource.
The aggregate climate benefit therefore derives from the displacement of grid electricity (307 kt Ceq ), giving a net balance of 285 kt Ceq , and not from manure management.
The central result of this layer is that the energy and mitigation rankings dissociate. Broilers rank first by recoverable energy but last by avoided methane (−100 kt Ceq ), because their baseline management system is already a low emitter. Swine rank fourth by energy but first by mitigation ( kt Ceq ), and are the only category with an unambiguous climate benefit, because liquid slurry storage is the only baseline system emitting enough methane for anaerobic digestion to displace. A programme optimized for renewable electricity and a programme optimized for methane abatement would therefore target different categories, and a policy instrument rewarding both jointly must price them separately.
3.9. Positioning and System-Level Significance
Table 10 positions the model against an international panel of livestock manure biogas assessments.
Table 10.
Methodological positioning relative to an international panel of livestock-manure biogas potential assessments. No prior assessment treats recoverability as a time-dependent function while also reporting formal uncertainty management.
Across a panel spanning four continents, no previous assessment combines a time-dependent recoverability function with formal uncertainty management, and only a subset reports a greenhouse-gas balance; both gaps coincide with those identified by the systematic review of Tjutju et al. [37]. In quantitative terms the Peruvian net electrical potential (731 ) is of the same order of magnitude as the Ecuadorian (≈275 [17]) and Chilean (332–362 [18]) estimates; these differences mainly reflect national herd sizes rather than methodological differences, so the absolute comparison should be interpreted with caution. The assessments restricting the resource to confined manure already incorporate the first side of the temporal bias and avoid gross overestimation, but by doing so with a static factor they do not capture the second; the present model subsumes that static correction and extends it into a trajectory.
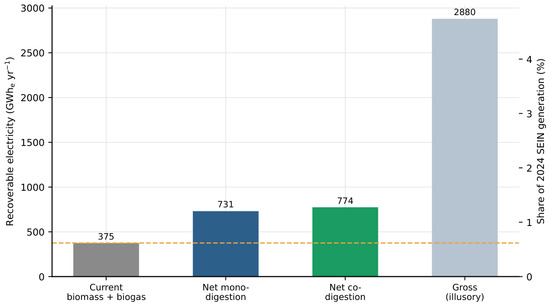
At the system level, the net electrical potential under mono-digestion represents approximately 1.2% of the 2024 output of the National Interconnected Electric System [73] and is approximately 1.9 times the bioelectricity currently dispatched from biomass and biogas [74]; modest in aggregate, but material as distributed generation in rural areas. Figure 12 places the recoverable potential in that context.
Figure 12.
Recoverable electricity from livestock manure relative to 2024 generation of the National Interconnected Electric System: currently dispatched bioelectricity and net potential under mono- and co-digestion. The right axis expresses the share of national generation; the dashed line marks the bioelectricity currently dispatched.
Since guinea pig manure represents 2.9% of the net total, it illustrates the limits of the co-digestion layer rather than an independent contribution. Its stream is intrinsically dispersed and its per-farm scale does not support a mesophilic plant with mechanical mixing and heating; the realistic technology is the low-cost tubular digester, whose psychrophilic operation at Andean altitude yields substantially less than the mesophilic assays on which the adopted BMP rests [27,28]. Its valorization as biochar and biofertilizer competes for the same substrate, so the bioenergy pathway does not have exclusive access to it. Treating it as one category among seven, rather than as a privileged resource, is consistent with the restriction logic of the model.
Regarding plant siting, Peru lacks georeferenced farm inventories, so the spatial analysis that would identify clusters suitable for shared plants is outside the scope of this work. The departmental concentration of technified poultry and swine production—the two categories whose scale supports viable plant sizes—is the practical entry point, and a full capital and operating cost assessment is a necessary complement to any potential estimate, building on the economic evaluation available for a small-scale plant in the Chillón Valley [33].
3.10. Action Plan
Three priorities follow directly from the results. First, the experimental characterization of the biochemical methane potential of Peruvian poultry manure, which the sensitivity analysis identifies as the highest-leverage parameter of the model. Second, the incorporation of the confined fraction per category as a variable of the National Agricultural Survey, which would allow to be calibrated against a real time series and convert the trajectory from a structured hypothesis into a validated model. Third, the reduction of digester methane leakage below the 4.6% break-even threshold, without which energy valorization produces no net climate benefit in manure management, however favourable its energy balance.
3.11. Limitations
The results depend on recoverability and conversion parameters ultimately constrained by the scarcity of national data at the production-system level; the most recent complete agricultural census dates from 2012, mitigated but not replaced by annual surveys; and guinea pig populations disperse across sources and are reported as a range. The guinea pig conversion parameters rely on the co-digestion literature and a single field system, so the mono-digestion yield inferred from the synergy ratio should be considered a first characterization subject to experimental confirmation, and the guinea pig figures read as an upper bound at farm scale. No IPCC category exists for guinea pigs, so the adopted is a rodent proxy and is declared as an assumption rather than a default value.
Climatic stratification is applied to the methane conversion factors of the greenhouse-gas layer, where temperature is the governing physical variable, but not to the whole energy cascade, because assigning populations to climatic zones without georeferenced inventories would narrow the intervals without adding information. The grid emission factor is a national average and does not capture the marginal generation displaced at each location. Finally, remains an exactly determined fit, and its empirical validation is the principal outstanding task identified above. The projected trajectories are likewise central estimates: they propagate the growth and confinement assumptions of each scenario but not the parametric uncertainty of the conversion coefficients, which is quantified separately as an interval on the aggregate level.
4. Conclusions
Treating recoverability as a continuous function of time corrects a structural bias of static inventories that operates in both temporal directions: they overstate the present resource, because the gross approach does not discount the fraction that can actually be harvested, and they understate the 2030 resource by 9.8% because they ignore the intensification of confinement. Neither term is accessible to a single-snapshot approach, since both arise from the same time-dependent parameter.
The resource is smaller than gross inventories suggest and the reason matters. The gross approach exceeds the recoverable resource by a factor of 3.94, and a symmetric decomposition attributes approximately three quarters of that gap to recoverability rather than to the conservatism of the conversion yields—an attribution stable across both yield hypotheses and both decomposition orders. This matters because recoverability, unlike the biological conversion ceiling, is a management variable: the same term that governs the size of the resource is also the lever through which public policy can expand it.
Which category deserves priority depends on the objective, and the two plausible objectives point in opposite directions. Under an energy criterion the answer is poultry, and broilers in particular, because near-complete confinement preserves most of their theoretical potential and because their methane potential is simultaneously the parameter carrying most of the model’s uncertainty. Under a mitigation criterion the answer is swine, the only category whose baseline management system—liquid slurry storage—emits enough methane for anaerobic digestion to displace, and therefore the only one with an unambiguous climate benefit. Broilers rank first by energy and last by mitigation. Recognizing that dissociation is, in policy terms, the most consequential result of this work: an instrument designed for renewable electricity and an instrument designed for methane abatement should not target the same farms.
The national net technical potential is 1975 under mono-digestion (731 ; 95% CI 1628–2404) and 2093 under co-digestion, equivalent to approximately 1.2% of national electricity generation but 1.9 times the bioelectricity currently dispatched: modest in aggregate, material as rural distributed generation. Whether that generation is also climate-positive is not guaranteed by the energy balance and depends on keeping digester leakage below 4.6%.
Supplementary Materials
The following supporting information can be downloaded at: https://www.mdpi.com/article/10.3390/environments13090479/s1: S1. Complete input dataset. S2. Uncertainty propagation. S3. Derivation of the base-year recoverability. S4. Computational reproducibility. Table S1: Complete input dataset by livestock category. Values are reported as minimum–mode–maximum. : reference population; : production cycle; : manure excretion rate; : volatile solids fraction; : maximum methane production capacity; : realized biochemical methane potential under hypothesis H1; , , : recoverability parameters of Equation (6); , : co-digestion parameters of Equation (7); : methane conversion factor of the current management system; Table S2: Monte Carlo specification. All distributions are triangular and supported on the minimum–mode–maximum triplets of Table S1. The last two columns identify which parameters were propagated in preliminary formulations and which are propagated here; Table S3: Derivation of the base-year recoverability factor from the structure of each production system.
Author Contributions
Conceptualization, Y.C.A. and R.J.B.; methodology, Y.C.A. and R.J.B.; software, Y.C.A., R.J.B., D.G.C.A. and J.A.C.G.; validation, Y.C.A., R.J.B., B.R.P. and G.M.C.L.; formal analysis, Y.C.A. and R.J.B.; investigation, Y.C.A., R.J.B., B.R.P., D.G.C.A. and J.A.C.G.; resources, Y.C.A., B.R.P. and G.M.C.L.; data curation, Y.C.A., R.J.B., D.G.C.A. and J.A.C.G.; writing—original draft preparation, Y.C.A. and R.J.B.; writing—review and editing, Y.C.A., R.J.B., B.R.P., D.G.C.A., J.A.C.G. and G.M.C.L.; visualization, Y.C.A., R.J.B., D.G.C.A. and J.A.C.G.; supervision, Y.C.A., R.J.B., B.R.P. and G.M.C.L.; project administration, Y.C.A. and R.J.B. All authors have read and agreed to the published version of the manuscript.
Funding
Esta investigación ha contado con el apoyo de la Universidad Peruana de Ciencias Aplicadas (UPC)/UPC-EXPOST-2026-2 (Fondo Interno).
Institutional Review Board Statement
Not applicable.
Informed Consent Statement
Not applicable.
Data Availability Statement
The complete input dataset is provided in Tables S1 and S2. The computational core reproducing every table and figure is openly available; further inquiries can be directed to the corresponding authors.
Acknowledgments
A la Dirección de Investigación de la Universidad Peruana de Ciencias Aplicadas por el apoyo bridado para realización de este trabajo de investigación a través del incentivo UPC-EXPOST-2026-2 (Fondo Interno).
Conflicts of Interest
The authors declare no conflicts of interest.
Nomenclature and Abbreviations
Nomenclature
| animal-days for category s in year t [d ] | |
| ultimate methane production capacity [ C kg , at 20 °C, 1 atm] | |
| realized biochemical methane potential [ C kg , at 20 °C, 1 atm] | |
| daily manure excretion rate [kg ] | |
| theoretical (gross) energy potential [ ] | |
| net technical potential, {mono, co} [ ] | |
| electrical generation [ ] | |
| grid emission factor [kg Ceq ] | |
| global warming potential, 100-year horizon [–] | |
| recoverability transition rate [] | |
| lower heating value of methane [MJ , at 20 °C, 1 atm] | |
| methane conversion factor of the current management system [–] | |
| methane conversion factor of the digester (leakage) [–] | |
| annual mass of fresh manure [kg ] | |
| annual placements or standing population [head] | |
| annual volatile solids production [kg VS ] | |
| co-digestion methane yield synergy ratio [–] | |
| manure recoverability factor [–] |
Abbreviations
| relative co-digestion gain [%] | |
| ratio [–] | |
| electrical conversion efficiency [–] | |
| volatile solids fraction of fresh manure [kg VS ] | |
| methane density [kg , at 20 °C, 1 atm] | |
| production cycle length [d] | |
| co-located fraction of recoverable manure [–] |
References
- Castillo Alvarez, Y.; Jiménez Borges, R.; Alfonso-Francia, G.; Rodríguez Pérez, B.; Patiño Vidal, C.D.; Iturralde Carrera, L.A.; Rodríguez-Reséndiz, J. Transition to a Circular Bioeconomy in the Sugar Agro-Industry: Predictive Modeling to Estimate the Energy Potential of By-Products. Technologies 2025, 13, 238. [Google Scholar] [CrossRef] [Scilit]
- Sadeghpour, A.; Afshar, R.K. Livestock manure: From waste to resource in a circular economy. J. Agric. Food Res. 2024, 17, 101255. [Google Scholar] [CrossRef] [Scilit]
- Koul, B.; Yakoob, M.; Shah, M.P. Agricultural waste management strategies for environmental sustainability. Environ. Res. 2022, 206, 112285. [Google Scholar] [CrossRef] [Scilit] [PubMed]
- IPCC. Emissions from Livestock and Manure Management. In 2019 Refinement to the 2006 IPCC Guidelines for National Greenhouse Gas Inventories; Chapter 10; Technical Report; Intergovernmental Panel on Climate Change: Geneva, Switzerland, 2019; Volume 4. [Google Scholar]
- Qi, J.; Yang, H.; Wang, X.; Zhu, H.; Wang, Z.; Zhao, C.; Liu, Z. State-of-the-art on animal manure pollution control and resource utilization. J. Environ. Chem. Eng. 2023, 11, 110462. [Google Scholar] [CrossRef] [Scilit]
- Zhang, C.; Su, H.; Baeyens, J.; Tan, T. Reviewing the anaerobic digestion of food waste for biogas production. Renew. Sustain. Energy Rev. 2014, 38, 383–392. [Google Scholar] [CrossRef] [Scilit]
- Neri, A.; Bernardi, B.; Zimbalatti, G.; Benalia, S. An Overview of Anaerobic Digestion of Agricultural By-Products and Food Waste for Biomethane Production. Energies 2023, 16, 6851. [Google Scholar] [CrossRef] [Scilit]
- Inga Nuñez, T.M.; Perez Navarro, A.; Pongo Vera, K.S.; Canales Guerra, V.N. Performance of Biogas from Cattle Manure in the Energy Consumption of a House. In Proceedings of the 8th International Conference on Energy and Environmental Science (ICEES 2024); Environmental Science and Engineering; Springer: Cham, Switzerland, 2024; pp. 683–694. [Google Scholar] [CrossRef] [Scilit]
- Alvarez, R.; Villca, S.; Lidén, G. Biogas production from llama and cow manure at high altitude. Biomass Bioenergy 2006, 30, 66–75. [Google Scholar] [CrossRef] [Scilit]
- Ferrer, I.; Garfí, M.; Uggetti, E.; Ferrer-Martí, L.; Calderon, A.; Velo, E. Biogas production in low-cost household digesters at the Peruvian Andes. Biomass Bioenergy 2011, 35, 1668–1674. [Google Scholar] [CrossRef] [Scilit]
- Ministerio de Desarrollo Agrario y Riego. Valor Bruto de la Producción Agropecuaria y Avícola del Perú; Technical Report; Ministerio de Desarrollo Agrario y Riego: Lima, Perú, 2024.
- Ministerio de Desarrollo Agrario y Riego. Población de Ganado Vacuno y Vacas en Ordeño del Perú; Technical Report; SIEA-Ministerio de Desarrollo Agrario y Riego: Lima, Perú, 2024.
- Ministerio de Desarrollo Agrario y Riego. Estadísticas de Producción Porcina del Perú; Technical Report; SIEA-Ministerio de Desarrollo Agrario y Riego: Lima, Perú, 2025.
- Instituto Nacional de Estadística e Informática. Encuesta Nacional Agropecuaria (ENA): Población de Cuy; Technical Report; Instituto Nacional de Estadística e Informática/MIDAGRI: Lima, Perú, 2017.
- Ministerio de Desarrollo Agrario y Riego. Compendio Anual de Producción Ganadera y Avícola; Technical Report; SIEA-Ministerio de Desarrollo Agrario y Riego: Lima, Perú, 2023.
- Reyes, J.M.; Barrenechea Ramirez, S. Estimación del potencial energético técnico a partir de biomasa residual agroindustrial y pecuario en el Perú. Rev. Innov. Transf. Product. 2022, 3, e004. [Google Scholar] [CrossRef] [Scilit]
- Cornejo, C.; Wilkie, A.C. Greenhouse gas emissions and biogas potential from livestock in Ecuador. Energy Sustain. Dev. 2010, 14, 256–266. [Google Scholar] [CrossRef] [Scilit]
- Bidart, C.; Fröhling, M.; Schultmann, F. Livestock manure and crop residue for energy generation: Macro-assessment at a national scale. Renew. Sustain. Energy Rev. 2014, 38, 537–550. [Google Scholar] [CrossRef] [Scilit]
- Scarlat, N.; Fahl, F.; Dallemand, J.F.; Monforti, F.; Motola, V. A spatial analysis of biogas potential from manure in Europe. Renew. Sustain. Energy Rev. 2018, 94, 915–930. [Google Scholar] [CrossRef] [Scilit]
- Sefeedpari, P.; Pudełko, R.; Jędrejek, A.; Kozak, M.; Borzęcka, M. To What Extent Is Manure Produced, Distributed, and Potentially Available for Bioenergy? A Step toward Stimulating Circular Bio-Economy in Poland. Energies 2020, 13, 6266. [Google Scholar] [CrossRef] [Scilit]
- International Renewable Energy Agency. Agricultural Residue-Based Bioenergy: Regional Potential and Scale-Up Strategies; Technical Report; International Renewable Energy Agency: Abu Dhabi, United Arab Emirates, 2023. [Google Scholar]
- Nehra, M.; Jain, S. Estimation of renewable biogas energy potential from livestock manure: A case study of India. Bioresour. Technol. Rep. 2023, 22, 101432. [Google Scholar] [CrossRef] [Scilit]
- Suberu, M.Y.; Bashir, N.; Mustafa, M.W. Biogenic waste methane emissions and methane optimization for bioelectricity in Nigeria. Renew. Sustain. Energy Rev. 2013, 25, 643–654. [Google Scholar] [CrossRef] [Scilit]
- Tsai, W.T.; Lin, C.I. Overview analysis of bioenergy from livestock manure management in Taiwan. Renew. Sustain. Energy Rev. 2009, 13, 2682–2688. [Google Scholar] [CrossRef] [Scilit]
- Meneses Quelal, W.O.; Velázquez-Martí, B.; Gaibor Chávez, J.; Niño Ruiz, Z.; Ferrer Gisbert, A. Evaluation of methane production from the anaerobic co-digestion of manure of guinea pig with lignocellulosic Andean residues. Environ. Sci. Pollut. Res. 2022, 29, 2227–2243. [Google Scholar] [CrossRef] [Scilit] [PubMed]
- Meneses-Quelal, O.; Velázquez-Martí, B.; Gaibor-Chávez, J.; Niño Ruiz, Z. Effect of the co-digestion of agricultural lignocellulosic residues with manure from South American camelids. Biofuels Bioprod. Biorefining 2021, 15, 525–544. [Google Scholar] [CrossRef] [Scilit]
- Garfí, M.; Ferrer-Martí, L.; Villegas, V.; Ferrer, I. Psychrophilic anaerobic digestion of guinea pig manure in low-cost tubular digesters at high altitude. Bioresour. Technol. 2011, 102, 6356–6359. [Google Scholar] [CrossRef] [Scilit] [PubMed]
- Garfí, M.; Ferrer-Martí, L.; Perez, I.; Flotats, X.; Ferrer, I. Codigestion of cow and guinea pig manure in low-cost tubular digesters at high altitude. Ecol. Eng. 2011, 37, 2066–2070. [Google Scholar] [CrossRef] [Scilit]
- Felipe-Morales, C.; Moreno, U. Biogas production with guinea pig manure. LEISA Mag. 2005, 21, 16–17. [Google Scholar]
- Palacios Toribio, L.K.; Obregón Castro, G.; Valverde Flores, J.W.; Castañeda Olivera, C.A.; Benites Alfaro, E.G. Calorific Value of Biogas Obtained by Cavia porcellus Biomass. Chem. Eng. Trans. 2020, 80, 271–276. [Google Scholar] [CrossRef] [Scilit]
- Castillo Cotrina, D.; Tito Vargas, C. Obtención de biogás a partir de excremento de cuy en condiciones ambientales en Tacna, Perú. Rev. Cienc. Desarro. 2011, 13, 84–91. [Google Scholar]
- Castillo Alvarez, Y.; Jiménez Borges, R.; Patiño Vidal, C.D.; Carhuancho Leon, F.M.; Pinares Buendia, J.S.; Samaniego Nolasco, J.A. Design Improvements and Best Practices in Small-Scale Biodigesters for Sustainable Biogas Production: A Case Study in the Chillón Valley, Perú. Energies 2025, 18, 338. [Google Scholar] [CrossRef] [Scilit]
- Buendia, P.; Santos, J.; Nolasco, S.; Alberto, J.; Vidal, P.; Diego, C.; Leon, C.; Mabel, F.; Rodríguez, B.R.; Borges, R.J.; et al. Economic and Environmental Evaluation of a Small-Scale Biogas Plant: Case Study in the Chillón Valley, Peru. In Proceedings of the 23rd LACCEI International Multi-Conference for Engineering, Education and Technology, Mexico City, Mexico, 16–18 July 2025. [Google Scholar] [CrossRef] [Scilit]
- Alvarez, D.G.C.; García, J.A.C.; Alvarez, Y.C.; Borges, R.J. Sustainable Valorization of Bovine–Guinea Pig Waste: Co-Optimization of pH and EC in Biodigesters. Recycling 2025, 10, 190. [Google Scholar] [CrossRef] [Scilit]
- Castillo Alvarez, Y.; Monteagudo Yanes, J.P.; Jiménez Borges, R.; Patiño Vidal, C.D. Propuesta de diseño de un biodigestor industrial de cachaza para la generación de energía eléctrica. Rev. Univ. Soc. 2021, 13, 416–424. [Google Scholar]
- Gómez Montoya, J.P.; Castillo Alvarez, Y.; De Magalhães, R.F.; Lermen, F.H. A thermo-economic analysis of a circular economy model for biomass in South America producing biofertilizers and biogas from municipal solid waste. Renew. Energy 2024, 225, 120254. [Google Scholar] [CrossRef] [Scilit]
- Tjutju, N.A.S.; Ammenberg, J.; Lindfors, A. Biogas potential studies: A review of their scope, approach, and relevance. Renew. Sustain. Energy Rev. 2024, 201, 114631. [Google Scholar] [CrossRef] [Scilit]
- Steindl, M.; Venus, T.J.; Koch, K. A new framework for the technical biogas potential: Concept design, method development, and analytical application in a case study from Germany. Renew. Sustain. Energy Rev. 2025, 216, 115645. [Google Scholar] [CrossRef] [Scilit]
- Einarsson, R.; Persson, U.M. Analyzing key constraints to biogas production from crop residues and manure in the EU—A spatially explicit model. PLoS ONE 2017, 12, e0171001. [Google Scholar] [CrossRef] [Scilit] [PubMed]
- Asociación Peruana de Avicultur. Colocación de Pollos BB en el Perú (Boletín Estadístico Avícola); Technical Report; Asociación Peruana de Avicultura/MIDAGRI: Lima, Perú, 2023. [Google Scholar]
- Ministerio de Desarrollo Agrario y Riego. Población de Gallinas de Postura del Perú; Technical Report; MIDAGRI/Asociación Peruana de Avicultura: Lima, Perú, 2023.
- University of Maryland Extension. Manure Production Rates; Technical Report; Agricultural Nutrient Management Program; University of Maryland Extension: College Park, MD, USA, 2018. [Google Scholar]
- Clemson University Cooperative Extension. Swine Manure Production and Nutrient Content (Confined Animal Manure Managers Program); Technical Report; Clemson University: Clemson, SC, USA, 2003. [Google Scholar]
- Miller, R. How Much Manure Will My Animals Produce? Technical Report; Utah State University Extension: Logan, UT, USA, 2015. [Google Scholar]
- Murray-Núñez, R.; Orozco-Benítez, G.; Martínez-Orozco, S.; Ávila-Ramos, F.; Bautista-Trujillo, G.; Carmona-Gasca, C.; Martínez-González, S. Composición química de excremento entero, composta y lixiviado de la cama de cuyes (Cavia porcellus). Abanico Agrofor. 2023, 5, e2022-12. [Google Scholar] [CrossRef] [Scilit]
- Ogejo, J.A.; Wildeus, S.; Knight, P.; Wilke, R.B. Estimating Goat and Sheep Manure Production and Their Nutrient Contribution in the Chesapeake Bay Watershed. Appl. Eng. Agric. 2010, 26, 1061–1065. [Google Scholar] [CrossRef] [Scilit]
- Owen, W.F.; Stuckey, D.C.; Healy, J.B.; Young, L.Y.; McCarty, P.L. Bioassay for monitoring biochemical methane potential and anaerobic toxicity. Water Res. 1979, 13, 485–492. [Google Scholar] [CrossRef] [Scilit]
- Angelidaki, I.; Alves, M.; Bolzonella, D.; Borzacconi, L.; Campos, J.L.; Guwy, A.J.; Kalyuzhnyi, S.; Jenicek, P.; van Lier, J.B. Defining the biomethane potential (BMP) of solid organic wastes and energy crops: A proposed protocol for batch assays. Water Sci. Technol. 2009, 59, 927–934. [Google Scholar] [CrossRef] [Scilit] [PubMed]
- Holliger, C.; Alves, M.; Andrade, D.; Angelidaki, I.; Astals, S.; Baier, U.; Bougrier, C.; Buffière, P.; Carballa, M.; de Wilde, V.; et al. Towards a standardization of biomethane potential tests. Water Sci. Technol. 2016, 74, 2515–2522. [Google Scholar] [CrossRef] [Scilit] [PubMed]
- Verein Deutscher Ingenieure. VDI 4630: Fermentation of Organic Materials—Characterisation of the Substrate, Sampling, Collection of Material Data, Fermentation Tests; Technical Report; Verein Deutscher Ingenieure: Düsseldorf, Germany, 2016. [Google Scholar]
- Symons, G.E.; Buswell, A.M. The methane fermentation of carbohydrates. J. Am. Chem. Soc. 1933, 55, 2028–2036. [Google Scholar] [CrossRef] [Scilit]
- Angelidaki, I.; Sanders, W. Assessment of the anaerobic biodegradability of macropollutants. Rev. Environ. Sci. Bio/Technol. 2004, 3, 117–129. [Google Scholar] [CrossRef] [Scilit]
- IPCC. Good Practice Guidance and Uncertainty Management in National Greenhouse Gas Inventories: CH4 Emissions from Animal Manure; Technical Report; Intergovernmental Panel on Climate Change: Geneva, Switzerland; Available online: https://www.ipcc-nggip.iges.or.jp/public/gp/english/ (accessed on 16 August 2026).
- Kafle, G.K.; Chen, L. Comparison on batch anaerobic digestion of five different livestock manures and prediction of biochemical methane potential (BMP) using different statistical models. Waste Manag. 2016, 48, 492–502. [Google Scholar] [CrossRef] [Scilit] [PubMed]
- Wijaya, A.S.; Jariyaboon, R.; Reungsang, A.; Kongjan, P. Biochemical Methane Potential (BMP) of Cattle Manure, Chicken Manure, Rice Straw, and Hornwort in Mesophilic Mono-digestion. Int. J. Integr. Eng. 2020, 12, 1–8. [Google Scholar]
- Ma, G.; Neibergs, J.S.; Harrison, J.H.; Whitefield, E.M. Methane yields during anaerobic co-digestion of animal manure with other feedstocks: A meta-analysis. Sci. Total Environ. 2020, 728, 138224. [Google Scholar] [CrossRef] [Scilit] [PubMed]
- Sun, C.; Cao, W.; Liu, R. Kinetics of methane production from swine manure and buffalo manure. Appl. Biochem. Biotechnol. 2015, 177, 985–995. [Google Scholar] [CrossRef] [Scilit] [PubMed]
- Astals, S.; Nolla-Ardèvol, V.; Mata-Alvarez, J. Anaerobic co-digestion of pig manure and crude glycerol at mesophilic conditions: Biogas and digestate. Bioresour. Technol. 2012, 110, 63–70. [Google Scholar] [CrossRef] [Scilit] [PubMed]
- Zhang, W.; Wei, Q.; Wu, S.; Qi, D.; Li, W.; Zuo, Z.; Dong, R. Batch anaerobic co-digestion of pig manure with dewatered sewage sludge under mesophilic conditions. Appl. Energy 2014, 128, 175–183. [Google Scholar] [CrossRef] [Scilit]
- Rubežius, M.; Bleizgys, R.; Venslauskas, K.; Navickas, K. Influence of biological pretreatment of poultry manure on biochemical methane potential and ammonia emission. Biomass Bioenergy 2020, 142, 105815. [Google Scholar] [CrossRef] [Scilit]
- Fuchs, W.; Wang, X.; Gabauer, W.; Ortner, M.; Li, Z. Tackling ammonia inhibition for efficient biogas production from chicken manure: Status and technical trends in Europe and China. Renew. Sustain. Energy Rev. 2018, 97, 186–199. [Google Scholar] [CrossRef] [Scilit]
- Sakar, S.; Yetilmezsoy, K.; Kocak, E. Anaerobic digestion technology in poultry and livestock waste treatment—A literature review. Waste Manag. Res. 2009, 27, 3–18. [Google Scholar] [CrossRef] [Scilit] [PubMed]
- Cu, T.T.T.; Nguyen, T.X.; Triolo, J.M.; Pedersen, L.; Le, V.D.; Le, P.D.; Sommer, S.G. Biogas production from Vietnamese animal manure, plant residues and organic waste: Influence of biomass composition on methane yield. Asian-Australas. J. Anim. Sci. 2015, 28, 280–289. [Google Scholar] [CrossRef] [Scilit] [PubMed]
- Zhang, T.; Liu, L.; Song, Z.; Ren, G.; Feng, Y.; Han, X.; Yang, G. Biogas production by co-digestion of goat manure with three crop residues. PLoS ONE 2013, 8, e66845. [Google Scholar] [CrossRef] [Scilit] [PubMed]
- Li, W.; Siddhu, M.A.H.; Amin, F.R.; He, Y.; Zhang, R.; Liu, G.; Chen, C. Methane production through anaerobic co-digestion of sheep dung and waste paper. Energy Convers. Manag. 2018, 156, 279–287. [Google Scholar] [CrossRef] [Scilit]
- Triolo, J.M.; Sommer, S.G.; Møller, H.B.; Weisbjerg, M.R.; Jiang, X.Y. A new algorithm to characterize biodegradability of biomass during anaerobic digestion: Influence of lignin concentration on methane production potential. Bioresour. Technol. 2011, 102, 9395–9402. [Google Scholar] [CrossRef] [Scilit] [PubMed]
- González, R.; Blanco, D.; García Cascallana, J.; Carrillo-Peña, D.; Gómez, X. Anaerobic Co-Digestion of Sheep Manure and Waste from a Potato Processing Factory: Techno-Economic Analysis. Fermentation 2021, 7, 235. [Google Scholar] [CrossRef] [Scilit]
- Baek, G.; Kim, D.; Kim, J.; Kim, H.; Lee, C. Treatment of Cattle Manure by Anaerobic Co-Digestion with Food Waste and Pig Manure: Methane Yield and Synergistic Effect. Int. J. Environ. Res. Public Health 2020, 17, 4737. [Google Scholar] [CrossRef] [Scilit] [PubMed]
- Zhang, Y.; Jiang, Y.; Wang, S.; Wang, Z.; Liu, Y.; Hu, Z.; Zhan, X. Environmental sustainability assessment of pig manure mono- and co-digestion and dynamic land application of the digestate. Renew. Sustain. Energy Rev. 2021, 137, 110476. [Google Scholar] [CrossRef] [Scilit]
- Manthos, G.; Dareioti, M.A.; Zagklis, D.; Kornaros, M. Using biochemical methane potential results for the economic optimization of continuous anaerobic digestion systems: The effect of substrates’ synergy. Renew. Energy 2023, 211, 296–306. [Google Scholar] [CrossRef] [Scilit]
- Meneses-Quelal, O.; Velázquez-Martí, B. Pretreatment of Animal Manure Biomass to Improve Biogas Production: A Review. Energies 2020, 13, 3573. [Google Scholar] [CrossRef] [Scilit]
- Xi, Y.; Chang, Z.; Ye, X.; Xu, R.; Du, J.; Chen, G. Methane production from wheat straw with anaerobic sludge by heme supplementation. Bioresour. Technol. 2014, 172, 91–96. [Google Scholar] [CrossRef] [Scilit] [PubMed]
- Organismo Supervisor de la Inversión en Energía y Minería. Generación de Energía Eléctrica en el SEIN: Producción Anual 2024; Technical Report; Organismo Supervisor de la Inversión en Energía y Minería: Lima, Perú, 2025.
- Centro Nacional de Planeamiento Estratégico. Observatorio Nacional de Prospectiva: Producción de Energía Eléctrica Con Recursos Energéticos Renovables por Tipo, 2014–2024; Centro Nacional de Planeamiento Estratégico: Lima, Peru, 2025.

Disclaimer/Publisher’s Note: The statements, opinions and data contained in all publications are solely those of the individual author(s) and contributor(s) and not of MDPI and/or the editor(s). MDPI and/or the editor(s) disclaim responsibility for any injury to people or property resulting from any ideas, methods, instructions or products referred to in the content. |
© 2026 by the authors. Licensee MDPI, Basel, Switzerland. This article is an open access article distributed under the terms and conditions of the Creative Commons Attribution (CC BY) license.