


Abstract
Grazing management strongly influences soil organic carbon (SOC) dynamics, yet existing versions of the widely used DayCent model represent grazing effects largely through biomass removal and manure return, without explicitly simulating post-grazing vegetation regrowth or trampling-driven redistribution of organic matter. To address this limitation, DayCent-IGM (Improved Grazing Module) was developed by incorporating two additional processes: climate- and residual biomass-constrained post-grazing regrowth and trampling-driven redistribution of biomass and litter into soil pools. Model performance was evaluated using SOC stocks and treatment-based SOC change rates from 18 grazing experiment sites. Compared with the original DayCent, DayCent-IGM improved simulations of both SOC stocks and change rates. For SOC change rates, RMSE decreased from 0.688 to 0.419 Mg C ha−1 yr−1, bias improved from −0.081 to −0.001 Mg C ha−1 yr−1, and simulated mean SOC change rates closely matched observations (0.099 vs. 0.100 Mg C ha−1 yr−1, simulated vs. observed), whereas DayCent underestimated the mean rate (0.019 Mg C ha−1 yr−1). These results demonstrate that explicit representation of grazing disturbance–recovery processes improves simulation of management-driven SOC responses. Because DayCent-IGM requires no additional inputs beyond standard DayCent data, it provides a practical framework for SOC modeling in grazing ecosystems.
1. Introduction
Soils constitute the largest terrestrial pool of organic carbon, storing more carbon than vegetation and the atmosphere combined [1,2]. Historical agricultural land use, including cropland expansion and grazing, has contributed to widespread losses of soil organic carbon (SOC) globally [3,4,5,6,7]. Restoring depleted SOC stocks has emerged as an important nature-based solution for climate-change mitigation by enhancing soil carbon sequestration, increasing terrestrial carbon storage, and contributing to atmospheric carbon dioxide (CO2) removal [8,9,10,11,12]. Because SOC dynamics arise from complex interactions among vegetation, soil properties, climate, and management practices, process-based ecosystem models are widely used to evaluate SOC responses to land management and to support greenhouse-gas accounting, climate mitigation assessments, land-management decision making, and carbon credit quantification [13,14,15,16]. Emerging soil carbon credit markets depend on accurate quantification of SOC change to translate management-driven sequestration into verifiable, tradeable climate mitigation outcomes [15,17,18,19,20].
Grazed ecosystems are particularly important in this context. Grasslands occupy approximately 40% of the Earth’s land surface and represent a major terrestrial SOC reservoir, with grazing management strongly influencing soil carbon dynamics [21,22]. Grazing management can affect SOC through changes in plant productivity, carbon allocation, litter inputs, nutrient cycling, and soil disturbance [22,23,24]. Recovery periods following grazing may stimulate plant regrowth and belowground carbon inputs, while trampling can alter litter incorporation and nutrient redistribution [25,26,27]. Reported SOC responses to grazing vary considerably across management systems and environmental conditions, highlighting the importance of accurately representing grazing-related processes when simulating SOC dynamics [25,27,28,29]. Consequently, accurate representation of grazing disturbance–recovery processes is important for evaluating grazing-based climate mitigation strategies and SOC sequestration potential.
A variety of process-based models have been used to simulate SOC dynamics in grassland and grazing systems, including CENTURY/DayCent [30], RothC [31], ECOSSE [32], DNDC [33], SNAPGRAZE [34], and MEMS 2 [35]. These models have been applied to grazing-system assessment, greenhouse-gas inventories, and soil carbon-accounting applications [15,34,36,37,38,39]. Although they differ in complexity and process representation, grazing is typically simulated through biomass removal, nutrient return, and management modifiers. However, this representation does not explicitly account for post-grazing vegetation regrowth or trampling-driven incorporation of plant material into the soil, both of which can influence carbon inputs and SOC dynamics in grazed ecosystems [40,41]. Recent field evidence further indicates that combined grazing disturbances—including trampling and excretal (dung and urine) inputs—can alter SOC storage across soil aggregate fractions in grazed grassland ecosystems [27]. Consequently, grazing disturbance and recovery processes are often represented only indirectly or in simplified form [29,30,31,32,33], limiting the ability of models to simulate SOC responses to grazing management.
DayCent is particularly well suited for targeted model development because it includes detailed plant–soil carbon and nutrient cycling and has been widely used for SOC and greenhouse-gas assessments in managed ecosystems [42,43,44]. In the current DayCent framework, grazing is simulated primarily through aboveground biomass removal and associated nutrient returns, whereas post-grazing recovery and trampling-driven redistribution of organic matter are not explicitly represented [30,45]. These processes can influence plant productivity, belowground carbon inputs, litter incorporation, and ultimately SOC accumulation [21,22,23,25], representing a specific source of uncertainty in simulations of grazing-management impacts.
To address this limitation, we developed DayCent-IGM (Improved Grazing Module), a targeted extension of DayCent that incorporates post-grazing regrowth and trampling-driven redistribution of organic matter while maintaining compatibility with commonly available soil, climate, and management inputs. The objectives of this study were to (i) develop and implement these grazing-related processes within DayCent; (ii) evaluate their influence on simulated SOC dynamics through parameter sensitivity analysis; (iii) calibrate and validate DayCent and DayCent-IGM using grazing studies with repeated SOC measurements under a site-level cross-validation framework; and (iv) assess whether the new model structure improves simulation of SOC stocks and SOC change, the latter being particularly relevant to carbon crediting since credits are issued based on stock change rather than absolute stocks [17]. The results indicate that explicit representation of grazing disturbance–recovery processes improves agreement with observed SOC dynamics relative to the original DayCent model within the validation domain represented by the available datasets, highlighting the importance of these mechanisms for modeling SOC responses to grazing management.
2. Materials and Methods
The workflow consisted of five main steps: (i) implementing the regrowth and trampling components in DayCent-IGM; (ii) compiling literature-derived grazing experiments with repeated SOC measurements and sufficient soil, climate, and management information for DayCent setup; (iii) initializing SOC pools using measured SOC stocks; (iv) conducting sensitivity analysis for DayCent and DayCent-IGM; and (v) calibrating and validating both models using site-level k-fold cross-validation. The same site inputs, weather data, calibration folds, calibration objective function, and evaluation framework were used for both models to support direct comparison between model structures.
2.1. DayCent Model
DayCent is a process-based biogeochemical model that simulates daily plant growth, soil organic matter (SOM) dynamics, nutrient cycling (C, N, P, and S), and soil trace-gas emissions (CO2, N2O, and CH4) [30,46]. The model has been widely applied to agricultural and grassland ecosystems and is used to support greenhouse-gas inventory reporting and carbon-accounting applications [15,47].
Vegetation growth in DayCent is regulated by climate, soil properties, water availability, nutrient dynamics, and management activities. The version used in this study was developed from DDCentEVI (Copyright 2022 Colorado State University, Fort Collins, CO 80523 USA). The SOM submodel simulates carbon dynamics within surface litter and SOM pools distributed through a layered soil profile. Organic matter is partitioned into active, slow, and passive pools that differ in turnover rates and receive inputs from above- and below-ground plant material. Decomposition rates are modified by environmental conditions, including soil temperature and moisture [45].
In the standard DayCent grazing module, grazing events are represented through removal of aboveground biomass and return of nutrients and organic matter via animal excreta. Grazing effects on plant production are controlled using the GRZEFF parameter, which specifies alternative plant production responses to grazing. By default, a grazing event is simulated over a 30-day period, with the specified effects distributed evenly across days. Detailed descriptions of DayCent model structure and processes are provided by Hartman et al. [45].
2.2. Grazing Regrowth and Trampling Representation in DayCent-IGM
DayCent-IGM extends the grazing representation in DayCent by incorporating explicit modules for post-grazing vegetation recovery and trampling-driven redistribution of organic matter (Figure 1). In the original DayCent framework, grazing effects on plant production are represented through predefined functional responses applied during grazing events. Although this approach accounts for biomass removal and nutrient return, explicit representation of post-grazing recovery and trampling processes is limited. DayCent-IGM was developed to address these limitations while maintaining compatibility with existing DayCent inputs, schedule files, and simulation workflows.
Figure 1.
Conceptual representation of the original DayCent grazing framework and added DayCent-IGM pathways. DayCent-IGM adds modules for post-grazing regrowth and trampling-driven redistribution of biomass and litter.
2.2.1. Regrowth Algorithm
DayCent-IGM retains the original DayCent grazing representation, including biomass removal, nutrient return through feces and urine, and existing grazing-related production response options. An additional regrowth module modifies plant production following grazing based on three controls that are widely recognized as important determinants of pasture recovery: (i) rest duration following grazing, (ii) residual live biomass remaining after grazing, and (iii) thermal conditions represented by growing degree days (GDD).
These factors are consistent with experimental evidence demonstrating that post-grazing recovery is governed by the interaction among defoliation severity, recovery duration, and environmental conditions [40,48]. By incorporating these controls, DayCent-IGM can represent a range of recovery trajectories associated with different grazing-management strategies. The regrowth response is represented by a nonlinear multiplier () for above-ground production ():
where is the maximum regrowth multiplier (e.g., 2.0), representing the upper limit of regrowth enhancement under ideal conditions. The literature suggests values typically range from 1.5 to 2.5 for well-managed pastures [40]. is the slope parameter of the sigmoid response curve and determines how rapidly the regrowth response approaches its maximum. This parameter may be calibrated or informed by empirical studies; a reasonable starting range is 0.2–0.5, with higher values producing a steeper response curve. restcnt represents the number of days since the last grazing event, incremented by one for each day without an active grazing event. The counter begins when grazing explicitly stops or after the default 30-day grazing period ends; if a new grazing event begins before this occurs, the new event supersedes the prior one, and the counter does not begin until grazing itself ceases with no subsequent event replacing it. is the midpoint of the sigmoid response (in rest days), representing the rest duration required to reach 50% of the maximum regrowth response. Lower values correspond to rapid recovery following grazing, whereas higher values represent slower recovery under less favorable growing conditions. For sensitivity analysis, candidate values spanning 3–50 days were evaluated to encompass a broad range of recovery periods reported across grazing systems, management intensities, and environmental conditions [49]. represents cumulative growing degree days (°C) accumulated since the last grazing event. The residual biomass modifier is defined as follows:
where controls the influence of residual biomass on regrowth and determines the maximum proportional increase in the residual biomass modifier. Experimental studies indicate that moderate defoliation may stimulate compensatory regrowth under favorable conditions, whereas severe biomass removal can suppress regrowth by reducing remaining photosynthetic tissue and stored reserves [50]. In this study, was fixed at 0.3, representing a moderate residual biomass response. is the estimated residual live aboveground biomass after grazing. The parameter and represent the threshold and optimal residual biomass levels, respectively. is the minimum residual biomass required to avoid regrowth suppression, while represents the residual biomass level above which the residual biomass effect reaches its maximum. Based on reported residual biomass levels in grazing studies, was set to 50 g C m−2, and was set to 300 g C m−2, representing moderate-to-high residual biomass in temperate pasture systems [49]. The term is the stored value of the most recent non-zero , retained during the rest period. In DayCent, is defined as the fraction of live shoots removed over a nominal 30-day grazing period, reflecting the monthly legacy structure of CENTURY/DayCent. Therefore, is used as an approximate daily removal fraction when estimating residual live aboveground biomass. The nested function bounds the residual biomass response between 0 and 1, preventing negative effects below and unrealistic increases above . Together, rest duration, residual biomass, and thermal conditions represent key ecological controls on pasture recovery by capturing grazing intensity, recovery time, and climatic growth potential. In addition to affecting plant regrowth, grazing animals influence ecosystem carbon cycling through physical disturbance and biomass redistribution. To represent these effects, DayCent-IGM includes a trampling component.
2.2.2. Trampling Effects
To represent physical disturbance caused by grazing animals, a trampling component was introduced as part of the DayCent-IGM extension (Figure 1). The trampling component redistributes organic matter among ecosystem pools through two pathways: transferring a fraction of aboveground live biomass to surface litter and incorporating a fraction of surface litter into the topsoil layer. This representation is supported by field and experimental evidence for both pathways: trampling has been shown to reduce standing live biomass while fragmenting plant material into litter [51], and physical incorporation of litter into soil has been shown to promote microbial assimilation and stabilization of litter-derived carbon in mineral-associated and particulate organic matter pools [41]. The fractions transferred are calculated as functions of grazing intensity:
where is the fraction of aboveground live biomass transferred to surface litter, is the fraction of surface litter incorporated into the topsoil layer, flgrem is the fraction of live shoots removed during grazing, and c1 and c2 are multiplicative coefficients controlling the magnitude of the trampling effect.
2.2.3. Basis for Fixed IGM Parameter Values
The five IGM-specific parameters were assigned fixed values informed by published grazing and defoliation literature rather than calibrated, because the validation datasets did not include the direct process measurements (e.g., repeated residual-biomass sampling, regrowth rates, or trampling-incorporation rates) needed to constrain them independently. The maximum regrowth multiplier (A = 2.0) falls within the 1.5–2.5 range reported for well-managed pastures under favorable regrowth conditions [40]. The sigmoid midpoint (C = 5 days) represents rapid post-grazing recovery consistent with short rest periods documented under intensive rotational management [49] and was set toward the fast-recovery end of the 3–50-day range evaluated in the sensitivity analysis to reflect the predominance of frequently defoliated, well-managed systems among the calibration sites. The residual-biomass coefficient (k = 0.3) reflects a moderate compensatory-growth response, consistent with experimental evidence that moderate defoliation can stimulate, rather than suppress, regrowth [50]. The trampling coefficients are informed by field and experimental evidence for the underlying processes they represent. The coefficient c1, governing transfer of live biomass to litter, is consistent with field observations that trampling significantly reduces standing aboveground biomass while promoting fragmentation of plant material into litter [51]. The coefficient c2, governing incorporation of litter into the topsoil, is consistent with controlled experiments showing that trampling-driven burial of surface litter substantially increases the transfer of litter carbon into SOC pools, with effect sizes on the order of 47–157% depending on the SOC fraction [41]. This evidence establishes the direction and plausible mechanism of these processes rather than providing a direct calibration of the field-scale coefficients. Shen and others [51] found that surface SOC gains did not scale monotonically with trampling intensity (light trampling produced larger gains than heavy trampling), and neither study measured litter transfer as a continuous function of grazing intensity (flgrem) as represented in Equations (4) and (5). We therefore retain c1 and c2 as fixed, literature-informed values rather than calibrated parameters.
2.2.4. Algorithm Implementation in DayCent-IGM
The regrowth and trampling components were implemented as modular additions to the existing DayCent grazing framework. The original DayCent grazing routines were retained, including biomass removal, nutrient return through animal excreta, and existing grazing-related production response options. The new modules are triggered in association with grazing events and operate alongside the original routines, preserving compatibility with established DayCent schedule files and simulation workflows.
Parameters controlling the added components are specified externally through a dedicated input file (regrowth.in) rather than being hard-coded within the model source code. This design improves transparency and allows parameter values to be documented, modified, and tested without altering the broader DayCent codebase. It also provides flexibility for future applications in which regrowth or trampling parameters may be informed by site-, species-, or system-specific observations.
As illustrated in Figure 1, the added components influence SOC dynamics through two primary pathways: modification of plant carbon inputs through the regrowth response component and redistribution of biomass and litter through the trampling component, which promotes transfer of organic matter to the soil surface and upper soil layer. Together, these additions enable DayCent-IGM to represent grazing disturbance–recovery processes that influence plant production, litter dynamics, and SOC responses while preserving the overall structure and functionality of the original DayCent model. Here, “disturbance” refers to grazing-induced defoliation and trampling-driven redistribution of biomass and litter, and “recovery” refers to vegetation regrowth during the rest period following defoliation. The term does not extend to soil structural recovery (e.g., bulk density or pore structure following compaction), which is not represented in the current model and is discussed as a limitation in Section 4.
2.3. Study Sites
A literature review was conducted to compile SOC observations from grazing studies for calibration and validation of both DayCent and DayCent-IGM. Experimental sites were selected using criteria adapted from Wang and others [52]: (i) sufficient management, soil, and site information was reported to support DayCent model setup; (ii) SOC stocks were measured at least twice, allowing the initial observation to be used for soil carbon pool initialization and subsequent observations to evaluate temporal SOC dynamics; and (iii) SOC measurements corresponded to a depth of 30 cm or included sufficient depth-resolved information to estimate SOC stocks to 30 cm. All SOC observations were harmonized to a 0–30 cm depth and converted to common units prior to analysis.
Because relatively few grazing studies report repeated SOC measurements together with the information required for process-based model simulation, all identified studies meeting these criteria were included. Sites were not selected based on model performance or the direction or magnitude of observed SOC change. Application of the selection criteria resulted in a dataset of 18 experimental sites for model calibration and validation (Figure 2 and Table 1). These sites define the validation domain of the present study and are not intended to represent all global grazing systems.
Figure 2.
Locations of experimental sites used in model cross−validation.
The selected sites spanned a clay content range of 10–66%, five climate zones defined by the Intergovernmental Panel on Climate Change (IPCC) [53], and six soil types. Most sites (66.7%) were classified as Cool Temperate Dry, while loam and sandy loam were the most common soil textures. Excluding initial observations used for model initialization, the dataset comprised 108 SOC stock observations for model evaluation.
In addition to SOC measurements, DayCent requires soil, weather, and management inputs. Management information, including grazing timing and intensity, fertilizer applications, and seeding practices, was compiled from the source publications (Table 1). Soil properties, including texture, pH, and bulk density, were obtained from the original studies whenever available. When required information was not reported, supplementary soil data were obtained from SoilGrids.org [54] using the reported site locations.
Meteorological inputs consisted of daily minimum temperature, maximum temperature, and precipitation. Because the study sites were distributed across multiple countries and no single weather dataset provided complete spatial and temporal coverage, weather data were obtained from the most appropriate source for each location. For sites in the United States, weather inputs were obtained from the Parameter-Elevation Regressions on Independent Slopes Model (PRISM) database [55]. For sites in Australia, temperature data were obtained from the SWAT Weather Database and precipitation data from the Australian Bureau of Meteorology [56]. For the site in China, temperature and precipitation data were obtained from the Watershed Weather Web Service (W3S). For sites in Brazil, temperature and precipitation data were obtained from the National Institute of Meteorology (INMET). The same weather inputs were used for both DayCent and DayCent-IGM simulations at each site, ensuring that model comparisons reflected differences in model structure rather than differences in climate forcing. Cross-product bias correction was not applied because consistent site-level reference observations were unavailable across all study regions and time periods.
Table 1.
Experimental study locations, grazing treatments, site characteristics, and study durations used for model calibration and evaluation of soil organic carbon.
2.4. Model Initialization
Because reliable long-term weather, management, and land-use histories preceding the experimental periods were generally unavailable for the study sites, conventional spin-up simulations could introduce uncertainty in the initialization of SOC pools [80,81]. Although terrestrial ecoregion information, such as that provided by Olson and others [82], can be used to inform DayCent spin-up simulations, previous studies have adopted alternative initialization approaches that use measured SOC stocks and calibrate parameters governing the partitioning of SOC among conceptual pools [83]. Accordingly, model initialization in this study was based on measured SOC stocks rather than long-term spin-up simulations.
Initial SOC was distributed vertically using an exponential depth distribution based on the observed sampling depth and partitioned among DayCent soil organic matter pools using two parameters adapted from the EPIC model: FBM, representing the fraction of SOC assigned to the active pool, and FHP, representing the fraction assigned to the passive pool [84]. The remaining SOC was assigned to the slow pool. These parameters were subsequently calibrated as part of the model parameter estimation procedure [52].
The initial SOC observation at each site was used for model initialization, whereas subsequent observations were reserved for model evaluation. Consequently, SOC stock comparisons assess the ability of the models to reproduce observed SOC stocks over time from known initial conditions, whereas SOC change rate comparisons assess the ability of the models to reproduce observed rates of SOC change between paired treatments following initialization.
2.5. Sensitivity Analysis
Sensitivity analyses were conducted separately for the original DayCent and DayCent-IGM models using the extended Fourier Amplitude Sensitivity Test (FAST) method [85]. FAST employs a periodic sampling scheme and Fourier transformation to decompose model output variance into contributions from individual parameters and their interactions. Parameter importance was quantified using the total sensitivity index (), which represents the overall contribution of a parameter to output variance, including interaction effects.
FAST analyses were performed across the 18 grazing-treatment sites. For the original DayCent model, sensitivity indices were calculated for 18 SOC-related parameters. For DayCent-IGM, sensitivity indices were calculated for the same 18 DayCent parameters together with five additional parameters associated with the regrowth and trampling modules. Inclusion of the DayCent-IGM-specific parameters allowed for assessment of whether the added grazing-process representations influenced simulated SOC dynamics.
Parameter rankings were derived by aggregating site-level sensitivity indices across the 18 sites. To ensure comparable calibration complexity between DayCent and DayCent-IGM, model calibration was restricted to a common subset of highly sensitive DayCent SOC-related parameters identified in both models. The parameters selected for calibration are indicated with asterisks in Table 2.
Table 2.
DayCent and DayCent-IGM parameters included in the FAST sensitivity analysis. Asterisks (*) denote the shared DayCent SOC-related parameters selected for calibration in both models. The last 5 parameters in the table are DayCent-IGM-specific regrowth and trampling parameters, which were included in the sensitivity analysis but excluded from calibration and retained at pre-specified values.
The five DayCent-IGM-specific regrowth and trampling parameters were included in the sensitivity analysis but were not calibrated. These parameters were retained at predefined values because the available datasets contained repeated SOC measurements but did not include direct observations of post-grazing regrowth dynamics, residual biomass, or trampling-induced litter incorporation. Although sensitivity analysis can identify parameters that influence simulated SOC dynamics, it does not establish that those parameters can be independently constrained using SOC observations alone. Consequently, SOC observations were considered insufficient for calibration of the grazing-process parameters. Retaining fixed values reduced the risk of treating the added process parameters as empirical-fitting coefficients and enabled a more direct comparison of structural differences between DayCent and DayCent-IGM.
2.6. Model Calibration and Cross-Validation
Model calibration and validation were conducted using a 3-fold site-level cross-validation procedure. The 18 experimental sites were randomly partitioned into three folds of equal size, with all observations from a given site assigned to the same fold to prevent information leakage between calibration and validation datasets. In each cross-validation iteration, two folds were used for calibration and the remaining fold was reserved for validation. The procedure was repeated three times so that each fold served as the validation set once.
A site-level cross-validation approach was adopted because multiple SOC observations were available within individual studies and sites. Assigning all observations from a site to the same fold ensured that model performance was evaluated on sites not used during calibration, thereby providing a more rigorous assessment of model transferability than observation-level partitioning.
DayCent and DayCent-IGM were calibrated separately using the same calibration sites, parameter set, optimization algorithm, and objective function, and were subsequently evaluated using the same validation sites. This design ensured that differences in model performance could be attributed to differences in model structure rather than calibration strategy.
Calibration was performed by adjusting six shared SOC-related parameters that exhibited consistently high total sensitivity indices in the FAST analysis and were directly related to SOC dynamics. Restricting calibration to the same parameter set in both models ensured comparable calibration complexity and facilitated evaluation of the added DayCent-IGM processes. Parameter estimation was conducted using the Shuffled Complex Evolution–University of Arizona (SCE-UA) algorithm, with root mean square error (RMSE) used as the objective function.
SCE-UA has been widely applied in environmental modeling [86,87,88], including applications in carbon-cycle modeling [52,89,90], hydrological modeling [91,92], and crop modeling [93,94]. The model calibration and k-fold cross-validation were implemented in a Python version 3.11.0 using SPOTPY version 1.6.2 [95] and DayCentPy version 1.0 [52].
2.7. Model Evaluation Metrics
Model performance was evaluated using both SOC stocks and SOC change rates at independent validation sites. Performance was quantified using the coefficient of determination (R2), Nash–Sutcliffe efficiency (NSE), root mean square error (RMSE), and model bias. Because SCE-UA is a deterministic optimization algorithm rather than a Bayesian sampling approach, model evaluation was based on the optimized parameter set obtained during each cross-validation fold rather than posterior predictive distributions. This approach provides an assessment of out-of-sample predictive performance but does not quantify full posterior parameter or prediction uncertainty.
SOC stock performance was evaluated by comparing simulated and observed SOC stocks for validation observations. SOC change-rate performance was evaluated using paired treatment comparisons within the same site and measurement period to isolate management-induced SOC changes. For each treatment comparison, observed SOC change rates were calculated as the difference in SOC stock change between treatments, adjusted for initial SOC differences, and divided by the number of years between measurements. Simulated SOC change rates were calculated using the same paired-treatment framework and time intervals. Change rates were expressed as Mg C ha−1 yr−1.
3. Results
3.1. Parameter Sensitivity and Model Response Patterns
DayCent and DayCent-IGM exhibited broadly similar sensitivity patterns across the 18 field experiments, with the highest FAST total sensitivity indices concentrated among a relatively small subset of carbon-cycle parameters (Figure 3). In both models, FHP, which determines the fraction of organic carbon allocated to the passive pool, was among the most influential parameters across sites. TEFF(1), which defines the temperature inflection point of the decomposition response function, also showed consistently high sensitivity. Other influential parameters included DEC5(2), PMCO2(2), P1CO2A(2), and WEFF(2), which regulate slow-pool decomposition, CO2 loss during decomposition, active-pool decomposition responses, and moisture effects on decomposition, respectively.
Figure 3.
Ranked parameters for (A) DayCent and (B) DayCent-IGM based on mean FAST total sensitivity indices () across 18 field experiments. Points represent site-level total sensitivity indices for individual experimental sites. DayCent-IGM included the shared DayCent SOC-related parameters and the additional regrowth/trampling parameters.
The consistency of dominant parameter rankings indicates that DayCent-IGM retained the primary SOC dynamics represented in the original DayCent framework. Based on their consistently high sensitivity across sites, six shared carbon-cycle parameters—FHP, TEFF(1), DEC5(2), PMCO2(2), P1CO2A(2), and WEFF(2)—were selected as the common calibration parameter set for both models.
The additional DayCent-IGM parameters also influenced simulated SOC dynamics, although their relative importance varied among sites. The maximum regrowth multiplier (A) ranked among the more influential DayCent-IGM-specific parameters, indicating that the regrowth component affected SOC predictions through its influence on plant biomass production and carbon inputs. The trampling coefficient c2, which governs the transfer of surface litter into the topsoil layer, also showed measurable sensitivity. In contrast, c1, C, and k generally exhibited lower sensitivity across the 18 sites. These results suggest that the IGM-specific parameters contributed to simulated SOC responses, while the dominant controls remained associated with carbon inputs, pool allocation, and decomposition processes inherited from the original DayCent framework.
Because A, C, k, c1, and c2 were not calibrated, the FAST sensitivity analysis (which varies each parameter across the bounds given in Table 2, spanning ranges 2–7-fold wider than the fixed default in most cases) provides the primary evidence on how sensitive simulated SOC outcomes are to these values. This analysis indicates that final SOC predictions are moderately sensitive to A and c2, meaning that alternative choices for the regrowth ceiling or the litter-to-soil transfer coefficient could measurably shift simulated SOC trajectories, and that this sensitivity should be weighed when applying DayCent-IGM outside the calibration domain. In contrast, C, k, and c1 showed comparatively low total sensitivity indices across the 18 sites, indicating that SOC outcomes are relatively robust to the specific fixed values chosen for these three parameters within the tested ranges. This asymmetry means the structural uncertainty introduced by fixing all five parameters is not uniform: it is concentrated in A and c2, and comparatively minor for C, k, and c1.
3.2. Calibrated Parameters
Fold-specific optimized parameter values obtained from SCE-UA calibration are presented in Table 3. Because calibration was performed independently for each cross-validation fold, the resulting parameter values represent fold-specific optimal solutions rather than a single global parameterization. These fold-specific parameter sets were subsequently used to generate validation simulations for the corresponding held-out sites.
Table 3.
Fold-specific optimized parameter values from SCE-UA 3-fold cross-validation for DayCent and DayCent-IGM across 18 grazing sites. Values represent the optimized parameter set obtained for each calibration fold and were used to generate the corresponding validation simulations.
Optimized parameter values varied among folds, reflecting differences in the calibration datasets and the interactions among parameters during optimization. For both DayCent and DayCent-IGM, all six shared carbon-cycle parameters were optimized within their predefined bounds. Differences in optimized parameter values between the two models indicate that incorporating additional grazing-process representations changed the parameter combinations required to reproduce observed SOC dynamics. These differences should therefore be interpreted as model-specific calibration solutions arising from differences in model structure, rather than as direct estimates of the isolated effects of individual grazing processes.
3.3. Validation of SOC Stocks
Using the optimized parameter sets obtained from the 3-fold cross-validation procedure, both DayCent and DayCent-IGM reproduced observed SOC stocks well for the held-out validation observations (Figure 4). Across the pooled validation dataset, DayCent achieved an NSE of 0.959, whereas DayCent-IGM achieved an NSE of 0.968. DayCent-IGM also reduced RMSE from 424.8 to 374.7 g m−2 and reduced absolute bias from 98.6 to 39.4 g m−2 compared with DayCent.
Figure 4.
Comparison of simulated and observed SOC stocks for DayCent and DayCent-IGM based on fold-specific optimized parameter sets from 3-fold cross-validation.
Regression relationships between simulated and observed SOC stocks were close to the 1:1 line for both models, indicating strong agreement in predicted SOC magnitude and variability across sites and treatments. The improvements achieved by DayCent-IGM were relatively small but consistent across evaluation metrics, suggesting improved predictive performance while retaining the overall SOC dynamics represented in the original DayCent framework. Because the validation dataset included both grazed and non-grazed treatments, these pooled statistics represent overall SOC stock prediction performance across management conditions rather than treatment-specific responses.
3.4. Validation of SOC Change Rates
Using the same optimized parameter sets, performance differences between the two models were more pronounced when SOC responses were evaluated as change rates between paired treatments (Figure 5). DayCent-IGM improved prediction of SOC change rates relative to the original DayCent model. This improvement was most evident in reduced prediction error, with RMSE decreasing from 0.688 to 0.419 Mg C ha−1 yr−1, and in reduced systematic bias, which improved from −0.081 to −0.001 Mg C ha−1 yr−1. DayCent-IGM also closely reproduced the mean observed SOC change rate, with a simulated mean of 0.099 Mg C ha−1 yr−1 compared with an observed mean of 0.100 Mg C ha−1 yr−1, whereas DayCent substantially underestimated the mean change rate at 0.019 Mg C ha−1 yr−1. Consistent with these improvements, NSE increased from 0.115 to 0.672. Although R2 also increased, this metric should be interpreted alongside error- and bias-based statistics because correlation alone does not fully characterize predictive accuracy.
Figure 5.
Comparison of simulated and observed SOC change rates from 18 validation sites. Scatterplots show site-level simulated versus observed SOC responses to management changes for DayCent and DayCent-IGM. The red dashed line indicates perfect agreement (1:1 relationship) between simulated and observed values, while the blue line represents the fitted linear regression.
The fitted regression slope increased from 0.145 for DayCent to 0.664 for DayCent-IGM, indicating that DayCent-IGM more accurately represented the magnitude of observed SOC responses to management, although some underestimation of larger positive responses remained. The largest remaining discrepancy occurred at the Berridale, Australia site. DayCent-IGM closely reproduced the observed SOC change rate for the cell grazing versus no-grazing comparison (observed as 3.65 and simulated as 3.96 Mg C ha−1 yr−1) but underestimated the tactical grazing versus no-grazing comparison (observed as 1.95 and simulated as 0.664 Mg C ha−1 yr−1), despite substantial improvement over DayCent (0.027 Mg C ha−1 yr−1) for the latter. Cell grazing in this dataset involved a heavy-grazing pulse followed by an extended rest period (80–120 days), whereas tactical grazing involved repeated moderate grazing with shorter rest intervals (4–6 weeks) across two periods per season. This contrast is consistent with DayCent-IGM’s regrowth and trampling formulations, which operate on aboveground biomass and litter dynamics following discrete grazing events, capturing SOC responses to a large disturbance–recovery cycle more fully than the cumulative effects of repeated moderate defoliation, which may depend more heavily on belowground carbon allocation processes not yet represented in the model (see Section 4). Together, these results indicate that while both models reproduced SOC stocks reasonably well, DayCent-IGM more accurately captured management-driven SOC change. The improvement was most evident for SOC change rates, which provide a more direct evaluation of model responses to grazing management than SOC stocks alone.
4. Discussion
DayCent-IGM was developed as a targeted extension of DayCent to improve representation of grazing-related processes that influence SOC dynamics. Rather than replacing DayCent with a more complex forage, grazing, or microbial-explicit model, the objective was to incorporate key disturbance–recovery pathways that are often simplified or omitted in SOC simulations. The results indicate that these additions improved prediction of management-driven SOC change while maintaining the strong SOC stock performance of the original DayCent framework. Because the new modules require no inputs beyond those already used by DayCent, DayCent-IGM remains compatible with the data typically available for SOC modeling and carbon-accounting applications.
In the k-fold cross-validation evaluation, both DayCent and DayCent-IGM reproduced SOC stocks well across validation sites. This result suggests that the dominant controls on SOC magnitude, including soil properties, climate, productivity, decomposition, and long-term SOC turnover, are already well represented within DayCent. Because SOC stocks integrate long-term ecosystem history and are strongly influenced by initial conditions and site characteristics [96], strong agreement for SOC stocks does not necessarily indicate accurate simulation of management-induced SOC responses [16]. The similar SOC stock performance of the two models indicates that DayCent-IGM preserved the dominant controls on long-term SOC dynamics represented in DayCent while providing a modest improvement in predictive accuracy.
Performance differences between the models were more pronounced when evaluated using SOC change rates. Although both models reproduced SOC stocks well, stock-based evaluation has inherent limitations because simulations were initialized using observed SOC stocks. Consequently, stock metrics primarily assess the ability of the models to reproduce subsequent SOC dynamics from known initial conditions rather than to predict absolute SOC stocks independently. Furthermore, total SOC stocks typically vary over a much larger range than management-induced changes [7], meaning that strong agreement for SOC stocks can occur even when models differ substantially in their ability to simulate SOC responses to management. SOC change rates therefore provide a more direct and demanding test of model response because they represent relatively small changes against large background SOC pools. Consistent with this interpretation, DayCent-IGM substantially improved agreement with observed SOC change rates, reducing RMSE by 39%, reducing bias to near zero, and increasing NSE from 0.115 to 0.672 relative to the original DayCent model. Notably, the improvement in SOC change-rate performance was much larger than the improvement observed for SOC stock prediction. In contrast, DayCent reproduced broad SOC stock patterns but tended to underestimate positive SOC responses to grazing management. These results highlight the importance of evaluating SOC models using both SOC stocks and management-driven changes, particularly for applications focused on estimating practice effects rather than absolute SOC stocks.
The improved SOC change-rate performance is consistent with the intended role of the added grazing-process modules. In grazed systems, SOC responses depend not only on biomass removal but also on post-defoliation recovery, residual biomass, rest duration, climate-driven growth potential, and physical redistribution of organic matter through trampling [24,27,97]. The original DayCent grazing framework represents biomass removal and nutrient return but provides limited explicit representation of post-grazing regrowth and trampling-driven litter incorporation. By incorporating these pathways, DayCent-IGM allows grazing management to influence SOC through additional mechanisms affecting plant carbon inputs and organic matter redistribution. The improved agreement with observed SOC change rates suggests that the added model structure helped capture management-induced variation that was not adequately represented in the original model.
The sensitivity analysis is consistent with this interpretation. DayCent-IGM retained the same dominant controls on SOC dynamics as DayCent, including parameters governing SOC pool partitioning, decomposition, temperature sensitivity, moisture effects, and carbon transfer among pools. At the same time, the IGM-specific regrowth and trampling parameters exhibited measurable sensitivity, particularly the maximum regrowth multiplier and the coefficient controlling litter transfer into the topsoil. These results indicate that the added modules influenced simulated SOC dynamics without altering the fundamental decomposition and SOC turnover structure of DayCent. DayCent-IGM therefore functions as a structural refinement of grazing-related carbon input and redistribution pathways rather than as a wholesale modification of the DayCent SOC framework.
A key strength of the evaluation design is that both models were calibrated using the same cross-validation folds, calibration algorithm, objective function, and shared carbon-cycle parameters. The IGM-specific parameters were included in the sensitivity analysis but were held fixed during calibration. This design reduces the likelihood that improved DayCent-IGM performance resulted solely from parameter flexibility and instead highlights the contribution of the modified model structure. Furthermore, site-level cross-validation provided an out-of-sample evaluation by assigning all observations from a given site to the same fold, thereby avoiding information leakage between calibration and validation datasets.
The results should also be interpreted in light of several limitations. Most importantly, the available datasets evaluated SOC responses but did not directly validate the individual regrowth and trampling processes. Although the formulations are ecologically motivated and supported by published literature, the present study did not include repeated measurements of residual biomass, post-grazing regrowth, root production, litter incorporation, or trampling-induced redistribution. Although the regrowth formulations (A, C, k) and trampling coefficients (c1, c2) are each grounded in published evidence for the mechanisms they represent [40,41,49,50,51], none of these values were directly calibrated to the field-scale, grazing-intensity-dependent relationships assumed by the model. Our sensitivity analysis indicates this structural uncertainty is not evenly distributed: SOC outcomes are comparatively more sensitive to A and c2 than to C, k, and c1; so, future work prioritizing direct measurement of post-grazing regrowth rates and litter-incorporation rates, the processes underlying A and c2, would do more to reduce structural uncertainty in DayCent-IGM than equivalent effort directed at C, k, or c1. Consequently, the results support the conclusion that the added model structure improves simulation of SOC responses, but they should not be interpreted as direct validation of every process represented within the new modules. Future studies should test these components using datasets that include vegetation recovery, grazing intensity, residual biomass, litter movement, root dynamics, and soil incorporation measurements following grazing events.
A related consideration is that improved agreement between simulated and observed SOC change rates does not, by itself, confirm that the internal processes driving that agreement are correctly represented. This data limitation reflects a broader data gap in grazing system science, as the necessary intensive measurements of biomass consumption, regrowth, and litter incorporation after grazing events remain scarce. Because regrowth trajectories, residual biomass, and litter-incorporation amounts were not independently measured in this study, it is possible that compensating errors among these processes, rather than an accurate representation of the underlying mechanisms, contributed to the observed improvement in SOC predictions. Distinguishing these possibilities will require datasets that resolve the internal state variables of the model, not just its aggregate SOC output. High-frequency, non-destructive biomass monitoring such as repeated rising-plate-meter or pasture-probe measurements, or UAV- or satellite-based vegetation indices (e.g., NDVI or biomass products) at sub-weekly to weekly resolution following grazing events, could directly test the shape and timing of the simulated regrowth curve (Equation (1)) against observed recovery trajectories. Similarly, direct measurement of litter incorporation, for example through marked or isotopically labeled litter placed at the soil surface before grazing and recovered at multiple depths afterward (as in [41]), would allow for direct estimation of the live-to-litter and litter-to-topsoil transfer fractions represented by c1 and c2, rather than inferring them from aggregate SOC outcomes alone. We recommend such process-level validation as a priority for future development of DayCent-IGM.
The validation dataset was compiled from published grazing experiments with repeated SOC measurements and sufficient information for DayCent parameterization. The 18 sites span a clay content range of 10–66%, six soil textures, and five IPCC climate zones, with the majority (66.7%) classified as Cool Temperate Dry; sites were located in the United States, Canada, Australia, Brazil, France, and China, under continuous grazing at light, moderate, and heavy intensities as well as rotational systems (cell and tactical grazing). This composition means the validation domain is weighted toward temperate and semi-arid cattle- and sheep-grazed pastures under low-to-moderate stocking intensities. Several grazing systems remain poorly represented and should be treated with caution when applying DayCent-IGM: (i) Tropical and subtropical grazing systems are represented by only two of the 18 sites. Global SOC models, including DayCent, are commonly parameterized for temperate systems and may not fully capture the climatic heterogeneity and altitudinal gradients characteristic of tropical mountain grazing systems, where livestock land uses have been shown to exhibit the largest model prediction errors among compared land covers, attributable in part to unmodeled trampling, compaction, and spatially heterogeneous nutrient deposition [98]. (ii) Hot arid and semi-arid rangelands are absent from the dataset. (iii) High-intensity, high-frequency rotational or mob-grazing systems with very short rest periods fall outside the lower end of the 3–50-day rest-duration range evaluated in our sensitivity analysis. (iv) The residual-biomass thresholds (Bmin, Bopt) and regrowth parameters of grazing by livestock other than cattle and sheep (e.g., yaks, goats, camelids) may differ substantially from the temperate pasture values used here. (v) Severely degraded or overgrazed systems with residual biomass below the Bmin threshold used in this study: the validation domain should therefore be interpreted as the set of grazing systems represented by currently available repeated-measurement studies, predominantly temperate, moderately grazed cattle and sheep pastures, rather than as a global validation across all grazing lands.
Weather inputs also contributed uncertainty because data were obtained from multiple sources across countries and study periods. Differences in station coverage, interpolation methods, and product-specific biases may have affected simulated plant production and SOC dynamics. However, because identical weather inputs were used for both models at each site, weather-related uncertainty likely influenced absolute site-level simulations but had less influence on the paired comparison between model structures.
Several model processes could be further refined. The current implementation focuses on aboveground regrowth responses and surface litter redistribution, whereas belowground carbon allocation, root turnover, root exudation, manure spatial heterogeneity, soil compaction, and physical protection of SOC remain simplified. These processes may be important under certain grazing systems and environmental conditions. Future development could incorporate additional belowground and microbial-mediated mechanisms, although such improvements should be balanced against data availability and the need to maintain model applicability for operational SOC modeling and carbon-accounting applications.
Overall, the results demonstrate that explicit representation of grazing disturbance–recovery dynamics can improve simulation of management-driven SOC change while maintaining the strong SOC stock performance of the original DayCent framework. The substantially larger improvement in SOC change-rate metrics than in SOC stock metrics suggests that the principal benefit of DayCent-IGM lies in improving model responsiveness to grazing management rather than altering the simulation of long-term SOC pools. These findings are particularly relevant for grazing-based carbon accounting and climate mitigation programs, where accurate estimation of SOC change rates is more important than reproducing SOC stocks alone. Future work should expand validation across a broader range of grazing systems, directly evaluate regrowth and trampling processes using process-level measurements, and further refine belowground carbon inputs and SOC stabilization mechanisms.
5. Conclusions
This study developed DayCent-IGM, a targeted extension of the DayCent model that explicitly represents post-grazing regrowth and trampling-driven organic matter redistribution. The objective was to improve simulation of grazing-driven SOC dynamics while retaining the core DayCent structure and compatibility with the soil, climate, and management inputs commonly available for SOC modeling and carbon-accounting applications.
Across the validation datasets, DayCent-IGM maintained strong performance in simulating SOC stocks and provided modest improvements in SOC stock prediction relative to the original DayCent model. More importantly, DayCent-IGM substantially improved simulation of SOC change rates, increasing agreement with observed management-induced SOC responses while reducing prediction error and bias. These results demonstrate that accurate SOC stock prediction alone does not necessarily indicate accurate simulation of management-driven SOC change, which often represents a relatively small signal relative to large background SOC pools.
The improved SOC change-rate performance suggests that grazing representations based primarily on biomass removal and nutrient return may not fully capture SOC responses to improved grazing management. By incorporating disturbance–recovery processes, including post-grazing regrowth and trampling-mediated redistribution of organic matter, DayCent-IGM provides a stronger process-based representation of how grazing management influences SOC dynamics.
DayCent-IGM should be viewed as a targeted process-based extension rather than a fully forage- or microbial-explicit grazing model. Future work should expand evaluation across a broader range of grazing systems and directly test the regrowth and trampling components using process-level measurements of residual biomass, post-grazing recovery, root production, litter redistribution, and soil incorporation. Overall, DayCent-IGM improves simulation of management-driven SOC change while preserving the practical usability and broad applicability of the original DayCent framework.
Author Contributions
Conceptualization, X.W.; methodology, X.W. and R.d.Q.M.; software, X.W. and R.d.Q.M.; validation, X.W., R.d.Q.M., S.M.J. and D.N.P.; formal analysis, X.W., R.d.Q.M. and D.N.P.; investigation, X.W., R.d.Q.M., S.M.J., D.N.P. and M.M.; resources, X.W.; data curation, X.W., R.d.Q.M. and S.M.J.; writing—original draft preparation performed by all authors; writing—review and editing performed by all authors; visualization, X.W., R.d.Q.M., S.M.J. and D.N.P.; supervision, X.W.; project administration, X.W. All authors have read and agreed to the published version of the manuscript.
Funding
This research received no external funding.
Data Availability Statement
The SOC observations used for model calibration and validation were compiled from previously published studies cited in this manuscript. Calibration and analysis scripts (including FAST sensitivity analysis, SCE-UA calibration, cross-validation, and figure generation) used in this study are available at https://github.com/SusanWang-ui/DayCent-IGM (accessed on 20 July 2026). The DayCent-IGM model was developed from DayCent revision 279 (rev279), specifically the DDCentEVI version obtained through the COMET-Farm program (Copyright © 2022 Colorado State University, Fort Collins, CO, USA). Because the underlying DayCent source code is owned and distributed by Colorado State University, the DayCent-IGM source code cannot be publicly redistributed. Researchers interested in obtaining access to the DayCent source code may do so through the Colorado State University Soil Carbon Solutions Center Data & Model Consortium, subject to the consortium’s access policies. The DayCent-IGM algorithms, equations, parameter definitions, and implementation details are described in the Section 2 of this manuscript.
Conflicts of Interest
The authors are employed by Agoro Carbon Alliance US. The DayCent-IGM model described in this study may be used in applications related to agricultural carbon accounting and carbon-credit quantification. The authors declare no other competing interests.
References
- Batjes, N.H. Total Carbon and Nitrogen in the Soils of the World. Eur. J. Soil Sci. 2014, 65, 10–21. [Google Scholar] [CrossRef] [Scilit]
- Georgiou, K.; Jackson, R.B.; Vindušková, O.; Abramoff, R.Z.; Ahlström, A.; Feng, W.; Harden, J.W.; Pellegrini, A.F.A.; Polley, H.W.; Soong, J.L.; et al. Global Stocks and Capacity of Mineral-Associated Soil Organic Carbon. Nat. Commun. 2022, 13, 3797. [Google Scholar] [CrossRef] [Scilit] [PubMed]
- Sanderman, J.; Hengl, T.; Fiske, G.J. Soil Carbon Debt of 12,000 Years of Human Land Use. Proc. Natl. Acad. Sci. USA 2017, 114, 9575–9580. [Google Scholar] [CrossRef] [Scilit] [PubMed]
- Gasser, T.; Crepin, L.; Quilcaille, Y.; Houghton, R.A.; Ciais, P.; Obersteiner, M. Historical CO2 Emissions from Land Use and Land Cover Change and Their Uncertainty. Biogeosciences 2020, 17, 4075–4101. [Google Scholar] [CrossRef] [Scilit]
- Smith, P.; Poch, R.M.; Lobb, D.A.; Bhattacharyya, R.; Alloush, G.; Eudoxie, G.D.; Anjos, L.H.C.; Castellano, M.; Ndzana, G.M.; Chenu, C.; et al. Status of the World’s Soils. Annu. Rev. Environ. Resour. 2024, 49, 73–104. [Google Scholar] [CrossRef] [Scilit]
- Kopittke, P.M.; Menzies, N.W.; Wang, P.; McKenna, B.A.; Lombi, E. Soil and the Intensification of Agriculture for Global Food Security. Environ. Int. 2019, 132, 105078. [Google Scholar] [CrossRef] [Scilit] [PubMed]
- Beillouin, D.; Corbeels, M.; Demenois, J.; Berre, D.; Boyer, A.; Fallot, A.; Feder, F.; Cardinael, R. A Global Meta-Analysis of Soil Organic Carbon in the Anthropocene. Nat. Commun. 2023, 14, 3700. [Google Scholar] [CrossRef] [Scilit] [PubMed]
- Lal, R. Soil Carbon Sequestration Impacts on Global Climate Change and Food Security. Science 2004, 304, 1623–1627. [Google Scholar] [CrossRef] [Scilit] [PubMed]
- Almaraz, M.; Simmonds, M.; Boudinot, F.G.; Di Vittorio, A.V.; Bingham, N.; Khalsa, S.D.S.; Ostoja, S.; Scow, K.; Jones, A.; Holzer, I.; et al. Soil Carbon Sequestration in Global Working Lands as a Gateway for Negative Emission Technologies. Glob. Change Biol. 2023, 29, 5988–5998. [Google Scholar] [CrossRef] [Scilit] [PubMed]
- Bossio, D.A.; Cook-Patton, S.C.; Ellis, P.W.; Fargione, J.; Sanderman, J.; Smith, P.; Wood, S.; Zomer, R.J.; Von Unger, M.; Emmer, I.M.; et al. The Role of Soil Carbon in Natural Climate Solutions. Nat. Sustain. 2020, 3, 391–398. [Google Scholar] [CrossRef] [Scilit]
- Frank, S.; Lessa Derci Augustynczik, A.; Havlík, P.; Boere, E.; Ermolieva, T.; Fricko, O.; Di Fulvio, F.; Gusti, M.; Krisztin, T.; Lauri, P.; et al. Enhanced Agricultural Carbon Sinks Provide Benefits for Farmers and the Climate. Nat. Food 2024, 5, 742–753. [Google Scholar] [CrossRef] [Scilit] [PubMed]
- Buma, B.; Gordon, D.R.; Kleisner, K.M.; Bartuska, A.; Bidlack, A.; DeFries, R.; Ellis, P.; Friedlingstein, P.; Metzger, S.; Morgan, G.; et al. Expert Review of the Science Underlying Nature-Based Climate Solutions. Nat. Clim. Change 2024, 14, 402–406. [Google Scholar] [CrossRef] [Scilit]
- Parton, W.J.; Scurlock, J.M.O.; Ojima, D.S.; Gilmanov, T.G.; Scholes, R.J.; Schimel, D.S.; Kirchner, T.; Menaut, J.; Seastedt, T.; Garcia Moya, E.; et al. Observations and Modeling of Biomass and Soil Organic Matter Dynamics for the Grassland Biome Worldwide. Glob. Biogeochem. Cycles 1993, 7, 785–809. [Google Scholar] [CrossRef] [Scilit]
- Paustian, K.; Lehmann, J.; Ogle, S.; Reay, D.; Robertson, G.P.; Smith, P. Climate-Smart Soils. Nature 2016, 532, 49–57. [Google Scholar] [CrossRef] [Scilit] [PubMed]
- Mathers, C.; Black, C.K.; Segal, B.D.; Gurung, R.B.; Zhang, Y.; Easter, M.J.; Williams, S.; Motew, M.; Campbell, E.E.; Brummitt, C.D.; et al. Validating DayCent-CR for Cropland Soil Carbon Offset Reporting at a National Scale. Geoderma 2023, 438, 116647. [Google Scholar] [CrossRef] [Scilit]
- Le Noë, J.; Manzoni, S.; Abramoff, R.; Bölscher, T.; Bruni, E.; Cardinael, R.; Ciais, P.; Chenu, C.; Clivot, H.; Derrien, D.; et al. Soil Organic Carbon Models Need Independent Time-Series Validation for Reliable Prediction. Commun. Earth Environ. 2023, 4, 158. [Google Scholar] [CrossRef] [Scilit]
- Verra. VM0042 Methodology for Improved Agricultural Land Management Version 2.2. 2025. Available online: https://verra.org/methodologies/vm0042-improved-agricultural-land-management-v2-2/ (accessed on 11 December 2025).
- Oldfield, E.E.; Eagle, A.J.; Rubin, R.L.; Rudek, J.; Sanderman, J.; Gordon, D.R. Crediting Agricultural Soil Carbon Sequestration. Science 2022, 375, 1222–1225. [Google Scholar] [CrossRef] [Scilit] [PubMed]
- Cariappa, A.A.G.; Konath, N.C.; Sapkota, T.B.; Krishna, V.V. Evaluating the Potential and Eligibility of Conservation Agriculture Practices for Carbon Credits. Sci. Rep. 2024, 14, 9193. [Google Scholar] [CrossRef] [Scilit] [PubMed]
- Dupla, X.; Bonvin, E.; Deluz, C.; Lugassy, L.; Verrecchia, E.; Baveye, P.C.; Grand, S.; Boivin, P. Are Soil Carbon Credits Empty Promises? Shortcomings of Current Soil Carbon Quantification Methodologies and Improvement Avenues. Soil Use Manag. 2024, 40, e13092. [Google Scholar] [CrossRef] [Scilit]
- Bardgett, R.D.; Bullock, J.M.; Lavorel, S.; Manning, P.; Schaffner, U.; Ostle, N.; Chomel, M.; Durigan, G.; Fry, E.L.; Johnson, D.; et al. Combatting Global Grassland Degradation. Nat. Rev. Earth Environ. 2021, 2, 720–735. [Google Scholar] [CrossRef] [Scilit]
- Conant, R.T.; Cerri, C.E.P.; Osborne, B.B.; Paustian, K. Grassland Management Impacts on Soil Carbon Stocks: A New Synthesis. Ecol. Appl. 2017, 27, 662–668. [Google Scholar] [CrossRef] [Scilit] [PubMed]
- Bai, Y.; Cotrufo, M.F. Grassland Soil Carbon Sequestration: Current Understanding, Challenges, and Solutions. Science 2022, 377, 603–608. [Google Scholar] [CrossRef] [Scilit] [PubMed]
- Stanley, P.L.; Wilson, C.; Patterson, E.; Machmuller, M.B.; Cotrufo, M.F. Ruminating on Soil Carbon: Applying Current Understanding to Inform Grazing Management. Glob. Change Biol. 2024, 30, e17223. [Google Scholar] [CrossRef] [Scilit] [PubMed]
- Byrnes, R.C.; Eastburn, D.J.; Tate, K.W.; Roche, L.M. A Global Meta-analysis of Grazing Impacts on Soil Health Indicators. J. Environ. Qual. 2018, 47, 758–765. [Google Scholar] [CrossRef] [Scilit] [PubMed]
- Hamilton, E.W.; Frank, D.A. Can Plants Stimulate Soil Microbes and Their Own Nutrient Supply? Evidence from a Grazing Tolerant Grass. Ecology 2001, 82, 2397–2402. [Google Scholar] [CrossRef]
- Li, W.; Sun, Q.; Zhang, S.; Hu, X.; Asiya, M.; Xiong, J.; Wang, M.; Wang, X.; Long, R.; Jin, G. Trampling and Dung and Urine Addition of Livestock Increase the Soil Organic Carbon in Mountain Meadows by Augmenting the Organic Carbon in Different Aggregates. Agronomy 2025, 15, 843. [Google Scholar] [CrossRef] [Scilit]
- McSherry, M.E.; Ritchie, M.E. Effects of Grazing on Grassland Soil Carbon: A Global Review. Glob. Change Biol. 2013, 19, 1347–1357. [Google Scholar] [CrossRef] [Scilit] [PubMed]
- Abdalla, M.; Hastings, A.; Chadwick, D.R.; Jones, D.L.; Evans, C.D.; Jones, M.B.; Rees, R.M.; Smith, P. Critical Review of the Impacts of Grazing Intensity on Soil Organic Carbon Storage and Other Soil Quality Indicators in Extensively Managed Grasslands. Agric. Ecosyst. Environ. 2018, 253, 62–81. [Google Scholar] [CrossRef] [Scilit] [PubMed]
- Parton, W.J.; Hartman, M.; Ojima, D.; Schimel, D. DAYCENT and Its Land Surface Submodel: Description and Testing. Glob. Planet. Change 1998, 19, 35–48. [Google Scholar] [CrossRef] [Scilit]
- Coleman, K.; Jenkinson, D.S. RothC-26.3—A Model for the Turnover of Carbon in Soil. In Proceedings of the Evaluation of Soil Organic Matter Models; Powlson, D.S., Smith, P., Smith, J.U., Eds.; Springer: Berlin/Heidelberg, Germany, 1996; pp. 237–246. [Google Scholar]
- Smith, J.; Gottschalk, P.; Bellarby, J.; Chapman, S.; Lilly, A.; Towers, W.; Bell, J.; Coleman, K.; Nayak, D.; Richards, M.; et al. Estimating Changes in Scottish Soil Carbon Stocks Using ECOSSE. II. Application. Clim. Res. 2010, 45, 193–205. [Google Scholar] [CrossRef] [Scilit]
- Li, C.; Frolking, S.; Frolking, T.A. A Model of Nitrous Oxide Evolution from Soil Driven by Rainfall Events: 1. Model Structure and Sensitivity. J. Geophys. Res. 1992, 97, 9759–9776. [Google Scholar] [CrossRef] [Scilit]
- Ritchie, M.E. Grazing Management, Forage Production and Soil Carbon Dynamics. Resources 2020, 9, 49. [Google Scholar] [CrossRef] [Scilit]
- Santos, R.S.; Hamilton, E.K.; Stanley, P.L.; Paustian, K.; Cotrufo, M.F.; Zhang, Y. Simulating Adaptive Grazing Management on Soil Organic Carbon in the Southeast U.S.A. Using MEMS 2. J. Environ. Manag. 2024, 365, 121657. [Google Scholar] [CrossRef] [Scilit] [PubMed]
- Del Grosso, S.J.; Parton, W.J.; Mosier, A.R.; Walsh, M.K.; Ojima, D.S.; Thornton, P.E. DAYCENT National-scale Simulations of Nitrous Oxide Emissions from Cropped Soils in the United States. J. Environ. Qual. 2006, 35, 1451–1460. [Google Scholar] [CrossRef] [Scilit] [PubMed]
- Del Grosso, S.J.; Parton, W.J.; Adler, P.R.; Davis, S.C.; Keough, C.; Marx, E. DayCent Model Simulations for Estimating Soil Carbon Dynamics and Greenhouse Gas Fluxes from Agricultural Production Systems. In Managing Agricultural Greenhouse Gases; Elsevier Inc.: New York, NY, USA, 2012; pp. 241–250. [Google Scholar]
- Gurung, R.B.; Ogle, S.M.; Breidt, F.J.; Spencer, S. Bayesian Uncertainty Analysis of Soil Organic Carbon Stocks and Stock Changes from Croplands in the U.S. Midwest. Geoderma 2026, 471, 117888. [Google Scholar] [CrossRef] [Scilit]
- Brummitt, C.D.; Mathers, C.A.; Keating, R.A.; O’Leary, K.; Easter, M.; Friedl, M.A.; DuBuisson, M.; Campbell, E.E.; Pape, R.; Peters, S.J.W.; et al. Solutions and Insights for Agricultural Monitoring, Reporting, and Verification (MRV) from Three Consecutive Issuances of Soil Carbon Credits. J. Environ. Manag. 2024, 369, 122284. [Google Scholar] [CrossRef] [Scilit] [PubMed]
- Parsons, A.J.; Penning, P.D. The Effect of the Duration of Regrowth on Photosynthesis, Leaf Death and the Average Rate of Growth in a Rotationally Grazed Sward. Grass Forage Sci. 1988, 43, 15–27. [Google Scholar] [CrossRef] [Scilit]
- Wei, Y.; Zhang, Y.; Wilson, G.W.T.; Guo, Y.; Bi, Y.; Xiong, X.; Liu, N. Transformation of Litter Carbon to Stable Soil Organic Matter Is Facilitated by Ungulate Trampling. Geoderma 2021, 385, 114828. [Google Scholar] [CrossRef] [Scilit]
- Takeda, N.; Rowlings, D.; Parton, W.; Grace, L.; Day, K.; Nguyen, T.; Grace, P. Soil Carbon Sequestration Potential in Subtropical Grasslands Estimated by DayCent-CABBI. Soil Sci. Soc. Am. J. 2025, 89, e70003. [Google Scholar] [CrossRef] [Scilit]
- Zani, C.F.; Abdalla, M.; Abbott, G.D.; Taylor, J.A.; Galdos, M.V.; Cooper, J.M.; Lopez-Capel, E. Predicting Long-Term Effects of Alternative Management Practices in Conventional and Organic Agricultural Systems on Soil Carbon Stocks Using the DayCent Model. Agronomy 2023, 13, 1093. [Google Scholar] [CrossRef] [Scilit]
- Bista, P.; Hartman, M.D.; DelGrosso, S.J.; Thapa, V.R.; Ghimire, R. Simulating Long-Term Soil Carbon Storage, Greenhouse Gas Balance, and Crop Yields in Semi-Arid Cropping Systems Using DayCent Model. Nutr. Cycl. Agroecosyst. 2024, 128, 99–114. [Google Scholar] [CrossRef] [Scilit]
- Hartman, M.; Parton, W.; Del Grosso, S.; Easter, M.; Hendryx, J.; Hilinski, T.; Kelly, R.; Keough, C.; Killian, K.; Lutz, S. The Daily Century Ecosystem, Soil Organic Matter, Nutrient Cycling, Nitrogen Trace Gas, and Methane Model: User Manual, Scientific Basis, and Technical Documentation; Natural Resource Ecology Laboratory, Colorado State University: Fort Collins, CO, USA, 2018. [Google Scholar]
- Parton, W.J.; Holland, E.A.; Del Grosso, S.J.; Hartman, M.D.; Martin, R.E.; Mosier, A.R.; Ojima, D.S.; Schimel, D.S. Generalized Model for NOx and N2O Emissions from Soils. J. Geophys. Res. 2001, 106, 17403–17419. [Google Scholar] [CrossRef] [Scilit]
- EPA. Inventory of U.S. Greenhouse Gas Emissions and Sinks: 1990–2022; EPA 430-R-24-004; U.S. Environmental Protection Agency: Washington, DC, USA, 2024. Available online: https://www.epa.gov/ghgemissions/inventory-us-greenhouse-gas-emissions-and-sinks-1990-2022 (accessed on 6 August 2026).
- Chapman, D.F.; Tharmaraj, J.; Agnusdei, M.; Hill, J. Regrowth Dynamics and Grazing Decision Rules: Further Analysis for Dairy Production Systems Based on Perennial Ryegrass (Lolium perenne L.) Pastures. Grass Forage Sci. 2012, 67, 77–95. [Google Scholar] [CrossRef] [Scilit]
- Binnie, R.C.; Kilpatrick, D.J.; Chestnutt, D.M.B. Effect of Altering the Length of the Regrowth Interval in Early, Mid and Late Season on the Productivity of Grass Swards. J. Agric. Sci. 1997, 128, 303–309. [Google Scholar] [CrossRef] [Scilit]
- Briske, D.D.; Richards, J.H. Plant Responses to Defoliation: A Physiological, Morphological and Demographic Evaluation. In Wildland Plants: Physiological Ecology and Developmental Morphology; Society for Range Management: Denver, CO, USA, 1995; pp. 635–710. [Google Scholar]
- Shen, Y.; Fang, Y.; Chen, H.; Ma, Z.; Huang, C.; Wu, X.; Chang, S.X.; Tavakkoli, E.; Cai, Y. New Insights into the Relationships between Livestock Grazing Behaviors and Soil Organic Carbon Stock in an Alpine Grassland. Agric. Ecosyst. Environ. 2023, 355, 108602. [Google Scholar] [CrossRef] [Scilit]
- Wang, X.; Jeong, J.; Park, S.; Zhang, X.; Gao, J.; Silvero, N.E.Q. DayCent-CUTE: A Global Sensitivity, Auto-Calibration, and Uncertainty Analysis Tool for DayCent. Environ. Model. Softw. 2023, 169, 105832. [Google Scholar] [CrossRef] [Scilit]
- Baasansuren, J.; Fukuda, M.; Ngarize, S.; Osako, A.; Pyrozhenko, Y.; Shermanau, P.; Federici, S. 2019 Refinement to the 2006 IPCC Guidelines for National Greenhouse Gas Inventories; IPCC: Geneva, Switzerland, 2019. [Google Scholar]
- Poggio, L.; De Sousa, L.M.; Batjes, N.H.; Heuvelink, G.B.M.; Kempen, B.; Ribeiro, E.; Rossiter, D. SoilGrids 2.0: Producing Soil Information for the Globe with Quantified Spatial Uncertainty. Soil 2021, 7, 217–240. [Google Scholar] [CrossRef] [Scilit]
- PRISM Group; Oregon State University. PRISM Weather Data. Available online: https://prism.oregonstate.edu (accessed on 20 January 2025).
- Bureau of Meteorology. Commonwealth of Australia. 2026. Available online: http://www.bom.gov.au/climate/data/ (accessed on 20 January 2025).
- Orgill, S.E.; Condon, J.R.; Conyers, M.K.; Morris, S.G.; Alcock, D.J.; Murphy, B.W.; Greene, R.S.B. Removing Grazing Pressure from a Native Pasture Decreases Soil Organic Carbon in Southern New South Wales, Australia. Land Degrad. Dev. 2016, 29, 274–283. [Google Scholar] [CrossRef] [Scilit]
- Ingram, L.J.; Stahl, P.D.; Schuman, G.E.; Buyer, J.S.; Vance, G.F.; Ganjegunte, G.K.; Welker, J.M.; Derner, J.D. Grazing Impacts on Soil Carbon and Microbial Communities in a Mixed-grass Ecosystem. Soil Sci. Soc. Am. J. 2008, 72, 939–948. [Google Scholar] [CrossRef] [Scilit]
- Melo, A.A.O.d. Levantamento de Solos na Estação de Zootecnia do Extremo Sul da Bahia (Boletim Técnico No 114); Empresa Brasileira de Pesquisa Agropecuária (EMBRAPA): Rio de Janeiro, Brazil, 1983. [Google Scholar]
- Tarré, R.; Macedo, R.; Cantarutti, R.B.; De Rezende, C.P.; Pereira, J.M.; Ferreira, E.; Alves, B.J.R.; Urquiaga, S.; Boddey, R.M. The Effect of the Presence of a Forage Legume on Nitrogen and Carbon Levels in Soils under Brachiaria Pastures in the Atlantic Forest Region of the South of Bahia, Brazil. Plant Soil 2001, 234, 15–26. [Google Scholar] [CrossRef] [Scilit]
- Franzluebbers, A.J.; Starks, P.J.; Steiner, J.L. Conservation of Soil Organic Carbon and Nitrogen Fractions in a Tallgrass Prairie in Oklahoma. Agronomy 2019, 9, 204. [Google Scholar] [CrossRef] [Scilit]
- Bieluczyk, W.; Piccolo, M.D.C.; Pereira, M.G.; Moraes, M.T.D.; Soltangheisi, A.; Bernardi, A.C.D.C.; Pezzopane, J.R.M.; Oliveira, P.P.A.; Moreira, M.Z.; Camargo, P.B.D.; et al. Integrated Farming Systems Influence Soil Organic Matter Dynamics in Southeastern Brazil. Geoderma 2020, 371, 114368. [Google Scholar] [CrossRef] [Scilit]
- Assmann, J.M.; Anghinoni, I.; Martins, A.P.; Costa, S.E.V.G.D.A.; Cecagno, D.; Carlos, F.S.; Carvalho, P.C.D.F. Soil Carbon and Nitrogen Stocks and Fractions in a Long-Term Integrated Crop–Livestock System under No-Tillage in Southern Brazil. Agric. Ecosyst. Environ. 2014, 190, 52–59. [Google Scholar] [CrossRef] [Scilit]
- Yellajosula, G.; Cihacek, L.; Faller, T.; Schauer, C. Soil Carbon Change Due to Land Conversion to Grassland in a Semi-Arid Environment. Soil Syst. 2020, 4, 43. [Google Scholar] [CrossRef] [Scilit]
- Franzluebbers, A.J.; Stuedemann, J.A. Soil-Profile Organic Carbon and Total Nitrogen during 12 Years of Pasture Management in the Southern Piedmont USA. Agric. Ecosyst. Environ. 2009, 129, 28–36. [Google Scholar] [CrossRef] [Scilit]
- Evans, C.R.W.; Krzic, M.; Broersma, K.; Thompson, D.J. Long-Term Grazing Effects on Grassland Soil Properties in Southern British Columbia. Can. J. Soil Sci. 2012, 92, 685–693. [Google Scholar] [CrossRef] [Scilit]
- Crème, A.; Rumpel, C.; Malone, S.L.; Saby, N.P.A.; Vaudour, E.; Decau, M.-L.; Chabbi, A. Monitoring Grassland Management Effects on Soil Organic Carbon—A Matter of Scale. Agronomy 2020, 10, 2016. [Google Scholar] [CrossRef] [Scilit]
- Frank, A.B.; Tanaka, D.L.; Hofmann, L.; Follett, R.F. Soil Carbon and Nitrogen of Northern Great Plains Grasslands as Influenced by Long-Term Grazing. J. Range Manag. 1995, 48, 470–474. [Google Scholar] [CrossRef] [Scilit]
- Liebig, M.A.; Gross, J.R.; Kronberg, S.L.; Phillips, R.L. Grazing Management Contributions to Net Global Warming Potential: A Long-term Evaluation in the Northern Great Plains. J. Environ. Qual. 2010, 39, 799–809. [Google Scholar] [CrossRef] [Scilit] [PubMed]
- Liebig, M.A.; Gross, J.R.; Kronberg, S.L.; Hanson, J.D.; Frank, A.B.; Phillips, R.L. Soil Response to Long-Term Grazing in the Northern Great Plains of North America. Agric. Ecosyst. Environ. 2006, 115, 270–276. [Google Scholar] [CrossRef] [Scilit]
- Liebig, M.A.; Kronberg, S.L.; Hendrickson, J.R.; Gross, J.R. Grazing Management, Season, and Drought Contributions to near-Surface Soil Property Dynamics in Semiarid Rangeland. Rangel. Ecol. Manag. 2014, 67, 266–274. [Google Scholar] [CrossRef] [Scilit]
- Wienhold, B.J.; Hendrickson, J.R.; Karn, J.F. Pasture Management Influences on Soil Properties in the Northern Great Plains. J. Soil Water Conserv. 2001, 56, 27–31. [Google Scholar] [CrossRef] [Scilit]
- Freitas, I.C.D.; Ribeiro, J.M.; Araújo, N.C.A.; Santos, M.V.; Sampaio, R.A.; Fernandes, L.A.; Azevedo, A.M.; Feigl, B.J.; Cerri, C.E.P.; Frazão, L.A. Agrosilvopastoral Systems and Well-Managed Pastures Increase Soil Carbon Stocks in the Brazilian Cerrado. Rangel. Ecol. Manag. 2020, 73, 776–785. [Google Scholar] [CrossRef] [Scilit]
- Reinhart, K.O.; Rinella, M.J.; Sanni Worogo, H.S.; Waterman, R.C.; Vermeire, L.T. Lessons from a next Generation Carbon Ranching Experiment. Geoderma 2022, 425, 116061. [Google Scholar] [CrossRef] [Scilit]
- McClelland, S.C.; Cotrufo, M.F.; Haddix, M.L.; Paustian, K.; Schipanski, M.E. Infrequent Compost Applications Increased Plant Productivity and Soil Organic Carbon in Irrigated Pasture but Not Degraded Rangeland. Agric. Ecosyst. Environ. 2022, 333, 107969. [Google Scholar] [CrossRef] [Scilit]
- Abagandura, G.O.; Mamo, M.; Schacht, W.H.; Shropshire, A.; Volesky, J.D. Soil Carbon and Nitrogen after Eight Years of Rotational Grazing in the Nebraska Sandhills Meadows. Geoderma 2024, 442, 116776. [Google Scholar] [CrossRef] [Scilit]
- Alemu, A.W.; Kröbel, R.; McConkey, B.G.; Iwaasa, A.D. Effect of Increasing Species Diversity and Grazing Management on Pasture Productivity, Animal Performance, and Soil Carbon Sequestration of Re-Established Pasture in Canadian Prairie. Animals 2019, 9, 127. [Google Scholar] [CrossRef] [Scilit] [PubMed]
- Bray, S.; Doran-Browne, N.; O’Reagain, P. Northern Australian Pasture and Beef Systems. 1. Net Carbon Position. Anim. Prod. Sci. 2014, 54, 1988. [Google Scholar] [CrossRef] [Scilit]
- Wu, Y.; Guo, Z.; Li, Z.; Liang, M.; Tang, Y.; Zhang, J.; Miao, B.; Wang, L.; Liang, C. The Main Driver of Soil Organic Carbon Differs Greatly between Topsoil and Subsoil in a Grazing Steppe. Ecol. Evol. 2022, 12, e9182. [Google Scholar] [CrossRef] [Scilit] [PubMed]
- Carvalhais, N.; Reichstein, M.; Seixas, J.; Collatz, G.J.; Pereira, J.S.; Berbigier, P.; Carrara, A.; Granier, A.; Montagnani, L.; Papale, D.; et al. Implications of the Carbon Cycle Steady State Assumption for Biogeochemical Modeling Performance and Inverse Parameter Retrieval. Glob. Biogeochem. Cycles 2008, 22, 2007GB003033. [Google Scholar] [CrossRef] [Scilit]
- Wutzler, T.; Reichstein, M. Soils Apart from Equilibrium—Consequences for Soil Carbon Balance Modelling. Biogeosciences 2007, 4, 125–136. [Google Scholar] [CrossRef] [Scilit]
- Olson, D.M.; Dinerstein, E.; Wikramanayake, E.D.; Burgess, N.D.; Powell, G.V.N.; Underwood, E.C.; D’amico, J.A.; Itoua, I.; Strand, H.E.; Morrison, J.C.; et al. Terrestrial Ecoregions of the World: A New Map of Life on Earth. BioScience 2001, 51, 933. [Google Scholar] [CrossRef] [Scilit]
- Yeluripati, J.B.; Van Oijen, M.; Wattenbach, M.; Neftel, A.; Ammann, A.; Parton, W.J.; Smith, P. Bayesian Calibration as a Tool for Initialising the Carbon Pools of Dynamic Soil Models. Soil Biol. Biochem. 2009, 41, 2579–2583. [Google Scholar] [CrossRef] [Scilit]
- Williams, J.R. The EPIC Model. In Computer Models of Watershed Hydrology; Singh, V.P., Ed.; Water Resources Publications: Highlands Ranch, CO, USA, 1995. [Google Scholar]
- Saltelli, A.; Tarantola, S.; Chan, K.P.-S. A Quantitative Model-Independent Method for Global Sensitivity Analysis of Model Output. Technometrics 1999, 41, 39–56. [Google Scholar] [CrossRef]
- Laloy, E.; Linde, N.; Vrugt, J.A. Mass Conservative Three-dimensional Water Tracer Distribution from Markov Chain Monte Carlo Inversion of Time-lapse Ground-penetrating Radar Data. Water Resour. Res. 2012, 48, 2011WR011238. [Google Scholar] [CrossRef] [Scilit]
- Vrugt, J.A.; Ter Braak, C.J.F.; Clark, M.P.; Hyman, J.M.; Robinson, B.A. Treatment of Input Uncertainty in Hydrologic Modeling: Doing Hydrology Backward with Markov Chain Monte Carlo Simulation. Water Resour. Res. 2008, 44, 2007WR006720. [Google Scholar] [CrossRef] [Scilit]
- Vrugt, J.A.; Ter Braak, C.J.F.; Gupta, H.V.; Robinson, B.A. Equifinality of Formal (DREAM) and Informal (GLUE) Bayesian Approaches in Hydrologic Modeling? Stoch. Environ. Res. Risk Assess. 2009, 23, 1011–1026. [Google Scholar] [CrossRef] [Scilit]
- Khaledi, V.; Baatz, R.; Antonijević, D.; Hoffmann, M.; Dietrich, O.; Lischeid, G.; Davies, M.F.; Merz, C.; Nendel, C. Evaluating MONICA’s Capability to Simulate Water, Carbon and Nitrogen Fluxes in a Wet Grassland at Contrasting Water Tables. Sci. Total Environ. 2024, 949, 174995. [Google Scholar] [CrossRef] [Scilit] [PubMed]
- Zhang, L.; Ren, T.; Yu, Y.; Yao, Y.; Li, C.; Zhao, Y.; Zhuang, Q.; Liu, Z.; Zhang, X.; Li, S. Optimization of Environmental Variable Functions of GPP Quantitative Model Based on SCE-UA and Minimum Loss Screening Method. Ecol. Inform. 2021, 66, 101479. [Google Scholar] [CrossRef] [Scilit]
- Duan, Q.; Sorooshian, S.; Gupta, V.K. Optimal Use of the SCE-UA Global Optimization Method for Calibrating Watershed Models. J. Hydrol. 1994, 158, 265–284. [Google Scholar] [CrossRef] [Scilit]
- Xu, Y.; Liu, C.; Yu, Q.; Zhao, C.; Quan, L.; Hu, C. Study on a Hybrid Hydrological Forecasting Model SCE-GUH by Coupling SCE-UA Optimization Algorithm and General Unit Hydrograph. Water 2023, 15, 2783. [Google Scholar] [CrossRef] [Scilit]
- Li, Q.; Gao, M.; Duan, S.; Yang, G.; Li, Z.-L. Integrating Remote Sensing Assimilation and SCE-UA to Construct a Grid-by-Grid Spatialized Crop Model Can Dramatically Improve Winter Wheat Yield Estimate Accuracy. Comput. Electron. Agric. 2024, 227, 109594. [Google Scholar] [CrossRef] [Scilit]
- Ren, J.; Yu, F.; Du, Y.; Qin, J.; Chen, Z. Assimilation of Field Measured LAI into Crop Growth Model Based on SCE-UA Optimization Algorithm. In Proceedings of the 2009 IEEE International Geoscience and Remote Sensing Symposium; IEEE: Piscataway, NJ, USA, 2009; pp. III-573–III-576. [Google Scholar]
- Houska, T.; Kraft, P.; Chamorro-Chavez, A.; Breuer, L. SPOTting Model Parameters Using a Ready-Made Python Package. PLoS ONE 2015, 10, e0145180. [Google Scholar] [CrossRef] [Scilit] [PubMed]
- Emde, D.; Poeplau, C.; Don, A.; Heilek, S.; Schneider, F. The Centennial Legacy of Land-use Change on Organic Carbon Stocks of German Agricultural Soils. Glob. Change Biol. 2024, 30, e17444. [Google Scholar] [CrossRef] [Scilit] [PubMed]
- Zhang, R.; Wei, Y.; Dong, C.; Wei, B.; Rillig, M.C.; Badgery, W.B.; Yang, G.; Liu, N.; Zhang, Y. Quantifying the Positive Effect of Ungulate Herbivory on Living Root-derived Soil Organic Carbon Formation: Evidence from an Eight-year Simulated Grazing Field Experiment with 13C Pulse Labeling. Glob. Change Biol. 2025, 31, e70336. [Google Scholar] [CrossRef] [Scilit] [PubMed]
- Mondragón Valencia, V.A.; Figueroa Casas, A.; Macias Pinto, D.J.; Rosas-Luis, R. Modeling Soil Organic Carbon Dynamics across Land Uses in Tropical Andean Ecosystems. Land 2025, 14, 2425. [Google Scholar] [CrossRef] [Scilit]
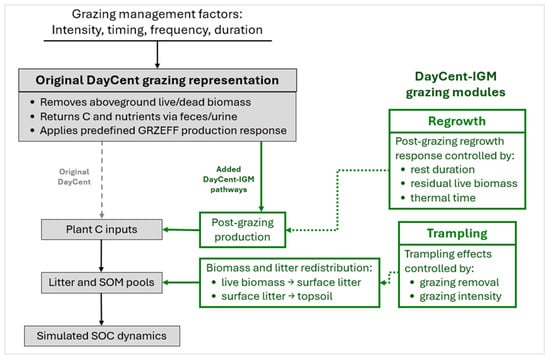
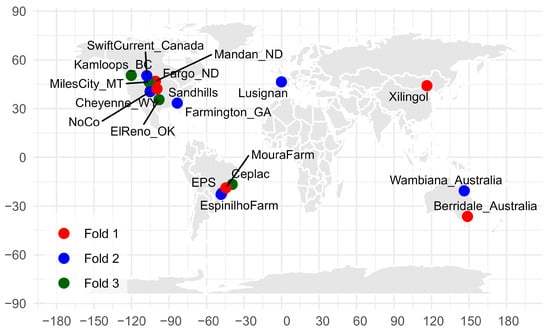
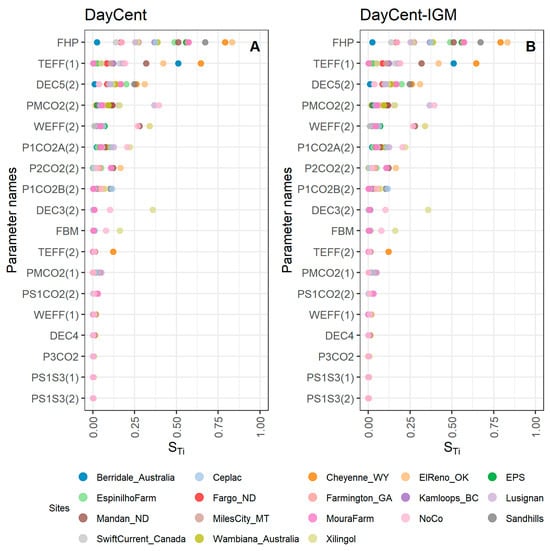
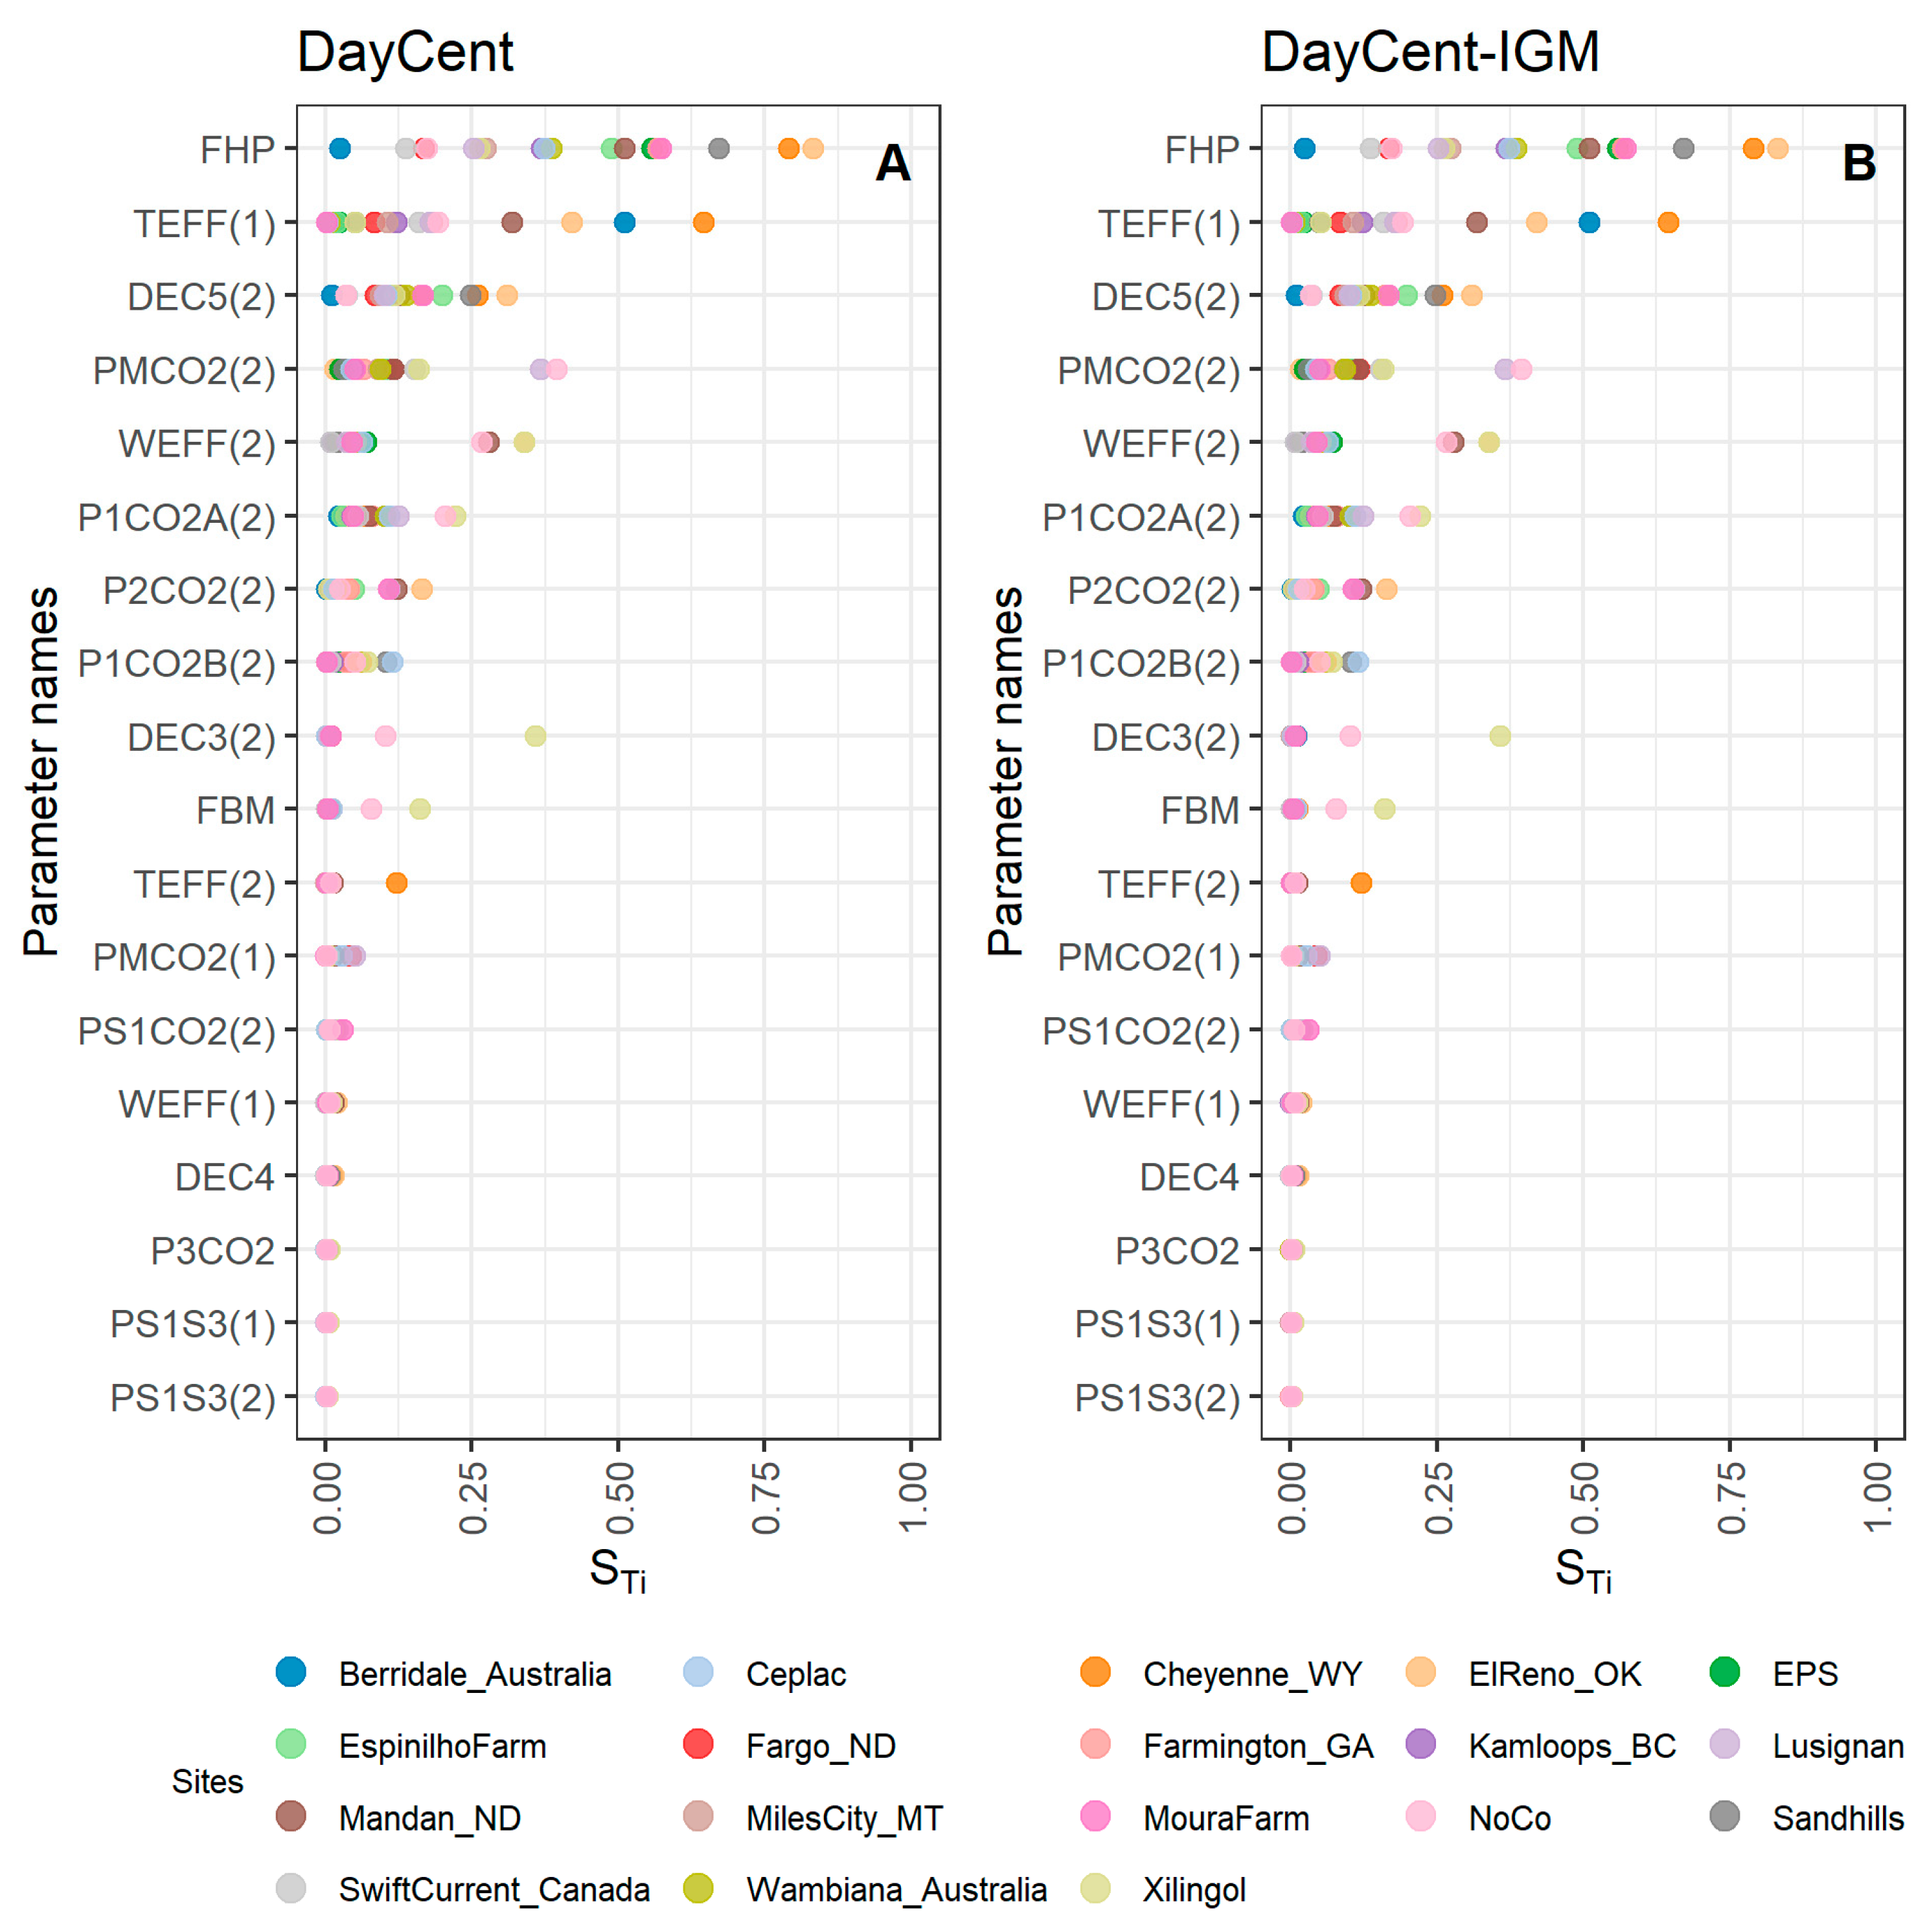
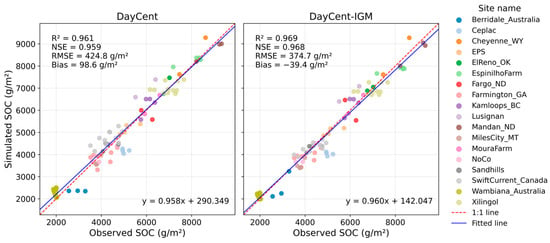
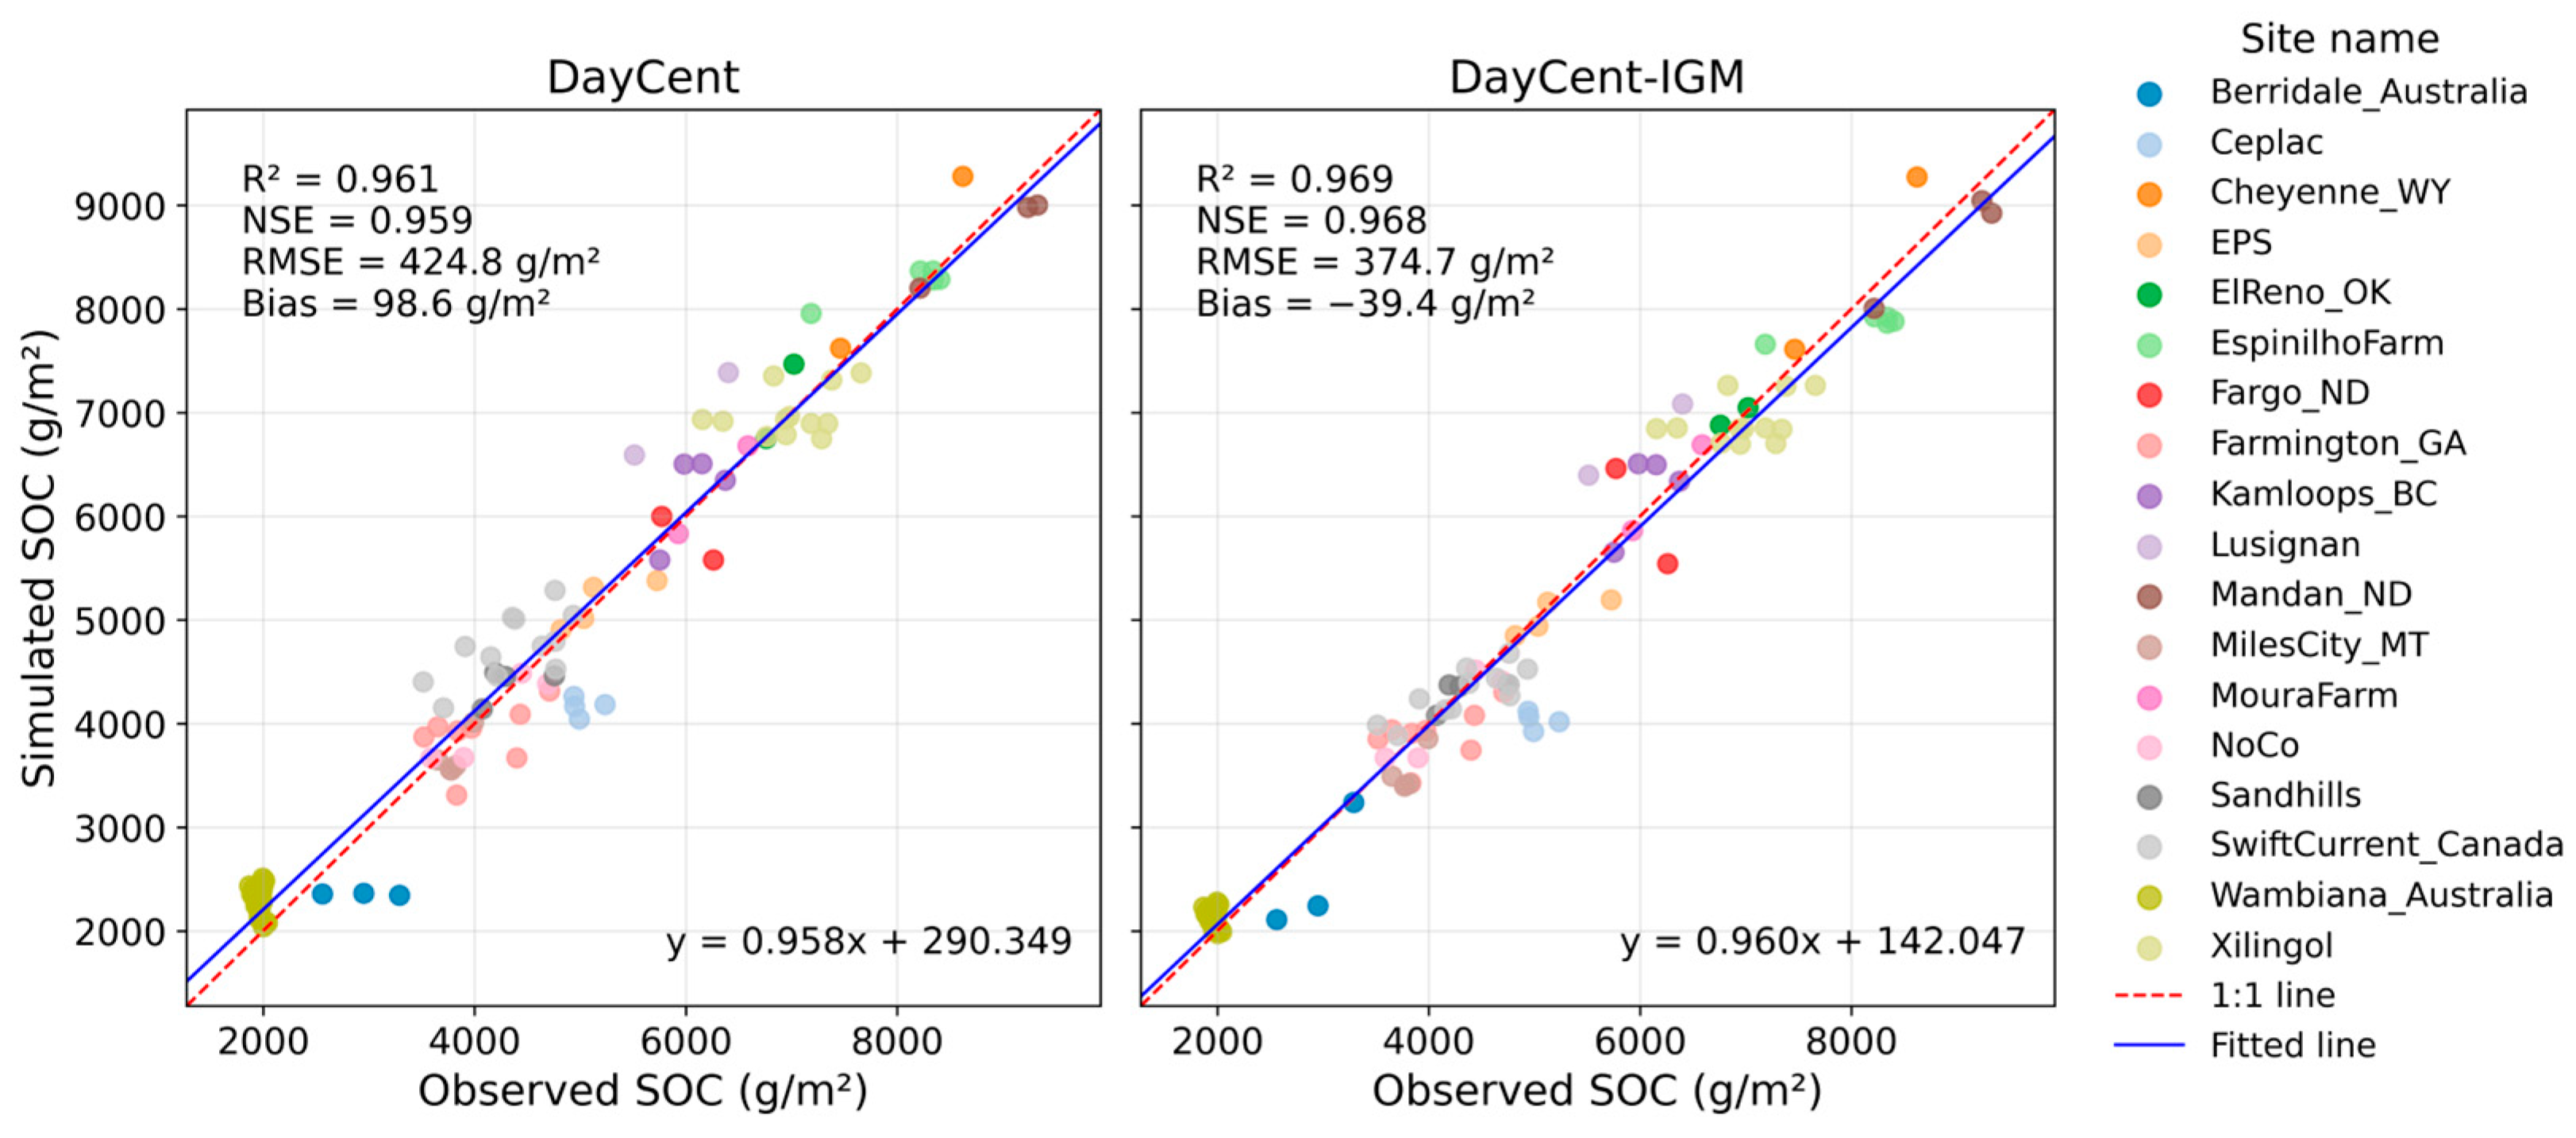
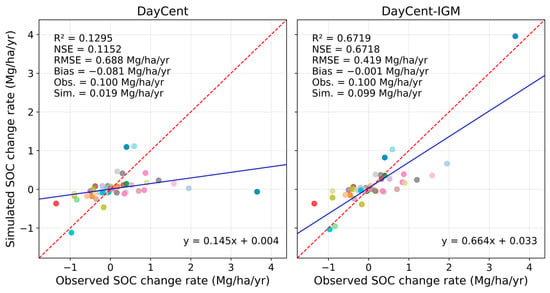

Disclaimer/Publisher’s Note: The statements, opinions and data contained in all publications are solely those of the individual author(s) and contributor(s) and not of MDPI and/or the editor(s). MDPI and/or the editor(s) disclaim responsibility for any injury to people or property resulting from any ideas, methods, instructions or products referred to in the content. |
© 2026 by the authors. Licensee MDPI, Basel, Switzerland. This article is an open access article distributed under the terms and conditions of the Creative Commons Attribution (CC BY) license.