Article

Hydraulic Performance of Multi-Phase Extraction Wells: From Laboratory Analysis to Field Validation

1
SGIDI Engineering Consulting (Group) Co., Ltd., Shanghai 200093, China
2
College of Environmental Science and Engineering, Tongji University, Shanghai 200092, China
*
Author to whom correspondence should be addressed.
Environments 2026, 13(5), 268; https://doi.org/10.3390/environments13050268
Submission received: 2 April 2026 / Revised: 4 May 2026 / Accepted: 5 May 2026 / Published: 11 May 2026

Abstract

Subsurface contamination at low-permeability petrochemical sites necessitates long-term multi-phase extraction (MPE), yet operational sustainability is frequently compromised by well-bore clogging. This study develops a “prevent–identify–remediate” strategy through integrated laboratory and field-based investigations. Laboratory bench tests identified a critical packing density threshold of 70%, above which permeability loss escalates rapidly. Furthermore, rounded quartz sand maintained a significantly higher permeability ratio (0.4) compared to irregular zeolite (0.1). These findings were validated through a longitudinal two-year field pilot study in a silty-clay formation. Innovative large-diameter wells (200 mm) utilising optimised quartz sand showed high resilience, with only a 20% reduction in discharge capacity over 24 months. In contrast, conventional wells using local yellow sand exhibited severe physical clogging, resulting in a 57% decrease in stable flow. The study also characterised a diameter effect, where small-diameter wells (63 mm) proved inherently more vulnerable to rapid performance degradation regardless of filter media. To address existing impairment, high-pressure water jetting and dilute hydrochloric acid washing restored flow capacity by 50% and 40%, respectively. By coupling mechanistic insights with field evidence, this research provides a comprehensive platform for the sustainable design and maintenance of subsurface remediation infrastructure, ensuring long-term operational efficiency and reduced resource consumption.

1. Introduction

Groundwater contamination by petroleum hydrocarbons at petrochemical sites remains difficult to remediate, particularly where low-permeability deposits such as silty clays and glacial tills are present [1]. In these settings, hydraulic conductivities are typically between 10 5   a n d   10 7 m / s . Light non-aqueous phase liquids (LNAPLs) commonly span the vadose zone, capillary fringe, and saturated zone and occur as vapour, dissolved, and separate-phase components [2]. Conventional single-phase techniques (for example, pump-and-treat or stand-alone soil vapour extraction) often recover only a small fraction of this mass because they target either the aqueous or vapour phase in isolation and poorly address the smear zone [3].
Multi-Phase Extraction (MPE) has become a key technology for such conditions because it combines groundwater, LNAPL, and vapour recovery in a single system [4]. Long-term field studies of LNAPL recovery have shown that extraction rates frequently decrease following a characteristically non-linear path [5]. At one case-study site, the recovery rate averaged 13.2 L/day over a three-year period but began to plateau as the most mobile mass was removed and the wellbore became progressively clogged [6]. Laboratory experiments have quantified this more precisely, showing that the hydraulic conductivity of a column packed with sand and gravel could decrease by an entire order of magnitude within 17 days of continuous flow [7]. In Managed Aquifer Recharge (MAR) analogs, the flow rate through columns was found to drop to 20–50% of its initial value within 22 days, even with influent suspended solids as low as 3–4 mg/L [8].
Well efficiency is a standard metric used to track the ageing process of extraction wells. Efficiency is typically defined as the ratio of theoretical specific capacity to actual specific capacity. Case studies have found that many irrigation and remediation wells operate at efficiencies as low as 35–50% [9], whereas a properly designed and maintained well should exceed 80%. The transition from laminar to turbulent flow near the well screen is a key indicator of deterioration. As clogging reduces the available open area, the velocity of the remaining flow increases, leading to turbulence and a corresponding increase in well losses. Monitoring the δ 0 parameter-numerically related to the flow rate, where well loss equals aquifer loss, serves as a reliable indicator: an increase in δ 0 over time signals a progressive increase in turbulent resistance and the need for rehabilitation [10].
Four main clogging mechanisms are recognised: physical, chemical, biological, and gas-related [11,12,13]. Physical clogging by fine particle migration and deposition is generally dominant, with several studies attributing approximately 50–80% of overall performance loss to this mechanism. High vacuum and steep hydraulic gradients in MPE systems mobilise silt- and clay-sized particles that would remain stable under lower gradients [14,15,16]. Laboratory tests on stratified sand–clay media show that fines accumulate at interfaces and can cause one to two orders of magnitude reduction in local hydraulic conductivity [17,18]. In filter-pack columns, size exclusion and hydrodynamic bridging at pore throats and screen slots reduce effective pore cross-section, and permeability ratios commonly decline to between 0.1 and 0.4 within days to weeks, depending on grain-size distribution and packing density [19].
Chemical clogging results from mineral precipitation driven by redox and pH changes. In systems where anaerobic groundwater contains dissolved ferrous iron, exposure to oxygen leads to ferric hydroxide formation [20]. Biofouling involves the growth of microorganisms and the production of extracellular polymeric substances (EPS) that form resilient biofilms on the surfaces of the well screen and the adjacent aquifer [21]. In petrochemical sites, the presence of hydrocarbons serves as a substrate for nutrient-driven microbial proliferation. Biofilms act as a biological glue that not only reduces the available pore space but also captures migrating fine particles, exponentially accelerating the clogging rate compared to a physical process alone [22]. Quantitative studies have shown that biofilms can occupy 7–20% of the total pore space, leading to a reduction in hydraulic conductivity of 60–77% within as little as 74 h under high-nutrient conditions [8]. Once established, these biofilms are robust and resistant to mechanical sloughing, often necessitating the use of biocides or oxidizing agents like chlorine. The combined effect of all clogging mechanisms on long-term extraction well performance has been reviewed by several authors [23,24], who emphasise that rehabilitation frequency and method selection must be site-specific and informed by continuous hydraulic monitoring. More broadly, the design criteria for well screens and filter packs in low-permeability aquifers have been discussed extensively for water-supply applications but remain underexplored for the high-vacuum, multi-phase conditions of remediation systems.
Despite the extensive body of research on individual clogging mechanisms, several critical gaps persist that limit the long-term effectiveness of MPE systems: (1) Much of the quantitative data on well clogging is derived from laboratory column experiments lasting only days. There is a profound lack of longitudinal data that captures the full extent of time-dependent processes like mineral transformation, biofilm maturation, and gradual “ageing” in representative environmental conditions. (2) While individual techniques for physical (jetting) or chemical (acid washing) cleaning are known, they are rarely integrated into a cohesive lifecycle management strategy that includes proactive design and real-time hydraulic identification. (3) There is a lack of clear, quantitative design thresholds (e.g., grain size ratios, density limits) specifically tailored for MPE wells operating in low-permeability silty clays. Traditional rules of thumb from water supply wells do not account for the high-vacuum gradients and multi-phase fluid interactions characteristic of petrochemical remediation.
This study addresses these gaps by combining controlled laboratory mechanism analysis with a field monitoring programme at a silty-clay petrochemical site. The laboratory work quantifies how filter material, packing density, and fluid viscosity affect permeability ratios and identifies density thresholds where clogging risk escalates. The field component compares the hydraulic performance of conventional and modified MPE wells differing in diameter and filter structure. Based on these data, an integrated “prevent-identify-remediate” framework is developed, linking quantitative design criteria, diagnostic thresholds, and targeted physical and chemical rehabilitation, with the aim of improving the durability and predictability of MPE systems in low-permeability aquifers.

2. Materials and Methods

2.1. Laboratory Bench Tests

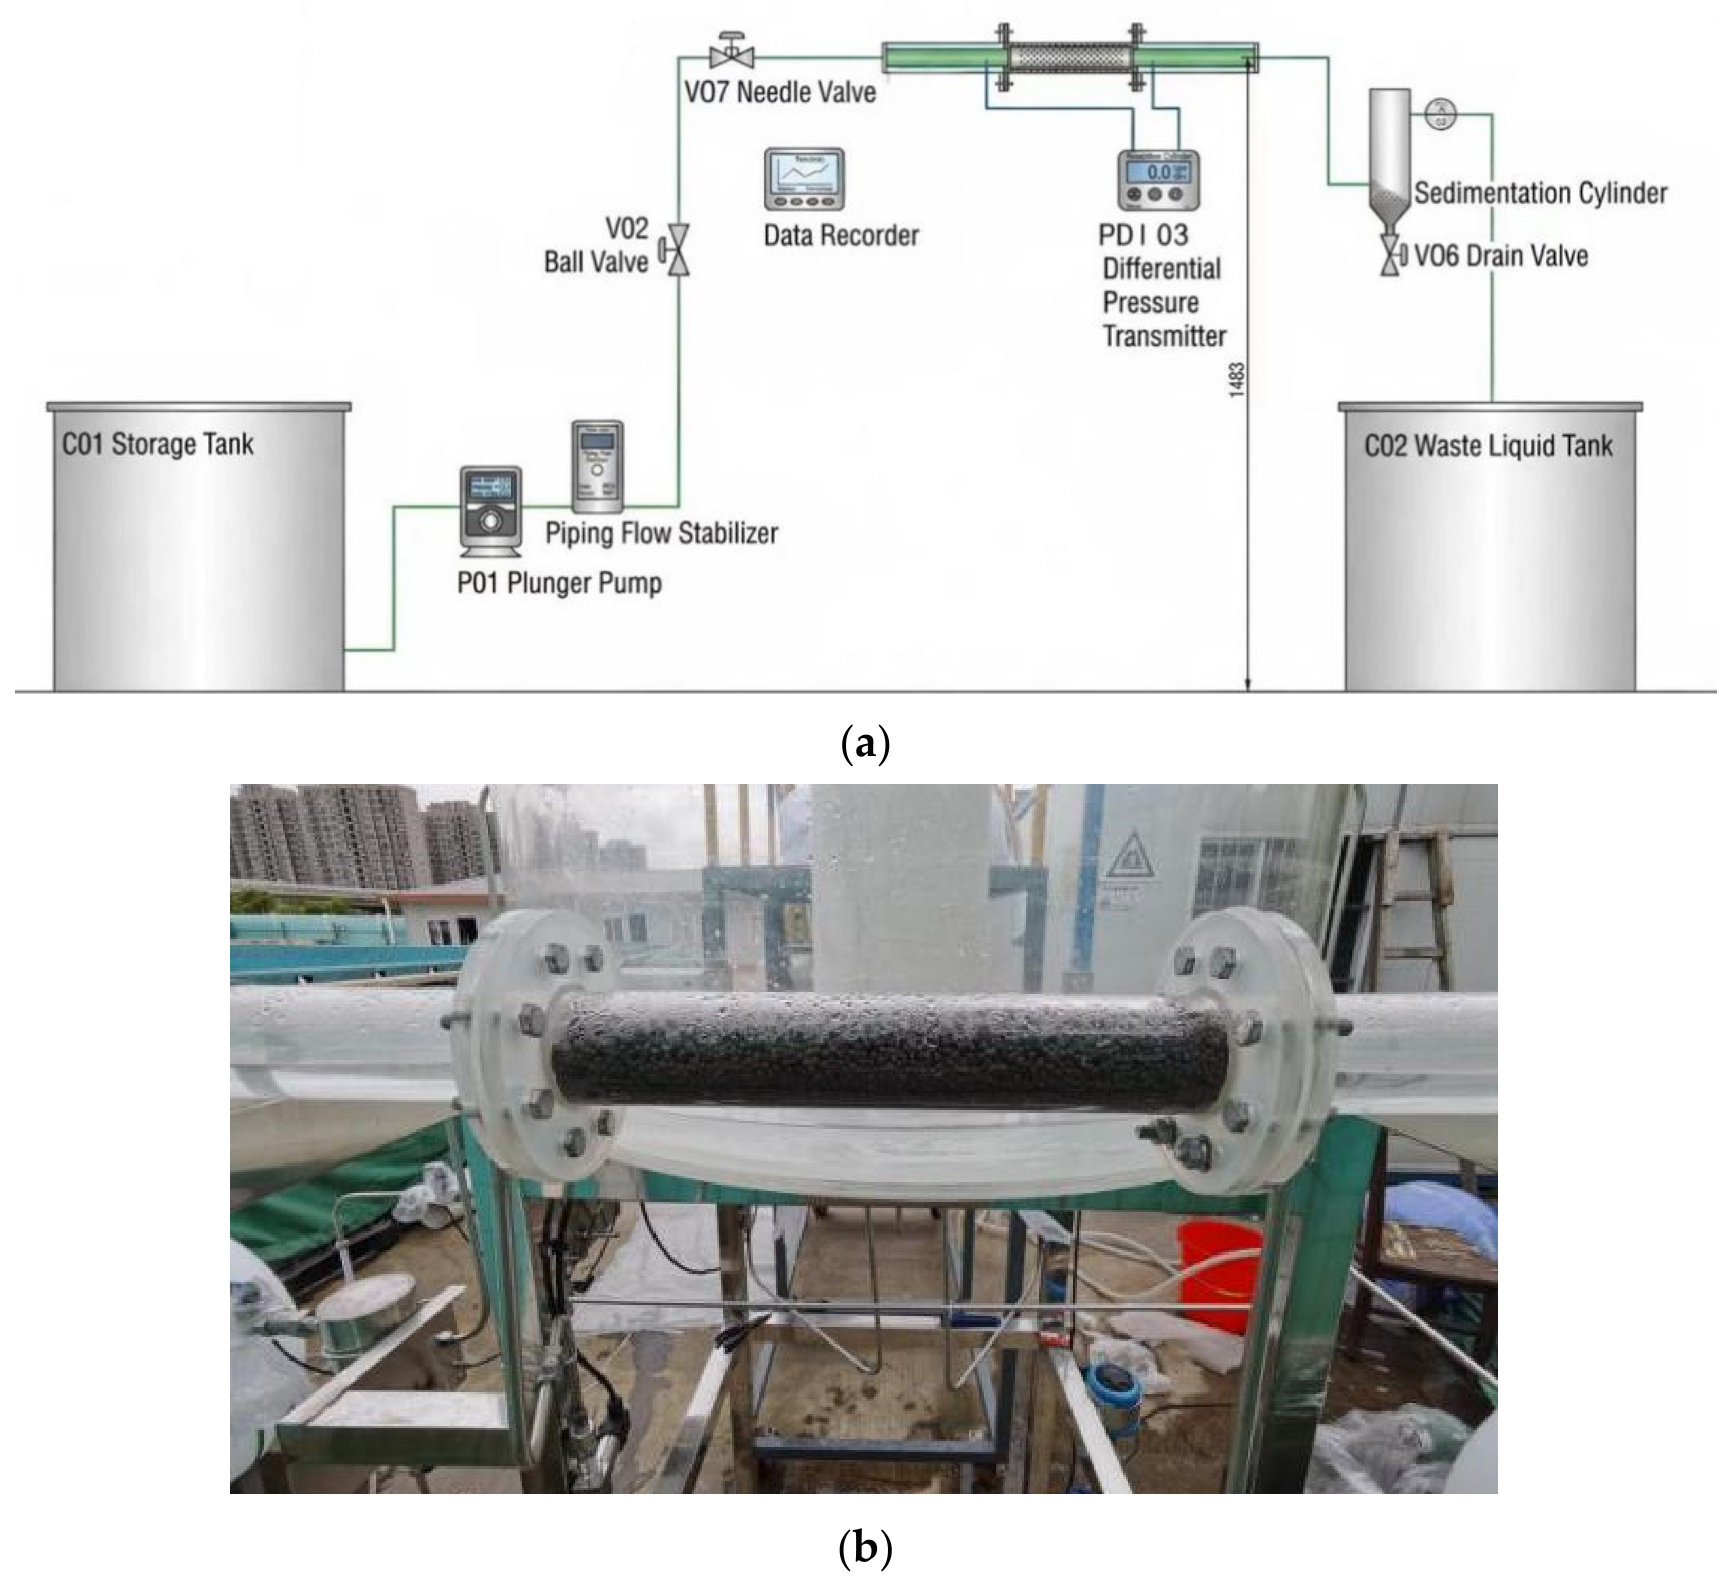
The laboratory investigation utilised a Darcy-based constant-flow testing system to evaluate the permeability evolution of filter media under simulated clogging conditions. This experimental approach was selected to replicate the hydraulic stresses encountered at the well-bore interface during vacuum-assisted multi-phase extraction, where the pump maintains a steady extraction effort against increasing subsurface resistance.
The experimental rig consists of a high-precision plunger pump (Hebei Chenlong Pump Industry Co., Ltd., Shijiazhuang, China), a transparent acrylic filter column, and a differential pressure monitoring assembly (Figure 1). The use of a transparent acrylic column—rather than opaque materials—allowed for the visual observation of particle migration and the formation of clogging layers within the filter pack. The column dimensions were standardised at an internal diameter of 50 mm and a height of 150 mm.
To ensure hydraulic consistency, all filter media were pre-saturated with deionised water to remove entrapped air before testing. During the displacement tests, a constant flow rate was maintained, and the pressure drop across the filter column was recorded at 10-s intervals using high-sensitivity differential pressure transducers(Kunlun Haian Sensing Technology Co., Ltd., Guangzhou, China). These measurements were used to calculate the instantaneous hydraulic conductivity based on Darcy’s Law. Results are primarily presented as the permeability ratio, where the initial hydraulic conductivity of the pristine filter media is, providing a normalised measure of performance degradation over time.

2.2. Material Characterisation and Experimental Parameters

This study investigated the impact of three key variables on well longevity: filter material morphology, initial packing density, and fluid viscosity. The physical properties of the three selected filter media—zeolite (Hebei Huabo New Material Technology Co., Ltd., Handan, China), yellow sand (locally sourced), and quartz sand (Lianyungang Kedi Mineral Powder Co., Ltd., Lianyungang, China)—are summarised in Table 1.
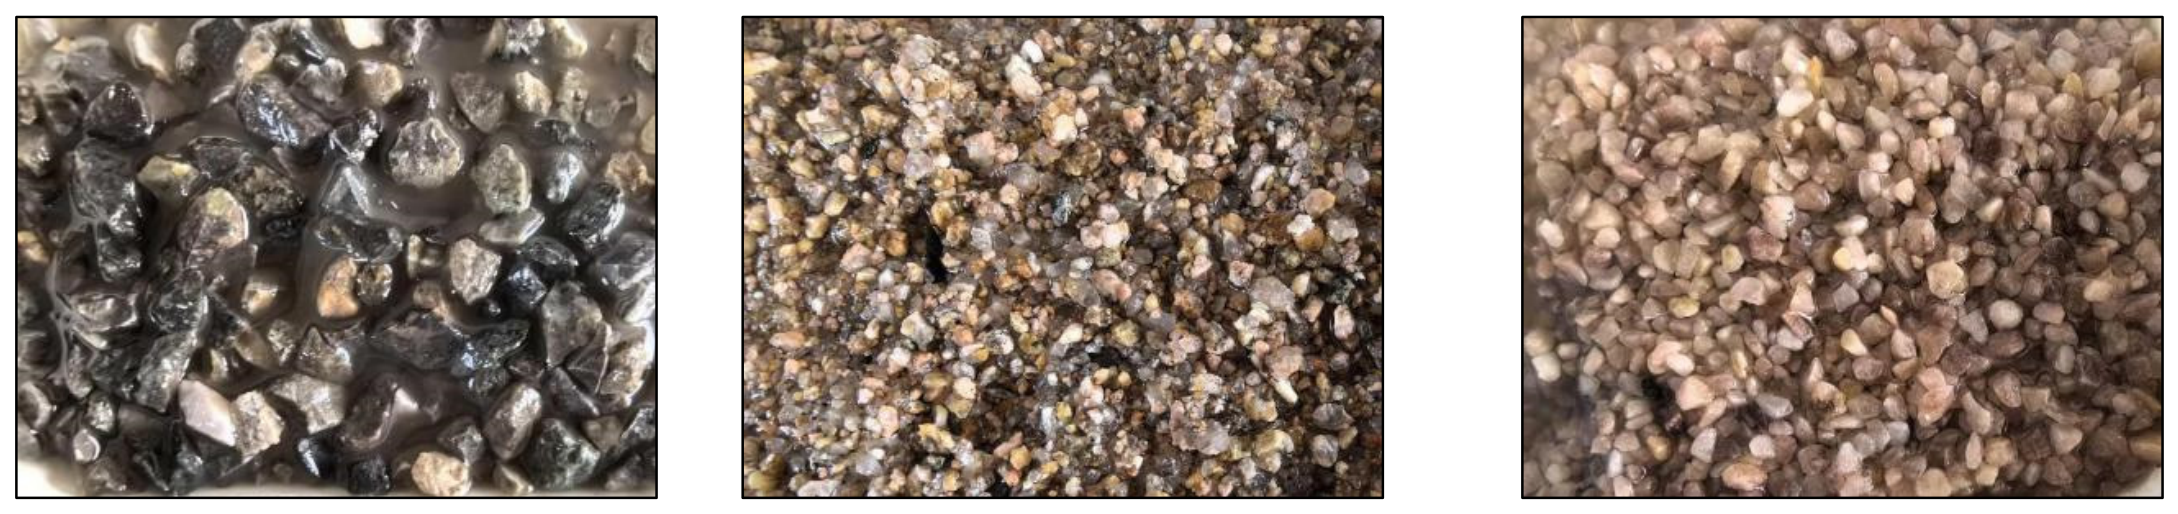
The morphology of these materials was further examined using high-resolution imaging to characterise grain sphericity and surface roughness (Figure 2). Quartz sand was selected for its high degree of uniformity and rounded grain structure, which promotes a stable pore-throat geometry less susceptible to the mechanical “bridging” of fine particles.
To simulate the physical clogging processes common in silty-clay aquifers, a suspension of fine formation particles (fraction < 63 μ m) was introduced into the system. The experimental matrix included:
1.
Packing Density: The media were packed at densities ranging from 60% to 90% of the maximum dry density to identify the critical threshold at which pore-throat constriction becomes irreversible;
2.
Fluid Viscosity: To simulate the transport of multi-phase fluids and petroleum hydrocarbons (NAPLs), the viscosity of the permeant was adjusted between 0.5 and 2.0 mPa·s. This allowed for the evaluation of how increased fluid-drag forces influence the retention of fine particles within the filter pack.

2.3. Field Pilot Setup

A two-year field pilot study was established at a petrochemical-contaminated site to validate the laboratory findings under complex subsurface conditions. The site is characterised by a stratigraphy dominated by silty-clay layers, which present significant challenges for long-term remediation due to their high fine-particle content and susceptibility to clogging.
Based on the laboratory results, two primary well designs were implemented for comparison:
  • A-type Wells (Innovative): These wells utilised the optimised rounded quartz sand filter pack, which laboratory tests identified as the most resilient against clogging.
  • R-type Wells (Conventional Control): These wells were constructed using standard local yellow sand with a single-layer filter structure, representing the current industry standard for the site region.
To quantify the “diameter effect” on well-aging, both designs were implemented in two sizes: 200 mm (designated A1 and R1) and 63 mm (designated A2 and R2). All wells were constructed using standard multi-phase extraction (MPE) specifications, incorporating horizontal slotted screens positioned across the primary contamination zones.
Performance was monitored continuously for 24 months. The primary metrics for evaluating hydraulic efficiency were the stable discharge rate ( m 3 / h ) and the specific cumulative recovery rate. The latter provides a standardised measure of well productivity by accounting for the total volume of water recovered per unit of drawdown over time, effectively filtering out seasonal fluctuations in the water table to provide a clear view of the progressive clogging trend.

2.4. Mathematical Indicators of Hydraulic Recovery

The assessment of well-bore clogging and the restoration of hydraulic capacity relies on two primary indicators: the Cumulative Recovery Rate ( S i ) and the Specific Cumulative Recovery Rate ( Δ S i ). These metrics allow for the normalisation of water level data, enabling a direct comparison between wells of different designs and operational histories. Both indicators are adapted from the classic slug-test recovery analysis framework established by Hvorslev [23] and subsequently applied to remediation well performance assessment by Polak et al. [10]. The Cumulative Recovery Rate (Si) is derived from the principle of hydraulic head normalisation, which scales the observed recovery against the total drawdown to produce a dimensionless index independent of absolute water-table elevation. The Specific Cumulative Recovery Rate (ΔSi) extends this concept by introducing a time-derivative component, quantifying the rate at which hydraulic head is restored per unit time. This temporal normalisation is analogous to the specific capacity concept widely employed in well hydraulics, enabling the separation of formation transmissivity effects from well-bore skin effects and making it a sensitive indicator of progressive clogging at the well-formation interface.
The Cumulative Recovery Rate represents the proportion of the hydraulic head that has been recovered at a specific time relative to the total drawdown achieved during the extraction phase. It is a dimensionless value, often expressed as a percentage, that tracks the progress of the well’s return to its static equilibrium. It is calculated using the following equation:
S i = h i h L h L h 0
where:
  • S i is the cumulative recovery rate at time t i ;
  • h i is the liquid level (head) measured at time t i (m);
  • h L is the minimum liquid level reached at the point of maximum drawdown (m);
  • h 0 is the initial static liquid level before extraction commenced (m).
In this convention, as the water level recovers from h L toward h 0 , the value of S i increases from 0% to 100%, providing a clear visual representation of the hydraulic refilling process.
The Specific Cumulative Recovery Rate (or Unit Cumulative Recovery Rate) provides a measure of the velocity of the hydraulic recovery. By dividing the recovery proportion by the elapsed time since the start of the recovery phase, this metric identifies how quickly the well-bore interface allows fluid to re-enter the system. It is defined as:
Δ S i = S i t i t L
where:
  • Δ S i is the specific cumulative recovery rate at time t i ( s 1 );
  • S i is the cumulative recovery rate at time t i ;
  • t i is the total elapsed time at the i-th measurement (s);
  • t L is the time duration at which the minimum liquid level ( h L ) was achieved (s).

3. Laboratory Insights into Clogging Mechanisms

3.1. Material Influence on Permeability Evolution

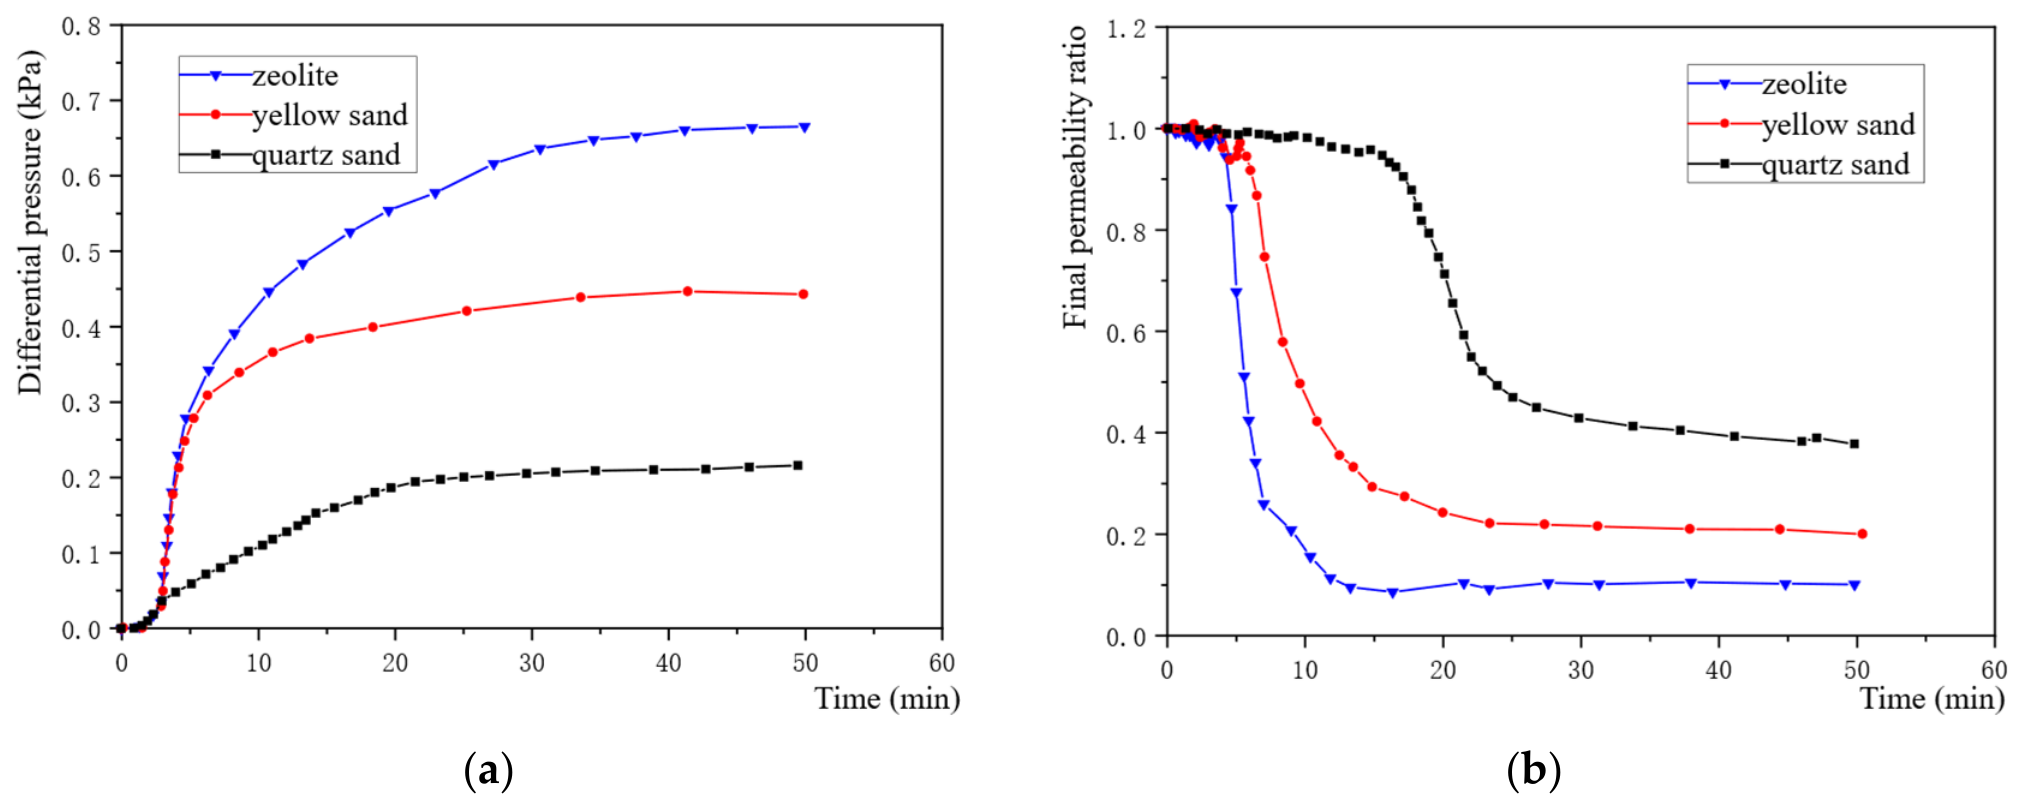
The experimental results illustrated in Figure 3 demonstrate that the morphology and surface characteristics of the filter media are primary determinants of hydraulic longevity. During the constant-flow displacement tests, all materials exhibited an initial decline in the permeability ratio ( K / K 0 ) as fine particles began to accumulate within the pore spaces. However, the magnitude of this decline varied significantly across the three tested media.
Quartz sand exhibited the highest resilience to physical clogging, with the permeability ratio eventually stabilising at approximately 0.4. In contrast, yellow sand and zeolite showed much more severe performance degradation, with their K / K 0 values dropping to approximately 0.15 and 0.1, respectively. This stark contrast is attributed to the geometric arrangement of the pore channels. As shown in the material characterisation, quartz sand is characterised by high grain sphericity and a rounded, smooth surface. This creates uniform, well-connected pore throats that are less likely to facilitate the mechanical “bridging” of fine particles.
Conversely, the angular and irregular grain shapes of zeolite and yellow sand create a more complex and tortuous pore network. The rough surface texture increases the frictional resistance and provides numerous sites for particle attachment. In these materials, fine particles from the formation are easily trapped at narrow constrictions, leading to a rapid reduction in the effective flow area. These findings suggest that for long-term remediation applications, the use of high-sphericity quartz sand is a critical “preventative” measure to maintain subsurface hydraulic capacity.

3.2. Packing Density and the Critical 70% Threshold

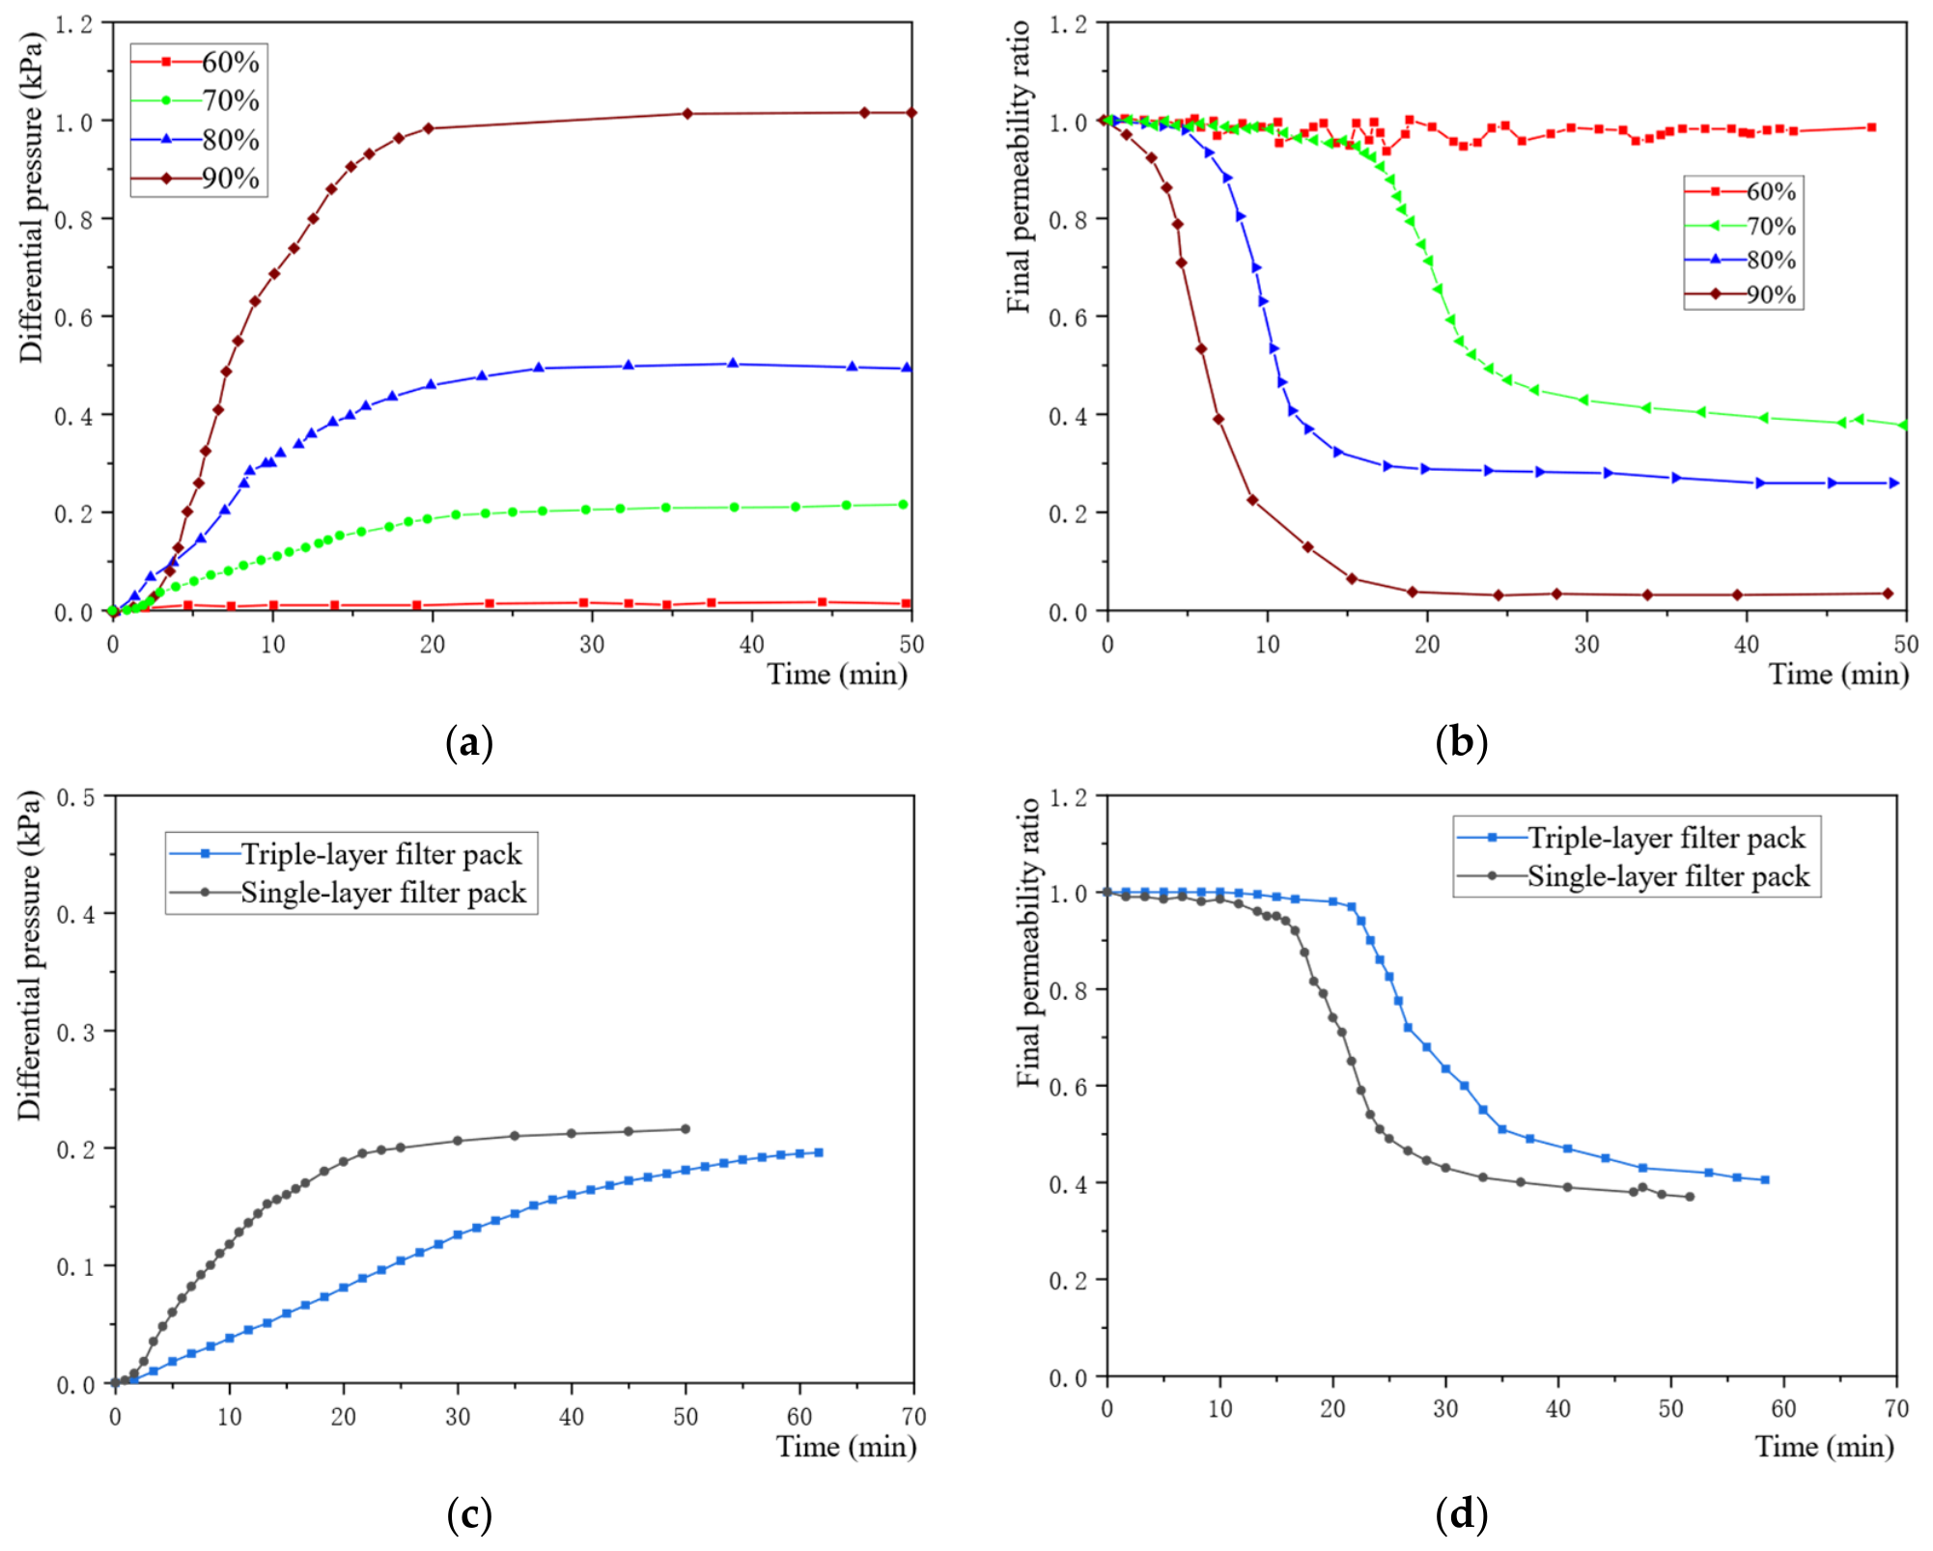
Operational factors, particularly the initial packing density of the filter pack, play a decisive role in the onset of clogging. Figure 4 reveals a clear non-linear relationship between filter density and hydraulic stability. At lower packing densities (60% to 70% of maximum dry density), the filter media maintained a relatively stable permeability ratio for an extended period, allowing fine particles to be stored within the pore volume without causing immediate hydraulic failure.
However, a critical density threshold was observed at 70%. Once the packing density exceeded this value, the risk of clogging escalated sharply. For samples packed at 80% and 90% density, we observed immediate and severe pressure spikes shortly after the introduction of fine-particle suspensions. In these high-density configurations, the initial pore volume is significantly reduced, and pore throats are already constricted. Consequently, even a small amount of particle deposition is sufficient to trigger a total blockage of the flow paths.
This threshold has significant implications for field construction. While traditional well-drilling practices often emphasise tight packing to prevent formation collapse, these results indicate that over-compaction of the filter pack creates a high-sensitivity environment where clogging occurs almost instantaneously. Maintaining a controlled density below 70% provides a necessary buffer that allows the well to accommodate particle migration from the formation while preserving its core hydraulic function.
Traditional single-layer filter packs are highly susceptible to surface clogging, where fine particles accumulate at the outermost interface of the filter media, forming a low-permeability filter cake that prevents fluid entry into the well. The multi-layer graded structure—where the filter grain size increases progressively from the formation interface toward the well screen—demonstrates a clear synergistic effect. By providing a staggered pore-throat geometry, the graded structure facilitates depth filtration. This allows fine particles to penetrate and be stored at various depths within the filter media rather than concentrating entirely at the surface. Laboratory measurements show that this graded approach significantly delays the onset of the primary clogging event, extending the service life of the filter pack by distributing the particle load across its entire thickness.

3.3. Impact of Fluid Viscosity on Clogging Kinetics

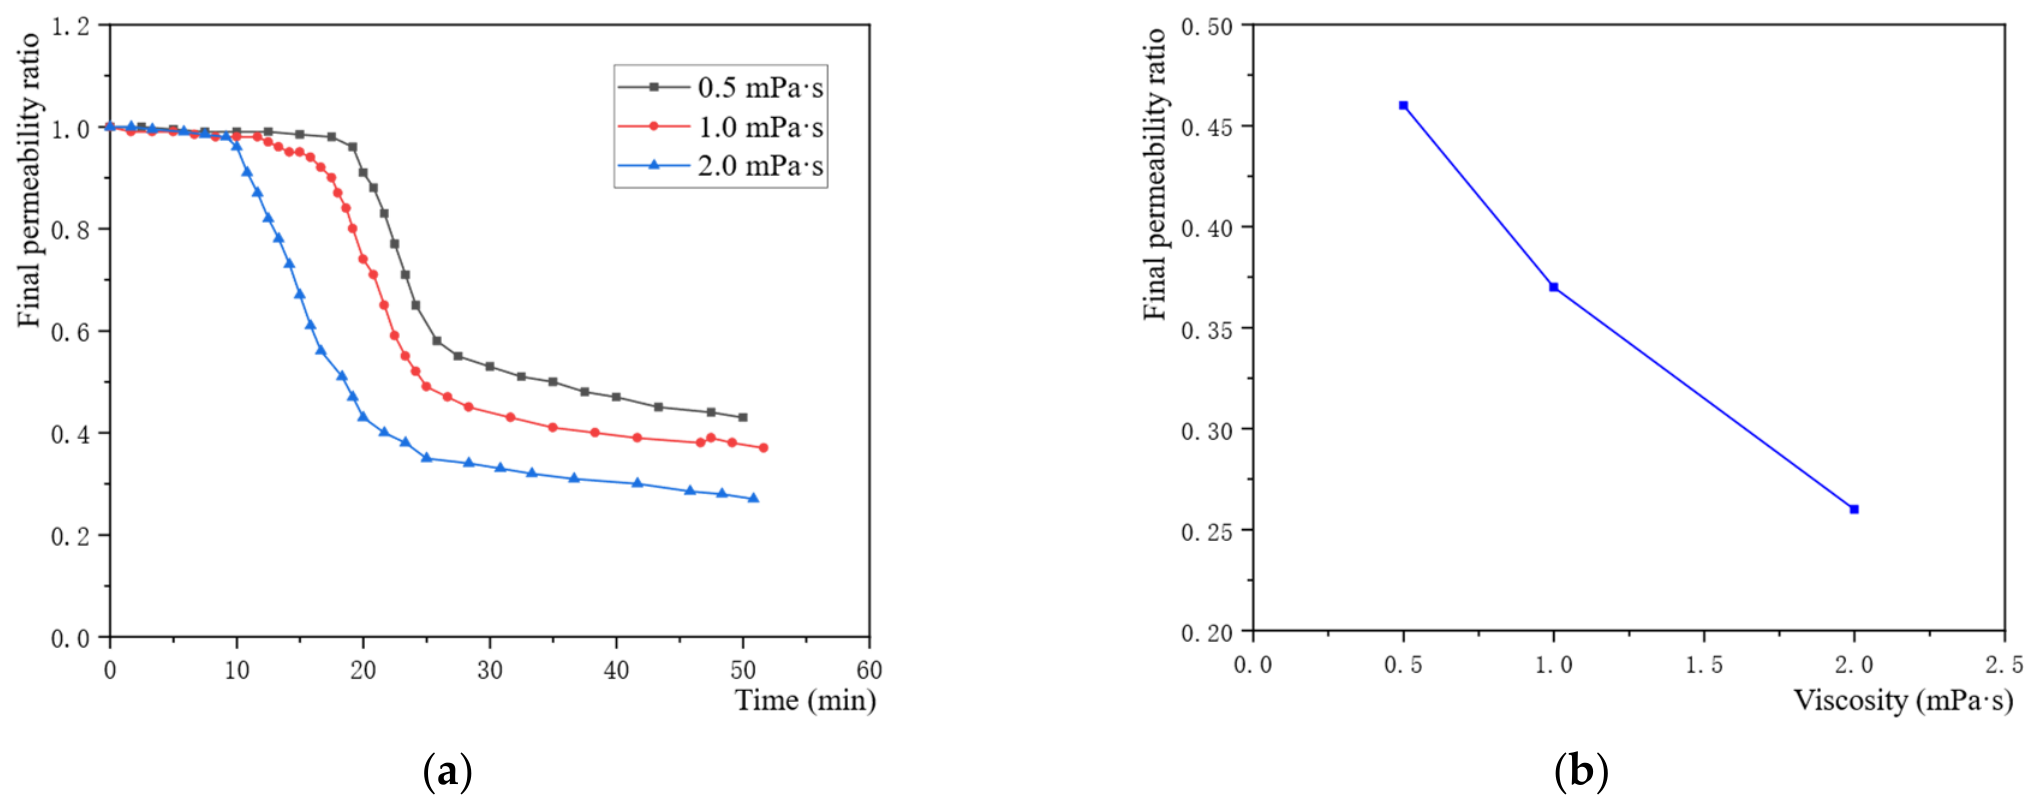
To simulate the impact of petroleum hydrocarbons (NAPLs) on well longevity, the influence of fluid viscosity was evaluated in Figure 5. As the viscosity of the permeant was increased from 0.5 to 2.0 mPa·s, the rate of permeability decline accelerated significantly. Higher fluid viscosity increases the viscous drag forces acting on fine particles within the pore channels, making it more difficult for them to pass through the filter media.
This increased drag facilitates the retention of particles that might otherwise remain mobile under standard water-flow conditions. Furthermore, the presence of high-viscosity fluids reduces the effective velocity within the pore throats, lowering the threshold for particle settling and entrapment. These findings highlight that in petrochemical sites where high-viscosity LNAPLs or DNAPLs are present, the clogging process is inherently more aggressive, requiring more robust anti-clogging designs—such as the rounded quartz sand that exhibits high resilience to clogging due to its smooth surface and well-connected pore throats (see Section 3.1)—to ensure sustainable operation.

4. Field Performance Evaluation

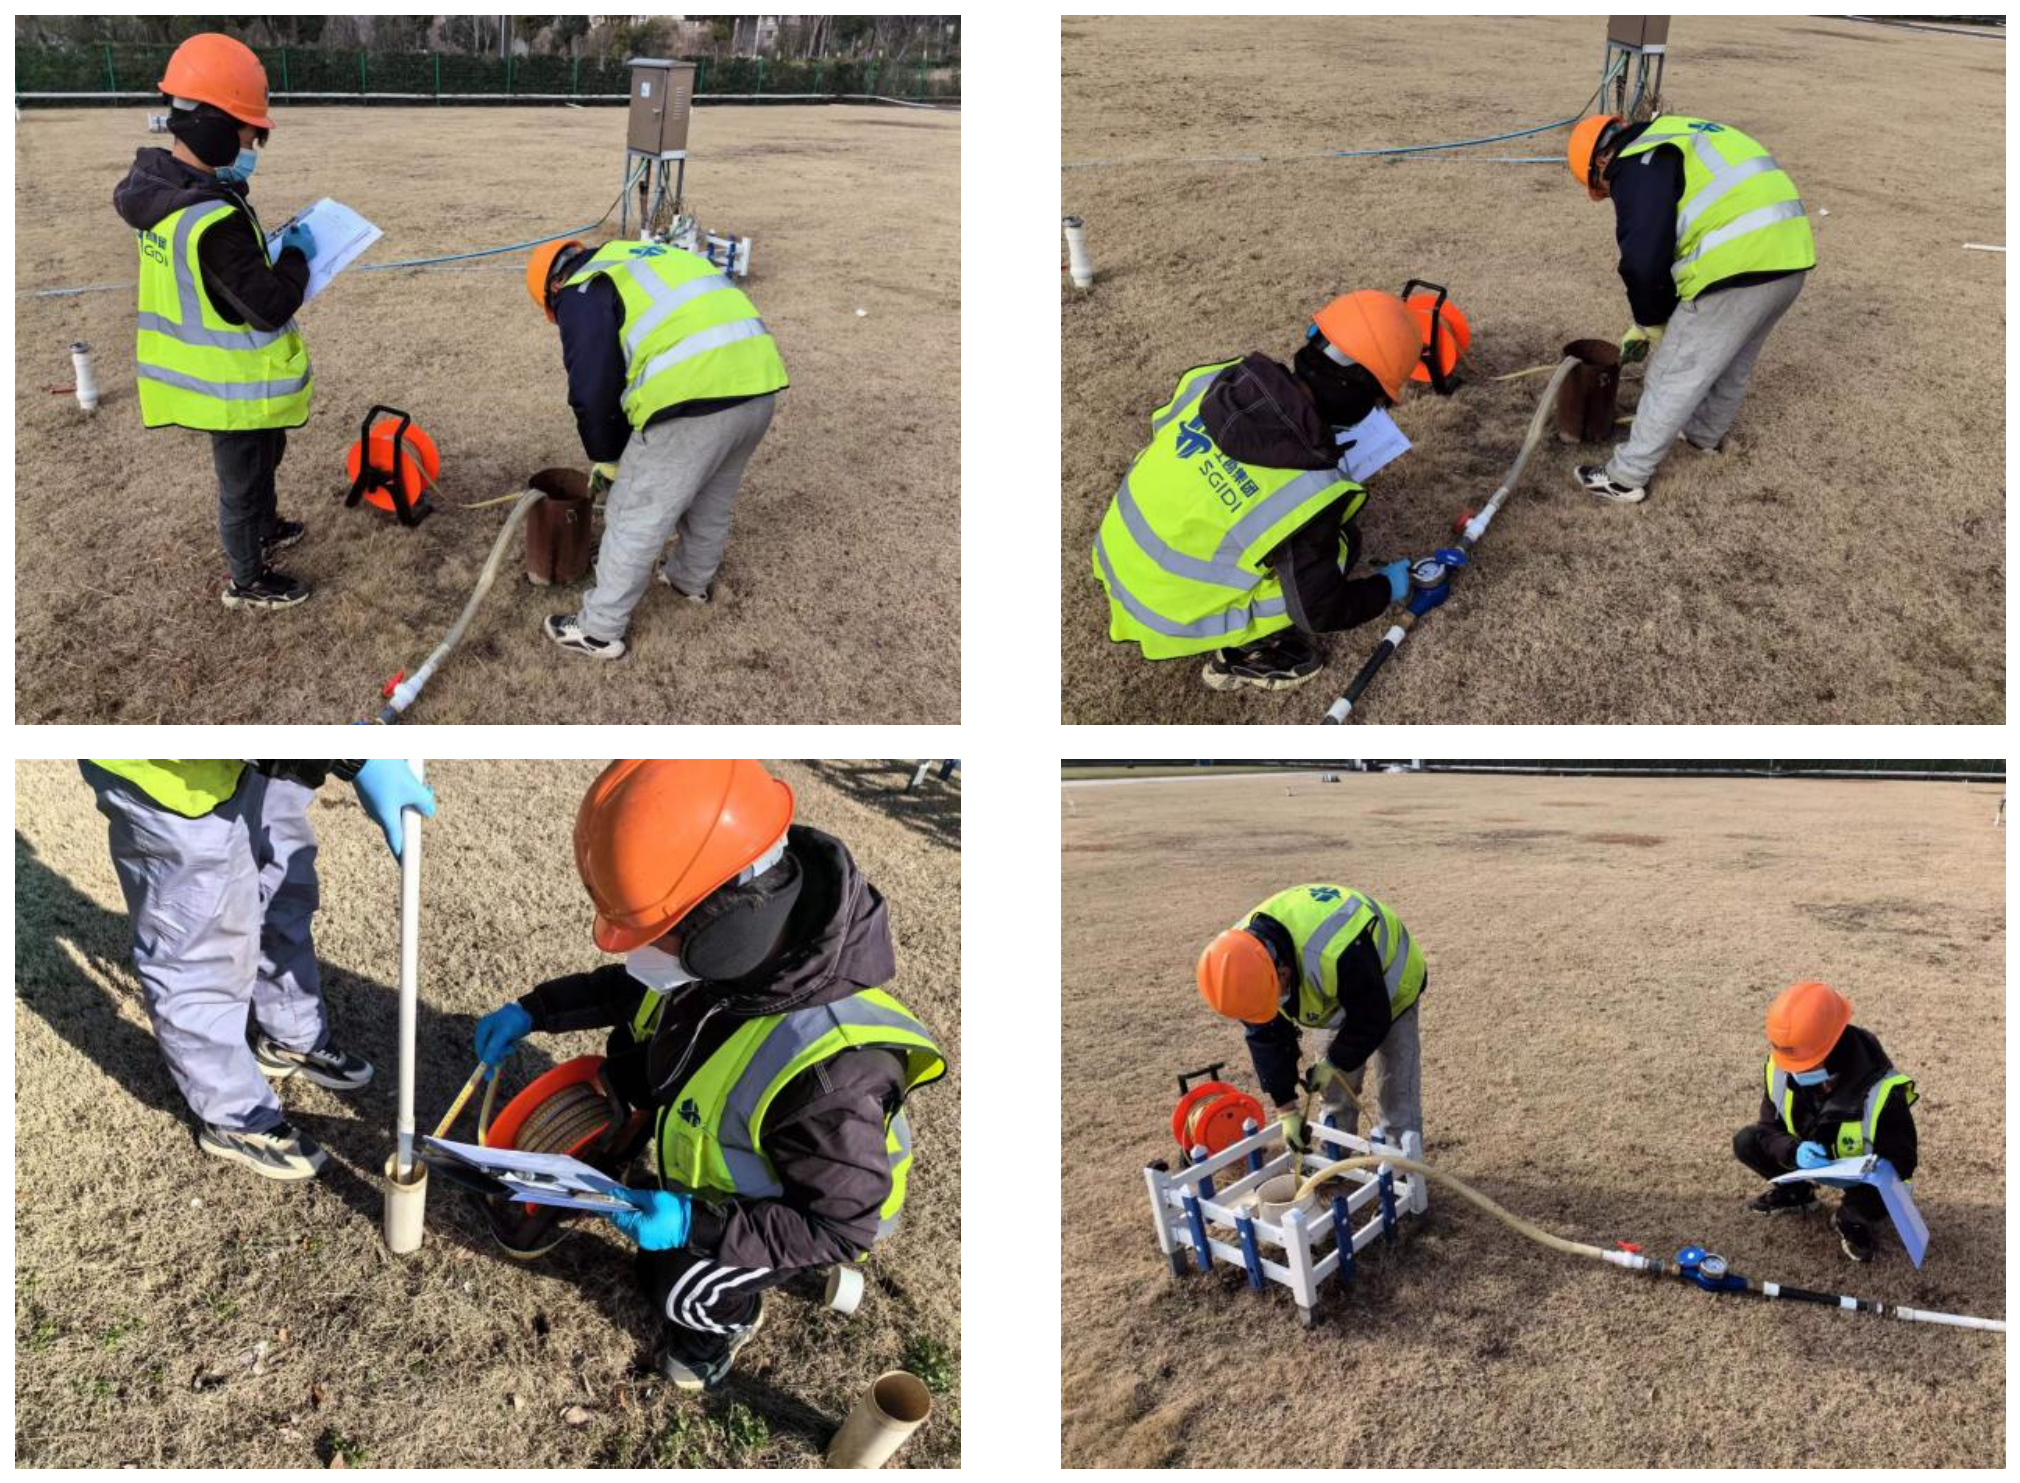
The field pilot (Figure 6) was conducted at a site where the stratigraphy is dominated by low-permeability silty-clay layers. The native hydraulic conductivity of the formation was measured at approximately 10 5   t o   10 6 cm/s, creating a high-risk environment for physical clogging due to the high concentration of mobile fine particles. Initial baseline tests conducted immediately after well installation (Table 2) showed that all wells achieved their design discharge rates, providing a uniform starting point for the performance evaluation.

4.1. Analysis of Hydraulic Performance: Large Diameter Wells A1 and R1

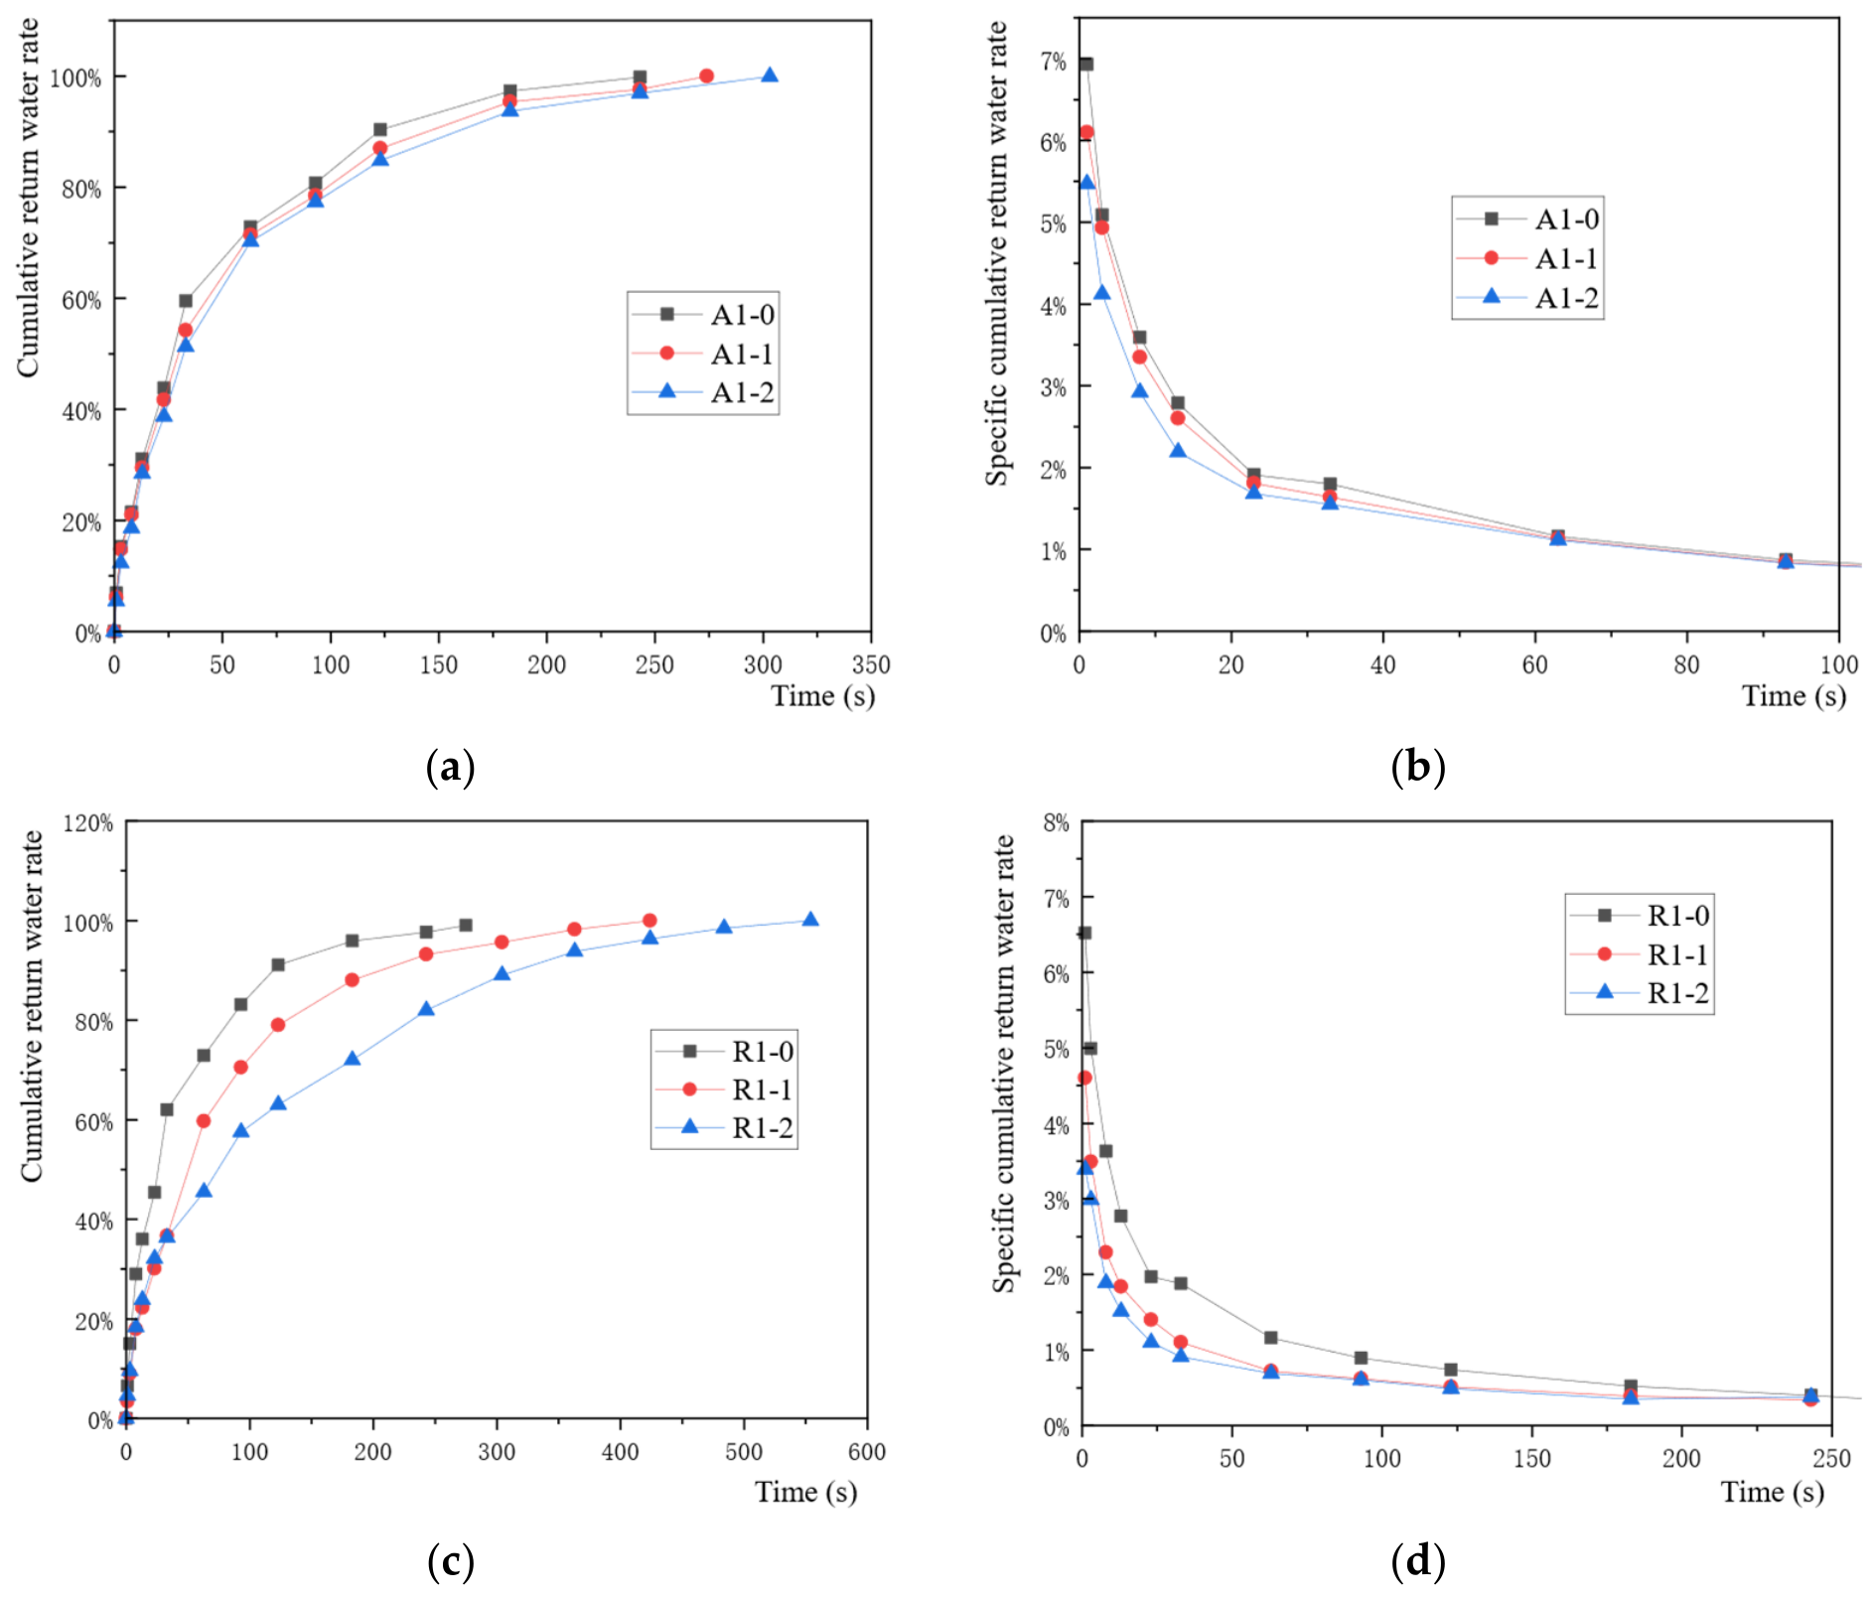
The hydraulic response characteristics of the innovative Well A1 and the conventional Well R1 were evaluated through short-term recovery tests to determine their ability to maintain stable discharge rates under operational stress. Figure 7 presents a comparative analysis of these pumping tests, illustrating the evolution of cumulative return water and specific recovery rates over a representative testing duration.
For Well A1, which utilises rounded quartz sand as the filter media, the cumulative return water volume exhibits a strictly linear increase throughout the duration of the test. This linear trend confirms that the well achieves a stable discharge rate almost immediately upon the initiation of extraction. This efficiency is further supported by the specific cumulative recovery rate, which rapidly ascends to a consistent plateau and remains stable. The lack of decay in this rate indicates that the rounded, uniform pore-throat geometry of the quartz sand maintains high hydraulic conductivity, preventing the mechanical entrapment of fine particles and ensuring a sustainable flow from the formation.
In contrast, Well R1, which employs conventional local yellow sand, demonstrates an unstable hydraulic profile. The cumulative return water curve shows a distinct non-linear, concave-downward trajectory, indicating that the extraction rate progressively diminishes as the test elapses. This performance degradation is clearly visible in the specific cumulative recovery rate, which exhibits a sharp initial peak followed by a continuous decline, failing to reach a stable hydraulic equilibrium. This characteristic decay is a direct consequence of the skin effect caused by physical clogging, where the migration of fine silty-clay particles from the formation leads to their entrapment within the angular interstices of the yellow sand.
These disparate hydraulic behaviours provide the mechanistic basis for the long-term performance trends observed in the test. The stable interface provided by the rounded quartz sand in Well A1 resulted in a highly resilient system, with only a 20% reduction in discharge capacity reported over 24 months. Conversely, the inherent instability of the R1 design led to a significant 57% decrease in flow. For sustainable multi-phase extraction systems, these results highlight that achieving stable short-term hydraulic equilibrium is a prerequisite for ensuring the long-term operational efficiency of the remediation infrastructure.

4.2. Analysis of Hydraulic Performance: Small Diameter Wells A2 and R2

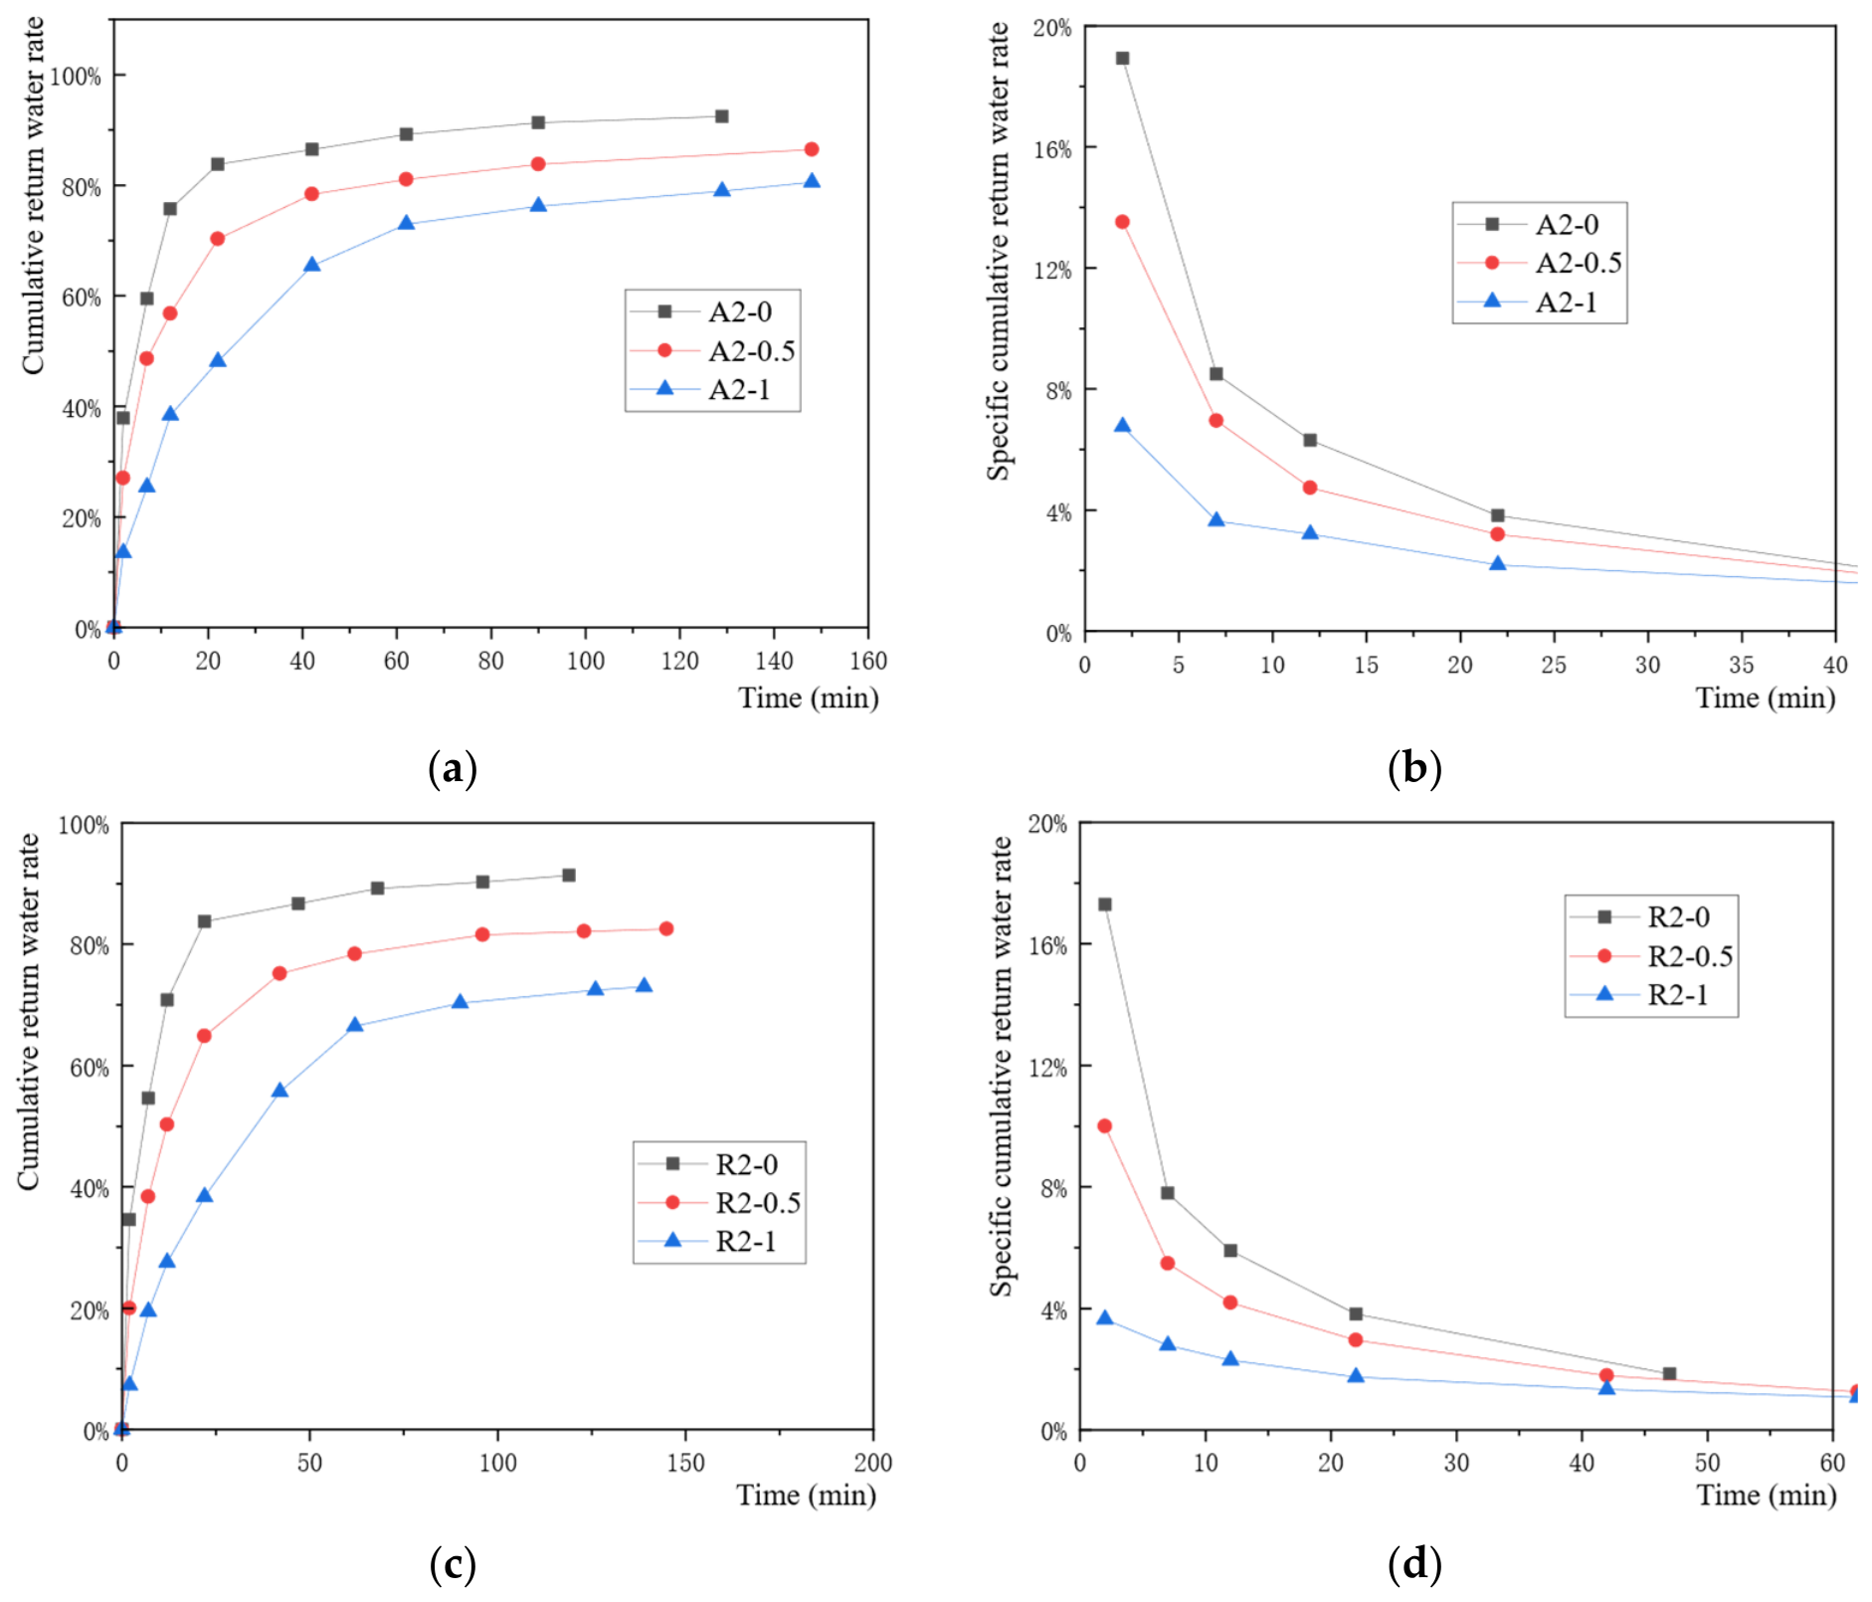
The performance of small-diameter wells (63 mm) was assessed to determine the influence of wellbore geometry on clogging kinetics within the silty-clay formation. Figure 8 presents the short-term hydraulic recovery data for Well A2 (innovative quartz sand) and Well R2 (conventional yellow sand). While the testing duration (measured in seconds) follows the same protocol as the large-diameter wells, the hydraulic responses reveal a heightened sensitivity to operational stress.
For Well A2, the cumulative return water volume maintains a linear relationship with time, suggesting that the rounded quartz filter continues to provide a relatively stable pathway for fluid entry. However, a comparison of the specific cumulative recovery rate with its large-diameter counterpart (A1) indicates a more rapid approach to a lower plateau. Even with the optimised filter media, the reduced surface area of the 63 mm wellbore increases the local hydraulic flux, which promotes a more concentrated deposition of fine particles at the interface, albeit at a slower rate than the control.
The conventional small-diameter Well R2 exhibits the most severe hydraulic impairment observed in the field study. The cumulative return water curve shows a marked concave-downward profile, with the rate of recovery slowing significantly as the test progresses. This is further elucidated by the specific cumulative recovery rate, which displays a sharp, transient peak followed by an immediate and steep decay. Unlike the large-diameter wells, R2 fails to maintain even a modest steady-state flow, as the high interfacial velocity quickly “plugs” the angular interstices of the yellow sand with formation silts.
These results confirm a significant “diameter effect” in well longevity. The reduction in well diameter from 200 mm to 63 mm results in a smaller interfacial area, thereby increasing the flow velocity at the filter-formation boundary. This elevated velocity provides the kinetic energy necessary to wedge fine particles deeper into the filter pack, accelerating the transition from surface filtration to a complete hydraulic block. Consequently, while the innovative quartz sand media mitigates these effects, the physical constraints of small-diameter designs make them inherently more vulnerable to rapid clogging in silty-clay environments.

5. Remediation of Clogged Wells

5.1. Physical Maintenance: High-Pressure Jetting Efficacy

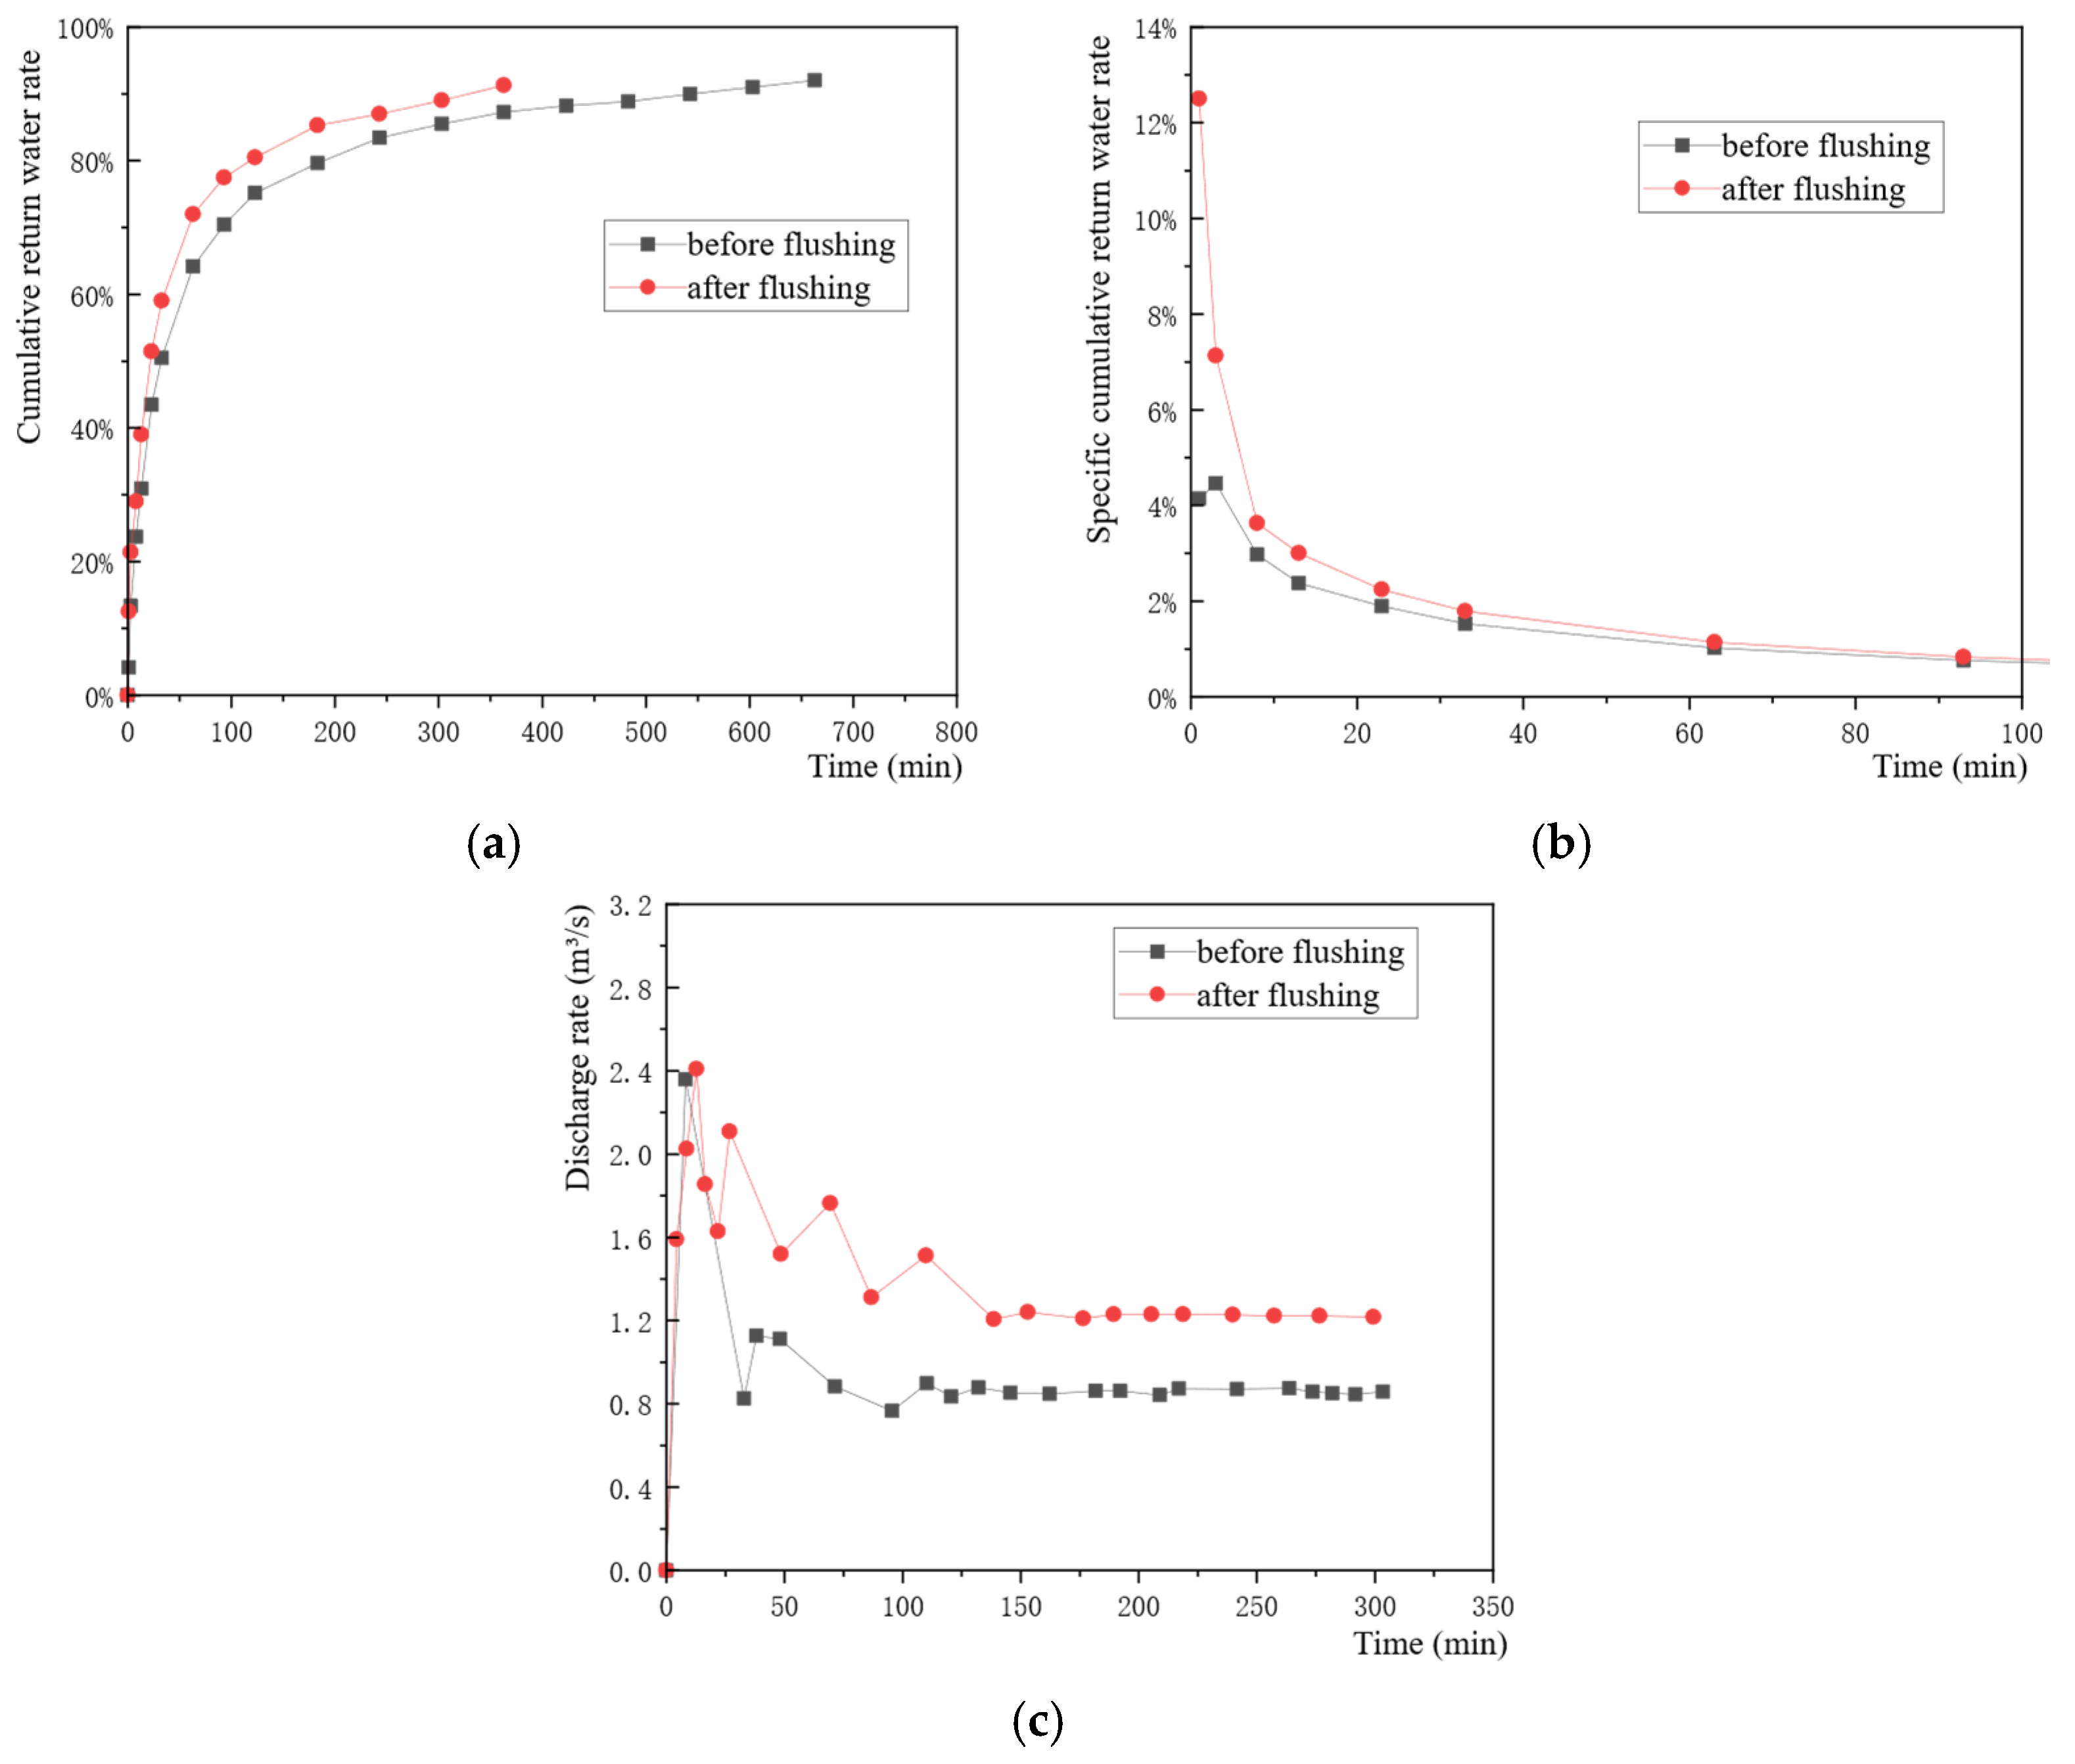
The restoration of hydraulic capacity in aged remediation wells is essential for sustainable site management. Figure 9 evaluates the impact of high-pressure water jetting on a well significantly impaired by physical clogging. The efficacy of this intervention is demonstrated through comparative recovery tests and continuous discharge monitoring.
Analysis of the cumulative recovery rate reveals that recovery speed improved across all stages following physical maintenance. The time required to reach 90% of the initial liquid level was reduced from 540 min pre-treatment to 330 min post-treatment—a factor of approximately 0.6. This represents a substantial increase in well-bore efficiency. During the early phases of recovery, the high hydraulic gradient between the well and the formation drives rapid fluid entry, with the cumulative recovery rate reaching 70% to 80% within the first 100 min.
The specific cumulative recovery rate further quantifies this improvement. During the critical first 100 min of recovery, the post-maintenance rates are significantly higher than the baseline. This is most pronounced in the initial 10 min, where the hydraulic gradient is at its maximum; here, the specific cumulative recovery rate is approximately 2 to 3 times higher than the pre-wash values. This indicates that the high-pressure jet effectively disrupted the low-permeability “clogging skin” at the filter-formation interface.
Finally, the continuous discharge test at maximum drawdown confirms the long-term benefit. While early-stage flow rates were similar due to high initial water levels, the stable discharge rate showed a clear divergence as the test progressed. The stable flow rate increased from 0.85 m 3 / h before flushing to 1.2 m 3 / h after flushing—a 50% improvement in sustained capacity. These results demonstrate that physical maintenance is a highly effective strategy for alleviating physical blockage and restoring the functional life of MPE wells in silty-clay environments.

5.2. Chemical Maintenance: Targeted Acid Washing Efficacy

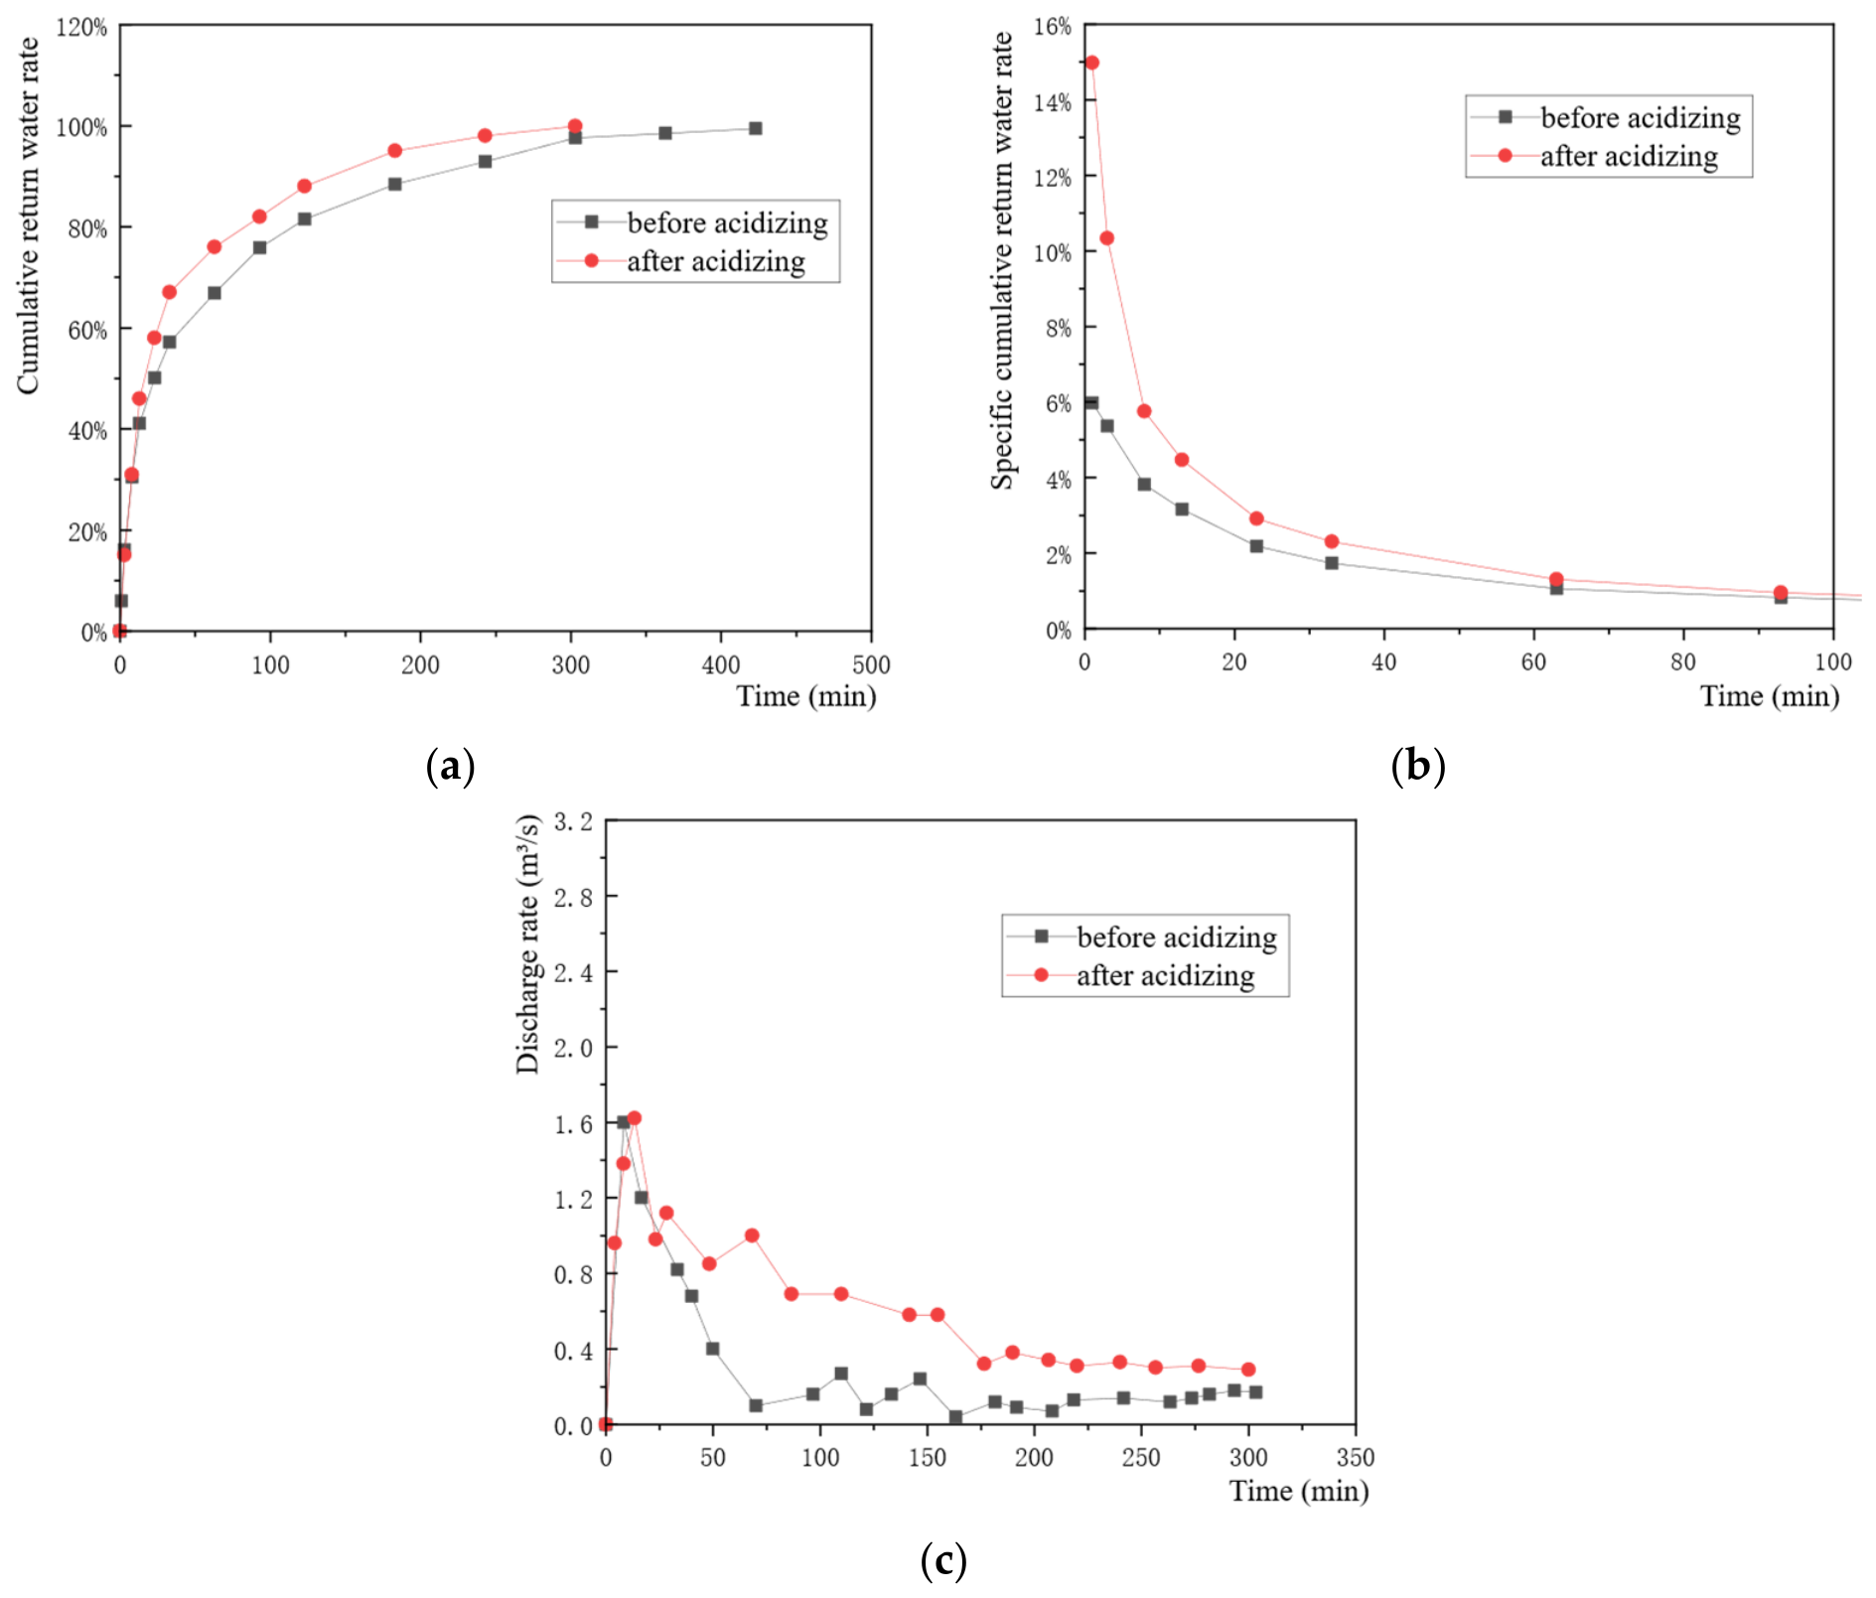
While physical maintenance addresses the accumulation of solid formation particles, chemical clogging—characterised by the precipitation of mineral scales and the development of biological films—requires a targeted chemical intervention. Figure 10 presents the results of a controlled acid washing procedure using a dilute hydrochloric acid solution (pH 2; Sinopharm Chemical Reagent Co., Ltd., Shanghai, China) to restore the hydraulic performance of a heavily aged MPE well. The restoration efficacy is quantified through comparative analysis of the cumulative recovery rate, the specific cumulative recovery rate, and the instantaneous discharge rate.
The cumulative recovery profile demonstrates a marked improvement in recovery efficiency following the acidizing treatment. Post-maintenance, the well exhibited significantly faster recovery across all hydraulic stages. Specifically, the time required for the liquid level to return to its initial static state was reduced from 460 min pre-treatment to 310 min post-treatment—a reduction factor of approximately 0.7. Within the first 100 min of the recovery phase, the cumulative recovery rate reached 70–85%, indicating that the dissolution of carbonate precipitates and iron oxides within the filter pack effectively lowered the entry resistance at the well-bore interface.
This hydraulic restoration is further elucidated by the specific cumulative recovery rate shown in Figure 10b. During the initial 100 min of recovery, the post-wash Δ S i values remained consistently and significantly higher than the pre-acidizing baseline. This improvement was most acute during the first 10 min of the test, where the high hydraulic gradient typically promotes rapid fluid entry; in this interval, the Δ S i for the treated well was approximately 2 to 3 times higher than the aged well. This quantitative jump confirms that the chemical treatment successfully cleared mineral obstructions from the well screen slots and the surrounding filter interstices.
Continuous discharge monitoring at maximum drawdown provides the definitive measure of operational restoration. While initial flow rates were comparable due to high static heads, the discharge rate of the aged well declined much more rapidly as the liquid level dropped. Following acid washing, the stable discharge rate was maintained at 0.35 m 3 / h , representing a 40% improvement over the pre-maintenance rate of 0.25 m 3 / h . These results highlight that chemical maintenance is a critical component of the “Remediate” phase of well management, particularly in petrochemical sites where the stripping of carbon dioxide during vacuum extraction often accelerates mineral scaling. When integrated with physical jetting, targeted acid washing ensures the long-term hydraulic viability of remediation infrastructure.

6. Conclusions

This study established a robust framework for the long-term management of multi-phase extraction (MPE) wells in low-permeability petrochemical contaminated sites. By integrating laboratory-scale mechanistic investigations with a comprehensive two-year field pilot study, we identified the critical geological and operational factors that dictate well longevity and hydraulic efficiency.
The laboratory findings demonstrated that the morphology and packing density of the filter media are the primary controls on permeability evolution. A critical density threshold of 70% was identified; exceeding this limit results in a significant reduction in initial pore volume, leading to immediate hydraulic failure upon the introduction of fine particles. Furthermore, the use of rounded, uniform quartz sand was found to be significantly more resilient than angular or irregular media like zeolite, maintaining a permeability ratio of 0.4 compared to values as low as 0.1 for conventional materials. The implementation of multi-layer graded filter structures further enhanced performance by facilitating depth filtration and delaying the formation of a low-permeability surface skin at the filter-formation interface.
Field-scale validation confirmed the effectiveness of these geoscience-informed designs. Innovative large-diameter wells maintained approximately 80% of their initial discharge capacity throughout the monitoring cycle. In contrast, conventional wells (R1) experienced severe clogging, with stable flow rates plummeting by 57% over the same period. The study also quantified a distinct “diameter effect,” revealing that small-diameter wells (63 mm) are inherently more vulnerable to rapid performance degradation due to the higher interfacial flux and accelerated particle entrapment at the well-bore boundary.
Finally, the research validated that integrated maintenance strategies are essential for the sustainable operation of aged remediation infrastructure. Physical maintenance via high-pressure water jetting successfully restored flow capacity by 50% in wells suffering from siltation, while targeted chemical washing with dilute hydrochloric acid (pH 2) improved recovery rates by 40% by addressing mineral scaling and biofilm accumulation.
The adoption of rounded quartz filter media, graded structural designs, and proactive physical–chemical maintenance provides a sustainable pathway for groundwater remediation. This approach not only ensures that technical cleanup objectives are met but also minimises the long-term carbon footprint and resource consumption associated with premature well failure in complex subsurface environments.

Author Contributions

Conceptualization, T.S., Y.Z. and C.S.; methodology, T.S., Y.Z. and G.Z.; software, Y.L.; validation, T.S., Y.L. and G.Z.; formal analysis, T.S. and J.C.; investigation, Y.L. and J.C.; resources, C.S.; data curation, T.S. and Y.Z.; writing—original draft preparation, T.S., Y.Z. and Y.L.; writing—review and editing, Y.Z. and C.S.; visualization, Y.L.; supervision, C.S.; project administration, C.S.; funding acquisition, C.S. All authors have read and agreed to the published version of the manuscript.

Funding

This research was funded by the National Natural Science Foundation of China, grant number 52400010; the Science and Technology Commission of Shanghai Municipality, grant number 24ZR1472300; and the Research Project of Shanghai Geological Society “Research on Deep Environmental Hydrogeological Conditions and Hydraulic Displacement DNAPL Reduction Technology in High-Risk Organic Contaminated Sites in Shanghai”, grant number Dzxh202501.

Data Availability Statement

The data presented in this study are available upon request from the corresponding author due to privacy and ongoing project restrictions.

Acknowledgments

The authors gratefully acknowledge the technical staff at the field site for their support during well installation and monitoring. Data processing and graphical plotting were performed using Origin 2021 (OriginLab Corporation, Northampton, MA, USA). The authors have reviewed and edited the output and take full responsibility for the content of this publication.

Conflicts of Interest

Authors Tingting Shen, Ying Liang, Jiao Cai, Gang Zhang and Chao Shen were employed by the company SGIDI Engineering Consulting (Group) Co., Ltd. The remaining author declare that the research was conducted in the absence of any commercial or financial relationships that could be construed as a potential conflict of interest.

References

  1. Majeed, B.K.; Shwan, D.M.; Rashid, K.A. A review on environmental contamination of petroleum hydrocarbons, its effects and remediation approaches. Environ. Sci. Process. Impacts 2025, 27, 526–548. [Google Scholar] [CrossRef] [Scilit] [PubMed]
  2. Yu, J.R.; Zhou, C.; Mu, Q.Y. Numerical investigation on light non-aqueous phase liquid flow in the vadose zone considering porosity effects on soil hydraulic properties. Vadose Zone J. 2022, 21, e20211. [Google Scholar] [CrossRef] [Scilit]
  3. Shiau, B.B.; Brammer, J.M.; Sabatini, D.A.; Harwell, J.H.; Knox, R.C. Recent development of low concentration surfactant flushing for NAPL-impacted site remediation and pollution prevention. In Petroleum Hydrocarbons and Organic Chemicals in Ground Water/Prevention, Assessment, and Remediation Twentieth Annual Conference and Exposition; NGWA: Costa Mesa, CA, USA, 2003. [Google Scholar]
  4. Qi, S.; Luo, J.; O’Connor, D.; Wang, Y.; Hou, D. A numerical model to optimize LNAPL remediation by multi-phase extraction. Sci. Total Environ. 2020, 718, 137309. [Google Scholar] [CrossRef] [Scilit] [PubMed]
  5. Wen, Z.; Zhu, Q.; Krause, S.; Chen, W. Advancing multi-phase LNAPL extraction models by incorporating a wellbore module. Water Resour. Res. 2025, 61, e2025WR041014. [Google Scholar] [CrossRef] [Scilit]
  6. Rayner, J.L.; Bekele, E.; Donn, M.; Bastow, T.; Davis, G.B.; Woodbury, R.; Geste, Y. Australian case studies of light non-aqueous phase liquid (LNAPL) natural source zone depletion rates compared with conventional active recovery efforts. In 47, CRC for Contamination Assessment and Remediation of the Environment; crcCARE: Newcastle, Australia, 2020. [Google Scholar]
  7. Thompson, A.R.; Stotler, R.L.; Macpherson, G.L.; Liu, G. Laboratory study of low-flow rates on clogging processes for application to small-diameter injection wells. Water Resour. Manag. 2015, 29, 5171–5184. [Google Scholar] [CrossRef] [Scilit]
  8. Rinck-Pfeiffer, S.; Ragusa, S.; Sztajnbok, P.; Vandevelde, T. Interrelationships between biological, chemical, and physical processes as an analog to clogging in aquifer storage and recovery (ASR) wells. Water Res. 2000, 34, 2110–2118. [Google Scholar] [CrossRef] [Scilit]
  9. Polak, K.; Górecki, K.; Kaznowska-Opala, K. The dynamics of water wells efficiency reduction and ageing process compensation. Water 2019, 11, 117. [Google Scholar] [CrossRef] [Scilit]
  10. Polak, K.; Kaznowska-Opala, K. The impact of water wells efficiency on hydrogeological parameters assessment and defect identification. Water 2025, 17, 3293. [Google Scholar] [CrossRef] [Scilit]
  11. Li, X.; Yue, G.; Huang, J.O. Experimental study of the microscopic visualization of gas clogging during groundwater recharge. Sustainability 2023, 15, 2593. [Google Scholar] [CrossRef] [Scilit]
  12. Zou, Z.; Shu, L.; Min, X.; Mabedi, E.C. Clogging of infiltration basin and its impact on suspended particles transport in unconfined sand aquifer: Insights from a laboratory study. Water 2019, 11, 1083. [Google Scholar] [CrossRef] [Scilit]
  13. Du, X.; Fang, Y.; Wang, Z.; Hou, J.; Ye, X. The prediction methods for potential suspended solids clogging types during managed aquifer recharge. Water 2014, 6, 961–975. [Google Scholar] [CrossRef] [Scilit]
  14. Ma, S.; Song, Y.; Ye, X.; Du, X.; Ma, J. Clogging and water quality change effects of typical metal pollutants under intermittent managed aquifer recharge using urban stormwater. Int. J. Environ. Res. Public Health 2021, 18, 13272. [Google Scholar] [CrossRef] [Scilit] [PubMed]
  15. Wang, H.; Wu, J.; Yang, D.; Chen, Y.; Xia, Y. The fate and clogging mechanisms of suspended particles in natural biofilm-coated porous media. Water 2025, 17, 1480. [Google Scholar] [CrossRef] [Scilit]
  16. Cao, S.C.; Cao, M.; Yuan, Y.; Jung, J.; Li, X. Experimental and numerical investigation of fines migration mechanisms in porous media: Implications for marine gas hydrate production. J. Mar. Sci. Eng. 2025, 13, 2002. [Google Scholar] [CrossRef] [Scilit]
  17. Kang, S.; Fei, L.; Yang, Z.; Zhao, P.; Wang, Q.; Fan, Q.; Liu, L. Effects of muddy water infiltration on the hydraulic conductivity of soils. Agronomy 2024, 14, 1545. [Google Scholar] [CrossRef] [Scilit]
  18. Andrés-Valeri, V.C.; Marchioni, M.; Sañudo-Fontaneda, L.A.; Giustozzi, F.; Becciu, G. Laboratory assessment of the infiltration capacity reduction in clogged porous mixture surfaces. Sustainability 2016, 8, 751. [Google Scholar] [CrossRef] [Scilit]
  19. Maliva, R.G. Clogging. In Anthropogenic Aquifer Recharge: WSP Methods in Water Resources Evaluation Series No. 5; Springer International Publishing: Cham, Switzerland, 2019; pp. 307–342. [Google Scholar]
  20. Indraratna, B.; Medawela, S.K.; Athuraliya, S.; Heitor, A.; Baral, P. Chemical clogging of granular media under acidic groundwater conditions. Environ. Geotech. 2022, 9, 450–462. [Google Scholar] [CrossRef] [Scilit]
  21. Jeong, H.Y.; Jun, S.C.; Cheon, J.Y.; Park, M. A review on clogging mechanisms and managements in aquifer storage and recovery (ASR) applications. Geosci. J. 2018, 22, 667–679. [Google Scholar] [CrossRef] [Scilit]
  22. Yoshitaka, N.; Makoto, N. Clogging mechanisms and preventive measures in artificial recharge systems. J. Groundw. Sci. Eng. 2021, 9, 181–201. [Google Scholar]
  23. Hvorslev, M.J. Time Lag and Soil Permeability in Ground-Water Observations; Waterways Experiment Station Bulletin 36; U.S. Army Corps of Engineers: Vicksburg, MS, USA, 1951.
  24. Batu, V. Aquifer Hydraulics: A Comprehensive Guide to Hydrogeologic Data Analysis; Wiley: New York, NY, USA, 1998. [Google Scholar]
Figure 1. Laboratory displacement apparatus for permeability testing. (a) Schematic of the constant-flow system, consisting of a high-precision plunger pump, a transparent acrylic filter column (50 mm internal diameter, 150 mm height), and a differential pressure monitoring assembly. (b) Photograph of the assembled apparatus. A fine-particle suspension (fraction < 63 μm) was injected at a constant flow rate while pressure drop across the column was recorded at 10-s intervals to compute the instantaneous hydraulic conductivity via Darcy’s Law.
Environments 13 00268 g001
Figure 2. Images of filter media morphology showing angular zeolite grains (left), moderately rounded yellow sand (middle), and rounded, uniform quartz sand (right).
Environments 13 00268 g002
Figure 3. Differential pressure (a) and normalised permeability ratio (K/K0) Laboratory permeability evolution for three filter media under identical constant-flow displacement conditions (flow rate 5 mL/min; fine-particle suspension < 63 μm). (a) Differential pressure across the column versus time, showing a steeper and earlier pressure rise for zeolite and yellow sand. (b) Normalised permeability ratio (K/K0) versus time, where K0 is the initial hydraulic conductivity. Quartz sand stabilises at K/K0 ≈ 0.4, whereas yellow sand and zeolite decline to ≈0.15 and 0.1, respectively, owing to their angular grain shape and rough surface texture that promote particle bridging at pore throats.
Environments 13 00268 g003
Figure 4. Differential pressure (a,c) and normalised permeability ratio (K/K0) (b,d) versus time for varying packing densities (60–90%) and single-layer versus multi-layer graded filter packs. (a,b) Effect of packing density: at densities above 70%, rapid pressure spikes and catastrophic K/K0 collapse occur within minutes, whereas samples below 70% exhibit an extended stable plateau before clogging onset. (c,d) Effect of filter structure: the single-layer pack (black line) reaches its minimum permeability rapidly and the test is terminated early once complete hydraulic blockage is confirmed, which is why the black line does not extend as far along the time axis as the multi-layer graded pack (blue line). The blue line continues longer because depth filtration in the graded structure progressively distributes fine particles across multiple pore-throat zones, delaying total blockage; the two curves would eventually converge to a similar minimum K/K0 if the single-layer test were prolonged, confirming that the graded design extends service life rather than eliminating clogging entirely.
Environments 13 00268 g004
Figure 5. Normalised permeability ratio (K/K0) versus time (a) and final (K/K0) versus fluid viscosity (b) for quartz sand packs, demonstrating accelerated permeability loss with increasing permeant viscosity. (a) Temporal evolution of K/K0 at three representative viscosities (0.5, 1.0, and 2.0 mPa·s), illustrating that higher viscosity promotes earlier and more severe permeability decline. (b) Final equilibrium K/K0 plotted against the three tested viscosity values; only three data points are shown because each test requires an independent column preparation and multi-hour run, so the three values (0.5, 1.0, and 2.0 mPa·s) were selected to span the representative range from near-water viscosity to that of light petroleum hydrocarbons. A monotonically decreasing trend confirms that higher fluid drag forces accelerate fine-particle retention and reduce the sustainable permeability of the filter pack.
Environments 13 00268 g005
Figure 6. Field site and well installation for the two-year hydraulic performance pilot study. The silty-clay formation (hydraulic conductivity 10−5 to 10−6 cm/s) creates a high-risk environment for fine-particle clogging. Four multi-phase extraction wells were installed: large-diameter A1 (200 mm, quartz sand) and R1 (200 mm, yellow sand) as the primary design comparison, and small-diameter A2 (63 mm, quartz sand) and R2 (63 mm, yellow sand) to quantify the diameter effect on clogging kinetics. All wells incorporate horizontal slotted screens positioned across the primary contamination zones and were monitored continuously for 24 months.
Environments 13 00268 g006
Figure 7. Short-term hydraulic recovery test results for large-diameter wells (200 mm) A1 (quartz sand, innovative design) and R1 (yellow sand, conventional control). (a) Cumulative return-water volume versus time for A1, showing a linear increase indicative of a stable, constant discharge rate. (b) Specific cumulative recovery rate (ΔSi) versus time for A1, rapidly reaching and maintaining a stable plateau. (c) Cumulative return-water volume versus time for R1, exhibiting a concave-downward profile reflecting progressive permeability loss due to fine-particle entrapment in the angular yellow sand. (d) ΔSi versus time for R1, showing an initial peak followed by continuous decline, confirming an inability to reach hydraulic equilibrium. The contrasting behaviours underpin the long-term field result: A1 retained 80% of its initial capacity over 24 months, while R1 experienced a 57% flow reduction.
Environments 13 00268 g007
Figure 8. Short-term hydraulic recovery test results for small-diameter wells (63 mm) A2 (quartz sand) and R2 (yellow sand), demonstrating the diameter effect on clogging severity. (a) Cumulative return-water volume versus time for A2, maintaining approximate linearity but at a lower plateau than A1, reflecting the higher interfacial flux imposed by the reduced wellbore circumference. (b) ΔSi versus time for A2, reaching a lower stable value than A1 despite the same filter medium, confirming that small diameter inherently amplifies clogging risk. (c) Cumulative return-water volume versus time for R2, exhibiting the most severe concave-downward profile of all four wells, indicating near-complete hydraulic blockage. (d) ΔSi versus time for R2, showing a sharp transient peak followed by an immediate steep decline to near-zero, consistent with rapid plugging of angular yellow-sand interstices by formation silts driven by high interfacial velocity.
Environments 13 00268 g008
Figure 9. Hydraulic performance before and after high-pressure water jetting in a physically clogged MPE well. (a) Cumulative recovery rate (Si) versus time: the post-jetting curve (red) rises faster than the pre-jetting baseline (black), with the time required to reach 90% recovery reducing from 540 to 330 min, confirming that jetting disrupted the low-permeability clogging skin at the well-formation interface. The two curves appear qualitatively similar in shape because both follow the same Hvorslev-type recovery function; the improvement is quantitative (rate and plateau), not structural. (b) Specific cumulative recovery rate (ΔSi) versus time: post-jetting values are approximately 2–3 times higher during the critical first 10 min, when the hydraulic gradient is at its maximum, clearly capturing the removal of the near-borehole blockage. (c) Stable discharge rate at maximum drawdown: flow increased from 0.85 m3/h (pre-jetting) to 1.2 m3/h (post-jetting), representing a 50% improvement in sustained capacity.
Environments 13 00268 g009
Figure 10. Hydraulic performance before and after dilute hydrochloric acid washing (pH 2) in a chemically and biologically clogged MPE well. (a) Cumulative recovery rate (Si) versus time: the post-washing curve (red) recovers faster than the pre-washing baseline (black), reducing the time to full recovery from 460 to 310 min. Both curves follow the same Hvorslev recovery envelope and appear structurally similar because the underlying formation transmissivity is unchanged; the acid treatment lowers the near-borehole entry resistance rather than altering aquifer properties. (b) Specific cumulative recovery rate (ΔSi) versus time: post-wash values are approximately 2–3 times higher in the initial 10 min, confirming dissolution of mineral scale and biofilm from well-screen slots and filter interstices. (c) Stable discharge rate at maximum drawdown: the two curves start similarly due to high static water heads; as drawdown deepens and the entry resistance of the aged well becomes rate-limiting, the curves diverge and would intersect if the aged-well rate continued to decline. The intersection point represents the drawdown threshold beyond which the chemical clogging skin becomes the dominant hydraulic resistance, after treatment this threshold is removed and stable flow of 0.35 m3/h is maintained, a 40% improvement over the pre-maintenance rate of 0.25 m3/h.
Environments 13 00268 g010
Table 1. Physical Characteristics of Filter Media.
Filter Material TypeParticle DistributionDescription
<1 mm1~3 mmGreater Than 3 mm
zeolite<1%31%69%The surface is rough, predominantly composed of coarse and fine particles.
yellow sand32%46%22%The surface is moderately rough, with particles of all sizes distributed.
quartz sand6%86%8%Smooth surface with uniform particle size
Table 2. Structural Specifications of Pilot MPE Wells.
Well IDWell Depth (m)Well Diameter (mm)Filter MaterialFilter Structure
A112200quartz sandSingle/multi-layer filter pack
R1yellow sandSingle/multi-layer filter pack
A21263quartz sandSingle/multi-layer filter pack
R2yellow groundSingle/multi-layer filter pack
Disclaimer/Publisher’s Note: The statements, opinions and data contained in all publications are solely those of the individual author(s) and contributor(s) and not of MDPI and/or the editor(s). MDPI and/or the editor(s) disclaim responsibility for any injury to people or property resulting from any ideas, methods, instructions or products referred to in the content.