Article

Hydro-Ecology of Household Life: Comparative Determination of Water Use Behavior in Mitigating Climate Change in Urban Areas


by
Dwi Rahayu Nugraheni
1,
Dwinowo Martono
2,* and
Ernoiz Antriyandarti
3
1
Social Environment, Community Empowerment, and Environmental Economics Research Cluster, Department of Environmental Science, Graduated School of Sustainable Development, Universitas Indonesia, Central Jakarta 10430, Indonesia
2
Department of Environmental Science, Graduated School of Sustainable Development, Universitas Indonesia, Central Jakarta 10430, Indonesia
3
Study Program of Agribusiness, Faculty of Agriculture, Universitas Sebelas Maret, Surakarta 57126, Indonesia
*
Author to whom correspondence should be addressed.
Environments 2026, 13(4), 189; https://doi.org/10.3390/environments13040189
Submission received: 29 January 2026 / Revised: 16 March 2026 / Accepted: 27 March 2026 / Published: 1 April 2026

Abstract

Sustainable water use behavior in households is a crucial component in facing the impacts of climate change on water conditions, especially in urban areas and their surroundings in countries like Indonesia. This study examines household water use behavior in urban and peri-urban areas of Surabaya and Sidoarjo in Indonesia by integrating environmental spatial characteristics and using psycho-social factors. This research methodology includes statistical analysis with the aim of examining the variable in relation to household water behavior and then integrating with spatial analysis using nearest neighborhood analyses and spatial overlay with land use/land cover (LULC) and Urban Heat Island (UHI) data, doing so to identify behavioral clustering patterns and assess spatial risk distribution. The results suggest that there is generally positive orientation toward sustainable household water use among respondents. Households in peri-urban areas show better water management behavior than those in urban areas. The implications of spatial risk in urban areas are higher due to poor behavior facing high environmental pressures. On the other hand, when overlaid with clusters of well-behaved respondents, the risk of water shortages decreases, supporting climate change mitigation efforts.

1. Introduction

High population growth will increase human needs, including water demand, and alter land use patterns, leading to a higher proportion of surface runoff and reduced groundwater recharge. Indonesia holds approximately 21 per cent of the world’s total freshwater reserves, with a total volume of around 5500 billion cubic meters. Indonesia boasts more than thousands of rivers and other forms of water bodies, making it a rich source of water resources for various purposes. Indonesia possesses abundant potential water resources, yet the nation faces significant challenges [1]. Water availability paradoxically continued to decline. This decline is exacerbated by slow infrastructure development in water resource management, insufficient storage for rainwater runoff, and less-than-optimal implementation of eco-efficient practices [1]. Other than that, the usefulness of water resources is declining due to water pollution, deforestation, climate change, uneven infrastructure development, ineffective management, and a lack of public awareness in maintaining the sustainability of water resources [2]. Adding to these complexities, historically, a significant portion of the Indonesian population has lacked access to safe water due to the slow and limited coverage of supply services over the past century [3]. However, recent data indicates positive progress, with 92.64% of households in Indonesia having access to improved drinking water sources as of 2024 [4].
Indonesia faces increasing pressure on water availability due to rapid population growth and accelerating urban expansion.Java, where large metropolitan areas have developed, faces a water security crisis. In highly urbanized environments characterized by rapid growth and structural social inequalities, maintaining water security becomes increasingly complex [5]. Urbanization, combined with climate change and pollution of water sources, further intensifies the pressure on urban water systems [6]. As cities continue to expand, water-related risks often become less visible, leading to local needs being overlooked [5]. Rapid population increase in urban centers creates significant challenges for ensuring reliable access to clean water [6]. In particular, in Java, water stress is worsened by high actual evapotranspiration driven by latitudinal factors [7]. These pressures are particularly evident in large, expanding urban regions with dense economic activity and concentrated populations [7]. Surabaya represents one such central urban area in Java that reflects these characteristics.
In contrast to Surabaya’s highly urbanized conditions, Sidoarjo is a peri-urban area that serves as a functional support to the metropolitan core. Peri-urban zones are frequently characterized as water-poor spaces, where limited access to reliable water and adequate sanitation facilities remains a constant challenge [8]. These difficulties arise not only from infrastructural gaps but also from delayed service improvements, which often reduce community participation in formal water services due to declining trust in public authorities [8]. Furthermore, water security challenges in peri-urban areas are closely linked to processes of urbanization, reflecting their continued interdependence with the urban regions they support [9].
As access to clean water becomes increasingly restricted across both urban and peri-urban settings, promoting household behaviors that enhance water-use efficiency becomes essential. Sustaining domestic hydro-ecology can be achieved in part through behavioral interventions that encourage more efficient practices [10]. At the same time, households often use water unconsciously, as daily practices are shaped by embedded routines and habits, highlighting the need to understand behavior across spatial contexts.
This study aims to examine sustainable household water management behavior in urban and peri-urban Indonesia by integrating spatial characteristics with psycho-social and governance factors. The analysis explores how household perception, perceived government role, and public satisfaction relate to water-use behavior across the study areas. ANOVA tests whether significant behavioral differences exist between study areas, while spatial overlay with environmental stress indicators (UHI and LULC) is used to assess potential water shortage risk patterns. This research has novelty in assessing behavior in two different regions which have distinct urban-peri urban characteristics to hydrological influences. This study contributes to the analysis of Indonesian household water management behavior in mitigating climate change.

1.1. Literature Review

There have been numerous research topics discussing water consumption behavior, but the discussion of community behavior related to hydrological variations remains limited. Research by Addo [11] highlights the psychological and social drivers of water consumption behavior stating that socio-demographic, psychosocial, behavioral, and infrastructure factors all have a role in determining water use in households. Another previous study found that attitudes, behavioral control, and norms predict the intention to adopt water-efficient behavior [10]. However, prior research has not sufficiently explored regional variations in water use behavior or the role of government, indicating the need for further investigation in these areas.

1.1.1. Perceptions Influencing Water Management Intentions

Perceptions significantly influence how households manage their water and what actions they intend to take. For instance, Delpla [12] highlighted how our perception of tap water’s quality directly impacts our satisfaction and, in turn, how we consume water. Practical habits and our perception of associated risks further shape this relationship. Beyond quality, another common challenge in water management is the inaccuracy in how people perceive their water use. Many often underestimate how much water they use, especially for high-consumption activities like showering or outdoor tasks. This misunderstanding directly affects whether people adopt effective water conservation strategies. Ultimately, these diverse perceptions are influenced by various factors.

1.1.2. The Government’s Role in Shaping Public Satisfaction with Water Management

The government’s role significantly influences public satisfaction with water management, as found in previous research. For example, Naiga [13] demonstrated in rural Uganda that user satisfaction with government services is strongly correlated with their willingness to help maintain water infrastructure. When it comes to complex issues like water supply in transboundary river basins, ref. [14] emphasized that policymakers must consider the perceived satisfaction of all stakeholders, including different government levels and the public, to ensure policies are accepted. Meanwhile, in urban settings like Makassar, Indonesia [15] found that public satisfaction with water utilities largely depends on the quality of both their technical and non-technical services, often indicating areas for improvement. Relying solely on performance indicators is insufficient; effective water governance must also consider the public’s core values regarding water.

1.1.3. Public Satisfaction with Water Management

Public satisfaction stands as a critical measure of success in water management. A multitude of factors shape this satisfaction. For instance, Li [16] indicate that improvements in water service quality play a critical role in enhancing customer satisfaction. These studies reinforce that meeting or exceeding customer expectations is fundamental. The governance way to interact with the public also plays a nuanced role that influences major drivers of dissatisfaction, particularly evident in publicly owned systems in developing contexts. Conversely, Tian et al. [17] found that perceived trustworthiness and active engagement, predict higher customer satisfaction. Ultimately, public satisfaction is a multi-faceted construct.

1.1.4. Implications of Community Satisfaction in Water Management

Community satisfaction with water management stands as a critical measure. When communities are satisfied, positive behavioral changes are directly encouraged. Ananga et al. [18] found that beneficiary satisfaction with water management committees correlates with crucial participatory variables, all of which are essential for improving the effectiveness and sustainability of water schemes. Likewise, user satisfaction influences the willingness to pay for water services and their maintenance, creating a viable path for financial sustainability in water provision.
Beyond individual behaviors and local contributions, community satisfaction provides vital insights for policymakers and service providers to refine and improve water management strategiesthat directly impact how consumers accept and utilize water sources. This feedback enables authorities to enforce overall service quality. Moreover, satisfaction is increasingly tied to the efficacy of engagement. Haikal et al. [19] demonstrate that digital technologies can boost community expectations and happiness, emphasizing the role of government engagement in public satisfaction. Conversely, dissatisfaction, often fueled by poor communication, can deter public engagement. Ultimately, understanding public satisfaction is not just about service quality, it is a fundamental aspect of building trust, ensuring active participation, and securing resilient and sustainable water management systems for the future.

1.1.5. Environmental Characteristic and Water Use Patterns

Understanding the complex relationship between environmental characteristics and water consumption is crucial for sustainable water management, especially as climate change intensifies. Recent research has increasingly utilized geospatial and machine learning techniques to unravel these intricate dynamics. For instance, LULC patterns are recognized as significant drivers of water demand, with studies like Yasmita et al. [20] demonstrating how urban expansion and changes in land use directly influence water consumption rates and hydrological responses. The transformation of natural landscapes into built-up areas, as highlighted by Zhang et al. [21], results in altered runoff patterns and increased water demand, underscoring the need to integrate LULC analysis into water management strategies. Furthermore Asteria et al. [22] emphasize climatic factors, requires a multi-stakeholder adaptive strategy in agricultural regions.
Beyond LULC, UHI effects emerge as another significant environmental factor shaping water use. Al-Hameedi et al. [23] predict future increases in Land Surface Temperature (LST) which correlated with UHI in urban areas, a phenomenon that worsens water demand for cooling and other uses. The growing recognition of these environmental influences has led to a more integrated approach to water research. Studies by Zubaidi et al. [24] and Miro et al. [25] showcase the power of Artificial Neural Networks (ANNs) and other machine learning models in predicting water demand, often by incorporating climatic variables. Similarly, the work of Utari [26] on hydrological information and prediction systems exemplifies the shift towards real-time data and machine learning to address water challenges under changing climatic conditions. This geospatial analysis provides a strong framework for assessing and mitigating the impacts of environmental shifts on water security, particularly in regions vulnerable to extreme events.

2. Materials and Methods

2.1. Overview

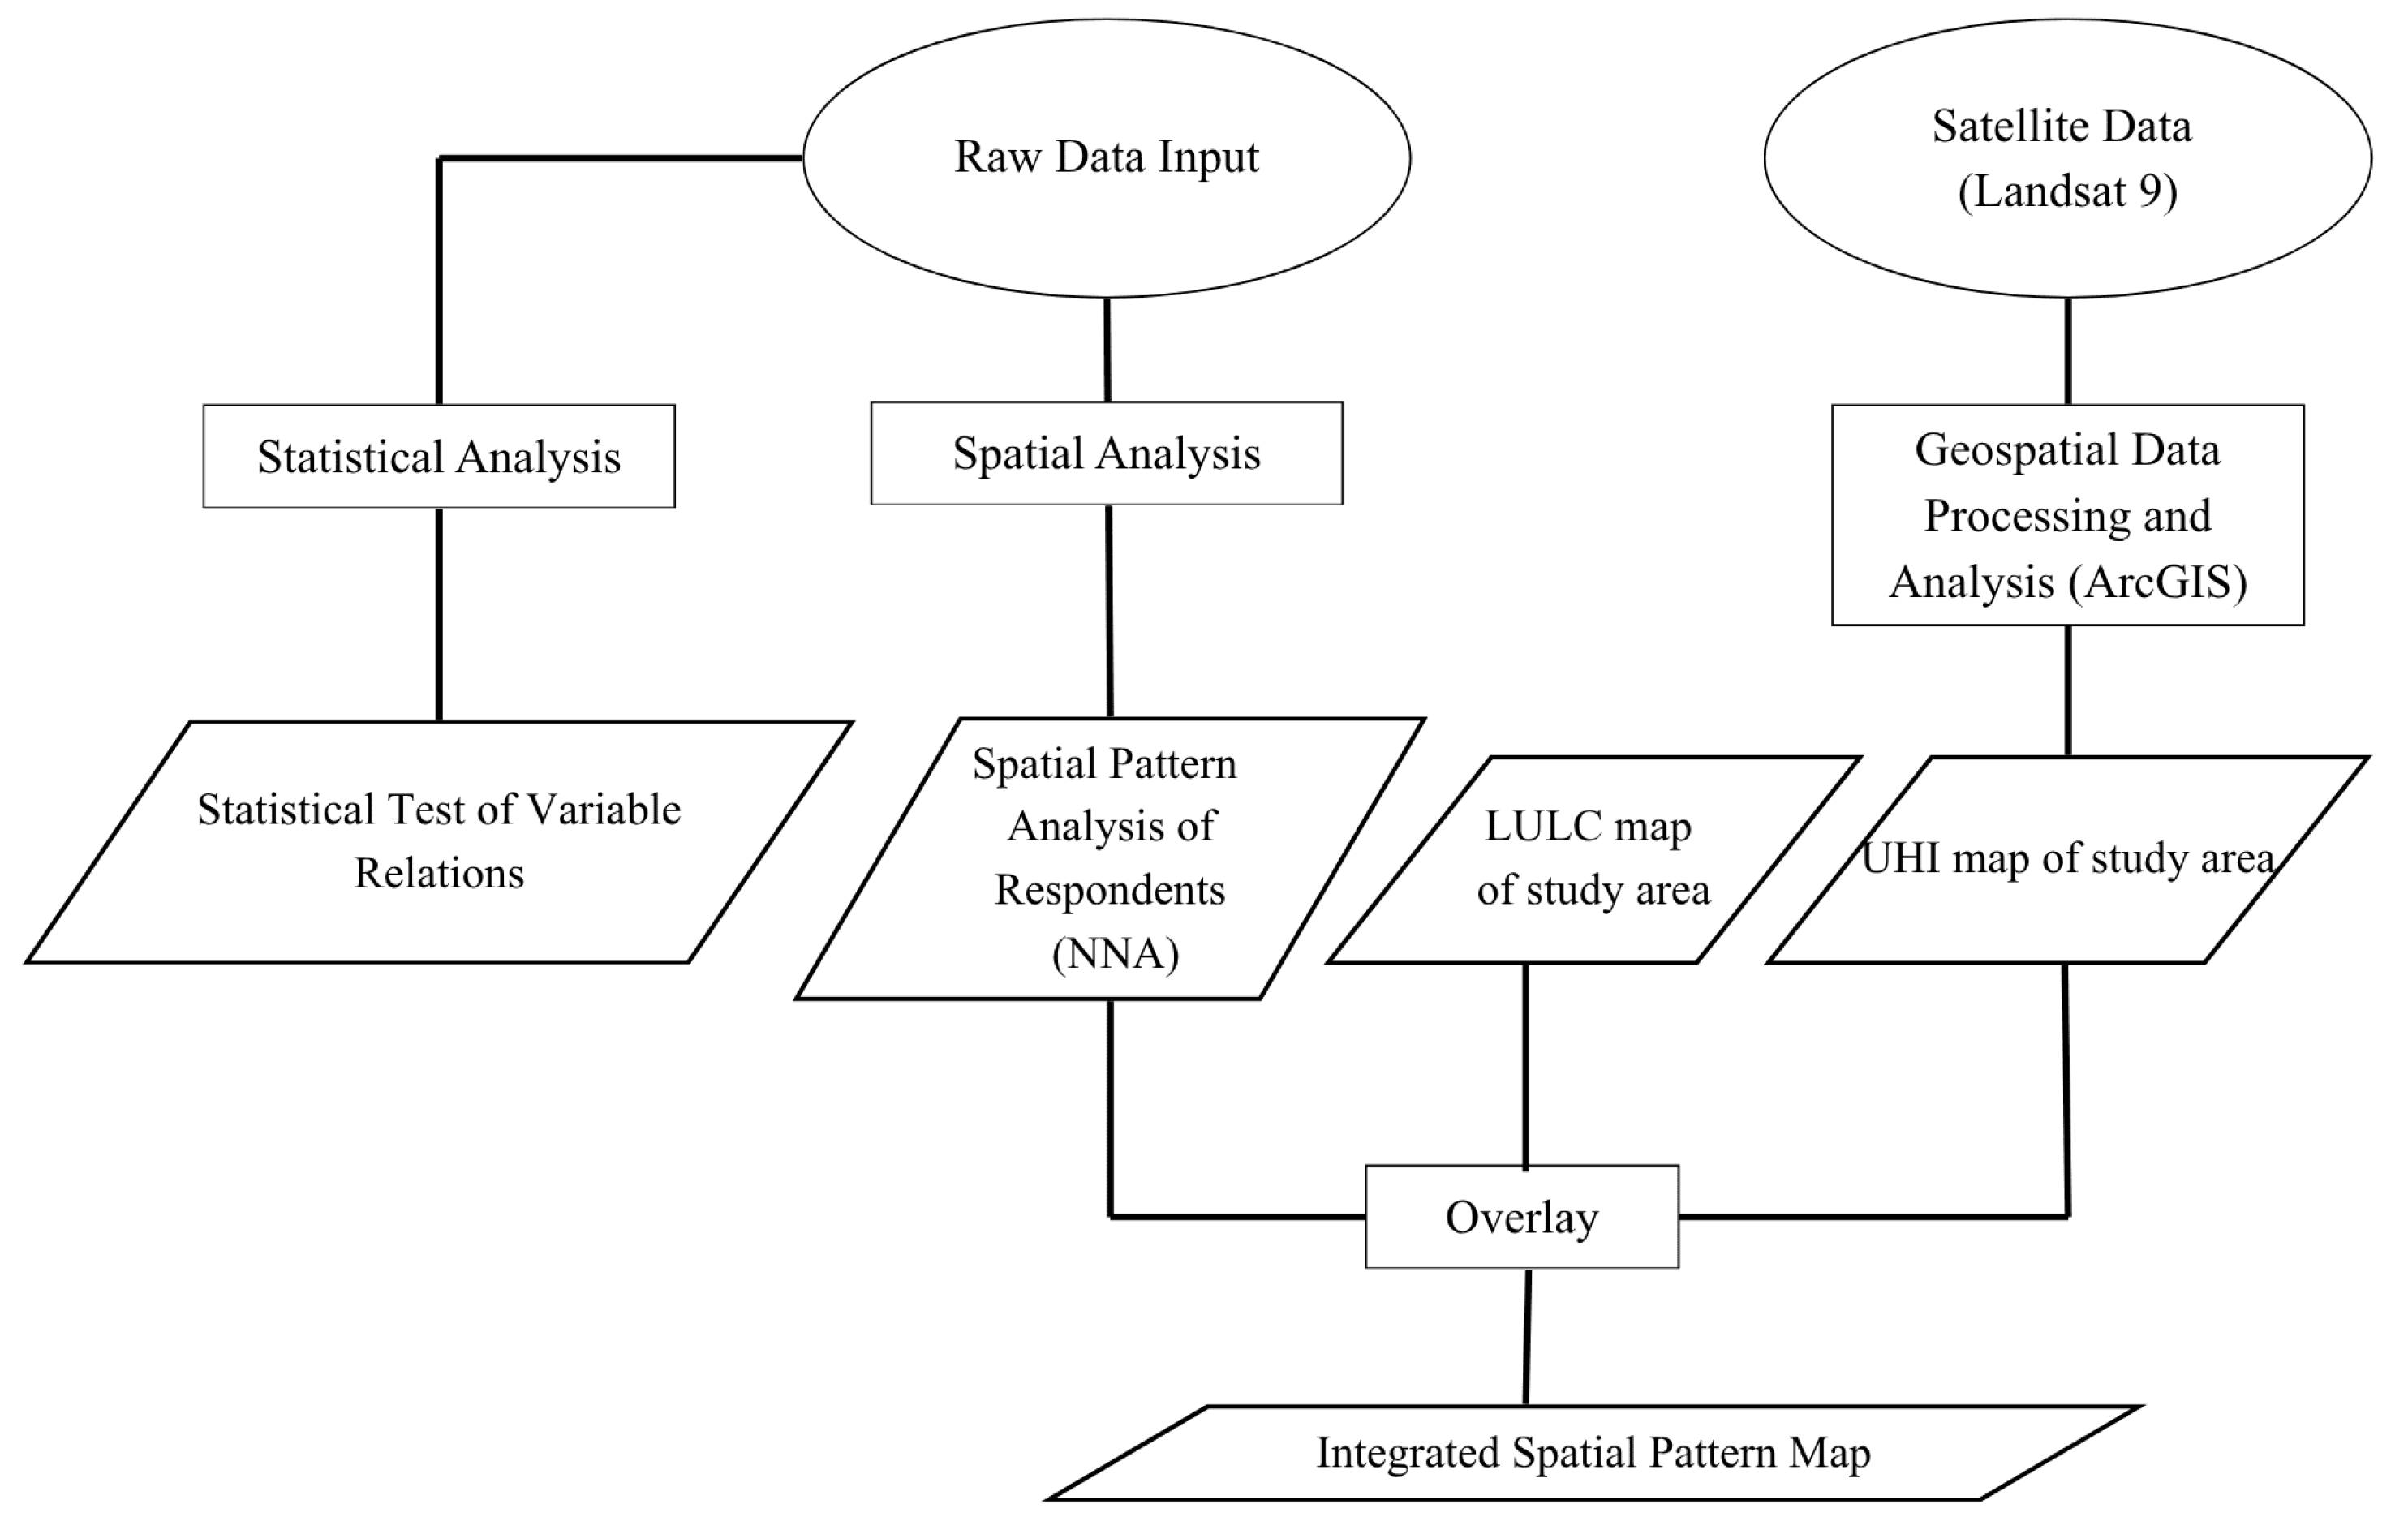
To achieve the research objectives, which involved analyzing household water management behavior using statistical analysis and spatial analysis, the following key research stages were followed:
  • Instrument Development and Data Collection: A structured questionnaire was developed to collect quantitative data on household water management behavior, including perceptions, perception of government roles, public satisfaction, and demographic information. The questionnaire consisted of 76 items for three variables, consisting of 25 items measuring perception, 35 items assessing the government’s role, and 16 items evaluating public satisfaction. The questionnaire also collected geotag information (longitude and latitude) of the respondent’s residence. A Likert scale was employed in the questionnaire to measure the constructs examined in this study.
  • Quantitative Data Analysis: SPSS software was used for the statistical analysis of the questionnaire data to examine the variables.
  • Geospatial Data Processing and Integration: Geographic Information System (GIS) software (ArcMap 10.6.1) was used to process the geotag data into point features. These respondent points were then overlaid with relevant geospatial layers, specifically LULC maps to understand the surrounding environmental context, UHI maps are used to assess the impact of urban thermal conditions.
  • Integrated Modelling and Comparative AnalysisAverage Nearest Neighbour (ANN) was employed to identify areas with high household behavioral water use and to compare water use behavior patterns based on the distinct hydro-ecological features of Surabaya and the surrounding city (Sidoarjo), as well as their respective spatial conditions. The NNA map of behavioral pattern then was subsequently overlaid with UHI intensity and LULC layers to assess spatial coincidence between behavioral patterns and environmental stressors. This overlay analysis was used to identify areas with potential water scarcity risk based on the interaction between household water use behavior and environmental conditions. The resulting composite layer was classified using the equal interval (equal break) method to categorize the spatial distribution into relative risk levels.

2.2. Study Area Description

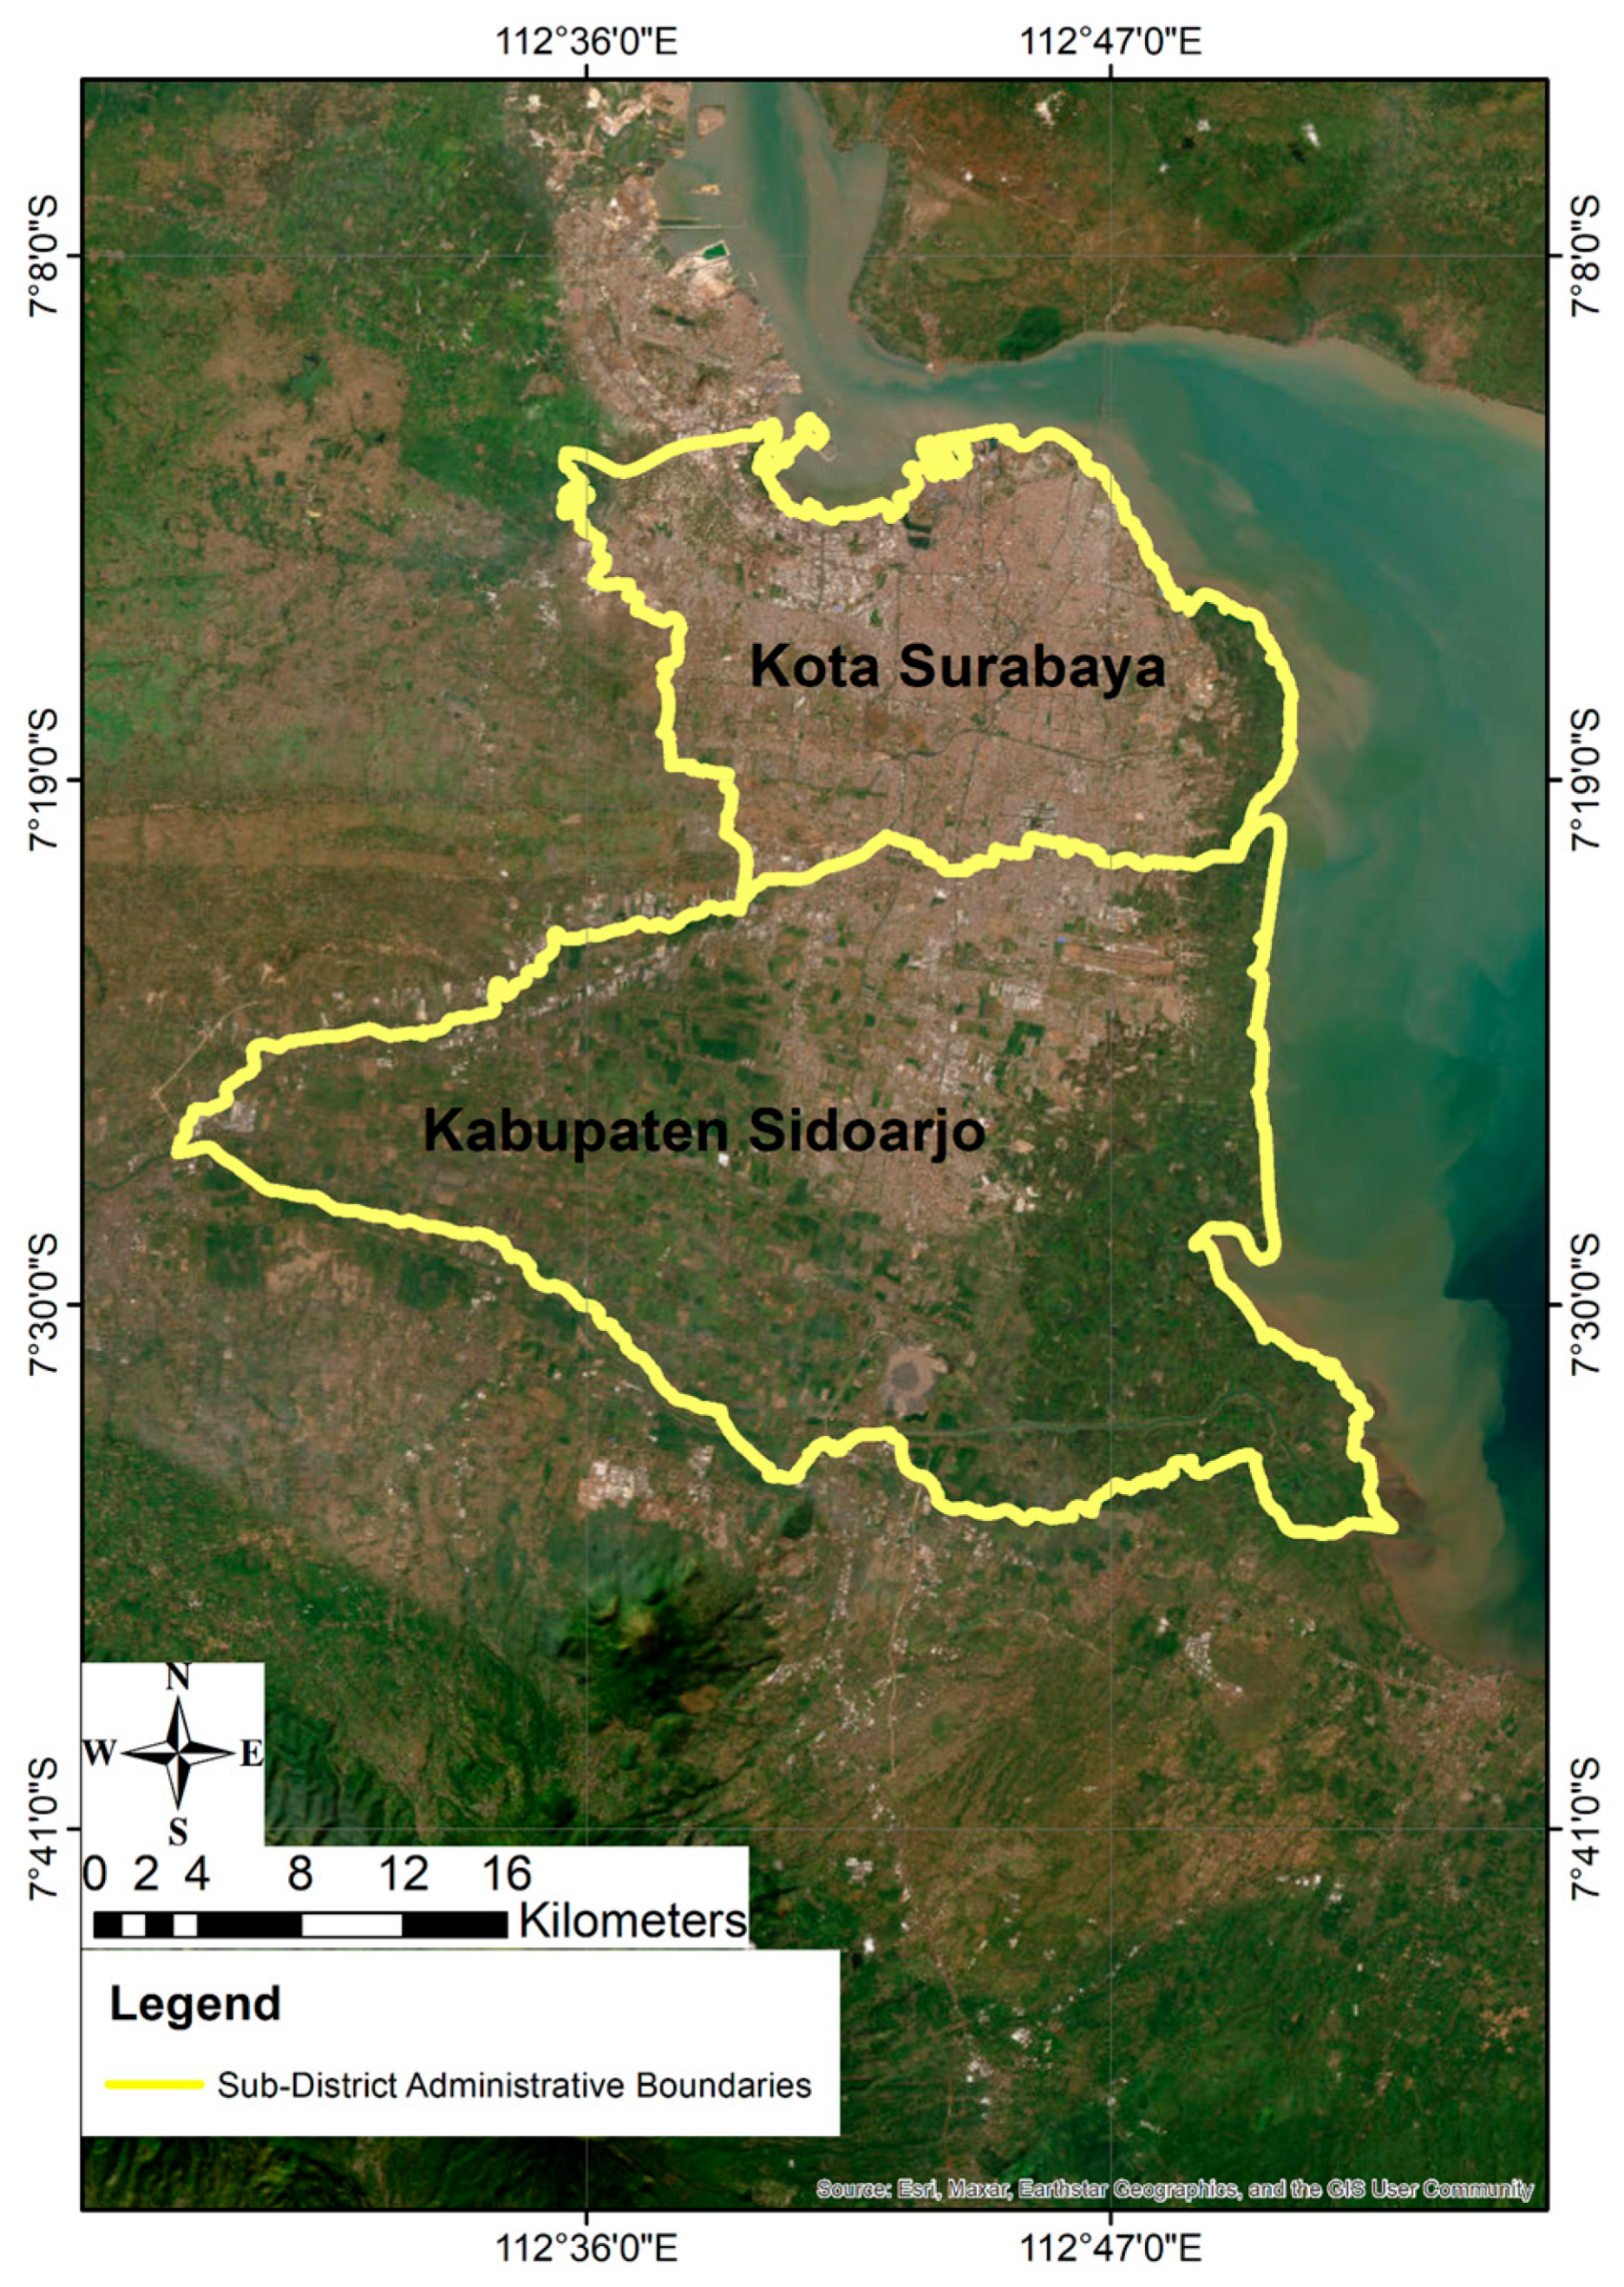
The major metropolitan city of East Java, Surabaya, is regarded as one of the largest urban centres in Indonesia, alongside the Capital City of Jakarta, Yogyakarta, Semarang, and other prominent cities. This gives Surabaya an exceptionally high human population, reaching 3,018,022 inhabitants (BPS, 2024) [27]. The present study area, located in Surabaya City and its surrounding regions, lies between longitude 112°36′ to 112°54′ E and latitude 07°09′ to 07°21′ S [27]. The study area generally covers approximately 335,950 m2 [27]. In the context of this research, the study is not limited to Surabaya City; it also includes Sidoarjo Regency as a peri-urban representative area that supports the metropolitan functions of Surabaya, as shown in Figure 1.

2.3. Samples

A total of 204 purposely selected individuals responded to the distributed questionnaire. The primary inclusion criterion included residents living in Surabaya City and its surrounding areas who are users of government-provided water services (PDAM). Respondents reported on their behavioral patterns and perceptions related to their domestic water use management. Table 1 presents the socio-demographic characteristics of the study participants. Overall, more women than men participated in the survey. Most respondents reported senior high school (SMA/SMK) as their latest educational level. Their monthly income levels varied, but generally ranged between Rp 3.000.000 and Rp5.000.000 (178 USD–296 USD), as shown in Table 1.

2.4. Statistical Analysis

IBM SPSS Statistics 25 was used to conduct analyses focusing on the factors in household water management behavior by examining residents’ perceptions, government’s role, and public satisfaction, as seen in Figure 2. To best capture relevant information regarding residents’ behaviors, the occurrence of content within questionnaire items was coded and grouped into three major content areas which are public perception, government role, and public satisfaction. Furthermore, aggregate questionnaire scores were computed using SPSS to identify respondents alongside their corresponding behaviors and perceptions toward water use management. A one-way ANOVA was then used to examine whether there were significant differences in household water use behavior between the two study areas (Surabaya and Sidoarjo). The hypotheses tested were H0, which states that there is no significant difference in mean behavior scores between the two areas, and H1, which states that there is a significant difference in mean behavior scores between the two areas.

2.5. Spatial Analysis

The spatial distribution of household water management behavior was analyzed using GIS tools to identify spatial patterns and environmental contexts associated with residents’ perceptions, government’s roles, and public satisfaction. The ANN analysis was employed to effectively visualize and understand the spatial distribution patterns of residents. This method generates a predictive pattern of spatial dispersion, allowing the identification of whether residents are evenly distributed or spatially concentrated within the study area. By applying ANN, distribution patterns that may not be immediately visible through simple mapping can be revealed.
This analysis is essential for recognizing how residents are spatially organized, thereby providing valuable insights for policymakers and urban planners regarding where and how efforts should be directed to enhance existing human resource quality. The ANN analysis further allows for the quantitative evaluation of spatial distribution patterns to determine whether these residents are clustered, randomly distributed, or dispersed. An ANN value less than 1 indicates clustering, while a value greater than 1 signifies dispersion.
Beyond its policy implications, this spatial analysis contributes to a deeper understanding of accessibility, equity, and the spatial potential of residents within the urban environment. All spatial analyses were conducted using ArcGIS software. Like the flowchart seen in Figure 2, this study then use the ArcGIS to further utilized to overlay the spatial distribution map of residents with high behavioral scores and low behavioral score onto LULC maps, and UHI layers, to examine the environmental and spatial characteristics of each respondent’s residential area. The spatial risk model was developed using an equal-weight additive approach. First, each parameter (behavioral density, UHI intensity, and LULC category) was standardized into a five-level ordinal scale (1–5), where higher values represent greater environmental stress. The standardized layers were then aggregated (Risk = B + U + L). Finally, the composite risk values were classified into relative risk categories using the equal interval method.

3. Results

3.1. Statistical Analysis Results

The data collected from respondents who are customers of the drinking water company (PAM/PDAM) were screened to avoid outliers. The initial 204 respondent datasets were reduced by removing outliers, and the remaining datasets were analyzed using IBM SPSS 25. Descriptive statistics were used to explore public perceptions of the water management they receive and their behavior. This includes the public’s perception of the government’s role and their public satisfaction. Table 2 shows the mean, standard deviation, minimum, and maximum values of the research variables.
The descriptive results for the three variables are presented in Table 2. The validity test results, as presented in Table 2, indicate that the calculated r-values for perception (ranging from 0.356 to 0.815), government role (ranging from 0.543 to 0.844), and public satisfaction (0.522–0.819) exceed the r-table value for n = 204, confirming that all items are valid, while the reliability test shows Cronbach’s alpha values of 0.935 (perception), 0.972 (government role), and 0.933 (public satisfaction), all exceeding the 0.60, thereby demonstrating that the constructs are reliable. The mean value for each variable is 3.92 for the perception variable, 3.77 for the government’s role variable, and 3.67 for the public satisfaction variable. In this study, with a maximum value of 5 for each variable, a higher score closer to 5 indicates a better outcome. Public perception regarding their water usage has a mean of 3.92 with a standard deviation of 0.53. The mean of 3.92 is the highest among the three variables, indicating that respondents have a positive perception of their sustainable water use, and the lowest standard deviation suggests low variation in respondents’ views. The government’s role, with a mean of 3.77 and a standard deviation of 0.66, indicates that respondents assess the government’s performance as moderately high or good. However, its standard deviation indicates greater variation in the answers than the perception variable. This can be interpreted as differences in experience or perception regarding the effectiveness of government policies and services. Public satisfaction has a mean that is still relatively high but lower than the other variables. Its standard deviation is also the highest, suggesting that public satisfaction is not yet evenly distributed.
The ANOVA analysis helped to evaluate and compare the influence of the three variables on sustainable water management behavior across two different cities/regencies, as presented in Table 3. The results demonstrate that Sidoarjo Regency has a significantly higher behavior score than the urban city it borders, Surabaya. The community in Sidoarjo Regency has a higher mean score for water management behavior (3.95) compared to the community in Surabaya City (3.49). The ANOVA results indicate a statistically significant difference between Surabaya and Sidoarjo, (F = 14.53; p < 0.05), as shown in Table 3. Since the p-value is lower than α = 0.05, the null hypothesis is rejected, indicating that mean behavior scores differ significantly between the two areas, with Sidoarjo demonstrating higher and more favorable behavioral scores.

3.2. Spatial Analysis Results

3.2.1. Spatial Pattern

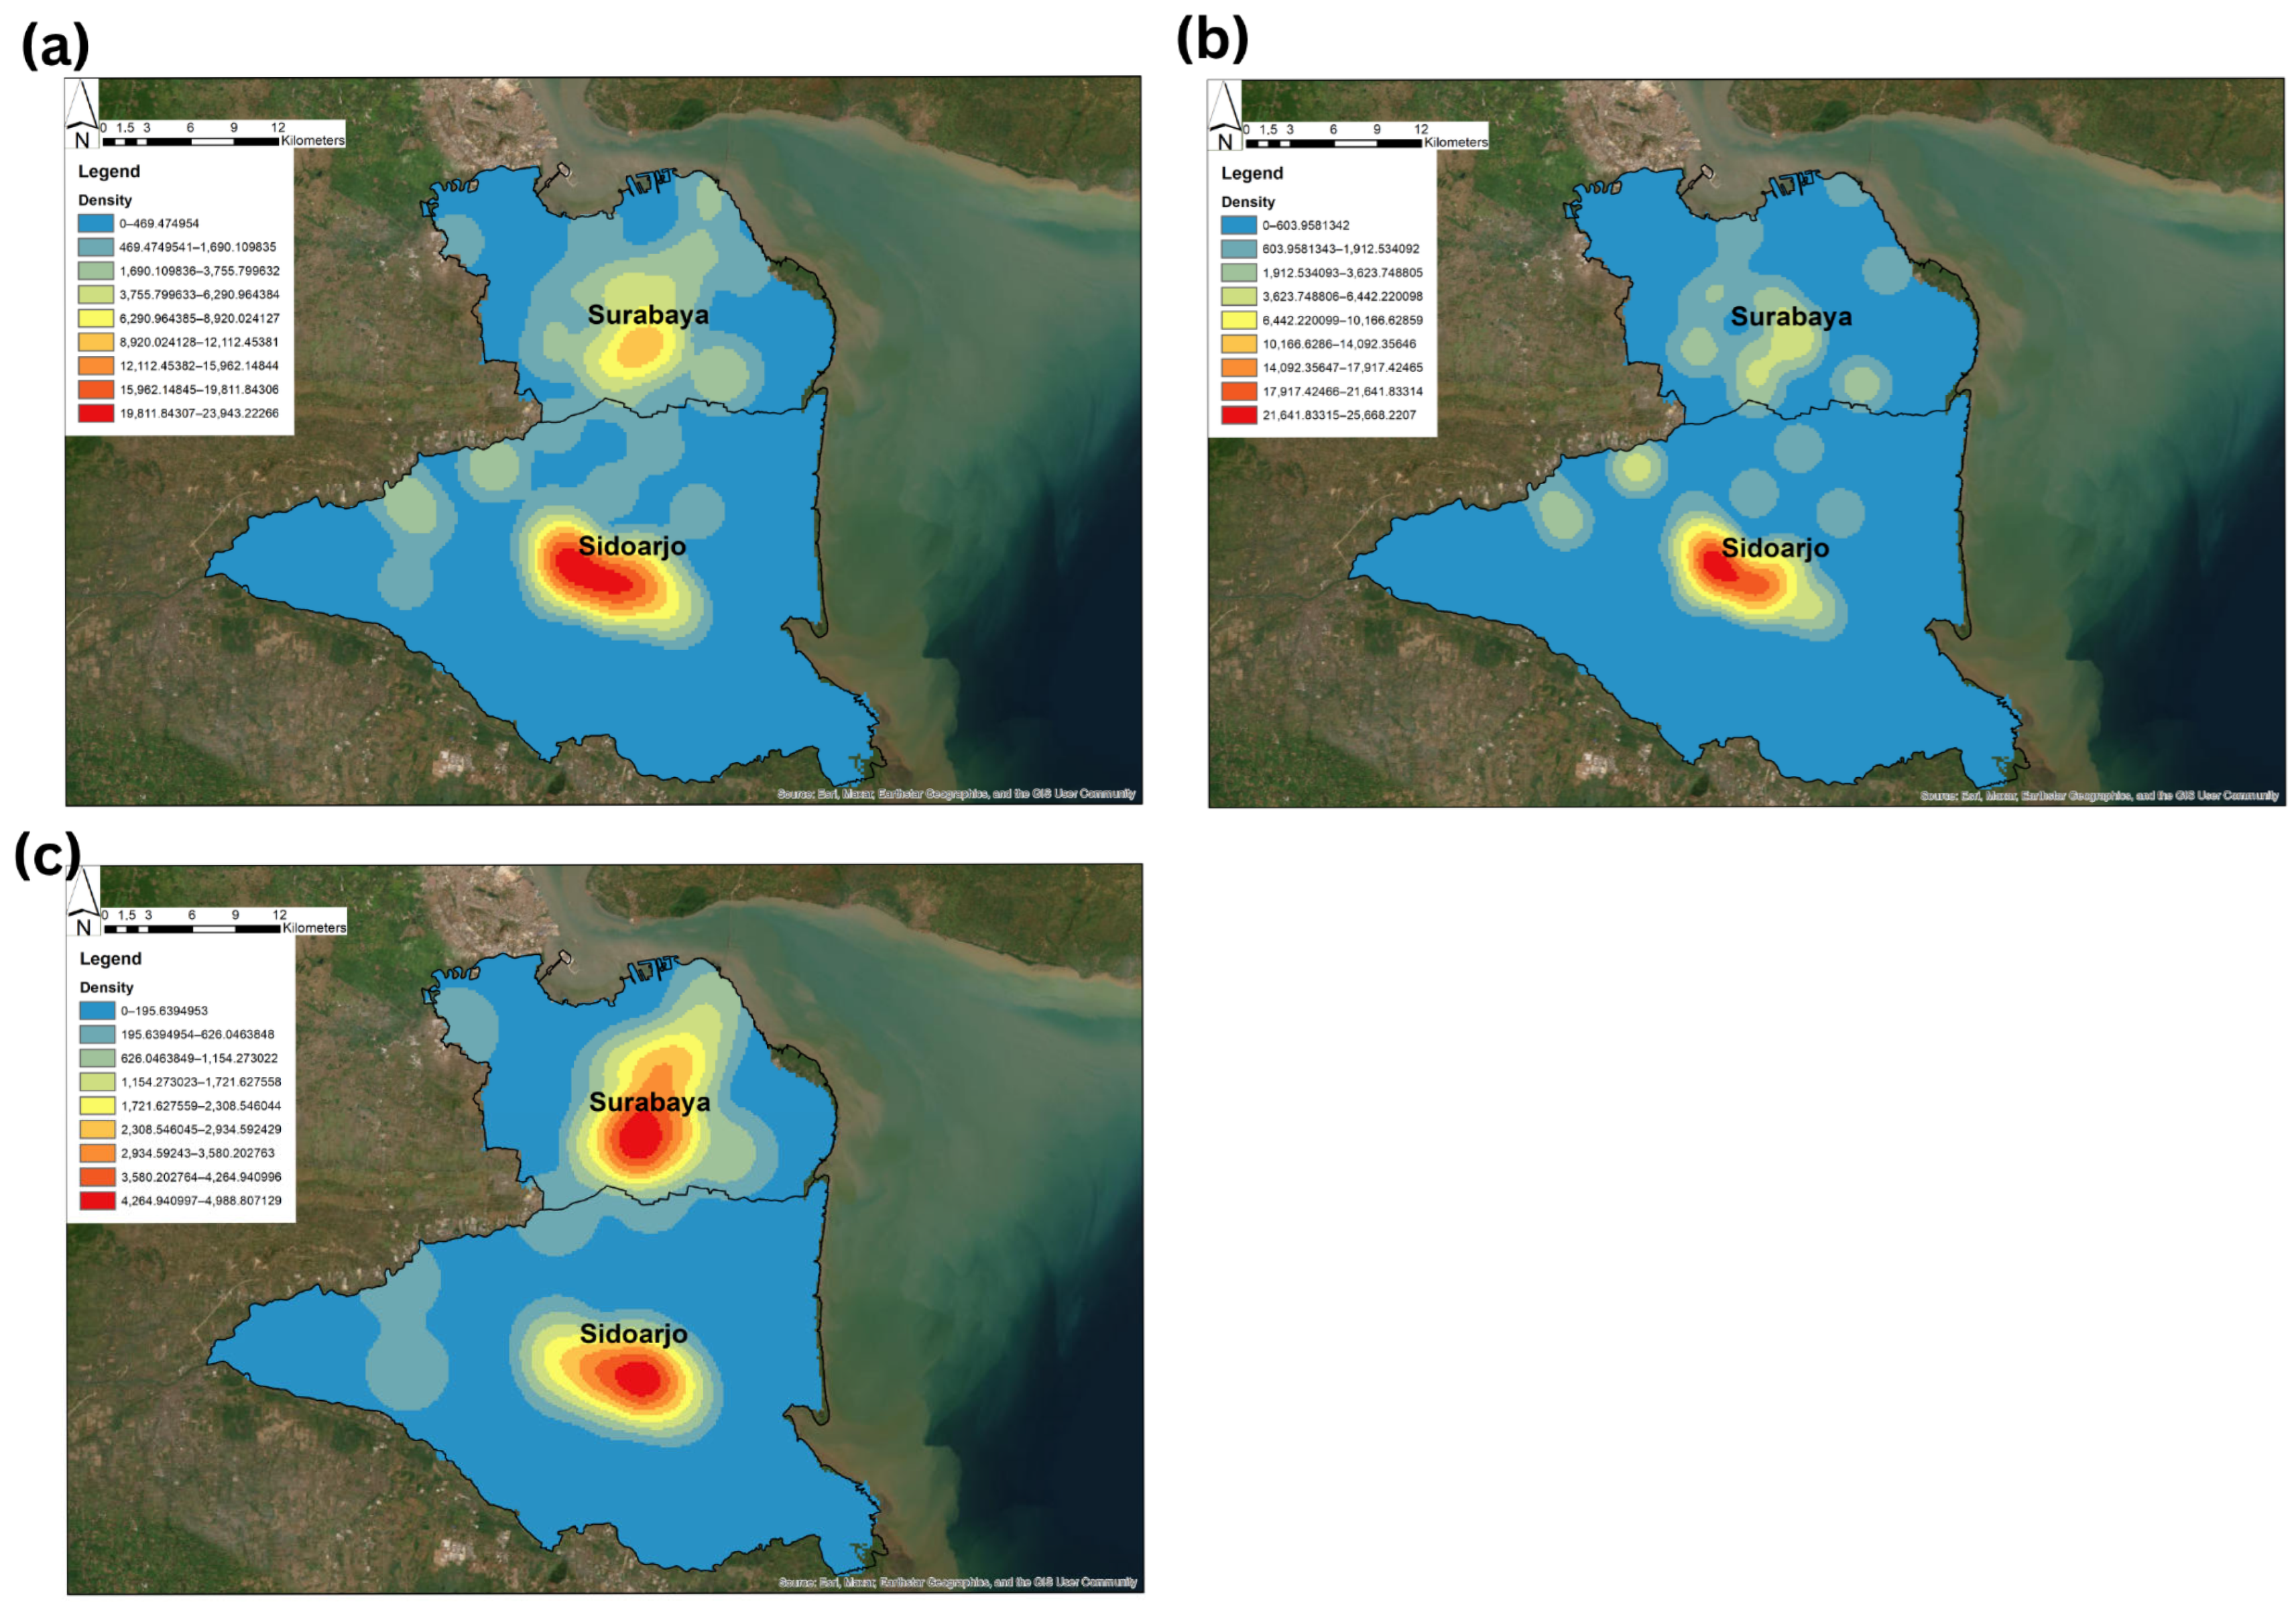
Kernel density analysis (KDA) was performed using the spatial locations of respondents, categorized by high and low behavioral scores, to identify areas of respondent clustering. The overall distribution showed that the majority of respondents are clustered for both group, as shown in Table 4, characterized by p-value < −2.58. Both group clustered in South Surabaya and Central Sidoarjo (Figure 3). Specifically, respondents exhibiting outstanding behavior (high scores) were observed to cluster prominently in Central Sidoarjo, with fewer clusters identified within Surabaya (Table 4). Contrarily, respondents with low behavioral scores clustered into two primary areas, with the largest clusters in Surabaya and Central Sidoarjo (Figure 3). Regarding the spatial characteristics of the residential locations, the trend analysis produced similar results for both the excellent and poor behavior groups. Although the trends were nearly identical, the clustering of respondents with excellent behavior revealed a significant difference between Surabaya City and Sidoarjo City, consistent with the subsequent Analysis of Variance (ANOVA) results.

3.2.2. Land Use Land Cover

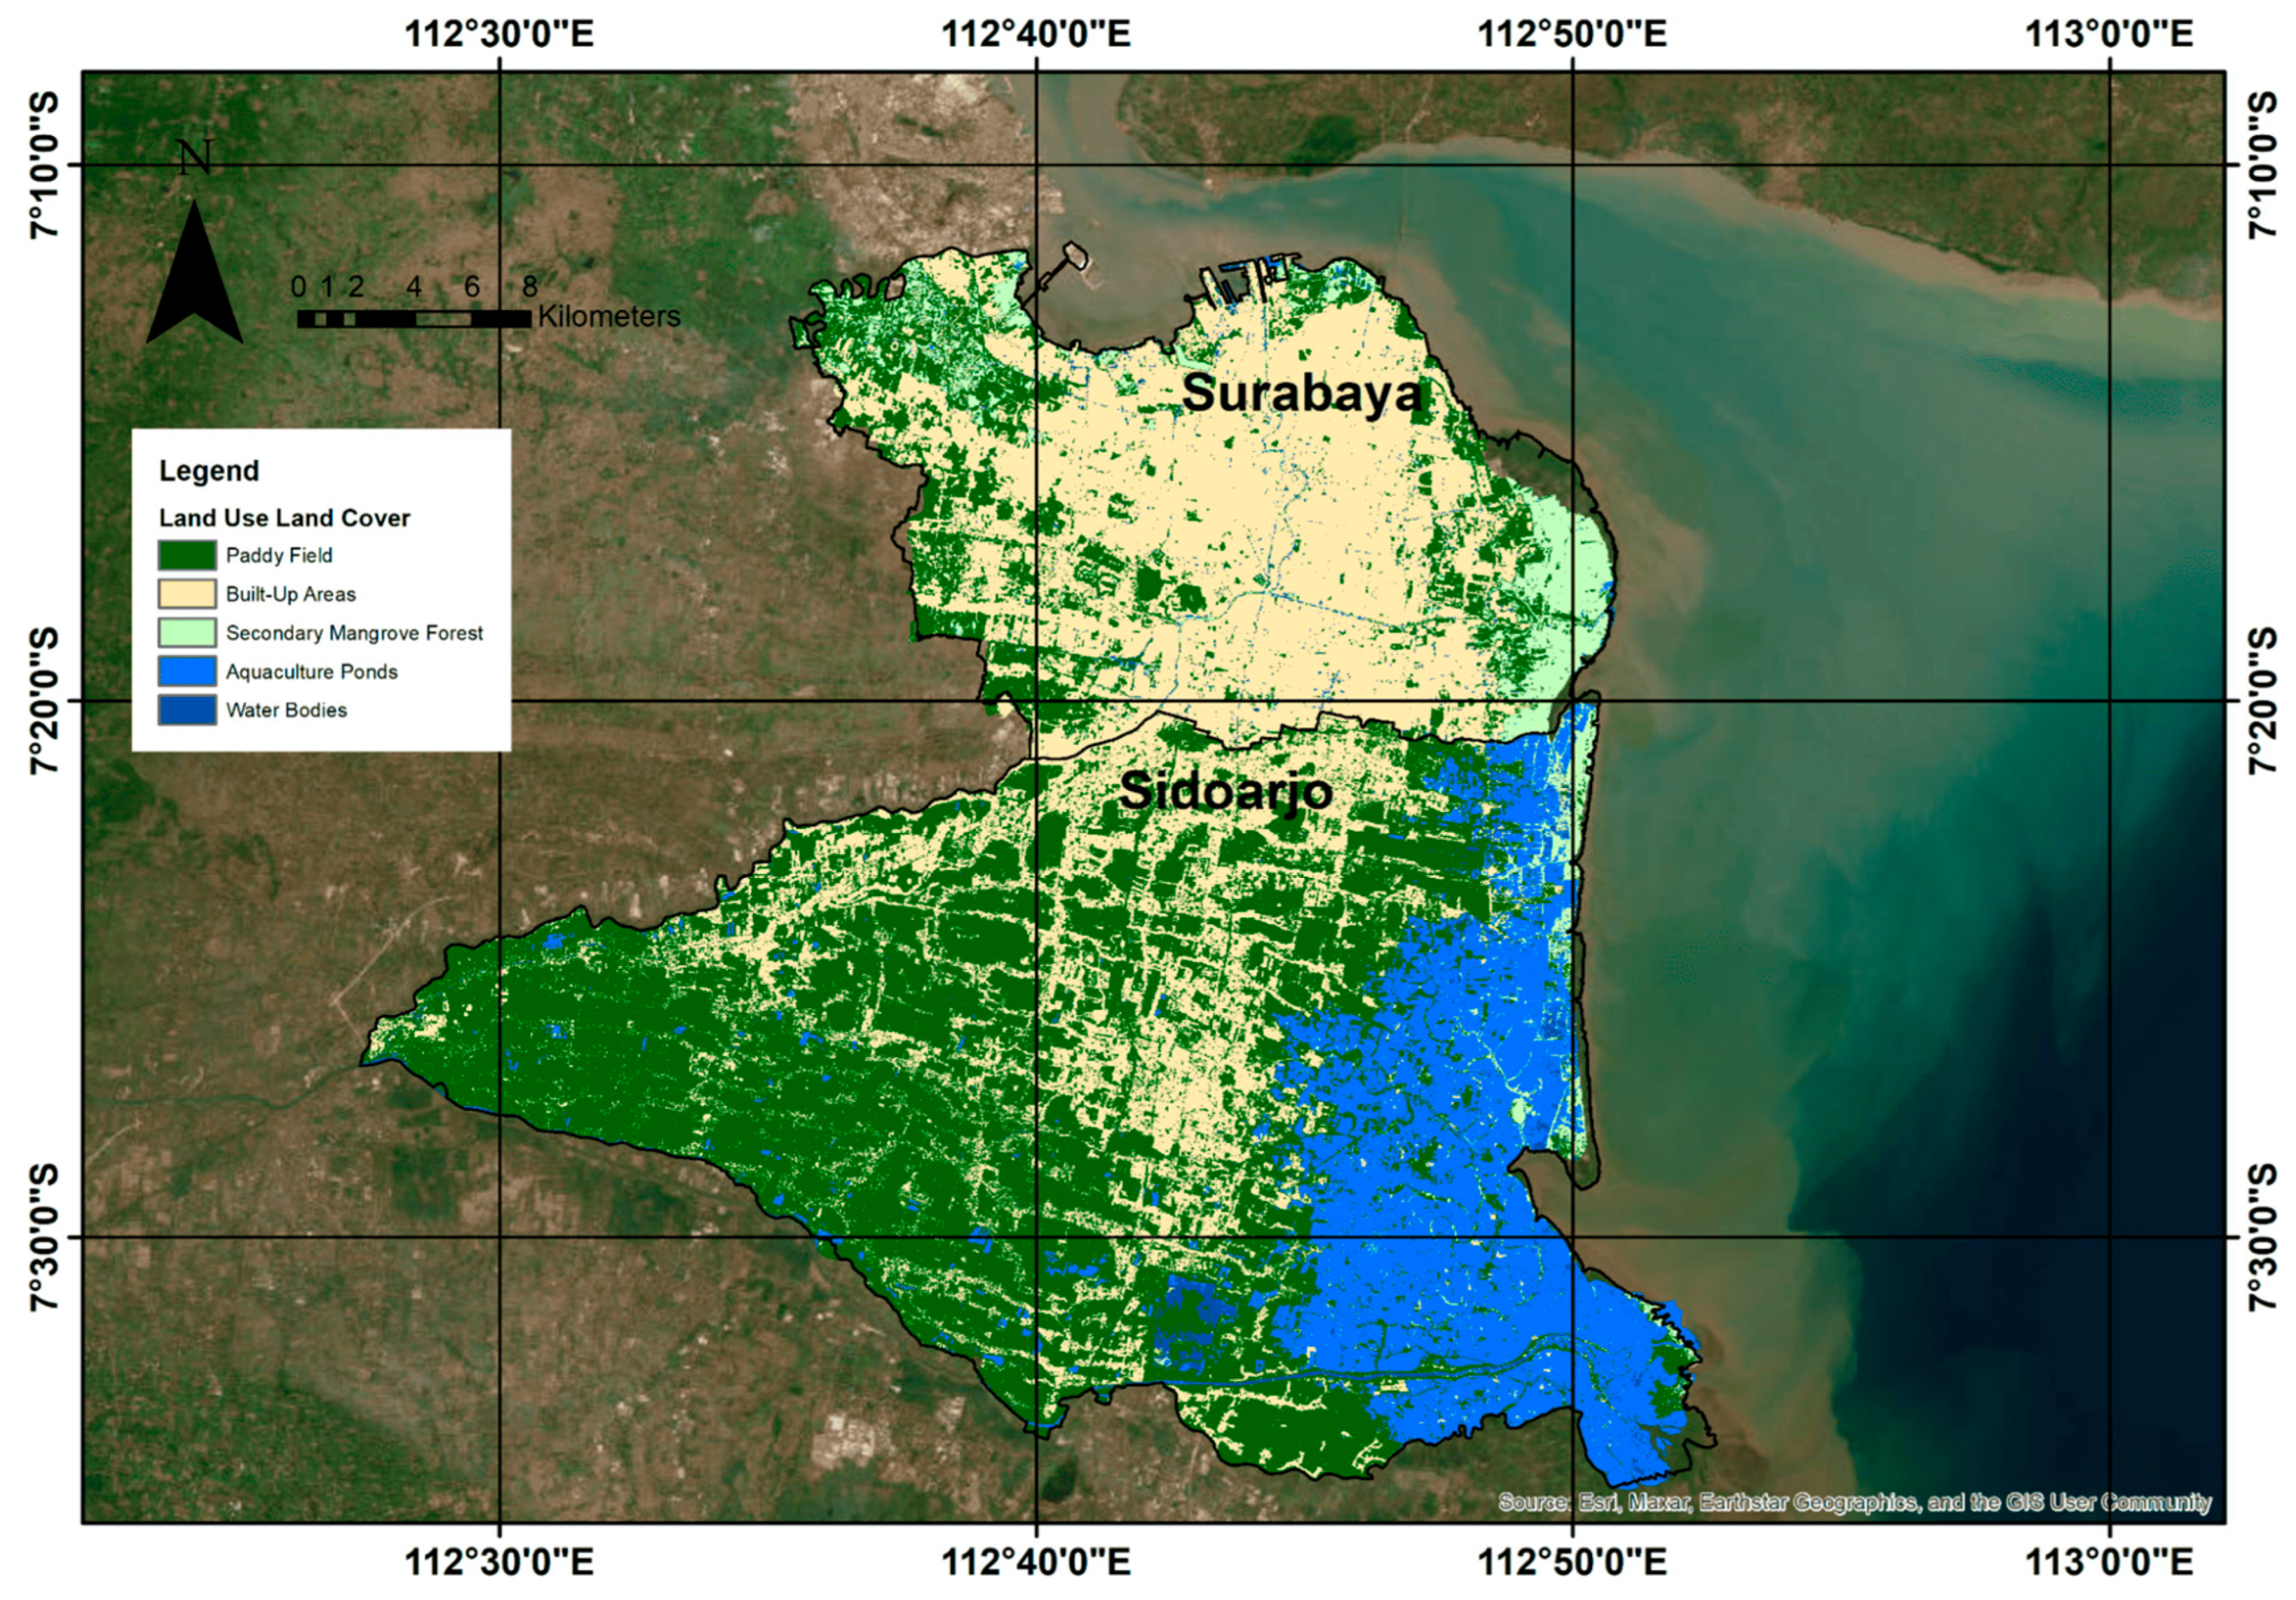
The results of land cover analysis are presented in Figure 4. Spatial cover includes paddy fields, built-up areas, secondary mangrove forests, ponds, and water bodies. Figure 4 shows that built-up areas cover more than half of Surabaya City, while paddy fields cover more than half of Sidoarjo Regency. In the eastern part, both Surabaya City and Sidoarjo Regency are identified as secondary mangrove forests. These results imply that Surabaya City, as an urban center with extensive built-up areas, and Sidoarjo Regency, its supporting regency, have more green areas.

3.2.3. Urban Heat Island

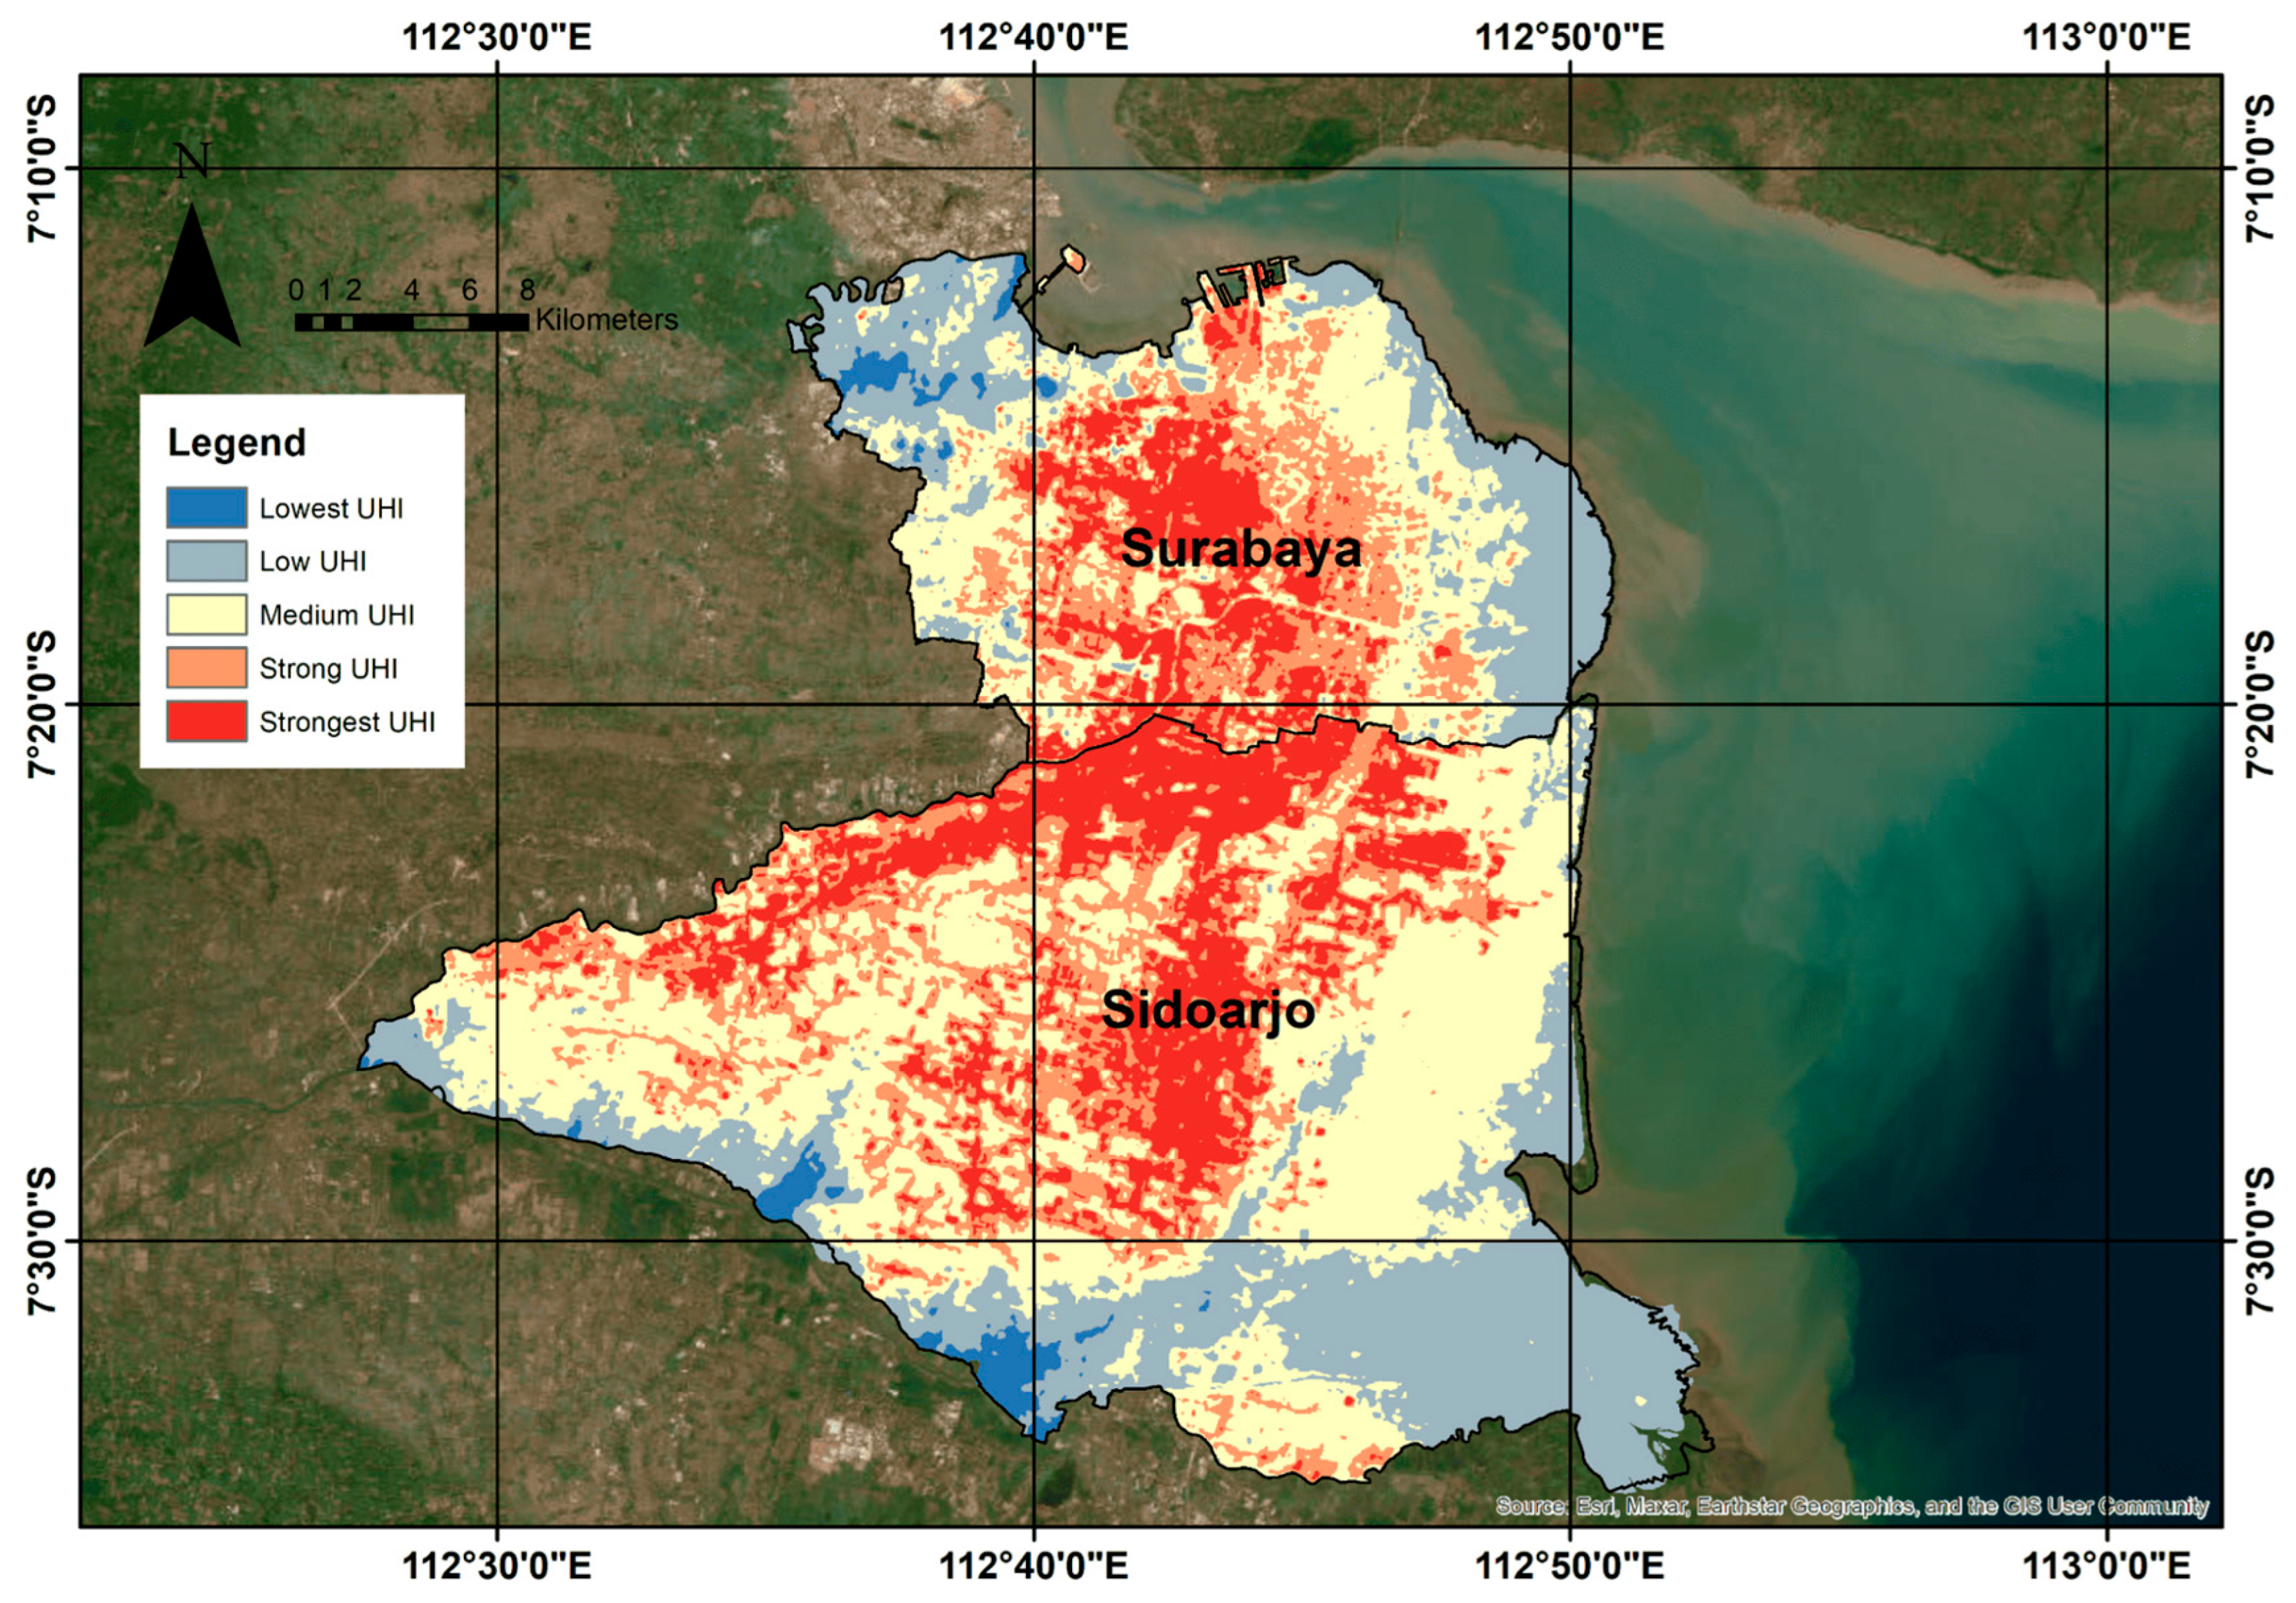
The dynamic interplay of various spatial factors leads to the formation of the UHI effect. The combination of these factors results in significant variations in UHI intensity across different geographic locations, as evidenced by the distinct UHI patterns observed between Surabaya and Sidoarjo in Figure 5. UHI values falling into the ‘very high’ category are a typical occurrence in highly urbanized settings, as prominently displayed in Surabaya City (Figure 5). Furthermore, observations from Figure 5 indicate that the strongest UHI category extends into the suburban areas of Sidoarjo that border Surabaya City. This constant presence of high to very high UHI intensity categories has considerable implications for numerous environmental concerns.

3.2.4. Integrated Spatial Map

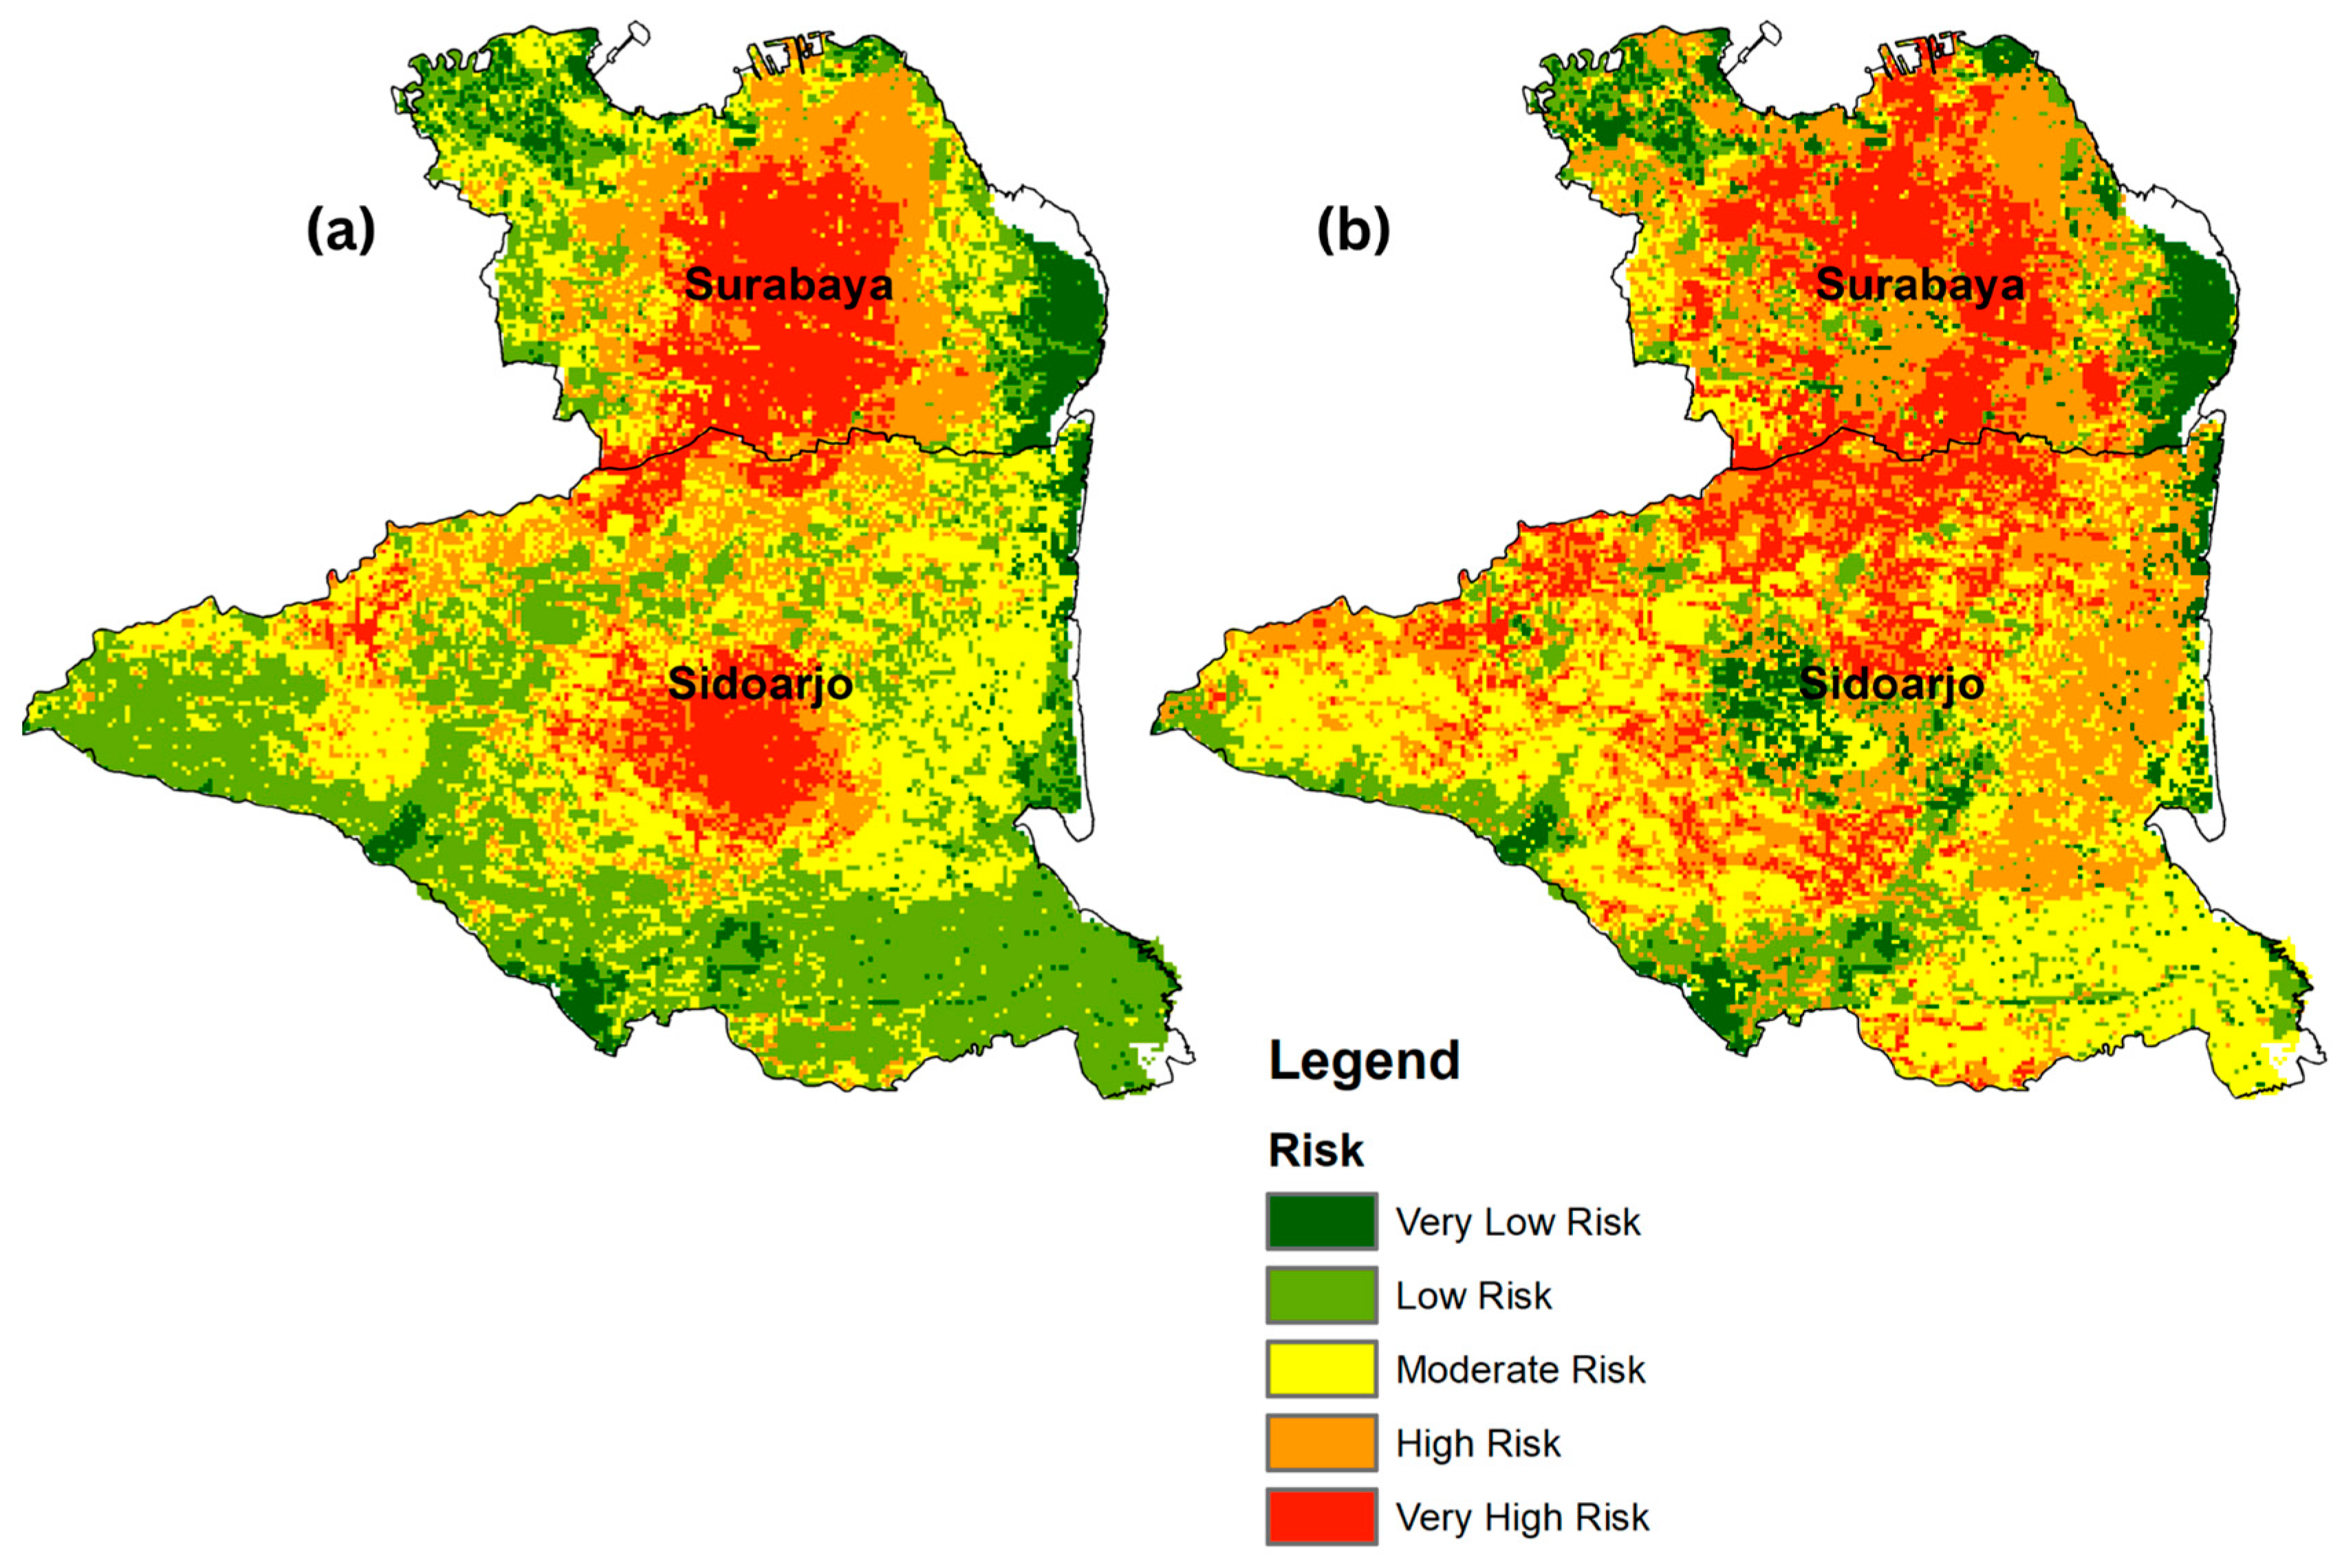
In this study, the spatial density of respondents, classified by high and low behavior scores, was spatially overlaid with the UHI and LULC data. The resulting risk maps are presented in Figure 6. These maps illustrate the disparity in localized hazard risk associated with water use when the population (represented by the respondents) exhibits poor behavior (Figure 6a) versus excellent behavior (Figure 6b). The highest risk conditions are marked in red, with the next risk level indicated in orange. Figure 6 consistently identifies the areas of south-central Surabaya, the Sidoarjo border, and central Sidoarjo as the region’s most vulnerable to high risk. This classification is fundamentally driven by adverse environmental conditions, such as strong UHI (Figure 5) and low-scoring land cover (extensive built-up areas, Figure 4). These two factors function as significant environmental stressors impacting local water availability. Crucially, when these environmental stressors coincide spatially with a resident population exhibiting poor water-use behavior, the overall risk factor is substantially amplified (Figure 6a). Contrarily, Figure 6b shows the positive contribution of residents with excellent behavior, which generally leads to few levels reduction in the concentration of high-risk areas, particularly evident in Surabaya. Furthermore, Figure 6b suggests a potential decrease to the lowest risk level in certain areas, most notably within Sidoarjo. This pattern highlights the potential of behavior to moderate water scarcity risks and support climate change mitigation.

4. Discussion

This study suggests that the existence of mostly positive public perceptions of sustainable household water use is a clear indication of collective awareness, shown by the behaviour patterns all being clustered. This positive water use behavior helps reduce the risk of water scarcity when integrated with environmental stressors associated with climate change (Figure 6). This aligns with previous research indicating that when individuals understand the implications of water scarcity, their moral obligation to conserve it increases, that perception in turn impacts how we consume water [12,28,29]. These findings also align with previous studies, demonstrating that behavioral factors play a significant role in determining household water use [10,11]. It is crucial to note, however, that previous studies highlight a tendency for individuals to underestimate their own consumption [30], often resulting in perceived effectiveness being inversely proportional to actual water use.
As outlined in the results above, alongside perceptions and public satisfaction, respondents in both areas also perceive the government’s role as another variable that is important and generally well performed. This suggests that public evaluation of governance may shape community responses to water-related challenges. For communities, inclusive water governance appears to promote proactive responses to water crises, mirroring observations in the Netherlands [31]. These findings support the evidence that trust in authorities can enhance households’ tendency to improve their water use [32]. When the public is satisfied, they are more willing to contribute to maintaining water infrastructure [13]. Nevertheless, this is accompanied by observations that assessments of government performance are not uniform. This variability may arise because communities differ in their interpretations of the government’s role, these interpretations are not always positive, as communities can be adversely affected by poor management worsened by water crises [33].
In line with the variability in responses to the performance of diverse government roles, public satisfaction also varies. This condition indicates public sensitivity to the reliability of water services or an imbalance in public satisfaction perceptions. This imbalance can affect broader conditions, as user satisfaction shapes the willingness to pay for water services and their upkeep, thereby supporting the financial sustainability of water provision systems [18]. This imbalance in public satisfaction perceptions can be rooted in differences in access and vulnerability [34]. Urban elites are typically more resilient and wasteful of water, often underestimating the scarcity of water they will face [34,35]. ANOVA results show a more favorable water use behavior in Sidoarjo compared to Surabaya. This finding is explained by the tendency of urban households to have lower water-saving attitudes than in other areas, such as rural areas [36] and peri-urban areas. This indication is reinforced by the understanding that socioeconomic differences can shape different water consumption patterns, with high-income urban groups tending to be more wasteful [37]. Peri-urban households may also exhibit stronger water-saving behavior due to higher levels of frugality, characterized by waste avoidance and careful financial management, which can encourage more conservative and efficient resource use [38].
Regarding spatial dimensions, our findings reveal that respondents are geographically clustered, distinguishing areas associated with sustainable versus unsustainable behaviors. This spatial relationship suggests that perceptions of household water use are not uniform across regions, clusters of favorable behavior are concentrated in the center of Sidoarjo Regency. In contrast, respondents exhibiting less sustainable habits are clustered within the center of Surabaya City. In contrast to Sidoarjo, Surabaya City characterizes an urban environment with a higher density of privileged households. Such households tend to misjudge their relative water use, either overestimating or underestimating it, depending on the urban-suburban context [30]. These behavioral divergences may also be driven by underlying motivations and social norms, which shape the spatial clustering of these behavioral patterns [39].
Environmental stress factors were subsequently integrated with behavioral stressors. When critical zones of high environmental stress, characterized by elevated temperatures and dense built-up areas, overlapped with regions of unsustainable behavior, a crucial distinction emerged. The intersection of environmental stress and poor behavior substantially worsened risk, particularly given that behavior is a primary determinant of household water use [40]. Conversely, when information on water availability was accessible and risks were understood, intentions toward water conservation increased, thereby creating lower-risk zones, as illustrated in Figure 6 [41].
This study acknowledges limitations regarding data availability, sample size, and specific aspects of data processing. While the exclusive focus on perceptions and spatial dimensions provided targeted insights, future research would benefit from incorporating participant demographics such as age, gender, and socioeconomic characteristics that may influence water-use behavior. The use of purposive sampling may also introduce potential sampling bias and limit the representativeness of the findings for the broader population. Furthermore, given that the comparative analysis was restricted to two specific regions, spatial generalizations remain limited. They may not fully capture the diversity of urban and peri-urban contexts across Indonesia. A sensitivity analysis also was not conducted, as the model was intended for exploratory spatial indication, this may influence the robustness of the risk classification and should be addressed in future research. Additionally, the current spatial approach lacks spatio-temporal dynamics related to climate change, thereby preventing a comprehensive assessment of mitigation strategies. Future research could advance this work by expanding the study area, integrating demographic variables, and incorporating spatio-temporal dimensions to better understand the context of household water use in mitigating climate change.

5. Conclusions

This study shows that respondents in both Surabaya and Sidoarjo generally report positive perceptions of their water use, evaluate government performance in water management favorably, and express positive public satisfaction. There are significant differences in behavior between the two areas, with Sidoarjo demonstrating more favorable household water-use behavior. In a spatial context, the analysis explains how environmental pressures such as UHI intensity and LULC interact with community behavior, where good water-use behavior may help moderate water scarcity risks, producing distinct variations between urban and peri-urban settings. The findings indicate that households exhibiting sustainable behavior tend to cluster in peri-urban areas. Theoretically, this study contributes by extending discussion of household water use beyond volumetric measures by integrating behavioral and environmental factors within the spatial framework. These findings also provide insight for developing spatially informed strategies to mitigate climate change impacts on urban water systems. Consequently, these findings emphasize the importance of water governance that is responsive to spatial contexts, alongside the need for targeted government intervention strategies to support sustainable household water use. These insights provide an empirical basis for designing adaptive and locally responsive water management strategies in urban and peri-urban areas.

Author Contributions

Conceptualization, D.R.N., D.M. and E.A.; methodology, D.R.N. and D.M.; software, D.R.N.; validation, D.M.; formal analysis, D.R.N., D.M. and E.A.; investigation, D.M.; resources, D.R.N.; data curation, D.R.N.; writing—original draft preparation, D.R.N., D.M. and E.A.; writing—review and editing, D.R.N., D.M. and E.A.; visualization, D.R.N., D.M. and E.A.; supervision, D.M.; project administration, D.M.; funding acquisition, D.M. All authors have read and agreed to the published version of the manuscript.

Funding

This research was funded by the Directorate of Funding and Research Ecosystem, Universitas Indonesia, PUTI Q1 grant PKS-297/UN2.RST/HKP.05.00/2025.

Informed Consent Statement

Informed consent for participation was obtained from all subjects involved in the study.

Data Availability Statement

The dataset is available upon author request. The raw data supporting the conclusions of this article will be made available by the author upon request.

Acknowledgments

Thank you to Institute for Advanced Social, Science, and Sustainable Future who has helped with the proofreading process and provided technical input during the writing process. The authors have reviewed and edited the output and take full responsibility for the content of this publication.

Conflicts of Interest

The authors declare no conflicts of interest.

References

  1. Umami, A.; Sukmana, H.; Wikurendra, E.A.; Paulik, E. A Review on Water Management Issues: Potential and Challenges in Indonesia. Sustain. Water Resour. Manag. 2022, 8, 63. [Google Scholar] [CrossRef] [Scilit]
  2. Al Djono, T.P.; Daniel, D. The effect of community contribution on the functionality of rural water supply programs in Indonesia. Groundw. Sustain. Dev. 2022, 19, 100822. [Google Scholar] [CrossRef] [Scilit]
  3. Sutomo, S.; Sagala, S.; Sutomo, B.; Wrinarti, S.; Sanjaya, G. Accelerating the Provision of Safe Water Supply in Urban and Rural Areas of Indonesia. Kesmas 2021, 16, 137–144. [Google Scholar] [CrossRef] [Scilit]
  4. Badan Pusat Statistik. Tabel Statistik: Persentase Rumah Tangga Menurut Provinsi, Tipe Daerah, Dan Sumber Air Minum Layak 2024. Available online: https://www.bps.go.id/id/statistics-table/2/ODU0IzI=/persentase-rumah-tangga-yang-memiliki-akses-terhadap-sumber-air-minum-layak-menurut-provinsi-dan-klasifikasi-desa--persen-.html (accessed on 1 October 2025).
  5. Marcal, J.; Shen, J.; Antizar-Ladislao, B.; Butler, D.; Hofman, J. Urban Water Security Assessment: Investigating Inequalities Using a Multi-Scale Approach. AQUA—Water Infrastructure. Ecosyst. Soc. 2024, 73, 569–583. [Google Scholar] [CrossRef] [Scilit]
  6. Srisuwan, A. Urban Water Security in Multidisciplinary Practices: A Case of Lamphun Municipality, Thailand. J. Urban Manag. 2024, 13, 456–468. [Google Scholar] [CrossRef] [Scilit]
  7. Yazawa, T.; Morita, A.; Shimizu, T. Assessment of Basin-Scale Water Stress Using Geographic Information System in Southeast Asian Countries with Megacities. J. Indones. Sustain. Dev. Plan. 2023, 4, 1–20. [Google Scholar] [CrossRef] [Scilit]
  8. Allen, A.; Dávila, J.D.; Hofmann, P. The Peri-Urban Water Poor: Citizens or Consumers? Environ. Urban. 2006, 18, 333–351. [Google Scholar] [CrossRef] [Scilit]
  9. Ramírez-Agudelo, N.A.; Pablo, J.; Roca, E. Exploring Alternative Practices in Urban Water Management through the Lens of Circular Economy–A Case Study in the Barcelona Metropolitan Area. J. Clean. Prod. 2021, 329, 129565. [Google Scholar] [CrossRef] [Scilit]
  10. Shahangian, S.A.; Tabesh, M.; Yazdanpanah, M.; Zobeidi, T. The use of social cognitive theory to explore urban household’s water conservation behaviours. In Proceedings of the Virtual Conference of AQUA ≈ 360: Water for All-Emerging Issues and Innovations, Virtual, 31 August–2 September 2021. [Google Scholar]
  11. Addo, I.B.; Thoms, M.C.; Parsons, M. Household Water Use and Conservation Behavior: A Meta-analysis. Water Resour. Res. 2018, 54, 8381–8400. [Google Scholar] [CrossRef] [Scilit]
  12. Delpla, I.; Legay, C.; Proulx, F.; Rodriguez, M.J. Perception of Tap Water Quality: Assessment of the Factors Modifying the Links between Satisfaction and Water Consumption Behavior. Sci. Total Environ. 2020, 722, 137786. [Google Scholar] [CrossRef] [Scilit] [PubMed]
  13. Naiga, R. Determinants of User Satisfaction and the Implications on Collective Action in Demand-Driven Water Governance in Rural Uganda. Int. J. Rural Manag. 2021, 17, 93–119. [Google Scholar] [CrossRef] [Scilit]
  14. Wang, W.; Zhou, H.; Guo, L. Emergency Water Supply Decision-Making of Transboundary River Basin Considering Government–Public Perceived Satisfaction. J. Intell. Fuzzy Syst. 2021, 40, 381–401. [Google Scholar] [CrossRef] [Scilit]
  15. Djaing, H.; Sangkala, M.R.; Yani, A.A. Public Satisfaction on Water Utility Services in Makassar Urban Community. J. Gov. 2020, 5, 1–19. [Google Scholar] [CrossRef] [Scilit]
  16. Li, T. Water-Based Logic: The Water Heritage of Greater Nanning and Its Role in Urban Authenticity. J. Environ. Sci. Sustain. Dev. 2025, 8, 443–466. [Google Scholar] [CrossRef] [Scilit]
  17. Tian, K.; Goodwin, D.; Gallagher, E.; Smith, H. An Exploration of Customers’ Satisfaction with Water and Wastewater Services in the UK. Water Econ. Policy 2023, 9, 2350001. [Google Scholar] [CrossRef] [Scilit]
  18. Ananga, E.O.; Agong, S.G.; Acheampong, M.; Njoh, A.J.; Hayombe, P. Examining the Effect of Community Participation on Beneficiary Satisfaction with the Work of Water Management Committee in Urban Community-Based Operated Water Schemes. Sustain. Water Resour. Manag. 2020, 6, 49. [Google Scholar] [CrossRef] [Scilit]
  19. Haikal, R.; Firdaus, T.; Nabila, S.H.; Chairunnisa, R.S. How Social, Behavioral, And Policy Factors Impact Water Satisfaction and Management in Urban Areas. J. Environ. Sci. Sustain. Dev. 2025, 8, 421–442. [Google Scholar] [CrossRef] [Scilit]
  20. Yasmita, I.G.A.L.; Rahmantari, N.L.L. Green Finance and Local Wisdom Synergy in Enhancing Community-Based Drinking Water Sustainability. Bioculture 2026, 3, 91–104. [Google Scholar] [CrossRef] [Scilit]
  21. Zhang, A.; Tariq, A.; Quddoos, A.; Naz, I.; Aslam, R.W.; Barboza, E.; Abdullah-Al-Wadud, M. Spatio-Temporal Analysis of Urban Expansion and Land Use Dynamics Using Google Earth Engine and Predictive Models. Sci. Rep. 2025, 15, 6993. [Google Scholar] [CrossRef] [Scilit]
  22. Asteria, D.; Budidarmono; Herdiansyah, H.; Nimah, N.H. Gender sensitive education in watershed management to support environmental friendly city. IOP Conf. Ser. Earth Environ. Sci. 2018, 126, 012146. [Google Scholar] [CrossRef] [Scilit]
  23. Al-Hameedi, W.M.M.; Chen, J.; Faichia, C.; Nath, B.; Al-Shaibah, B.; Al-Aizari, A. Geospatial Analysis of Land Use/Cover Change and Land Surface Temperature for Landscape Risk Pattern Change Evaluation of Baghdad City, Iraq, Using CA–Markov and ANN Models. Sustainability 2022, 14, 8568. [Google Scholar] [CrossRef] [Scilit]
  24. Zubaidi, S.L.; Ortega-Martorell, S.; Kot, P.; Alkhaddar, R.M.; Abdellatif, M.; Gharghan, S.K.; Hashim, K. A Method for Predicting Long-Term Municipal Water Demands under Climate Change. Water Resour. Manag. 2020, 34, 1265–1279. [Google Scholar] [CrossRef] [Scilit]
  25. Miro, M.E.; Groves, D.; Tincher, B.; Syme, J.; Tanverakul, S.; Catt, D. Adaptive Water Management in the Face of Uncertainty: Integrating Machine Learning, Groundwater Modeling and Robust Decision Making. Clim. Risk Manag. 2021, 34, 100383. [Google Scholar] [CrossRef] [Scilit]
  26. Utari, A.W.; Herdiansyah, H. Using filtration as a technology to remove pollutants in domestic wastewater. IOP Conf. Ser. Mater. Sci. Eng. 2020, 725, 012025. [Google Scholar] [CrossRef] [Scilit]
  27. BPS-Statistics Surabaya Municipality. Surabaya Municipality in Figures 2025 (Published by BPS Kota Surabaya). BPS Kota Surabaya. 2024. Available online: https://surabayakota.bps.go.id/en/publication/2025/02/28/bd1f25e59ae790cc8a7c0c07/surabaya-municipality-in-figures-2025.html (accessed on 1 October 2025).
  28. Hou, C.; Wen, Y.; Liu, X.; Dong, M. Impacts of Regional Water Shortage Information Disclosure on Public Acceptance of Recycled Water—Evidences from China’s Urban Residents. J. Clean. Prod. 2021, 278, 123965. [Google Scholar] [CrossRef] [Scilit]
  29. Cauberghe, V.; Vazquez-Casaubon, E.; Van de Sompel, D. Perceptions of water as commodity or uniqueness? The role of water value, scarcity concern and moral obligation on conservation behavior. J. Environ. Manag. 2021, 292, 112677. [Google Scholar] [CrossRef] [Scilit]
  30. Haeffner, M.; Jackson-Smith, D.; Barnett, M.J. Categorizing Relative Water Use Perception Bias Using Household Surveys and Monthly Water Bills. J. Environ. Manag. 2023, 334, 117443. [Google Scholar] [CrossRef] [Scilit] [PubMed]
  31. Emile, R.; Clammer, J.R.; Jayaswal, P.; Sharma, P. Addressing Water Scarcity in Developing Country Contexts: A Socio-Cultural Approach. Humanit. Soc. Sci. Commun. 2022, 9, 144. [Google Scholar] [CrossRef] [Scilit]
  32. Jorgensen, B.; Graymore, M.; O’Toole, K. Household Water Use Behavior: An Integrated Model. J. Environ. Manag. 2009, 91, 227–236. [Google Scholar] [CrossRef] [Scilit]
  33. De Luque-Villa, M.A.; Granda-Rodríguez, H.D.; Garza-Tatis, C.I.; González-Méndez, M. Applying Bourdieu’s Theory to Public Perceptions of Water Scarcity during El Niño: A Case Study of Santa Marta, Colombia. Societies 2024, 14, 201. [Google Scholar] [CrossRef] [Scilit]
  34. Savelli, E.; Mazzoleni, M.; Baldassarre, G.; Cloke, H.; Rusca, M. Urban Water Crises Driven by Elites’ Unsustainable Consumption. Nat. Sustain. 2023, 6, 929–940. [Google Scholar] [CrossRef] [Scilit]
  35. Liu, H.; Sun, S.; Fang, C.; Tang, Q.; Ma, T. Public Perceptions of Water Scarcity in China: Insights from an Online Survey of 3262 Responses. Int. J. Water Resour. Dev. 2025, 2025, 2486848. [Google Scholar] [CrossRef] [Scilit]
  36. Fariz, T.R.; Rizky, T.B.; Holeng, V.A.; Damayanti, M.; Heriyanti, A.P. Mapping household physical vulnerability to tidal floods through indicator-based scoring analysis. Spat. Rev. Sustain. Dev. 2025, 2, 111–128. [Google Scholar] [CrossRef] [Scilit]
  37. Narmilan, A.; Puvanitha, N.; Niroash, G.; Sugirtharan, M.; Vassanthini, R. Domestic Water Consumption Pattern and Awareness of Urban Households. Int. J. Hum. Cap. Urban Manag. 2021, 6, 225–236. [Google Scholar] [CrossRef]
  38. Chang, G. Factors influencing water conservation behavior among urban residents in China’s arid areas. Water Policy 2013, 15, 691–704. [Google Scholar] [CrossRef] [Scilit]
  39. Russell, S.V.; Knoeri, C. Exploring the Psychosocial and Behavioural Determinants of Household Water Conservation and Intention. Int. J. Water Resour. Dev. 2020, 36, 940–955. [Google Scholar] [CrossRef] [Scilit]
  40. Ekklesia, J.M. Social Capital in a Capitalocene Risk Society: An Integrative Analysis to Eco-Society Structure. J. Sustain. Soc. Eco-Welf. 2026, 3, 104–123. [Google Scholar] [CrossRef] [Scilit]
  41. Si, H.; Duan, X.; Zhang, W.; Su, Y.; Wu, G. Are You a Water Saver? Discovering People’s Water-Saving Intention by Extending the Theory of Planned Behavior. J. Environ. Manag. 2022, 311, 114848. [Google Scholar] [CrossRef] [Scilit]
Figure 1. Research area.
Environments 13 00189 g001
Figure 2. Flowchart of the methods used.
Environments 13 00189 g002
Figure 3. Spatial Density Maps: (a) Overall Density Map, (b) High-Behavior Density Map, and (c) Low-Behavior Density Map.
Environments 13 00189 g003
Figure 4. LULC Map of the Study Area.
Environments 13 00189 g004
Figure 5. Urban Heat Island (UHI) Map of the Study Area.
Environments 13 00189 g005
Figure 6. Integrated Spatial Map of Water-Use Behavioral Risk: (a) Risk Map Overlaid with the Low-Behavior Group; (b) Risk Map Overlaid with the High-Behavior Group.
Environments 13 00189 g006
Table 1. Demographic and Socio-Economics Characteristics of Respondents.
VariableCategoryFrequency (N)
GenderMale51
Female153
Total204
Last Education LevelPostgraduate (Master/Ph.D.)6
Undergraduate (Bachelor)61
Diploma5
Senior High School118
Junior High School11
Elementary School3
Total204
Household Monthly IncomeLess than Rp1.000.000
(Less than 60 USD)
52
Rp1.000.000–Rp3.000.000
(60 USD–177 USD)
52
Rp3.000.000–Rp5.000.000
(178 USD–296 USD)
64
Rp5.000.000–Rp10.000.000
(297 USD–592 USD)
33
More than Rp10.000.000
(More than 593 USD)
3
Total204
Table 2. Statistics Results of Main Variables.
VariablesMeanSDMinimumMaxValidity Test Results Value RangeReliability Test
Perception3.920.53350.356–0.8150.935
Government’s role3.770.66250.543–0.8440.972
Public Satisfaction3.670.83250.522–0.8190.933
Table 3. Comparison of Water Management Behavior between Surabaya and Sidoarjo (ANOVA Results).
RegionMeanStd. Deviation
Surabaya3.490.549
Sidoarjo3.950.696
F = 14.530, p-value = 0.000, Sig Homogenity = 0.819.
Table 4. ANN Analysis Summary.
Regionp-Valuez-ScoreSpatial Pattern
Overall ANN Summary0.001−7.161Clustered
High-Score Behavior Group ANN Summary0.001−5.903Clustered
Low-Score Behavior Group ANN Summary0.001−3.283Clustered
Disclaimer/Publisher’s Note: The statements, opinions and data contained in all publications are solely those of the individual author(s) and contributor(s) and not of MDPI and/or the editor(s). MDPI and/or the editor(s) disclaim responsibility for any injury to people or property resulting from any ideas, methods, instructions or products referred to in the content.