


Abstract
This study examined associations of depressive symptoms and physical fitness with academic achievement in students at a Chinese health vocational school. Routine records linked earlier and December examinations with physical-fitness and depressive-symptom assessments collected during the intervening autumn term. Of 1415 linked students, 1261 from 35 classes had complete fitness data (88.7% female). Models adjusted for earlier Chinese, mathematics and English scores, body mass index, demographic characteristics and the other health indicators, with class-clustered inference. Higher depressive-symptom scores were associated with lower December relative achievement (standardized β = −0.065, 95% CI −0.106 to −0.024), whereas endurance performance (β = 0.080, 95% CI 0.022 to 0.139) and standing long jump (β = 0.063, 95% CI 0.018 to 0.107) were positively associated in complete cases. All three Benjamini–Hochberg-adjusted p values were 0.014. Together, the five health indicators increased in-sample R2 by 1.54 percentage points. After imputation of missing fitness data for all 1415 students, the symptom and endurance associations persisted, whereas the long-jump estimate attenuated (β = 0.037, 95% CI −0.010 to 0.085). Routine health indicators were associated with small differences in relative academic achievement beyond measured earlier performance, with the stability of these associations varying across indicators.
1. Introduction
Adolescent mental and physical health have been examined in relation to educational achievement. Yet associations between health indicators and school performance may partly reflect academic differences that preceded the health assessment. Meta-analyses have linked depressive symptoms with poorer educational attainment, while research on attendance and disengagement points to broader educational correlates of psychological difficulties (Riglin et al., 2014; Wickersham et al., 2021; Esch et al., 2014; Finning et al., 2019). Earlier examination records offer a useful context for evaluating the additional information associated with students’ current health.
Depressive symptoms may accompany difficulties in concentration, motivation and school engagement relevant to academic work. Conversely, academic difficulties can contribute to psychological distress. Longitudinal evidence suggests that the direction and strength of the association vary across developmental stages and by sex (López-López et al., 2021; Verboom et al., 2014), while research in Chinese adolescents highlights the roles of peer and educational contexts (Bi et al., 2023). These findings provide a rationale for examining depressive symptoms in relation to academic achievement while accounting for earlier performance.
Physical activity has also been studied in relation to mental health in children and adolescents (Biddle et al., 2019). Physical fitness is distinct from habitual physical activity and encompasses attributes expressed through performance on physical tasks (Caspersen et al., 1985). Reviews suggest relatively consistent positive associations between cardiorespiratory fitness and academic achievement, whereas findings for other fitness components are less uniform (Álvarez-Bueno et al., 2020; Santana et al., 2017). Longitudinal evidence linking aerobic fitness with school marks offers a specific rationale for examining endurance performance (Sardinha et al., 2016). Sprinting, jumping and muscular tests impose different physical demands, however, and examining them separately may reveal associations obscured by an aggregate fitness measure.
Proposed links between physical fitness and academic functioning include attention, executive control and psychological well-being (Donnelly et al., 2016; Lubans et al., 2016). Research on physical-activity interventions has also examined cognitive and academic outcomes (Singh et al., 2019). At the same time, school field tests reflect not only physical capacity but also technique, effort and persistence. Motivation and self-regulation may therefore contribute to both test performance and academic work. These shared influences are particularly relevant when interpreting associations with specific fitness tasks.
Psychological symptoms and physical fitness may themselves be related. Prior studies have examined cardiorespiratory fitness in relation to depressive symptoms and have considered physical fitness, mental health and achievement jointly (Alves Donato et al., 2021; Chiang et al., 2024; Xiang et al., 2017). The DADOS study and research among European schoolchildren have also examined mental health in models connecting fitness with academic outcomes (Monzonís-Carda et al., 2023; Muntaner-Mas et al., 2025). Less is known about their mutually adjusted associations with academic achievement after accounting for earlier subject-level performance.
Secondary vocational education provides a distinctive context for this question. Students pursue general academic subjects alongside occupation-oriented coursework and practical training. Research has addressed physical activity and well-being among vocational students (Kirschner et al., 2022), while a Chinese longitudinal study documented differences in mental-health patterns during transitions into academic and vocational secondary schools (Lu et al., 2025). This setting allows psychological symptoms and school-measured fitness to be examined alongside achievement in core academic subjects, although examination scores do not capture vocational competence.
The present study investigated the associations of depressive symptoms and distinct components of physical fitness with academic achievement among students at a Chinese health vocational school, taking their earlier examination performance into account. By considering psychological symptoms and physical performance together, we sought to clarify the extent to which routinely collected health information contributes to understanding academic achievement in this educational setting.
2. Methods
2.1. Study Design and Participants
We conducted an observational analysis of routinely collected school examination and physical-fitness records linked to a depressive-symptom questionnaire at Wuxi Higher Health Vocational Technology School, China. The sample comprised students from the 2021 and 2022 entry cohorts. At the June 2023 examination, these cohorts were completing Years 2 and 1, respectively; during the subsequent autumn term they were in Years 3 and 2. Both academic assessments were undertaken after entry into the same institution.
The school provided examination records from June and December 2023, routine physical-fitness and anthropometric measurements from October, and CES-D questionnaires administered in November. The December examinations assessed subjects taught during the autumn term; accordingly, the analyses concern students’ relative academic performance rather than changes in achievement attributable to health measures.
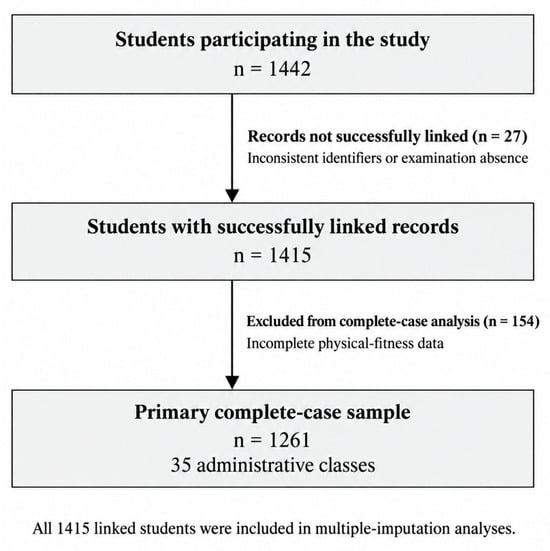
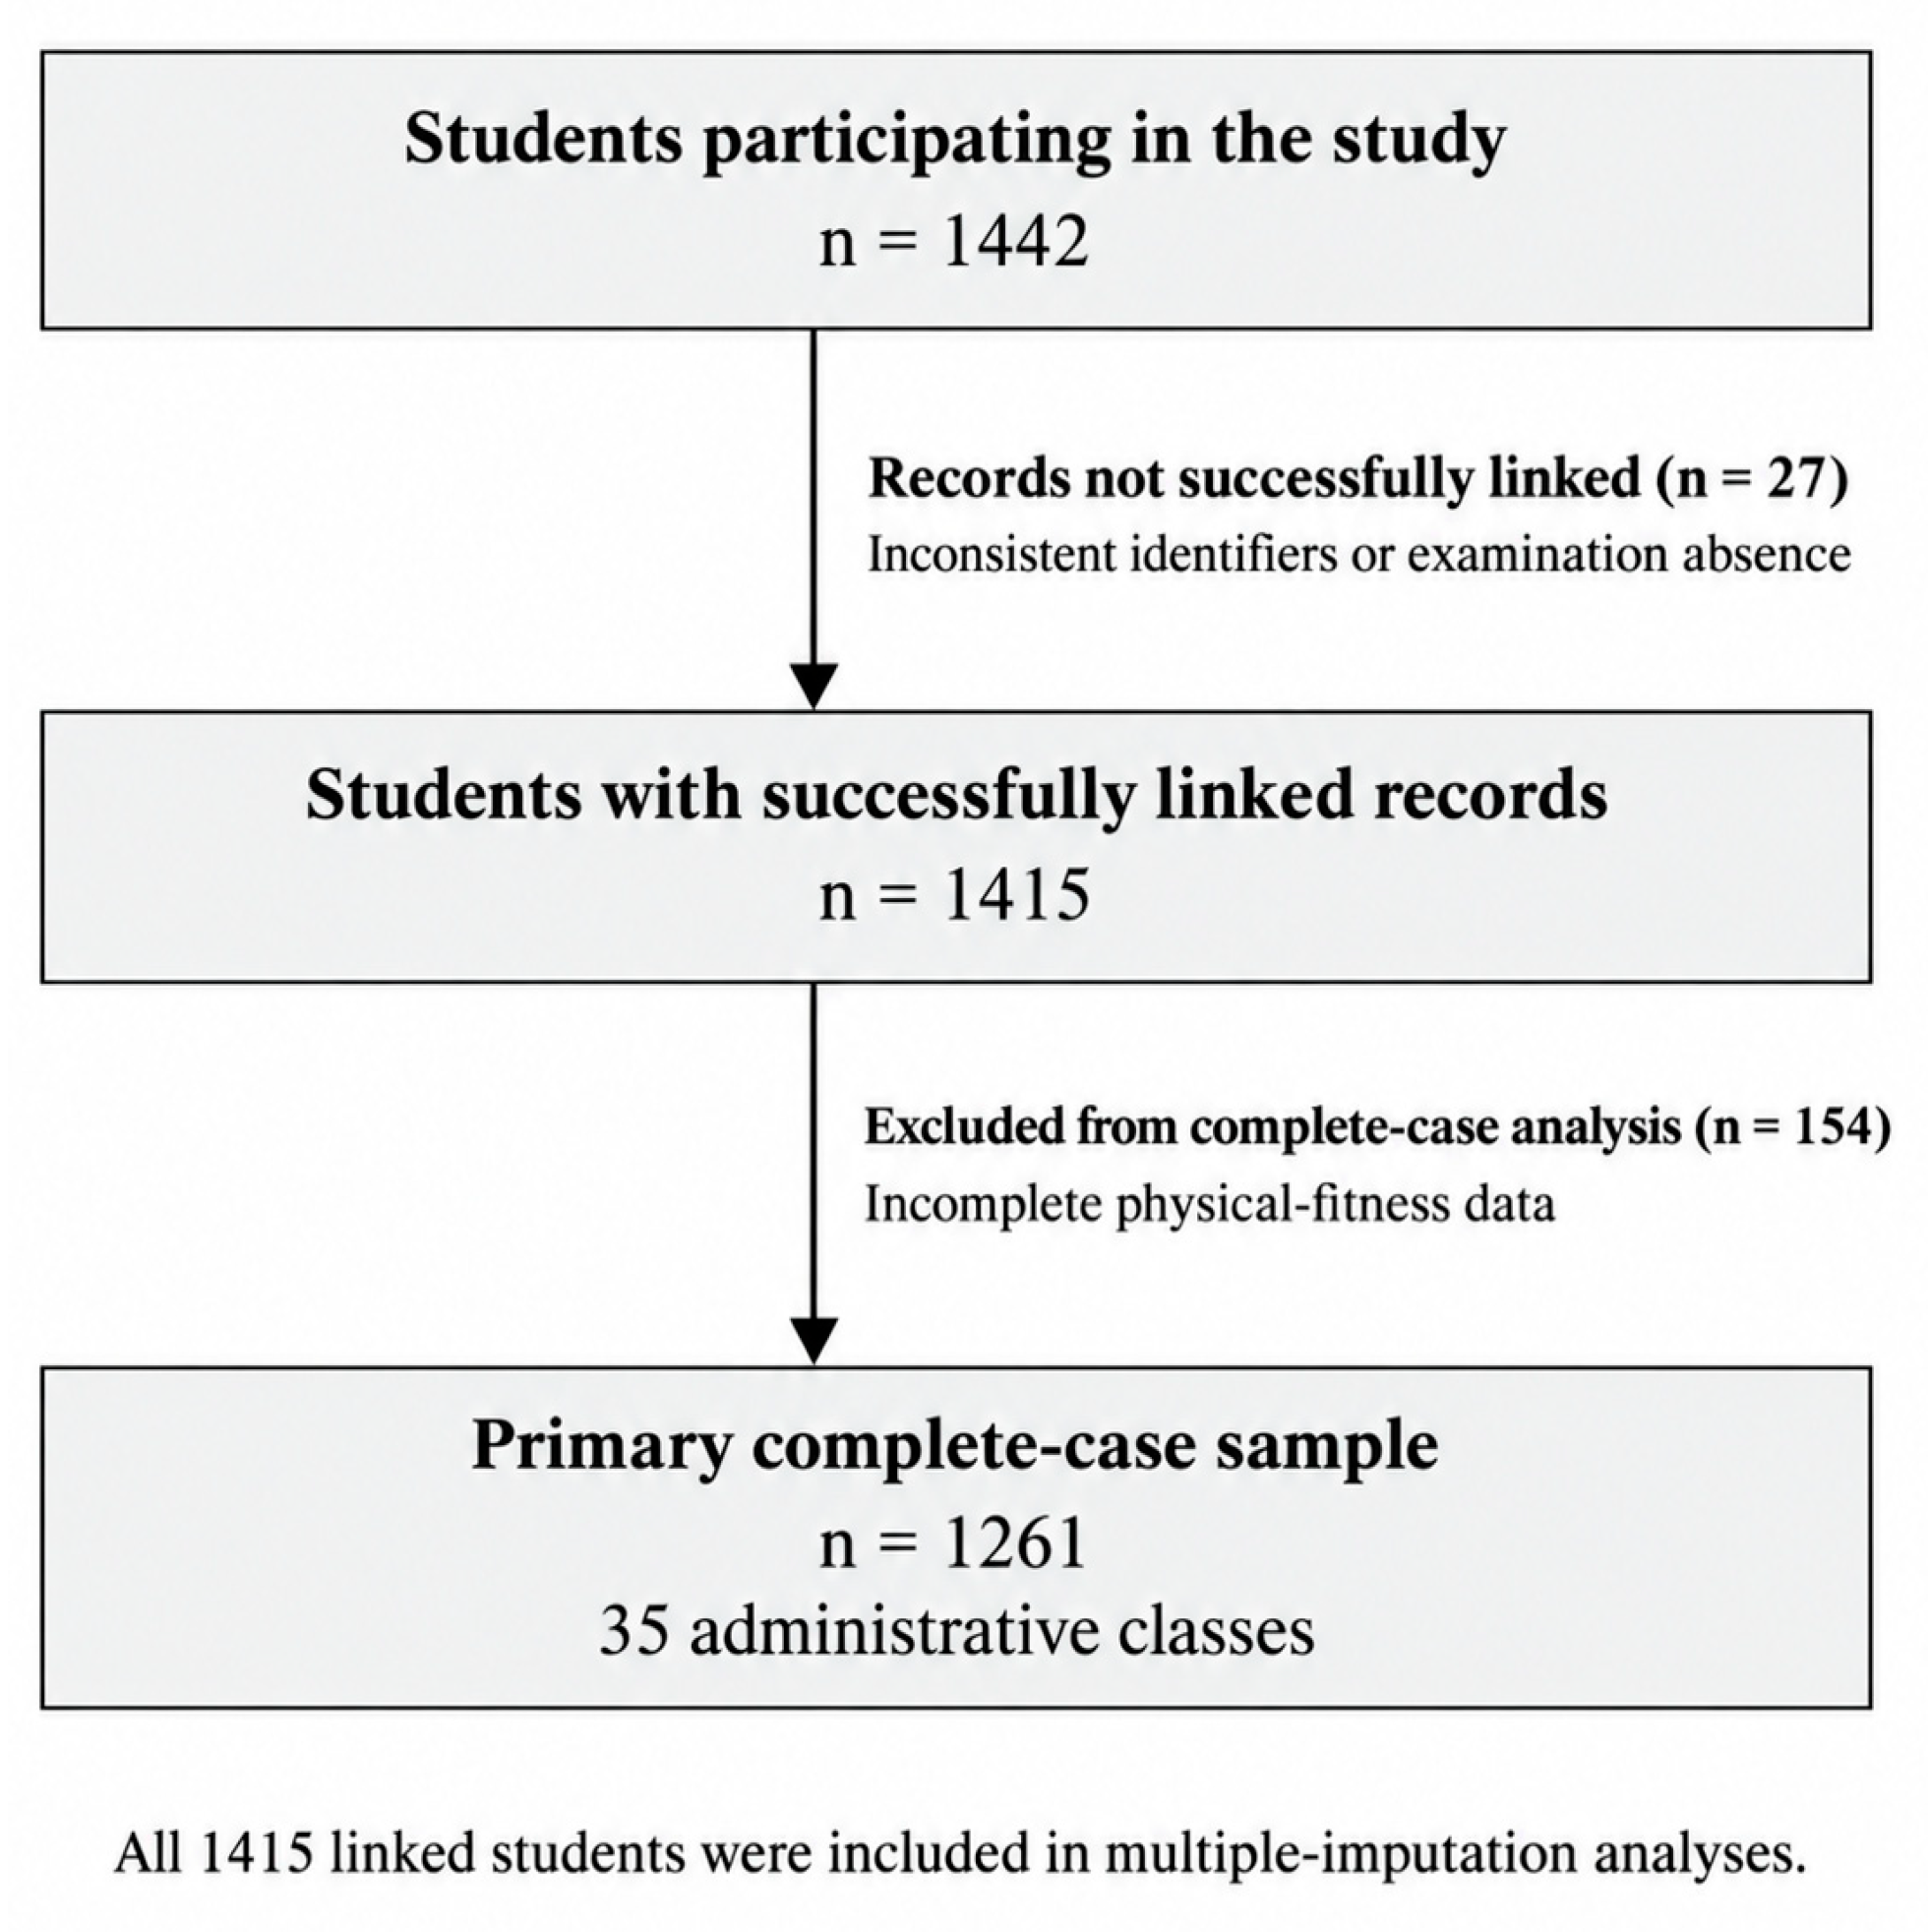
Of 1442 participating students, 1415 (98.1%) had records successfully linked across sources. Records for 27 students could not be matched because of inconsistent identifiers or missing examination scores resulting from examination absence. A further 154 linked students lacked at least one physical-fitness result, leaving 1261 complete cases from 35 administrative classes for the primary analysis. The sample comprised all available matched records; analyses followed STROBE reporting guidance (von Elm et al., 2007).
The study was approved by the Institutional Ethics Committee of Wuxi Higher Health Vocational Technology School on 8 November 2022 (approval 2022003). Written consent was obtained from all participating students and their parents or guardians, including for students aged 18 years or older. For participants younger than 18 years, the students’ written agreement served as assent alongside their guardians’ written consent. The consent covered authorized linkage of questionnaire responses and routine school records. Personal identifiers were used to match records across sources; analyses were conducted using study identifiers.
2.2. Academic Achievement
Examinations were organized by the school and its grade-level teaching teams. Within each grade, students across classes and majors completed the same papers in Chinese, mathematics, and English, each scored on a 100-point scale. Subject teachers applied common marking criteria within each examination. Teachers responsible for marking did not have access to the linked CES-D or fitness records, which were maintained separately from academic records.
The arithmetic mean of the three subject scores represented achievement in general academic subjects at each examination occasion. Equal nominal weighting followed the common 100-point score range. To assess the influence of differences in subject-score variability, sensitivity analyses used a composite formed from standardized individual subjects and fitted separate models for Chinese, mathematics, and English outcomes.
Because grades and examination occasions involved different papers, scores were converted to Z scores within each entry cohort and examination occasion. December composite scores expressed students’ relative academic standing within the corresponding cohort; June subject scores were standardized separately within cohort and entered individually as prior-achievement covariates. This approach permits analysis of relative achievement across cohorts without equating the difficulty or content of different examination papers (Moses, 2026).
2.3. Depressive Symptoms
Depressive symptoms were measured using the Chinese version of the 20-item Center for Epidemiologic Studies Depression Scale (CES-D; Chen et al., 2009; Radloff, 1977). Items assessed symptom frequency during the preceding week on a four-point scale (0–3); positively worded items 4, 8, 12, and 16 were reverse-coded. Scores ranged from 0 to 60, with higher values indicating greater symptom burden. Previous research supports the use of the CES-D among Chinese adolescents (Yang et al., 2018). Cronbach’s α was 0.926 in the analytic sample.
The questionnaire was completed on paper during a school-administered assessment. Class teachers were present to distribute and collect questionnaires but did not assist students with item responses. Students supplied identifying information for authorized linkage with school records; questionnaire responses were handled confidentially. The CES-D total was analysed continuously, with scores ≥16 and ≥20 additionally summarized descriptively rather than used to define clinical depression.
2.4. Physical Fitness
Physical-fitness assessments were part of the school’s routine implementation of the National Student Physical Fitness Standard (2014 revision; Ministry of Education of the People’s Republic of China, 2014). Experienced physical education teachers from the school’s physical education department conducted the tests and recorded the results according to established school testing procedures. The study used these existing school measurements rather than conducting additional fitness testing.
The four physical-performance measures were the 800-m run for females or 1000-m run for males (endurance), 50-m sprint, standing long jump, and sex-specific muscular test (one-minute sit-ups for females or pull-ups for males). Running times were recorded in seconds, jump distances in centimetres, and muscular performance in repetitions. Where multiple attempts were recorded, the best performance was retained. BMI was considered separately as an anthropometric covariate; vital capacity and flexibility were not included in the linked dataset.
2.5. Covariates and Score Standardization
Fitness measures were standardized within sex-by-entry-cohort groups to express relative performance on each applicable test; running times were reversed so that higher scores indicated better performance. The sex-specific muscular score therefore represented relative performance on sit-ups or pull-ups, not a common absolute-strength measure. CES-D scores were standardized across all linked students. BMI (kg/m2) was calculated from height and weight recorded during the routine school fitness assessment and entered as a covariate (VanderWeele, 2019).
Other covariates were age, sex, entry cohort and major (nursing, pharmacy, rehabilitation, midwifery or other). Standardization parameters were calculated from available linked records before complete-case restriction and held constant for subgroup and imputation analyses unless the scaling method was explicitly varied. Age and BMI were centred and retained their original units; female sex, the 2022 entry cohort and midwifery were the reference categories.
2.6. Statistical Analysis
Analyses were performed using R version 4.4.1 (R Foundation for Statistical Computing, Vienna, Austria), with the readxl (version 1.4.5), clubSandwich (version 0.6.2), and mice (version 3.19.0) packages. Regression estimates, cluster-robust inference, sensitivity analyses, and multiple imputation were generated using the accompanying R scripts; software versions, variable definitions, and random seeds were recorded.
Continuous variables were summarized as means and standard deviations, supplemented by medians, interquartile ranges or observed limits when relevant; categorical variables were summarized as counts and percentages. Record identifiers, CES-D scoring and examination composites were checked during linkage and preparation. Included and excluded students were compared using standardized mean differences and available fitness measurements. Pearson correlations described associations among health indicators and academic outcomes; observed examination ceilings and muscular-test zeros were examined. Sample standard deviations (denominator n − 1) were used for standardization.
Ordinary least-squares regression related cohort-standardized December academic achievement to CES-D and four fitness indicators, with adjustment for the three June subject scores, BMI, age, sex, entry cohort, and major. The five health measures were entered simultaneously to estimate their conditional associations in a common model (Rohrer, 2018).
Dependence within the 35 administrative classes was addressed with CR2 cluster-robust covariance estimates and coefficient-specific Satterthwaite degrees of freedom (Cameron & Miller, 2015; Pustejovsky & Tipton, 2018). Joint inference for the four fitness coefficients used the approximate Hotelling (HTZ) test. Two-sided 95% confidence intervals and nominal p values were reported; Benjamini–Hochberg correction was applied to the five primary health coefficients as one family (Benjamini & Hochberg, 1995). Direct fitness-coefficient contrasts constituted a separate exploratory family. Robustness was assessed using a restricted wild cluster bootstrap (4999 Rademacher draws at the class level; seed 20261107), class-deletion estimates and class fixed-effects models with CR2 inference. Variance inflation factors and descriptive class intraclass correlations from one-way ANOVA estimators of the outcome and primary-model residuals were also examined.
Incremental explained variance was assessed by comparing R2 and adjusted R2 for models with and without the five health indicators, using the same 1261 complete cases. Additional deletion analyses quantified the contribution of CES-D, the fitness block, and each individual test to in-sample model fit (Shmueli, 2010).
Missing fitness data were addressed by multiple imputation with 50 sex-specific chained predictive-mean-matching datasets (20 iterations; five donors; seed 20261107). Imputation models included June and December subject scores, CES-D, BMI, age, major, class indicators and available fitness results. Donors were restricted to the same sex, and observed measurements were retained. Imputed datasets were analysed using the primary model; coefficient estimates and CR1S class-clustered covariance matrices were combined with Rubin’s rules and Barnard–Rubin degrees of freedom (complete-data df = 34; Barnard & Rubin, 1999; Sterne et al., 2009; van Buuren & Groothuis-Oudshoorn, 2011). The imputation analysis assumes missing at random conditional on the observed predictors. Pattern-mixture sensitivity scenarios assigned missing fitness values 0.5 or 1 standard deviation poorer performance than imputed values. The pooled-imputation inference used CR1S, whereas complete-case inference used CR2.
Additional analyses varied the prior-attainment specification (a three-subject mean or restricted cubic splines with knots at the 10th, 50th and 90th percentiles), BMI and age adjustment, class effects, academic-score construction and fitness scaling. Single-indicator and CES-D-plus-one-fitness models were compared with mutual adjustment, and an equal-weight standardized fitness composite was examined as a descriptive summary rather than a validated latent construct. Exploratory analyses addressed sex and cohort heterogeneity, individual December subjects, contrasts among fitness coefficients and nonlinearity of the CES-D association. These additional comparisons were exploratory or sensitivity analyses and were not preregistered.
3. Results
3.1. Participant Characteristics
The analytic sample comprised 1261 students across 35 classes: 625 from the 2022 entry cohort and 636 from the 2021 cohort. There were 1119 female students (88.7%), and nursing was the largest major (46.7%). Mean age was 16.85 years (SD 0.57; range 15.16–18.03), mean BMI was 21.86 kg/m2 (SD 3.70), and mean CES-D score was 19.69 (SD 12.13). CES-D scores ≥16 and ≥20 were observed in 725 students (57.5%) and 585 students (46.4%), respectively (Table 1; Figure 1).
Table 1.
Characteristics of the complete-case sample.
Figure 1.
Participant linkage and analytic sample selection.
The 27 unmatched students had inconsistent identifiers or examination records missing because of absence. The subsequent 154 complete-case exclusions were attributable to incomplete physical-fitness records.
Mean unstandardized academic composites were 67.38 (SD 12.98) in June and 73.38 (SD 11.57) in December. No examination score of zero was observed, and at most 11 students in any cohort-by-subject examination cell attained 100. Table 2 reports raw fitness performance by sex; four male students recorded zero pull-ups, which were included in the analyses. Additional distributional summaries are provided in Supplementary Table S3.
Table 2.
Raw physical-fitness performance by sex.
Among 1415 linked students, 154 (10.9%) had missing fitness results: 150 lacked one test and four lacked two. Missing values occurred in endurance (n = 49; 40 female), sprint (n = 31; 29 female), long jump (n = 28; 27 female) and muscular performance (n = 50; 46 female). Complete-case exclusion occurred in 138/1257 females (11.0%) and 16/158 males (10.1%); class-specific exclusion proportions ranged from 2.4% to 26.8%. Standardized mean differences between included and excluded students were small for CES-D (0.024), June achievement (0.004) and December achievement (0.040). Supplementary Tables S1 and S4 show additional observed characteristics and class-specific missingness.
3.2. Conditional Health Associations
CES-D scores correlated negatively with the June and December academic composites (r = −0.140 and −0.157, respectively). Fitness indicators showed small positive correlations with June achievement (r = 0.080–0.138) and December achievement (r = 0.072–0.168) and were moderately intercorrelated (r = 0.348–0.527; Supplementary Table S5).
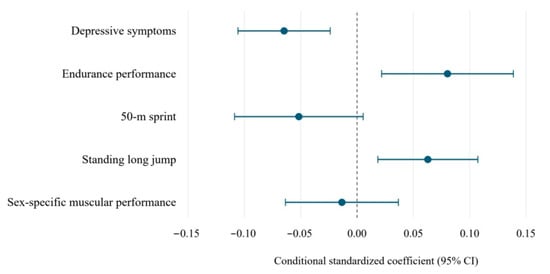
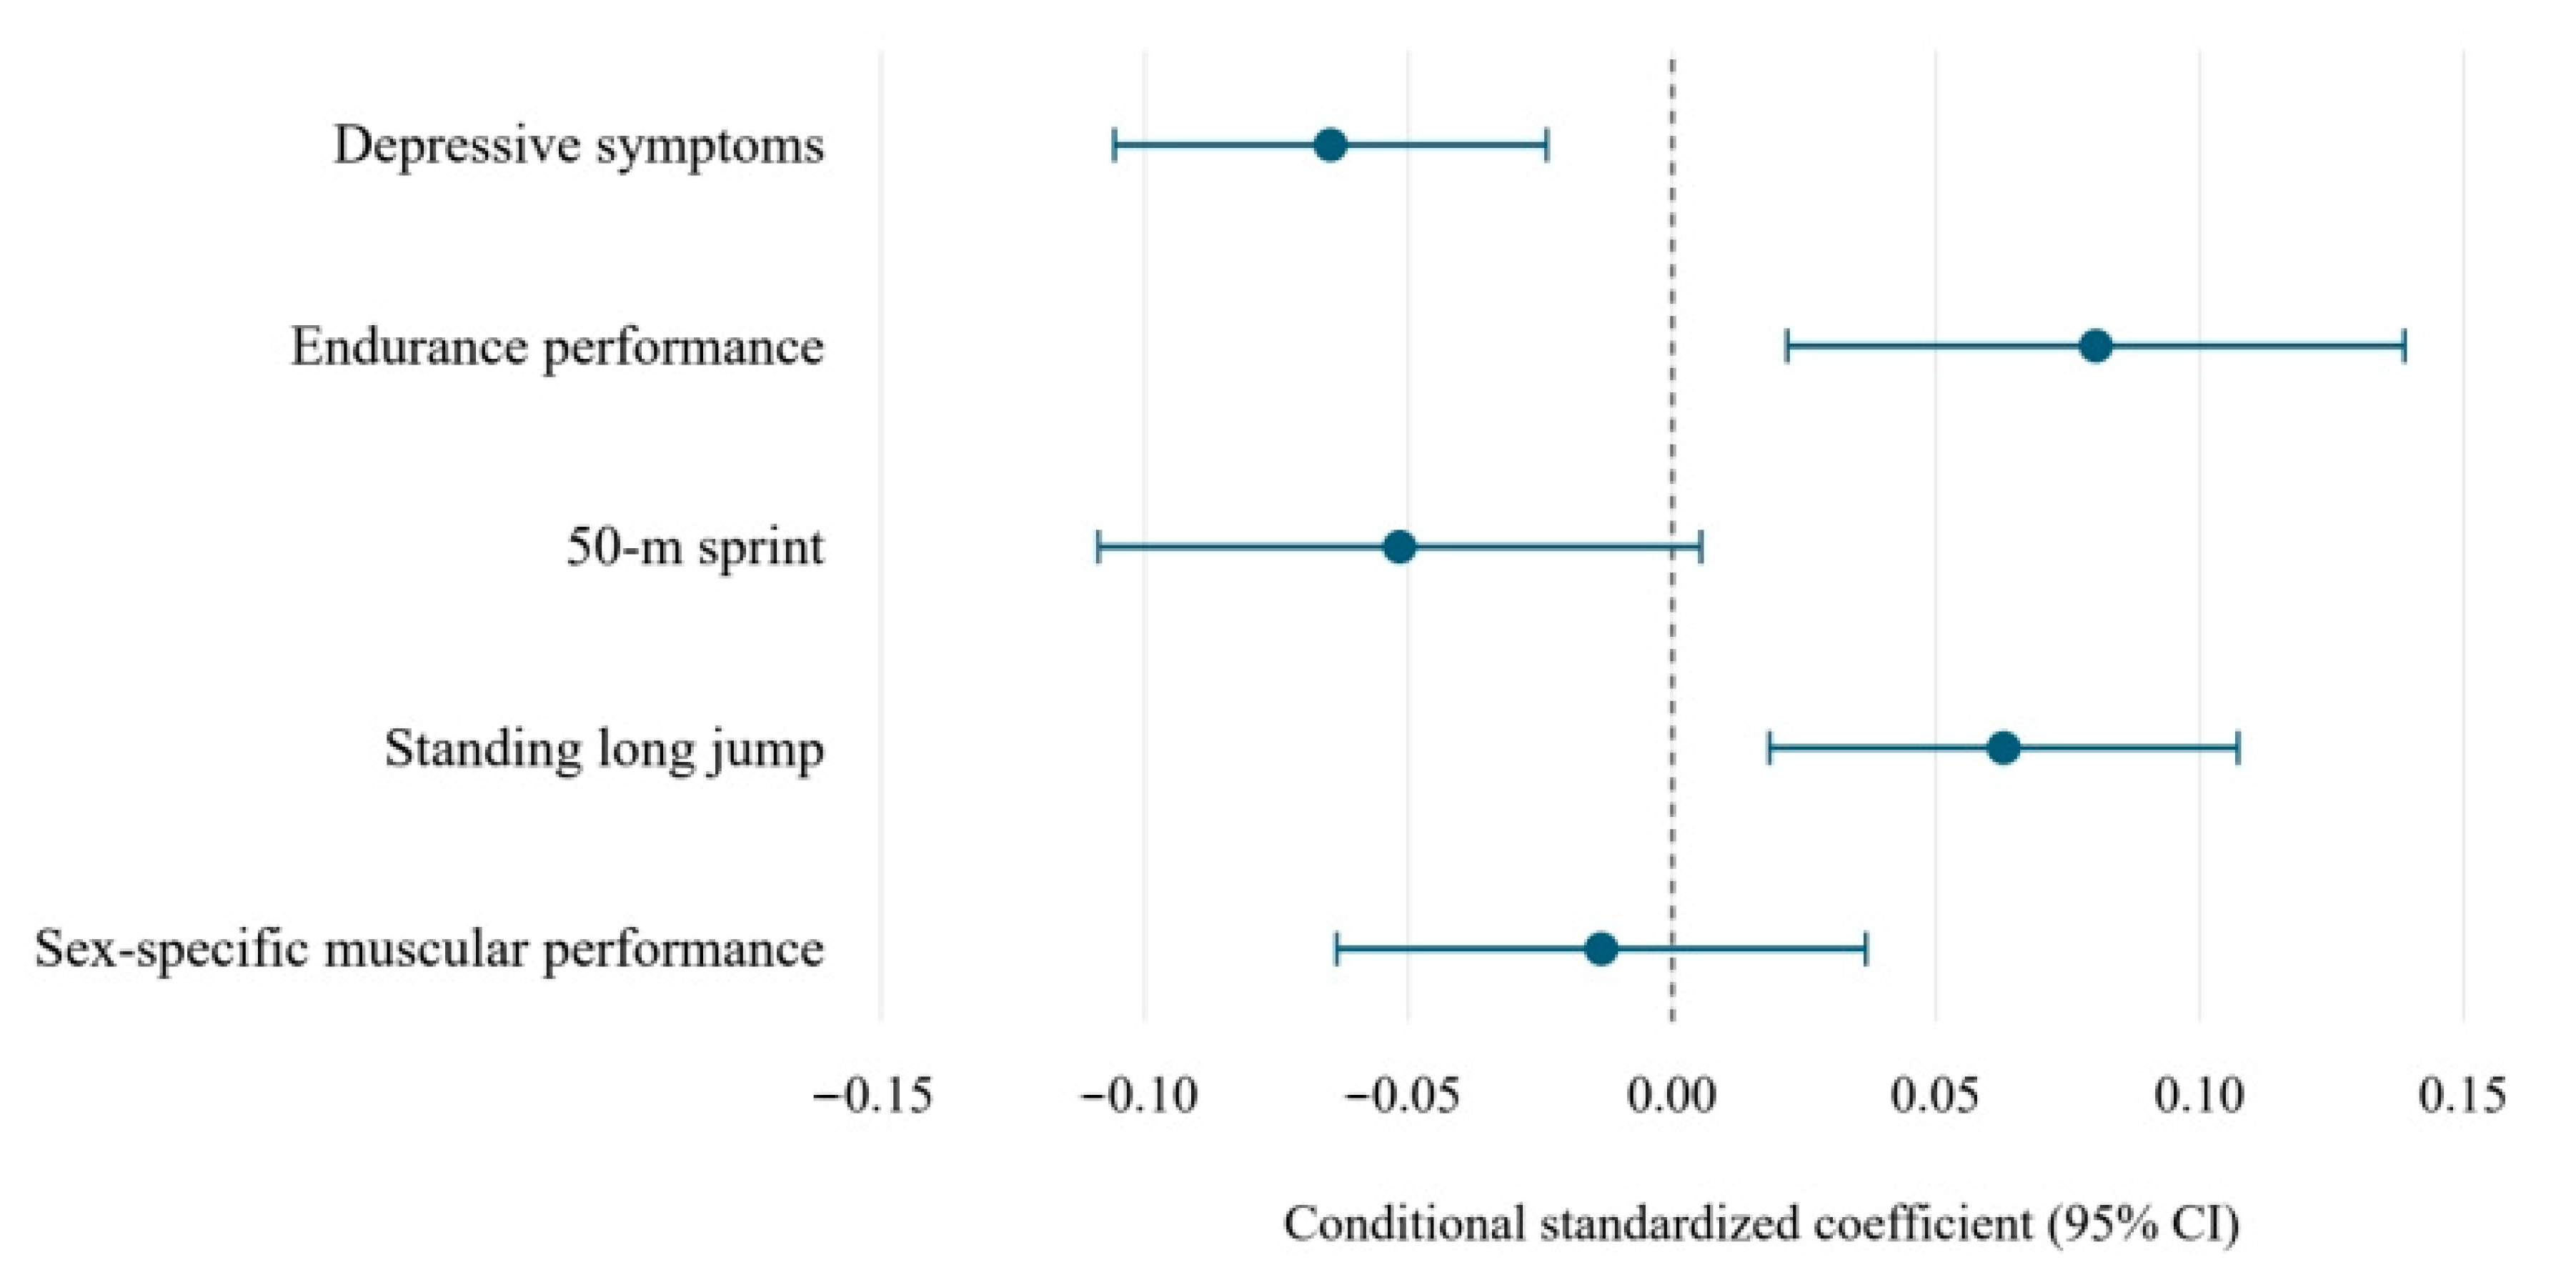
In the mutually adjusted model, CES-D scores were negatively associated with December relative achievement (β = −0.065, 95% CI −0.106 to −0.024). Endurance (β = 0.080, 95% CI 0.022 to 0.139) and standing long jump (β = 0.063, 95% CI 0.018 to 0.107) showed positive associations; all three Benjamini–Hochberg-adjusted p values were 0.014. Sprint (β = −0.052, 95% CI −0.109 to 0.005) and muscular performance (β = −0.013, 95% CI −0.064 to 0.037) were not clearly associated with achievement. The fitness coefficients were jointly associated with achievement, F(4, 29.45) = 5.62, p = 0.002 (Table 3; Figure 2).
Table 3.
Primary model for December relative academic achievement.
Figure 2.
Primary conditional associations of the five health indicators.
Points and bars show conditional regression coefficients with nominal 95% confidence intervals from Table 3. Higher fitness scores indicate better performance; the dashed line denotes zero.
The estimated associations were small on the original examination scale. A one-standard-deviation difference in CES-D corresponded to approximately 0.74–0.76 points on the December composite, compared with 0.92–0.94 points for endurance performance. An interquartile difference in CES-D scores (10–28 points) corresponded to approximately 1.10–1.12 examination points, based on cohort-specific December standard deviations.
3.3. Incremental Explanatory Value
The model including prior subject scores, BMI, and demographic covariates accounted for 34.08% of the variation in December relative achievement (R2 = 0.3408; adjusted R2 = 0.3350). Adding the five health indicators increased R2 to 0.3563 (adjusted R2 = 0.3480), an increment of 1.54 percentage points (adjusted-R2 increment = 0.0130). The conditional R2 increments were 0.0039 for CES-D and 0.0094 for the fitness block; individual test contributions appear in Table 4.
Table 4.
Model fit and incremental explained variance.
3.4. Sensitivity Analyses
Estimates were similar across alternative representations of prior achievement. The respective CES-D, endurance, and standing-long-jump coefficients were −0.065, 0.080, and 0.063 in the primary model; −0.064, 0.083, and 0.062 using the June composite; and −0.065, 0.079, and 0.064 using flexible prior-subject terms. Omitting earlier academic scores yielded estimates of −0.131, 0.133, and 0.066. Estimates changed little when BMI was omitted (−0.065, 0.082, and 0.063) or academic-score scaling was varied.
In female-only analyses, CES-D, endurance, and long-jump estimates were −0.071, 0.087, and 0.063, respectively; class fixed-effects models gave −0.059, 0.075, and 0.066. Wild-cluster-bootstrap p values for these indicators were 0.0022, 0.0082, and 0.0100. Leave-one-class-out estimates were similarly stable, with ranges of −0.071 to −0.058, 0.071 to 0.090, and 0.055 to 0.071. Fitness VIFs were ≤1.72, the overall maximum VIF was 4.75 for June Chinese, and the age–cohort correlation was 0.020. ANOVA-based class ICCs were 0.0047 for the outcome and approximately zero for adjusted model residuals.
Associations differed across single-indicator and mutually adjusted models (Table 5). The sprint correlation with achievement was positive (r = 0.072), but its adjusted single-indicator coefficient was 0.016 and its mutually adjusted coefficient was −0.052. The equal-weight fitness composite was positively associated with achievement (β = 0.061, 95% CI 0.009 to 0.113). Exploratory differences between fitness coefficients were 0.132 (95% CI 0.037 to 0.227) for endurance versus sprint and 0.017 (95% CI −0.067 to 0.102) for endurance versus standing long jump.
Table 5.
Health–achievement associations across model specifications.
The unadjusted column contains Pearson correlations with December achievement. Single-indicator models include three June scores, BMI and demographic covariates; the paired models additionally include CES-D with one fitness test. The full model includes all five health indicators simultaneously. n = 1261 in every model.
3.5. Missing Fitness Analyses
In the 50-imputation analysis of all 1415 linked students, CES-D (β = −0.069, 95% CI −0.109 to −0.029) and endurance (β = 0.091, 95% CI 0.038 to 0.144) retained associations with achievement. The standing-long-jump estimate was attenuated (β = 0.037, 95% CI −0.010 to 0.085; Table 6). Sensitivity scenarios assigning poorer fitness to missing observations produced a similar overall pattern.
Table 6.
Complete-case and missing-fitness sensitivity estimates.
Entries are β (95% CI). Complete-case intervals use CR2/Satterthwaite inference. Multiple-imputation intervals pool 50 sex-specific predictive-mean-matching datasets using CR1S class covariance and Barnard–Rubin degrees of freedom. The poorer-fitness scenario modifies imputed values only and represents a sensitivity assumption.
In CES-D models without fitness covariates, the coefficient was −0.082 (95% CI −0.121 to −0.043) for all 1415 linked students and −0.079 (95% CI −0.120 to −0.038) in complete cases. Including all four fitness indicators in the complete-case model gave a CES-D coefficient of −0.065.
3.6. Exploratory Analyses
In subject-specific models, CES-D coefficients were negative and endurance coefficients positive for Chinese, mathematics, and English outcomes (Supplementary Table S2). Joint interaction tests did not indicate clear variation in the five health associations by sex, F(5, 21.65) = 0.46, p = 0.799, or entry cohort, F(5, 27.69) = 0.89, p = 0.502. The sprint coefficients were −0.090 (95% CI −0.153 to −0.027) in the 2022 cohort and −0.005 (95% CI −0.108 to 0.098) in the 2021 cohort. The nonlinear CES-D term did not improve fit (p = 0.800).
4. Discussion
After adjustment for earlier subject-specific achievement, BMI and demographic characteristics, higher depressive-symptom scores were associated with lower relative academic achievement and better endurance performance with higher achievement. Both associations were small and remained similar across the principal sensitivity analyses. Standing long jump was positively associated with achievement in complete cases, but its estimate weakened after the imputation of missing fitness values. The five health measures added 1.54 percentage points to the variance explained by prior academic records and covariates. Overall, the findings indicate a modest contribution of routinely collected health indicators, with differing degrees of support across fitness components.
4.1. Depressive Symptoms in Relation to Achievement
The inverse CES-D association accords with previous evidence linking depressive symptoms to poorer educational outcomes. Wickersham et al. (2021) reported a pooled Fisher z of −0.19 (95% CI −0.22 to −0.16); our unadjusted correlation was −0.157, and the coefficient decreased in magnitude to −0.065 after adjustment. The differing study designs and statistical scales preclude a direct effect-size comparison, but the attenuation after including earlier subject scores emphasizes the relevance of academic history when interpreting symptom–achievement associations.
Concentration, motivation, attendance, and engagement offer plausible educational contexts for this relationship (Finning et al., 2019; Bi et al., 2023). Academic setbacks may also coincide with greater distress, making the association potentially reciprocal. In this setting, a symptom assessment collected during the academic term may capture both ongoing psychological difficulties and students’ responses to school experiences. These processes remain intertwined in the available observational records.
More than half of the analytic sample had CES-D scores of at least 16. This screening threshold does not identify clinical depression, but the distribution makes psychological well-being a relevant concern in this school population. An exploratory spline model provided no clear evidence that the symptom–achievement association departed from linearity.
4.2. Physical Fitness and Component-Specific Associations
Endurance was the most consistent fitness-related correlate of academic achievement. A meta-analysis reported pooled aerobic-fitness associations of 0.23 with language or reading, 0.27 with mathematics and 0.28 with composite academic outcomes (Álvarez-Bueno et al., 2020). Our adjusted coefficient (β = 0.080) represents a different contrast because earlier subject scores, other health measures and measured covariates were included. In a two-year Finnish study, changes in aerobic fitness were associated with changes in grades (B = 0.27, 99% CI 0.06–0.48), whereas aerobic fitness did not independently predict later grades in cross-lagged models (Syväoja et al., 2019). These differences in design and estimand are relevant when interpreting findings from routine school fitness testing.
Sustained running performance may reflect aerobic capacity alongside pacing, training, effort, and persistence. Some of these behavioral characteristics, particularly motivation and self-regulation, may also be relevant to academic engagement. The endurance association could therefore arise from a combination of physical and psychosocial factors rather than one isolated physiological pathway (Donnelly et al., 2016; Lubans et al., 2016).
Standing long jump was positively associated with achievement among complete cases, but the coefficient decreased after missing fitness values were imputed and its confidence interval included zero. This sensitivity warrants a more tentative interpretation of the jumping association than of the endurance finding.
The sprint coefficient also depended on model specification: a small positive bivariate correlation shifted toward zero after adjusting for academic history and measured covariates, then became negative with simultaneous adjustment for the other fitness indicators. Such sign changes may arise from shared variance and suppression among correlated performance measures. The formal component contrasts and the composite-fitness analysis indicate overlapping as well as potentially distinct information, without establishing a causal hierarchy among the tests.
The measures also differ in their physical demands. Endurance runs, sprinting, jumping, sit-ups, and pull-ups do not constitute physiologically interchangeable assessments, particularly for the sex-specific muscular indicator. Their standardized scores are useful for comparing relative performance, but component coefficients should be read as associations with the recorded tasks. The comparatively small male sample further limits sex-specific interpretation.
Across these analyses, endurance showed the most consistent association with academic achievement, whereas estimates for the other fitness components were less stable or more dependent on model specification.
4.3. Relevance to Vocational School Health
The five health indicators contributed 1.54 percentage points to in-sample explained variance beyond earlier subject scores and measured covariates. The corresponding differences were small on the original examination scale; for example, an interquartile difference in CES-D scores was associated with approximately 1.1 points on the three-subject composite. School-health measures thus provided modest additional information alongside students’ academic histories.
In vocational schools, routine health assessments may complement academic records when considering students’ well-being and support needs. Studies of physical-activity interventions have reported reductions in depressive symptoms among children and adolescents (Recchia et al., 2023). The observed associations do not establish that changes in fitness or depressive symptoms would improve examination results; supporting student health remains important independently of grades.
Further studies across schools could extend this evidence through repeated health measures, attendance and engagement records, and comparable academic outcomes. Such research would help distinguish persistent between-student differences from changes occurring within students and clarify the processes linking school health and educational performance.
4.4. Strengths and Limitations
The study combined routinely assessed physical performance and BMI with symptom questionnaires and independently administered examination records. Adjustment for earlier subject scores, class-sensitive inference and sensitivity analyses allowed us to examine how the main estimates varied across model specifications and approaches to missing fitness data.
Several design features constrain interpretation. Fitness and symptom assessments were obtained during the autumn term assessed by the December examinations, leaving the direction of the observed associations uncertain. The June and December papers differed and lacked item-level reliability information; cohort-specific standardization expressed relative standing rather than directly comparable learning gains. More generally, analyses of change scores do not by themselves identify causal effects in observational studies (Tennant et al., 2022). Socioeconomic circumstances, sleep, attendance, physical activity, earlier mental health and effort-related traits were not measured. Residual confounding is therefore possible even after adjustment for earlier scores and BMI (Glymour et al., 2005; Westfall & Yarkoni, 2016).
Fitness scores represented performance in routine field tests rather than direct physiological assessments. CES-D was recorded on one occasion and referenced the preceding week. Although multiple imputation and sensitivity scenarios addressed missing fitness observations, neither approach determines the actual reasons for missing tests. The small male subgroup and concentration in one health vocational school also restrict generalizability.
The academic outcome consisted of Chinese, mathematics, and English examinations, which capture general-subject achievement but not vocational practice. The findings are consequently most directly relevant to educational settings with comparable students, test structures, and health-assessment procedures.
5. Conclusions
Among students at a Chinese health vocational school, greater depressive-symptom burden and poorer endurance performance were associated with lower relative academic achievement after accounting for earlier subject scores and other measured characteristics. These associations were small, and the contribution of the health indicators to explained variation was limited. The complete-case association for standing long jump weakened after imputation of missing fitness values, underscoring the importance of examining the robustness of individual field-test findings.
Supplementary Materials
The following supporting information can be downloaded at https://www.mdpi.com/article/10.3390/bs16112170/s1: Table S1. Included and excluded linked students, including available fitness performance; Table S2. Exploratory health associations by entry cohort, sex and December examination subject; Table S3. Observed raw fitness distributions by sex and entry cohort; Table S4. Linked students with at least one missing fitness test, by anonymous class; Table S5. Bivariate correlations among academic and health indicators. An accompanying code archive provides the R scripts, variable documentation and selected aggregate outputs.
Author Contributions
Conceptualization, Q.G. and C.Z.; methodology, Q.G., Z.L. and C.Z.; software, Q.G.; validation, Q.G. and Z.L.; formal analysis, Q.G.; investigation, S.Y. and L.L.; resources, S.Y. and L.L.; data curation, Q.G., S.Y. and L.L.; writing—original draft preparation, Q.G.; writing—review and editing, Q.G., Z.L., S.Y., L.L. and C.Z.; visualization, Q.G.; supervision, Z.L. and C.Z.; project administration, S.Y. and L.L. All authors have read and agreed to the published version of the manuscript.
Funding
This research was funded by the General Program of the Wuxi Municipal Health Commission, grant number M202209.
Institutional Review Board Statement
Approved by the Institutional Ethics Committee of Wuxi Higher Health Vocational Technology School on 8 November 2022, approval 2022003.
Informed Consent Statement
Written consent was obtained from all participating students and their parents or guardians, including for students aged 18 years or older. For participants younger than 18 years, students’ written agreement served as assent alongside their guardians’ written consent. Consent included authorized linkage of questionnaire responses with school records.
Data Availability Statement
R analysis scripts, a variable dictionary and non-identifying aggregate results are provided as Supplementary Files. Individual-level academic, health and psychological records are not publicly available because they concern adolescent students and are subject to confidentiality, consent and institutional data-protection requirements. Requests for access to a de-identified analytic dataset for verification may be directed to the corresponding author and will be evaluated subject to institutional approval and applicable safeguards. The publicly supplied scripts can be inspected and used with an authorized dataset; independent reproduction of participant-level analyses requires such access.
Acknowledgments
The authors thank the participating students, their guardians and the school staff who supported routine assessments and record linkage.
Conflicts of Interest
The authors declare no conflicts of interest. The funder had no role in the design of the study; in the collection, analyses, or interpretation of data; in the writing of the manuscript; or in the decision to publish the results.
References
- Alves Donato, A. N., Waclawovsky, A. J., Tonello, L., Firth, J., Smith, L., Stubbs, B., Schuch, F. B., & Boullosa, D. (2021). Association between cardiorespiratory fitness and depressive symptoms in children and adolescents: A systematic review and meta-analysis. Journal of Affective Disorders, 282, 1234–1240. [Google Scholar] [CrossRef] [Scilit]
- Álvarez-Bueno, C., Hillman, C. H., Cavero-Redondo, I., Sánchez-López, M., Pozuelo-Carrascosa, D. P., & Martínez-Vizcaíno, V. (2020). Aerobic fitness and academic achievement: A systematic review and meta-analysis. Journal of Sports Sciences, 38(5), 582–589. [Google Scholar] [CrossRef] [Scilit]
- Barnard, J., & Rubin, D. B. (1999). Small-sample degrees of freedom with multiple imputation. Biometrika, 86(4), 948–955. [Google Scholar] [CrossRef] [Scilit]
- Benjamini, Y., & Hochberg, Y. (1995). Controlling the false discovery rate: A practical and powerful approach to multiple testing. Journal of the Royal Statistical Society Series B: Statistical Methodology, 57(1), 289–300. [Google Scholar] [CrossRef] [Scilit]
- Bi, Y., Moon, M., & Shin, M. (2023). The longitudinal effects of depression on academic performance in Chinese adolescents via peer relationships: The moderating effect of gender and physical activity. International Journal of Environmental Research and Public Health, 20(1), 181. [Google Scholar] [CrossRef] [Scilit]
- Biddle, S. J. H., Ciaccioni, S., Thomas, G., & Vergeer, I. (2019). Physical activity and mental health in children and adolescents: An updated review of reviews and an analysis of causality. Psychology of Sport and Exercise, 42, 146–155. [Google Scholar] [CrossRef] [Scilit]
- Cameron, A. C., & Miller, D. L. (2015). A practitioner’s guide to cluster-robust inference. Journal of Human Resources, 50(2), 317–372. [Google Scholar] [CrossRef] [Scilit]
- Caspersen, C. J., Powell, K. E., & Christenson, G. M. (1985). Physical activity, exercise, and physical fitness: Definitions and distinctions for health-related research. Public Health Reports, 100(2), 126–131. [Google Scholar]
- Chen, Z. Y., Yang, X. D., & Li, X. Y. (2009). Psychometric features of CES-D in Chinese adolescents. Chinese Journal of Clinical Psychology, 17(4), 443–445, 448. (In Chinese) [Google Scholar]
- Chiang, H. L., Chuang, Y. F., Chen, Y. A., Hsu, C. T., Ho, C. C., Hsu, H. T., Sheu, Y. H., Gau, S. S. F., & Liang, L. L. (2024). Physical fitness and risk of mental disorders in children and adolescents. JAMA Pediatrics, 178(6), 595–607. [Google Scholar] [CrossRef] [Scilit]
- Donnelly, J. E., Hillman, C. H., Castelli, D., Etnier, J. L., Lee, S., Tomporowski, P., Lambourne, K., & Szabo-Reed, A. N. (2016). Physical activity, fitness, cognitive function, and academic achievement in children: A systematic review. Medicine & Science in Sports & Exercise, 48(6), 1197–1222. [Google Scholar] [CrossRef] [Scilit]
- Esch, P., Bocquet, V., Pull, C., Couffignal, S., Lehnert, T., Graas, M., Fond-Harmant, L., & Ansseau, M. (2014). The downward spiral of mental disorders and educational attainment: A systematic review on early school leaving. BMC Psychiatry, 14(1), 237. [Google Scholar] [CrossRef] [Scilit]
- Finning, K., Ukoumunne, O. C., Ford, T., Danielsson-Waters, E., Shaw, L., Romero De Jager, I., Stentiford, L., & Moore, D. A. (2019). The association between child and adolescent depression and poor attendance at school: A systematic review and meta-analysis. Journal of Affective Disorders, 245, 928–938. [Google Scholar] [CrossRef] [Scilit]
- Glymour, M. M., Weuve, J., Berkman, L. F., Kawachi, I., & Robins, J. M. (2005). When is baseline adjustment useful in analyses of change? An example with education and cognitive change. American Journal of Epidemiology, 162(3), 267–278. [Google Scholar] [CrossRef] [Scilit]
- Kirschner, M., Golsteijn, R. H. J., van der Wurff, I. S. M., Savelberg, H. H. C. M., & de Groot, R. H. M. (2022). The role of physical activity behavior in the mental wellbeing of vocational education and training students: The PHIT2LEARN study. Frontiers in Education, 7, 839848. [Google Scholar] [CrossRef] [Scilit]
- López-López, J. A., Kwong, A. S. F., Washbrook, L., Tilling, K., Fazel, M. S., & Pearson, R. M. (2021). Depressive symptoms and academic achievement in UK adolescents: A cross-lagged analysis with genetic covariates. Journal of Affective Disorders, 284, 104–113. [Google Scholar] [CrossRef] [Scilit]
- Lu, J., Tan, M., Ma, Y., Li, J., Yang, F., & Zhou, X. (2025). Better mental health and better academic performance: A longitudinal study of high school freshmen in China. Journal of Affective Disorders, 386, 119424. [Google Scholar] [CrossRef] [Scilit]
- Lubans, D., Richards, J., Hillman, C., Faulkner, G., Beauchamp, M., Nilsson, M., Kelly, P., Smith, J., Raine, L., & Biddle, S. (2016). Physical activity for cognitive and mental health in youth: A systematic review of mechanisms. Pediatrics, 138(3), e20161642. [Google Scholar] [CrossRef] [Scilit]
- Ministry of Education of the People’s Republic of China. (2014). National student physical fitness standard (2014 revision). Available online: https://www.moe.gov.cn/jyb_xxgk/xxgk/neirong/fenlei/sxml_twyjy/twyjy_tyws/tyws_xgzc/201407/t20140708_171692.html (accessed on 14 November 2023).
- Monzonís-Carda, I., Adelantado-Renau, M., Beltran-Valls, M. R., & Moliner-Urdiales, D. (2023). Risk of depression mediates the association between cardiorespiratory fitness and academic performance in adolescent boys and girls: DADOS study. European Journal of Pediatrics, 182(1), 67–77. [Google Scholar] [CrossRef] [Scilit]
- Moses, T. (2026). Scaling, equating, and linking. In L. L. Cook, & M. J. Pitoniak (Eds.), Educational measurement (5th ed., pp. 735–820). Oxford University Press. [Google Scholar] [CrossRef] [Scilit]
- Muntaner-Mas, A., Valenzuela, P. L., Pinto-Escalona, T., Erickson, K. I., & Martínez-de-Quel, Ó. (2025). Mental health mediates the association between cardiorespiratory fitness and academic performance in European schoolchildren. Jornal de Pediatria, 101(4), 616–624. [Google Scholar] [CrossRef] [Scilit]
- Pustejovsky, J. E., & Tipton, E. (2018). Small-sample methods for cluster-robust variance estimation and hypothesis testing in fixed effects models. Journal of Business & Economic Statistics, 36(4), 672–683. [Google Scholar] [CrossRef] [Scilit]
- Radloff, L. S. (1977). The CES-D scale: A self-report depression scale for research in the general population. Applied Psychological Measurement, 1(3), 385–401. [Google Scholar] [CrossRef] [Scilit]
- Recchia, F., Bernal, J. D. K., Fong, D. Y., Wong, S. H. S., Chung, P. K., Chan, D. K. C., Capio, C. M., Yu, C. C. W., Wong, S. W. S., Sit, C. H. P., Chen, Y. J., Thompson, W. R., & Siu, P. M. (2023). Physical activity interventions to alleviate depressive symptoms in children and adolescents: A systematic review and meta-analysis. JAMA Pediatrics, 177(2), 132–140. [Google Scholar] [CrossRef] [Scilit]
- Riglin, L., Petrides, K. V., Frederickson, N., & Rice, F. (2014). The relationship between emotional problems and subsequent school attainment: A meta-analysis. Journal of Adolescence, 37(4), 335–346. [Google Scholar] [CrossRef] [Scilit]
- Rohrer, J. M. (2018). Thinking clearly about correlations and causation: Graphical causal models for observational data. Advances in Methods and Practices in Psychological Science, 1(1), 27–42. [Google Scholar] [CrossRef] [Scilit]
- Santana, C. C. A., Azevedo, L. B., Cattuzzo, M. T., Hill, J. O., Andrade, L. P., & Prado, W. L. (2017). Physical fitness and academic performance in youth: A systematic review. Scandinavian Journal of Medicine & Science in Sports, 27(6), 579–603. [Google Scholar] [CrossRef] [Scilit]
- Sardinha, L. B., Marques, A., Minderico, C., Palmeira, A., Martins, S., Santos, D. A., & Ekelund, U. (2016). Longitudinal relationship between cardiorespiratory fitness and academic achievement. Medicine & Science in Sports & Exercise, 48(5), 839–844. [Google Scholar] [CrossRef] [Scilit]
- Shmueli, G. (2010). To explain or to predict? Statistical Science, 25(3), 289–310. [Google Scholar] [CrossRef] [Scilit]
- Singh, A. S., Saliasi, E., van den Berg, V., Uijtdewilligen, L., de Groot, R. H. M., Jolles, J., Andersen, L. B., Bailey, R., Chang, Y. K., Diamond, A., Ericsson, I., Etnier, J. L., Fedewa, A. L., Hillman, C. H., McMorris, T., Pesce, C., Pühse, U., Tomporowski, P. D., & Chinapaw, M. J. M. (2019). Effects of physical activity interventions on cognitive and academic performance in children and adolescents: A novel combination of a systematic review and recommendations from an expert panel. British Journal of Sports Medicine, 53(10), 640–647. [Google Scholar] [CrossRef] [Scilit]
- Sterne, J. A. C., White, I. R., Carlin, J. B., Spratt, M., Royston, P., Kenward, M. G., Wood, A. M., & Carpenter, J. R. (2009). Multiple imputation for missing data in epidemiological and clinical research: Potential and pitfalls. BMJ, 338, b2393. [Google Scholar] [CrossRef] [Scilit]
- Syväoja, H. J., Kankaanpää, A., Joensuu, L., Kallio, J., Hakonen, H., Hillman, C. H., & Tammelin, T. H. (2019). The longitudinal associations of fitness and motor skills with academic achievement. Medicine & Science in Sports & Exercise, 51(10), 2050–2057. [Google Scholar] [CrossRef] [Scilit]
- Tennant, P. W. G., Arnold, K. F., Ellison, G. T. H., & Gilthorpe, M. S. (2022). Analyses of ‘change scores’ do not estimate causal effects in observational data. International Journal of Epidemiology, 51(5), 1604–1615. [Google Scholar] [CrossRef] [Scilit]
- van Buuren, S., & Groothuis-Oudshoorn, K. (2011). mice: Multivariate imputation by chained equations in R. Journal of Statistical Software, 45(3), 1–67. [Google Scholar] [CrossRef] [Scilit]
- VanderWeele, T. J. (2019). Principles of confounder selection. European Journal of Epidemiology, 34(3), 211–219. [Google Scholar] [CrossRef] [Scilit]
- Verboom, C. E., Sijtsema, J. J., Verhulst, F. C., Penninx, B. W. J. H., & Ormel, J. (2014). Longitudinal associations between depressive problems, academic performance, and social functioning in adolescent boys and girls. Developmental Psychology, 50(1), 247–257. [Google Scholar] [CrossRef] [Scilit]
- von Elm, E., Altman, D. G., Egger, M., Pocock, S. J., Gøtzsche, P. C., Vandenbroucke, J. P., & STROBE Initiative. (2007). The Strengthening the Reporting of Observational Studies in Epidemiology (STROBE) statement: Guidelines for reporting observational studies. PLoS Medicine, 4(10), e296. [Google Scholar] [CrossRef] [Scilit]
- Westfall, J., & Yarkoni, T. (2016). Statistically controlling for confounding constructs is harder than you think. PLoS ONE, 11(3), e0152719. [Google Scholar] [CrossRef] [Scilit]
- Wickersham, A., Sugg, H. V. R., Epstein, S., Stewart, R., Ford, T., & Downs, J. (2021). Systematic review and meta-analysis: The association between child and adolescent depression and later educational attainment. Journal of the American Academy of Child & Adolescent Psychiatry, 60(1), 105–118. [Google Scholar] [CrossRef] [Scilit]
- Xiang, M., Gu, X., Jackson, A., Zhang, T., Wang, X., & Guo, Q. (2017). Understanding adolescents’ mental health and academic achievement: Does physical fitness matter? School Psychology International, 38(6), 647–663. [Google Scholar] [CrossRef] [Scilit]
- Yang, W., Xiong, G., Garrido, L. E., Zhang, J. X., Wang, M.-C., & Wang, C. (2018). Factor structure and criterion validity across the full scale and ten short forms of the CES-D among Chinese adolescents. Psychological Assessment, 30(9), 1186–1198. [Google Scholar] [CrossRef] [Scilit]

Disclaimer/Publisher’s Note: The statements, opinions and data contained in all publications are solely those of the individual author(s) and contributor(s) and not of MDPI and/or the editor(s). MDPI and/or the editor(s) disclaim responsibility for any injury to people or property resulting from any ideas, methods, instructions or products referred to in the content. |
© 2026 by the authors. Licensee MDPI, Basel, Switzerland. This article is an open access article distributed under the terms and conditions of the Creative Commons Attribution (CC BY) license.