


Abstract
Although coaching leadership is consistently linked to positive employee outcomes, the psychological pathways through which it is associated with employee thriving remain theoretically underspecified. Applying a stage-specific extension of person–environment (PE) fit theory, this study examined a parallel indirect-effect model in which coaching leadership is associated with thriving through person–job fit (PJF) and person–organization fit (POF) as parallel mediators. Rather than relying on regression-based path comparisons alone, this study employed path analysis with structural equation modeling (SEM) and two equality-constrained model comparisons via likelihood ratio tests (LRTs) to test whether coaching leadership’s antecedent-side associations with PJF and POF differ, and whether PJF and POF’s outcome-side associations with thriving differ. Data were collected from 427 Korean employees using a three-wave time-lagged design (coaching leadership at T1, PJF and POF at T2, thriving at T3). One person–organization fit item with a markedly weak standardized loading (λ = 0.164) was identified during measurement-model testing and removed; all results reported here are based on the resulting refined measurement. Coaching leadership was positively associated with both PJF (B = 0.27, β = 0.33) and POF (B = 0.44, β = 0.50), and this antecedent-side association was significantly stronger for POF, Δχ2(1) = 28.30, p < 0.001. On the outcome side, both PJF (B = 0.32, β = 0.28) and POF (B = 0.16, β = 0.15) were positively associated with thriving, and the equality-constrained comparison did not detect a significant difference between the two outcome-side associations, Δχ2(1) = 1.82, p = 0.177. A bootstrap analysis of the indirect associations indicated that both the indirect association through PJF (0.086, 95% CI [0.044, 0.133]) and the indirect association through POF (0.072, 95% CI [0.004, 0.148]) were reliably different from zero, while the contrast between the two indirect associations was not significant (0.014, 95% CI [−0.092, 0.112]). These findings suggest that PJF and POF follow distinct patterns of association with coaching leadership at the antecedent side, even though their outcome-side associations with thriving and their overall indirect contributions could not be shown to differ.
1. Introduction
Coaching leadership, a supervisory behavior pattern characterized by developmental feedback, inquiry-based questioning, goal-setting facilitation, and capability-building support (Ellinger et al., 2003; Hagen, 2012), is consistently associated with positive employee outcomes including job satisfaction (McCarthy & Milner, 2013), organizational commitment (Grant, 2014), and proactive behavior (Frese & Fay, 2001). A growing body of evidence suggests that coaching leadership is also associated with employee thriving, defined as the psychological state of simultaneous vitality and learning (Porath et al., 2012; Spreitzer et al., 2005), yet the pathways through which this association operates remain theoretically underspecified.
Person–environment (PE) fit theory (Caplan, 1987; A. L. Kristof-Brown et al., 2005) offers a natural organizing framework. Two sub-dimensions have received the most empirical attention: person–job fit (PJF), reflecting congruence between employee capabilities and job demands (Edwards, 1991; Lauver & Kristof-Brown, 2001), and person–organization fit (POF), reflecting congruence between employee values and organizational culture (Chatman, 1989; O’Reilly et al., 1991). Meta-analytic evidence (A. L. Kristof-Brown et al., 2005) establishes that PJF and POF exhibit differential validity, showing different antecedent and consequence profiles. The present study applies a stage-specific extension of this established differential-validity perspective to a new context: coaching leadership as antecedent and employee thriving as outcome.
A central methodological concern in prior cross-sectional PE fit research is the validity of coefficient-comparison tests. The key question is whether coaching leadership’s associations with PJF and POF differ (antecedent-side comparison) and whether PJF and POF’s associations with thriving differ (outcome-side comparison). Both comparisons involve correlated coefficient estimates that require proper statistical treatment. The present study addresses this directly using structural equation modeling (SEM) path analysis with equality-constrained model comparisons via likelihood ratio tests (LRTs), which provides a statistically appropriate approach for testing coefficient equality when residuals are correlated across equations.
Coaching leadership, PJF and POF, and thriving were measured at three temporally separated waves (coaching leadership at T1, PJF and POF at T2, and thriving at T3), so the hypothesized antecedent-side and outcome-side relations reflect a genuine time-lagged sequence rather than a single cross-sectional snapshot; this clarifies the temporal ordering implied by the hypothesized process structure and reduces, though does not eliminate, common-method-bias concerns associated with same-time self-report measurement. Because participants were not randomly assigned to levels of coaching leadership and reciprocal relations across waves cannot be fully ruled out, we nonetheless use ‘association’ rather than ‘effect’ and ‘indirect association’ rather than ‘mediated effect’ throughout, while ‘antecedent-side’ and ‘outcome-side’ now describe positions in the hypothesized process structure that correspond directly to the T1–T2–T3 measurement sequence. Fully causal interpretation would still benefit from cross-lagged replication that models reciprocal paths across additional measurement occasions.
Building on this foundation, three streams of prior research motivate the present study’s specific focus. First, research on coaching leadership has established its associations with proximal attitudinal and behavioral outcomes such as satisfaction, commitment, and proactivity (Frese & Fay, 2001; Grant, 2014; McCarthy & Milner, 2013), but has rarely examined the person–environment fit perceptions through which these associations might operate, and almost never within a design that separates antecedent, mediating, and outcome measurement in time. Second, the person–job fit and person–organization fit studies have each developed largely in parallel: studies of PJF emphasize demands–abilities congruence and its proximal, task-related consequences (Edwards, 1991; French et al., 1982; Saks & Ashforth, 1997), while studies of POF emphasize needs–supplies, value congruence and its broader attitudinal consequences (Chatman, 1989; Edwards & Billsberry, 2010; O’Reilly et al., 1991; Verquer et al., 2003); relatively few studies estimate both dimensions simultaneously within a single empirical model, and fewer still test, rather than assume, whether a common antecedent activates them to the same degree (A. Kristof-Brown et al., 2023; Vleugels et al., 2023). Third, the thriving literature has matured considerably since Spreitzer et al.’s (2005) original formulation, with meta-analytic evidence confirming thriving’s incremental validity for performance, health, and citizenship outcomes (Kleine et al., 2019), yet the leadership antecedents of thriving—and in particular the fit-based mechanisms through which a specific leadership style might cultivate it—remain comparatively underexamined. Taken together, these three streams leave open a specific empirical question that the cross-sectional, single-fit-dimension designs common in the literature cannot resolve: whether a single leadership antecedent such as coaching leadership activates PJF and POF to different degrees, and whether any such antecedent-side differentiation persists, strengthens, or dissolves by the time these fit perceptions are linked to thriving.
The purpose of this study is therefore to examine, within a single three-wave time-lagged design, whether coaching leadership is differentially associated with PJF and POF at the antecedent side, and whether PJF and POF are in turn differentially associated with employee thriving at the outcome side, using equality-constrained structural equation modeling to test both comparisons formally rather than informally. Accordingly, this study addresses two research questions. RQ1: Is coaching leadership’s association with POF significantly stronger than its association with PJF? RQ2: Are PJF’s and POF’s associations with employee thriving, and their resulting indirect associations with thriving through coaching leadership, significantly different in magnitude? These research questions are formalized as the hypotheses developed in Section 2.3 below (H1–H5).
2. Theoretical Background and Hypotheses
2.1. Employee Thriving: Vitality and Learning
Employee thriving comprises vitality (positive energy and aliveness) and learning (sense of acquiring and applying new knowledge), as defined by Spreitzer et al. (2005) and validated by Porath et al. (2012). Meta-analytic evidence (Kleine et al., 2019) confirms that thriving predicts performance, health, and citizenship above and beyond engagement, and vitality and learning have been shown to carry both independent and joint associations with employee outcomes (Rudolph et al., 2022). The two-component structure motivates separate examination of vitality and learning in robustness analyses, since PJF (task-capability congruence) may more directly support learning through competence activation and POF (value congruence) may more directly support vitality through organizational belonging.
2.2. Stage-Specific Extension of PE Fit Theory
PE fit theory (Caplan, 1987; Kristof, 1996; A. L. Kristof-Brown et al., 2005) proposes that congruence generates positive outcomes through two mechanisms: demands–abilities complementarity (PJF mechanism (French et al., 1982)) and needs–supplies fulfillment (POF mechanism (Edwards & Billsberry, 2010)). Because these mechanisms are distinct, PJF and POF exhibit differential-validity profiles. A. L. Kristof-Brown et al.’s (2005) meta-analysis of 172 studies established that PJF more strongly predicts job satisfaction and task performance, while POF more strongly predicts organizational commitment and turnover intentions, a differential pattern independently replicated in personnel-selection contexts (Sekiguchi, 2004).
The present study extends this established differential validity to coaching leadership as antecedent and employee thriving as outcome, treating this as a stage-specific empirical extension rather than a new theory. Cable and DeRue (2002) provided validated measures of PJF and POF, and in the present competing CFA comparison, PJF and POF were confirmed to be empirically distinguishable (Δχ2(3) = 193.4, p < 0.001), although their correlation (r = 0.679) indicates they share considerable common variance, a point revisited as a measurement limitation in Section 5.6 and addressed directly via the item-refinement procedure, which removed a weak-loading POF item.
Recent scholarship provides further theoretical grounding for the stage-differentiated fit pathway model. A. Kristof-Brown et al. (2023) conducted a comprehensive historical review of PO fit theory and identified a critical gap: studies rarely estimate PJF and POF simultaneously within a single empirical framework, making within-study comparison of their differential profiles impossible. The present study directly addresses this gap by estimating both dimensions in a single parallel indirect-effect SEM model.
Vleugels et al. (2023) conducted a systematic review of temporal PE fit research and explicitly called for studies that differentiate between fit dimensions within the same empirical framework, which is precisely the methodological contribution of the present study. Their review also highlighted that fit researchers rarely examine the interrelationships between different forms of fit, leaving the question of whether PJF and POF are generated at different rates by leadership behavior unanswered. Vleugels and Flatau-Harrison (2023) further demonstrated that the same PE fit type can show different effect sizes depending on the outcome domain, supporting the theoretical premise that PJF and POF may show systematically different outcome-side profiles.
Xi et al. (2022) provided the most direct empirical precedent for the stage-differentiated pathway model by showing that ethical leadership differentially activated demands–abilities fit (PJF) versus needs–supplies fit (POF), such that the former mediated leadership’s association with career mobility and promotability while the latter mediated its association with career satisfaction. This pattern, in which a single leadership antecedent generates different fit dimensions at different rates and those dimensions in turn predict different outcomes, is structurally identical to the crossing pattern documented in the present study.
Relative to Xi et al. (2022) and related single-leadership-style, single-outcome-pair studies, the originality of the present study lies in four specific features rather than in the differential-validity logic itself, which is adapted from established theory (A. L. Kristof-Brown et al., 2005; A. Kristof-Brown et al., 2023; Vleugels et al., 2023). First, whereas Xi et al. (2022) examined two different outcome variables (career mobility and career satisfaction) for PJF and POF respectively, the present study holds the outcome constant (employee thriving) and instead compares the two fit dimensions’ associations with that single outcome, isolating the outcome-side comparison that their design could not address. Second, the present study estimates coaching leadership’s associations with PJF and POF, and PJF’s and POF’s associations with thriving, within one simultaneous SEM rather than across separate models, and tests both sets of coefficient differences formally via equality-constrained likelihood ratio tests rather than via descriptive comparison of separately estimated coefficients—a methodological step that, to our knowledge, has not been applied to this specific antecedent–mediator–outcome configuration. Third, the three-wave time-lagged design (coaching leadership at T1, PJF and POF at T2, thriving at T3) separates the measurement of antecedent, mediators, and outcome in time, whereas much of the differential-validity literature, including Xi et al. (2022), relies on cross-sectional or two-wave data. Fourth, the present study formally compares the magnitude of the two resulting indirect associations (H5) via bootstrap contrast, extending the differential-validity question from the direct paths examined in prior work to the indirect, process-level associations that ultimately link leadership behavior to employee outcomes.
2.3. Coaching Leadership and the Hypothesized Process Structure
Building on the theoretical foundation established above, this section develops specific hypotheses concerning coaching leadership’s hypothesized process structure with PJF, POF, and employee thriving. Five sets of predictions are proposed: a direct association between coaching leadership and thriving (H1), antecedent-side associations between coaching leadership and each fit dimension together with their formal comparison (H2a–H2c), outcome-side associations between each fit dimension and thriving together with their formal comparison (H3a–H3c), indirect associations between coaching leadership and thriving through each fit dimension (H4a, H4b), and a hypothesized asymmetry in the relative magnitude of the two resulting total indirect associations (H5).
Coaching leadership is theorized to relate directly to thriving independent of its indirect associations through fit. As a supervisory behavior pattern built on autonomy-supportive dialog and goal-focused engagement, coaching leadership resembles the kind of need-supportive supervisory behavior that self-determination theory (Deci & Ryan, 2008) links to vitality and engagement, and it has been associated with proactive, initiative-taking behavior more broadly (Frese & Fay, 2001). Coaching leadership has also been linked empirically to a more engaged and committed workforce, including learning-goal orientation and organizational self-esteem (Tang et al., 2024), both of which are conceptually adjacent to the vitality and learning components of thriving (Porath et al., 2012; Spreitzer et al., 2005). On this basis, coaching leadership is expected to retain a positive direct association with thriving even after accounting for its associations with PJF and POF.
H1.
Coaching leadership is positively associated with employee thriving.
On the antecedent side, coaching leadership is expected to be positively associated with both PJF and POF, but not necessarily to the same degree. Coaching behaviors such as developmental feedback and capability-building support (Ellinger et al., 2003; Hagen, 2012) directly target the demands–abilities congruence that underlies PJF (Edwards, 1991; French et al., 1982), providing a straightforward basis for H2a. Coaching dialogs are also described as oriented toward purpose and meaning exploration (Ives, 2008; Passmore & Fillery-Travis, 2011), which more closely maps onto the needs–supplies, value-congruence mechanism underlying POF (Chatman, 1989; Edwards & Billsberry, 2010), providing the basis for H2b. In Korean organizational contexts, where Confucian-influenced relational and hierarchical norms emphasize organizational belonging (Hofstede, 1980; Kim et al., 1994), this orientation may be further reinforced, so that coaching conversations engage POF-relevant themes more readily than PJF-relevant ones. This asymmetry parallels recent evidence that a single leadership antecedent can activate demands–abilities and needs–supplies fit at different rates (Cai et al., 2018; Xi et al., 2022), and it is consistent with calls in the literature to test such differential activation directly within a single study (Billsberry & Vleugels, 2023; Vleugels et al., 2023). H2c therefore predicts that coaching leadership’s association with POF will be significantly stronger than its association with PJF, a prediction tested formally via the SEM equality-constrained LRT described in Section 3.4.
H2a.
Coaching leadership is positively associated with PJF.
H2b.
Coaching leadership is positively associated with POF.
H2c.
Coaching leadership shows a stronger antecedent-side association with POF than with PJF, tested via SEM equality-constrained LRT.
On the outcome side, both PJF and POF are expected to be positively associated with thriving, consistent with PE fit theory’s general premise that congruence supports positive functioning (Caplan, 1987; Kristof, 1996; A. L. Kristof-Brown et al., 2005). PJF’s demands–abilities congruence is expected to support thriving primarily by activating a sense of competence and mastery, which aligns closely with the learning component of thriving (Porath et al., 2012; Spreitzer et al., 2005) and is consistent with longitudinal evidence linking PJ fit to positive work outcomes (Saks & Ashforth, 1997). POF’s value congruence, in turn, is expected to support thriving through a sense of belonging and identification with the organization, consistent with meta-analytic evidence linking PO fit to favorable work attitudes (Verquer et al., 2003) and with more recent evidence connecting POF specifically to thriving (Sugiono et al., 2023). H3a and H3b accordingly predict that both PJF and POF will show positive associations with thriving when estimated simultaneously and controlling for coaching leadership.
H3a.
PJF is positively associated with thriving, controlling for coaching leadership and POF.
H3b.
POF is positively associated with thriving, controlling for coaching leadership and PJF.
Although both PJF and POF are expected to relate positively to thriving, their outcome-side associations are not expected to be of equal strength. A. L. Kristof-Brown et al.’s (2005) meta-analysis found that PJF more strongly predicts proximal, performance- and engagement-related outcomes, whereas POF more strongly predicts broader attitudinal outcomes such as commitment and turnover intentions, a pattern suggesting that PJF may be more proximally tied to the active, energized state captured by thriving. Consistent with this, PJF and POF have been shown to operate through distinct psychological mechanisms even when both are examined together (Zeng & Hu, 2024). H3c therefore predicts that PJF’s outcome-side association with thriving will be significantly stronger than POF’s, again tested via the SEM equality-constrained LRT.
H3c.
PJF shows a stronger outcome-side association with thriving than POF, tested via SEM equality-constrained LRT.
Beyond these direct antecedent-side and outcome-side paths, PE fit theory implies that coaching leadership should also be associated with thriving indirectly through each fit dimension, via the sequential process CL → fit → thriving. H4a and H4b state these indirect associations formally, providing the necessary foundation for the comparative prediction advanced in H5. The full hypothesized model, including the antecedent-side, outcome-side, and indirect paths specified above, is depicted in Figure 1.
Figure 1.
Hypothesized research model.
H4a.
Coaching leadership is positively associated with thriving indirectly through PJF.
H4b.
Coaching leadership is positively associated with thriving indirectly through POF.
Because H2c and H3c predict opposing antecedent-side and outcome-side asymmetries, the net direction of coaching leadership’s total indirect association with thriving through each fit dimension (H4a, H4b) is not obvious by simple extension of either result alone: a weaker antecedent-side path for PJF could in principle combine with its stronger outcome-side path to produce an indirect association similar in magnitude to that of POF, whose stronger antecedent-side path is paired with a weaker outcome-side path. However, following the same theoretical logic developed for H3c, in which the outcome-side mechanism most proximal to thriving is expected to be the more decisive determinant of the resulting indirect association, the present study advances the parallel prediction that the PJF pathway will also show the larger total indirect association, tested formally via bootstrap comparison of the two indirect associations following recommended practice for comparing indirect effects (Hayes, 2022; Preacher & Hayes, 2008).
H5.
The indirect association between coaching leadership and thriving through PJF is stronger than the indirect association through POF.
3. Method
3.1. Participants and Procedure
Data were collected using a three-wave time-lagged design (T1, T2, and T3) via a professional online survey panel in 2025. Measured variables were allocated across waves following the theoretical causal order of the hypothesized model: coaching leadership (the independent variable) and the demographic control variables were measured at T1, person–job fit and person–organization fit (the parallel first-stage mediators) were measured at T2, and employee thriving (the dependent variable) was measured at T3. Of the 600 full-time Korean employees initially recruited at T1, 427 (71.2%) provided valid responses across all three waves and were retained for the final analytic sample, following attrition during the T2 and T3 follow-ups (cumulative attrition N = 173, 28.8%); the participant flow and an attrition test comparing completers and non-completers are reported in Table 1. The final analytic sample comprised 427 full-time Korean employees (221 men, 51.8%; 206 women, 48.2%; mean age = 40.7, SD = 10.0). Informed consent was obtained from all participants at each wave. No missing values among the 427 employees were retained in the final analytic sample. Further demographic details are in Table 1. Panel invitations at each subsequent wave were sent only to respondents who had completed the immediately preceding wave, and eligibility at T1 required current full-time employment of at least six months with the respondent’s organization; participants received standard panel-point compensation from the survey provider for each completed wave. Responses were screened for validity using a minimum completion-time threshold and embedded attention-check items, with respondents failing these checks excluded prior to the attrition counts reported in Table 1. The interval between T1 and T2 was approximately four weeks and between T2 and T3 was approximately four weeks (eight weeks total from T1 to T3); this lag was chosen to allow sufficient time for coaching interactions to translate into updated fit perceptions (T1–T2) and for fit perceptions to translate into changes in thriving (T2–T3), while remaining short enough to limit confounding from unrelated organizational changes during the study period (Mitchell & James, 2001). Statistical analyses were conducted using semopy (version 2.3.11) for structural equation modeling and bootstrap indirect-effect tests, and IBM SPSS Statistics (version 29) for variance inflation factor diagnostics and Harman’s single-factor test.
Table 1.
Participant flow and attrition test across three waves (initial N = 600).
Independent-samples t-tests showed no significant differences between completers (n = 427) and non-completers (n = 173) in age, t(598) = −0.47, p = 0.641, d = −0.04; job tenure, t(598) = −0.50, p = 0.615, d = −0.05; or baseline coaching leadership scores, t(598) = −0.75, p = 0.456, d = −0.07. Chi-square tests likewise showed no significant differences in education level, χ2(3) = 3.09, p = 0.378, Cramér’s V = 0.07, or job rank, χ2(5) = 6.65, p = 0.248, Cramér’s V = 0.11. Gender was significantly associated with retention, χ2(1) = 5.85, p = 0.016, Cramér’s V = 0.10, such that women were somewhat more likely than men to remain in the study through the final wave (36.9% of non-completers were women vs. 48.2% of completers), although this effect was small. Overall, no significant differences were detected between completers and non-completers on most observed baseline variables, including the substantive study variable (coaching leadership), age, job tenure, education level, and job rank. Retention did, however, differ significantly by gender, as reported above. These comparisons indicate that attrition was largely, though not entirely, unrelated to the observed baseline variables; they cannot, however, establish the underlying missingness mechanism or rule out the possibility of attrition bias associated with unobserved variables, and this is acknowledged as a limitation.
Statistical Power and Sample Size Justification
No a priori power analysis was conducted prior to data collection; the target sample size was instead set by the data-collection budget and the panel provider’s available respondent pool, a common constraint in applied organizational survey research. To address this gap post hoc, achieved power and the minimum detectable effect (MDE) at 80% power were calculated for each structural path and each indirect/contrast test, using a normal-approximation approach based on each coefficient’s estimated standard error at N = 427 (cf. Fritz & MacKinnon, 2007, for the general logic of power analysis for indirect effects). The direct and antecedent-side paths were well powered (H1: power = 0.80; H2a, H2b: power > 0.99; H3a: power > 0.99), as was the PJF indirect association (H4a: power = 0.96). Power was more limited for the POF outcome-side path (H3b: power = 0.68) and the POF indirect association (H4b: power = 0.51, MDE = 0.102 in the B-scale indirect-association metric), and was low for the bootstrap contrast between the two indirect associations (H5: power = 0.06, MDE = 0.143), meaning the present design was not well positioned to detect anything but a very large difference between the PJF and POF indirect associations. This post hoc power profile is revisited in Section 5.6 and supports treating the non-significant H3c and H5 results as inconclusive rather than as evidence of equivalence, consistent with the interpretation already offered in Section 4.4, Section 4.6 and Section 5.1.
3.2. Measures
3.2.1. Coaching Leadership (CL; 13 Items, α = 0.955, M = 3.09, SD = 0.84)
Coaching leadership was measured with the 13-item scale developed by Stowell (1986), translated into Korean following standard back-translation procedures (Brislin, 1970) and adapted to reflect the supervisory coaching practices described by Ellinger et al. (2003) for Korean workplace contexts. Consistent with the four-dimensional conceptualization outlined in the Introduction, the items ask employees to rate the extent to which their supervisor provides constructive, developmental feedback on their work; asks questions that encourage them to think through problems and identify their own solutions rather than simply supplying answers; works with them to set clear, specific, and attainable goals; and actively supports the development of the skills and capabilities needed to perform their job well. All items were rated on a 5-point Likert-type scale (1 = strongly disagree, 5 = strongly agree).
3.2.2. Person–Job Fit (PJF; 5 Items, α = 0.860, M = 3.59, SD = 0.68)
Person–job fit was measured with a 5-item scale adapted from Cable and DeRue (2002), reflecting the demands–abilities congruence mechanism described in Section 2.2 (French et al., 1982). The items ask employees to rate the degree of match between their own knowledge, skills, and abilities and the demands of their current job, for example the extent to which their skills and abilities fit what the job requires and the extent to which the job calls on the kinds of skills and abilities they possess. Items were rated on the same 5-point Likert-type scale used for the other study measures.
3.2.3. Person–Organization Fit (POF; 4 Items After Item Refinement, α = 0.869, M = 3.28, SD = 0.75; Originally a 5-Item Scale, α = 0.781, M = 3.27, SD = 0.65)
Person–organization fit was measured with a 5-item scale adapted from Cable and DeRue (2002) and Lauver and Kristof-Brown (2001), reflecting the needs–supplies, value-congruence mechanism described in Section 2.2 (Chatman, 1989; Edwards & Billsberry, 2010). The items ask employees to rate the degree of congruence between their personal values and the values, culture, and goals of their organization, for example the extent to which their personal values match the values embodied in the organization’s culture and the extent to which the organization’s values and priorities are similar to their own. Items were rated on the same 5-point Likert-type scale. The scale originally comprised five items; one item showed a markedly weak standardized loading (λ = 0.164) in the measurement-model testing reported in Section 4.1 and was removed following the item-refinement procedure, yielding the four-item scale used in all analyses reported in this manuscript.
3.2.4. Employee Thriving (TW; 10 Items, α = 0.949, M = 3.00, SD = 0.79)
Employee thriving was measured with the 10-item scale developed by Spreitzer et al. (2005) and validated by Porath et al. (2012), comprising two five-item sub-dimensions. The vitality items ask employees to rate the extent to which they feel alive, energized, and full of positive energy at work, while the learning items ask employees to rate the extent to which they feel they are developing and getting better at their job, continually learning, and acquiring new knowledge and skills. The two sub-dimensions were combined into a single overall thriving score (α = 0.949, M = 3.00, SD = 0.79), while the vitality (α = 0.939, M = 2.95, SD = 0.83) and learning (α = 0.930, M = 3.05, SD = 0.87) sub-dimensions were retained separately for the robustness analyses reported in Section 5.3. Thriving was self-reported because vitality and learning are internal experiences that supervisors cannot directly observe (Spector, 2006); same-source measurement therefore remains a design limitation despite the CMB procedures described in Section 3.3.
3.2.5. Control Variables
Gender, age, educational attainment, job rank, and tenure, each with theoretical justification (Kleine et al., 2019; A. L. Kristof-Brown et al., 2005). All VIF < 2.30 (maximum VIF = 2.24, for POF, after the weak-loading POF item was removed.
3.3. Common-Method-Bias Procedures
Procedural safeguards included physical section separation, scale format variation, reverse-coded items, and anonymity assurance. Post hoc assessments included (1) Harman’s single-factor test (28.3% first-factor variance; threshold 50% (Podsakoff et al., 2003)); (2) the marker variable technique, using workplace cooperation, a collaborative norm behavior distinct from supervisory behavior, fit perceptions, and well-being dimensions, as the marker (Lindell & Whitney, 2001; Organ, 1988), with all Δβ values below 0.03 when the marker was included; and (3) a four-factor CFA that significantly outperformed a one-factor model (ΔCFI = 0.393, p < 0.001). These procedures reduce, but do not eliminate, CMB concerns.
3.4. Analytical Strategy
Four analytical layers were used. The first consisted of competing CFA models, in which four nested models were compared to verify construct distinctiveness. The second was SEM path analysis (ML estimation, semopy 2.3.11), in which three models were estimated: M1 (unconstrained, freely estimating all paths), M2 (equality-constrained antecedent side: a_CL-PJF = a_CL-POF), and M3 (equality-constrained outcome side: b_PJF → TW = b_POF → TW). In all models, the PJF–POF residual covariance was freely estimated to account for correlated disturbances arising from shared antecedents. CL, PJF, POF, and TW entered M1–M3 as single composite (mean) indicators of their respective item sets rather than as latent factors with their indicators carried into the structural stage; the four-factor CFA reported in Section 4.1 is a separate, prior step that evaluates the measurement model itself (loadings, reliability, discriminant validity) and is not re-estimated jointly with the structural paths (see Section 5.6 for the implications of this two-step approach). The third layer consisted of LRTs comparing M2 vs. M1 (H2c) and M3 vs. M1 (H3c); a significant LRT (p < 0.05) indicates that the constrained model fits significantly worse, rejecting equality of the constrained paths. The fourth layer consisted of bootstrap SEM indirect effects, in which the unconstrained M1 was used for 2000-resample percentile bootstrap estimates of the indirect associations (H4a, H4b) and their contrast (H5).
This SEM-based LRT approach addresses the core methodological concern about cross-equation coefficient comparisons. Because M1 freely estimates the PJF–POF residual covariance (B = 0.251, SE = 0.023, p < 0.001), the model explicitly accounts for the correlation between PJF and POF disturbances arising from unmeasured shared antecedents. The LRT then compares the fit of this correctly specified model against equality-constrained alternatives, providing an internally consistent test of coefficient equality that does not rely on assumptions about the independence of path coefficients across equations, a concern with a long history in the seemingly unrelated-regression literature on correlated equation systems (Zellner, 1962).
4. Results
4.1. Measurement Model: Competing CFA Comparisons
Table 2 presents four nested CFA models estimated on the final 32-item measurement model. One POF item (item 8, POF3) showed a markedly weak standardized loading (λ = 0.164) in initial estimation; following the item-refinement procedure, this item was removed from the POF scale and all measurement and structural results reported from this point forward are based on the resulting 32-item model (13 CL + 5 PJF + 4 POF + 10 TW items). The four-factor model (CL, PJF, POF, TW) showed fit indices below conventional thresholds for excellent fit (CFI/TLI ≥ 0.90; RMSEA ≤ 0.08): CFI = 0.861, TLI = 0.849, RMSEA = 0.089 (90% CI [0.085, 0.093]), SRMR = 0.051. This level of fit is a genuine limitation of the measurement model rather than a negligible deviation, and it is treated as such throughout this manuscript (Section 5.6), removing the weak item left overall fit essentially unchanged, indicating that this limitation reflects broader measurement-model complexity rather than a single problematic indicator. Standardized factor loadings for the retained items ranged from 0.68 to 0.86 (Table 3(a)). AVE values were CL = 0.62, PJF = 0.55, POF = 0.63, and TW = 0.65, all exceeding the 0.50 threshold. The Fornell–Larcker criterion was not satisfied for PJF even after item removal: the latent PJF–POF correlation (r = 0.792) exceeded √AVE for PJF (0.744), so PJF did not clearly discriminate from POF by this criterion. For POF, the criterion remained only marginally satisfied, as the same correlation (0.792) was essentially equal to, rather than clearly below, √AVE for POF (0.792). Both figures represent an improvement over the clear violation present before the item was removed, but neither resolves the underlying discriminant-validity concern, which is more pronounced for PJF specifically. The HTMT ratio between PJF and POF was 0.783 (down from 0.806 before item removal), below the conservative 0.85 threshold, indicating that PJF and POF, while conceptually and empirically distinguishable, continue to share a substantial amount of variance. Despite this, the three-factor model merging PJF and POF fit significantly worse than the four-factor model (ΔCFI = 0.017, Δχ2(3) = 193.4, p < 0.001), supporting their retention as separate constructs in the structural model, and the two-factor and one-factor models fit progressively worse still (Table 2).
Table 2.
Competing CFA models (N = 427).
Table 3.
(a) Complete standardized factor loadings, four-factor CFA (N = 427). (b) Composite reliability (CR) and average variance extracted (AVE) by construct (N = 427). (c) Fornell–Larcker discriminant validity matrix (N = 427). (d) Heterotrait–Monotrait (HTMT) ratio matrix (N = 427).
To address the need for fully transparent measurement-model reporting, Table 3(a) reports the complete standardized factor loadings for all 32 indicators across the four latent constructs (replacing the abbreviated loading range reported above with full item-level detail), Table 3(b) reports composite reliability (CR) and average variance extracted (AVE) for each construct, Table 3(c) reports the Fornell–Larcker discriminant-validity matrix, and Table 3(d) reports the HTMT ratios for all construct pairs. All four tables reflect the final 32-item model (POF3 excluded); the full before/after comparison against the original 33-item scale is reported in Appendix A (Table A1).
Item Refinement: Removal of a Weak POF Indicator
In an initial estimation of the four-factor CFA on the full, originally validated 33-item scale, one POF item (item 8, POF3) showed a markedly weak standardized loading (λ = 0.164) and contributed to a discriminant-validity concern between PJF and POF; no coding error was identified, so the item was removed and the resulting 32-item, 4-item-POF measurement model was adopted as the primary model reported throughout this manuscript. Re-estimating the four-factor CFA, the structural path model, the equality-constrained LRTs (H2c, H3c), and the percentile bootstrap (H4a, H4b, H5) both with and without this item showed that overall model fit and every hypothesis conclusion (H1–H5) were unchanged, while POF’s reliability and convergent validity improved (α = 0.781 to 0.869; CR = 0.818 to 0.871; AVE = 0.507 to 0.628); the full before/after comparison is reported in Appendix A (Table A1) for transparency.
4.2. Descriptive Statistics and Correlations
Table 4 presents means, reliability, and correlations. All α ≥ 0.860, with POF’s own reliability (α = 0.869) now comfortably above the conventional 0.70 threshold following the item refinement (α = 0.781 in the original 33-item scale). CL was associated with PJF (r = 0.323), POF (r = 0.486), and TW (r = 0.318), all p < 0.001. PJF–TW (r = 0.432) was numerically larger than POF–TW (r = 0.413), though both were positive and significant, and PJF and POF themselves were highly correlated (r = 0.679, up from r = 0.663 before the weak item was removed, consistent with a cleaner, less attenuated POF composite).
Table 4.
Descriptive statistics, reliability, and correlations (N = 427).
4.3. SEM Path Analysis: Unconstrained Model (M1)
Table 5 presents the unconstrained SEM path model (M1), a fully recursive path model in which PJF, POF, and thriving (the endogenous variables) are each regressed on all of their hypothesized predictors, including the six exogenous control variables (gender, age, education, job rank, tenure) and, for thriving, coaching leadership, PJF, and POF; the PJF–POF residual covariance (B = 0.251, SE = 0.023, p < 0.001) is also freely estimated. With respect to this path structure, M1 imposes no testable restriction on the covariances among the endogenous variables, so χ2 ≈ 0 essentially by construction and conventional incremental fit indices such as CFI, TLI, and RMSEA are not informative here; AIC, BIC, and log-likelihood are reported instead, and these are meaningful for the model comparisons in Table 6. Table 6 reports 21 degrees of freedom for M1. We verified this figure by re-estimating M1 directly in the original software (semopy 2.3.11; output reproduced in the accompanying response letter), which returns DoF = 21, χ2 = 5.77 × 10⁻⁵, and AIC = 48.00, BIC = 145.36, and LogLik ≈ 0.00, exactly matching Table 5’s reported statistics. The nonzero df arises because semopy’s degrees-of-freedom accounting includes the variances and covariances among the six exogenous control variables (6 × 7/2 = 21 moments), which other SEM software (e.g., Mplus or lavaan under the fixed.x = TRUE convention) instead fixes at their sample values and excludes from the χ2/df count; the two conventions fit the identical model and return the identical χ2 ≈ 0, AIC, BIC, and log-likelihood, differing only in how the control-variable covariances are counted toward the nominal df. This difference in bookkeeping does not affect the equality-constrained LRTs reported in Table 6, which compare M2 and M3 against the same M1 baseline under the same convention, so that Δdf = 1 in each comparison regardless of which df convention is used.
Table 5.
SEM path analysis—M1 unconstrained model (N = 427, ML estimation).
Table 6.
SEM equality-constrained LRT comparisons (N = 427).
4.4. SEM Equality-Constrained Model Comparisons: LRTs (H2c and H3c)
Table 6 presents the equality-constrained model comparisons. Constraining the two antecedent-side paths to equality (M2: a_CL-PJF = a_CL-POF, in the unstandardized B metric) significantly degraded model fit compared to M1: LRT Δχ2(1) = 28.30, p < 0.001 (H2c supported). This LRT result confirms that the antecedent-side association with POF (B = 0.439, β = 0.495) is significantly stronger than with PJF (B = 0.266, β = 0.329), with the test explicitly accounting for the PJF–POF residual covariance within the SEM framework.
Constraining the two outcome-side paths to equality (M3: b_PJF → TW = b_POF → TW, in the unstandardized B metric) did not significantly degrade fit: LRT Δχ2(1) = 1.82, p = 0.177 (H3c not supported). Although PJF’s outcome-side coefficient is numerically larger than POF’s (B = 0.324, β = 0.280 vs. B = 0.161, β = 0.153), the equality-constrained LRT did not detect a statistically significant difference between the two, so H3c is not supported: the two outcome-side associations cannot be shown to differ. The use of LRT rather than ad hoc coefficient-comparison tests provides a methodologically defensible basis for both the H2c and H3c conclusions.
4.5. H3b: POF Outcome-Side Association
In the unconstrained M1, POF’s outcome-side association with thriving was positive and statistically significant (B = 0.161, β = 0.153, p = 0.015). H3b is therefore supported at the α = 0.05 threshold: POF retains a reliable positive association with thriving even after controlling for coaching leadership, PJF, and the control variables.
4.6. Bootstrap SEM Indirect Associations (H4a, H4b, H5)
Table 7 presents bootstrap SEM indirect associations (2000-resample percentile bootstrap from M1). The PJF indirect association was reliably different from zero (0.086, 95% CI [0.044, 0.133]), supporting H4a. The POF indirect association was also reliably different from zero (0.072, 95% CI [0.004, 0.148]), supporting H4b. The contrast between the two indirect associations was not significant (Δ = 0.014, 95% CI [−0.092, 0.112]), so H5 is not statistically supported: the analysis did not detect a statistically significant difference between the two indirect association magnitudes. This result neither establishes equivalence nor demonstrates inequality. Because the outcome-side LRT (H3c) also did not detect a significant difference between the PJF and POF paths, the non-significant indirect contrast in H5 is consistent with, rather than independent of, the outcome-side result: coaching leadership reaches thriving through both fit dimensions with indirect associations that are each individually reliable, but whose relative magnitudes this analysis cannot statistically distinguish at the outcome side, even though it reaches POF more strongly than PJF at the antecedent side.
Table 7.
SEM bootstrap indirect associations (N = 427; 2000-resample percentile bootstrap).
4.7. Incremental R2 and Robustness
Incremental R2 decomposition (regression-based) shows that both fit dimensions contribute unique variance to thriving: PJF explained 4.1% unique variance above POF (ΔR2 = 0.041, F(1,415) = 22.68, p < 0.001) and POF explained 1.0% unique variance above PJF (ΔR2 = 0.010, F(1,415) = 5.78, p = 0.017), consistent with the outcome-side LRT (H3c) in showing that PJF’s unique contribution is larger but POF’s is also reliably non-zero. Sub-dimension robustness analyses (2000-resample percentile bootstrap) showed that the POF indirect association was significant for the vitality sub-dimension (0.090, 95% CI [0.023, 0.166]) but not for learning (0.052, 95% CI [−0.025, 0.138]), while the PJF indirect association was significant for both vitality (0.085, 95% CI [0.040, 0.137]) and learning (0.087, 95% CI [0.040, 0.141]). As with the overall outcome-side comparison (H3c, H5), one path reaching significance and the other not reaching significance individually does not by itself establish that the two sub-dimension associations differ from one another; a direct paired-bootstrap contrast test was therefore conducted for each fit dimension. Neither contrast was statistically significant: the difference between POF’s vitality and learning indirect associations was not reliably different from zero (Δ = 0.036, 95% CI [−0.022, 0.092]), and likewise for PJF (Δ = −0.002, 95% CI [−0.035, 0.032]). This sub-dimension pattern should therefore be read as suggestive rather than statistically confirmed, and is discussed with this caveat in Section 5.4. Table 8 summarizes the results of all hypothesis tests reported in this study.
Table 8.
Hypothesis test summary.
5. Discussion
Several interpretive points merit explicit attention before turning to the findings in detail. Because the data are correlational, sequencing language such as mediates has been avoided in favor of association-based framing throughout this discussion, and the relations examined here are best understood as a hypothesized process structure linking coaching leadership, fit perceptions, and thriving rather than as an empirically demonstrated causal chain, a limitation addressed further in Section 5.6. The stage-specific extension offered in this study does not propose a new theoretical framework but instead applies the differential-validity logic already established within person–environment fit theory to a new empirical context. Its contribution lies in three features that distinguish it from prior single-variable studies: the simultaneous estimation of PJF and POF within one parallel indirect-effect model, the documentation of a clear antecedent-side asymmetry whereby coaching leadership is more closely tied to POF than to PJF, and the finding that, once this antecedent-side asymmetry is accounted for, both fit dimensions carry a reliably positive outcome-side association with thriving—individually significant for both PJF and POF, and with a reliably non-zero total indirect association for each—even though the analysis did not detect a statistically significant difference between their magnitudes. Recent reviews of person–environment fit research (A. Kristof-Brown et al., 2023; Vleugels et al., 2023) have explicitly called for this kind of within-study comparison, underscoring the relevance of the approach taken here. This within-study comparison, together with the equality-constrained LRT approach and the genuine three-wave design described above, is what distinguishes the present study’s contribution from prior single-fit-dimension research.
Several results also warrant precise interpretation. POF’s association with thriving remained statistically significant even after PJF was included in the same model (β = 0.153, p = 0.015), indicating that POF retains an independent association with thriving net of its considerable overlap with PJF (r = 0.679); this indicates that POF’s association with thriving is not simply an artifact of its overlap with PJF, although this single result should not be overinterpreted given the measurement limitations discussed in Section 5.6. At the same time, the non-significant contrast between the PJF and POF indirect associations (H5) and the non-significant outcome-side LRT (H3c) should not be read as evidence that the two pathways are equivalent, since the corresponding confidence intervals do not rule out a meaningful difference either; the more accurate conclusion is that these comparisons remain inconclusive rather than confirmatory of either possibility, a point developed further in Section 5.1. Common method bias remains a concern inherent to single-source, self-report designs, and the procedural and statistical safeguards applied here, including the use of workplace cooperation as a theoretically distinct marker variable, reduce rather than eliminate this concern; thriving was assessed via self-report because vitality and learning are internal experiences that cannot be reliably observed by supervisors. The cultural explanation offered for the stronger antecedent-side POF association, discussed in Section 5.2, should likewise be treated as a plausible post hoc interpretation rather than a directly tested mechanism, since power distance, collectivism, and the content of coaching conversations were not measured in this study. Finally, although the sample was drawn through convenience sampling from a single national context, it spanned a range of hierarchical levels, ages, and education levels within the Korean workforce, lending it reasonable internal heterogeneity even as cross-national replication with random sampling remains necessary to establish the generalizability of these patterns, as discussed in Section 5.6.
5.1. Core Findings from the Equality-Constrained Comparisons
Three findings emerge from the equality-constrained comparisons used to test H2c, H3c, and H5. The first two (H2c, H3c) rest on SEM likelihood ratio tests (LRTs) that explicitly account for the PJF–POF residual covariance; the third (H5) rests on a percentile bootstrap contrast of the indirect associations, a distinct procedure that does not involve a χ2 statistic or degrees of freedom.
First, coaching leadership’s antecedent-side association with POF is significantly stronger than with PJF. This was established by the SEM equality-constrained LRT (Δχ2(1) = 28.30, p < 0.001, H2c), which accounts for the PJF–POF residual covariance within the correctly specified path model. By freely estimating the PJF–POF residual covariance (B = 0.251, p < 0.001) in M1 and then imposing the equality constraint on the unstandardized antecedent-side paths in M2, the LRT tests the equality claim within a model that already properly accounts for the correlation structure of the disturbances. The Δχ2(1) = 28.30 result indicates that coaching leadership’s antecedent-side associations with PJF and POF are not equal, with the POF path roughly 65% larger in raw metric (B = 0.439 vs. B = 0.266).
Second, and in contrast to the antecedent side, PJF’s outcome-side association with thriving could not be shown to differ significantly from POF’s. The LRT for M3 vs. M1 (Δχ2(1) = 1.82, p = 0.177, H3c) did not reach significance, even though PJF’s raw coefficient is numerically larger (B = 0.324 vs. B = 0.161). Both paths were individually significant (H3a: p < 0.001; H3b: p = 0.015), so the appropriate interpretation is not that POF is unrelated to thriving, but that the present data do not support the claim that PJF’s association is reliably stronger than POF’s once both are estimated simultaneously and the equality test is applied to the correctly specified, correlation-adjusted model.
Third, H5—which predicted that the indirect association between coaching leadership and thriving through PJF would be stronger than through POF—is not supported: the bootstrap contrast between the two indirect associations was not significant (Δ = 0.014, 95% CI [−0.092, 0.112]). Both the PJF indirect association (H4a: 0.086, 95% CI [0.044, 0.133]) and the POF indirect association (H4b: 0.072, 95% CI [0.004, 0.148]) were reliably different from zero, and the confidence interval for their contrast rules out neither equivalence nor a meaningful difference, so the appropriate conclusion is that this comparison remains inconclusive rather than that the two pathways are equivalent. Together, these three findings share a common statistical foundation despite relying on two distinct procedures: because M1 freely estimates the PJF–POF residual covariance (B = 0.251, p < 0.001), both the equality-constrained LRTs used for H2c and H3c and the bootstrap resampling procedure underlying H5 are computed from a model that already conditions on the correlated structure of the PJF and POF disturbances, so the pattern of results obtained—the significant and non-significant Δχ2 values for H2c and H3c, and the non-significant bootstrap contrast for H5—cannot be attributed to a violation of the independence assumption that would otherwise complicate simple coefficient-comparison tests. Read together, the results depict an antecedent-side process in which coaching leadership reaches POF more readily than PJF, followed by an outcome-side process in which both fit dimensions carry thriving forward, with the analysis unable to statistically distinguish the magnitude of their respective contributions.
5.2. Korean Context and Post Hoc Interpretation
The stronger antecedent-side association with POF may reflect features of Korean organizational contexts, where Confucian-influenced relational norms emphasize organizational belonging and collective identity (Hofstede, 1980; Kim et al., 1994). This is offered as one plausible post hoc interpretation. The study did not measure power distance, collectivism, or coaching conversation content, so the cultural explanation cannot be directly tested. Cross-national replication with explicit cultural measures is needed.
5.3. Theoretical Implications
These findings contribute to the three bodies of literature motivating this study (Section 1). For person–environment fit theory, the results provide one of the few simultaneous, formally tested comparisons of a common antecedent’s differential activation of PJF and POF: rather than assuming, as much prior single-fit-dimension research implicitly does, that an antecedent such as coaching leadership relates to demands–abilities and needs–supplies fit perceptions to a similar degree, the equality-constrained LRT (H2c) shows formally that coaching leadership is more strongly associated with POF, consistent with coaching leadership operating primarily through the relational, value-congruence-relevant behaviors captured by needs–supplies theorizing (A. L. Kristof-Brown et al., 2005; A. Kristof-Brown et al., 2023) rather than through the task-focused, ability-relevant behaviors more closely tied to demands–abilities fit (Edwards, 1991; French et al., 1982). At the same time, the outcome-side LRT (H3c) did not detect a significant difference between PJF’s and POF’s associations with thriving, which is consistent with the view that once fit perceptions are formed, their downstream consequences for broad, self-reinforcing employee states such as thriving (Spreitzer et al., 2005) may converge more than their antecedents do—a stage-specific pattern that a single cross-sectional comparison of PJF and POF could not have distinguished from either uniform convergence or uniform differentiation. For the coaching leadership literature, this study extends work on coaching leadership’s proximal attitudinal and behavioral correlates (Frese & Fay, 2001; Grant, 2014; McCarthy & Milner, 2013) by identifying person–environment fit perceptions as a specific, formally supported mechanism linking coaching leadership to a downstream thriving outcome, and by showing that this mechanism operates unevenly across fit dimensions at the antecedent stage. For the thriving literature, the results extend Spreitzer et al.’s (2005) thriving framework by identifying coaching leadership, operating through PJF and POF, as a leadership-based antecedent of thriving, complementing the more proximal motivational and resource-based antecedents emphasized in prior thriving research (Kleine et al., 2019) and suggesting that fit-based mechanisms deserve further attention alongside them.
5.4. Sub-Dimension Specificity: Vitality vs. Learning
Robustness analyses showed the POF indirect association is significant for vitality (0.090, 95% CI [0.023, 0.166]) but not for learning (0.052, 95% CI [−0.025, 0.138]), while the PJF indirect association is significant for both vitality (0.085, 95% CI [0.040, 0.137]) and learning (0.087, 95% CI [0.040, 0.141]). This pattern persists even though the overall (vitality + learning combined) POF indirect association is also significant (H4b), and is consistent with the interpretation that POF’s value-congruence mechanism may contribute to thriving primarily through the energetic belonging-sense underlying vitality, while PJF’s demands–abilities mechanism broadly supports both vitality and learning. This interpretation should, however, be treated as suggestive rather than statistically confirmed: a direct paired-bootstrap contrast between the vitality and learning indirect associations (Section 4.7) was not statistically significant for either fit dimension (POF: Δ = 0.036, 95% CI [−0.022, 0.092]; PJF: Δ = −0.002, 95% CI [−0.035, 0.032]), so one sub-dimension association reaching significance while the other does not is not, by itself, evidence that the two sub-dimension associations actually differ from one another.
5.5. Practical Implications
The pattern of results carries several practical implications for coaching programs in Korean organizations. Because coaching leadership appears more strongly associated with POF than with PJF at the antecedent side, coaching conversations in practice may already lean naturally toward the value-alignment topics that strengthen employees’ sense of fit with the organization. At the same time, because both PJF and POF show reliable outcome-side associations with thriving whose magnitudes could not be shown to differ statistically (though this does not establish that they are equivalent), organizations should not assume that their apparent natural strength in building POF is sufficient on its own: coaching programs designed to promote employee thriving should also cultivate explicit attention to the job-related capabilities and demands that connect employees to their specific roles, since both value-alignment and role-capability pathways were each individually associated with thriving, even though their relative contributions could not be statistically distinguished here. Doing so may help ensure that coaching interventions engage both the belonging-based and competence-based pathways through which thriving appears to develop.
5.6. Limitations
This study has several limitations that should be considered when interpreting the findings. First, although coaching leadership, PJF and POF, and thriving were measured at three temporally separated waves (T1, T2, and T3, respectively), which establishes the temporal precedence assumed in the hypothesized process structure, participants were not randomly assigned to levels of coaching leadership and reciprocal or reverse relations across waves cannot be fully ruled out, so the associations reported here still fall short of fully causal evidence; cross-lagged replication that explicitly models reciprocal paths across additional measurement occasions would strengthen causal inference further. Second, although a range of procedural and statistical safeguards was used to address common method bias, all variables were measured from the same source, so same-source measurement remains a limitation that these procedures reduce rather than eliminate. Third, because the sample was drawn exclusively from Korean employees, the generalizability of the findings to other cultural and organizational contexts is limited, and cross-national replication would be needed to establish how broadly the pattern of results applies. Fourth, one item from the original five-item POF scale showed a markedly weak standardized loading (λ = 0.164) and was removed prior to the analyses reported in this manuscript, following the item-refinement procedure, this improved POF’s reliability (α = 0.781 to 0.869) and discriminant validity, but the PJF–POF discriminant-validity concern was only partly resolved: the Fornell–Larcker criterion remains violated for PJF (latent r = 0.792 vs. √AVE = 0.744 for PJF) and only marginally, essentially tied, satisfied for POF (r = 0.792 vs. √AVE = 0.792 for POF) even after item removal, and HTMT (0.783) remained below but not far from the conservative 0.85 threshold; the competing-CFA evidence that the two constructs are empirically distinguishable (Section 4.1) is retained here as complementary evidence, not as a substitute for the Fornell–Larcker violation for PJF, which is acknowledged as a genuine measurement limitation; together these results suggest PJF and POF, while distinguishable, continue to be measured with only moderate discriminant separation, and future work would benefit from further refinement of the POF item set or additional discriminant-validity evidence (e.g., externally validated behavioral or performance correlates that should relate differently to PJF and POF). Because this item removal changes the reported scale from the originally validated five-item instrument, we also note this as a deviation from the original validated measure that future replications should be aware of. Fifth, the structural path model (M1–M3, Table 5) used coaching leadership, PJF, POF, and thriving as composite (mean) scores of their constituent items, rather than as latent factors carrying their full indicator sets into the structural stage; this two-step approach, in which the four-factor CFA (Section 4.1, Table 2) establishes and validates the measurement model separately from the structural path estimates reported in Table 5, is common in applied SEM research but does not propagate indicator-level measurement error into the path coefficients the way a fully latent, one-step SEM would; this should be considered when interpreting the precision of the coefficients in Table 5, and a fully latent structural model is a natural target for replication. Sixth, the significant direct association between coaching leadership and thriving (β = 0.137) suggests that the present model does not fully capture the mechanisms linking coaching leadership to thriving, and constructs such as psychological safety (Edmondson & Lei, 2014), autonomy support (Deci & Ryan, 2008), and leader–member exchange (Graen & Uhl-Bien, 1995) warrant examination as additional indirect pathways in future research. Relatedly, the sub-dimension analysis in Section 5.4 found that POF’s indirect association with thriving was significant for vitality but not for learning; a formal paired-bootstrap contrast showed this difference was not itself statistically significant (Section 4.7), so this pattern should be treated as suggestive rather than confirmed and warrants replication with a larger sample better powered to detect sub-dimension differences. Finally, post hoc power analysis (Section Statistical Power and Sample Size Justification) indicated that the design was well powered to detect the direct and antecedent-side associations and the PJF indirect association, moderately powered for the POF outcome-side path and indirect association, and poorly powered for the H5 bootstrap contrast between the PJF and POF indirect associations; the non-significant H3c and H5 results should therefore be interpreted as inconclusive given limited power to detect anything but a large difference, rather than as evidence that the two fit dimensions’ outcome-side roles are equivalent, and studies with larger samples or more precise indirect-effect estimators are needed to test this question with adequate power.
6. Conclusions
This study examined a parallel indirect-effect model linking coaching leadership to employee thriving through PJF and POF, applying a stage-specific extension of PE fit theory to Korean organizational contexts. Structural equation modeling with equality-constrained LRTs, applied to coaching leadership, PJF and POF, and thriving as measured across three temporally separated waves (T1, T2, and T3), provided a statistically appropriate set of tests for this time-lagged design, subject to the measurement and design limitations discussed in Section 5.6. LRT M2 vs. M1 confirmed that coaching leadership’s antecedent-side association with POF (β = 0.495) is significantly stronger than with PJF (β = 0.329), Δχ2(1) = 28.30, p < 0.001 (H2c). LRT M3 vs. M1 did not detect a significant difference between PJF’s outcome-side association with thriving (β = 0.280) and POF’s (β = 0.153), Δχ2(1) = 1.82, p = 0.177 (H3c not supported); both associations were individually significant. Bootstrap SEM indirect effects confirmed that both the PJF indirect association (0.086, 95% CI [0.044, 0.133]; H4a) and the POF indirect association (0.072, 95% CI [0.004, 0.148]; H4b) are reliably different from zero. The bootstrap contrast between the indirect associations was not significant (Δ = 0.014, 95% CI [−0.092, 0.112]), so H5 is not supported: the analysis did not detect a significant difference in total indirect association magnitudes, and no claim of equivalence is warranted either. PJF and POF thus show a clear antecedent-side asymmetry favoring POF, but their outcome-side and total indirect associations with thriving could not be shown to differ. By estimating both fit dimensions simultaneously within a single equality-constrained SEM framework, and by doing so across a genuine three-wave time-lagged design, this study offers a useful, though observational, comparison of a differentiation that prior single-fit research could only assume rather than test directly; given the measurement model’s below-threshold overall fit and the structural model’s reliance on composite indicators (Section 5.6), these findings are best interpreted as associations rather than as definitive methodological evidence, with the differentiation appearing more pronounced at the antecedent side of the process than at the outcome side.
Author Contributions
Conceptualization, H.-O.L.; Data Curation, S.-H.Y.; Formal Analysis, D.C.; Writing—Original Draft, H.-O.L.; Writing—Review and Editing, H.-O.L., S.-H.Y., and D.C. All authors have read and agreed to the published version of the manuscript.
Funding
This research received no external funding.
Institutional Review Board Statement
The study was conducted in accordance with the Declaration of Helsinki and approved by the IRB of Kyungsung University (No. 7001066-202504-HR-021; approved 16 April 2025). This study is exempted from full review for minimal-risk, anonymous survey research.
Informed Consent Statement
Informed consent was obtained from all participants.
Data Availability Statement
Data are available upon request.
Conflicts of Interest
The authors declare no conflicts of interest.
Appendix A
For full transparency, Table A1 reports the complete measurement and structural comparison between the original, validated 33-item POF scale (POF3 included) and the final 32-item primary model reported throughout this manuscript (POF3 excluded; see Table A1).
Table A1.
Measurement and Structural Model Before and After Removing the Weak POF Item (POF3): Original 33-Item Scale vs. Final 32-Item Primary Model, N = 427.
References
- Billsberry, J., & Vleugels, W. (2023). A consolidation of competing logics on selecting for fit. Academy of Management Perspectives, 37, 220–238. [Google Scholar] [CrossRef] [Scilit]
- Brislin, R. W. (1970). Back-translation for cross-cultural research. Journal of Cross-Cultural Psychology, 1, 185–216. [Google Scholar] [CrossRef] [Scilit]
- Cable, D. M., & DeRue, D. S. (2002). The convergent and discriminant validity of subjective fit perceptions. Journal of Applied Psychology, 87, 875–884. [Google Scholar] [CrossRef] [Scilit] [PubMed]
- Cai, D., Cai, Y., Sun, Y., & Ma, J. (2018). Linking empowering leadership and employee work engagement: The effects of person-job fit, person-group fit, and proactive personality. Frontiers in Psychology, 9, 1304. [Google Scholar] [CrossRef] [Scilit] [PubMed]
- Caplan, R. D. (1987). Person–environment fit theory and organizations. Journal of Vocational Behavior, 31, 248–267. [Google Scholar] [CrossRef] [Scilit]
- Chatman, J. A. (1989). Improving interactional organizational research: A model of P–O fit. Academy of Management Review, 14, 333–349. [Google Scholar] [CrossRef] [Scilit]
- Cheung, G. W., & Rensvold, R. B. (2002). Evaluating goodness-of-fit indexes for testing measurement invariance. Structural Equation Modeling, 9, 233–255. [Google Scholar] [CrossRef] [Scilit]
- Deci, E. L., & Ryan, R. M. (2008). Self-determination theory. Canadian Psychology, 49, 182–185. [Google Scholar]
- Edmondson, A. C., & Lei, Z. (2014). Psychological safety: History, renaissance, and future. Annual Review of Organizational Psychology and Organizational Behavior, 1, 23–43. [Google Scholar] [CrossRef] [Scilit]
- Edwards, J. R. (1991). Person–job fit: A conceptual integration, literature review, and methodological critique. International Review of Industrial and Organizational Psychology, 6, 283–357. [Google Scholar]
- Edwards, J. R., & Billsberry, J. (2010). Testing a multidimensional theory of person–environment fit. Journal of Managerial Issues, 22, 476–493. [Google Scholar]
- Ellinger, A. D., Ellinger, A. E., & Keller, S. B. (2003). Supervisory coaching behavior, employee satisfaction, and warehouse employee performance. Human Resource Development Quarterly, 14, 435–458. [Google Scholar] [CrossRef] [Scilit]
- Fornell, C., & Larcker, D. F. (1981). Evaluating structural equation models. Journal of Marketing Research, 18, 39–50. [Google Scholar] [CrossRef] [Scilit]
- French, J. R. P., Caplan, R. D., & Harrison, R. V. (1982). The mechanisms of job stress and strain. Wiley. [Google Scholar]
- Frese, M., & Fay, D. (2001). Personal initiative: An active performance concept for work in the 21st century. Research in Organizational Behavior, 23, 133–187. [Google Scholar] [CrossRef] [Scilit]
- Fritz, M. S., & MacKinnon, D. P. (2007). Required sample size to detect the mediated effect. Psychological Science, 18, 233–239. [Google Scholar] [CrossRef] [Scilit] [PubMed]
- Graen, G. B., & Uhl-Bien, M. (1995). Relationship-based approach to leadership: LMX theory. Leadership Quarterly, 6, 219–247. [Google Scholar] [CrossRef] [Scilit]
- Grant, A. M. (2014). Autonomy support, relationship satisfaction and goal focus in the coach–coachee relationship. Coaching: An International Journal of Theory, Research and Practice, 7, 18–38. [Google Scholar] [CrossRef] [Scilit]
- Hagen, M. S. (2012). Managerial coaching: A review of the literature. Performance Improvement Quarterly, 24, 17–39. [Google Scholar] [CrossRef] [Scilit]
- Hayes, A. F. (2022). Introduction to mediation, moderation, and conditional process analysis (3rd ed.). Guilford Press. [Google Scholar]
- Hofstede, G. (1980). Culture’s consequences. Sage. [Google Scholar]
- Ives, Y. (2008). What is ‘coaching’? An exploration of conflicting paradigms. International Journal of Evidence Based Coaching and Mentoring, 6, 100–113. [Google Scholar] [CrossRef] [Scilit]
- Kim, U., Triandis, H. C., Kâğitçibaşi, Ç., Choi, S.-C., & Yoon, G. (Eds.). (1994). Individualism and collectivism. Sage. [Google Scholar]
- Kleine, A. K., Rudolph, C. W., & Zacher, H. (2019). Thriving at work: A meta-analysis. Journal of Organizational Behavior, 40, 973–999. [Google Scholar] [CrossRef] [Scilit]
- Kristof, A. L. (1996). Person-organization fit: An integrative review of its conceptualizations, measurement, and implications. Personnel Psychology, 49, 1–49. [Google Scholar] [CrossRef] [Scilit]
- Kristof-Brown, A., Schneider, B., & Su, R. (2023). Person–organization fit theory and research: Conundrums, conclusions, and calls to action. Personnel Psychology, 76, 375–412. [Google Scholar] [CrossRef] [Scilit]
- Kristof-Brown, A. L., Zimmerman, R. D., & Johnson, E. C. (2005). Consequences of individuals’ fit at work: A meta-analysis. Personnel Psychology, 58, 281–342. [Google Scholar] [CrossRef] [Scilit]
- Lauver, K. J., & Kristof-Brown, A. (2001). Distinguishing between PJ and PO fit. Journal of Vocational Behavior, 59, 454–470. [Google Scholar]
- Lindell, M. K., & Whitney, D. J. (2001). Accounting for common method variance in cross-sectional designs. Journal of Applied Psychology, 86, 114–121. [Google Scholar] [CrossRef] [Scilit] [PubMed]
- McCarthy, G., & Milner, J. (2013). Managerial coaching: Challenges, opportunities and training. Journal of Management Development, 32, 768–779. [Google Scholar] [CrossRef] [Scilit]
- Mitchell, T. R., & James, L. R. (2001). Building better theory: Time and the specification of when things happen. Academy of Management Review, 26, 530–547. [Google Scholar] [CrossRef] [Scilit]
- O’Reilly, C. A., Chatman, J., & Caldwell, D. F. (1991). People and organizational culture: A profile comparison approach. Academy of Management Journal, 34, 487–516. [Google Scholar] [CrossRef] [Scilit] [PubMed]
- Organ, D. W. (1988). Organizational citizenship behavior. Lexington Books. [Google Scholar]
- Passmore, J., & Fillery-Travis, A. (2011). A critical review of executive coaching research. Coaching: An International Journal of Theory, Research and Practice, 4, 70–88. [Google Scholar] [CrossRef] [Scilit]
- Podsakoff, P. M., MacKenzie, S. B., Lee, J. Y., & Podsakoff, N. P. (2003). Common method biases in behavioral research. Journal of Applied Psychology, 88, 879–903. [Google Scholar] [CrossRef] [Scilit] [PubMed]
- Porath, C., Spreitzer, G., Gibson, C., & Garnett, F. G. (2012). Thriving at work: Toward its measurement, construct validation, and theoretical refinement. Journal of Organizational Behavior, 33, 250–275. [Google Scholar] [CrossRef] [Scilit]
- Preacher, K. J., & Hayes, A. F. (2008). Asymptotic and resampling strategies for comparing indirect effects. Behavior Research Methods, 40, 879–891. [Google Scholar] [CrossRef] [Scilit] [PubMed]
- Rudolph, C. W., Schmitt, A., & Zacher, H. (2022). Thriving at work: An investigation of the independent and joint effects of vitality and learning on employee health. European Journal of Work and Organizational Psychology, 32, 95–106. [Google Scholar] [CrossRef] [Scilit]
- Saks, A. M., & Ashforth, B. E. (1997). A longitudinal investigation of PJ fit and work outcomes. Personnel Psychology, 50, 395–426. [Google Scholar] [CrossRef] [Scilit]
- Sekiguchi, T. (2004). P–O fit and P–J fit in employee selection. Osaka Keidai Ronshu, 54, 179–196. [Google Scholar]
- Spector, P. E. (2006). Method variance in organizational research. Organizational Research Methods, 9, 221–232. [Google Scholar] [CrossRef] [Scilit]
- Spreitzer, G., Sutcliffe, K., Dutton, J., Sonenshein, S., & Grant, A. M. (2005). A socially embedded model of thriving at work. Organization Science, 16, 537–549. [Google Scholar] [CrossRef] [Scilit]
- Stowell, S. J. (1986). Leadership and the coaching process in organizations [Doctoral dissertation, University of Utah]. [Google Scholar]
- Sugiono, E., Efendi, S., & Hendryadi. (2023). Linking talent management to thriving at work and employees’ voice behavior: The moderating role of person–organization fit. Cogent Social Sciences, 9, 2244309. [Google Scholar] [CrossRef] [Scilit]
- Tang, L., Shi, M., Liu, Y., Liu, Y., & Yang, B. (2024). Building a committed workforce: The synergistic effects of coaching leadership, organizational self-esteem, and learning goal orientation. Frontiers in Psychology, 15, 1423540. [Google Scholar] [CrossRef] [Scilit] [PubMed]
- Verquer, M. L., Beehr, T. A., & Wagner, S. H. (2003). A meta-analysis of P–O fit and work attitudes. Journal of Vocational Behavior, 63, 473–489. [Google Scholar] [CrossRef] [Scilit]
- Vleugels, W., & Flatau-Harrison, H. (2023). Curvilinear relationships in person–environment fit research: Is there evidence for a too-much-of-a-good-thing effect? Journal of Occupational and Organizational Psychology, 96, 669–677. [Google Scholar] [CrossRef] [Scilit]
- Vleugels, W., Verbruggen, M., De Cooman, R., & Billsberry, J. (2023). A systematic review of temporal person–environment fit research: Trends, developments, obstacles, and opportunities for future research. Journal of Organizational Behavior, 44, 376–398. [Google Scholar] [CrossRef] [Scilit]
- Xi, R., Yu, K., Ge, Y., & Cao, P. (2022). Ethical leadership and followers’ career satisfaction, mobility, and promotability: A P–E fit perspective. Frontiers in Psychology, 13, 927146. [Google Scholar] [CrossRef] [Scilit] [PubMed]
- Zellner, A. (1962). An efficient method of estimating seemingly unrelated regressions and tests for aggregation bias. Journal of the American Statistical Association, 57, 348–368. [Google Scholar] [CrossRef] [Scilit]
- Zeng, P., & Hu, X. (2024). A study of the psychological mechanisms of job burnout: Implications of person–job fit and person–organization fit. Frontiers in Psychology, 15, 1351032. [Google Scholar] [CrossRef] [Scilit] [PubMed]
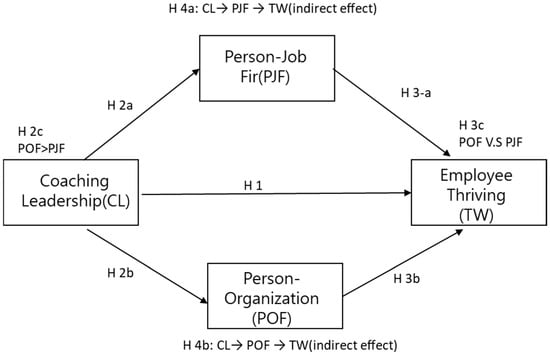
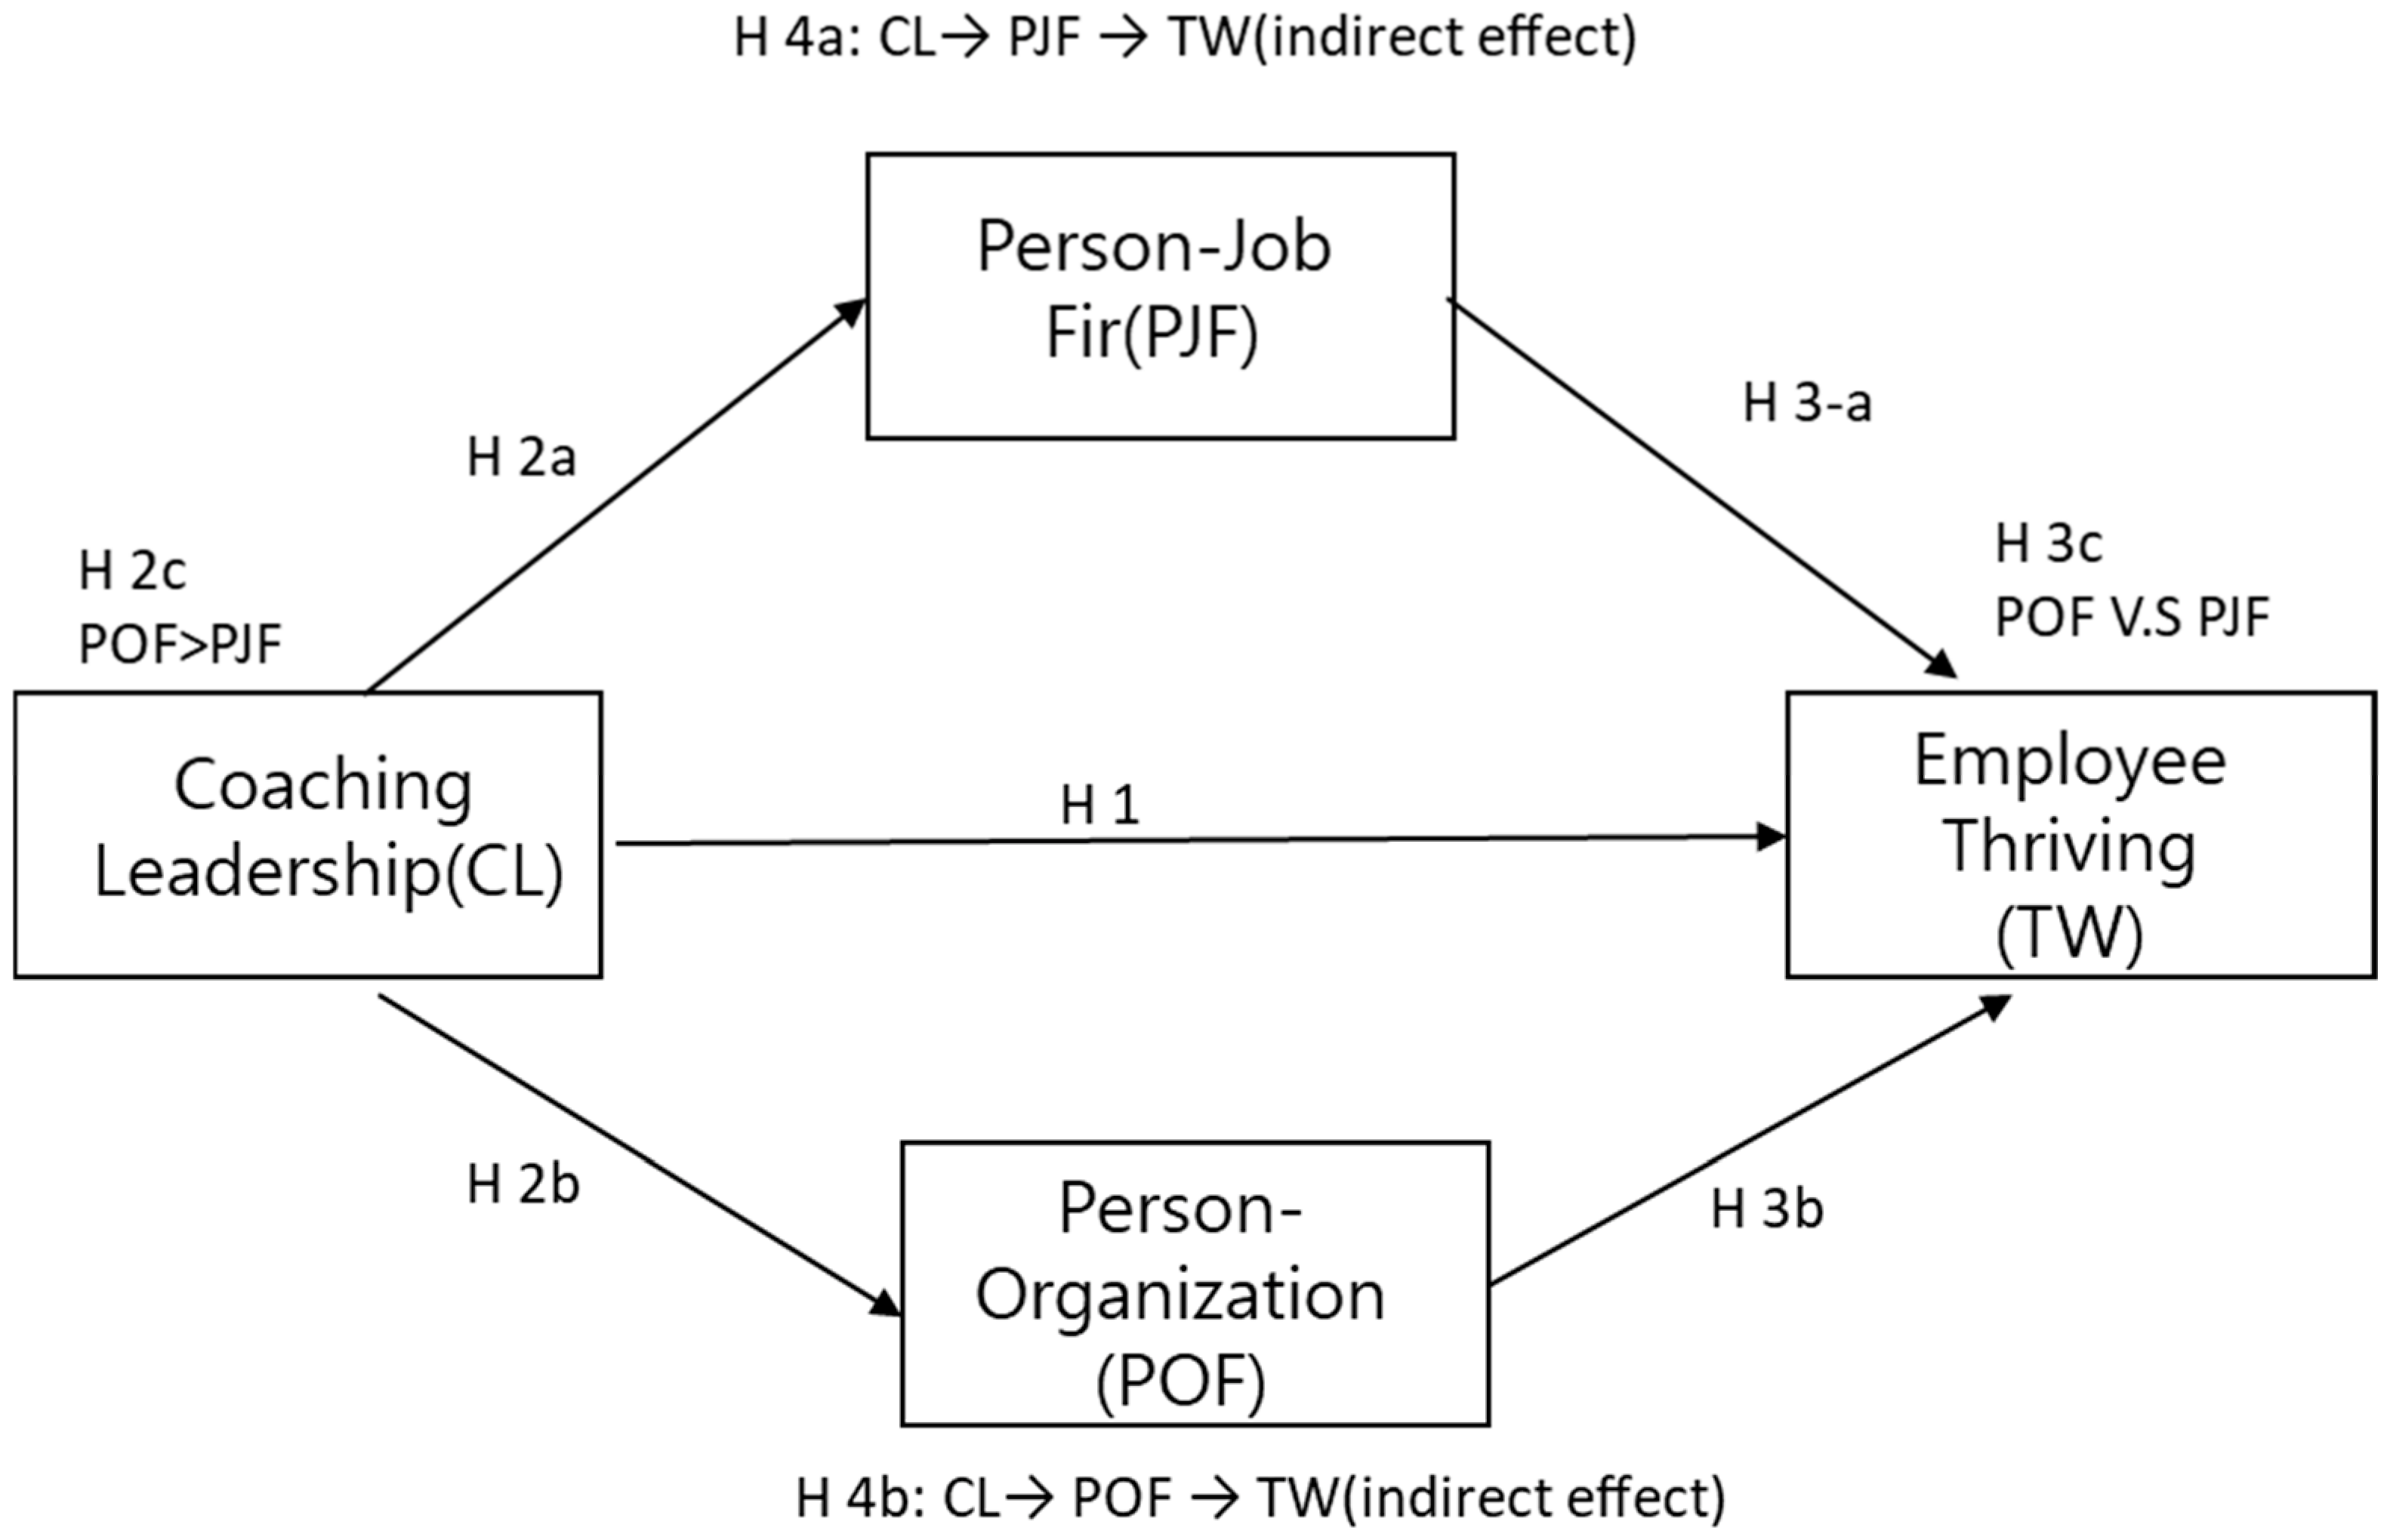

Disclaimer/Publisher’s Note: The statements, opinions and data contained in all publications are solely those of the individual author(s) and contributor(s) and not of MDPI and/or the editor(s). MDPI and/or the editor(s) disclaim responsibility for any injury to people or property resulting from any ideas, methods, instructions or products referred to in the content. |
© 2026 by the authors. Licensee MDPI, Basel, Switzerland. This article is an open access article distributed under the terms and conditions of the Creative Commons Attribution (CC BY) license.