


Abstract
Whether responses to different opportunity structures vary by social value orientation (SVO), particularly when individuals have more opportunities than others, remains unclear. This study examined this question in 208 Chinese undergraduates (47.60% female) aged 18 to 23 years. Using the triple-dominance matrix, participants were classified as prosocials or proselfs. Each participant encountered one of the three opportunity structures: equality, disadvantageous inequality, and advantageous inequality. Participants rated the fairness of their assigned opportunity structure and indicated their willingness to continue the game under it. Results showed that fairness perceptions and willingness to continue were highest under equality, followed by advantageous inequality, and lowest under disadvantageous inequality. Compared with proselfs, prosocials perceived advantageous inequality as less fair and reported lower willingness to continue under this condition, but reported higher willingness to continue under disadvantageous inequality. An additional analysis indicated that the discrepancy between fairness perceptions and willingness to continue was larger under advantageous inequality, especially among proselfs. These findings demonstrate that prosocials and proselfs differ in their responses to opportunity inequality, extending research on SVO beyond outcome allocation.
1. Introduction
Fairness in resource allocation is often conceptualized in terms of procedures and outcomes, yet a more comprehensive account also involves the initial conditions from which individuals begin. This aspect, opportunity equity, is distinct from procedural fairness, which concerns the fairness of the rules and processes used to determine allocation outcomes (Cooney et al., 2016; Thibaut & Walker, 1975), and from outcome fairness, which concerns the distribution of final benefits (Adams, 1963; Fehr & Schmidt, 1999). Opportunity equity concerns whether, compared with others, people have relatively equal starting points and opportunities to access resources, participate in competition, and pursue personal development (Aoki et al., 2014; Arneson, 1989; Rawls, 1971; You et al., 2023). Opportunity equity thus emphasizes equality of expected opportunities rather than actual returns (Saito, 2013). While equal opportunities do not guarantee equal outcomes (Aoki et al., 2015; Q. Li et al., 2025), they render subsequent outcome differences more acceptable (Bolton et al., 2005; Trautmann & van de Kuilen, 2016).
In modern society, opportunity equity is widely valued in multiple domains such as education, employment, health care, and political participation (Andreoli et al., 2019; Ding et al., 2022; Zhou et al., 2022). In education, for instance, improving equity in access to high-quality early education has been linked to better later academic achievement and educational attainment (Gray-Lobe et al., 2023). Nevertheless, opportunity structures in the real world are various, leading individuals not only to face equality (having as many opportunities as others) but also disadvantageous inequality (i.e., having fewer opportunities than others) or advantageous inequality (i.e., having more opportunities than others) (Long et al., 2022; Sun et al., 2018).
In the absence of social comparison, having more opportunities is often rewarding because greater choice enhances felt autonomy and control, even when additional options do not improve outcomes (Bown et al., 2003; Fujiwara et al., 2013; Leotti & Delgado, 2011). This preference reflects opportunity-based self-interest, which centers on one’s relative opportunities rather than material gain per se (Cropanzano et al., 2005). In social-comparison contexts, however, this preference may conflict with fairness. Under equality and disadvantageous inequality, the two motives do not conflict: equality is fair and does not disadvantage the self, whereas disadvantageous inequality is unfair and disadvantages the self. Only under advantageous inequality do the two motives directly conflict, because the structure benefits the self while violating the norm of equal opportunity. This makes responses to advantageous inequality particularly revealing, as they directly reflect the trade-off between maintaining fairness and pursuing opportunity-based self-interest.
Prior behavioral research, however, has mainly examined acceptance or rejection under equality and disadvantageous inequality (e.g., Q. Li et al., 2025; Yang et al., 2022), whereas behavioral responses under advantageous inequality remain largely unexamined. This limits the ability to distinguish whether such responses are driven by fairness concerns or opportunity-based self-interest. Moreover, how individuals resolve this trade-off may depend on stable social preferences, which have rarely been considered in this context. Social value orientation (SVO), reflecting individual differences in prosocial versus proself orientations (Murphy & Ackermann, 2014; Van Lange, 1999), is well suited to capture such preferences. The present study therefore examines whether and how SVO moderates responses to opportunity equality, disadvantageous inequality, and advantageous inequality.
1.1. Responses Under Different Opportunity Structures
Early research on fairness primarily documented that individuals are averse to unfair outcomes and are willing to sacrifice personal gain to punish unfairness or avoid receiving less than others (Blake et al., 2015; Fehr & Schmidt, 1999; McAuliffe et al., 2017). More recently, increasing attention has shifted to opportunity equity. This line of research has manipulated the number of opportunities available to participants and others and consistently found that individuals typically perceive equality as fairer than inequality, with advantageous inequality considered less fair than equality, and disadvantageous inequality perceived as the least fair (Long et al., 2022; Sun et al., 2018; Yang et al., 2022; You et al., 2023). This pattern suggests a general preference for equal opportunities (Aoki et al., 2015; Arneson, 1989), although the asymmetry between advantageous and disadvantageous inequality also leaves room for self-interested considerations.
Beyond perceptions, prior research has also examined behavioral reactions, such as acceptance or rejection of opportunity structures. When opportunities are equal, 5-year-old children accept unequal resource distributions; when opportunities are unequal, they judge the situation as unfair and seek to change the rules (Grocke et al., 2015). Similarly, 6- and 8-year-olds generally prefer equitable over inequitable opportunity allocations, and 8-year-olds are more likely to reject unequal opportunities than 6-year-olds (Shaw & Olson, 2014). Similar patterns have also been found among adults. Yang et al. (2022) found that even when both players had equal expected payoffs, acceptance of the opportunity structure declined as the participant had progressively fewer opportunities than the other player, from an equal opportunity condition (5:5) to a highly unequal one (9:1). These findings show that sensitivity to opportunity equity emerges early and extends into adulthood.
The present study examines this behavioral response as willingness to continue under the opportunity structure, together with fairness perceptions. For fairness perceptions, based on the pattern reported in prior research, we expect it to replicate:
H1.
Fairness perceptions will be highest under equality, lower under advantageous inequality, and lowest under disadvantageous inequality.
For willingness to continue, we test competing predictions under advantageous inequality and a common prediction under disadvantageous inequality.
H2a.
If fairness concerns dominate, willingness to continue will be lower under advantageous inequality than under equality.
H2b.
If opportunity-based self-interest dominates, willingness to continue will be higher under advantageous inequality than under equality.
H2c.
Willingness to continue will be lower under disadvantageous inequality than under equality.
The competing predictions in H2a and H2b also raise the question of whether willingness to continue aligns with perceptions. Research on outcome fairness has shown that fairness perceptions and behavior do not always correspond. Individuals often understand fairness principles yet still choose self-serving options (Blake et al., 2014; Cheng et al., 2024; Jin et al., 2022; Liu et al., 2017). A similar divergence may occur in opportunity equity contexts, especially when an unequal structure benefits the self. The present study therefore explores this possibility.
H3.
The difference between fairness perceptions and willingness to continue (i.e., the perception–willingness gap) may be larger under advantageous inequality than under equality and disadvantageous inequality.
1.2. SVO as a Moderator
SVO is an important and stable social preference that reflects how individuals prefer outcomes to be allocated between self and others (Hilbig et al., 2014; Murphy & Ackermann, 2014; Van Lange, 1999). SVO is typically divided into prosocial and proself orientations (Z. Li et al., 2023; Nezlek, 2024; Pletzer et al., 2018). Prosocials seek to maximize joint outcomes and minimize the difference between their own and others’ outcomes, whereas proselfs seek to maximize their own outcomes and show less concern for others’ outcomes (Bogaert et al., 2008; De Dreu & Van Lange, 1995; Pletzer et al., 2018).
Prior research has examined SVO within the contexts of outcome fairness and cooperation. Within these frameworks, prosocials exhibit stronger cooperation tendencies and greater concern for fairness than proselfs (Bilancini et al., 2022; Van Lange, 1999; Yan et al., 2026). They also show stronger aversion to unfair offers and are more inclined to reject them, even when such rejection is costly (Bieleke et al., 2017; Hu & Mai, 2021; Hu et al., 2017). Notably, compared to proselfs, prosocials are more likely to reject advantageous but unfair offers (Chen et al., 2024).
These differences in social decision-making suggest that prosocials and proselfs may also diverge in how they respond to opportunity equity. Fairness perceptions are strongly shaped by the widely shared norm of equal opportunity (Aoki et al., 2015; Andreoli et al., 2019; You et al., 2023), yet SVO may also influence how individuals evaluate opportunity structures, particularly when those structures are self-relevant. For willingness to continue, however, SVO should matter more, because such choices directly activate the conflict between fairness and self-interest (Murphy & Ackermann, 2014; Van Lange, 1999). The moderating role of SVO may therefore be most pronounced under advantageous inequality, where the two motives directly conflict. We test one theory-driven prediction and two open questions regarding SVO moderation.
H4a.
Under advantageous inequality, prosocials will report lower fairness perceptions and lower willingness to continue than proselfs.
H4b.
The effect of SVO on fairness perceptions and willingness to continue may be weaker under opportunity equality and disadvantageous inequality than under advantageous inequality.
H4c.
SVO may moderate the effect of opportunity structure on the perception–willingness gap.
1.3. Overview of the Present Study
To test these hypotheses, participants were classified as prosocials or proselfs using a triple-dominance matrix, then randomly assigned to one of three opportunity structures in an anonymous, multi-round two-person dice game. These structures were created by varying the number of dice available to each player, yielding equality, disadvantageous inequality, and advantageous inequality. Outcome probabilities were held constant across conditions. In each round, participants rated the fairness of the current opportunity structure and indicated whether they were willing to continue the game.
2. Methods
2.1. Participants and Design
We employed a 3 (opportunity structure: equality/disadvantageous inequality/advantageous inequality) × 2 (SVO: prosocials/proselfs) between-subjects design. Opportunity structure was experimentally manipulated, whereas SVO was measured as a categorical individual-difference variable. An a priori power analysis using G*power 3.1 (Faul et al., 2007) for the 3 × 2 interaction indicated a required sample of 158 participants, assuming a medium effect size (f = 0.25), α = 0.05, and power = 0.80. Given the lack of a directly applicable effect size estimate for the interaction of interest, we based our assumption of a medium effect size on conventional benchmarks (Cohen, 1988) and on common practice in psychological research when directly comparable estimates are unavailable (Bakker et al., 2020). A sensitivity analysis based on the final sample (N = 208) further indicated that, under the same criteria, the minimum detectable interaction effect was approximately f = 0.22, slightly smaller than the medium effect size assumed in the a priori analysis.
We recruited 212 undergraduates (100 females, 112 males; Mage = 19.87, SD = 1.47, range: 18–23 years) through offline campus advertisements. Inclusion criteria were being a current university student, a native Chinese speaker, self-reporting good physical and mental health, and not majoring in psychology or economics. Four participants were excluded because their SVO responses could not be clearly classified, leaving 208 participants (99 females, 109 males; Mage = 19.91, SD = 1.51, range: 18–23 years). Based on SVO, the final sample consisted of 102 proselfs and 106 prosocials. Participants were randomly assigned by a computer-generated procedure to one of three opportunity structure conditions. Detailed demographic characteristics and sample distribution are presented in Table 1.
Table 1.
Sample characteristics by opportunity structure condition and SVO group.
2.2. Materials
2.2.1. SVO Measurement
SVO was assessed by using the triple-dominance matrix task (Nagatsu et al., 2018; Van Lange et al., 1997). In the task, participants were required to imagine allocating tokens between themselves and an anonymous stranger. The task consisted of nine items, each presenting a different payoff matrix, with higher token amounts indicating a larger payoff. Each item followed a consistent structure. In option 1, the participant and the other person received the same number of tokens. In option 2, the participant received the largest number of tokens among the three options. In option 3, the difference between the participant’s token count and the other person’s token count was the largest. The positions of the three options were counterbalanced across the nine items.
For each item, choices were coded as prosocial (option 1), individualistic (option 2), or competitive (option 3). In the standard triple-dominance procedure, participants are classified independently into one of these orientations if at least six of nine choices are consistent with it (Van Lange et al., 1997). Because our primary theoretical contrast was prosocial versus proself, we adopted a simplified classification rule. Specifically, participants were classified as prosocials if they chose option 1 on at least six items, as proselfs if the combined number of option 2 and option 3 choices was at least six, and as unclassifiable if they met neither criterion. This rule differs from the standard independent classification by combining individualistic and competitive choices at the item level, but it aligns with the common practice of pooling these two subgroups into a broader proself category for analysis (Bogaert et al., 2008; Pletzer et al., 2018; Sun et al., 2022). Detailed frequencies based on the standard independent classification, including separate frequencies for individualists and competitors, are reported in Appendix A.
2.2.2. Modified Two-Person Dice Game
All subsequent tasks were incorporated into a two-person dice game adapted from Long et al. (2018). In the game, participants were informed that they would play multiple rounds with different anonymous partners. They were told that, in each round, the player with the higher dice roll would receive 40 tokens, the player with the lower roll would receive none, and ties would yield 20 tokens each. They were also told that the “higher dice roll” referred to each player’s single highest die result, not the sum of their dice. For example, if the participant rolled a 3 with one die, and the partner rolled a 2 and a 3 with two dice, the partner’s highest result was 3, resulting in a tie. Participants learnt that one round would be selected after completing the game to calculate their actual payment. They were further informed that the results of the dice rolls would not be shown immediately after each round; rather, all results would be revealed after they completed the game. This was explained as being necessary to avoid feedback effects and to allow proper matching of games across players.
Crucially, to prevent participants from correlating the quantity of dice with their likelihood of reward, participants were explicitly informed that the number of dice did not determine the actual outcome; rather, each round’s outcome was predetermined by a computer program, ensuring that both players always had an equal and fixed probability of winning each round, regardless of the number of dice they were assigned. Participants were not told the exact probability values. In fact, the computer program used a fixed and symmetric probability structure: 40% win, 40% loss, and 20% tie. Dice results were then generated to match the predetermined outcome. Specifically, in wins, the winner’s highest die result was higher than the loser’s; in ties, both players’ highest die results were equal.
Comprehension checks. Participants were required to answer three questions to ensure they understood the rules. For instance, one question was “What is the probability of each side winning a round?” The options were “A. The more dice a player has, the higher that player’s chances of winning. B. Both sides have a fixed and equal probability of winning. C. The fewer dice a player has, the higher that player’s chances of winning.” The correct answer was B. No feedback or additional attempts were provided after incorrect responses. Participants who did not answer all three questions correctly were to be excluded from the data analysis.
Manipulation of opportunity structure. The opportunity structure was manipulated by varying the number of dice available to participants and their partners, the operationalization of the number of opportunities available to each player. In each round, the opportunities available to both players were displayed, determined by the number of dice presented. In the equality condition, both the participant and the partner are allocated two dice each. In the disadvantageous inequality condition, the participant is provided with one die, whereas the partner is given two dice. Conversely, in the advantageous inequality condition, the participant receives two dice, while the partner is limited to one die.
Fairness perceptions measurement. In each round, participants were required to assess a single item: “How fair do you think the opportunity structure is in this round?” Responses were recorded on a 7-point Likert scale ranging from 1 (very unfair) to 7 (very fair). Fairness perceptions were operationalized as the mean of responses across rounds. Cross-round Cronbach’s α was 0.939.
Willingness to continue measurement. Participants were also required to indicate their willingness to continue under the current opportunity structure using a single item: “To what extent are you willing to roll the dice in this round?” Responses were recorded on a 7-point Likert scale ranging from 1 (very unwilling) to 7 (very willing). Willingness to continue was operationalized as the mean of the responses across rounds. Cross-round Cronbach’s α was 0.853.
Perception–willingness gap measurement. For each participant, the perception–willingness gap was indexed by the absolute difference between the mean willingness to continue and fairness perceptions scores (i.e., |willingness − perception|). Higher values indicate a larger discrepancy between willingness to continue and fairness perceptions, regardless of direction.
2.3. Procedures
The experiment consisted of two phases. Phase 1 was an online screening session in which participants were invited to complete the SVO measurement. Based on their choices, only those who demonstrated a consistent SVO were classified as prosocials or proselfs and invited to participate in Phase 2. The payment for completing this measurement was a fixed amount of 1 Chinese yuan.
Phase 2 was a laboratory experiment. Upon arrival, participants were seated in individual computer cubicles and learnt that all instructions would be presented on the screen and all responses were recorded. Afterwards, they read detailed instructions of the multi-round, anonymous two-person dice game and completed comprehension checks. At the beginning of the game, each participant was assigned a unique identifier code. In each round, the computer first matched the participant with an anonymous partner, and then displayed the opportunity structure, showing the number of dice the participant and the partner could roll. Participants were required to indicate their fairness perceptions and willingness to continue. If their willingness was 4 or above, a rolling-die animation appeared, and the participant pressed the “F” key to roll the die. If the willingness was 3 or below, the dice roll was skipped, and the participant moved directly to the next round. The anonymous partners were not real-time participants. Their responses were pre-collected from earlier participants and presented as fixed partners identified by different codes, rather than generated in real time. Participants were not informed of this during the game.
Each participant completed five rounds under the same opportunity structure. Participants were not told the exact number of rounds in advance. After completing the game, they were asked to provide their gender and age. Subsequently, the actual outcomes of the dice rolls were revealed. The computer then randomly selected one round, and the outcome of that round was used to determine the participants’ payment. A win yielded 40 tokens, a loss 0 tokens, and a tie 20 tokens. If the selected round was one in which either player’s willingness was 3 or below (i.e., the dice roll was skipped), it was treated as a tie for payment calculation, yielding 20 tokens. Tokens were converted at 5 tokens = 1 Chinese yuan. Neither the tie-for-skipped-roll rule nor the token-to-money conversion rate was stated in the task instructions in advance; both were communicated only at the payment stage. Participants received an average payment of approximately 5.17 Chinese yuan, including 1 Chinese yuan for the SVO measure. Finally, participants were fully debriefed. They were informed that the partner responses had been pre-collected rather than generated in real time, the purpose of this procedure was explained, and they were given the opportunity to ask questions and withdraw their data. No participants withdrew their data after debriefing. The laboratory session lasted about 6 min.
2.4. Statistical Analysis
All participants answered all three comprehension-check questions correctly on the first attempt; therefore, no participants were excluded from the data analysis on the basis of the comprehension check.
We analyzed the data using IBM SPSS Statistics (version 29.0; IBM Corp., Armonk, NY, USA) For the primary analyses, responses were averaged across the five rounds for each participant. Fairness perceptions and willingness to continue were measured on 7-point scales. Although ordinal, both covered the full 1–7 range with modest skewness (0.34 and −0.24, respectively) and no substantial floor or ceiling effects. Following Norman (2010), we treated them as approximately continuous in the primary analyses of variance (ANOVAs).
We conducted separate two-way between-subjects ANOVAs, with opportunity structure and SVO as factors, for fairness perceptions and willingness to continue. Significant interactions were followed by simple effects analyses with Bonferroni correction. Partial eta squared (ηp2) was reported as the effect size.
Following the primary analyses, we conducted an additional two-way between-subjects ANOVA to examine the perception–willingness gap and whether this gap was moderated by opportunity structure and SVO.
As robustness checks, we re-analyzed the unaggregated five-round data using R (version 4.4.3; R Core Team, Vienna, Austria), with participant random intercepts and round as a fixed control variable. Specifically, we conducted ordinal sensitivity analyses using cumulative link mixed models (CLMMs), treating the outcome variables as ordinal. We recoded willingness to continue into a binary outcome (ratings ≥ 4 = roll; ratings < 4 = skip) and analyzed it using a generalized linear mixed model (GLMM). We also fitted mixed-effects models with a first-order autoregressive residual correlation structure [AR(1)] to account for temporal dependence among repeated observations. Further details on model specifications and estimation procedures are provided in Appendix B, Appendix C and Appendix D.
3. Results
3.1. Fairness Perceptions
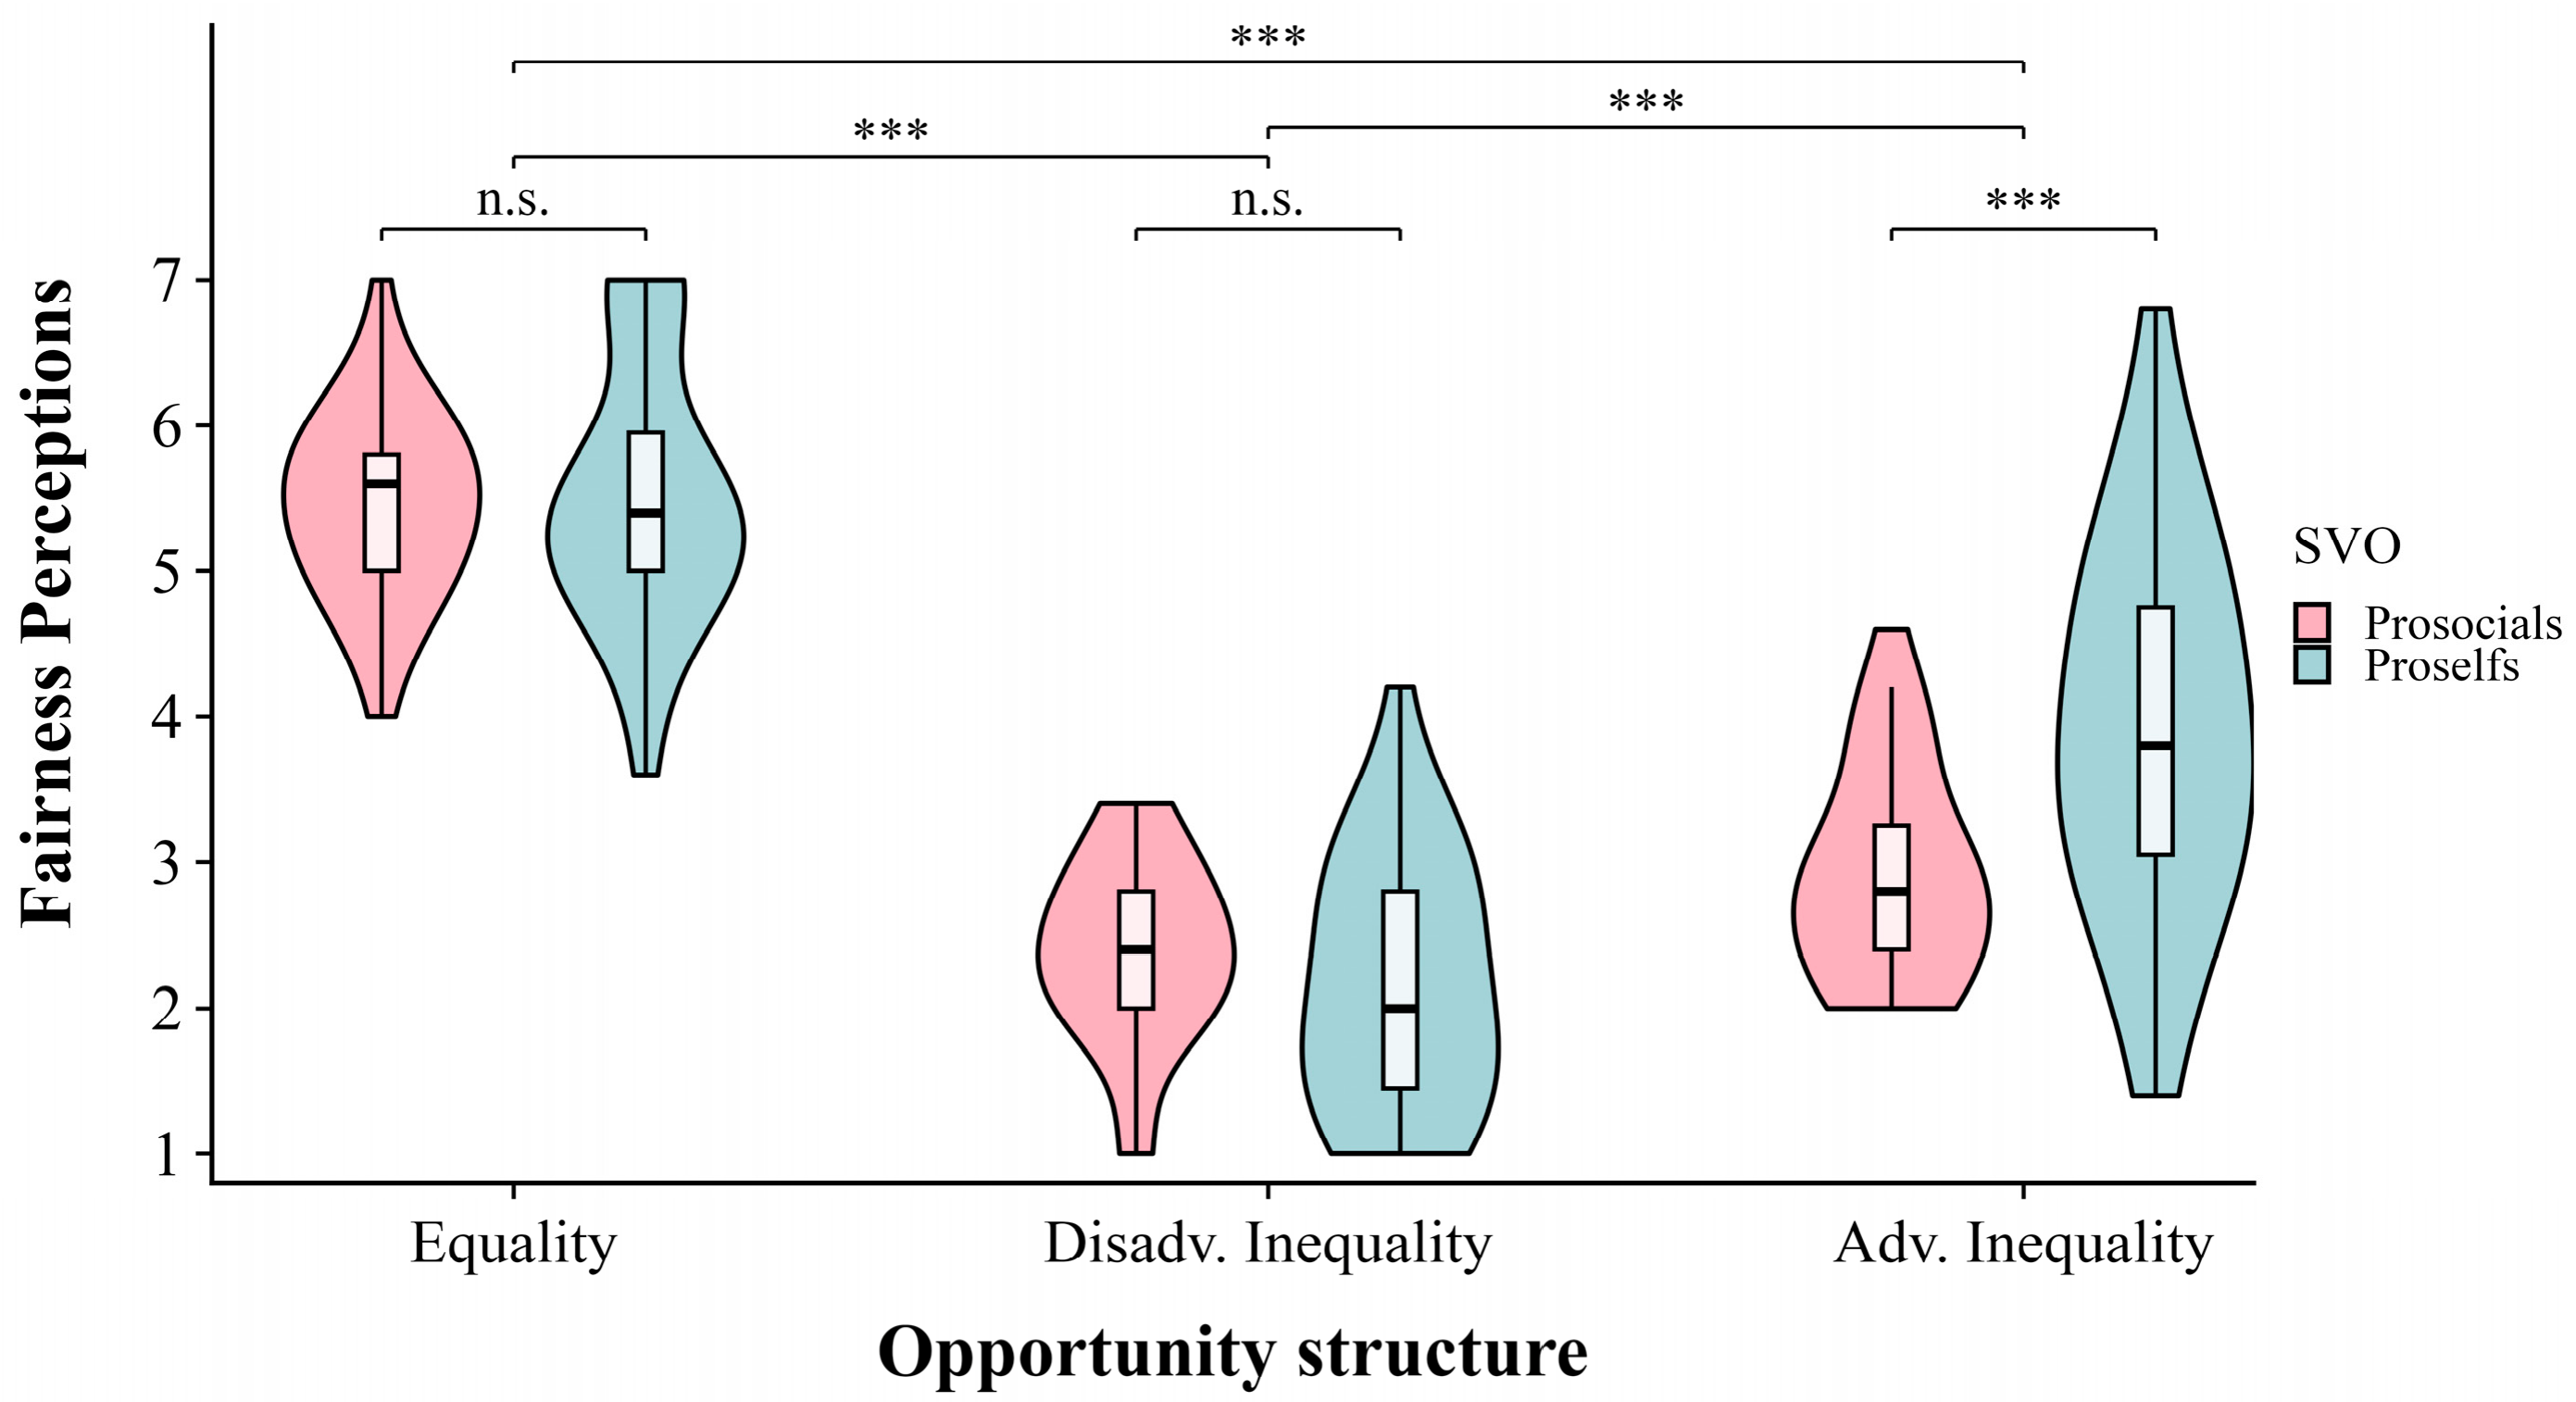
The results showed a significant main effect of opportunity structure, F(2, 202) = 261.09, p < 0.001, ηp2 = 0.72. Fairness perceptions were highest under equality (M = 5.48, SD = 0.77), lower under advantageous inequality (M = 3.39, SD = 1.10), and lowest under disadvantageous inequality (M = 2.26, SD = 0.74). All pairwise comparisons were significant, ps < 0.001. The main effect of SVO was significant, F(1, 202) = 5.41, p = 0.021, ηp2 = 0.03, with fairness perceptions lower among prosocials (M = 3.57, SD = 1.49) than among proselfs (M = 3.85, SD = 1.70).
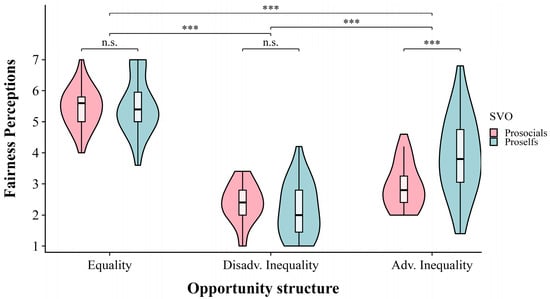
The interaction between opportunity structure and SVO (see Figure 1) was significant, F(2, 202) = 10.24, p < 0.001, ηp2 = 0.09. Simple effects analyses showed fairness perceptions did not differ between prosocials and proselfs under equality (Prosocials: M = 5.45, SD = 0.62, Proselfs: M = 5.51, SD = 0.90), p = 0.766, or under disadvantageous inequality (Prosocials: M = 2.38, SD = 0.61, Proselfs: M = 2.14, SD = 0.84), p = 0.233. However, under advantageous inequality, fairness perceptions were lower among prosocials (M = 2.91, SD = 0.71) than among proselfs (M = 3.91, SD = 1.22), p < 0.001.
Figure 1.
Fairness perceptions by SVO and opportunity structure. The colored areas represent the kernel density estimation. Inside the box plots, horizontal lines indicate the median, boxes represent the interquartile range, and whiskers extend to the most extreme observations within 1.5 times the interquartile range. Brackets indicate pairwise comparisons across opportunity structures (averaged across SVO groups) and between SVO groups within each structure. *** p < 0.001, n.s. p > 0.05.
Within both prosocials and proselfs, fairness perceptions were highest under opportunity equality, followed by advantageous inequality, and lowest under disadvantageous inequality. All pairwise differences between conditions were significant within each SVO group (ps < 0.05).
3.2. Willingness to Continue
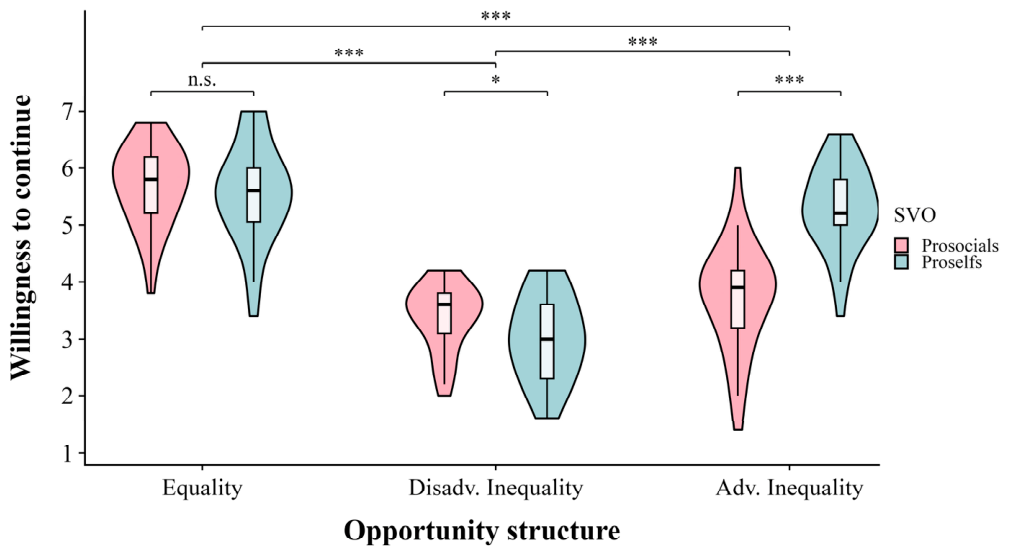
The results showed a significant main effect of opportunity structure, F(2, 202) = 180.58, p < 0.001, ηp2 = 0.64. Willingness to continue the game was highest under equality (M = 5.63, SD = 0.77), lower under advantageous inequality (M = 4.50, SD = 1.15), and lowest under disadvantageous inequality (M = 3.20, SD = 0.66), ps < 0.001. The advantageous inequality condition also differed significantly from the disadvantageous inequality condition, p < 0.001. The main effect of SVO was significant, F(1, 202) = 12.24, p < 0.001, ηp2 = 0.06, with willingness to continue lower among prosocials (M = 4.26, SD = 1.26) than proselfs (M = 4.63, SD = 1.39).
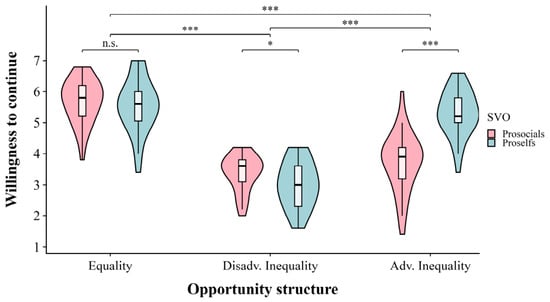
The interaction between opportunity structure and SVO (see Figure 2) was significant, F(2, 202) = 35.17, p < 0.001, ηp2 = 0.26. Simple effects analyses showed willingness to continue did not differ between prosocials (M = 5.70, SD = 0.68) and proselfs (M = 5.57, SD = 0.86) under equality, p = 0.487. However, willingness to continue was higher among prosocials (M = 3.38, SD = 0.57) than among proselfs (M = 3.01, SD = 0.71) under disadvantageous inequality, p = 0.042, whereas it was lower among prosocials (M = 3.72, SD = 0.92) than among proselfs (M = 5.32, SD = 0.73) under advantageous inequality, p < 0.001.
Figure 2.
Willingness to continue by SVO and opportunity structure. The colored areas represent the kernel density estimation. Inside the box plots, horizontal lines indicate the median, boxes represent the interquartile range, and whiskers extend to the most extreme observations within 1.5 times the interquartile range. Brackets indicate pairwise comparisons across opportunity structures (averaged across SVO groups) and between SVO groups within each structure. *** p < 0.001, * p < 0.05, n.s. p > 0.05.
Moreover, prosocials were more willing to continue under equality than under both disadvantageous and advantageous inequality, ps < 0.001, but did not differ between the two inequality conditions, p = 0.504. However, proselfs were less willing to continue under disadvantageous inequality than under equality and advantageous inequality, ps < 0.001, but did not differ between equality and advantageous inequality, p = 0.536.
3.3. The Perception–Willingness Gap
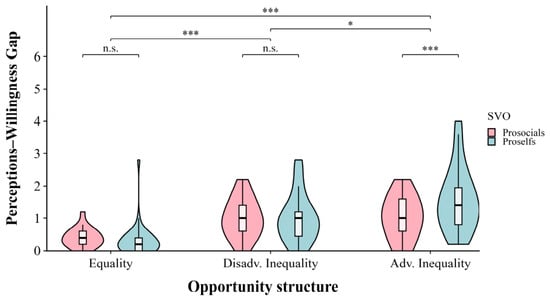
The results showed a significant main effect of opportunity structure, F(2, 202) = 37.92, p < 0.001, ηp2 = 0.27. The perception–willingness gap was largest under advantageous inequality (M = 1.30, SD = 0.85), smaller under disadvantageous inequality (M = 1.01, SD = 0.65), and lowest under equality (M = 0.37, SD = 0.40), ps < 0.05. The advantageous inequality condition also differed significantly from the disadvantageous inequality condition, p < 0.001. The main effect of SVO was not significant, F(1, 202) = 3.15, p = 0.077, ηp2 = 0.02, with the gap did not differing significantly between prosocials (M = 0.82, SD = 0.59) and proselfs (M = 0.97, SD = 0.91).
The interaction between opportunity structure and SVO (see Figure 3) was significant, F(2, 202) = 4.65, p = 0.011, ηp2 = 0.04. Simple effects analyses showed that the perception–willingness gap did not differ between prosocials and proselfs under equality (Prosocials: M = 0.41, SD = 0.28, Proselfs: M = 0.33, SD = 0.50), p = 0.626, or under disadvantageous inequality (Prosocials: M = 1.01, SD = 0.57, Proselfs: M = 1.02, SD = 0.73), p = 0.939. However, the gap was smaller among prosocials (M = 1.03, SD = 0.64) than among proselfs (M = 1.58, SD = 0.96) under advantageous inequality, p < 0.001.
Figure 3.
The perception–willingness gap across opportunity structures and SVO. The gap was indexed by the absolute difference between willingness and perception. The colored areas represent the kernel density estimation. Inside the box plots, horizontal lines indicate the median, boxes represent the interquartile range, and whiskers extend to the most extreme observations within 1.5 times the interquartile range. Brackets indicate pairwise comparisons across opportunity structures (averaged across SVO groups) and between SVO groups within each structure. *** p < 0.001, * p < 0.05, n.s. p > 0.05.
Moreover, among prosocials, the gap was smaller under equality than under the two inequality conditions, ps < 0.001, but did not differ between these two inequality conditions, p = 1.000. However, among proselfs, the gap was smallest under equality, followed by disadvantageous inequality, and largest under advantageous inequality; all pairwise comparisons were significant, ps < 0.01.
3.4. Robustness Checks
For fairness perceptions, both the ordinal and AR(1) sensitivity analyses revealed a significant main effect of opportunity structure and a significant Opportunity Structure × SVO interaction (see Appendix B.1 and Appendix D). For willingness to continue, the ordinal, binary outcome, and AR(1) analyses all showed significant main effects of opportunity structure and SVO, as well as their interaction (see Appendix B.2, Appendix C and Appendix D). For the perception–willingness gap, both the ordinal and AR(1) sensitivity analyses showed consistent patterns with the primary findings (see Appendix B.3 and Appendix D).
3.5. Brief Summary
Together, the results supported the prediction that fairness perceptions would be highest under equality and lowest under disadvantageous inequality (H1), and that willingness to continue would be lower under disadvantageous inequality than under equality (H2c). Under advantageous inequality, willingness to continue was lower than under equality, supporting the fairness-concerns prediction (H2a) rather than the opportunity-based self-interest prediction (H2b). In this condition, the perception–willingness gap was largest (H3) and smaller for prosocials than proselfs (H4c); prosocials also showed lower fairness perceptions and willingness to continue than proselfs (H4a); and SVO effects on fairness perceptions and willingness to continue were stronger than under the other two conditions (H4b).
4. Discussion
4.1. Interpretation of Findings and Implications
4.1.1. Fairness Concerns in Opportunity Trade-Offs
The present study found that both fairness perceptions and willingness to continue varied across opportunity structures, even though opportunity structure did not guarantee better outcomes. Participants reported higher fairness perceptions and willingness to continue under opportunity equality than under disadvantageous inequality. These results are consistent with existing research (Shaw & Olson, 2014; Sun et al., 2022; Yang et al., 2022) and support the crucial role of opportunity equity in resource allocation practice (Aoki et al., 2015).
More importantly, by including advantageous inequality, the present study revealed how individuals trade off opportunity equity against their own opportunities. Although advantageous inequality placed individuals in a relatively advantaged position, it was perceived as less fair than equality, and willingness to continue was also lower. This suggests that the appeal of a personal opportunity advantage did not outweigh fairness concerns. At the same time, participants perceived advantageous inequality as fairer than disadvantageous inequality and were more willing to continue under the former, indicating asymmetric responses to the two forms of opportunity inequality. These findings are broadly consistent with the inequity aversion model (Fehr & Schmidt, 1999), which proposes that people dislike both advantageous and disadvantageous inequality, with disadvantageous inequality typically weighted more heavily. Whereas the model focuses on realized outcomes, the similar pattern observed here suggests that sensitivity to the direction of inequality may also be relevant to responses to opportunity structures, even though the number of opportunities did not determine the probability of winning. These findings may be relevant to organizations and policymakers concerned with how opportunities are structured.
4.1.2. The Role of SVO in Opportunity Trade-Offs
The present study showed that responses to unequal opportunity structures differed between prosocials and proselfs. The most theoretically relevant finding concerned advantageous inequality. Under advantageous inequality, prosocials reported lower fairness perceptions and lower willingness to continue than proselfs. This finding is consistent with research on outcome fairness, which shows that prosocials have stronger equality preferences (Van Lange, 1999), greater sensitivity to unfairness (Hu & Mai, 2021), and a higher tendency to reject advantageous unfairness (Chen et al., 2024). These findings suggest that SVO-related differences in fairness responses may also emerge when individuals face unequal opportunities.
Under opportunity equality, prosocials and proselfs showed similarly high levels of fairness perceptions and willingness to continue, indicating that SVO played a relatively limited role when opportunities were equal. Under disadvantageous inequality, both groups reported similarly low fairness perceptions, but prosocials were more willing to continue than proselfs. One possible explanation is that prosocials have a stronger cooperative orientation. Even when disadvantaged, they were more likely to continue the game, consistent with evidence that prosocials are more willing to cooperate in social dilemmas even at a personal cost (Pletzer et al., 2018; Van Lange et al., 2007). This tendency may stem from their greater concern for joint outcomes and fairness norms (Bogaert et al., 2008; De Dreu & Van Lange, 1995), which may help explain their willingness to continue even when their own opportunities are reduced.
Although prosocials and proselfs showed a broadly similar ordering of fairness perceptions and willingness to continue across the three opportunity structures, their responses differed in relative terms. Compared with proselfs, prosocials responded to advantageous inequality as more similar to disadvantageous inequality, whereas proselfs responded to advantageous inequality as more similar to equality. These differences may reflect not only how individuals weigh fairness against the personal value of having more opportunities, but also the broader goals they seek to pursue (Krautwurm & Wichardt, 2026). For prosocials, fairness may itself be a personally valued goal. Their less favorable responses to advantageous inequality may therefore reflect a desire to act in accordance with this goal, rather than simply a willingness to give up a personal advantage for others. Practically, these findings suggest that efforts to promote opportunity equity should take individual differences in SVO into account.
4.1.3. The Perception–Willingness Gap in Opportunity Equity
The present study also showed that the perception–willingness gap varied across opportunity structures. Specifically, the gap was largest when individuals had more opportunities than others, intermediate when they had fewer opportunities, and smallest when opportunities were equal.
One possible interpretation is that this pattern reflects the degree of alignment or conflict between fairness concerns and the personal value of having more opportunities. Under opportunity equality, the two motives align, so fairness perceptions and willingness to continue were both high and closely aligned, producing the smallest gap. Under disadvantageous inequality, the motives align but neither motive is satisfied. Negative emotions may arise and interfere with willingness to continue, resulting in an intermediate gap. Under advantageous inequality, individuals may recognize the unfairness of having more opportunities while still valuing the personal advantage these opportunities afford. This speculative interpretation is also consistent with the attitude–behavior gap perspective (Blake, 2018; Kaiser et al., 2021), which suggests that acting in accordance with one’s attitudes may entail costs beyond merely holding those attitudes. In this case, under advantageous inequality, acting on fairness perceptions means forgoing their perceived value of additional opportunities, which may widen the perception–willingness gap.
Furthermore, SVO significantly moderated the effect of opportunity structure on the perception–willingness gap. Although both prosocials and proselfs showed the largest gap under advantageous inequality, the gap was significantly larger for proselfs than for prosocials. Compared with the equality condition, prosocials reported lower fairness perceptions under advantageous inequality, and their willingness to continue decreased correspondingly. In contrast, proselfs perceived advantageous inequality as less fair but did not significantly reduce their willingness to continue, producing a larger perception–willingness gap. This pattern may indicate that proselfs place high personal value on having more opportunities, which may sustain their willingness to continue despite their fairness concerns. This interpretation is consistent with prior work showing that proselfs prioritize self-interest (Van Lange, 1999) and exhibit lower aversion to inequity when it benefits themselves (Pauwels et al., 2022).
4.2. Limitations and Future Directions
Several limitations should be noted. First, behavioral responses were measured using a 7-point willingness rating rather than an actual behavioral choice. Although the rating was tied to real incentives, expressing willingness may differ from making an actual choice (Sheeran & Webb, 2016), particularly when the choice involves giving up actual benefits or perceived advantage. This may lead to an overestimation of individuals’ tendency to act fairly. In addition, key constructs were measured with single items, which may not fully capture the complexity of fairness perceptions and willingness to continue. Moreover, because fairness perceptions were assessed before willingness to continue, the perception measure may have increased the salience of fairness norms and shaped subsequent responses. Future research could incorporate real behavioral choices, multi-item measures, and counterbalanced or implicit measures to examine whether this bias affects the robustness of the findings.
Second, participants may have intuitively associated more opportunities with better expected outcomes (Klusowski et al., 2021), even though the instructions emphasized that both players had equal and fixed probabilities of winning regardless of the number of opportunities and all participants answered the comprehension-check questions correctly. Such subjective outcome expectancies could have influenced their fairness perceptions and willingness to continue. Future studies could directly measure these expectancies, make the independence between opportunities and outcomes more salient, or use more naturalistic opportunity manipulations.
Third, the present study did not directly assess the cognitive and emotional processes underlying fairness perceptions and decisions, though these processes matter in fairness-related decision-making (Kim et al., 2024; Luo et al., 2024). Fairness concerns, negative emotions, perceived costs, or motivational conflicts may have contributed to the observed patterns, but these mechanisms remain speculative. Including such measures in future research would help clarify the mechanisms underlying responses to different opportunity structures.
Fourth, individualistic and competitive participants were combined into a single proself category. Although this is consistent with prior SVO research (e.g., Z. Li et al., 2023; Sun et al., 2022), it may obscure subtle differences between the two orientations. Future research with larger samples could examine them separately.
Finally, the sample consisted of Chinese undergraduates recruited from a single public university, which limits generalizability across populations and cultural or institutional contexts. Future research should test these effects in more diverse and representative samples.
Author Contributions
Conceptualization, Q.S.; Methodology, Q.S. and Y.Y.; Investigation, Q.S. and W.F.; Data curation, Y.Y., Z.W. and W.F.; Formal analysis, Y.Y. and D.D.; Writing—original draft preparation, Q.S., Y.Y. and W.F.; Writing—review and editing, Q.S., Y.Y., Z.W., D.D. and W.F.; Supervision, Q.S. and W.F.; Funding acquisition, Q.S., Z.W. and W.F. All authors have read and agreed to the published version of the manuscript.
Funding
This study was supported by the Humanities and Social Science Fund of the Ministry of Education of China (23YJC190020), the National Social Science Fund of China (24CSH120), Shanghai Normal University Humanities and Social Sciences Research Project (310-AW0203-26-005412), and the Postgraduate Research and Practice Innovation Program of Jiangsu Province (26CXJH6003).
Institutional Review Board Statement
This study adhered to the Declaration of Helsinki and received approval from the Human Research Ethics Committee of Suzhou University of Science and Technology (Approval ID: HRP226-2023; approved on 20 March 2023).
Informed Consent Statement
Informed consent was obtained from all participants involved in the study.
Data Availability Statement
The raw data are openly available in the Open Science Framework repository at https://osf.io/dcbtw (accessed on 22 June 2026).
Conflicts of Interest
The authors state that there are no conflicts of interest.
Appendix A. Social Value Orientation Classification Frequencies
In the final sample of 208 participants, using the standard independent classification (Van Lange et al., 1997), 106 participants were classified as prosocials (option 1 ≥ 6), 16 as individualists (option 2 ≥ 6), and 22 as competitors (option 3 ≥ 6). The remaining 64 participants were unclassifiable under the standard classification. Among them, 37 chose option 2 five times, 5 chose option 3 five times, and 22 showed a more balanced mix between options 2 and 3. Under the simplified rule used in the main analyses, these 64 participants were classified as proselfs (i.e., mixed proselfs) because their combined number of option 2 and option 3 choices reached at least six.
Appendix B. Cumulative Link Mixed-Model Analysis
As a robustness check, we further analyzed the trial-level data using cumulative link mixed models (CLMMs). Unlike the primary 3 × 2 ANOVAs based on participant-level averages, these analyses retained all five rounds. For fairness perceptions and willingness to continue, the original 7-point ratings were modeled as ordinal outcomes. For the perception–willingness gap, the absolute within-round difference between the two ratings was modeled as an ordinal outcome. All models included opportunity structure (dummy-coded; advantageous inequality as the reference), SVO (dummy-coded; proselfs as the reference), and their interaction as fixed effects, round as a categorical control variable, and a participant-level random intercept to account for repeated observations. Overall, the CLMM results for fairness perceptions, willingness to continue, and the perception–willingness gap were broadly consistent with the corresponding primary ANOVAs.
Appendix B.1. Fairness Perceptions
The CLMM on fairness perceptions (see Table A1, column 1) showed a significant main effect of opportunity structure, χ2(2) = 290.08, p < 0.001. The main effect of SVO was not significant, χ2(1) = 3.68, p = 0.055. The interaction between SVO and opportunity structure was also significant, χ2(2) = 17.51, p < 0.001.
Pairwise comparisons showed fairness perceptions did not differ between prosocials and proselfs under equality (p = 0.534) or disadvantageous inequality (p = 0.113). However, under advantageous inequality, fairness perceptions were lower among prosocials than among proselfs, p < 0.001.
Within both prosocials and proselfs, fairness perceptions were highest under opportunity equality, followed by advantageous inequality, and lowest under disadvantageous inequality. All pairwise differences between conditions were significant within each SVO group (ps < 0.05).
Table A1.
Estimation results using cumulative link mixed models.
Appendix B.2. Willingness to Continue
The CLMM on willingness to continue (see Table A1, column 2) showed a significant main effect of opportunity structure, χ2(2) = 58.22, p < 0.001. The main effect of SVO was significant, χ2(1) = 10.73, p = 0.001. The interaction between SVO and opportunity structure was also significant, χ2(2) = 63.01, p < 0.001.
Pairwise comparisons showed willingness to continue was significantly higher among prosocials than among proselfs under disadvantageous inequality (p = 0.037), whereas it was significantly lower among prosocials than among proselfs under advantageous inequality (p < 0.001). No significant difference between prosocials and proselfs was observed under equality (p = 0.496).
Among prosocials, willingness to continue was significantly higher under equality than under both disadvantageous inequality and advantageous inequality (ps < 0.001), whereas the difference between the two inequality conditions was not significant (p = 0.084). Among proselfs, willingness to continue was significantly lower under disadvantageous inequality than under both equality and advantageous inequality (ps < 0.001), whereas equality and advantageous inequality did not differ significantly (p = 0.774).
Appendix B.3. The Perception–Willingness Gap
The CLMM on the perception–willingness gap (see Table A1, column 3) showed a significant main effect of opportunity structure, χ2(2) = 148.86, p < 0.001. The main effect of SVO was not significant, χ2(1) = 1.06, p = 0.302. The interaction between SVO and opportunity structure was also significant, χ2(2) = 13.64, p = 0.001.
Pairwise comparisons showed the perception–willingness gap did not differ between prosocials and proselfs under equality (p = 0.099) or disadvantageous inequality (p = 0.893). However, under advantageous inequality, the gap was smaller among prosocials than among proselfs (p < 0.001).
Moreover, among prosocials, the gap was smaller under equality than under the two inequality conditions (ps < 0.001), but did not differ between the two inequality conditions (p = 0.969). However, among proselfs, the gap was smallest under equality, followed by disadvantageous inequality, and largest under advantageous inequality, with all pairwise differences significant (ps < 0.001).
Appendix C. Supplementary Analysis of Binary Willingness Outcome
Willingness ratings were recoded into a binary roll/skip outcome, with ratings of 4 or higher coded as roll (1) and ratings of 3 or lower coded as skip (0). As a supplementary robustness analysis, the binary outcome was analyzed using a generalized linear mixed model (GLMM) with a logit link, with opportunity structure (dummy-coded; advantageous inequality as the reference), SVO (dummy-coded; proselfs as the reference), and their interaction entered as fixed effects, round as a categorical control variable, and a participant-level random intercept to account for repeated observations.
The GLMM results (see Table A2) for the binary willingness outcome were broadly consistent with those for willingness to continue. The main effect of opportunity structure was significant, χ2(2) = 121.55, p < 0.001, and the main effect of SVO was significant, χ2(1) = 8.73, p = 0.003. The interaction between SVO and opportunity structure was also significant, χ2(2) = 15.49, p < 0.001.
Pairwise comparisons showed that the binary willingness outcome did not differ between prosocials and proselfs under equality (p = 0.461) or disadvantageous inequality (p = 0.905). However, prosocials were less likely to accept the opportunity structure than proselfs under advantageous inequality (p < 0.001).
Moreover, among prosocials, the binary willingness outcome was highest under equality, followed by advantageous inequality, and lowest under disadvantageous inequality, with all pairwise differences significant (ps < 0.001). Among proselfs, the binary willingness outcome was lower under disadvantageous inequality than under equality and advantageous inequality, ps < 0.001, but did not differ between equality and advantageous inequality, p = 0.090.
Table A2.
Generalized linear mixed-effects model predicting binary willingness outcome.
Appendix D. Sensitivity Analyses Using a First-Order Autoregressive Residual Correlation Structure [AR(1)]
To account for potential serial dependence in participants’ responses across successive rounds, we further analyzed the trial-level data using linear mixed-effects models with a first-order autoregressive [AR(1)] residual correlation structure. These analyses retained all five rounds of observations. This structure allows residuals from adjacent rounds within the same participant to be correlated, with the correlation assumed to decrease as the interval between rounds increases. Specifically, the residual correlation between adjacent rounds is represented by ρ, whereas the correlation between rounds separated by k intervals is ρk. Separate models were fitted for fairness perceptions, willingness to continue, and the perception–willingness gap, controlling for opportunity structure, SVO, their interaction, and round, with a participant-level random intercept.
The three AR(1) models yielded positive residual correlation coefficients of ρ = 0.224, 0.503, and 0.400 for fairness perceptions, willingness to continue, and the perception–willingness gap, respectively. The interaction between opportunity structure and SVO was significant for fairness perceptions, F(2, 202) = 10.16, p < 0.001; willingness to continue, F(2, 202) = 29.03, p < 0.001; and the perception–willingness gap, F(2, 202) = 6.84, p = 0.001. Pairwise comparisons showed that, under advantageous inequality, prosocials reported significantly lower fairness perceptions and willingness to continue than proselfs, but also exhibited a smaller perception–willingness gap (ps < 0.001). In contrast, no significant differences between the two SVO groups were observed under equality or disadvantageous inequality across any of the three outcomes. Overall, these findings were broadly consistent with the primary ANOVAs, although the difference in willingness to continue between prosocials and proselfs under disadvantageous inequality was not significant in the AR(1) model (p = 0.154).
References
- Adams, S. (1963). Toward an understanding of inequity. Journal of Abnormal and Social Psychology, 67(5), 422–436. [Google Scholar] [CrossRef] [Scilit] [PubMed]
- Andreoli, F., Havnes, T., & Lefranc, A. (2019). Robust inequality of opportunity comparisons: Theory and application to early childhood policy evaluation. Review of Economics and Statistics, 101(2), 355–369. [Google Scholar] [CrossRef] [Scilit]
- Aoki, R., Matsumoto, M., Yomogida, Y., Izuma, K., Murayama, K., Sugiura, A., Camerer, C. F., Adolphs, R., & Matsumoto, K. (2014). Social equality in the number of choice options is represented in the ventromedial prefrontal cortex. The Journal of Neuroscience, 34(18), 6413–6421. [Google Scholar] [CrossRef] [Scilit] [PubMed]
- Aoki, R., Yomogida, Y., & Matsumoto, M. (2015). The neural bases for valuing social equality. Neuroscience Research, 90, 33–40. [Google Scholar] [CrossRef] [Scilit] [PubMed]
- Arneson, R. J. (1989). Equality and equal opportunity for welfare. Philosophical Studies, 56(1), 77–93. [Google Scholar] [CrossRef] [Scilit]
- Bakker, M., Veldkamp, C. L., van den Akker, O. R., van Assen, M. A., Crompvoets, E., Ong, H. H., & Wicherts, J. M. (2020). Recommendations in pre-registrations and internal review board proposals promote formal power analyses but do not increase sample size. PLoS ONE, 15(7), e0236079. [Google Scholar] [CrossRef] [Scilit] [PubMed]
- Bieleke, M., Gollwitzer, P. M., Oettingen, G., & Fischbacher, U. (2017). Social value orientation moderates the effects of intuition versus reflection on responses to unfair ultimatum offers. Journal of Behavioral Decision Making, 30(2), 569–581. [Google Scholar] [CrossRef] [Scilit]
- Bilancini, E., Boncinelli, L., & Celadin, T. (2022). Social value orientation and conditional cooperation in the online one-shot public goods game. Journal of Economic Behavior & Organization, 200, 243–272. [Google Scholar] [CrossRef] [Scilit]
- Blake, P. R. (2018). Giving what one should: Explanations for the knowledge-behavior gap for altruistic giving. Current Opinion in Psychology, 20, 1–5. [Google Scholar] [CrossRef] [Scilit] [PubMed]
- Blake, P. R., McAuliffe, K., Corbit, J., Callaghan, T. C., Barry, O., Bowie, A., Kleutsch, L., Kramer, K. L., Ross, E., Vongsachang, H., Wrangham, R., & Warneken, F. (2015). The ontogeny of fairness in seven societies. Nature, 528(7581), 258–261. [Google Scholar] [CrossRef] [Scilit] [PubMed]
- Blake, P. R., McAuliffe, K., & Warneken, F. (2014). The developmental origins of fairness: The knowledge–behavior gap. Trends in Cognitive Sciences, 18(11), 559–561. [Google Scholar] [CrossRef] [Scilit] [PubMed]
- Bogaert, S., Boone, C., & Declerck, C. (2008). Social value orientation and cooperation in social dilemmas: A review and conceptual model. British Journal of Social Psychology, 47(3), 453–480. [Google Scholar] [CrossRef] [Scilit] [PubMed]
- Bolton, G. E., Brandts, J., & Ockenfels, A. (2005). Fair procedures: Evidence from games involving lotteries. The Economic Journal, 115(506), 1054–1076. [Google Scholar] [CrossRef] [Scilit]
- Bown, N. J., Read, D., & Summers, B. (2003). The lure of choice. Journal of Behavioral Decision Making, 16(4), 297–308. [Google Scholar] [CrossRef] [Scilit]
- Chen, P., Zhang, Y., Hu, X., & Mai, X. (2024). Age differences of responders’ decision-making in disadvantageous and advantageous inequality contexts in the ultimatum game: The role of social value orientation. Personality and Individual Differences, 220, 112521. [Google Scholar] [CrossRef] [Scilit]
- Cheng, T., Lin, Q., & Fu, H. (2024). Children’s distributive justice behavior probably not matching their understanding: A systematic review. Current Psychology, 43(11), 10398–10408. [Google Scholar] [CrossRef] [Scilit]
- Cohen, J. (1988). Statistical power analysis for the behavioral sciences. Lawrence Erlbaum Associates. [Google Scholar]
- Cooney, G., Gilbert, D. T., & Wilson, T. D. (2016). When fairness matters less than we expect. Proceedings of the National Academy of Sciences of the United States of America, 113(40), 11168–11171. [Google Scholar] [CrossRef] [Scilit] [PubMed]
- Cropanzano, R., Goldman, B., & Folger, R. (2005). Self-interest: Defining and understanding a human motive. Journal of Organizational Behavior, 26(8), 985–991. [Google Scholar] [CrossRef] [Scilit]
- De Dreu, C. K. W., & Van Lange, P. A. M. (1995). The impact of social value orientations on negotiator cognition and behavior. Personality and Social Psychology Bulletin, 21(11), 1178–1188. [Google Scholar] [CrossRef] [Scilit]
- Ding, L., Jones, A. M., & Nie, P. (2022). Ex ante inequality of opportunity in health among the elderly in China: A distributional decomposition analysis of biomarkers. Review of Income and Wealth, 68(4), 922–950. [Google Scholar] [CrossRef] [Scilit]
- Faul, F., Erdfelder, E., Lang, A. G., & Buchner, A. (2007). G*Power 3: A flexible statistical power analysis program for the social, behavioral, and biomedical sciences. Behavior Research Methods, 39(2), 175–191. [Google Scholar] [CrossRef] [Scilit] [PubMed]
- Fehr, E., & Schmidt, K. M. (1999). A theory of fairness, competition, and cooperation. The Quarterly Journal of Economics, 114(3), 817–868. [Google Scholar] [CrossRef] [Scilit]
- Fujiwara, J., Usui, N., Park, S. Q., Williams, T., Iijima, T., Taira, M., Tsutsui, K.-I., & Tobler, P. N. (2013). Value of freedom to choose encoded by the human brain. Journal of Neurophysiology, 110(8), 1915–1929. [Google Scholar] [CrossRef] [Scilit] [PubMed]
- Gray-Lobe, G., Pathak, P. A., & Walters, C. R. (2023). The long-term effects of universal preschool in Boston. The Quarterly Journal of Economics, 138(1), 363–411. [Google Scholar] [CrossRef] [Scilit]
- Grocke, P., Rossano, F., & Tomasello, M. (2015). Procedural justice in children: Preschoolers accept unequal resource distributions if the procedure provides equal opportunities. Journal of Experimental Child Psychology, 140, 197–210. [Google Scholar] [CrossRef] [Scilit] [PubMed]
- Hilbig, B. E., Glöckner, A., & Zettler, I. (2014). Personality and prosocial behavior: Linking basic traits and social value orientations. Journal of Personality and Social Psychology, 107(3), 529–539. [Google Scholar] [CrossRef] [Scilit] [PubMed]
- Hu, X., & Mai, X. (2021). Social value orientation modulates fairness processing during social decision-making: Evidence from behavior and brain potentials. Social Cognitive and Affective Neuroscience, 16(7), 670–682. [Google Scholar] [CrossRef] [Scilit] [PubMed]
- Hu, X., Xu, Z., & Mai, X. (2017). Social value orientation modulates the processing of outcome evaluation involving others. Social Cognitive and Affective Neuroscience, 12(11), 1730–1739. [Google Scholar] [CrossRef] [Scilit] [PubMed]
- Jin, Y., Gao, Q., Wang, Y., Xiao, L., Wu, M. S., & Zhou, Y. (2022). The perception-behavior dissociation in the ultimatum game in unmedicated patients with major depressive disorders. Journal of Psychopathology and Clinical Science, 131(3), 253–264. [Google Scholar] [CrossRef] [Scilit] [PubMed]
- Kaiser, F. G., Kibbe, A., & Hentschke, L. (2021). Offsetting behavioral costs with personal attitudes: A slightly more complex view of the attitude-behavior relation. Personality and Individual Differences, 183, 111158. [Google Scholar] [CrossRef] [Scilit]
- Kim, J., Bong, S. H., Yoon, D., & Jeong, B. (2024). Prosocial emotions predict individual differences in economic decision-making during ultimatum game with dynamic reciprocal contexts. Scientific Reports, 14, 11397. [Google Scholar] [CrossRef] [Scilit] [PubMed]
- Klusowski, J., Small, D. A., & Simmons, J. P. (2021). Does choice cause an illusion of control? Psychological Science, 32(2), 159–172. [Google Scholar] [CrossRef] [Scilit] [PubMed]
- Krautwurm, P., & Wichardt, P. C. (2026). Preferences, goals and implications for paternalism. Economics and Philosophy, 42(1), 154–173. [Google Scholar] [CrossRef] [Scilit]
- Leotti, L. A., & Delgado, M. R. (2011). The inherent reward of choice. Psychological Science, 22(10), 1310–1318. [Google Scholar] [CrossRef] [Scilit] [PubMed]
- Li, Q., Zheng, Y., Xiao, J., Hu, K., & Yang, Z. (2025). Neural mechanisms of fairness decision-making: An EEG comparative study on opportunity equity and outcome equity. NeuroImage, 305, 120970. [Google Scholar] [CrossRef] [Scilit] [PubMed]
- Li, Z., Dong, D., & Qiao, J. (2023). The role of social value orientation in Chinese adolescents’ moral emotion attribution. Behavioral Sciences, 13(1), 3. [Google Scholar] [CrossRef] [Scilit] [PubMed]
- Liu, W., Zhang, X., Zhang, Y., & Yu, R. (2017). Fairness cognition–behavior gap in 4- to 8-year-old children: The role of social comparison. Acta Psychologica Sinica, 49(12), 1504–1512. [Google Scholar] [CrossRef] [Scilit]
- Long, C., Hu, X., Qi, G., & Zhang, L. (2022). Self-interest is intuitive during opportunity (in)equity: Evidence from multivariate pattern analysis of electroencephalography data. Neuropsychologia, 174, 108343. [Google Scholar] [CrossRef] [Scilit] [PubMed]
- Long, C., Sun, Q., Jia, S., Li, P., & Chen, A. (2018). Give me a chance! Sense of opportunity inequality affects brain responses to outcome evaluation in a social competitive context: An event-related potential study. Frontiers in Human Neuroscience, 12, 135. [Google Scholar] [CrossRef] [Scilit] [PubMed]
- Luo, L., Xu, H., Tian, X., Zhao, Y., Xiong, R., Dong, H., Li, X., Wang, Y., Luo, Y.-J., & Feng, C. (2024). The neurocomputational mechanism underlying decision-making on unfairness to self and others. Neuroscience Bulletin, 40(10), 1471–1488. [Google Scholar] [CrossRef] [Scilit] [PubMed]
- McAuliffe, K., Blake, P. R., Steinbeis, N., & Warneken, F. (2017). The developmental foundations of human fairness. Nature Human Behaviour, 1(2), 0042. [Google Scholar] [CrossRef] [Scilit]
- Murphy, R. O., & Ackermann, K. A. (2014). Social value orientation: Theoretical and measurement issues in the study of social preferences. Personality and Social Psychology Review, 18(1), 13–41. [Google Scholar] [PubMed]
- Nagatsu, M., Larsen, K., Karabegovic, M., Székely, M., Mønster, D., & Michael, J. (2018). Making good cider out of bad apples—Signaling expectations boosts cooperation among would-be free riders. Judgment and Decision Making, 13(1), 137–149. [Google Scholar] [CrossRef] [Scilit]
- Nezlek, J. B. (2024). Relationships between personal human values and social value orientation. PLoS ONE, 19(11), e0312795. [Google Scholar] [CrossRef] [Scilit] [PubMed]
- Norman, G. (2010). Likert scales, levels of measurement and the “laws” of statistics. Advances in Health Sciences Education, 15(5), 625–632. [Google Scholar] [CrossRef] [Scilit] [PubMed]
- Pauwels, L., Declerck, C. H., Boone, C., Diaz-Gutierrez, P., & Lambert, B. (2022). Does power corrupt? An fMRI study on the effect of power and social value orientation on inequity aversion. Journal of Neuroscience, Psychology, and Economics, 15(4), 222–240. [Google Scholar] [CrossRef] [Scilit]
- Pletzer, J. L., Balliet, D., Joireman, J., Kuhlman, D. M., Voelpel, S. C., & Van Lange, P. A. M. (2018). Social value orientation, expectations, and cooperation in social dilemmas: A meta-analysis. European Journal of Personality, 32(1), 62–83. [Google Scholar] [CrossRef] [Scilit]
- Rawls, J. (1971). A theory of justice. Harvard University Press. [Google Scholar]
- Saito, K. (2013). Social preferences under risk: Equality of opportunity versus equality of outcome. The American Economic Review, 103(7), 3084–3101. [Google Scholar] [CrossRef] [Scilit]
- Shaw, A., & Olson, K. (2014). Fairness as partiality aversion: The development of procedural justice. Journal of Experimental Child Psychology, 119, 40–53. [Google Scholar] [CrossRef] [Scilit] [PubMed]
- Sheeran, P., & Webb, T. L. (2016). The intention–behavior gap. Social and Personality Psychology Compass, 10(9), 503–518. [Google Scholar] [CrossRef] [Scilit]
- Sun, Q., Long, C., & Chen, A. (2018). The neural signs of opportunity equality during outcome evaluation. Chinese Journal of Applied Psychology, 24(2), 113–122. [Google Scholar]
- Sun, Q., Zhou, J., & Liu, Y. (2022). Effects of self-social value orientation and other’s social value orientation on cooperative behavior and its underlying mechanisms. Studies of Psychology and Behavior, 20(6), 821–827. [Google Scholar]
- Thibaut, J., & Walker, L. (1975). Procedural justice: A psychological analysis. Lawrence Erlbaum. [Google Scholar]
- Trautmann, S. T., & van de Kuilen, G. (2016). Process fairness, outcome fairness, and dynamic consistency: Experimental evidence for risk and ambiguity. Journal of Risk and Uncertainty, 53(2–3), 75–88. [Google Scholar] [CrossRef] [Scilit]
- Van Lange, P. A. M. (1999). The pursuit of joint outcomes and equality in outcomes: An integrative model of social value orientation. Journal of Personality and Social Psychology, 77(2), 337–349. [Google Scholar] [CrossRef] [Scilit]
- Van Lange, P. A. M., Bekkers, R., Schuyt, T. N. M., & Van Vugt, M. (2007). From games to giving: Social value orientation predicts donations to noble causes. Basic and Applied Social Psychology, 29(4), 375–384. [Google Scholar] [CrossRef] [Scilit]
- Van Lange, P. A. M., Otten, W., De Bruin, E. M. N., & Joireman, J. A. (1997). Development of prosocial, individualistic, and competitive orientations: Theory and preliminary evidence. Journal of Personality and Social Psychology, 73(4), 733–746. [Google Scholar] [CrossRef] [Scilit] [PubMed]
- Yan, H., Fu, C., Zhang, M., Zhao, X., Luo, J., & Li, J. (2026). Social value orientation and cooperative behavior: A moderated mediation model. Acta Psychologica, 269, 107476. [Google Scholar] [CrossRef] [Scilit] [PubMed]
- Yang, Z., Zheng, Y., Wang, C., Lai, X., Hu, K., Li, Q., & Liu, X. (2022). Fairness decision-making of opportunity equity in gain and loss contexts. Journal of Experimental Social Psychology, 98, 104243. [Google Scholar] [CrossRef] [Scilit]
- You, T., Zhang, L., Qi, G., & Long, C. (2023). Opportunity (in)equity affects outcome evaluation at an early cognitive stage. Acta Psychologica Sinica, 55(12), 1997–2012. [Google Scholar] [CrossRef] [Scilit]
- Zhou, G., Liu, L., & Song, Y. (2022). Inequality of opportunity and mass incidents: Evidence from China. Economics of Transition and Institutional Change, 30(3), 465–488. [Google Scholar] [CrossRef] [Scilit]

Disclaimer/Publisher’s Note: The statements, opinions and data contained in all publications are solely those of the individual author(s) and contributor(s) and not of MDPI and/or the editor(s). MDPI and/or the editor(s) disclaim responsibility for any injury to people or property resulting from any ideas, methods, instructions or products referred to in the content. |
© 2026 by the authors. Licensee MDPI, Basel, Switzerland. This article is an open access article distributed under the terms and conditions of the Creative Commons Attribution (CC BY) license.