


Abstract
Sleep disturbance symptoms are common during adolescence and may be associated with affective difficulties and health-related behaviors. This cross-sectional study examined sleep disturbance profiles in relation to anxiety and stress symptoms and risky headphone-use behaviors among 2828 middle- and high-school students in Lianyungang, China. Participants were recruited using stratified multistage cluster sampling. Latent profile analysis identified profiles of nighttime sleep disturbance and daytime dysfunction. Multiple linear regression models estimated adjusted associations with the study outcomes. Three latent profiles were identified. Anxiety and stress symptom scores increased from Profile 1 to Profile 3. Risky headphone-use scores were higher in Profiles 2 and 3 than in Profile 1, with no significant difference between Profiles 2 and 3. Longitudinal studies are needed to clarify the temporal ordering of these associations.
1. Introduction
Adolescence is a critical developmental period accompanied by substantial psychosocial and behavioral changes that may increase vulnerability to sleep disturbance symptoms (Chen et al., 2021). Academic demands, interpersonal challenges, parental expectations, and extensive use of electronic devices have all been associated with poorer sleep among adolescents (Xiong et al., 2019). Sleep problems are also associated with impaired concentration, poorer academic performance, and reduced psychological well-being (Díez et al., 2024). Despite increasing concern about adolescent sleep, comparatively little research has examined its relationship with risky headphone-use behaviors, which are common in adolescents’ daily lives. Clarifying this association may therefore provide useful evidence for adolescent health promotion.
Sleep disturbance symptoms can adversely affect adolescents’ physical, psychological, and cognitive functioning (American Psychiatric Association, 2022; Medic et al., 2017). Epidemiological studies have reported a high prevalence of sleep problems among Chinese adolescents, which may reflect differences in academic demands, daily schedules, and lifestyle characteristics across settings (Chen et al., 2021; Otsuka et al., 2021). Importantly, sleep problems are heterogeneous: adolescents may differ in the relative severity of nighttime disturbance and daytime dysfunction. Person-centered methods such as latent profile analysis can identify such subgroups and may clarify whether their emotional and behavioral correlates differ. However, few studies have examined sleep-symptom profiles in relation to both affective symptoms and risky headphone-use behaviors.
1.1. Sleep Disturbance Symptoms Among Adolescents
Adolescence is a critical period of physical and psychological development, during which adequate sleep supports cognitive, emotional, and physiological functioning (Mason et al., 2021; Pavlova & Latreille, 2019). Physiological changes, academic demands, and lifestyle factors may contribute to sleep disturbance symptoms in this population (Baddam et al., 2024). Such symptoms are common among adolescents and are associated with impaired daily functioning and poorer well-being (Gemke et al., 2024; Sateia, 2014; Trosman & Ivanenko, 2021).
1.2. Sleep Disturbance Symptoms, Anxiety, and Stress
Sleep disturbance symptoms have been associated with anxiety and stress symptoms in adolescents (Lazaratou et al., 2012; Palmer et al., 2020). Anxiety and stress are conceptually distinct affective constructs and were therefore measured separately in the present study. Poor or insufficient sleep has also been linked to attentional difficulties and more frequent negative emotional experiences (Danker-Hopfe, 2011; Kansagra, 2020; Lazaratou et al., 2012; Lofthouse et al., 2009; Mesurado et al., 2018). Accordingly, we hypothesized that greater sleep disturbance symptoms would be associated with higher levels of anxiety and stress symptoms among adolescents.
1.3. Sleep Disturbance Symptoms and Risky Headphone-Use Behaviors
Beyond affective symptoms, sleep disturbance may also be associated with potentially risky headphone-use behaviors. In the present study, these behaviors include prolonged headphone use, uninterrupted listening, and listening at increased volume in noisy environments (Mazlan et al., 2002). The outcome therefore measures listening practices rather than auditory impairment. Protection Motivation Theory (Rogers, 1975) provides a framework for understanding health-risk appraisal and protective behavior, but it does not specify a direct pathway from sleep disturbance to risky headphone use.
Effortful control refers to the ability to regulate immediate responses in pursuit of longer-term goals (Dennis et al., 2007). Poor or insufficient sleep may impair inhibitory control and self-regulation and is associated with greater risk-taking (Guarana et al., 2021; Killgore, 2015). Impaired self-regulation may therefore help explain the association between sleep disturbance symptoms and risky headphone-use behaviors. However, self-control was not measured, and this proposed mechanism could not be tested in the present study.
Few studies have directly examined sleep disturbance in relation to risky headphone-use behaviors. Adolescents may engage in prolonged or high-volume listening despite awareness of potential health risks, and headphone use may also serve as distraction or mood regulation for some individuals. Because coping motives were not assessed, this possibility remains speculative. Based on these considerations, we hypothesized a positive cross-sectional association between sleep disturbance symptoms and risky headphone-use behaviors among adolescents.
1.4. Latent Profile Analysis of Sleep Disturbance Symptoms
Latent profile analysis (LPA) is a person-centered method that identifies latent subgroups based on patterns across observed indicators (Collins & Lanza, 2010; Wang & Hanges, 2011). In the present study, LPA was used to characterize heterogeneous patterns of nighttime sleep disturbance and daytime dysfunction and to examine the cross-sectional associations of these profiles with anxiety, stress symptoms, and risky headphone-use behaviors.
1.5. Current Study
Few studies have examined how anxiety, stress symptoms, and risky headphone-use behaviors vary across adolescent sleep disturbance profiles. We used LPA to identify profiles of nighttime sleep disturbance and daytime dysfunction, compared the study outcomes across profiles, and estimated adjusted associations using regression models. The cross-sectional design precludes conclusions about causality or temporal ordering.
2. Methods
2.1. Participants and Procedures
This cross-sectional survey was conducted in September 2023 among middle- and high-school students in Lianyungang, Jiangsu Province, using stratified multistage cluster sampling. Twenty-seven schools were selected according to the local monitoring protocol. Within each selected school, at least two classes per grade were randomly selected, and all students in those classes were invited to participate. The present analysis included students who reported headphone use and otherwise met the survey eligibility criteria.
Before the de-identified dataset was provided to the research team, the Lianyungang Center for Disease Control and Prevention conducted routine quality control, including the exclusion of questionnaires with logical inconsistencies. The dataset available for this secondary analysis contained 2873 records. Percentile-based trimming was applied only to active screen time (AST) and passive screen time (PST); sleep, anxiety, stress, and headphone-use variables were not trimmed. Records were excluded if either AST or PST was below the 1st percentile or above the 99th percentile because some upper-tail responses approached 24 h/day for a single screen-time component and were considered implausible (Gyu & JongHae, 2017; Knebel et al., 2022). This procedure excluded 45 records (1.57%), leaving 2828 participants in the final analytic sample. Missing data were rare and were handled by listwise deletion.
No formal a priori power or sample-size calculation was performed. The available analytic sample of 2828 participants was used for the planned regression and latent profile analyses.
2.2. Measures
2.2.1. Sleep Disturbance Symptoms
The Pittsburgh Sleep Quality Index (PSQI) was used to assess sleep during the previous month (Buysse et al., 1989; Liu et al., 1996). The LPA included nine nighttime sleep disturbance items and two daytime dysfunction items. The nighttime items covered experiences such as nocturnal awakening, breathing difficulty, coughing or loud snoring, feeling too cold or too hot, nightmares, pain or discomfort, and other sleep-disrupting events. The daytime items assessed sleepiness and difficulty maintaining enthusiasm or energy for daily activities. All items were scored from 0 to 3, with higher scores indicating more frequent or severe symptoms. Following prior work supporting a common latent dimension involving sleep disturbance and daytime dysfunction (Cole et al., 2006), all 11 indicators were analyzed jointly. Cronbach’s α for the sleep-disturbance measure was 0.834 in this sample.
2.2.2. Anxiety and Stress Symptoms
Two subscales of the Depression Anxiety Stress Scales-21 (DASS-21) (Antony et al., 1998) were used to measure anxiety and stress symptoms separately.
The DASS-21 Anxiety subscale (7 items) assesses autonomic arousal, situational anxiety, and anxious affect (e.g., “I felt I was close to panic” and “I felt scared without any good reason”). The DASS-21 Stress subscale (7 items) assesses chronic nonspecific arousal, difficulty relaxing, and nervous tension (e.g., “I found it hard to wind down” and “I tended to over-react to situations”). Each item is rated from 0 (did not apply to me at all) to 3 (applied to me very much or most of the time). The seven item scores are summed for each subscale, yielding a score range of 0–21, with higher scores indicating greater anxiety or stress symptom severity.
In the current sample, Cronbach’s α was 0.939 for the DASS-21 Anxiety subscale and 0.906 for the DASS-21 Stress subscale, indicating high internal consistency for both measures.
2.2.3. Risky Headphone-Use Behaviors
Risky headphone-use behaviors were assessed using three items (F02–F04) from the Student Common Diseases and Health Factors Monitoring Questionnaire administered by the Lianyungang Center for Disease Control and Prevention as part of provincial student health monitoring. The items assessed (1) average daily headphone-use duration during the previous 7 days (F02; 0–4 points), (2) frequency of uninterrupted listening for more than 60 min during the previous 7 days (F03; 0–5 points), and (3) frequency of headphone use for at least 30 min in noisy environments in which the listening volume had to be increased (e.g., subway or bus; F04; 0–5 points).
The three items capture complementary aspects of potentially risky headphone use: overall duration, prolonged uninterrupted listening, and listening in noisy environments requiring increased volume. The item scores were coded in the same direction and summed without weighting to create a study-specific Headphone Risk Score (HRS), with higher scores indicating more frequent risky listening practices. Total scores ranged from 0 to 14 and were treated as continuous in the primary analyses. Cronbach’s α for the three-item HRS was 0.810 in the present sample. The HRS should be interpreted as a behavioral composite rather than as a validated clinical measure of auditory risk.
2.2.4. Covariates
Covariates included gender, grade, boarding status (school accommodation), sick leave (short-term absence from school due to illness), medical leave of absence (formal leave from school for medical reasons), outdoor activity duration, and electronic screen time. Outdoor activity was assessed by asking, “How much time did you spend outdoors during the day in the past week?” Response categories were “<1 h,” “1–2 h,” “2–3 h,” “≥3 h,” and “don’t know.” Electronic screen use was assessed as active screen time (AST) and passive screen time (PST). AST referred to screen use requiring ongoing user input or content creation, whereas PST referred to primarily one-way content consumption with minimal interaction. Both variables were recorded continuously in minutes per day.
2.3. Statistical Analysis
Descriptive statistics were used to summarize sociodemographic and daily-life characteristics. Categorical variables are presented as counts and percentages. Continuous variables are presented as means with standard deviations or standard errors, as specified in the corresponding tables.
Latent profile models with one to five profiles were estimated using the 11 PSQI indicators in Mplus version 8.3 (Muthén & Muthén, Los Angeles, CA, USA) with robust maximum likelihood estimation (MLR). Although the item scores were ordinal (0–3), they were treated as continuous indicators in the primary analysis, consistent with prior PSQI-based LPA applications (Li et al., 2025). In a sensitivity analysis, models with one to five classes were estimated using MLR in the same software, with all 11 items specified as ordered categorical indicators.
Model selection was based on the Akaike information criterion (AIC), Bayesian information criterion (BIC), sample-size-adjusted BIC (aBIC), entropy, the likelihood-ratio test (LRT), the bootstrap likelihood-ratio test (BLRT), minimum profile or class size, substantive interpretability, and parsimony (Nylund et al., 2007). The LRT and BLRT compared each k-profile model with the corresponding (k − 1)-profile model; p < 0.05 favored the model with k profiles. The BLRT used parametric bootstrap samples to obtain the reference distribution of the likelihood-ratio statistic. Higher entropy indicated better classification quality. A minimum profile size of 5% was specified a priori. The final solution was selected by considering these criteria jointly and assessing whether additional profiles represented substantively distinct patterns.
Categorical and continuous characteristics were compared across profiles using chi-square tests and one-way ANOVA, respectively. Anxiety, stress symptoms, and risky headphone-use behaviors were compared using one-way ANOVA with Bonferroni-adjusted pairwise comparisons. Multiple linear regression models were then used to estimate adjusted cross-sectional associations. A prespecified covariate-selection rule was applied separately to the three- and four-profile solutions: variables associated with profile membership in univariable analyses at p < 0.05 were included in the corresponding regression models. The primary models adjusted for gender, boarding status, sick leave, medical leave of absence, AST, and PST. Grade met the selection criterion only in the four-profile solution and was therefore additionally included in the sensitivity models. Because students were nested within 27 schools, regression standard errors were estimated using school-level cluster-robust methods. No additional multiplicity correction was applied to the regression coefficients. Statistical significance was defined as p < 0.05.
3. Results
3.1. Latent Profiles of Adolescent Sleep Disturbance Symptoms
Table 1 summarizes the fit indices for the one- to five-profile solutions. AIC, BIC, and aBIC decreased as additional profiles were added. The three-profile solution showed high classification accuracy (entropy = 0.931). Although the four-profile solution had lower information-criterion values and met the prespecified minimum profile-size criterion, its entropy was slightly lower (0.918), and the additional profile did not provide a sufficiently distinct and substantively interpretable pattern. The five-profile solution contained a profile representing only 4.07% of the sample, below the prespecified 5% threshold. Considering statistical fit, classification quality, interpretability, and parsimony, the three-profile solution was retained as the primary model. The four-profile solution is examined further in the sensitivity analyses.
Table 1.
Fit indices for the latent profile models.
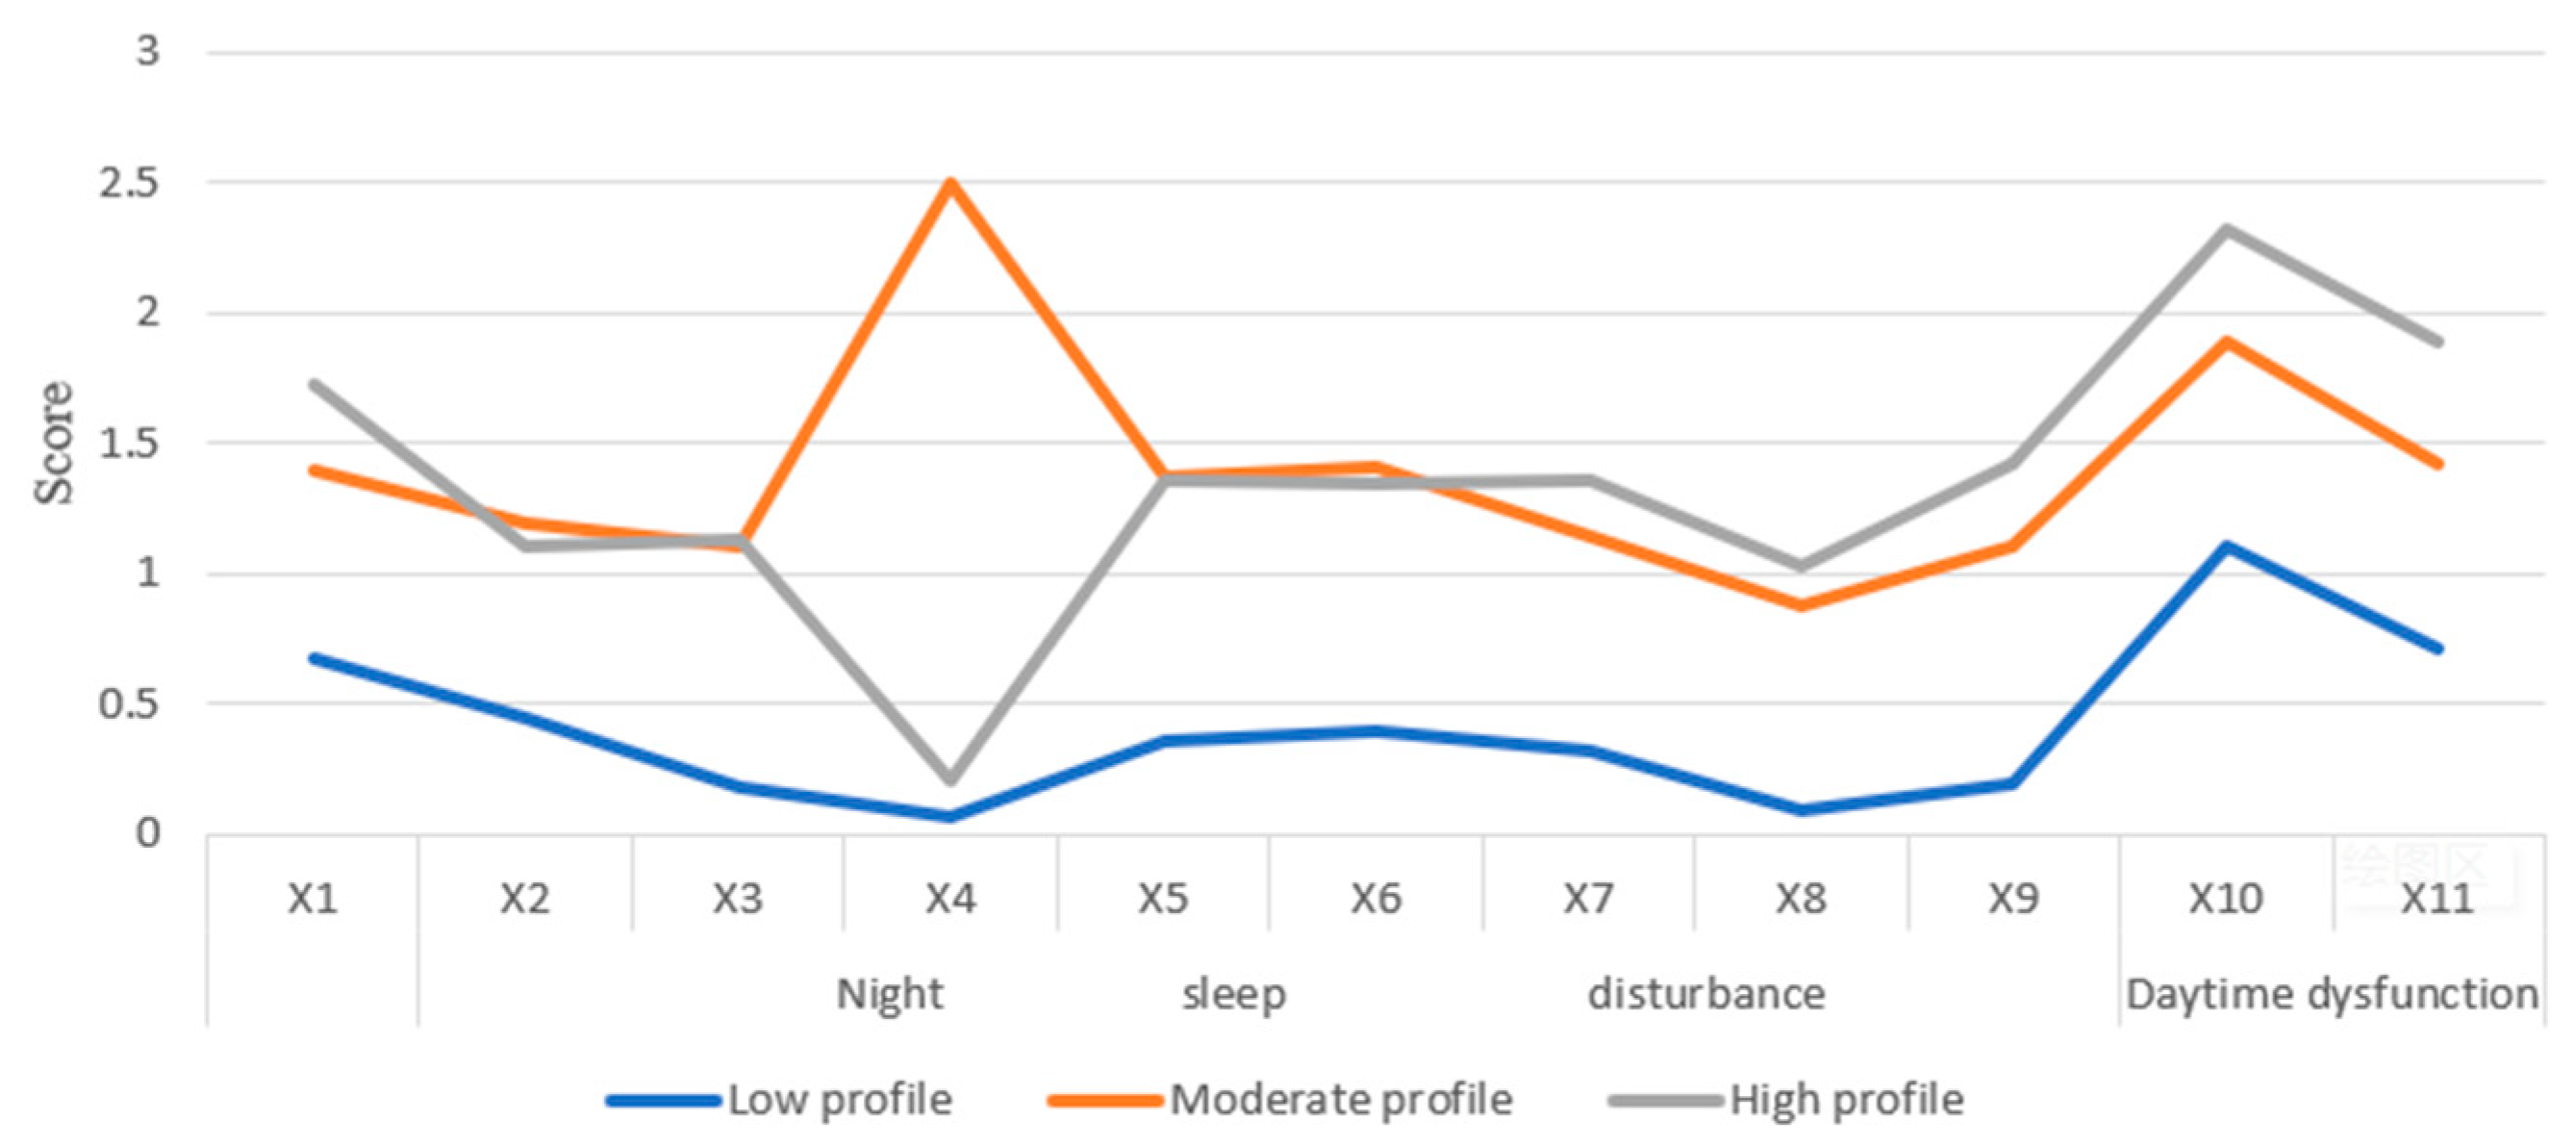
As shown in Figure 1, three latent profiles were identified. Profile 1 included 1963 adolescents (69.41%) and was characterized by generally low levels of nighttime sleep disturbance and daytime dysfunction. Profile 2 included 215 adolescents (7.60%) and showed an intermediate overall symptom pattern, but with a notably higher score on item X4 than Profile 3. Profile 3 included 650 adolescents (22.98%) and was characterized by generally higher levels of nighttime sleep disturbance and daytime dysfunction than Profile 1, although its score on item X4 was lower than that of Profile 2. For descriptive purposes, the profiles are referred to as low, moderate, and high sleep-disturbance/daytime-dysfunction profiles, respectively, with these labels interpreted as relative rather than absolute severity descriptors.
Figure 1.
Characteristic profiles of sleep disturbance symptoms based on nighttime sleep disturbance and daytime dysfunction. X1–X9 represent items assessing nighttime sleep disturbance; X10–X11 represent items assessing daytime dysfunction.
3.2. Sociodemographic and Daily-Life Characteristics Across Latent Sleep Symptom Profiles
Among the 2828 adolescents included in the analysis, 1353 (47.8%) were female, and 1475 (52.2%) were male. The grade distribution was as follows: Grade 7, 250 (8.8%); Grade 8, 292 (10.3%); Grade 9, 349 (12.3%); Grade 10, 621 (22.0%); Grade 11, 641 (22.7%); and Grade 12, 675 (23.9%). A total of 1332 participants (47.1%) were boarding students, and 1496 (52.9%) were day students. Additional descriptive statistics by latent profile are presented in Table 2.
Table 2.
Sociodemographic and daily-life characteristics across latent sleep-symptom profiles.
With the exception of grade level and outdoor activity duration, the characteristics shown in Table 2 differed significantly across the latent profiles (p < 0.05). Variables included in the final adjusted regression models are specified in Section 2.3.
3.3. Anxiety, Stress, and Risky Headphone-Use Behaviors Across Latent Sleep Symptom Profiles
One-way ANOVA showed significant differences across the three profiles in anxiety (F = 276.151, p < 0.001), stress symptoms (F = 244.443, p < 0.001), and risky headphone-use behaviors (F = 21.716, p < 0.001). Bonferroni-adjusted pairwise comparisons showed that anxiety and stress scores were highest in Profile 3, intermediate in Profile 2, and lowest in Profile 1, with all pairwise differences significant at p < 0.001.
For risky headphone-use behaviors, Profile 1 had the lowest mean score. Profiles 2 and 3 both had higher scores than Profile 1, whereas the difference between Profiles 2 and 3 was not statistically significant. Detailed descriptive statistics and Bonferroni-adjusted pairwise comparisons are presented in Table 3.
Table 3.
Anxiety, stress symptoms, and risky headphone-use behaviors across latent sleep-symptom profiles.
3.4. Multiple Linear Regression Analyses of Sleep Disturbance, Anxiety, Stress, and Risky Headphone-Use Behaviors
Before fitting the regression models, multicollinearity and residual diagnostics were examined. Variance inflation factor values ranged from 1.01 to 1.96 and tolerance values from 0.51 to 0.99, indicating no evidence of serious multicollinearity. Residual diagnostics did not indicate substantial violations of the linear-model assumptions. School-level cluster-robust standard errors were used to account for within-school dependence among students.
Table 4 and Table 5 summarize the adjusted regression models for anxiety and stress symptoms. In Model 1, nighttime sleep disturbance and daytime dysfunction were positively associated with both anxiety and stress symptoms (all p < 0.001). The standardized coefficients were larger for daytime dysfunction than for nighttime sleep disturbance for both affective outcomes. In Model 2, compared with the low profile, the moderate profile was associated with higher anxiety (B = 2.762, p < 0.001) and stress scores (B = 2.611, p < 0.001), and the high profile showed larger positive coefficients (B = 4.587 for anxiety and B = 4.062 for stress; both p < 0.001). Among the covariates, female gender and school accommodation were associated with anxiety. School accommodation and AST were associated with stress, and female gender was additionally associated with stress in Model 2.
Table 4.
Multiple linear regression models for anxiety (N = 2828).
Table 5.
Multiple linear regression models for stress symptoms (N = 2828).
Table 6 summarizes the regression models for risky headphone-use behaviors. In Model 1, nighttime sleep disturbance symptoms were positively associated with the HRS, whereas daytime dysfunction was not significantly associated with this score. In Model 2, the moderate and high profiles were associated with higher HRS values than the low profile (B = 0.600, p < 0.05 and B = 0.551, p < 0.001, respectively). The coefficient for the high profile was not larger than that for the moderate profile. Gender, sick leave, medical leave of absence, and AST were also associated with the HRS in the adjusted models.
Table 6.
Multiple linear regression models for risky headphone-use behaviors (N = 2828).
3.5. Sensitivity Analysis
In a sensitivity analysis, the models were re-estimated with all 11 PSQI items specified as ordered categorical indicators. This analysis supported a four-class solution (Supplementary Table S1A). Cross-classification with the primary three-profile solution showed that 90.3% of participants in the low profile were assigned to the low or moderate classes, whereas 92.9% of those in the high profile were assigned to the high or severe classes (Supplementary Table S1B). Participants in the moderate profile were more widely distributed across classes. Thus, correspondence was strongest at the lower and upper ends of symptom severity, without exact one-to-one agreement between the two solutions.
Separately, a profile-enumeration sensitivity analysis fitted an alternative four-profile model while retaining the continuous-indicator specification used in the primary analysis. The four-profile model had acceptable classification quality (entropy = 0.918), and its smallest profile represented 9.65% of the sample. The additional profile appeared to subdivide participants with greater overall symptom burden rather than to produce a fundamentally different profile structure (Supplementary Figure S1). Sociodemographic and daily-life characteristics for the four-profile solution are reported in Supplementary Table S2.
Between-profile comparisons further supported the overall pattern observed in the primary analysis (Supplementary Table S3). Significant overall differences were observed across the four profiles for anxiety, stress, and risky headphone-use behaviors. For anxiety and stress, Profile 1 had the lowest mean scores and Profile 4 the highest, whereas Profiles 2 and 3 showed comparable intermediate levels and did not differ significantly from each other in the post hoc comparisons. Risky headphone-use behaviors also differed across profiles, with Profile 1 showing the lowest and Profile 4 the highest descriptive scores, although the pairwise differences were less consistently graded than those observed for anxiety and stress. Adjusted regression analyses yielded findings that were directionally consistent with the primary analysis. Compared with the low profile, the moderate, high, and severe profiles were all positively associated with anxiety (Supplementary Table S4) and stress (Supplementary Table S5). A similar pattern was observed for risky headphone-use behaviors, for which all three profiles showed positive associations relative to the low profile (Supplementary Table S6).
In the sensitivity analysis using four profiles and continuous indicators, regression coefficients differed in magnitude, but the directions and overall interpretations of the associations remained consistent with those in the primary three-profile analysis.
4. Discussion
The three latent profiles primarily differed in the overall severity of nighttime sleep disturbance and daytime dysfunction. Anxiety and stress symptom scores increased from the low to the high profile. Risky headphone-use scores were higher in the moderate and high profiles than in the low profile, with no significant difference between the moderate and high profiles. Thus, the behavioral findings did not show a clear gradient across all three profiles.
Consistent with prior literature (Lofthouse et al., 2009; Palmer et al., 2020; Tomaso et al., 2021), sleep disturbance was associated with higher anxiety and stress symptom scores in the present sample. This study extends previous findings by showing that these outcomes varied across empirically derived sleep-symptom profiles. One possible explanation is that insufficient or disturbed sleep may reduce resources available for self-regulation (Baumeister et al., 1998), although this mechanism was not directly tested. The regression models explained only part of the variation in the outcomes, indicating that their explanatory power was limited.
The findings also suggest an association between sleep disturbance profiles and potentially risky listening practices. The HRS measures these practices; it does not assess auditory impairment or provide a validated clinical estimate of auditory risk. Experimental work suggests that stress can shift behavior toward more habitual responding (Schwabe & Wolf, 2009). This may help explain the co-occurrence of psychological distress and less health-conscious listening practices, although neither mediation nor causal pathways were tested. Overall, these findings do not establish a dose–response relationship between sleep disturbance severity and risky headphone use.
Some adolescents may use headphones to regulate mood, distract themselves, or cope with psychological distress. This explanation remains speculative because coping motives were not measured. Reverse or bidirectional associations are also possible: prolonged or late-night headphone use may disrupt sleep routines, although this possibility was not assessed. The direction of the observed association therefore remains uncertain. Environmental and social factors, including access to portable audio devices and youth media habits, may further shape headphone-use practices (Portnuff, 2016; Vogel et al., 2014).
Taken together, the findings place adolescent sleep disturbance within a broader pattern of affective symptoms and health-related behaviors. Combining person-centered sleep profiles with emotional and behavioral measures may help identify groups that warrant further longitudinal investigation. Future studies should examine whether sleep, psychological distress, self-regulation, and headphone-use practices change together over time and should directly assess coping motives and other proposed mechanisms.
5. Limitations
This study has several limitations. First, participants were recruited from a single geographic area, and all reported headphone use, which limits generalizability to adolescents in other regions and to those who rarely or never use headphones. The cultural and educational context of the study should also be considered when interpreting the findings.
Second, all measures were self-reported and therefore susceptible to recall bias, reporting bias, and common-method variance. No objective sleep measures or device-based listening data were available. The HRS was constructed from three monitoring-questionnaire items and has not been independently validated as a standardized instrument. Accordingly, “risk” describes listening practices and does not represent a validated estimate of individual auditory risk. Although the HRS showed acceptable internal consistency in this sample (Cronbach’s α = 0.810), its construct validity and generalizability require evaluation in independent samples. Future studies should incorporate objective sleep assessments, including polysomnography where clinically appropriate (Stowe & Afolabi-Brown, 2020), and device-based listening measures.
Third, the cross-sectional design precludes conclusions about causality or temporal ordering among sleep disturbance symptoms, anxiety, stress, and risky headphone-use behaviors. Self-control and coping motives were not directly measured, so the proposed psychological explanations could not be tested. Longitudinal studies incorporating objective measures and direct assessments of these mechanisms are needed to clarify temporal and psychological pathways.
Fourth, clustering was not handled consistently across all analyses. The regression models used school-level cluster-robust standard errors to account for students nested within 27 schools, whereas clustering was not explicitly modeled in the ANOVA or LPA. Consequently, ANOVA inference and the estimated profile solution may have been affected by within-school dependence. Future work should evaluate the robustness of these results using multilevel or other clustering-adjusted approaches throughout the analytical framework.
In addition, covariate selection was partly informed by preliminary analyses. Grade was not included in the primary regression models, although it was additionally adjusted for in the four-profile sensitivity models. Because a nonsignificant univariable association does not rule out confounding, residual confounding by grade or other measured and unmeasured factors cannot be excluded.
Finally, percentile-based exclusion of extreme AST/PST values may have removed some valid observations. Because no sensitivity analysis retained the 45 excluded records, the robustness of the findings to this data-cleaning decision cannot be fully evaluated.
6. Conclusions
This study identified three latent profiles of nighttime sleep disturbance and daytime dysfunction in adolescents. Anxiety and stress symptom scores increased from the low to the high profile. Risky headphone-use scores were higher in the moderate and high profiles than in the low profile, with no significant difference between the two higher profiles. Longitudinal studies are needed to clarify the temporal ordering and potential mechanisms of these associations.
Supplementary Materials
The following supporting information can be downloaded at: https://www.mdpi.com/article/10.3390/bs16112049/s1, Table S1A: Ordered-categorical latent class models; Table S1B: Correspondence of participant classification between the primary and ordered-categorical solutions; Table S2: Distribution characteristics of sociodemographic and daily life factors under the sleep disturbance symptoms model; Table S3: One-way ANOVA results for anxiety, stress and risky headphone-use behaviors across distinct latent sleep symptom profiles; Table S4: Linear regression: sleep disturbance symptoms associated with anxiety (N = 2828); Table S5: Linear regression: sleep disturbance symptoms associated with stress (N = 2828); Table S6: Linear regression: sleep disturbance symptoms associated with risky headphone-use behaviors (N = 2828); Figure S1: Characteristic profile of potential sleep disturbance symptom categories based on nighttime sleep disturbances and daytime functional impairment.
Author Contributions
J.L. (Jiahao Liu): Conceptualization, Data Curation, Validation, and Writing—Original Draft Preparation, Writing—Review & Editing; R.Y.: Conceptualization, Writing—Review & Editing; L.M.: Conceptualization, Data Curation, Writing—Original Draft Preparation; M.C.: Investigation, Resources, Validation, Writing—Review & Editing; J.L. (Jiayi Lu): Investigation, Conceptualization, Validation, Data Curation; Z.L.: Methodology, Software, Conceptualization, Formal Analysis; F.G.: Methodology, Investigation, Resources, Conceptualization, Supervision; X.Z.: Conceptualization, Supervision, Project Administration, Writing—Review & Editing; Y.T.: Conceptualization, Supervision, Methodology, Project Administration, Writing—Review & Editing. All authors have read and agreed to the published version of the manuscript.
Funding
This research received no external funding.
Institutional Review Board Statement
The original data were collected by the Lianyungang Center for Disease Control and Prevention (Lianyungang CDC) as part of routine public health surveillance of students’ common diseases. The Ethics Review Committee of the Lianyungang CDC confirmed that a separate ethics review was not required for this surveillance activity. The present secondary analysis used fully de-identified data and involved no new contact with participants.
Informed Consent Statement
The source project was routine public health surveillance. As confirmed by the Ethics Review Committee of the Lianyungang CDC, separate informed consent was not required for the surveillance activity. The present study used only existing, fully de-identified data; therefore, no additional informed consent was required.
Data Availability Statement
Restrictions apply to the availability of these data. The data were obtained from the Lianyungang Center for Disease Control and Prevention (Lianyungang CDC) and may be available from the corresponding author upon reasonable request and with permission from the Lianyungang CDC.
Acknowledgments
The authors thank the anonymous reviewers and the Editor of Behavioral Sciences for their constructive comments on the manuscript.
Conflicts of Interest
The authors declare no conflicts of interest.
References
- American Psychiatric Association. (2022). Diagnostic and statistical manual of mental disorders (5th ed., text revision ed.). American Psychiatric Association Publishing. [Google Scholar] [CrossRef] [Scilit]
- Antony, M. M., Bieling, P. J., Cox, B. J., Enns, M. W., & Swinson, R. P. (1998). Psychometric properties of the 42-item and 21-item versions of the Depression Anxiety Stress Scales in clinical groups and a community sample. Psychological Assessment, 10(2), 176–181. [Google Scholar] [CrossRef]
- Baddam, S. K. R., Canapari, C. A., van de Grift, J., McGirr, C., Nasser, A. Y., & Crowley, M. J. (2024). Screening and evaluation of sleep disturbances and sleep disorders in children and adolescents. Psychiatric Clinics of North America, 47(1), 65–86. [Google Scholar] [CrossRef] [Scilit] [PubMed]
- Baumeister, R. F., Bratslavsky, E., Muraven, M., & Tice, D. M. (1998). Ego depletion: Is the active self a limited resource? Journal of Personality and Social Psychology, 74(5), 1252–1265. [Google Scholar] [CrossRef] [Scilit] [PubMed]
- Buysse, D. J., Reynolds, C. F., 3rd, Monk, T. H., Berman, S. R., & Kupfer, D. J. (1989). The Pittsburgh Sleep Quality Index: A new instrument for psychiatric practice and research. Psychiatry Research, 28(2), 193–213. [Google Scholar] [CrossRef] [Scilit] [PubMed]
- Chen, X. R., Ke, Z. L., Chen, Y. H., & Lin, X. X. (2021). The prevalence of sleep problems among children in mainland China: A meta-analysis and systemic-analysis. Sleep Medicine, 83, 248–255. [Google Scholar] [CrossRef] [Scilit] [PubMed]
- Cole, J. C., Motivala, S. J., Buysse, D. J., Oxman, M. N., Levin, M. J., & Irwin, M. R. (2006). Validation of a 3-factor scoring model for the Pittsburgh Sleep Quality Index in older adults. Sleep, 29(1), 112–116. [Google Scholar] [CrossRef] [Scilit] [PubMed]
- Collins, L. M., & Lanza, S. T. (2010). Latent class and latent transition analysis: With applications in the social, behavioral, and health sciences (Vol. 14, pp. 24–31). Wiley. [Google Scholar] [CrossRef] [Scilit]
- Danker-Hopfe, H. (2011). Growth and development of children with a special focus on sleep. Progress in Biophysics and Molecular Biology, 107(3), 333–338. [Google Scholar] [CrossRef] [Scilit] [PubMed]
- Dennis, T. A., Brotman, L. M., Huang, K. Y., & Gouley, K. K. (2007). Effortful control, social competence, and adjustment problems in children at risk for psychopathology. Journal of Clinical Child and Adolescent Psychology, 36(3), 442–454. [Google Scholar] [CrossRef] [Scilit] [PubMed]
- Díez, M., Jiménez-Iglesias, A., Paniagua, C., & García-Moya, I. (2024). The role of perfectionism and parental expectations in the school stress and health complaints of secondary school students. Youth & Society, 56(5), 885–906. [Google Scholar] [CrossRef] [Scilit]
- Gemke, R., Burger, P., & Steur, L. M. H. (2024). Sleep disorders in children: Classification, evaluation, and management. A review. European Journal of Pediatrics, 184(1), 39. [Google Scholar] [CrossRef] [Scilit] [PubMed]
- Guarana, C. L., Ryu, J. W., O’Boyle, E. H., Jr., Lee, J., & Barnes, C. M. (2021). Sleep and self-control: A systematic review and meta-analysis. Sleep Medicine Reviews, 59, 101514. [Google Scholar] [CrossRef] [Scilit] [PubMed]
- Gyu, K. S., & JongHae, K. (2017). Statistical data preparation: Management of missing values and outliers. Korean Journal of Anesthesiology, 70(4), 407–411. [Google Scholar] [CrossRef] [Scilit] [PubMed]
- Kansagra, S. (2020). Sleep disorders in adolescents. Pediatrics, 145, S204–S209. [Google Scholar] [CrossRef] [Scilit] [PubMed]
- Killgore, W. D. S. (2015). Sleep deprivation and behavioral risk-taking. In Modulation of sleep by obesity, diabetes, age, and diet. Elsevier. [Google Scholar] [CrossRef] [Scilit]
- Knebel, M. T. G., da Costa, B. G. G., Dos Santos, P. C., de Sousa, A., & Silva, K. S. (2022). The conception, content validation, and test-retest reliability of the Questionnaire for Screen Time of Adolescents (QueST). Jornal De Pediatria, 98(2), 175–182. [Google Scholar] [CrossRef] [Scilit] [PubMed]
- Lazaratou, H., Soldatou, A., & Dikeos, D. (2012). Medical comorbidity of sleep disorders in children and adolescents. Current Opinion in Psychiatry, 25(5), 391–397. [Google Scholar] [CrossRef] [Scilit] [PubMed]
- Li, J., Zhou, N., & Li, X. X. (2025). Latent profiles and influencing factors of sleep quality in patients with chronic obstructive pulmonary disease. Frontiers in Medicine, 12, 1692930. [Google Scholar] [CrossRef] [Scilit] [PubMed]
- Liu, X., Tang, M., Hu, L., Wang, A., Wu, H., Zhao, G., Gao, C. N., & Li, W. (1996). Reliability and validity of the Pittsburgh Sleep Quality Index. Chinese Journal of Psychiatry, 29(2), 103–107. [Google Scholar]
- Lofthouse, N., Gilchrist, R., & Splaingard, M. (2009). Mood-related Sleep Problems in Children and Adolescents. Child and Adolescent Psychiatric Clinics of North America, 18(4), 893–916. [Google Scholar] [CrossRef] [Scilit] [PubMed]
- Mason, G. M., Lokhandwala, S., Riggins, T., & Spencer, R. M. C. (2021). Sleep and human cognitive development. Sleep Medicine Reviews, 57, 101472. [Google Scholar] [CrossRef] [Scilit] [PubMed]
- Mazlan, R., Saim, L., Thomas, A., Said, R., & Liyab, B. (2002). Ear infection and hearing loss amongst headphone users. The Malaysian Journal of Medical Sciences MJMS, 9(2), 17–22. [Google Scholar] [PubMed]
- Medic, G., Wille, M., & Hemels, M. E. H. (2017). Short- and long-term health consequences of sleep disruption. Nature and Science of Sleep, 9, 151–161. [Google Scholar] [CrossRef] [Scilit] [PubMed]
- Mesurado, B., Vidal, E. M., & Mestre, A. (2018). Negative emotions and behaviour: The role of regulatory emotional self-efficacy. Journal of Adolescence, 64, 62–71. [Google Scholar] [CrossRef] [Scilit] [PubMed]
- Nylund, K. L., Asparoutiov, T., & Muthén, B. O. (2007). Deciding on the number of classes in latent class analysis and growth mixture modeling: A Monte Carlo simulation study. Structural Equation Modeling—A Multidisciplinary Journal, 14(4), 535–569. [Google Scholar] [CrossRef] [Scilit]
- Otsuka, Y., Kaneita, Y., Itani, O., Matsumoto, Y., Jike, M., Higuchi, S., Kanda, H., Kuwabara, Y., Kinjo, A., & Osaki, Y. (2021). The association between Internet usage and sleep problems among Japanese adolescents: Three repeated cross-sectional studies. Sleep, 44(12), zsab175. [Google Scholar] [CrossRef] [Scilit] [PubMed]
- Palmer, C. A., Alfano, C. A., & Bower, J. L. (2020). Adolescent sleep patterns are associated with the selection of positive and negative emotional situations. Journal of Sleep Research, 29(6), e12917. [Google Scholar] [CrossRef] [Scilit] [PubMed]
- Pavlova, M. K., & Latreille, V. (2019). Sleep Disorders. American Journal of Medicine, 132(3), 292–299. [Google Scholar] [CrossRef] [Scilit] [PubMed]
- Portnuff, C. D. (2016). Reducing the risk of music-induced hearing loss from overuse of portable listening devices: Understanding the problems and establishing strategies for improving awareness in adolescents. Adolescent Health, Medicine and Therapeutics, 7, 27–35. [Google Scholar] [CrossRef] [Scilit] [PubMed]
- Rogers, R. W. (1975). A protection motivation theory of fear appeals and attitude-change. Journal of Psychology, 91(1), 93–114. [Google Scholar] [CrossRef] [Scilit] [PubMed]
- Sateia, M. J. (2014). International classification of sleep disorders-third edition: Highlights and modifications. Chest, 146(5), 1387–1394. [Google Scholar] [CrossRef] [Scilit] [PubMed]
- Schwabe, L., & Wolf, O. T. (2009). Stress prompts habit behavior in humans. Journal of Neuroscience, 29(22), 7191–7198. [Google Scholar] [CrossRef] [Scilit] [PubMed]
- Stowe, R. C., & Afolabi-Brown, O. (2020). Pediatric polysomnography-A review of indications, technical aspects, and interpretation. Paediatric Respiratory Reviews, 34, 9–17. [Google Scholar] [CrossRef] [Scilit] [PubMed]
- Tomaso, C. C., Johnson, A. B., & Nelson, T. D. (2021). The effect of sleep deprivation and restriction on mood, emotion, and emotion regulation: Three meta-analyses in one. Sleep, 44(6), zsaa289. [Google Scholar] [CrossRef] [Scilit] [PubMed]
- Trosman, I., & Ivanenko, A. (2021). Classification and epidemiology of sleep disorders in children and adolescents. Child and Adolescent Psychiatric Clinics of North America, 30(1), 47–64. [Google Scholar] [CrossRef] [Scilit] [PubMed]
- Vogel, I., van de Looij-Jansen, P. M., Mieloo, C. L., Burdorf, A., & de Waart, F. (2014). Risky music listening, permanent tinnitus and depression, anxiety, thoughts about suicide and adverse general health. PLoS ONE, 9(6), e98912. [Google Scholar] [CrossRef] [Scilit] [PubMed]
- Wang, M., & Hanges, P. J. (2011). Latent class procedures: Applications to organizational research. Organizational Research Methods, 14(1), 24–31. [Google Scholar] [CrossRef] [Scilit]
- Xiong, W. J., Liu, H. J., Gong, P., Wang, Q., Ren, Z., He, M. F., Zhou, G., Ma, J., Guo, X., Fan, X., Liu, M., Yang, X., Shen, Y., & Zhang, X. M. (2019). Relationships of coping styles and sleep quality with anxiety symptoms among Chinese adolescents: A cross-sectional study. Journal of Affective Disorders, 257, 108–115. [Google Scholar] [CrossRef] [Scilit] [PubMed]

Disclaimer/Publisher’s Note: The statements, opinions and data contained in all publications are solely those of the individual author(s) and contributor(s) and not of MDPI and/or the editor(s). MDPI and/or the editor(s) disclaim responsibility for any injury to people or property resulting from any ideas, methods, instructions or products referred to in the content. |
© 2026 by the authors. Licensee MDPI, Basel, Switzerland. This article is an open access article distributed under the terms and conditions of the Creative Commons Attribution (CC BY) license.