


Abstract
This study examined associations between leisure participation types and leisure satisfaction using a Korean national survey sample, with perceived leisure constraints specified as an intervening variable in a cross-sectional structural model. Data came from the 2025 National Leisure Activity Survey, and 10,028 respondents were included. Seven types of primary leisure activity were compared with rest-oriented leisure, perceived leisure constraints were modeled as a latent variable, and sociodemographic and employment-related characteristics were controlled. Participation type was related to perceived constraints and leisure satisfaction, but the differences were small. Relative to rest-oriented leisure, satisfaction was higher for cultural participation, sports participation, tourism, hobbies and entertainment, and social and other activities (standardized differences = 0.09–0.50) but not for cultural viewing or sports viewing. Sports participation was associated with fewer perceived constraints and tourism with more. Perceived constraints were negatively associated with satisfaction (β = −0.055); exploratory analysis suggested that this association may mainly reflect time and financial constraints. Indirect associations through perceived constraints were very small and robust only for sports participation and tourism. Participation type explained about 1% and the full model 4.4% of the variance in leisure satisfaction, indicating that broad activity type and perceived constraints are minor correlates of satisfaction.
1. Introduction
Leisure participation is an important domain of everyday life through which individuals pursue recovery, enjoyment, social interaction, and self-development. Previous research has linked leisure engagement with subjective well-being and quality of life (Kuykendall et al., 2015; Newman et al., 2014). In Korea, work–life balance, population aging, cultural consumption, and lifestyle diversification have increased the relevance of leisure to daily life. The National Leisure Activity Survey provides national-level information on leisure time use, activity types, leisure satisfaction, and perceived constraints, offering an empirical basis for examining these relationships in Korean society.
In the Korean context, leisure opportunities, perceived constraints, and leisure satisfaction may also be shaped by broader life-course and socioeconomic circumstances, including work and family roles, population aging, economic resources, and the diversification of digital, cultural, and sport-related leisure opportunities. These contextual conditions may influence both the types of leisure activities individuals select and how they evaluate their leisure experiences. Because these broader contextual factors were not directly measured in the present study, they are considered here as contextual conditions rather than empirically tested explanatory mechanisms.
Leisure satisfaction is understood here as an overall evaluation of leisure life rather than a momentary response to a single activity; its conceptualization and measurement are discussed in Section 2.2.
Leisure participation is not homogeneous, and different activity types may involve different levels of physical involvement, social interaction, accessibility, and personal meaning. Korean and international studies have reported differences in leisure satisfaction across activity types and participation profiles (Ahn & Song, 2021; Wheatley & Bickerton, 2017), while national-survey research has suggested that the composition of leisure activities may be more informative than leisure time alone (Y.-K. Lee et al., 2024). These findings support examining leisure participation by activity type rather than treating participation as a single undifferentiated behavior.
Perceived leisure constraints are also relevant to leisure satisfaction. In its classic formulation, leisure constraints theory treats constraints as factors that intervene between leisure preferences and participation, and the hierarchical model describes how intrapersonal, interpersonal, and structural constraints are encountered and negotiated on the way to participation (Crawford & Godbey, 1987; Crawford et al., 1991). Subsequent work, however, has shown that people commonly participate despite constraints and that constraints continue to be experienced within ongoing participation, where they bear on the enjoyment and evaluation of leisure and not only on whether participation occurs (Jackson, 2000; Jackson et al., 1993; Kay & Jackson, 1991; Nadirova & Jackson, 2000). Korean research has linked perceived constraints with participation motivation, work–leisure balance, sport participation, and leisure satisfaction (Ahn et al., 2006; Jeon & Lee, 2022; S.-H. Lee, 2022). Perceived constraints may therefore be related both to the type of leisure in which individuals are primarily engaged and to how they evaluate their leisure lives.
Despite this body of research, two issues remain insufficiently addressed. First, studies comparing leisure types have rarely specified why particular types should be associated with higher or lower satisfaction, or with greater or fewer perceived constraints. Second, the relationship between participation type and perceived constraints is theoretically bidirectional: constraints may channel individuals toward more accessible activities, and the activity context in which individuals are engaged may shape the constraints they experience and report. The present study addresses these issues in a Korean national survey sample by (a) deriving directional expectations for seven leisure participation types relative to rest-oriented leisure from need-based accounts of leisure and well-being, (b) formulating two competing expectations for the association between participation type and perceived constraints, and (c) examining whether perceived constraints statistically account for part of the association between participation type and leisure satisfaction. Because the design is cross-sectional, the specified ordering is treated as one theoretically motivated decomposition of these associations and not as evidence of temporal or causal ordering.
2. Literature Review
2.1. Leisure Participation Types as Distinct Contexts of Need Satisfaction
Leisure participation types differ in psychological meaning, social context, physical demands, resource requirements, and accessibility. Examining activity type can therefore provide information that is obscured when leisure is represented only by total time or participation status.
Need-based accounts of leisure provide a rationale for expecting systematic differences across activity types. Tinsley and Eldredge (1995) showed that leisure activities can be classified according to the psychological needs they gratify, and Newman et al. (2014) proposed that leisure contributes to subjective well-being through five psychological mechanisms: detachment-recovery, autonomy, mastery, meaning, and affiliation (the DRAMMA model). From this perspective, an activity type is not a psychologically neutral label but a context that affords some of these experiences more readily than others. Meta-analytic evidence further indicates that leisure engagement is positively related to subjective well-being and that leisure satisfaction is a central link in this relationship (Kuykendall et al., 2015).
The eight categories of the National Leisure Activity Survey can be located within this framework. Rest-oriented leisure, which includes television and online video viewing, napping, bathing, listening to music, strolling or walking, and doing nothing, corresponds closely to what Stebbins (1997) termed casual leisure in its passive-entertainment and relaxation forms: it is immediately rewarding, low in effort, and requires little skill or coordination. Such activities primarily afford detachment and recovery, but they provide comparatively limited opportunity for mastery, meaning, and affiliation, and heavy television viewing in particular has been associated with lower life satisfaction (Frey et al., 2007). By contrast, sports participation, cultural participation, and many hobbies involve the use of skill and progressive challenge and therefore afford mastery and autonomy; cultural viewing and sports viewing involve chosen, absorbing content and are frequently shared with others, affording meaning and affiliation; tourism affords detachment from routine together with novelty and meaning; and social activities directly afford affiliation (Iwasaki, 2007; Newman et al., 2014).
Empirical findings are broadly consistent with this reasoning. Korean studies have shown that leisure types differ by social class and are associated with leisure satisfaction and happiness (M.-W. Lee & Yoon, 2022; Nam & Choi, 2008), and Korean and international evidence indicates that activity-related characteristics and engagement in arts, culture, and sport are associated with leisure satisfaction (Ahn, 2025; Ahn & Song, 2021; Huo et al., 2025; Wheatley & Bickerton, 2017). At the same time, need-based accounts imply that differences between broad activity categories should be modest in size. What individuals derive from leisure depends on how and why they engage in an activity and not only on which activity they choose (Deci & Ryan, 2000); satisfied needs have been found to relate more strongly to life satisfaction than the activities participated in (Rodríguez et al., 2008), and person-centered evaluations of leisure predict quality of life better than activity- or place-based indicators (Lloyd & Auld, 2002). Because the hobbies and entertainment category is broad and includes both skill-based hobbies and entertainment that resembles casual leisure, its expected difference from rest-oriented leisure is less clear-cut than for the other types. On this basis, the following directional hypothesis was formulated:
H1.
Relative to rest-oriented leisure, each of the seven other leisure participation types (cultural viewing, cultural participation, sports viewing, sports participation, tourism, hobbies and entertainment, and social and other activities) is associated with higher leisure satisfaction.
2.2. Leisure Satisfaction as a Subjective Outcome of Leisure Behavior
Leisure satisfaction refers to an individual’s subjective evaluation of leisure experiences and the extent to which they meet personal needs and expectations. Beard and Ragheb (1980) conceptualized it as a multidimensional construct, and subsequent research has linked leisure engagement and satisfaction with subjective well-being (Kuykendall et al., 2015; Newman et al., 2014). In the present study, leisure satisfaction is treated as a broad evaluative outcome rather than temporary enjoyment.
In Korea, leisure satisfaction has been associated with perceived benefits such as stress relief, health promotion, skill development, social relationships, and self-development (Ahn, 2016). Because the National Leisure Activity Survey measures overall satisfaction with leisure life, the present study uses this global evaluation to examine differences across participation types.
Perceived freedom is also relevant to this evaluation. S.-H. Lee (2022) reported that the ability to use leisure time in accordance with personal choice was positively associated with leisure satisfaction, suggesting that satisfaction reflects not only what individuals do but also how manageable and self-directed their leisure experiences are. This is consistent with self-determination theory, in which autonomy is a basic psychological need whose satisfaction supports well-being (Deci & Ryan, 2000).
2.3. Perceived Leisure Constraints: Antecedent Barriers and Experienced Constraints
Leisure constraints are factors that inhibit, limit, or interfere with leisure preferences, participation, and satisfaction. Crawford and Godbey (1987) classified them as intrapersonal, interpersonal, and structural. Intrapersonal constraints include psychological states and individual conditions, interpersonal constraints arise from social relationships or a lack of companions, and structural constraints include external barriers such as time, cost, facilities, transportation, information, and accessibility. Crawford et al. (1991) later proposed a hierarchical model of leisure constraints in which individuals encounter and negotiate constraints through a sequential process, and subsequent studies have tested structural models of how constraints are negotiated in specific recreation settings (Hubbard & Mannell, 2001; White, 2008).
In this classic formulation, constraints are positioned before participation: they shape leisure preferences, are negotiated sequentially from the intrapersonal through the interpersonal to the structural level, and thereby condition whether and how individuals participate (Crawford et al., 1991). The specification adopted in the present study, in which participation type precedes perceived constraints, therefore requires explicit justification. Three developments in the constraints literature are relevant.
First, constraints are not confined to non-participants. Early findings that people frequently participate despite reporting constraints, and that those who report more constraints do not necessarily participate less (Kay & Jackson, 1991; Shaw et al., 1991), led to the proposition that participation depends not on the absence of constraints but on negotiation through them, and that negotiation may modify participation instead of foreclosing it (Jackson et al., 1993). Constraints are thus a continuing feature of the leisure of people who are already participating. Second, the outcomes against which constraints are assessed have been broadened beyond participation. Jackson (2000, p. 62) defined constraints as factors “assumed by researchers and/or perceived or experienced by individuals to limit the formation of leisure preferences and/or to inhibit or prohibit participation and enjoyment in leisure,” and Nadirova and Jackson (2000) showed that respondents themselves distinguish among being unable to start an activity, having ceased an activity, participating less often than desired, and enjoying activities less than they otherwise might. Third, the constraints people report depend on the activity in question. Barriers differ systematically across types of activity (Jackson, 1983), and the hierarchical model has since been clarified as circular and not strictly one-directional, with its starting point located wherever individuals currently are in their daily lives (Godbey et al., 2010).
Taken together, these developments support a distinction between antecedent constraints, which operate on preferences and on the decision to participate, and experienced constraints, which are perceived within an established pattern of leisure and bear on its quality. The measure available in the National Leisure Activity Survey corresponds to the latter. All respondents reported a primary leisure activity, and they rated how strongly each of nine factors constrains their leisure activities; the items do not refer to a specific activity that is desired but not realized. Perceived leisure constraints in this study are therefore interpreted as respondents’ current appraisal of how constrained their leisure is, given the leisure pattern in which they are engaged.
Perceived leisure constraints are subjectively interpreted rather than functioning only as objective barriers. Individuals facing similar conditions may report different levels of constraint depending on motivation, resources, health, prior experience, and social context. Korean studies have linked leisure constraints with participation motivation, leisure attitudes, participation, and satisfaction-related outcomes (Ahn, 2009, 2014; Ahn et al., 2006; E. J. Kim et al., 2022). These findings support examining perceived leisure constraints as a variable that may be associated with both participation type and leisure satisfaction.
National-level Korean evidence further indicates that constraints are embedded in work–leisure balance, socioeconomic resources, health, and leisure-time freedom. Jeon and Lee (2022) reported negative associations of time and economic burden with sport participation, while J. Kim et al. (2021) identified leisure groups differing in time sufficiency, freedom, resources, constraints, and quality of life. These findings suggest that perceived constraints may vary across participation contexts and may be associated with lower evaluations of leisure life.
2.4. Theoretical Ordering of Participation Type and Perceived Constraints: Two Competing Expectations
The association between participation type and experienced constraints can arise through two processes that imply opposite signs.
The first is an activity-demand process. Activity types differ in the time, money, facilities, information, skills, physical capacity, and companions they require, and constraints become salient to the extent that an activity makes such demands (Jackson, 1983). Rest-oriented leisure is largely based at or near home, low in cost, and independent of facilities and companions. Sports participation, cultural attendance, and tourism depend on scheduling, expenditure, and access, and social activities depend by definition on the availability and coordination of other people, which corresponds to the interpersonal constraints described by Crawford and Godbey (1987). Under this process, individuals whose primary leisure is more demanding should report greater perceived constraints than those whose primary leisure is rest-oriented. This expectation should be clearest for tourism, for which time and cost constraints are well documented (Nyaupane & Andereck, 2008), and for social activities, in which interpersonal coordination is intrinsic to the activity.
The second is a resource-sorting process. Individuals do not arrive at their primary leisure activity at random. The hierarchical model proposes that the experience of constraints follows a hierarchy of social privilege (Crawford et al., 1991), and those who sustain demanding activities are disproportionately those who have the resources to do so or who have successfully negotiated the constraints involved (Hubbard & Mannell, 2001; Jackson et al., 1993). Consistent with this view, non-participants in recreational sport have been found to perceive higher constraints than participants (Alexandris & Carroll, 1997). Conversely, when a preferred activity is blocked, individuals tend to substitute a more accessible one (Iso-Ahola, 1986), and low-demand, home-based rest is the most readily available substitute. Rest-oriented leisure may therefore function partly as a residual category for individuals who are constrained in time, money, health, or companionship. Under this process, individuals whose primary leisure is more demanding should report fewer perceived constraints than those whose primary leisure is rest-oriented.
The two processes also differ in the direction of dependence they imply. The activity-demand process runs from the activity context to experienced constraints, whereas the resource-sorting process includes the canonical ordering in which constraints shape activity choice. A cross-sectional association between participation type and perceived constraints reflects the net result of both and cannot separate them. For this reason, the path from participation type to perceived constraints in the present model is interpreted as a conditional difference in experienced constraints between activity groups, adjusted for sociodemographic and employment-related characteristics, and not as the effect of taking up an activity. The following competing hypotheses were formulated:
H2a (activity-demand hypothesis).
Relative to rest-oriented leisure, the other leisure participation types are associated with greater perceived leisure constraints, most clearly tourism and social and other activities.
H2b (resource-sorting hypothesis).
Relative to rest-oriented leisure, the other leisure participation types are associated with fewer perceived leisure constraints.
2.5. Perceived Constraints, Leisure Satisfaction, and the Theoretical Status of the Indirect Pathway
Experienced constraints are expected to be negatively related to leisure satisfaction for two reasons. First, constraints restrict the extent to which leisure is experienced as freely chosen. Autonomy is a basic psychological need and one of the mechanisms through which leisure supports well-being (Deci & Ryan, 2000; Newman et al., 2014), and individuals who feel that time, money, health, or the absence of companions dictates what they can do are less likely to evaluate their leisure favorably (S.-H. Lee, 2022). Second, constraints reduce the enjoyment that can be derived from leisure even when participation occurs (Jackson, 2000; Nadirova & Jackson, 2000). Empirically, perceived constraints have been negatively associated with leisure satisfaction in a multi-city general-population sample (Chick et al., 2015).
H3.
Perceived leisure constraints are negatively associated with leisure satisfaction.
Combining these arguments, the association between participation type and leisure satisfaction can be decomposed into two components. The direct component represents differences between activity groups that are not accounted for by perceived constraints; theoretically, it is attributed to the need-related affordances described in Section 2.1. The indirect component represents the portion of the difference that is statistically accounted for by differences in experienced constraints. Given the negative association expected under H3, the sign of the indirect component follows from the sign of the association between participation type and perceived constraints: it is negative under the activity-demand hypothesis and positive under the resource-sorting hypothesis.
H4.
Leisure participation type is indirectly associated with leisure satisfaction through perceived leisure constraints, with a negative indirect association for types showing greater perceived constraints (H2a) and a positive indirect association for types showing fewer perceived constraints (H2b).
Three points define the theoretical status of this specification. First, the psychological mechanisms invoked for the direct component (detachment-recovery, autonomy, mastery, meaning, and affiliation) are not measured in the National Leisure Activity Survey. They provide the rationale for the direction of H1 but are not tested, and the direct path should be read as a residual association that may reflect these and other unmeasured processes. Perceived leisure constraints are the only intervening construct that is measured, so the model examines one specific pathway and does not offer a complete account of why activity types differ in satisfaction. Second, the ordering of participation type and perceived constraints is not uniquely determined by theory, as discussed in Section 2.4. Alternative orderings of the same variables may account for the observed covariances equally well (MacCallum et al., 1993), and cross-sectional estimates of indirect effects can differ substantially from the corresponding longitudinal parameters (Maxwell & Cole, 2007). Third, the indirect association is consequently interpreted as a statistical decomposition of between-group differences under one theoretically motivated ordering, and the term mediation is not used in a causal sense. The conceptual model and the hypotheses are summarized in Figure 1.
Figure 1.
Conceptual research model. Boxes represent observed variables and the ellipse represents the latent variable of perceived leisure constraints. H1 denotes the direct association between leisure participation type and leisure satisfaction; H2a and H2b denote the competing hypotheses for the association between leisure participation type and perceived leisure constraints; H3 denotes the association between perceived leisure constraints and leisure satisfaction; H4 denotes the statistical indirect association through perceived leisure constraints, whose sign follows from H2a or H2b. Signs in parentheses indicate the hypothesized direction of each association: (+) = positive; (−) = negative.
3. Methods
3.1. Data Source and Participants
This study used data from the 2025 National Leisure Activity Survey (Ministry of Culture, Sports and Tourism & Korea Culture and Tourism Institute, 2025) conducted in South Korea, a nationally representative survey designed to examine leisure time use, leisure participation, leisure activity types, leisure satisfaction, perceived leisure constraints, and related aspects of leisure life among Korean citizens. Because the survey includes both behavioral indicators of leisure participation and perceptual indicators of leisure constraints and satisfaction, it is appropriate for examining the structural relationships among leisure participation types, perceived leisure constraints, and leisure satisfaction.
The present study used the general survey dataset and selected the variables related to leisure participation type, perceived leisure constraints, overall leisure satisfaction, and the prespecified control variables. The 2025 National Leisure Activity Survey contained 10,028 respondents, and all 10,028 had complete data on the variables used in the present structural analyses; therefore, no respondents were excluded because of missing data (0/10,028, 0.0%). This large sample provides sufficient statistical power for confirmatory factor analysis and structural equation modeling. Because large samples make the chi-square statistic highly sensitive to minor model-data discrepancies, model fit was evaluated with multiple fit indices rather than with the chi-square test alone (Kline, 2016; Schumacker & Lomax, 2016). Because the study involved secondary analysis of de-identified national survey data, the respondents were not recruited directly by the authors, and the dataset contained no personally identifiable information. The study was therefore based on anonymized secondary data.
The National Leisure Activity Survey uses a stratified multistage cluster sampling design for household-based data collection, and the released analytical file includes a survey weight (WT) intended to account for unequal selection probabilities and population calibration. The released file does not document stratum or primary sampling unit variables. However, the first four digits of the respondent identifier define 1000 groups of about ten respondents each (range 7–18), each located within a single province and a single area type, which appeared to correspond to the enumeration districts sampled by the survey; these groups were therefore treated as putative enumeration-district clusters in sensitivity analyses. Because the primary objective was to model associations rather than estimate population prevalence, the primary SEM analyses were estimated as unweighted individual-level models, and their standard errors and confidence intervals are model-based. The consequences of clustering and weighting were examined with a cluster bootstrap and with weighted, cluster-robust regressions (Section 3.4). Because the cluster identifier was inferred from the structure of the respondent identifier and stratification was not incorporated, the findings should be interpreted as associations within the analyzed Korean national survey sample rather than as fully survey-design-adjusted population estimates.
3.2. Measures
3.2.1. Leisure Participation Types
Leisure participation type was used as the independent variable. Respondents’ primary leisure activity was classified into eight leisure participation types according to the classification system of the National Leisure Activity Survey: cultural viewing, cultural participation, sports viewing, sports participation, tourism, hobbies and entertainment, rest-oriented leisure, and social and other activities. Classification followed the activity list of the 2025 questionnaire, which assigns 88 activity codes to the eight categories (cultural viewing, codes 1–8; cultural participation, 9–15; sports viewing, 16–19; sports participation, 20–37; tourism, 38–48; hobbies and entertainment, 49–70; rest-oriented leisure, 71–79; social and other activities, 80–88). Because leisure participation type is a categorical variable, it was converted into dummy variables for structural equation modeling. Dummy coding is appropriate when categorical predictors are included in regression-based or structural models, because it allows each category to be interpreted in comparison with a designated reference group (Cohen et al., 2003). Rest-oriented leisure was used as the reference group because it represents a common and comparatively low-demand form of leisure participation, providing an interpretable baseline against which more active, socially organized, or resource-dependent leisure types can be compared. Rest-oriented leisure was the primary activity of 54.9% of respondents. According to the National Leisure Activity Survey classification, this category includes activities such as walking, bathing/sauna use, napping, television viewing (including IPTV), online or mobile video viewing (including OTT services), listening to radio or podcasts, listening to music, reading newspapers or magazines, and doing nothing. Accordingly, coefficients for the seven dummy-coded leisure types represent differences relative to this rest-oriented baseline. Seven dummy variables were entered into the model: cultural viewing, cultural participation, sports viewing, sports participation, tourism, hobbies and entertainment, and social and other activities. The rest-oriented leisure group was excluded from the model and served as the comparison category. This coding approach allowed the study to examine whether each leisure participation type differed from rest-oriented leisure in perceived leisure constraints and leisure satisfaction. Among the seven comparison categories, hobbies and entertainment was both the largest (17.8% of the sample) and the most heterogeneous, encompassing a broad range of activities that do not fit within the arts, sports, tourism, or rest categories of the National Leisure Activity Survey’s classification scheme. This breadth should be borne in mind when the results for this category are interpreted, and it is addressed further in the Limitations section.
3.2.2. Perceived Leisure Constraints
Perceived leisure constraints were specified as the statistical intervening variable. The 2025 National Leisure Activity Survey asked all respondents, “To what extent do the following factors constrain your leisure activities?” (authors’ translation), for nine factors: lack of leisure time (LC1), financial burden (LC2), lack of diverse leisure experience (LC3), lack of leisure information (LC4), illness or disability of the respondent or family members (LC5), lack of leisure companions (LC6), limited accessibility to leisure facilities (LC7), lack of diversity in leisure programs (LC8), and climatic conditions such as fine dust or heat waves (LC9). Each item was rated on a 7-point scale ranging from 1 (no influence at all) to 7 (very strong influence), with higher scores indicating greater perceived leisure constraints. In the structural equation model, the nine items were specified as observed indicators of a single latent construct. The internal consistency and measurement properties of the scale were evaluated using Cronbach’s alpha (Cronbach, 1951), confirmatory factor analysis, standardized factor loadings, composite reliability, and average variance extracted.
3.2.3. Leisure Satisfaction
Leisure satisfaction was used as the dependent variable and was measured with a single item asking, “Overall, how satisfied are you with your leisure life?” Responses were recorded on a 7-point scale ranging from 1 (very dissatisfied) to 7 (very satisfied), with 4 representing the midpoint (neutral/average). Higher scores therefore indicated greater leisure satisfaction. Because the National Leisure Activity Survey assesses this global evaluation directly, the item was specified as a single observed outcome rather than as a latent construct. A single-item measure can be appropriate when a construct is sufficiently global and unidimensional, particularly when the purpose is to assess an overall evaluation rather than multiple subdimensions (Wanous et al., 1997). The corresponding variable name in the analytical dataset and the structural equation model was SAT_OVERALL.
3.2.4. Control Variables
To account for potential confounding by sociodemographic and employment-related characteristics, thirteen control variables were entered as covariates predicting both perceived leisure constraints and leisure satisfaction. These covariates were selected to account for differences in demographic characteristics, socioeconomic resources, household circumstances, employment-related conditions, and disability status that may be associated with both leisure participation and subjective evaluations of leisure life. Including these variables allowed the associations among leisure participation type, perceived leisure constraints, and leisure satisfaction to be examined while statistically adjusting for these observed characteristics. The covariates were coded as follows: gender (0 = male, 1 = female), age (seven ordered categories), education (four ordered categories), household income (seven ordered categories), household size (three ordered categories), marital status (two dummy variables: married and widowed/divorced/other; reference = unmarried), employment status (five dummy variables: regular worker, non-regular worker, self-employed, homemaker, and student; reference = unemployed, unpaid family worker, or other), and disability status (0 = no disability, 1 = registered or unregistered disability). Variance inflation factors for all covariates and leisure participation type dummies were below 4.0 (maximum = 3.70), which indicates that multicollinearity was not a concern. Two additional work-related variables available in the survey, weekly working hours and personal monthly income, were not included as covariates because they applied only to economically active respondents and would have introduced substantial structural missingness (34.8% and 29.1% missing, respectively) inconsistent with the complete-case analytical sample (N = 10,028) used throughout this study; employment status, which had no missing values, was retained instead as the primary work-related covariate. Residential area size (large city, small/medium city, or rural area) is reported descriptively in Table 1 as part of the sample’s demographic profile but was not included as a covariate in the structural model because it was not conceptually central to the hypothesized relationships among leisure participation type, perceived leisure constraints, and leisure satisfaction examined in the present study.
Table 1.
Descriptive characteristics of the study participants (N = 10,028).
3.3. Measurement Validity and Reliability
The validity and reliability of perceived leisure constraints were examined before the structural model was tested. A one-factor confirmatory factor analysis (CFA) was specified with the nine perceived leisure constraint items (LC1–LC9) as observed indicators of a single latent construct. With nine observed indicators, the model contained 45 distinct sample variances and covariances. The initial one-factor CFA estimated 18 free parameters and therefore had 27 degrees of freedom.
Because the initial model showed inadequate fit, modification indices were examined sequentially together with item content. Three residual covariances were introduced between LC1–LC2, LC3–LC4, and LC5–LC6. These item pairs addressed conceptually related constraint domains: time availability and financial resources (LC1–LC2), leisure experience and information (LC3–LC4), and health-related limitations and the availability of leisure companions (LC5–LC6). The residual covariances were specified to account for localized associations between these indicators beyond the common leisure-constraint factor.
No additional residual covariances were introduced. The final CFA estimated 21 free parameters and had 24 degrees of freedom. The same measurement specification, including the three residual covariances, was retained in the subsequent structural model.
Because residual covariances introduced on the basis of modification indices can capitalize on chance, the specification was examined further in three ways. First, the sample was divided at random into a calibration half and a validation half (n = 5014 each); the correlation residuals (observed minus model-implied correlations) of the one-factor model were inspected in the calibration half, and the final model was then fitted without further modification to the validation half. Second, the final model was compared with alternative specifications in which the nine items were assigned to two, three, or four correlated factors defined by item content (time and money; leisure experience and information; health and companions; facilities, programs, and climate). Third, the structural model was re-estimated without the residual covariances, without LC1, and with two correlated constraint factors (time and money versus the remaining seven items). The results of these checks are reported in Section 4.2 and Section 4.6 and in Supplementary Tables S6 and S7. In view of these results, the latent variable is treated as a general summary index of perceived leisure constraints and not as a validated unidimensional scale.
3.4. Data Analysis
Data analysis proceeded in several steps. First, descriptive statistics were calculated to examine the distribution of leisure participation types, perceived leisure constraints, and leisure satisfaction. Frequencies and percentages were calculated for categorical variables, and means and standard deviations were calculated for continuous variables. The descriptive frequencies and percentages reported in Table 1 are unweighted sample statistics. The primary confirmatory factor analysis (CFA), structural equation modeling (SEM), and bootstrap analyses did not incorporate survey weighting, stratification, or clustering into variance estimation; design-based sensitivity analyses are described below.
Second, reliability analysis was conducted for the perceived leisure constraints scale using Cronbach’s alpha. Corrected item–total correlations and alpha-if-item-deleted values were examined to evaluate the contribution of each item to the scale. Third, correlation analysis was performed to examine preliminary relationships among the main study variables, with perceived leisure constraints represented by the mean score of LC1–LC9.
Fourth, CFA assessed the perceived leisure-constraints measurement model described in Section 3.3. Standardized factor loadings, composite reliability (CR), average variance extracted (AVE), and model fit indices were examined; results are reported in Section 4.2 and Table 2.
Table 2.
Confirmatory Factor Analysis of Perceived Leisure Constraints.
Fifth, SEM was conducted to test the hypothesized cross-sectional indirect-association model. Seven dummy-coded leisure participation types were entered as exogenous observed variables, perceived leisure constraints as a latent intervening variable, and overall leisure satisfaction as an observed outcome variable. Rest-oriented leisure served as the reference category. The same measurement specification, including the three residual covariances between LC1–LC2, LC3–LC4, and LC5–LC6, was retained in the uncontrolled core structural model. The core structural model was estimated with maximum likelihood.
Sixth, the structural model was re-estimated with the thirteen control variables described in Section 3.2.4 to account for potential sociodemographic and employment-related confounding. These covariates were included as predictors of both perceived leisure constraints and leisure satisfaction, with covariances among all exogenous predictors freely estimated. The covariate-adjusted model is reported as the primary structural model in Section 4.4. Finally, statistical indirect associations were evaluated using 5000 nonparametric respondent-level bootstrap resamples and bias-corrected 95% confidence intervals.
Measurement and correlation analyses were conducted using SPSS (version 26.0; IBM Corp., Armonk, NY, USA) and AMOS (version 23.0; IBM Corp., Armonk, NY, USA), and the standalone CFA was estimated in AMOS using maximum likelihood. Structural models were estimated in Python (version 3; Python Software Foundation, Wilmington, DE, USA) using semopy (version 2.3.11) with maximum likelihood. The uncontrolled core structural model yielded χ2(88) = 1669.47, p < 0.001, CFI = 0.970, TLI = 0.954, and RMSEA = 0.042; the fit indices of the standalone CFA and of the covariate-adjusted primary model are reported in Section 4.2 and Section 4.4, respectively. Generative artificial intelligence tools (Claude 5.5, Anthropic, San Francisco, CA, USA; ChatGPT 6.0, OpenAI, San Francisco, CA, USA) were used to assist with the Python analysis code and the statistical analyses, as described in the Acknowledgments.
Because leisure participation type is an eight-category nominal variable, it was evaluated in two steps. First, omnibus likelihood-ratio tests compared the primary model with models in which the seven type coefficients were constrained to zero, separately for perceived leisure constraints and for leisure satisfaction. Second, the seven contrasts with rest-oriented leisure were evaluated as reference-group comparisons and are reported with unstandardized coefficients, 95% confidence intervals, standardized mean differences (the coefficient divided by the standard deviation of the outcome), and p values adjusted for the seven comparisons within each outcome by the Holm (1979) procedure. Interpretation is based on the size and precision of the estimates and not on unadjusted significance tests alone.
Four sets of sensitivity analyses were conducted. (a) To evaluate the linearity assumption for the ordered covariates, age, education, household income, and household size were entered as sets of indicator variables; linear and indicator-coded specifications were compared with F tests in regressions of leisure satisfaction and of the constraint composite, and the structural model was re-estimated with indicator-coded covariates. (b) The structural model was re-estimated under the alternative measurement specifications described in Section 3.3. (c) To account for clustering within the 1000 putative enumeration-district groups inferred from the respondent identifier, intraclass correlations were computed, the primary model was re-estimated in 5000 cluster bootstrap resamples in which these groups were resampled with replacement (percentile 95% confidence intervals), and regressions using the constraint composite were estimated with cluster-robust standard errors, with and without the survey weight. (d) The age-group analyses were repeated with the primary model specification. Results are summarized in Section 4.6 and Section 4.7 and reported in Supplementary Tables S4–S9.
The nine perceived leisure-constraint indicators (LC1–LC9) and overall leisure satisfaction (SAT_OVERALL) were measured using seven-point response scales and were treated as approximately continuous variables in the SEM. Age, education, household income, and household size were entered as ordered covariates using their coded category values, whereas binary and nominal covariates were entered using binary or dummy coding, as described in Section 3.2.4.
Maximum likelihood estimation was used because the focal outcome and latent-variable indicators had seven response categories and the analytical sample was large (N = 10,028). Nevertheless, treating ordered categorical variables as continuous represents an analytical approximation and does not establish that the observed variables satisfy the assumptions of multivariate normality. Furthermore, entering ordered covariates using their coded category values assumes linear associations across successive categories, an assumption that was tested and relaxed in the sensitivity analysis described above.
No sensitivity analysis using an alternative estimator specifically designed for ordinal data was conducted. Therefore, the robustness of the parameter estimates, standard errors, and statistical significance to alternative estimation methods was not established. These analytical limitations should be considered when interpreting the findings and are further acknowledged in the Limitations section.
Statistical significance was evaluated at the 0.05 level. All statistical significance tests were two-tailed. H1 and H3 specify a direction, and H2a and H2b are competing directional hypotheses with a corresponding sign for H4; two-tailed tests were retained so that an association in either direction could be detected. The directional forms of the hypotheses were specified during revision of the manuscript, after initial results were known; they are derived from the literature reviewed in Section 2 and should be read as theory-based expectations, not as preregistered predictions.
4. Results
4.1. Participants
A total of 10,028 respondents from the 2025 National Leisure Activity Survey were included in the analysis. Table 1 presents the unweighted descriptive characteristics of the participants. The sample was evenly distributed by gender (49.1% male, 50.9% female), and participants were fairly balanced across age groups, with the largest proportion in their 50s (18.8%). Nearly half of the respondents (46.4%) had completed college or higher education, and household income was widely distributed, with the largest group (30.3%) reporting a monthly household income of 6,000,000 KRW or more.
4.2. Measurement Model
Model fit was evaluated using multiple fit indices, including chi-square, degrees of freedom, the comparative fit index (CFI), the Tucker–Lewis index (TLI), and the root mean square error of approximation (RMSEA). Because chi-square is sensitive to sample size, particularly in large-scale survey data, approximate fit indices were used for substantive model evaluation (Kline, 2016). CFI and TLI values of 0.90 or higher were considered acceptable and values of 0.95 or higher good, while RMSEA values below 0.08 were considered acceptable and values below 0.05 good (Hu & Bentler, 1999; Schumacker & Lomax, 2016).
The initial one-factor CFA showed inadequate fit to the data, χ2(27) = 5361.832, p < 0.001, CFI = 0.896, TLI = 0.861, and RMSEA = 0.140, 90% CI [0.137, 0.144]. Following the procedure described in Section 3.3, three residual covariances (LC1–LC2, LC3–LC4, and LC5–LC6) were added. In the final CFA, all standardized factor loadings were statistically significant and ranged from 0.383 to 0.857 (LC1 = 0.383, LC2 = 0.472, LC3 = 0.736, LC4 = 0.766, LC5 = 0.673, LC6 = 0.760, LC7 = 0.849, LC8 = 0.857, LC9 = 0.736). LC1 and LC2 showed lower factor loadings than the other items. Cronbach’s α was 0.898, and conventional composite reliability (CR) was 0.897 (Hair et al., 2019). Because the measurement model included three correlated residuals, these conventional estimates may overstate reliability (Raykov, 2001). When the residual covariances were incorporated into the error variance, the residual-covariance-adjusted CR was 0.88, indicating adequate reliability. The average variance extracted (AVE = 0.503) only marginally exceeded the conventional 0.50 criterion (Fornell & Larcker, 1981), reflecting the relatively weak loadings of LC1 and LC2 compared with LC3–LC9 (average squared loading = 0.59).
The revised measurement model showed acceptable approximate fit according to the prespecified CFI, TLI, and RMSEA criteria: χ2(24) = 1366.258, p < 0.001, CMIN/DF = 56.927, GFI = 0.971, AGFI = 0.946, NFI = 0.973, IFI = 0.974, TLI = 0.961, CFI = 0.974, and RMSEA = 0.075, 90% CI [0.071, 0.078]. Given the very large sample size (N = 10,028), substantive evaluation emphasized the approximate fit indices rather than the chi-square statistic alone. Nevertheless, the significant chi-square statistic, elevated chi-square-to-degrees-of-freedom ratio, and RMSEA of 0.075 indicate that some model-data discrepancy remained. The measurement model was therefore considered acceptable for the present analysis, rather than indicative of an exact or exceptionally close fit.
Because LC1 had the weakest factor loading (β = 0.383), its exclusion was examined in a sensitivity analysis. Reliability and convergent validity improved, but the structural coefficients and explained variance remained substantively unchanged. LC1 was retained to preserve coverage of the conceptually important time-constraint domain (Supplementary Tables S1 and S2).
The additional checks described in Section 3.3 supported the stability of the specification but also showed that the items are not strictly unidimensional (Supplementary Table S6). In the calibration half, the three largest correlation residuals of the one-factor model were those for LC1–LC2 (0.26), LC3–LC4 (0.13), and LC5–LC6 (0.13), and no other correlation residual exceeded |0.06|. Fitted without modification to the validation half, the final model reproduced the fit obtained in the full sample (CFI = 0.971, TLI = 0.957, RMSEA = 0.078), with estimated error correlations of 0.26, 0.19, and 0.20. A four-factor model based on item content fitted about as well as the final model, χ2(21) = 1158.5, CFI = 0.978, TLI = 0.962, RMSEA = 0.073; its factor correlations were high among the last three content domains (0.78–0.85) and lower between the time-and-money domain and the others (0.56–0.61).
The LC5–LC6 residual covariance may reflect shared personal and household circumstances underlying health limitations and lack of companions; however, all three correlated item pairs were adjacent in the questionnaire, so an item-proximity explanation cannot be excluded. LC1 (lack of leisure time) was also weakly represented by the general factor: it was more pronounced among regular employees (M = 5.11) than among non-employed respondents (M = 3.91), homemakers (M = 4.16), or respondents aged 70 or older (M = 4.08), whereas health, companionship, and access constraints were highest in the oldest group. The structural implications of this heterogeneity are examined in Section 4.6.
4.3. Correlation
Leisure satisfaction had a mean of 4.86 (SD = 1.06), and 88% of respondents chose one of the three response options from 4 to 6. Table 3 presents the results of the correlation analysis. Perceived leisure constraints were negatively and significantly correlated with leisure satisfaction (r = −0.075, p < 0.01). Among the leisure participation types, sports participation (r = −0.064, p < 0.01) and hobbies and entertainment (r = −0.021, p < 0.05) were negatively correlated with perceived leisure constraints, whereas tourism (r = 0.036, p < 0.01) and social and other activities (r = 0.022, p < 0.05) were positively correlated with them. Leisure satisfaction was positively correlated with cultural participation (r = 0.058, p < 0.01), sports participation (r = 0.093, p < 0.01), and tourism (r = 0.028, p < 0.01). All correlations were small in absolute value (|r| < 0.10 for the correlations involving the two outcomes).
Table 3.
Correlations among study variables.
4.4. Structural Model Results
The covariate-adjusted structural model showed acceptable approximate fit, χ2(192) = 4020.94, p < 0.001, CFI = 0.965, TLI = 0.920, RMSEA = 0.045. Participation type was first evaluated with omnibus likelihood-ratio tests in which all seven type coefficients were constrained to zero. Participation type was related to perceived leisure constraints, Δχ2(7) = 48.35, p < 0.001, and, directly, to leisure satisfaction, Δχ2(7) = 117.98, p < 0.001. Both associations were small. Removing the seven type coefficients reduced the explained variance from 0.021 to 0.015 for perceived leisure constraints and from 0.044 to 0.033 for leisure satisfaction, and in a covariate-adjusted regression of leisure satisfaction on participation type (the total association), participation type accounted for 1.2% of the variance (ΔR2 = 0.012, F(7, 10,007) = 17.45, p < 0.001; Cohen’s f2 = 0.012; Cohen, 1988).
Table 4 reports the reference-group contrasts of each participation type with rest-oriented leisure (see also Figure 2). For leisure satisfaction (H1), all seven point estimates were positive, and the differences ranged from 0.09 to 0.50 standard deviations. Cultural participation (B = 0.528, 95% CI [0.360, 0.696], d = 0.50), sports participation (B = 0.304, 95% CI [0.237, 0.371], d = 0.29), tourism (B = 0.231, 95% CI [0.103, 0.359], d = 0.22), social and other activities (B = 0.148, 95% CI [0.051, 0.245], d = 0.14), and hobbies and entertainment (B = 0.091, 95% CI [0.034, 0.148], d = 0.09) differed from rest-oriented leisure after Holm adjustment, whereas the intervals for cultural viewing (B = 0.111, 95% CI [−0.003, 0.225], d = 0.10) and sports viewing (B = 0.112, 95% CI [−0.005, 0.229], d = 0.11) included zero. H1 was therefore supported for five of the seven types. The largest estimate, for cultural participation, is based on the smallest group (n = 151) and has the widest interval.
Table 4.
Structural Paths (Controlling for Sociodemographic and Employment-Related Covariates).
Figure 2.
Structural model results. Values are unstandardized coefficients with 95% confidence intervals for the contrasts of each participation type with rest-oriented leisure (H1; H2a and H2b) and for the association of perceived leisure constraints with leisure satisfaction (H3), and indirect associations with bias-corrected bootstrap intervals (H4). Entries in bold have intervals that exclude zero in both the model-based (for H4, individual-bootstrap) and cluster-bootstrap analyses; intervals from the cluster bootstrap are given in Table 5 and Supplementary Table S9a.
For perceived leisure constraints (H2a and H2b), the differences were smaller, between −0.16 and 0.22 standard deviations of the latent variable. Sports participation was associated with fewer perceived constraints than rest-oriented leisure (B = −0.090, 95% CI [−0.131, −0.050], d = −0.15), consistent with the resource-sorting hypothesis (H2b). Tourism was associated with greater perceived constraints (B = 0.134, 95% CI [0.057, 0.211], d = 0.22), consistent with the activity-demand hypothesis (H2a). Social and other activities also showed greater perceived constraints (B = 0.076, 95% CI [0.018, 0.135], d = 0.13), but this contrast did not remain significant after Holm adjustment (adjusted p = 0.052). The intervals for cultural viewing, cultural participation, sports viewing, and hobbies and entertainment included zero, so neither hypothesis was supported for these four types.
For H3, perceived leisure constraints were negatively associated with leisure satisfaction (B = −0.096, 95% CI [−0.132, −0.060], β = −0.055); a difference of one standard deviation in perceived constraints corresponded to a difference of about 0.06 standard deviations in satisfaction. The model explained 2.1% of the variance in perceived leisure constraints and 4.4% of the variance in leisure satisfaction (Cohen’s f2 = 0.021 and 0.046, respectively). Among the control variables, age (β = 0.153), household income (β = 0.121), education (β = 0.104), household size (β = −0.094), and marital status (β = −0.066 for married and −0.051 for widowed/divorced/other) were associated with leisure satisfaction, and each of the first three standardized associations exceeded that of any participation type (largest β = 0.092). Self-employed respondents reported lower satisfaction than the reference group (β = −0.061), whereas homemakers (β = 0.053) and students (β = 0.045) reported higher satisfaction (Supplementary Table S3).
4.5. Statistical Indirect Associations Through Perceived Leisure Constraints
Table 5 reports the indirect associations through perceived leisure constraints. All were very small: the largest in absolute value was −0.013 points on the seven-point satisfaction scale (about 0.01 standard deviations), and no indirect association exceeded 6% of the corresponding total association. With the bootstrap of individual respondents, the bias-corrected intervals excluded zero for sports participation (0.0087, BC 95% CI [0.0041, 0.0154]) and cultural participation (0.0093, BC 95% CI [0.0009, 0.0222]), which were positive, and for tourism (−0.0129, BC 95% CI [−0.0238, −0.0051]) and social and other activities (−0.0073, BC 95% CI [−0.0154, −0.0020]), which were negative. With the cluster bootstrap, only the intervals for sports participation (95% CI [0.0014, 0.0193]) and tourism (95% CI [−0.0272, −0.0020]) excluded zero.
Table 5.
Statistical Indirect Associations Through Perceived Leisure Constraints.
The signs of the two robust indirect associations followed the first-stage associations as specified in H4: positive for the type associated with fewer perceived constraints (sports participation; H2b) and negative for the type associated with greater perceived constraints (tourism; H2a). H4 was therefore supported, in the predicted direction, for two of the seven types, and the corresponding indirect associations were negligible in size.
4.6. Sensitivity Analyses
Ordered covariates. Replacing the linear terms for age, education, household income, and household size with indicator variables improved the prediction of leisure satisfaction, F(13, 9994) = 4.92, p < 0.001, and of the constraint composite, F(13, 9994) = 2.05, p = 0.014, so the linearity assumption did not hold strictly. The departure was clearest for age: relative to respondents aged 15–19, satisfaction was similar from the twenties to the fifties (differences ≤ 0.14) and higher in the sixties (0.34) and at 70 or older (0.48). In the structural model with indicator-coded covariates, no coefficient for participation type changed by more than 0.015, the path from perceived leisure constraints to leisure satisfaction was −0.098, and R2 was 0.023 for perceived leisure constraints and 0.050 for leisure satisfaction (Supplementary Table S8). In this specification, the contrast of sports viewing with leisure satisfaction had an unadjusted p of 0.040 (B = 0.122), compared with p = 0.061 (B = 0.112) in the primary model, but it was not significant after Holm adjustment for the seven contrasts (adjusted p = 0.08), and the contrast of cultural viewing remained non-significant (p = 0.099). The conclusions for H1 were therefore unchanged.
Measurement specification. Omitting the three residual covariances or LC1 left the structural coefficients essentially unchanged (largest coefficient change = 0.013). In the exploratory two-factor model, time-and-money constraints showed a negative association with leisure satisfaction (β = −0.149, p < 0.001), whereas the remaining seven-item factor showed a small positive conditional coefficient (β = 0.044, p = 0.011). This pattern may reflect statistical suppression between correlated factors rather than a beneficial association of constraints with satisfaction, as all nine constraint items were negatively correlated with satisfaction (r = −0.03 to −0.09). These findings suggest that time-and-money constraints may be particularly relevant to leisure satisfaction, although this interpretation remains exploratory and requires confirmation in independent samples. Activity-type associations also differed between the two factors: relative to rest-oriented leisure, the cultural, sport, and hobby types reported fewer time-and-money constraints (B = −0.096 to −0.307), whereas the greater perceived constraints of the tourism (B = 0.250) and social and other activities (B = 0.144) groups appeared on the seven-item factor (Supplementary Table S7).
Survey design. Responses were clustered within the putative enumeration-district groups inferred from the respondent identifier (intraclass correlation = 0.25 for leisure satisfaction and 0.66 for the constraint composite), so model-based standard errors understate uncertainty, particularly for perceived leisure constraints. In the cluster bootstrap, the association of perceived leisure constraints with leisure satisfaction remained negative (95% CI [−0.161, −0.031]). The contrasts of cultural participation, sports participation, tourism, hobbies and entertainment, and social and other activities with leisure satisfaction, and those of sports participation (95% CI [−0.154, −0.027]) and tourism (95% CI [0.032, 0.231]) with perceived leisure constraints, retained intervals that excluded zero, whereas the interval for social and other activities with perceived leisure constraints included zero (95% CI [−0.009, 0.160]; Supplementary Table S9a). Weighted, cluster-robust regressions gave the same pattern for these results (Supplementary Table S9b). In the weighted analysis, the contrast of cultural viewing with leisure satisfaction and that of hobbies and entertainment with the constraint composite were also significant; because these were not observed in the unweighted analyses, they are not interpreted. Apart from the exploratory two-factor results, which are identified as such, only the results that held across the model-based, cluster-bootstrap, and weighted cluster-robust analyses are interpreted in the Discussion.
4.7. Supplementary Analysis: Age-Group Differences
Supplementary age-group analyses were conducted to explore whether the observed associations differed between respondents aged under 60 (n = 6804) and those aged 60 or older (n = 3224), using the primary model specification. Standardized coefficients were of similar size in the two groups (Supplementary Table S4), and none of the eight interaction terms was significant, even before correction for multiple comparisons (smallest unadjusted p = 0.095; Supplementary Table S5). These analyses provide no evidence of age moderation and are reported as exploratory.
5. Discussion
The central finding of this study is one of magnitude. In a national sample of more than 10,000 respondents, the type of a person’s primary leisure activity and the constraints they perceive were only weakly related to how satisfied they were with their leisure life. Participation type accounted for about 1% of the variance in leisure satisfaction beyond sociodemographic and employment-related characteristics, the association between perceived leisure constraints and leisure satisfaction was small (β = −0.055), and the indirect associations through perceived constraints were negligible. The discussion first considers the differences that were robust, then the measurement of constraints, and finally why broad participation type explains so little.
5.1. Leisure Participation Types and Leisure Satisfaction
The pattern was consistent with H1 for five of the seven participation types. Respondents whose primary leisure was cultural participation, sports participation, tourism, social and other activities, or hobbies and entertainment reported higher leisure satisfaction than those whose primary leisure was rest-oriented, and these differences held under the cluster bootstrap and in the weighted analyses. Cultural viewing and sports viewing could not be distinguished from rest-oriented leisure. The differences were modest: only cultural participation, the smallest group, differed by as much as half a standard deviation, and the remaining differences were below 0.30 standard deviations.
This pattern is consistent with the need-based reasoning in Section 2.1, in which activities that involve doing, such as making art, playing sport, or travelling, afford mastery, meaning, and affiliation more readily than rest-oriented leisure (Iwasaki, 2007; Newman et al., 2014; Wheatley & Bickerton, 2017). The two spectator categories, which are receptive in character, as rest-oriented leisure largely is, were the ones that did not differ from it. These mechanisms were not measured, however, and the direct associations remain residual differences between self-selected groups, which may reflect unmeasured characteristics of the people who choose each activity as much as characteristics of the activities themselves.
Age, education, and household income each showed larger standardized associations with leisure satisfaction than any participation type. The association with age was not linear: satisfaction was similar from the teens to the fifties and higher among respondents in their sixties and seventies (Supplementary Table S8). The supplementary analyses gave no indication that the associations of participation type with satisfaction differed between respondents under and over 60. Age is therefore best regarded as a sociodemographic correlate of leisure satisfaction and not as a moderator of the associations examined here.
5.2. Leisure Participation Types and Perceived Leisure Constraints
The competing hypotheses for perceived leisure constraints each received support for one participation type. Consistent with the resource-sorting hypothesis (H2b), sports participants reported fewer perceived constraints than respondents whose primary leisure was rest-oriented. Consistent with the activity-demand hypothesis (H2a), respondents whose primary leisure was tourism reported greater perceived constraints; tourism was one of the two types for which this expectation was strongest. The higher perceived constraints of the social and other activities group were in the direction predicted by H2a but did not hold after adjustment for multiple comparisons or under the cluster bootstrap, and the remaining four types did not differ from rest-oriented leisure. Even the two robust differences were small (0.15 and 0.22 standard deviations).
Because the two processes imply opposite directions of dependence, these results do not show that taking up sport reduces constraints or that travelling increases them. Fewer perceived constraints among sports participants are equally consistent with the sorting of less constrained individuals into sport, as reported for recreational sport participation elsewhere (Alexandris & Carroll, 1997). The sensitivity analysis also indicated that the cultural, sport, and hobby groups reported fewer time-and-money constraints than the rest-oriented group, which is what would be expected if rest-oriented leisure serves partly as a fallback for people who are short of time or money. This pattern comes from the exploratory two-factor model, whose standard errors were not adjusted for clustering, and should be read as tentative. The absence of differences for four types may mean that demand-related and sorting-related processes offset one another within broad categories, although this cannot be tested with the present data.
Korean and international evidence likewise shows that the relationship between leisure constraints and participation varies by activity type and population characteristics (Jeon & Lee, 2022; E. J. Kim et al., 2026; J. Kim et al., 2021; S.-Y. Kim, 2024; Li et al., 2022). The present results are therefore best read as activity-specific differences in experienced constraints and not as evidence of a common constraint process across all forms of leisure.
5.3. Perceived Leisure Constraints and Leisure Satisfaction
H3 was supported: higher perceived leisure constraints were associated with lower leisure satisfaction, in line with the view that constraints bear on the quality and evaluation of leisure and not only on participation (Crawford & Godbey, 1987; Jackson, 2000), and with negative associations reported in other cultural and occupational contexts (Chick et al., 2015; Wu et al., 2021). The association was small (β = −0.055), and its confidence interval was wide once clustering was taken into account.
The exploratory two-factor sensitivity analysis suggests that time and financial constraints may be more closely associated with leisure satisfaction than the remaining constraint domains (Section 4.6; Supplementary Table S7). This pattern is consistent with the theoretical importance of freedom to allocate leisure time and resources (Deci & Ryan, 2000; Jeon & Lee, 2022; S.-H. Lee, 2022), although perceived freedom was not directly measured. Because the two-factor model was specified after inspection of the data and was not adjusted for clustering, these findings should be interpreted cautiously and confirmed through future research using multidimensional measures of leisure constraints.
5.4. Interpretation of the Indirect Associations Through Perceived Leisure Constraints
The observed indirect associations were consistent with H4 for sports participation and tourism. For sports participation, fewer perceived constraints accounted for a small positive part of the association with satisfaction; for tourism, greater perceived constraints accounted for a small negative part, so that the direct association of tourism with satisfaction was slightly larger than the total association. In both cases the indirect component was less than 6% of the total association and amounted to about one hundredth of a scale point.
These results are a statistical decomposition under one theoretically motivated ordering. The cross-sectional design does not establish that participation type precedes perceived constraints, alternative orderings cannot be ruled out (MacCallum et al., 1993; Maxwell & Cole, 2007), and the indirect associations are too small to carry theoretical weight on their own. We therefore do not interpret them as mediation, and we do not regard perceived leisure constraints, as measured here, as an explanation of why participation types differ in satisfaction.
5.5. Why Does Broad Participation Type Explain So Little?
The more informative result is how little of the variation in leisure satisfaction is related to broad participation type. Four considerations, each connected to the framework in Section 2, help to explain this. First, broad categories are internally heterogeneous. A category such as hobbies and entertainment or sports participation groups together people who differ in frequency, skill, companions, and motives. Need-based accounts hold that what people derive from leisure depends on how and why they engage in an activity more than on which activity it is (Deci & Ryan, 2000), and earlier studies have found satisfied needs and person-centered evaluations of leisure to be more closely related to well-being than the activities people take part in (Lloyd & Auld, 2002; Rodríguez et al., 2008). Category membership is a distal proxy for these experiences.
Second, a single primary activity describes only one element of a person’s leisure. Respondents take part in several activities, whereas the outcome is an evaluation of leisure life as a whole, and meta-analytic evidence relates subjective well-being to overall leisure engagement and leisure satisfaction (Kuykendall et al., 2015). Third, the outcome was a single global item with limited spread: 88% of respondents chose one of the three response options from 4 to 6, which restricts the variance available to any predictor.
Fourth, leisure satisfaction appears to be embedded in life-course and socioeconomic circumstances. Age, education, household income, household size, and marital status were all related to satisfaction, and several of these associations were larger than that of any participation type, although the full model still explained only 4.4% of the variance. Much of what distinguishes satisfied from dissatisfied respondents therefore lies outside the variables examined here, plausibly in health, motivation, the social context of leisure, and the quality of specific experiences, some of which are recorded in the survey and could be examined in future work. We regard the small size of the type differences as the main finding of the study and not as a shortcoming of it.
5.6. Practical Implications
The practical implications are correspondingly limited. The results do not support the expectation that shifting people from one broad category of leisure to another would appreciably change their satisfaction with leisure life, and they do not identify which constraint a program should target. The exploratory two-factor analysis, which was not adjusted for clustering, suggests that time and financial constraints deserve more attention than a general index of constraints conveys, and that people whose primary leisure is rest-oriented, who make up more than half of the sample, report more time-and-money constraints than those in the cultural, sport, and hobby categories. Whether reducing such constraints would change leisure behavior or satisfaction is a question for longitudinal and intervention studies, and associations of the size reported here are not a sufficient basis for specific program recommendations.
6. Conclusions
This study examined how the type of a person’s primary leisure activity and the leisure constraints they perceive relate to satisfaction with leisure life in a Korean national sample. Relative to rest-oriented leisure, five of seven participation types were associated with higher leisure satisfaction, sports participation was associated with fewer perceived constraints and tourism with more, and perceived constraints were negatively associated with satisfaction. All of these associations were small, the indirect associations through perceived constraints were negligible and robust for only two types, and the model explained 4.4% of the variance in leisure satisfaction. In exploratory analyses, the negative association of constraints with satisfaction was carried mainly by time and financial constraints, which a single constraint factor represented poorly. Broad participation type and a general index of perceived constraints are therefore minor correlates of leisure satisfaction, which appears to depend more on sociodemographic circumstances and on aspects of leisure experience that were not measured. Because the data are cross-sectional, the results describe associations and not causal mechanisms. Future research should measure constraint dimensions and need-related experiences directly, describe leisure by repertoire and quality of engagement as well as by primary activity, and use longitudinal designs to separate the sorting of constrained individuals into activities from the constraints experienced within them.
7. Limitations and Future Research
This study has several limitations. First, its cross-sectional design does not permit causal conclusions or establish the temporal ordering among leisure participation type, perceived leisure constraints, and leisure satisfaction. In particular, the association between participation type and perceived leisure constraints may reflect the sorting of more constrained individuals into rest-oriented leisure as well as differences in the constraints experienced within each activity context, and the present data cannot separate these two processes. Alternative orderings of the same variables cannot be ruled out (MacCallum et al., 1993; Maxwell & Cole, 2007), so the indirect associations depend on the theoretically motivated ordering described in Section 2 and not on empirical evidence of direction. Longitudinal or panel studies are needed to examine these relationships more rigorously.
Second, the national survey limited the level of measurement detail. Leisure satisfaction was assessed with a single item, leisure participation type was based on respondents’ primary activity, and perceived leisure constraints were modeled as a single latent construct. The constraint items were not strictly unidimensional: three residual covariances were required, the corresponding item pairs are adjacent in the questionnaire, the time item loaded weakly, and a two-factor sensitivity model indicated that time and financial constraints relate to satisfaction differently from the other items. The one-factor results should be read as describing a general summary index. In addition, the psychological mechanisms assumed to underlie differences in satisfaction across activity types (detachment-recovery, autonomy, mastery, meaning, and affiliation) were not measured, so the direct associations of participation type with leisure satisfaction cannot be attributed to any specific mechanism. Future studies should employ multidimensional measures and consider activity frequency, duration, intensity, and participation in multiple activities.
Third, the model explained a relatively modest proportion of the variance in leisure satisfaction (R2 = 0.044), and the associations of interest were small. With a sample of this size, statistical significance is not an indication of practical importance, and interpretation has been based on effect sizes and on results that were robust across analyses. The supplementary age-group analysis was exploratory and did not provide evidence of moderation. Future studies should examine age and other population characteristics using continuous age specifications and formal multi-group structural equation modeling.
Fourth, the analysis incorporated the complex survey design only in part. The source survey used stratified multistage cluster sampling, but the released file does not document stratum or primary sampling unit variables, and the cluster identifier used in the sensitivity analyses was inferred from the structure of the respondent identifier. Responses were strongly clustered within these units, especially for the constraint items (intraclass correlation = 0.66), which may reflect interviewer or neighborhood effects and implies that the model-based standard errors of the primary analysis are too small. Stratification was not incorporated, and weights were used only in the supplementary regressions. Future research with access to complete design variables should replicate the model using fully design-based estimation.
Fifth, the seven-point leisure-constraint indicators and the single-item leisure satisfaction measure were treated as approximately continuous variables under maximum likelihood estimation, and the robustness of the estimates to estimators designed for ordinal data was not established. The ordered sociodemographic covariates were entered as linear terms in the primary model; linearity was rejected, although indicator coding left the focal estimates essentially unchanged. Future research should examine whether the present findings are replicated using estimation methods specifically designed for ordinal data.
Sixth, the participation categories are broad. Hobbies and entertainment in particular encompasses a heterogeneous range of activities, and cultural participation was the primary activity of only 151 respondents, so its comparatively large estimate is imprecise. The rest-oriented reference category is also mixed, combining strolling or walking with sedentary activities such as television viewing, so the contrasts describe differences from a broad low-demand baseline. Estimates for all categories should be interpreted as average differences for the category rather than as evidence of a common psychological or behavioral process shared by all activities within it.
Seventh, the directional hypotheses were specified during revision of the manuscript, after initial results were known. They should be read as theory-based expectations, and the present results should be confirmed in independent data, including other waves of the National Leisure Activity Survey.
Supplementary Materials
The following supporting information can be downloaded at https://www.mdpi.com/article/10.3390/bs16111990/s1. Table S1: Standardized factor loadings with and without LC1. Table S2: Reliability, validity, and structural model comparison with and without LC1. Table S3: Structural paths for control variables (supplementary to Table 4). Table S4: Standardized structural paths by age group (supplementary group-specific models). Table S5: Age × leisure-type interaction terms on leisure satisfaction, with multiple-comparison corrections (N = 10,028). Table S6: Alternative measurement models for the nine perceived leisure constraint items and split-sample cross-validation. Table S7: Sensitivity model with two correlated constraint factors. Table S8: Structural model with ordered covariates entered as indicator variables. Table S9a: Design-based sensitivity analysis: model-based and cluster-bootstrap 95% confidence intervals for the structural paths. Table S9b: Design-based sensitivity analysis: regressions with cluster-robust standard errors and survey weights.
Author Contributions
Conceptualization, B.A. and B.K.; methodology, B.A. and B.K.; formal analysis, B.A. and B.K.; investigation, B.A. and B.K.; data curation, B.A. and B.K.; writing—original draft preparation, B.A. and B.K.; writing—review and editing, B.A. and B.K. All authors have read and agreed to the published version of the manuscript.
Funding
This research was supported by Kyungdong University Research Fund, 2025.
Institutional Review Board Statement
This study involved a secondary analysis of de-identified data from the 2025 National Leisure Activity Survey. The study was reviewed by the Institutional Review Board of Hanseo University and was determined to be exempt from full ethical review because it used publicly available information and did not involve the collection or recording of personally identifiable information (approval no. HS26-0813-01; approval date: 5 August 2026).
Informed Consent Statement
Informed consent was waived because this study involved the secondary analysis of de-identified, publicly available data and did not involve the collection of personally identifiable information.
Data Availability Statement
The data used in this study are publicly available from the 2025 National Leisure Activity Survey, jointly conducted by the Ministry of Culture, Sports and Tourism (Culture Policy Division) and the Korea Culture & Tourism Institute (KCTI), Republic of Korea.
Acknowledgments
During the preparation of this study, the authors used Claude (version 5.5; Anthropic, San Francisco, CA, USA) and ChatGPT (version 6.0; OpenAI, San Francisco, CA, USA) to assist with writing the Python analysis code and with conducting and checking the statistical analyses. During the final revision, Claude was also used to check the consistency of the reported statistics across the manuscript and the Supplementary Materials, for language editing, and to adjust the formatting of Figure 2. The authors have reviewed and edited the output and take full responsibility for the content of this publication.
Conflicts of Interest
The authors declare no conflicts of interest.
References
- Ahn, B. (2009). The influence of participant motivation and constraint factor on life satisfaction among paragliding participants. Journal of Leisure and Recreation Studies, 33(1), 77–87. [Google Scholar]
- Ahn, B. (2014). The verification of relationship model among leisure motivation, flow, constraint, attitude, and satisfaction by foreigners’ leisure activity participation in Korea. Journal of Korea Society for Wellness, 9(4), 13–25. [Google Scholar]
- Ahn, B. (2016). Analysis of equivalence and latent mean on leisure satisfaction of Korean adults. Information, 19(4), 1181–1186. [Google Scholar]
- Ahn, B. (2025). Effect of leisure activity participation on leisure attitude, recreational specialization, leisure satisfaction, and intention to re-participate in South Korea. Behavioral Sciences, 15(3), 372. [Google Scholar] [CrossRef] [Scilit] [PubMed]
- Ahn, B., & Song, W. (2021). A study of differences in leisure satisfaction of leisure activity patterns for South Korean adults. International Journal of Environmental Research and Public Health, 18(20), 10790. [Google Scholar] [CrossRef] [Scilit] [PubMed]
- Ahn, B., Yi, K.-J., Lee, J.-S., & Kim, J.-T. (2006). The influence of leisure constraint on participation motivation for paragliding participants. Journal of Leisure and Recreation Studies, 30, 225–236. [Google Scholar]
- Alexandris, K., & Carroll, B. (1997). An analysis of leisure constraints based on different recreational sport participation levels: Results from a study in Greece. Leisure Sciences, 19(1), 1–15. [Google Scholar] [CrossRef] [Scilit]
- Beard, J. G., & Ragheb, M. G. (1980). Measuring leisure satisfaction. Journal of Leisure Research, 12(1), 20–33. [Google Scholar] [CrossRef] [Scilit]
- Chick, G., Hsu, Y.-C., Yeh, C.-K., & Hsieh, C.-M. (2015). Leisure constraints, leisure satisfaction, life satisfaction, and self-rated health in six cities in Taiwan. Leisure Sciences, 37(3), 232–251. [Google Scholar] [CrossRef] [Scilit]
- Cohen, J. (1988). Statistical power analysis for the behavioral sciences (2nd ed.). Lawrence Erlbaum Associates. [Google Scholar]
- Cohen, J., Cohen, P., West, S. G., & Aiken, L. S. (2003). Applied multiple regression/correlation analysis for the behavioral sciences (3rd ed.). Lawrence Erlbaum Associates. [Google Scholar]
- Crawford, D. W., & Godbey, G. (1987). Reconceptualizing barriers to family leisure. Leisure Sciences, 9(2), 119–127. [Google Scholar] [CrossRef] [Scilit]
- Crawford, D. W., Jackson, E. L., & Godbey, G. (1991). A hierarchical model of leisure constraints. Leisure Sciences, 13(4), 309–320. [Google Scholar] [CrossRef] [Scilit]
- Cronbach, L. J. (1951). Coefficient alpha and the internal structure of tests. Psychometrika, 16, 297–334. [Google Scholar] [CrossRef] [Scilit]
- Deci, E. L., & Ryan, R. M. (2000). The “what” and “why” of goal pursuits: Human needs and the self-determination of behavior. Psychological Inquiry, 11(4), 227–268. [Google Scholar] [CrossRef] [Scilit]
- Fornell, C., & Larcker, D. F. (1981). Evaluating structural equation models with unobservable variables and measurement error. Journal of Marketing Research, 18(1), 39–50. [Google Scholar] [CrossRef] [Scilit]
- Frey, B. S., Benesch, C., & Stutzer, A. (2007). Does watching TV make us happy? Journal of Economic Psychology, 28(3), 283–313. [Google Scholar] [CrossRef] [Scilit]
- Godbey, G., Crawford, D. W., & Shen, X. S. (2010). Assessing hierarchical leisure constraints theory after two decades. Journal of Leisure Research, 42(1), 111–134. [Google Scholar] [CrossRef] [Scilit]
- Hair, J. F., Jr., Black, W. C., Babin, B. J., & Anderson, R. E. (2019). Multivariate data analysis (8th ed.). Cengage. [Google Scholar]
- Holm, S. (1979). A simple sequentially rejective multiple test procedure. Scandinavian Journal of Statistics, 6(2), 65–70. [Google Scholar]
- Hu, L.-T., & Bentler, P. M. (1999). Cutoff criteria for fit indexes in covariance structure analysis: Conventional criteria versus new alternatives. Structural Equation Modeling: A Multidisciplinary Journal, 6(1), 1–55. [Google Scholar] [CrossRef] [Scilit]
- Hubbard, J., & Mannell, R. C. (2001). Testing competing models of the leisure constraint negotiation process in a corporate employee recreation setting. Leisure Sciences, 23(3), 145–163. [Google Scholar] [CrossRef] [Scilit]
- Huo, X., Tian, H., Wang, Z., Xu, J., & Tang, Z. (2025). Recreation specialization and leisure satisfaction among long-distance running: An examination of the mediating role of place dependence and place identity. Frontiers in Psychology, 16, 1543861. [Google Scholar] [CrossRef] [Scilit] [PubMed]
- Iso-Ahola, S. E. (1986). A theory of substitutability of leisure behavior. Leisure Sciences, 8(4), 367–389. [Google Scholar] [CrossRef] [Scilit]
- Iwasaki, Y. (2007). Leisure and quality of life in an international and multicultural context: What are major pathways linking leisure to quality of life? Social Indicators Research, 82(2), 233–264. [Google Scholar] [CrossRef] [Scilit]
- Jackson, E. L. (1983). Activity-specific barriers to recreation participation. Leisure Sciences, 6(1), 47–60. [Google Scholar] [CrossRef] [Scilit]
- Jackson, E. L. (2000). Will research on leisure constraints still be relevant in the twenty-first century? Journal of Leisure Research, 32(1), 62–68. [Google Scholar] [CrossRef] [Scilit]
- Jackson, E. L., Crawford, D. W., & Godbey, G. (1993). Negotiation of leisure constraints. Leisure Sciences, 15(1), 1–11. [Google Scholar] [CrossRef] [Scilit]
- Jeon, S.-B., & Lee, M.-S. (2022). Comprehensive understanding of the relationship between leisure constraints and sport participation level. Journal of Leisure Studies, 20(2), 115–133. [Google Scholar] [CrossRef]
- Kay, T., & Jackson, G. (1991). Leisure despite constraint: The impact of leisure constraints on leisure participation. Journal of Leisure Research, 23(4), 301–313. [Google Scholar] [CrossRef] [Scilit]
- Kim, E. J., Kang, H. W., & Park, S. M. (2026). The connection between leisure constraints and leisure activity participation: A meta-analysis. Highlights of Sustainability, 5(1), 194–205. [Google Scholar] [CrossRef] [Scilit]
- Kim, E. J., Park, S. M., & Kang, H. W. (2022). Comprehensive analysis of the relationship between leisure constraints negotiation and leisure participation within the Korean context. Frontiers in Psychology, 13, 733200. [Google Scholar] [CrossRef] [Scilit] [PubMed]
- Kim, J., Oh, S., & Yang, B. (2021). A study on types of leisure index based on National Leisure Activities Survey 2019 in Korea. Sustainability, 13(7), 3619. [Google Scholar] [CrossRef] [Scilit]
- Kim, S.-Y. (2024). A study on the leisure sports participation behavior of the elderly through comparative analyses by age: Focusing on leisure participation constraints and price sensitivity. Behavioral Sciences, 14(9), 803. [Google Scholar] [CrossRef] [Scilit] [PubMed]
- Kline, R. B. (2016). Principles and practice of structural equation modeling (4th ed.). Guilford Press. [Google Scholar]
- Kuykendall, L., Tay, L., & Ng, V. (2015). Leisure engagement and subjective well-being: A meta-analysis. Psychological Bulletin, 141(2), 364–403. [Google Scholar] [CrossRef] [Scilit] [PubMed]
- Lee, M.-W., & Yoon, K.-W. (2022). The effects of activity hours by leisure type on leisure satisfaction and happiness: Focusing on comparison before and after COVID-19. The Journal of Cultural Policy, 36(3), 29–55. [Google Scholar] [CrossRef] [Scilit]
- Lee, S.-H. (2022). Work-leisure balance and happiness among young Koreans: Focusing on the amount and distribution of leisure time and leisure self-determination [Doctoral dissertation, Yonsei University]. [Google Scholar]
- Lee, Y.-K., Kim, B., & Kim, J. (2024). Exposing factors influencing Korean leisure life satisfaction through machine learning techniques. Discover Artificial Intelligence, 4, 88. [Google Scholar] [CrossRef] [Scilit]
- Li, X., Liu, J., Su, X., Xiao, Y., & Xu, C. (2022). Exploration of leisure constraints perception in the context of a pandemic: An empirical study of the Macau Light Festival. Frontiers in Psychology, 13, 822208. [Google Scholar] [CrossRef] [Scilit] [PubMed]
- Lloyd, K. M., & Auld, C. J. (2002). The role of leisure in determining quality of life: Issues of content and measurement. Social Indicators Research, 57(1), 43–71. [Google Scholar] [CrossRef] [Scilit]
- MacCallum, R. C., Wegener, D. T., Uchino, B. N., & Fabrigar, L. R. (1993). The problem of equivalent models in applications of covariance structure analysis. Psychological Bulletin, 114(1), 185–199. [Google Scholar] [CrossRef] [Scilit] [PubMed]
- Maxwell, S. E., & Cole, D. A. (2007). Bias in cross-sectional analyses of longitudinal mediation. Psychological Methods, 12(1), 23–44. [Google Scholar] [CrossRef] [Scilit] [PubMed]
- Ministry of Culture, Sports and Tourism & Korea Culture and Tourism Institute. (2025). 2025 National leisure activity survey. Ministry of Culture, Sports and Tourism.
- Nadirova, A., & Jackson, E. L. (2000). Alternative criterion variables against which to assess the impacts of constraints to leisure. Journal of Leisure Research, 32(4), 396–405. [Google Scholar] [CrossRef] [Scilit]
- Nam, E.-Y., & Choi, Y.-J. (2008). The effects of social class on the leisure activities in Korea: Based on types and satisfaction of leisure activities. Korea Journal of Population Studies, 31(3), 57–84. [Google Scholar]
- Newman, D. B., Tay, L., & Diener, E. (2014). Leisure and subjective well-being: A model of psychological mechanisms as mediating factors. Journal of Happiness Studies, 15(3), 555–578. [Google Scholar] [CrossRef] [Scilit]
- Nyaupane, G. P., & Andereck, K. L. (2008). Understanding travel constraints: Application and extension of a leisure constraints model. Journal of Travel Research, 46(4), 433–439. [Google Scholar] [CrossRef] [Scilit]
- Raykov, T. (2001). Bias of coefficient α for fixed congeneric measures with correlated errors. Applied Psychological Measurement, 25(1), 69–76. [Google Scholar] [CrossRef] [Scilit]
- Rodríguez, A., Látková, P., & Sun, Y.-Y. (2008). The relationship between leisure and life satisfaction: Application of activity and need theory. Social Indicators Research, 86(1), 163–175. [Google Scholar] [CrossRef] [Scilit]
- Schumacker, R. E., & Lomax, R. G. (2016). A beginner’s guide to structural equation modeling (4th ed.). Routledge. [Google Scholar]
- Shaw, S. M., Bonen, A., & McCabe, J. F. (1991). Do more constraints mean less leisure? Examining the relationship between constraints and participation. Journal of Leisure Research, 23(4), 286–300. [Google Scholar] [CrossRef] [Scilit]
- Stebbins, R. A. (1997). Casual leisure: A conceptual statement. Leisure Studies, 16(1), 17–25. [Google Scholar] [CrossRef] [Scilit]
- Tinsley, H. E. A., & Eldredge, B. D. (1995). Psychological benefits of leisure participation: A taxonomy of leisure activities based on their need-gratifying properties. Journal of Counseling Psychology, 42(2), 123–132. [Google Scholar] [CrossRef]
- Wanous, J. P., Reichers, A. E., & Hudy, M. J. (1997). Overall job satisfaction: How good are single-item measures? Journal of Applied Psychology, 82(2), 247–252. [Google Scholar] [CrossRef] [PubMed]
- Wheatley, D., & Bickerton, C. (2017). Subjective well-being and engagement in arts, culture and sport. Journal of Cultural Economics, 41, 23–45. [Google Scholar] [CrossRef] [Scilit]
- White, D. D. (2008). A structural model of leisure constraints negotiation in outdoor recreation. Leisure Sciences, 30(4), 342–359. [Google Scholar] [CrossRef] [Scilit]
- Wu, C.-H., Lin, H.-H., Lai, S.-Y., Tseng, K.-C., & Hsu, C.-H. (2021). A study of leisure constraints and job satisfaction of middle-aged and elderly health care workers in COVID-19 environment. Healthcare, 9(6), 713. [Google Scholar] [CrossRef] [Scilit] [PubMed]
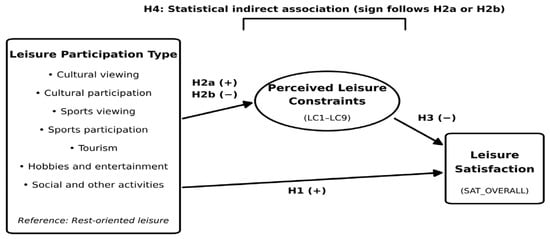
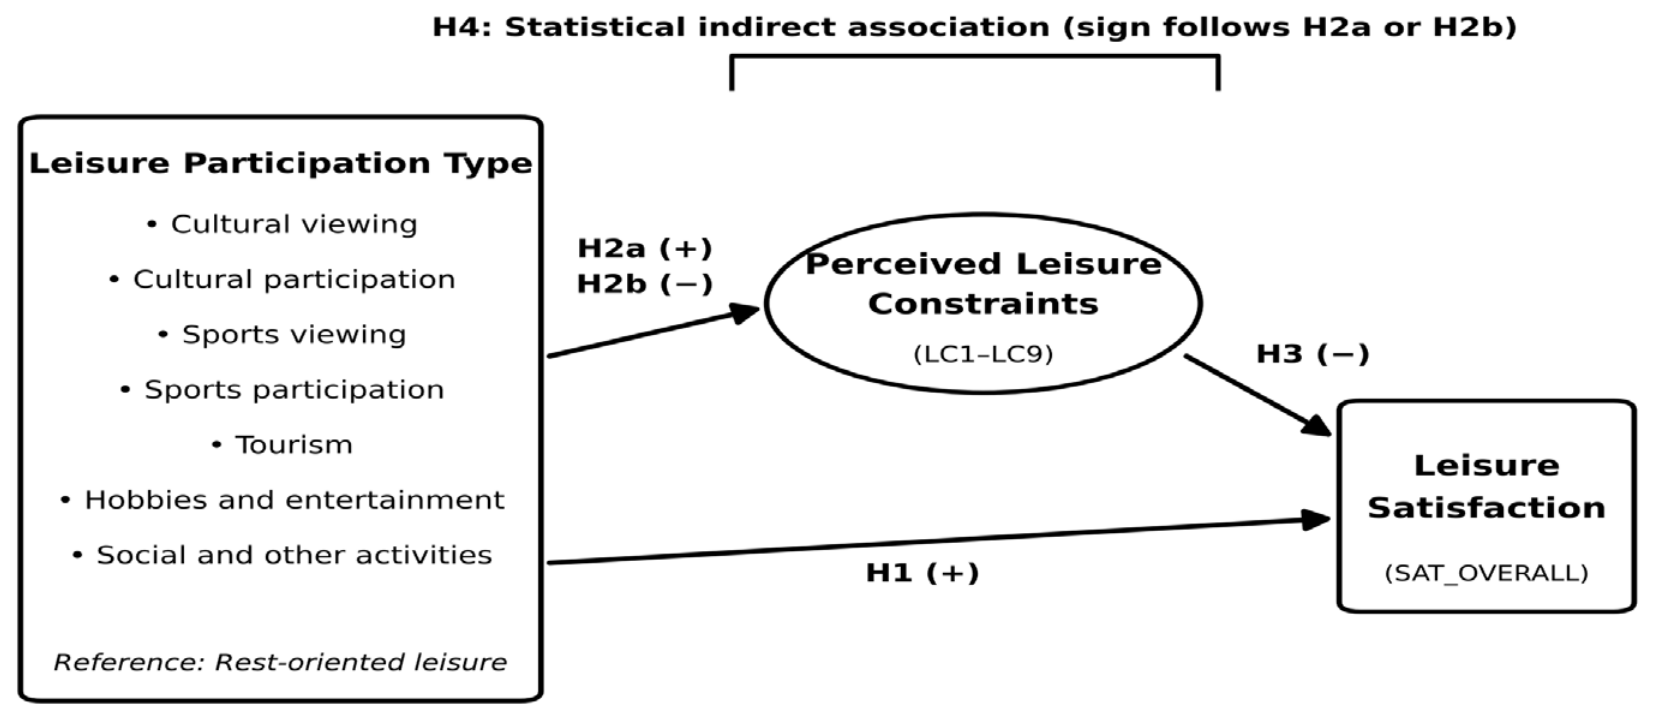
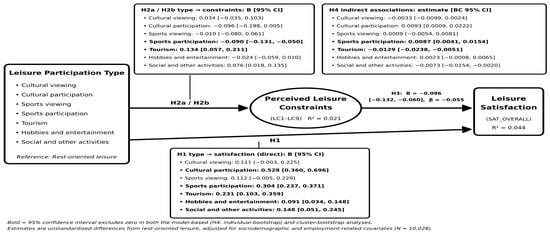
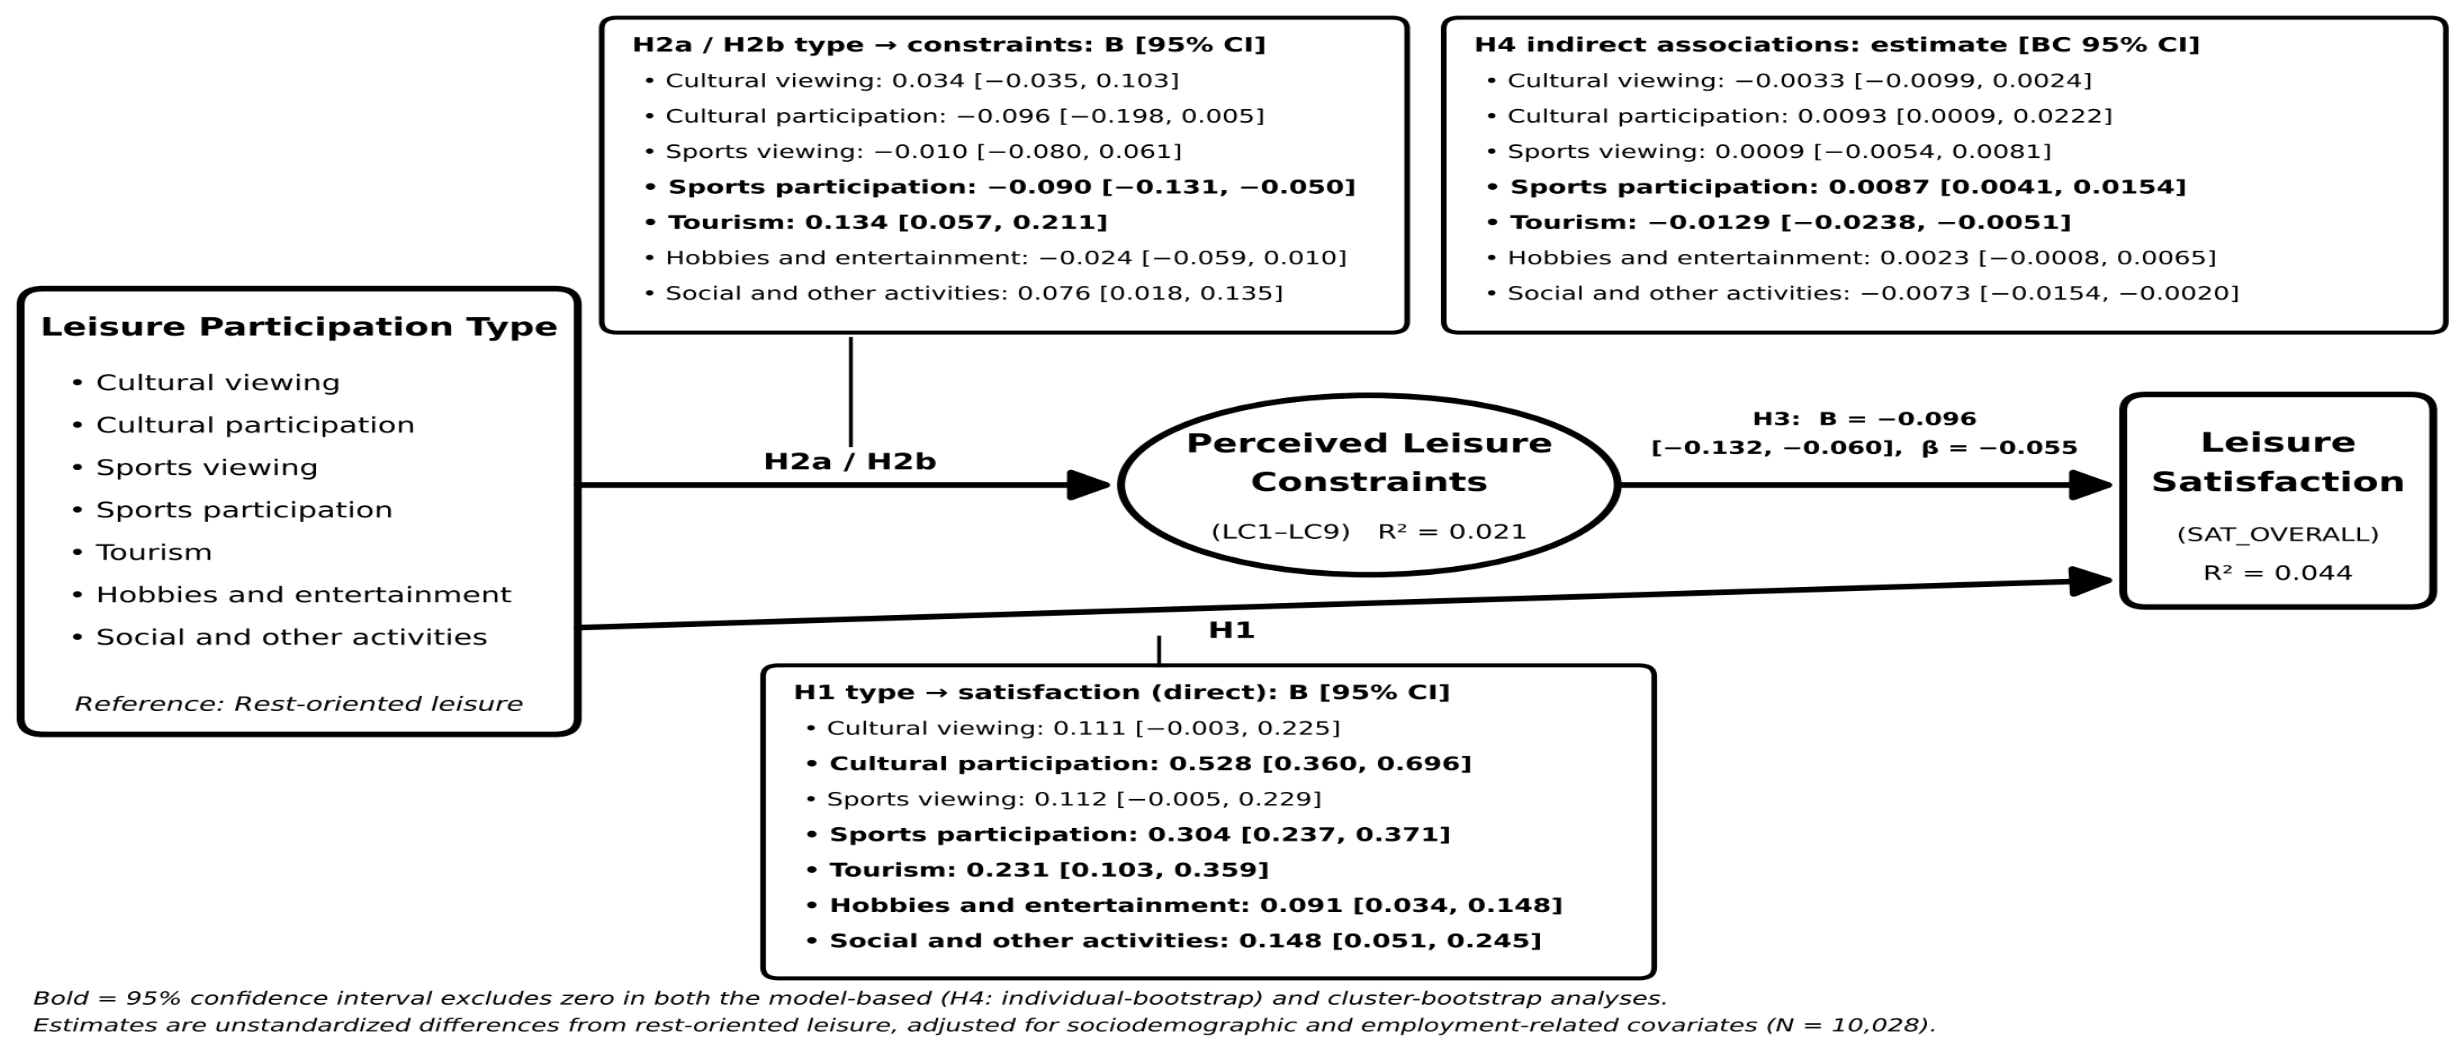

Disclaimer/Publisher’s Note: The statements, opinions and data contained in all publications are solely those of the individual author(s) and contributor(s) and not of MDPI and/or the editor(s). MDPI and/or the editor(s) disclaim responsibility for any injury to people or property resulting from any ideas, methods, instructions or products referred to in the content. |
© 2026 by the authors. Licensee MDPI, Basel, Switzerland. This article is an open access article distributed under the terms and conditions of the Creative Commons Attribution (CC BY) license.