


Abstract
A novel axiomatic foundation of entropy has recently been proposed, overcoming the limitations of classical and information-theoretic entropy foundations and eventually unifying probabilistic and physical entropy. A new set of postulates leads to a rigorous, uncertainty-based definition of entropy consistent with the principle of maximum entropy. Entropy is thus a purely stochastic concept quantifying uncertainty, thereby enriching Kolmogorov’s probability system. Applied to gas thermodynamics, the new framework reproduces classical results and derives, rather than assumes, the laws of thermodynamics. In atmospheric applications, entropy maximization yields an isothermal state as the molecular equilibrium. Gravitation does not alter the isothermal state but differentiates it from the isentropic one of macroscopic air parcels, whose motion drives the atmosphere away from equilibrium. Radiatively active gases, through interactions with shortwave and longwave radiation, sustain non-equilibrium vertical profiles of the atmospheric variables. Combined with the Stefan–Boltzmann law, these mechanisms provide a simple, parsimonious, and coherent explanation of observed atmospheric behaviors and the climatic system. The framework highlights thermodynamics as emergent from stochastics, offering new insights into molecular uncertainty, emergence of macroscopic structures, and radiation in shaping Earth’s climate. It also suggests a broader stochastic view of nature and atmospheric processes.
«Πολλὰ ἀπιστία δέδρακεν ἀγαθὰ ‹καὶ› πίστις κακά. ὅ τε Ἐπίχαρμος “μέμνασο ἀπιστεῖν” φησίν· “ἄρθρα ταῦτα τῶν φρενῶν.” αὐτίκα τὸ μὲν ἀπιστεῖν τῇ ἀληθείᾳ θάνατον φέρει ὡς τὸ πιστεύειν ζωήν, ἔμπαλιν δὲ τὸ πιστεύειν τῷ ψεύδει, ἀπιστεῖν δὲ τῇ ἀληθείᾳ εἰς ἀπώλειαν ὑποσύρει.» (“Incredulity has brought about many good things, and trust evil things. And Epicharmus says, ‘Don’t forget to exercise incredulity; for it is the sinews of the mind.’ Now, just as believing in the truth brings life, so does disbelieving in it bring death; but on the other hand, believing in lies, while disbelieving in the truth, leads to ruin.Clement of Alexandria [1].
1. Introduction
The basic premise of this work, which has been presented in detail in recent books (Koutsoyiannis, 2025 [2], 2026 [3]), is that entropy is uncertainty quantified and is associated with change. As further clarified elsewhere [4,5], uncertainty is not ambiguity, confusion, fuzziness, disorder, or a “monster”. Rather, uncertainty (or randomness, which is the same) is a fundamental governing principle of nature. Uncertainty makes the world interesting, life liveable, and humanity capable of freedom.
However, uncertainty needs to be described with clarity and accuracy—or, in Aristotle’s language, with saphenia [2,3]. The language to this aim is offered by stochastics—a collective name for probability theory, statistics, and stochastic processes. Uncertainty and its quantified version, entropy, are not just a modeling convenience; they are the actual physics driving the reality we observe.
This reality is continuously changing, while the very notion of time would be meaningless without change. The nature of change has been a central philosophical issue from ancient times, as testified by quotations such as
«Πάντα ῥεῖ».(“Everything flows”; Heraclitus [6])
«Μεταβάλλει τῷ χρόνῳ πάντα».(“All changes in course of time”; Aristotle [7])
The fundamental deterministic physical principles are primarily either conservation laws (for mass, momentum, energy, etc.) or derived from conservation laws. Conservation laws cannot be responsible for change; rather, they constrain the changes that are dynamically allowed. Because those allowed changes are time-reversible, the irreversible evolution observed in macroscopic systems requires a quantity that is not conserved—and this is entropy. The tendency of entropy to attain its maximum value under the constraints imposed by the conservation laws is the driving force of change. This tendency is mathematically expressed by the principle of maximum entropy, for which the following formulation is proposed:
Uncertainty will not be lower than its maximum possible value without a reason.
Such a reason, if it exists, would be expressed mathematically as a constraint, as we will see below, but the definition of entropy should be independent of constraints. It is stressed that, as is typical of first principles, the principle of maximum entropy, with its above formulation, is posited axiomatically and not derived or proved. Hence, its validity is not subject to proof, but is confirmed (or refuted) by the richness, reliability and consistency of the results it yields. Furthermore, contrary to the usual epistemological interpretation, the principle is here advanced as an ontological—hence physical—principle.
This difference in status can be seen clearly by comparing the formulation given above with the classic statement of the principle by Jaynes [8]. Jaynes introduced the principle of maximum entropy in 1957 not as a physical (ontological) principle, but as one for logical inference (epistemological):
“In making inferences on the basis of partial information, we must use that probability distribution which has maximum entropy subject to whatever is known.”
Interestingly, Jaynes (2003 [9]) insisted that probabilistic and thermodynamic entropies are different. In contrast, the approach proposed here treats the two as equivalent: the same maximization principle is regarded as governing both the assignment of probabilities and the irreversible change in physical systems. The tendency of entropy to attain its maximum value under the prevailing constraints is taken as the principle that supplies the direction of irreversible evolution once the description has been reduced from the underlying time-reversible dynamics. Additional key features of the proposed approach are the explicit connection between uncertainty and entropy, with the latter being the quantification of the former, and the recognition of uncertainty as a physical reality, also connected with change.
Even the colloquial meaning of the name entropy is related to change; it is etymologized from the Greek word εντροπία, a synthesis of εν (=in) and τροπή (=change; cf. troposphere). As a scientific term, entropy was introduced by Rudolf Clausius in 1865 [10], who understood the connection of entropy with change and its tendency to increase until it reaches a maximum. However, he did not connect entropy with probability or uncertainty. His pioneering work led to the development of classical thermodynamics, in which, however, the definition of entropy is rather circular. Specifically, the thermodynamic entropy, , is defined for a reversible process by , where is heat and temperature, and where a reversible process is one in which this equality holds—otherwise .
It was Ludwig Boltzmann (1872 [11], 1877 [12]) who gave entropy its probabilistic content as he linked it to probabilities of thermodynamic system states. He thus explained the second law of thermodynamics as the tendency of a system to run toward more probable states, which have higher entropy. Boltzmann was followed by Gibbs (1902 [13]) and Planck (1906–1914 [14,15]), who regarded entropy as a probabilistic concept but without formal mathematical completeness. Note that Kolmogorov’s probability system had not been proposed at the time. It is interesting that Planck arrived at the same entropic formula in thermodynamics as the one that Shannon (1948 [16]) did for information content. Shannon also called the quantity he arrived at ‘entropy’ at von Neumann’s suggestion. According to his definition, entropy is a probabilistic concept, a measure (as Shannon incorrectly calls it) of information or, equivalently, of uncertainty.
Wiener (1948 [17]) also used the same definition for information, albeit with the opposite sign. Von Neumann (1956 [18]) obtained virtually the same definition of entropy as Shannon, though in a slightly different way. As von Neumann was a mathematician, physicist, computer scientist, and engineer, he clearly understood the connection of the information-based entropy definition with its pre-existing physical content. He cited Szilard (1929 [19]), who had implied the same definition of entropy in a thermodynamic system. (Perhaps he was not aware of the earlier contributions by Planck).
Given the above substantial contributions of famous scientists, one would expect that the existing foundation of entropy is fully satisfactory. However, it may be argued that it is not. Specifically, Shannon [16] derived the entropy formula by positing three “properties”, which are mathematically problematic—particularly the last one based on an example, rather than a mathematically rigorous statement [2]. Khinchin (1957) [20] tried to give a proper mathematical foundation to Shannon’s theory using a different variant of Shannon’s postulates and demonstrating a “Uniqueness Theorem”, but he used the notion of conditional entropy before defining entropy [2].
Jaynes [9] (p. 347) reformulated Shannon’s postulates in a more general wording, which, however, did not satisfy even himself, as he noted:
Although the above demonstration appears satisfactory mathematically, it is not yet in completely satisfactory form conceptually. The functional Equation (11.7) [the problematic Shannon’s example reformulated by Jaynes] does not seem quite so intuitively compelling as our previous ones did. In this case, the trouble is probably that we have not yet learned how to verbalize the argument leading to (11.7) in a fully convincing manner. Perhaps this will inspire others to try their hand at improving the verbiage that we used just before writing (11.7).
Papoulis (1991 [21], p. 533) claimed that he used Shannon’s postulates, whom he cited, after rephrasing them in a better mathematical language, but what he wrote was inaccurate (as demonstrated by counterexamples in Koutsoyiannis [2]).
The above limitations and shortcomings give room to introduce a new foundation serving the need for mathematical rigor, consistency with maximum entropy as an ontological principle, and seamless connection to stochastic processes. In this new foundation, rather than following Jaynes’ suggestion for “improving the verbiage,” it was preferred to abandon these problematic postulates altogether and replace them with more satisfactory ones.
Hopefully this is done below in Section 2. Applied to gas thermodynamics, the new framework reproduces classical results and derives, rather than assumes, the laws of thermodynamics in general and their application in the atmosphere simply by entropy maximization (Section 3). Radiation laws, namely Planck’s Radiation Law and the Stefan–Boltzmann Law, are also produced by entropy maximization (Section 4), thus completing the simple, parsimonious, and coherent explanation of observed atmospheric behaviors and the climatic system. Overall, the framework (further discussed in Section 5 and summarized in Section 6) highlights thermodynamics as emergent from stochastics, offering new insights into molecular uncertainty, emergence of macroscopic structures, and radiation in shaping Earth’s climate. It also suggests a broader stochastic view of nature and atmospheric processes.
Due to the wide range of topics covered, on the one hand, and the requirement for brevity, on the other hand, the full set of derivations and their proofs is not contained in the paper, but can be found in [3].
2. Proposed Stochastic Foundation of Entropy
2.1. Preliminaries: Partitions, Probability, and Uncertainty
Probability, as defined by Kolmogorov (1933) [22], is a normalized measure. Practically speaking (excluding non-measurable sets), probability is a function that assigns numbers to events, where events are represented as sets. Events are subsets of a ground set, , whose elements are called outcomes. Any subset of which includes any number of outcomes is also an event. The ground set is also an event, the certain event, and has probability 1. All other events are uncertain. In typical problems, there is an infinite number of outcomes (possibilities) and an even greater number of events. Given two events, we can tell which is more uncertain by comparing their probability.
Entropy is a quantification of a set of events, which are disjoint and whose union is the entire ground set. This set of events is called a partition. While probability assigns one number to each event, entropy assigns a single number to the entire set of events (partition or distribution). In this respect, it is not a measure. Figure 1 provides a schematic that helps intuition about the concepts involved.
Figure 1.
Schematic for the basic concepts required for entropy definition: ground set, outcomes, events, partition, and probability and entropy as functions.
It is useful to list here a few of the fundamental properties of partitions:
- The coarsest partition has one element, .
- The finest partition is composed of elementary events, .
- A partition with two elements, is called a bipartition.
- A refinement of a partition is a partition such that each element of is a subset of some element of .
- A common refinement of two partitions is a refinement of both.
- Given two ground sets and partitions thereof , their product partition, denoted as , is a partition of the Cartesian product , consisting of all events for all . Since the occurrence of the event is equivalent to the occurrence of both and , we can simplify the notation by omitting ‘’ and writing .
2.2. Postulates and the Derivation of the Entropic Formula
We need to define the entropic function (the green layer in Figure 1) in such a way that it incorporates the principle of maximum entropy. Namely, we should specify states associated with maximum uncertainty and make our definition such as to give a function that becomes maximum at these states. The following postulates ensure this.
Postulate 1.
Continuity: Given a partition of the ground set , its entropy is a twice continuously differentiable function of the probabilities of the events that form the partition. Namely , i.e., .
This is a general postulate, specifying the form of entropy as a function of probabilities.
Postulate 2.
Zero at certainty: The entropy of the coarsest partition is zero, .
This is an obvious postulate, saying that a certain event has zero uncertainty.
Postulate 3.
Non-interaction: There is no interaction between any two elements of a partition: .
This is posited for consistency with the principle of maximum entropy: Had this second derivative been nonzero, the knowledge of would provide some information on and therefore would decrease uncertainty—without a reason.
Postulate 4.
Maximization at independence: If are two identical ground sets, and are partitions thereof, then the entropy of the product partition is maximized when any paired events are independent, i.e., .
This is also posited for consistency with the principle of maximum entropy: Independence between two events results in maximum uncertainty as the occurrence of does not contain any information about the occurrence of .
It is evident that the above postulates are abstract and general in order to characterize uncertainty and its maximization in the most abstract and broad way possible. No reference is made to any specific field of application, let alone to the specific constraints of a particular system. As already noted in the Introduction, the definition of entropy should be independent of constraints.
Based on the four postulates, we specify the form of , completing the entropy definition, through the following two theorems:
Theorem 1.
There exists a univariate function such that
Theorem 2.
The function in Equation (1) is uniquely determined as
where is a constant.
The proof of Theorem 2, which is not elementary, is given in Appendix A.1. That of Theorem 1 is easy and can also be found in [2,3]. Based on these two theorems, we derive the entropic formula (also depicted in Figure 1) for the parsimony and simplicity setting , as
and we readily observe that, as is a dimensionless quantity, so will also be the entropy . The following corollaries, whose proofs are direct, express useful properties of entropy:
Corollary 1.
Entropy is determined by Equation (3) uniquely up to a constant multiplier.
Corollary 2.
(with when or ).
Corollary 3.
is a concave function of .
Corollary 4.
For independent , the entropy of the product partition is
Corollary 5.
For any ground sets and partitions thereof
with equality holding when are independent.
Corollary 4 is called the additivity property (or additivity principle) and verbally expressed as “the total entropy of two or more independent systems is equal to the sum of their individual entropies”. According to corollary 5, that sum is the maximum that a product partition can reach. Additional theorems and corollaries that give important properties of entropy can be found in [3].
Entropy can also be expressed in terms of expectations of functions of stochastic variables, considering the finest partition. Specifically, it is readily seen that for a discrete stochastic variable taking integer values (where could be infinite) with the entropy (of the finest partition) is
where E[·] denotes expectation.
For a continuous stochastic variable taking real values ) the definition of the entropy of is possible by means of the relative entropy. This is defined in terms of a background measure , either normalized (so that ) or not. If not, the most typical (but not exclusive) case for continuous variables is the Lebesgue measure, which for an interval (or ) equals the length . For any background measure , the relative entropy is defined as
It is noted that other names (e.g., Kullback–Leibler divergence or cross-entropy) have also been in use for the same concept. To define the entropy of a continuous stochastic variable, first we take the finest partition for intervals of size , form the relative entropy for measure , and make the partition with elements ,
where is the distribution function. Then we take the limit of and set where is the probability density, and , so that . Hence,
It is important to note that for discrete variables, entropy is a nonnegative number (any number between 0 and ∞), but for continuous variables, the (relative) entropy can take any real value (between −∞ and ∞).
The importance of entropy stems from the very fact that it quantifies uncertainty in a rigorous manner. The associated principle of maximum entropy formally expresses the fact that uncertainty rules in nature. By maximizing entropy, we determine the distribution of uncertain quantities, formally expressed as stochastic variables. This determination is made in a precise manner and within an inference framework that is deductive (αποδεικτικό/apodeictic according to Aristotle), i.e., the strongest possible. Maximization is a very strong mathematical operation, which can determine any number of unknown quantities. In typical problems we have to determine an infinite number of unknowns, such as the probabilities of an infinite number of possibilities, but a single maximization suffices to determine them all. With entropy maximization, we do not get the exact values of the variables involved (this would eliminate uncertainty and contradict the very principle of maximum entropy) but the probabilities thereof.
3. Applications to Atmospheric Thermodynamics
3.1. Premises
To find the state of the atmosphere, we maximize entropy at the lowest level: the uncertainty of molecules in motion. For each molecule, the uncertainty comprises several components:
- Location: Three location coordinates, .
- Velocity: Three coordinates, , each bearing kinetic energy proportional to ; the number of degrees of freedom is thus .
- Angular momentum (transformed into velocity units, expressing additional, i.e., rotational, degrees of freedom): (a) for monoatomic molecules (e.g., Ar): no angular momentum and hence, no additional degrees of freedom (); (b) for diatomic molecules (e.g., N2, O2) and triatomic molecules with linear structure (e.g., CO2): two rotational degrees of freedom, corresponding to two axes of rotation (); (c) for triatomic molecules with nonlinear structure (e.g., H2O) or polyatomic molecules: three additional degrees of freedom, corresponding to three axes of rotation ().
In the most typical case, we apply the principle of maximum entropy to the microscopic (molecular) level. Because of the large number of molecules (of the order of Avogadro’s number, , representing the number of particles per mole of substance) the uncertainty is practically eliminated at the macroscopic level. Indeed, the coefficient of variation (standard deviation divided by mean) is minuscule: . This should not mislead us to think that thermodynamic laws are deterministic.
In addition to the principle of maximum entropy, which is regarded here as a first principle, we also use as first principles the conservation of mass, momentum, and energy. In our framework, these take the form of constraints for the entropy maximization. The framework is formulated in such a manner that it can work for any number of molecules, including the case of a single molecule. In the latter case, even if the molecule is treated in isolation, the fact is that it interacts (collides) with other molecules. Hence, its state variables, such as velocity and energy, are not fixed but vary in time. Naturally, we should consider them as uncertain quantities represented as stochastic variables. This is also a necessary requirement to define the entropy of its state—without uncertainty there is no entropy. Accordingly, the conservation laws do not apply to the molecule’s instantaneous state, but to the expectation thereof. As we will see below, there is no reason to change this setting when we move from one to many molecules. We always formulate conservation laws in terms of expectations or the respective variables. This may sound odd within classical mechanical thinking, but it is in full consistency with the ontological treatment of uncertainty. It is similar to the treatment in quantum mechanics, where, for instance, there is no single classical-like value of energy that could be “strictly conserved” from one instant to the next. What is strictly conserved is again the expectation of energy.
For further clarification, our framework considers the mass of each molecule as fixed and therefore mass conservation switches to probabilities adding up to 1—the standard requirement of a normalized measure, which probability is. For simplicity, when we examine a gas mass in a container, we choose a reference frame for which the container is motionless (all velocity coordinates have zero expectation). This allows us to omit the momentum conservation from the constraints, while it is always necessary to use the energy conservation (in addition to probability normalization). This does not affect the value of entropy, which is independent of the choice of the reference frame [3] (Digression 6.A).
3.2. Entropy of Gas Molecules
First we consider a monatomic molecule of mass , moving rapidly in a motionless cube with edge (volume ), whose exact position and velocity are unknown. Its state is described by six variables, three indicating its position and three indicating its velocity with all represented as stochastic variables, forming the vector . The constraints for the particle’s position are . We use a non-relativistic framework, and therefore we do not constrain velocity. The feasible space, , is thus (0, a) for each and () for each ().
The conservation of energy demands that where is the energy per particle (known as internal or thermal energy) and . Hence, the energy constraint is .
We form the entropy of as in Equation (9), recognizing that the background density in should have units [z−1] = [x−3] [u−3] = [L−6 T3]. To form this, we utilize a universal constant, i.e., the Planck constant = 6.626 × 10⁻³⁴ J s, whose dimensions are [L2 M T−1]. If we combine it with a reference mass (such as the particle’s or the proton’s mass), we observe that the quantity has the required dimensions [L−6 T3], thereby giving the entropy as
Application of the principle of maximum entropy with constraints for conservation of mass (i.e., total probability equal to 1), momentum, and energy gives the distribution of as
and it is shown that it satisfies all constraints. This is the multivariate normal distribution for velocity and the uniform for location.
Combining Equations (10) and (11), and performing the integration over , we find the final expression of entropy:
where e is the base of the natural logarithm and are constants with units of energy and volume, respectively, satisfying
so that the middle term of the Equation equals the rightmost one. Note that one of is a freely chosen parameter. Equation (12) reflects the fact that the entropy is a dimensionless quantity, as it should according to its definition in Section 2, and its rightmost part is the sum of two dimensionless quantities representing energy and space available to motion.
An extended version of Equation (12) (for many particles; see below), but with some differences (see Section 3.3), is known as the Sackur-Tetrode equation (after Sackur [23] and Tetrode [24], who developed it independently at about the same time in the early 1910s).
Generalizing for a molecule with degrees of freedom moving in the same cube, we again find a multivariate normal distribution for velocity and uniform for location, i.e.,
where , is the energy associated with the ith degree of freedom with being equal to the mass for and related to the rotational inertia for the other coordinates, and is the geometric mean of , i.e., .
The maximized entropy of the molecule is
where is a physical constant incorporating Planck’s constant, the proton mass, and a reference moment of inertia, and are constants appropriately chosen to match the rightmost with the middle term.
If we wish to calculate the total entropy of identical molecules (instead of one) moving in the same cube of volume , and with average energy per molecule , each with degrees of freedom, then the unknown quantity is the vector with 3N location coordinates and βN motion coordinates. The molecules collide continuously, as can be seen in visualized simulations (e.g., ref. [25] for a homogeneous case and ref. [26] for motion in a gravitational field). With mass, momentum, and energy constraints expressed in terms of expectations of the related stochastic variables, the entropy-maximizing distribution is found to be the product of the distribution functions of the individual molecules:
This clearly suggests (a) independence of the motion of different molecules, (b) uniform distribution for their location, and (c) multivariate normal distribution for their velocity. The entropy for N molecules is the sum of the entropies of the individual molecules (additivity property):
It is stressed that the independence in the motion of different molecules is a result of entropy maximization under the given constraints, and not an assumption. It is also stressed that, similar to the case of one molecule, the energy constraint is expressed in terms of the expectation of the total kinetic energy of all molecules and not as a fixed value of the total kinetic energy. Had we used a fixed value instead, this would create dependence among different molecules, as well as a departure of the probability distribution of the molecules’ velocities from the normal distribution. However, as would tend to infinity, the difference would tend to disappear (because of ergodicity, i.e., equality of the average of infinitely many variables with the true average) and independence would reappear. Practically, this happens for as low as 100. Hence, even in the case of a fixed value constraint, the dependence could be totally neglected in practical problems, where is of the order of Avogadro’s number.
Dependence can also appear in dense systems, where the free path between collisions, , is of the order of molecular size, . Such systems are characterized by macroscopic coupling and cross-dependencies, which are strong, persistent, and highly complex. These systems cannot be represented by the above setting, which is appropriate for so that the systems can be regarded as collections of isolated particles that only interact during brief, instantaneous collisions. Instead, when a fluid becomes dense ( → 1), molecules are in a constant state of overlapping contact. Apparently, the study of such systems should require additional constraints and more involved treatment. However, the Earth’s atmosphere is characterized by ratios of the order of several hundreds and can therefore be represented as a dilute gas. Hence, the study of dense systems is out of our scope of typical atmospheric applications. Additional information about this issue is given in [3]. The molecular-independence assumption is also challenged by turbulence, in which strong velocity correlations develop inside coherent structures. This issue is examined in Section 3.12.
3.3. Standardized (Intensive and Extensive) Entropies
The entropies determined above for one or molecules do not precisely correspond to those in standard use in physics, because they are not intensive and extensive, respectively. To restore full correspondence, we take the entropies conditional on a partition , in which only the molecule location, discretized into bins, matters. The entropy of this partition for 1 and molecules are, respectively, and .
We denote the total energy and the total volume, with being the average volume per molecule. The non-standardized (original) and standardized (conditional on ) entropies for one molecule are, respectively,
The non-standardized (original) and standardized (conditional on ) entropies for molecules are, respectively,
The standardized entropies and are intensive and extensive, respectively, while the original ones, and , do not have these properties. However, the descriptions by either the original or the standardized entropies are precisely equivalent, once the probability calculus for each case is correct. The original quantities are more effective, and hence preferable, in explaining behaviors regarded as paradoxical (e.g., the Gibbs paradox [27]).
3.4. Definition of Temperature and Relation to Classical Thermodynamics
In classical thermodynamics, temperature is regarded as a foundational concept. In our stochastic framework, the foundational concepts are the energy and the entropy , with the temperature being a derivative:
In a gas with molecules in motion with average energy per particle ε and β degrees of freedom, the temperature is obtained as
Here the temperature has energy units and differs from the classical temperature in physics, , measured in kelvins. The unit of kelvin was an arbitrary choice (a historical accident) which, in our framework, is rendered an energy unit: 1 K = 13.81 yJ. The fact that the kelvin unit and the Boltzmann constant are both arbitrary choices that need each other to be made consistent is expressed even in the definition of the kelvin, according to the SI Brochure [28]:
“[The kelvin] is defined by taking the fixed numerical value of the Boltzmann constant, , to be 1.380649 × 10⁻²³ when expressed in the unit J K−1, which is equal to kg m2 s−2 K−1 […].
[…] The effect of this definition is that one kelvin is equal to the change of thermodynamic temperature that results in a change of thermal energy by 1.380649 × 10⁻²³ J.”
Although, according to SI, the kelvin is derived from Boltzmann’s constant, the historical course was the opposite, and this constitutes the historical accident. First, Kelvin defined the unit in 1848 [29], and later in 1900, for consistency with the arbitrary Kelvin scale, Planck [30] introduced the constant, which he named the Boltzmann–Drude constant.
Yet the two quantifications are equivalent: Our definition of entropy through Theorem 2 (Equation (2)) allows for any arbitrary multiplicative constant , which here, for parsimony, we set . If we took = 1.381 × 10⁻²³ J K−1 (i.e., equal to Boltzmann’s constant), we would find the classical entropy, , in lieu of , while the derivative would equal . The two quantifications are therefore related by the proportionality relationships:
3.5. Ideal Gas Law
To find the pressure, , at the box shown in Figure 2, we calculate which molecules hit the base of the cube at a time interval and with which velocity. Namely, the molecules in question are those satisfying .
Figure 2.
Explanation sketch for the collision of a molecule with the bottom face of a cube. The particle shown, located at coordinate (distance from the bottom face), will collide with the bottom face () within time if . The other location and velocity coordinates do not play any role: for example, if and/or are large, a possible collision with the rightmost face of the cube will result in horizontal reflection that will not alter the velocity coordinate .
Knowing the distribution function of , we integrate and find the expectation of the momentum of those molecules. Using Newton’s Second Law, we calculate the expectation of the force exerted on the face, and dividing by the area, we calculate the pressure. The result is (in natural units of temperature and for denoting the volume per molecule):
Converting to SI and using the universal gas constant or the specific gas constant , where is the molar mass, we find the classical form of the ideal gas law:
where n is the number of moles in the volume and is the density.
3.6. Specific Heats and Comparison with Observations
The specific heat in thermodynamics reflects just the degrees of freedom. For a gas with degrees of freedom and gas constant , the specific heat under constant volume (isochoric), , and under constant pressure (isobaric), , are
Table 1 shows the gases appearing in Earth’s atmosphere in proportions > 0.05%, and their characteristics as derived by our stochastic framework. Experimental values for are also given and compared with theoretical values. The deviations are smaller than 1% except for the most complex case of water vapor, in which it is 2%.
Table 1.
Gases appearing in Earth’s atmosphere in proportions (mole fraction) > 0.05%, and their characteristics as derived by our stochastic framework. Conventional experimental values for the isobaric specific heat are also given in the table and compared with theoretical values. Trace gases not included in the table constitute <0.05% altogether.
3.7. Interactions of Bodies
Our framework of entropy maximization can infer by deduction the final states of systems brought into contact, without using the principles of thermodynamics, both in equilibrium cases and in non-equilibrium cases. We summarize the most interesting results here, the derivation of which can be found in [3].
In equilibrium cases, we maximize the entropy under the typical constraints as above and assume that the entropy attains its maximum value allowed by the constraints after their interaction. Specifically,
- In a closed interaction, two systems A and B that are brought into contact, so that they can exchange energy but not mass, will have equal temperatures: .
- In an open interaction, in which the two systems can exchange both energy and mass, in the final state all intensive quantities will be equal: temperature, volume per particle, density, pressure and standardized entropy per particle. This expresses the macroscopic ultimate simplicity of a microscopically complex system.
- In an open interaction of two systems under gravitation, in which one system is at an elevation higher than the other, the temperature in the two systems will be the same, but all other intensive properties will differ.
Contrary to classical equilibrium thermodynamics, the proposed framework can also deal with non-equilibrium cases. For the latter cases, we just put an additional constraint expressing the reason why the systems are not allowed to reach equilibrium. Specifically,
- In two systems in contact, a stable temperature difference could be sustained if there is a constant heat transfer. In this case, all quantities are determined from the temperature difference, and there is no room for entropy maximization of the compound system.
- In two systems far apart under gravitation, in which one system is at an elevation higher than the other, a stable temperature difference can again be sustained if there is a constant heat transfer.
- In this case, with isothermality excluded, entropy maximization results in an isentropic state: the standardized entropy per particle is the same in the two systems.
It is stressed that in these non-equilibrium cases we apply precisely the same entropy maximization framework with additional constraints, and we do not involve additional concepts (e.g., the concept of entropy production or the hypothesis of maximum entropy production; e.g., [32,33,34]).
3.8. Equilibrium and Non-Equilibrium States of an Air Column
The state of an air column is generally affected by gravitation. However, gravitation does not alter the equilibrium state: it remains isothermal, the same as if gravitation were absent—a result verified by simulating molecule collisions under gravitation [35]. What gravitation does is distinguish the isentropic state from the isothermal.
In reality, the Earth is not in equilibrium; hence, the atmosphere is not isothermal. The non-equilibrium state is caused by perpetual change occurring on all scales due to diverse mechanisms affecting radiation processes, both shortwave and longwave: day and night, cloud formation and disappearance, summer and winter, albedo’s spatial and temporal variation (also affected by biosphere changes), Sun’s dynamics and astronomical processes, orbital variations (Milanković cycles), tectonic and volcanic activity, and numerous other irregular changes by internal processes and external forces [35].
In the absence of equilibrium, there is heat transfer. While in solids heat is transferred by conduction, in fluids (atmosphere and oceans) heat transfer is dominated by convection, i.e., mass flow. When mass flows, conduction can be neglected as its power is orders of magnitude smaller than in convection. This is particularly the case for air, whose thermal conductivity is 25 times smaller than in water.
Therefore, when there is convection, the macroscopic motion is mostly reversible adiabatic (where adiabatic means without heat exchange), i.e., isentropic. Ergo, the atmospheric temperature profile departs from the isothermal and tends toward the isentropic.
3.9. Atmospheric Temperature Profiles
A specific solution of the differential equation of vertical heat transfer is a linear temperature profile,
with constant ) known as the lapse rate. The isothermal profile corresponds to constant temperature, exponential pressure decrease, and linear entropy increase:
On the other hand, the isentropic state is characterized by constant entropy and the following equations for dry air:
These two profiles are special cases of the general equations for constant lapse rate, the derivation of which can be found in [3]:
Since in the applications below we use SI units, we omit the subscript ‘T’ for notational simplification and simply write Γ which is meant to be ΓT. The isothermal and isentropic profiles are depicted in Figure 3, in comparison with four others, also having constant lapse rates: 6.5 K/km for the standard atmosphere (see Section 3.11); −3 K/km for an inversion state, i.e., one with negative lapse rate; 12 K/km for a superadiabatic profile with steep gradient; and = 34.2 K/km for the so-called homogeneous profile, in which the density is constant.
Figure 3.
(left) Temperature difference, (middle) pressure ratio, and (right) difference in entropy per unit mass at elevation with respect to the values at zero elevation for the indicated states for dry air. The lapse rates are 0 (isothermal); 9.8 K/km (isentropic); = 34.2 K/km (homogeneous); and 6.5 K/km (standard atmosphere). The specific rates chosen for illustration of the superadiabatic and inversion states are 12 K/km and −3 K/km, respectively. In the leftmost graph, the temperature at zero elevation can be any value, while for the other graphs, it is 288 K (continuous lines), 258 K (dotted lines), and 303 K (dashed lines).
Real-world profiles are not identical to any of the above theoretical ones, but change in time and space. However, all the above lapse rate values (except the homogeneous) do appear in reality, as seen in the examples in Figure 4. The differences in daytime and nighttime lapse rates are suggestive of their thermodynamic origin. Despite this, the average lapse rate in the troposphere is close to 6.5 K/km—that of the standard atmosphere.
Figure 4.
Lower troposphere profiles as observed by radiosondes at the indicated sites and dates. The slopes noted are calculated by linear regression on the points shown in the graph (not the entire range covered by radiosonde data). The profiles with continuous lines correspond to daytime and those with dashed lines to nighttime. For comparison, the standard atmospheric profile, as well as the slope of the isentropic profile, are also shown (Data retrieved from [36]).
One reason for the standard lapse rate being smaller than the above calculated isentropic one of 9.8 K/km is that in that calculation the air was assumed dry. As explained in Section 3.10, for air containing water vapor, the calculation is more complex, and the resulting lapse rate is smaller.
3.10. Phase Change, Saturation Vapor Pressure and Effect on the Isentropic Profile
To find the equilibrium state between the liquid and gaseous phase of water, we maximize the uncertainty of a single molecule with respect to (a) its phase (whether gaseous or liquid); (b) its location in space; and (c) its kinetic state, i.e., its velocity and other coordinates corresponding to its degrees of freedom: 6 in gaseous phase, 18 in liquid phase [37], where the additional degrees of freedom in the liquid phase are not translational or rotational, but are due to local clusters with low-energy vibrational modes that can be thermally excited, reflecting the collective, low-frequency intermolecular modes of water molecules. The final result for the saturation vapor pressure, , as a function of the temperature, , which was derived in [38], is
where is an anchoring point (arbitrarily chosen) and is the amount of energy per molecule (which is assumed constant) to break the bonds between molecules of the liquid phase in order for the molecule to switch to the gaseous phase (evaporation). If converted to SI units, Equation (30) becomes
where the point denotes the triple point of water and the constant was slightly modified to to agree with the experimental quantity . The agreement of the equation with measurements is excellent, better than in standard and empirical formulae, and is not limited to the saturation vapor pressure but also extends to the latent heat of water [38,39]. This is a confirmation of the assumption of a constant . The impressive agreement with empirical data shows that by maximizing microscopic uncertainty we almost eliminated the macroscopic one, for the very reason discussed in Section 3.1.
The equation determining the modified isentropic profile when water is present in the atmosphere in both gaseous (vapor) and liquid (clouds) phases is somewhat complicated and needs integration across the atmospheric column. The integration between any two states 0 and 1 gives the following relationship of the moist isentropic profile:
where is the latent heat of vaporization per molecule, and are the total pressure and saturation vapor pressure, respectively, and are the numbers of molecules of dry air and water, respectively, and is the number of water molecules that are in the gaseous phase. Note that during the transition from state 0 to state 1, does not remain constant because of vapor condensation.
A simplified equation is obtained if we neglect the term . We call the resulting profile the wet isentropic profile, which approximates satisfactorily the pseudoadiabatic profile, in which the condensed water vapor precipitates immediately. To a lesser degree, it also approximates the moist isentropic profile, in which the condensed water vapor remains in the atmosphere (clouds). Converted to SI units, the equation of the wet isentropic profile becomes
In the latter equation, and are the temperature and pressure at any altitude , is the saturation vapor pressure, is the saturation mixing ratio (where and are the densities of water vapor and dry air, respectively), and is the latent heat of vaporization (in SI units). The subscripts ‘0’ and ‘D’ refer to the base level () and “dry air” case, respectively.
Figure 5 illustrates some instances of the wet isentropic profile, which depends on the surface temperature. For large temperatures, its slope is significantly smaller than in dry air. The slope of this idealized profile is not constant across altitudes, thus standing in contrast to the linear Equation (26).
Figure 5.
Vertical wet isentropic temperature profiles in the atmosphere for the indicated surface temperatures. For comparison, the dry isentropic profile for one of the illustrated temperatures is also plotted. The lapse rate values near the surface are 4.8, 3.5, and 8.2 K/km for surface temperatures of 288, 303, and 258 K, respectively.
For low surface temperature, the moist isentropic profile becomes practically indistinguishable from the dry isentropic profile because the low temperature does not allow much water to evaporate (or sublimate) to enter the gaseous phase.
3.11. Standard Profiles of Earth’s Atmosphere
The standard atmosphere, i.e., a profile representative of year-round, midlatitude conditions (ICAO [40]), is depicted in Figure 6. It is seen that in the mesosphere, the temperature decreases with increasing altitude as there is removal of heat from the atmosphere (cooling) due to emission of longwave radiation (see Section 4). In the upper stratosphere, the pattern is opposite (inversion) because of the absorption of solar radiation, caused by the ozone layer reacting with ultraviolet radiation. The lower stratosphere is a 9 km-thick layer in an isothermal state. There, the presence of ozone is weak, and the air absorbs just as much heat as it radiates away, keeping the temperature uniform.
Figure 6.
Vertical profiles of the ICAO [40] standard atmosphere (Source: [35]).
In the troposphere, the temperature drops as the altitude increases. While in the established theory the latter behavior is again attributed to radiation, here it is suggested that it is driven by a different mechanism, namely convection. This convection is strong near the surface and dies off at the level of the tropopause, thus not affecting the upper atmospheric layers, where radiative action drives the observed profiles.
Particular local profiles for different zones of the Earth (namely five different locality profiles) are compiled and used for MODTRAN (MODerate resolution atmospheric TRANsmission model), a code that performs detailed modeling of radiation in the atmosphere [41,42,43]. Three of these profiles are shown in Figure 7, along with data from ERA5 reanalysis (with ERA5 standing for the fifth generation atmospheric reanalysis of the European Centre for Medium-Range Weather Forecasts—ECMWF; ECMWF ReAnalysis [44]). These data are publicly available for the period from 1940 onwards at a spatial resolution of 0.5°. Here, they were retrieved from the WRIT [45] and ClimExp [46] platforms, with the former providing the entire dataset and the latter for the period from 1950 onwards. The figure shows good agreement between the data and these profiles.
Figure 7.
ERA5 temperature (marked as “observed”) vs. ERA5 geopotential height, spatially integrated over ocean grid points at (upper row) a tropical zone extending ±7.5° around the equator and (lower row) a polar zone of width 7.5° south of the north pole, for mean monthly scale and specifically for the months of (left column) February and (right column) August. The monthly average profiles are compared to (i) the profile of the standard atmosphere (shifted to match the temperature at ), (ii) the closest MODTRAN profile (namely the tropical profile for the upper row, and the subarctic winter and subarctic summer profiles for the left and right panels of the lower row, respectively), (iii, iv) the dry and moist isentropic profiles, respectively, and (v) the isothermal profile with the column average temperature.
It is stressed that the standard and local profiles presented above are not theoretically derived (by deduction) but were compiled from long-term observations. In this case, while theoretical reasoning does provide qualitative explanations of what is observed in vertical atmospheric temperature profiles, it does not suffice for quantitative modeling. The processes are too complex to describe within a simple entropic framework in an independent column approximation. Convection (vertical heat transfer), advection (horizontal heat transfer by wind from warmer areas, also affected by Coriolis forces and cell formation), radiation, cloud formation, precipitation, and several other processes are acting together, and their final outcome cannot be predicted by deduction, unlike the analyses of previous sections. However, a stochastic framework, on which entropy and its maximization principle are founded, also supports induction, i.e., inference based on data.
Clearly, the atmospheric profiles discussed here are induction-based. The most impressive finding of this induction is the near constancy of the lapse rate, which remains close to the standard of 6.5 K/km across the troposphere and in all areas. While this signifies a tendency toward the isentropic profile in the troposphere, we cannot maintain that the troposphere is isentropic—whether dry or moist. This becomes clear from the polar areas where the dry and moist isentropic profiles almost coincide with a lapse rate of 9.8 K/km. The latter coincidence can be explained by the low presence of water vapor, which also substantially reduces the radiative activity. However, in the polar areas the actual rate, instead of tending to 9.8 K/km, is lower than the standard of 6.5 K/km (Figure 7). Yet the local profiles clearly reflect the connection with convection: in the polar regions and midlatitude winters, the atmosphere is closer to the isothermal profile than in the tropics, because of the lower level of convection, whose full absence would necessarily lead to an isothermal atmosphere. Furthermore, in tropical and midlatitude areas the actual lapse rate is almost constant, as implied by Equation (26), rather than following the patterns seen in Figure 5. Hence, a common argument that it is the moist isentropic state that determines the lapse rate in the troposphere is deemed not accurate. Additionally, most of the time the atmosphere is not saturated and therefore the moist isentropic profile is not applicable. As already mentioned, the climatic system is too complex to describe by invoking a single mechanism.
3.12. Macroscopic Motion, Cells or Air Parcels, and Turbulence
Once entropy is viewed as a quantification of uncertainty, we may think it relevant to maximize it not only at a molecular level but also at a macroscopic level. As clarified in Section 2.2, entropy is a function of the probabilities of the events that form a partition. Many different partitions could be formed, which have different entropies and, when these are maximized, different values of the variables involved will be obtained. Hence, we would expect that the maximization of a coarser partition would give a different result from that of the finest partition.
The entropy maximization at the finest, i.e., molecular, scale gave accurate results for atmospheric thermodynamics, virtually eliminating macroscopic uncertainty, but these do not explain everything that occurs in the atmosphere. Has nature restricted entropy maximization to a unique unit or scale, the molecular one? Or does it employ a multitude of scales for this maximization, considering different partitions on which to maximize uncertainty? The second possibility appears to be the case. Indeed, there are macroscopic atmospheric structures, named cells or air parcels, which move as structures (convection), while being continually transformed in shape and physical characteristics. This makes their study much more complicated. While molecules belong to a few species only, each having a fixed and stable structure, the clusters that form the cells are temporary, lack a clear shape and a fixed scale, and instead span a hierarchy of spatiotemporal scales, starting with a spatial scale of mm to m and a temporal scale of min, and reaching the horizontal scale of a third of a hemisphere, the vertical scale of the entire troposphere, and the seasonal time scale. The hierarchy includes Rayleigh-Bénard cells, small thermals or plumes, mesoscale convection cells, deep convective cells, mesoscale convective systems, and global circulation cells. The entire hierarchy is linked to macroscopic motion: without it, the clusters do not form at all, in contrast to the microscopic motion, which is intrinsic.
In this respect, it looks reasonable to accept that (a) nature does not adhere to a unique scale or unit for maximizing entropy, (b) the atmospheric system composition includes units of different sizes, and (c) there are different physical mechanisms acting on multiple scales. It is important to recognize that there is an antagonism between scales: maximizing entropy on one scale reduces it on another. A numerical illustration for this, based on a toy model, is given in [3] (Digression 6.L). Because simultaneous maximization at all scales is impossible, a balance across many scales would be the alternative. It is recalled that entropy means uncertainty, and entropy maximization results in maximum uncertainty. In this respect, we could assume that nature may “sacrifice” some part of uncertainty on one scale in order to increase uncertainty on other scales.
The physical mechanisms responsible for the emergence of clusters (coherent flow structures) on different scales are twofold: viscosity and, primarily, turbulence. Inside these coherent structures, the velocities of neighboring molecules (or fluid elements) are strongly correlated, so the assumption of molecular independence no longer holds.
At the finest macroscopic scales, viscous packets emerge within a flow due to local velocity gradients. The flow disrupts the spatial equilibrium of intermolecular electromagnetic bonds (liquids) or biases the random thermal transport of molecular momentum (gases). Both manifest macroscopically as a resistance to sliding motion (viscous shear stress) between adjacent fluid layers.
At larger scales and higher velocities, the flow mechanisms are no longer molecular in origin. Instead, they arise from macroscopic inertial transport driven by the stochastic structure of the velocity field. Specifically, these turbulent stresses manifest as covariances between fluctuating velocity components in different directions (Reynolds stresses). Turbulence spans a wide range of spatial and temporal scales (encompassing the entire hierarchy of cells mentioned above) and is sustained by a massive energy cascade. This cascade continuously transfers kinetic energy from coarser to finer macroscopic scales, until it reaches the dissipation range where viscosity ultimately converts it into microscopic kinetic energy (heat).
Because both viscous and turbulent motions emerge from the collective statistical behavior of countless particles, they are mathematically intractable to model as isolated molecules via standard molecular thermodynamics. Instead, they are effectively analyzed within the continuum framework of fluid dynamics.
A natural adaptation of the presented framework is to treat the air parcel (or coherent turbulent structure) as the new elementary unit and to maximize entropy subject to the appropriate macroscopic constraints (mass, energy, and possibly Reynolds stresses or other moments of the velocity field). Developing the corresponding parcel-scale maximum-entropy theory lies beyond the present scope but constitutes a logical extension for complex turbulent regimes.
Even though continuum dynamics is beyond the scope of this study, the above analysis helps us to understand the different mechanisms and dynamics on different scales, and to explain and interpret the observed profiles discussed in Section 3.11. As shown in Section 3.1, Section 3.2, Section 3.3, Section 3.4, Section 3.5, Section 3.6, Section 3.7, Section 3.8 and Section 3.9, if there were only molecular motion, the atmospheric profile would tend toward an isothermal profile, driven by the principle of maximum entropy at the molecular scale.
The coexistence of molecular and macroscopic motion at multiple scales determines a nonzero vertical temperature gradient, reducing the entropy at the molecular level. Indeed, macroscopic motion cannot maintain a constant temperature. Rather, it drives the actual vertical temperature profile away from the isothermal. An air parcel that has been warmed at the surface will move upward so fast that no heat can be removed from it, or added to it. Hence, the process is reversible and adiabatic, i.e., isentropic. The lapse rate will then tend to the isentropic lapse rate, , the dry one if the atmosphere is not saturated, or the wet one if it is saturated.
Since the entropy maximization at the microscopic (molecular) level results in , while that at the macroscopic level the lapse rate is pushed toward , it is reasonable to expect that the actual Γ would be in between 0 and , and the standard lapse rate K/km is therefore unsurprising. But as we have already explained, we do not expect to find this by deduction, due to the complexity of the entire climatic system and the fact that this standard value is the result of an integration over the globe. Hence, it is necessary to rely on induction, which is fully consistent with the stochastic approach adopted here.
4. Extension to Radiation
4.1. Entropy of Radiation Quanta and Planck’s Law for Blackbody Radiation
In Section 3, we treated the moving molecules by their kinetic energy, while we also investigated the effect of the potential energy due to gravitation. In steady state, the energy and entropy remain unchanged. However, the kinetic energy of molecules tends to decay due to their emission of photons. Thus, in order to remain in steady state, a system must receive energy equal to the energy emitted, and in order to be in equilibrium, its entropy must be at maximum.
We assume that a molecule has average kinetic energy and within a certain time frame it emits an average energy as electromagnetic radiation (photons). It receives the same average amount of energy from the environment (e.g., by heat or radiation), and it remains at steady state. As radiation is a stochastic process, it has its own entropy ; hence, the total entropy of the molecule is
where is the entropy related to the kinetic state of the molecule. Here we have assumed additivity of entropy, which presupposes independence of the kinetic and the radiative processes—an assumption that in the problem examined is plausible, even though in other systems it is not (e.g., in strongly entangled quantum systems). Assuming a perturbation of radiative energy, at the expense of the kinetic energy, so that , and taking derivatives with respect to we find
From the definition of temperature, (Equation (20)), we recognize that the term equals . The inverse of the term is the radiation temperature and since at equilibrium , from Equation (35) we conclude that the radiation temperature is identical to the kinetic temperature, .
To determine the radiation entropy , we recall that a photon is a quantum that cannot be subdivided and has minimal specific energy content, , where is the Planck constant and is the frequency. Integer multiples of the minimal energy are allowed, and thus radiation materializes in quanta of energy , where is regarded as a realization of the stochastic variable with allowed values . Denoting , the entropy is
where the constraints are
After entropy maximization considering the constraints, as shown in Appendix A.2, the unknown probabilities are found to follow the geometric distribution, namely
and the average energy and entropy expressions become, respectively:
Converting the average energy to power per unit area (see Appendix A.2), we obtain Planck’s Law for blackbody radiation:
where is the spectral density expressed in terms of frequency , is the spectral density expressed in terms of wavelength , and denotes the speed of light in vacuum. The law determines the emitted radiation intensity. Converted to SI units, and are respectively expressed as W s m−2 sr−1 and W m−3 sr−1. Figure 8 illustrates the law for the spectrum of the solar (shortwave; SW) and terrestrial (longwave; LW) radiation.
Figure 8.
Blackbody radiation intensity for the Sun’s surface (spectral radiant exitance, 5772 Κ, ) and the Sun viewed from Earth (irradiance, for sr), in comparison to terrestrial (Earth’s) blackbody radiation (spectral radiant exitance, for T = 255 Κ, ). (For further explanations of the different spectral quantities, see Appendix A.2). Classification of radiation based on wavelength is also shown, with visible light defined between 0.4 and 0.7 μm and the boundary between solar (SW) and terrestrial (LW) radiation defined at a wavelength of 4 μm. The wavelengths at which the intensity is maximized are 0.502 μm and 11.36 μm for solar and terrestrial radiation, respectively (Equation (A37) in Appendix A.2). The temperature 255 Κ is the mean temperature of the Earth’s atmosphere (see Section 4.3 for justification).
4.2. Atmospheric Radiation Effect
The atmosphere is not transparent to radiation. As shown in Figure 9, several gases absorb and emit radiation at particular wavelengths. These are called here radiatively active gases (RAGs) but are more commonly referred to as “greenhouse gases” (see Section 4.4). These include water vapor (condensing) and non-condensing gases (NC-RAGs). The effect of RAGs and clouds on transmitted radiation is here called the atmospheric radiation effect (ARE), but is more commonly referred to as the “greenhouse effect”.
Figure 9.
Transmission and absorption of SW (solar) and LW (terrestrial) radiation through the atmosphere vs. wavelength. The absorption bands of Earth’s atmosphere (middle) affect both downwelling SW radiation and upgoing LW radiation emitted near the surface (upper). The individual absorption spectra of radiatively active gases (plus Rayleigh scattering) are also shown (lower). (Source: [47] under a CC license.)
The ARE applies to both solar (SW) and terrestrial (LW) radiation. For the solar spectrum, the total power (area of spectrum) is 1361 and 735 W/m2 (reduction to 54%) at the top of the atmosphere and the surface, respectively. If reduced to Earth’s area (by division by 4), these become 340 and 184 W/m2, respectively.
4.3. The Stefan–Boltzmann Law and the Earth’s Equilibrium Temperature
The integral of the spectrum over the entire range of frequencies , is
Converting this to SI units and identifying it as emitted power per unit area, after integrating the radiant exitance (see Appendix A.2) over the outgoing hemisphere (units W/m2), we obtain
where is the Stefan–Boltzmann constant. This is the Stefan–Boltzmann Law, which applies to a blackbody, an idealized body with maximal emission. In a real object, typically called a gray body, the total radiation is lower by a factor , known as emissivity, i.e.,
The solar radiation, which is governed by the Stefan–Boltzmann Law at Τ = 5772 Κ, when reaching the Earth, is partly reflected and absorbed. Then, the Earth emits at different wavelengths, determined by its own equilibrium temperature, where the meaning of equilibrium is that, in the long term, energy balance is achieved.
Given that the amount of energy the Earth receives from the Sun is equal to the amount it radiates back to space, it is not correct to say the Earth gains energy from the Sun. Rather, it is correct to say that the Sun provides the Earth with a source of low entropy. Indeed, solar radiation is at higher frequencies than terrestrial radiation (see Figure 8 and Figure 9), and entropy is a decreasing function of frequency (see Equation (A29) in Appendix A.2). The difference between the lower entropy of solar radiation and the higher entropy of terrestrial radiation is the main reason why the atmosphere is maintained away from equilibrium.
Based on the Stefan–Boltzmann Law and using the trigonometric and astronomic details of Earth’s geometry and motion, we obtain the equilibrium temperature of Earth. The results shown in Table 2 are for the top of the atmosphere (TOA) and for the average albedo [3].
Table 2.
Comparison of Earth’s average temperature resulting from the indicated assumptions and albedo (Source: [3]).
As seen in Table 2, the equilibrium temperature is not a uniquely defined magnitude; depending on several factors, it can range widely. For reasons explained in [3], the most realistic value is that in the bottom-right corner of Table 2, or somewhat higher. We finally adopt the average temperature value of 255 K.
A typical question is ‘Why is Earth’s surface temperature 288 K (estimated by averaging measurements at Earth’s surface), much higher than the equilibrium temperature (255 K)?’ The typical answer is ‘Because of the “greenhouse effect”.’ Here we examine another question: Is it higher (in a comparable way)?
In calculating the equilibrium temperature of 255 K, we used the irradiance and albedo at the TOA, and thus we considered the Earth as a whole. On the other hand, at any location (defined by its geographical coordinates ) we do not have a unique Earth temperature across altitudes because the atmospheric column is not isothermal.
Since calculating the equilibrium temperature, we considered the Earth as a whole; it is reasonable to assume that this value represents the average temperature over the atmospheric column. As inferred from Figure 7, the column average temperature equals the actual temperature at an altitude of 5–7 km, which roughly corresponds to the atmospheric pressure level of 500 hPa.
As seen in Figure 10, based on ERA5 reanalysis data, the global average temperature at the level of 500 hPa is 258 K, close to 255 K. Furthermore, the average altitude for the pressure level of 500 hPa is 5.7 km. It appears thus that we have a “stationary point”, the intersection of the isotherm of 255 K and the inclined profile, with its slope being the lapse rate. For a lapse rate of 6.5 K/km in the troposphere, a temperature of 255 K at the altitude of 5.7 km yields a surface temperature of 292 K, close to 288 K.
Figure 10.
Temperature variation at the atmospheric level of 500 hPa according to ERA5 Reanalysis. In addition to the annual global average, maxima and minima are plotted as indicated in the legend; the dotted line, almost indistinguishable from the line of annual average, is a linear trend with slope 0.14 K/decade. The data were retrieved from WRIT [45], except for the series of annual averages of monthly maxima and minima, which were retrieved from ClimExp [46].
4.4. Is the Atmosphere a Greenhouse?
A greenhouse is a structure designed to regulate the temperature and humidity of the environment inside. Such constructions had their origin in Roman times [48], and initially aimed to insulate a garden during the night. When greenhouses became common in the 17th century, they were outfitted with glass. In modern times, the cover and walls can be plastic, usually low-density polyethylene (LDPE).
It was thought that the glass’s opacity to LW radiation was the mechanism causing warming of the greenhouse, by letting SW radiation in and trapping LW radiation. This is not accurate, as testified by both Roman and modern technology. In particular, LDPE is transparent to LW radiation.
In fact, the mechanism of warming in a greenhouse is the blocking of convection, which otherwise would transfer heat from the inside farther away. This has been known for more than 100 years, by an experiment by Wood (1909) [49], who reported that “the loss of temperature of the ground by radiation is very small in comparison to the loss by convection; in other words […] we gain very little from the circumstance that the radiation is trapped”.
In contrast, in the atmosphere, the surface warming relative to the effective radiating temperature occurs through the establishment of the lapse rate via convection. Without convection, the temperature profile would be isothermal (as is in a real greenhouse). An isothermal atmosphere would lead to an average surface temperature of 255 K (see Table 2 and its description). It is the temperature gradient that makes the surface warmer than this. This may sound paradoxical if viewed on a local scale, e.g., above warm ground where convection removes heat. However, it should be viewed on a macroscopic basis including the entire air column and not as a local phenomenon. Convection does not impact the average temperature of the atmospheric column, which remains close to 255 K, and this is indeed the case as seen in Figure 10. A temperature equal to the column average appears at about 5.7 km. As illustrated above, if we take this “stationary point” (the intersection of the isotherm at 255 K and an inclined profile) and apply a slope of 6.5 K/km to the inclined profile, then we find that the surface temperature will be close to 288 K. The warming (from ~255 K to ~288 K) is a necessary consequence of the lapse rate, which in turn appears because of convection. Indeed, there would not be a lapse rate without convection. Convection occurs in a reversible adiabatic manner, thus pushing the atmosphere toward the isentropic profile. In an isentropic profile, temperature decreases with increasing altitude (see Figure 3)—hence the lapse rate. This line of reasoning is summarized in the schematic of Figure 11. Note that this ordering is the reverse of the classic Manabe and Strickler (1964 [50]) pure-radiative versus radiative-convective comparison (see Section 4.5); the difference arises because here the lapse rate is set by the entropy maximization framework rather than by radiative equilibrium.
Figure 11.
Logical chain for the formation of the atmospheric temperature profile according to the proposed approach.
Because the dominant mechanisms operating in the atmosphere are in several respects opposite to those of a greenhouse, the traditional label “greenhouse effect” is arguably inaccurate. It carries several potential drawbacks: a mismatch of mechanisms (convection versus radiation and the implication of a static barrier), an oversimplified view of complex processes, and an uneven emphasis on particular gases [35]. As first highlighted by Aristotle, sapheneia (clarity and accuracy) of concepts and terminology is essential in science. In this respect, the expression “anti-greenhouse effect” would be more accurate in describing the behavior of the atmosphere, namely the fact that the convection establishes a lapse rate and thereby a surface temperature above the column-mean temperature, whilst a greenhouse warms mainly by suppressing convection. For these reasons, as already mentioned, the present work uses the terms radiatively active gas (RAG) and atmospheric radiative effect (ARE). To improve cross-field readability, the conventional expression “greenhouse effect” is retained only sparingly and is always placed in quotation marks.
In our framework, ARE is not absent, but constitutes the final link of the chain shown in Figure 11. Specifically, ARE is necessary for the maintenance and stability of the lapse rate, which is created by convection. This stability requires an energy source at the bottom and a sink at the top. Therefore, in a fully transparent atmosphere (without the ARE), while the perpetual changes listed in Section 3.8 would still occur and would produce convection, that convection would vary in time and space, and the lapse rate would likely become more variable and could frequently change sign locally. In that imaginary case, atmospheric cells, such as convective systems and global circulation cells, as well as the evaporation–condensation–precipitation processes, would likely have a more complex structure and an enhanced role in energy redistribution within the atmosphere. In the real atmosphere, ARE properly adapts the energy balance so that the lapse rate remains at the value determined by thermodynamics, rather than imposing a different value of its own. The adaptability of radiation with respect to lapse rate will become more evident in Section 4.5, where it will be seen that the net effect of ARE on the surface temperature (without considering convection) can be either warming (for the most common case of positive lapse rate) or cooling (in the case of atmospheric inversion). In this sense, the radiative adjustment functions as the restorative mechanism described by the notion of Le Chatelier’s principle. This principle states that, if a dynamic balance is disturbed by changing conditions, the system shifts its state to counteract that change and restore balance. Further clarification and justification of the proposed logical chain is provided in Appendix A.3, also using real-world atmospheric data.
4.5. How Are the Vertical Temperature Gradient and ARE Linked?
This question cannot be answered merely from experimental evidence, as it is difficult to control the lapse rate. It is also difficult to address it by deduction based on bulk entropy maximization, as we did in other questions. Therefore, to investigate the link between the vertical temperature gradient and ARE, we use a radiation transmission model, namely RRTM (standing for rapid radiative transfer model), a hybrid physical/statistical approximation of the full line-by-line models, whose results have been extensively evaluated and validated [51,52]. The model implementation used here simulates the radiation flux through Earth’s atmosphere at a range of altitudes, calculating both SW (incoming and scattered sunlight) and LW (emitted by the ground and the atmosphere), both upward and downward. The model version used is an online application [53] and thus any interested reader can repeat the calculations and check the results.
In the first mode, RRTM was run with different lapse rates using default values for other parameters and assuming no clouds. The equilibrium temperatures obtained from the RRTM runs at the surface () and the TOA () are shown in Figure 12. For we get K (expected: ~255 K). For K/km we get K (reasonably below 288, not considering clouds). Importantly, the surface temperature increases with for the same atmospheric composition and tends to become constant for high .
Figure 12.
Surface and TOA temperatures leading to energy balance vs. lapse rate, as calculated from RRTM runs using default parameters without clouds, as well as using the indicated modifications of parameters for sensitivity analysis.
For sensitivity analysis, additional RRTM runs were conducted, and two sets of results are also shown in Figure 12. For the first additional set, the assumption of double CO2 concentration (800 ppm, where the default value is 400 ppm) was made, as is typical in climatic sensitivity studies. In isothermality, no change is seen, while in positive and negative lapse rates the doubling of CO2 concentration results in an increase and decrease in surface temperature, respectively (and the opposite behavior in TOA temperature). For K/km and 12 K/km, the temperature increase is 2.5 K and 3 K, respectively.
For the second additional set, the CO2 concentration was kept constant at the default value of 400 ppm, but a relatively small fraction, 20%, of high clouds was assumed (compared to 0 in the default parameter set). The behavior is similar, but the changes are much greater: 5.5 K and 12 K for K/km and 12 K/km, respectively (2.2 and 4 times greater than the effect of doubling the CO2 concentration, respectively). Overall, the sensitivity analysis shows that the presence of NC-RAGs does affect the temperature profile, but other factors such as lapse rate and clouds are more important.
The most characteristic index for the behavior of the atmosphere—with emphasis on the troposphere—is provided by the net radiative flux gradient , easily calculated from RRTM and depicted in Figure 13. To investigate the results shown in this graph, we use the following simplified form of the differential equation for the one-dimensional heat transfer in fluids, written in SI units [3]:
where and are the total vertical radiation and heat flux, respectively (in units of power per area), and is a macroscopic (long-term in a stochastic view) thermal conductivity. The equation holds for an atmosphere without convection, but can approximate an atmosphere with convection if the variables are regarded as temporal averages for time scales long enough so that the expectation of the gradient could be assumed constant throughout . Observational data of the troposphere suggest that this is indeed the case, and hence ; the first term on the right-hand side of Equation (44) can be omitted. It is stressed that the online RRTM version used in this paper is consistent with this assumption (constant ).
Figure 13.
Vertical distribution of net radiation flux gradient for the RRTM runs as in Figure 12 (ensuring the energy balance) vs. lapse rate. For better presentation, smoothing of the original values was performed by taking moving averages over five adjacent values.
We examine two special cases: in the first, there is no vertical heat transfer, i.e.,
and in the second, there is steady state, i.e.,
Furthermore, we focus on the troposphere and denote as the temperature at the surface and the tropopause, respectively, where the tropopause is assumed to be at the altitude of 11 km, as in the standard atmosphere. We compare these temperatures with those of an isothermal atmosphere, , which would be between . We also denote the radiative heat flux gradient near the surface and the tropopause, respectively.
In the case of temperature inversion, we will have
From Figure 13, in both examined cases of inversion, −3 and −1 K/km, we have
If we assume no vertical heat transfer, then
- Near the surface we have, ; hence, the layer will warm, and the temperature will tend toward the isothermal, ;
- Near the tropopause we have, ; hence, the layer will cool, and the temperature will tend toward the isothermal, .
That is, in both cases, an atmosphere with temperature inversion and no vertical heat transfer is unstable, and its temperature profile will tend to the isothermal, which is stable according to molecular thermodynamics (Section 3.7 and Section 3.8).
If we assume steady state for the cases of temperature inversion, then
- Near the surface, , which means that less energy leaves the layer from below than enters from above; since heat can only be absorbed by the layer, this means that the heat transfer is from upper layers downward;
- Near the tropopause, , which means that more energy enters the layer from below than leaves it from above, or we have upward transfer of energy.
That is, in steady state in the long term, heat should be created somewhere between the surface and the tropopause and be transmitted both downward and upward, which seems absurd.
In the case of a regular atmospheric profile, i.e., cooling with increasing altitude, we will have
From Figure 13, in the examined regular cases, K/km, we have
If we assume no vertical heat transfer, then across the entire atmosphere we have ; hence, any layer will cool, which seems absurd. On the contrary, if we assume steady state, then across the entire atmosphere we have , which means that more energy enters the layer from below than leaves it from above. Some energy is absorbed in the layer, and we have upward transfer of energy. This is physically consistent, because . Actually, this suggests the development of convection to restore energy balance through .
The profile with the steepest gradient (superadiabatic case) in Figure 13, 12 K/km, results in a very positive near the surface and a negative in the upper atmospheric layers. Without convection, we will have in the troposphere and in the stratosphere, i.e., a clear tendency to the isothermal profile.
Most interesting and enlightening are the RRTM results for the isothermal state (). We observe in Figure 13 that in this case is close to zero for the entire troposphere. A small negative appears in the lower atmospheric levels, which, however, is not deemed to be significant, as the accuracy of the model is not perfect. Also, an isothermal atmosphere would block convection and hence radically reduce evaporation. In RRTM, the default value of humidity is 80%, and this was not modified in our model runs. If taken lower, the negative disappears. For we have implying no heat transfer and no convection. Therefore, the isothermal state is stable both with and without RAGs. In other words, for the isothermal case (), RRTM confirms that the thermodynamic equilibrium in the troposphere () is also a radiative equilibrium ( The plausibility that the atmospheric profile of thermodynamic equilibrium is also at radiative equilibrium is studied in Appendix A.4 by means of simple and transparent calculations rather than sophisticated models. These simple calculations are consistent with RRTM results for an isothermal atmosphere.
Some of the above results stand in contrast to Manabe and Strickler’s [50] notion of pure radiative equilibrium, which corresponds to a very steep lapse rate and a surface temperature of 332.3 K, without convection. Further explanation of this contrast is provided in Appendix A.5. It is stressed that RRTM is a purely radiative model and does not model or make dynamical assumptions about macroscopic atmospheric motion, including convection. Hence, its results are not affected by the presence or the absence of convection. Rather, the absence of convection is signified by the condition in the temperature profile, i.e., by the isothermal atmosphere at about K. Once RRTM results in for this condition, the same condition also signifies a radiative equilibrium.
The above theoretical findings are also supported by experimental and field evidence. Among laboratory experiments related to LW radiation from gases, the most sophisticated and informative ones are those of Harde and Schnell [54,55] and Schnell and Harde [56,57,58]. Their measurements were also confirmed by radiative transfer calculations. Their results suggested that ARE depends on the lapse rate. They provided experimental evidence that ARE can also have a cooling effect, which they called “negative greenhouse effect”.
Measurements by satellites also support the fact that, in the case of an inversion, the behavior of ARE is reversed. Figure 14 (reproduction with adaptation of part of Figure 9 in [59]) shows the vertical intensities at the TOA observed from a satellite and modeled with radiation transfer theory for the Mediterranean and Antarctica. In both cases, the agreement between observations and the detailed radiation modeling the authors conducted is remarkable. (Similar remarkable agreements have also been reported for other data sets, e.g., [60]).
Figure 14.
Vertical radiation intensities at TOA observed with a Michelson interferometer in a satellite (after Hanel and Conrath [61]), and modeled with radiation transfer theory for the Mediterranean and Antarctica (Reproduction with adaptation of part of Figure 9 in [59]).
However, when compared to Planck’s law, remarkable differences are seen. In the Mediterranean, there is a regular vertical temperature profile, with a positive lapse rate. In contrast, in Antarctica, an atmospheric inversion is almost permanent between the surface and the atmospheric level of 600 hPa [35]. In the Mediterranean, as a result of the ARE, the radiation intensity at the TOA is lower than that leaving the ground, where the latter is given by the curve of Planck’s Law. This has a warming effect on the ground. However, in Antarctica, the ARE amplifies the LW radiation that leaves the ground. This is tantamount to a cooling effect at all altitudes, including at the surface. Hence, it is the vertical temperature profile that determines whether ARE has either a warming or a cooling effect. Once positive lapse rates have a warming effect on the ground and negative lapse rates a cooling effect, it may be expected that a zero lapse rate would be neutral (neither warming nor cooling) in consistency with the RRTM results.
Yet the proposed stochastic framework, which is different from the established radiative-convective thermodynamic framework, needs to be further tested. Tests should also include comparisons of the two approaches based on testable observational predictions. For this reason, some possible falsifiable empirical benchmarks for such testing are discussed in Appendix A.6.
5. Discussion
The entropic–stochastic framework has several advantages, such as the unifying character, simplicity, parsimony, better alignment with quantum uncertainty, and resolution of paradoxes. Its relevance for hydrometeorology and the new insights it provides can explain a diversity of processes, including convection, lapse rates, moisture effects, radiation, and non-equilibrium states.
Future work would point out strengths and limitations, as well as required adaptations of the framework in additional tasks, such as full stochastic processes, turbulence, and climate implications. As an example, independence at the molecular scale needs to be adapted in studying turbulent motion.
With reference to classical thermodynamics, it is remarkable that all analyses presented here fully avoided using its four principles. Rather, the principles are either derived or replaced by the new stochastic framework. In summary:
- Zeroth Law: If two systems are in thermal equilibrium with a third system, then they are in thermal equilibrium with each other.
We did not need this law. Rather, we derived it from maximization of entropy.
- First Law: It is related to the conservation of energy, which in classical thermodynamics takes a particular form distinguishing internal energy and work.
We used the conservation of energy as a first principle, from which the particular form used in thermodynamics is readily derived.
- Second Law: It states that in the process of reaching thermodynamic equilibrium, the total entropy of a system increases, or at least does not decrease.
We replaced it with the principle of maximum entropy applied to thermodynamic systems.
- Third Law: It states that the entropy of a system approaches zero as the temperature approaches absolute zero.
We did not need to assume this law at all. Rather, the law is derived in [3] in a slightly different form, in which as the entropy approaches zero, the energy is not zero but a super-tiny quantity, smaller than the quantum zero-point energy that is imposed by Heisenberg’s uncertainty principle. Thus, our stochastic framework is in better agreement with quantum physics than the classical version, which implies that zero energy is in principle feasible.
Additionally, the new framework enables broader philosophical and scientific implications in terms of comprehending and treating uncertainty and change, which are principal properties of nature.
6. Conclusions
- A novel foundation of entropy was proposed, grounded in stochastic principles and four postulates that naturally incorporate the principle of maximum entropy as an ontological (physical) law of nature, rather than merely an epistemological tool.
- The resulting entropy expression, uniquely derived, coincides with the classical Planck–Shannon form but rests on firmer mathematical and conceptual grounds, free from the circularities and limitations of previous formulations.
- This framework unifies probability, uncertainty, and change: entropy is uncertainty quantified, and its maximization drives the irreversible evolution of natural systems.
- In hydrometeorology and atmospheric thermodynamics, the approach allows deductive derivation of key physical laws and relations (temperature, ideal gas law, specific heats, dry and moist isentropic profiles, Clausius–Clapeyron equation, Planck’s radiation law) directly from stochastic principles and conservation of energy.
- The stochastic view reveals the atmosphere as a system governed by coexisting molecular and macroscopic randomness across scales, explaining why its temperature profile tends toward (but is not strictly) isentropic rather than isothermal.
- Overall, stochastics emerges not as a modeling convenience but as the actual physics underlying natural processes. This consideration offers clarity (sapheneia), predictive power, and deeper insight into the workings of a fundamentally uncertain world.
Uncertainty is not a bug. It is the governing principle that makes the universe alive.
Funding
This research received no external funding and was rather conducted out of scientific curiosity.
Data Availability Statement
No new data were created in this study. The datasets used were retrieved from the sources described in detail in the text.
Acknowledgments
In two review rounds, three reviewers provided numerous constructive comments, which helped me to substantially improve the manuscript. Another reviewer, in the first round, provided a negative assessment of the paper, which in a way served as an incentive to improve the paper. I thank Vassilios Zoukos and George Tsakalias for their comments and suggestions about materials related to this paper. I also thank Alberto Montanari (University of Bologna), Roberto Ranzi (University of Brescia) and Hafzüllah Aksoy (Istanbul Technical University), who invited me to present related material at their institutions. I shared a preprint of the paper on several platforms, based on which Jonathan Cohler, Will Happer, Tarik Kupusovic, Ned Nikolov, Willie Soon, and Gilles Bourgeois provided useful feedback, mostly encouraging. During the preparation of the manuscript, I used Grok 4 (by xAI) to check texts and mathematical derivations, and summarize the material for the Conclusions section. In addition, Jonathan Cohler, of his own accord, asked Grok 4 and Claude 4 (by Anthropic, Palo Alto, CA, USA) to review the preprint and kindly shared with me the extensive conversations he had with them. I also consulted Gemini 3.8 (by Google) occasionally. While I have considered the outputs of these AI chats, I take full responsibility for the content of this publication.
Conflicts of Interest
The author declares no conflicts of interest.
Abbreviations
The following abbreviations are used in this manuscript:
| ARE | Atmospheric radiative effect |
| CERES | Clouds and the Earth’s Radiant Energy System (NASA) |
| ClimExp | Climate Explorer |
| ERA5 | Fifth generation atmospheric reanalysis of the European Centre for Medium-Range Weather Forecasts |
| ICAO | International Civil Aviation Organization |
| LDPE | Low-density polyethylene |
| LW | Longwave |
| MODTRAN | MODerate resolution atmospheric TRANsmission model |
| RAG | Radiatively active gas |
| RRTM | Rapid radiative transfer model |
| SI | Système international d’unités (International System of Units) |
| SW | Shortwave |
| TOA | Top of the atmosphere |
| WRIT | Web-based Reanalysis Intercomparison Tool (NOAA) |
Appendix A
Appendix A.1. Proof of Theorem 2 for the Derivation of the Entropic Formula
Step 1. We start with the observation that, since Postulate 4 holds for any pair of partitions , it also holds in the simplest nontrivial case of bipartitions. Let be a bipartition of , with probabilities and . By virtue of Theorem 1, the entropy is
We consider two identical ground sets , and two identical partitions thereof, with . The product partition is and constitutes a partition of the set . Let . Since , we have . Furthermore, since , we have . Hence, the entropy of the product partition is
Step 2. The probability which extremizes has derivative zero, i.e.,
Step 3. By Postulate 4, for independent , . Hence,
We note here that independence of implies independence of all other pairs. Specifically, we have
Step 4. The functional Equation (A4) should be valid for any in [0, 1]. Consequently, a solution to this equation will also be a solution to equation
The latter is obtained by taking a very small in (A4), so that we can omit all but the lowest-order polynomial terms, and it is easier to handle. By setting , , we get the linearly homogeneous functional equation
whose solution is
where is any real number. Pathological discontinuous solutions of the equation are excluded by virtue of Postulate 1. By inverting the transformation, we get
From Postulate 2, we have , so that , and finally
Step 5. We verify that the thus determined satisfies the original functional equation in step 3. We have
which validates the solution.
Step 6. By virtue of Theorem 1, the entropy of is
Since (by Postulate 1) , we must set . We check whether the extremum is a maximum or a minimum. The second derivative is , which means that we have a maximum.
Step 7. We consider two arbitrary partitions with elements, respectively, and we will show that the uniquely defined function for bipartitions satisfies Postulate 4 for any . Specifically, we will show that entropy maximization with this results in independent partitions. If then
The total entropy is
The functional that maximizes with constrained probabilities as above and Lagrange multipliers is
and has derivatives
Hence,
Setting
we find that
which means that the partitions are independent. It is easy to see that the constraints are satisfied with these values of and hence the values set for are the correct ones.
Step 8. The constant can be any positive real, but by convention (and for convenience) we set . This completes the proof of Theorem 2.
Appendix A.2. Derivations for Planck’s Law for Blackbody Radiation
In maximizing in Equation (36) with constraints (37), the Lagrangian is
where and are Lagrange multipliers. Taking the derivative with respect to and equating it to 0, we find
which, after taking the probability constraint into account, yields
This is the geometric distribution, which can be reparametrized by its mean in its standard form (see [2,3]; their Table 2.4):
On the other hand,
from which is determined as
The entropy of the geometric distribution is (see [2,3], their Table 2.4)
Taking the derivative with respect to we find
Solving for we find
Upon substitution of and in the expressions of and , we obtain, respectively, Equations (38) and (39). By taking the derivative of in Equation (A28) with respect to , we find
Because is negative, the radiative entropy decreases with the increase in frequency . That is, photons with higher frequency are associated with lower entropy than those with lower frequency. On the other hand, since (Equation (A28)), the radiative entropy is an increasing function of energy. Finally, the derivative of with respect to is
and so the radiative entropy is an increasing function of temperature.
Equation (A28) gives the energy without reference to time. To convert it to power (energy per unit time), we should involve the frequency and get the quantity . To convert it to power per unit area, we move from the notion of a single emitting molecule to the notion of a surface of a solid or liquid with very many (Avogadro-scale) emitters. By elementary dimensional analysis involving the speed of light in vacuum , in addition to the frequency , as influencing the phenomenon, we observe that the quantity gives the required units of inverse area. The typical conceptual explanation for is that it represents the number of “modes” that exist in a given space in a standing wave vibrating at frequency ν. Therefore, we need to use the quantity . However, in what we call blackbody radiation, the emission does not occur at a specific frequency but at all frequencies. Therefore, we need to define a quantity of power per unit frequency (dividing by ) and per solid angle (measured in steradians—sr—which in fact is dimensionless, surface area divided by radius squared).
From these considerations and utilizing Equation (A28), we conclude that the so-called spectral radiance (in units W s m−2 sr−1) is given by the first expression in Equation (40) known as Planck’s Radiation Law. In this, the multiplying factor 2 could not be found by dimensional analysis, but from measurement. The typical conceptual explanation for it is that there are two different polarizations of light as a transverse wave. Specifically, there are two spatial dimensions perpendicular to the direction of travel, which define two independent (orthogonal) states of polarization, horizontal and vertical (any other polarization is just a combination of these two primary states). We note, though, that Equation (A28) does not contain angle units and therefore, assuming that the total angle of emission over a surface is (for a half-spherical geometry), the actual equivalence is or , which implies a factor of instead of 2, when we convert the energy of an emitter to the power per unit area, unit frequency, and unit angle.
Assuming that the emission is from a sphere (a star or a planet) of radius and that we observe it from a point at a distance from the center of the sphere, the received radiation or irradiance (in units of W−1 m−2 s) is
At the surface of the sphere the irradiance is called the spectral radiant exitance and is
We note that, despite the angle being 2π, we multiply by as a result of decreasing weight for more distant emitters. (The result is accurate, but we omit the proof.) At a large distance, the quantity equals the solid angle , and thus,
It is common to use the loose term spectral intensity to describe any of the quantities . We can also convert the spectral intensity using the wavelength instead of the frequency , where
Since
we obtain the second expression listed in Equation (40). Likewise, we may convert and to expressions involving .
All the above functions represent bell-shaped curves with a maximum intensity. To find the position of the maximum, we take the derivative of and equate it to zero. This results in
which has a closed solution for λ:
where W(·) is the Lambert W function. This result, here derived analytically with a closed solution (rather than numerically as is typical in the literature), is known as Wien’s Displacement Law.
Appendix A.3. Atmospheric Radiative Cooling as an Emergence of Le Chatelier’s Principle
A common account in the climate literature is that radiative processes associated with the “greenhouse effect” set the tropospheric lapse rate. The alternative developed here is that the lapse rate is fixed by convective thermodynamics, while radiation adjusts to it. The different line of reasoning proposed here is summarized in the schematic of Figure 11. The emission of LW radiation by the atmosphere is highly adaptive and is therefore regarded here as emergent from Le Chatelier’s principle, while the lapse rate is dictated by atmospheric thermodynamics. In the present case, the dynamic balance to which the principle refers is not the molecular (thermal or chemical) equilibrium (the first link of the chain of Figure 11) but a combined balance that incorporates both microscopic (molecular) and macroscopic (convective) motion, modulated by gravity.
Here we provide additional support to the argument that the lapse rate does not emerge as a result of the ARE. The high adaptivity of ARE and hence its role as the agent materializing Le Chatelier’s principle is evident from Equation (43). An elementary relative increase in temperature, , produces a fourfold greater relative increase in the LW radiation () if the emissivity is constant.
However, while the emissivity of Earth’s surface is almost constant and close to 1 (typically between 0.95 and 0.97), the bulk atmospheric emissivity is not a physical constant. Rather, it increases with rising temperature for several reasons, thereby enhancing the adaptivity still further. One such reason is the spectral shift, described by Wien’s displacement law (Equation (A37)). As temperature increases, decreases and the spectrum shifts toward smaller wavelengths. As illustrated in Figure 9 of the main text, this shift brings a larger portion of the spectrum into the region where water vapor is strongly radiatively active, thereby increasing the effective emissivity. Yet at lower temperatures (high altitudes), it is the carbon dioxide that becomes more active, as the emission band is centered at its thermal emission peak (14–15 μm). Still, the relationship of emissivity with temperature is dominated by the presence of water.
Another reason originates from the geometric distribution of the probability that a photon of frequency is emitted. According to Equation (38) (setting ), this equals , which entails that the probability increases with increasing temperature. Also, at higher temperatures, molecules have high kinetic energy, and collisions are more frequent. A large percentage of molecules are constantly bumped into excited states, giving a higher emissivity at higher temperatures.
An additional reason is related to the fact that the saturation water vapor pressure increases almost exponentially with temperature. For the same relative humidity, the concentration of water molecules tends to be higher at higher temperatures. As water is the strongest RAG, this results in higher bulk emissivity.
This should be combined with another factor which is not directly related to temperature, but it becomes relevant in the presence of a positive lapse rate: the rise in temperature goes together with the rise in pressure. At higher pressure, collisions are more frequent, again resulting in higher bulk emissivity at higher temperatures.
As a combined result of all these factors, in the standard atmosphere the atmospheric emissivity drops from over ~0.80 near the ground to ~0.10 near TOA, while at the same time the temperature drops from an average of 288 K near the ground to less than 230 K at the tropopause.
As a conclusion of all the above analyses, changes in LW radiation required to satisfy changes in the radiation balance can be effectively taken up by much smaller changes in temperature, without producing changes in the lapse rate. To illustrate this fact, we study the monthly changes in radiation, temperature, and lapse rate at north midlatitudes (30–60° N) for the year 2024. The radiation data, both SW and LW at TOA, were taken from NASA’s ongoing satellite project, Clouds and the Earth’s Radiant Energy System (CERES) [62,63], were retrieved from the CERES site for the Terra platform [64], and were spatially averaged over the midlatitude area. The temperature data were taken from ERA5 Reanalysis, were retrieved from the WRIT platform [45] for pressure levels ranging from 1000 to 10 hPa (altitudes 0 to ~31 km), and were again spatially averaged. For the same pressure levels, the ERA5 geopotential heights were also retrieved, which are practically equal to the altitudes (error < 0.5% for the examined altitudes). Finally, relative humidity data at the level of 850 hPa (altitude ~1.5 km) were used as described below.
The altitude vs. temperature relationships are plotted in Figure A1 for four months, with January and July being the coldest and hottest, respectively. It is seen that the lapse rate, depicted as the slope of each plot, is fairly constant for altitudes <10 km and does not vary substantially through the months, despite the enormous changes in radiation. Indeed, radiation is marked by huge imbalances, noted in the figure caption; the outgoing minus incoming total radiation for the four months varies from +118.5 W/m2 (January) to −76.7 W/m2 (July), and this range is even higher when all 12 months are considered.
Figure A1.
ERA5 temperature vs. altitude, spatially integrated over midlatitudes (30–60° N) for the indicated months of 2024. The monthly average profiles are compared to the isothermal profiles with the column-average temperature as calculated from Equation (A38) and depicted with the same color as that of the empirical profiles. The radiation imbalance (outgoing minus incoming total radiation) for the four months in W/m2 is Jan +118.5, Apr −36.1, Jul −76.7, Oct +73.0.
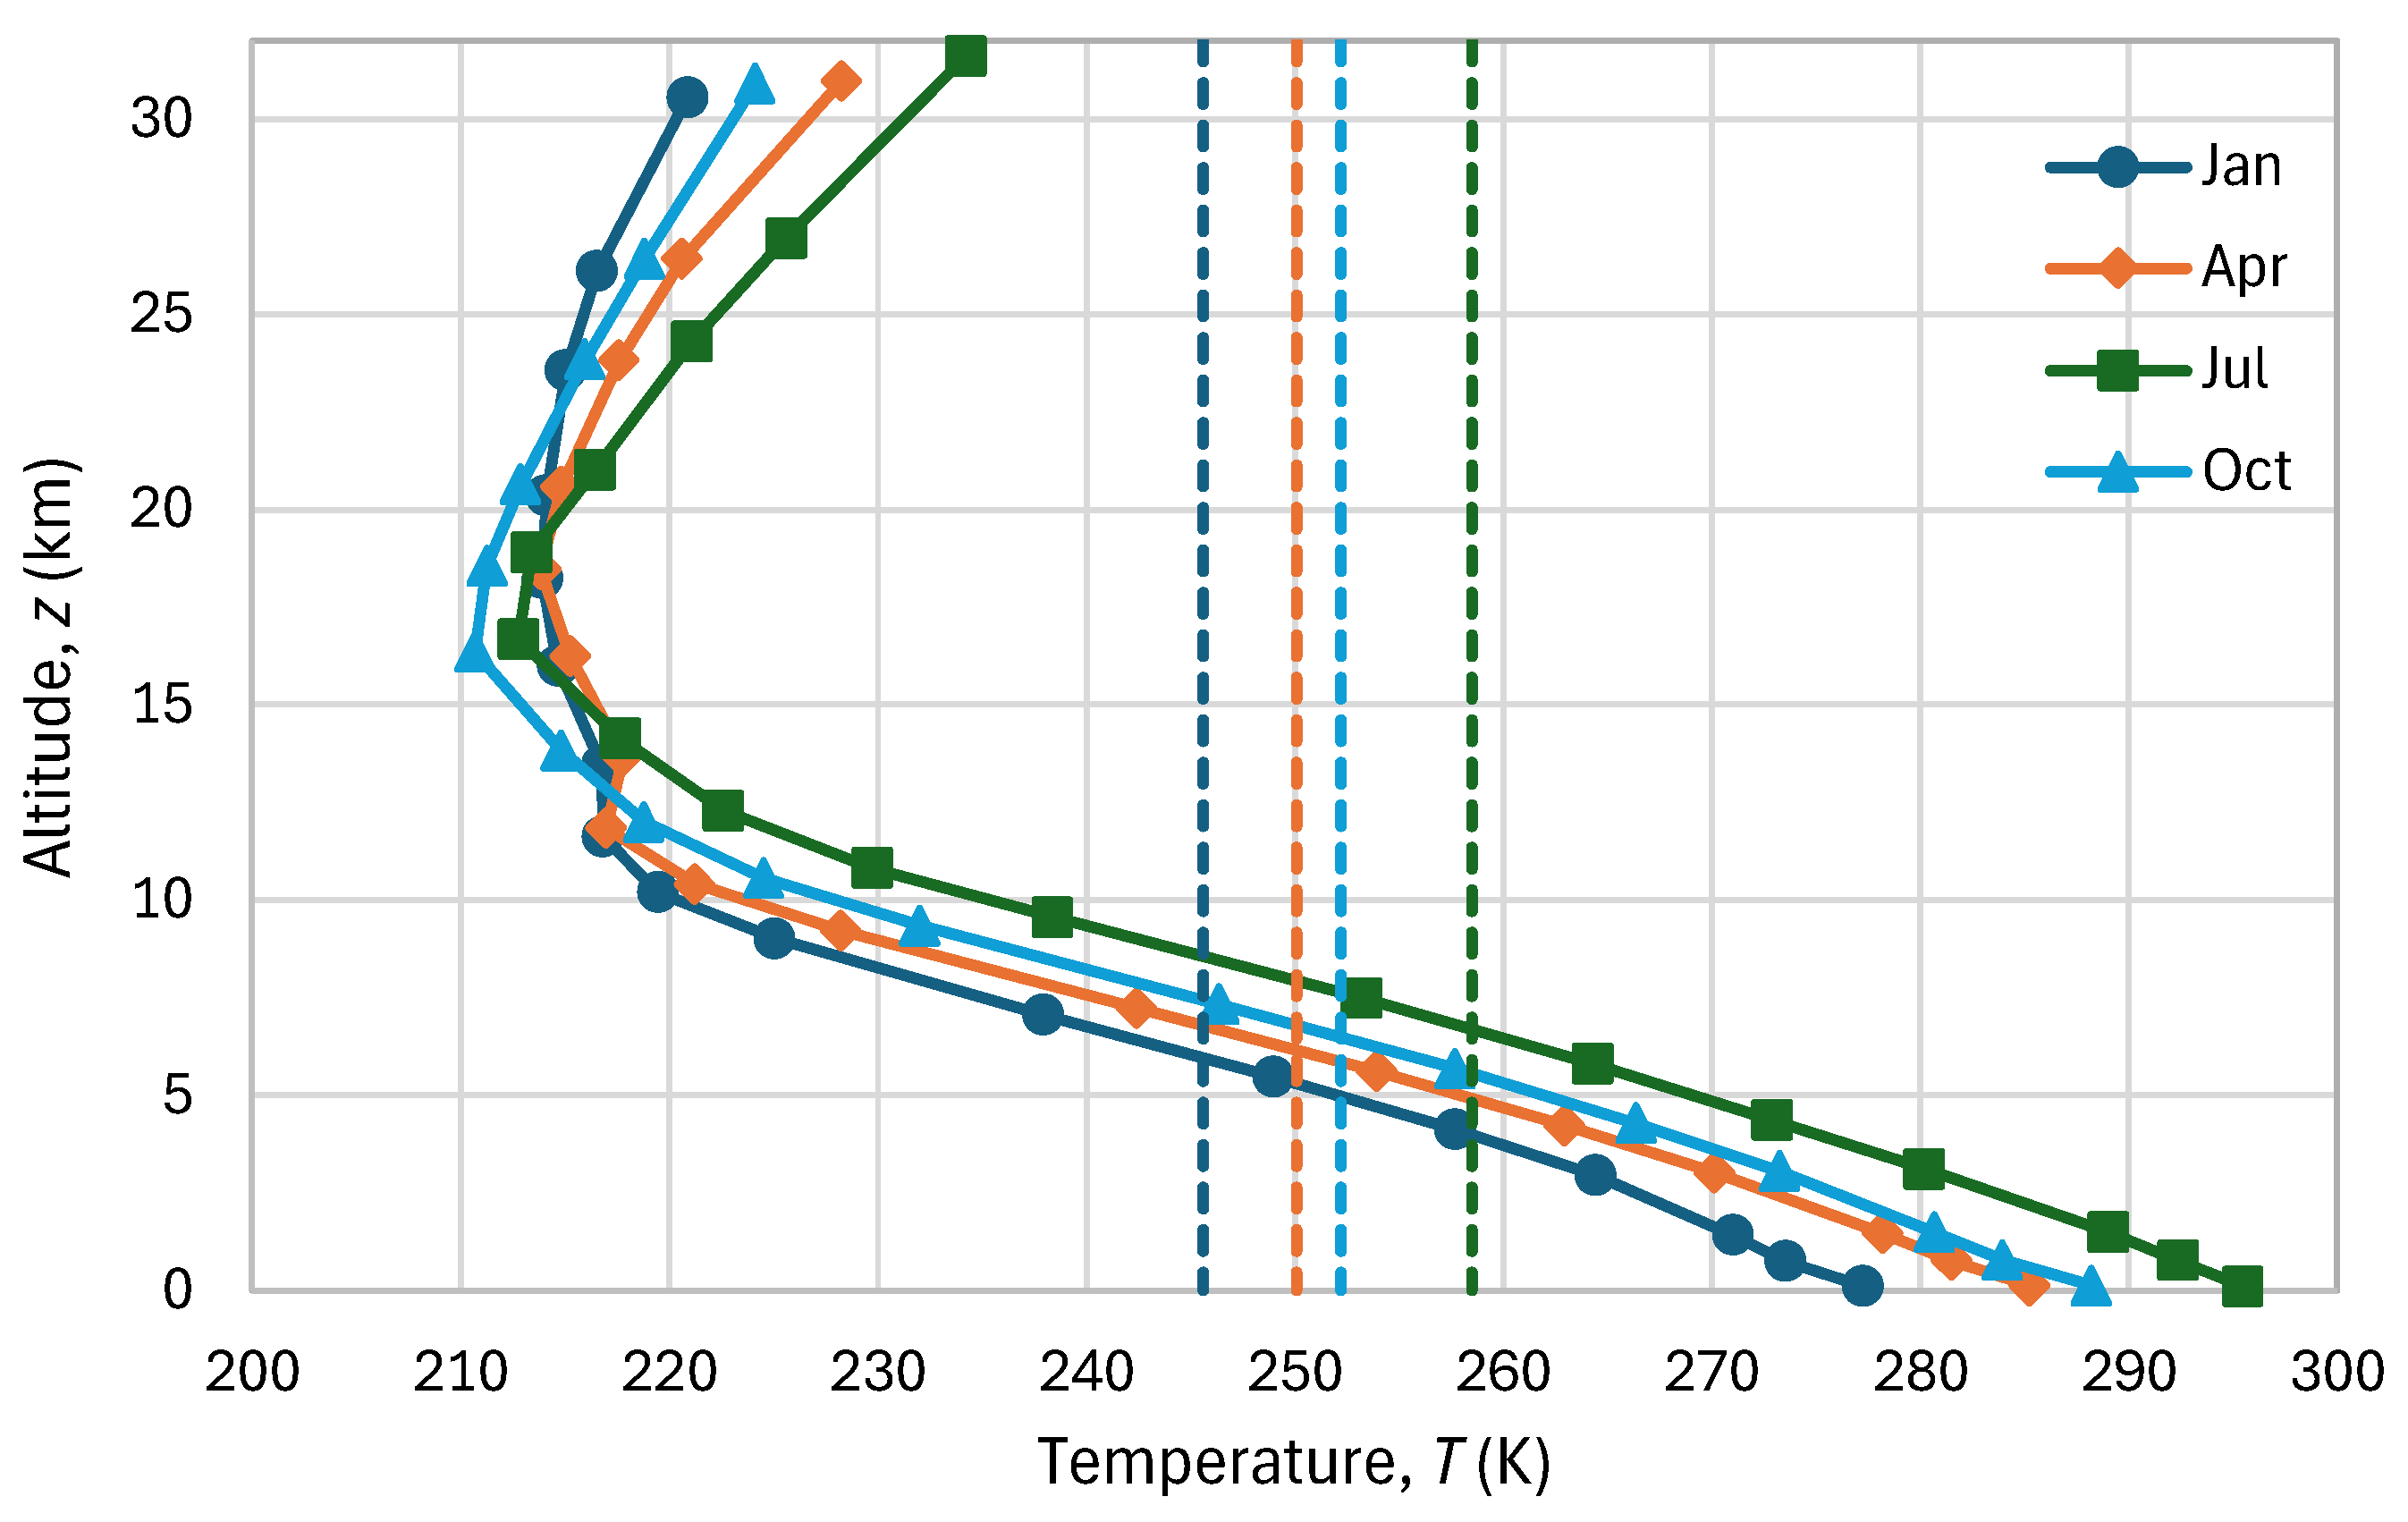
Figure A1 also shows the column-average temperatures calculated as [3]
where is the temperature at pressure level , and and are, respectively, the pressures at the bottom and the top level of the column considered (here taken as 1000 hPa and 10 hPa, respectively). The column average temperature varies from 245.6 K (January) to 258.5 K (July), while the temperature near the surface (for 1000 hPa) varies from 277.2 K (January) to 295.5 K (July).
The lapse rates, calculated by linear regression on altitudes <10 km for all months, are slowly varying with a ratio max/min = 1.07, as shown in Figure A2. Figure A2 also shows the monthly variation in temperature near the surface (at 1000 hPa) and radiation at TOA, both net SW (incoming minus outgoing) and LW (outgoing). The ratios max/min for all variables are also shown in the figure legend, and it is seen that radiation has much higher variation than lapse rate, particularly the SW one.
Figure A2.
Monthly variation in radiation fluxes at TOA according to CERES data, and temperature at 1000 hPa and lapse rate according to ERA5 reanalysis data. All data are spatially integrated over midlatitudes (30–60° N) for the months of 2024.
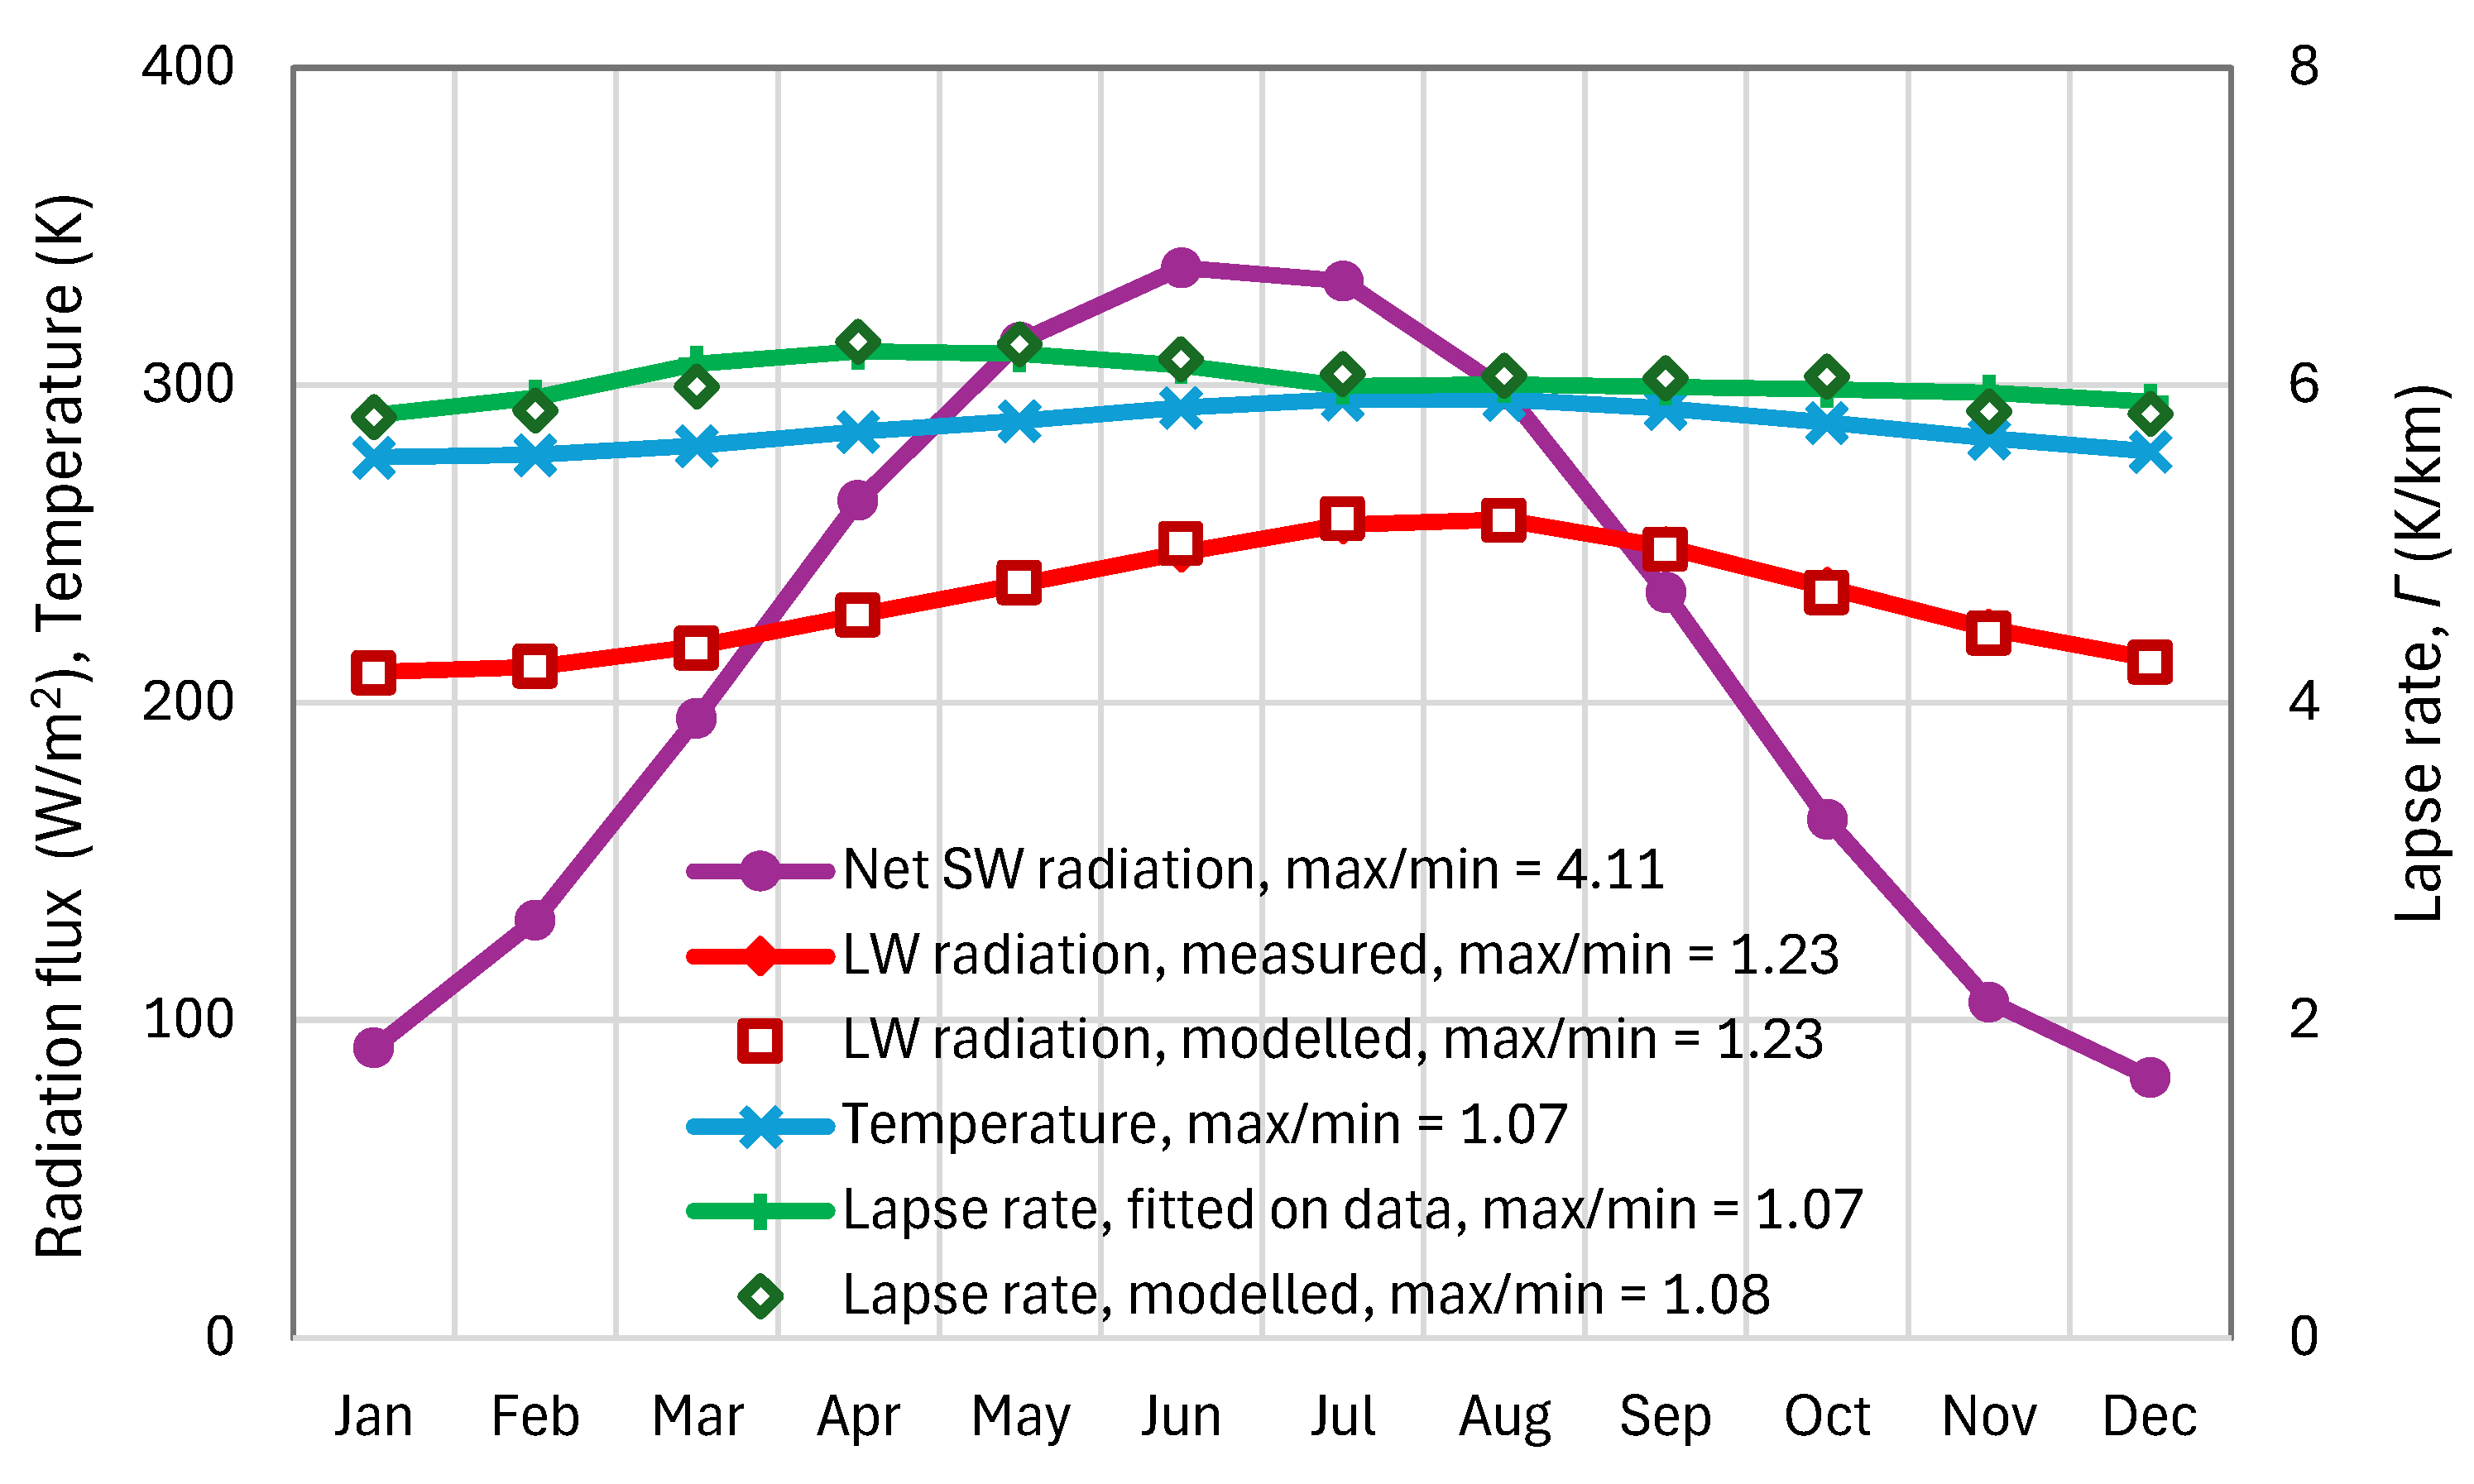
The relative stability of the lapse rate clearly indicates the thermodynamic, rather than radiative, origin of the nearly constant lapse rate, as the radiation intensities are highly variable. This is supported by the observation in Figure A2 that the slight variation in the lapse rate is not in phase with either SW or LW radiation, nor with temperature. The hypothesis is that this slight variation could be related to the relative humidity, as a proxy of the probability that at a certain location the atmosphere reaches saturation; hence, the moist lapse rate dominates over the dry one.
We quantify this assumption by the simple macroscopic relationship in linear form:
where K/km is the dry lapse rate, is the relative humidity at the level of 850 hPa, expressed as a fraction between 0 and 1, and is a parameter to be fitted. It is readily seen that for , Equation (A39) yields , as expected for dry air. From the available monthly data, maximization of the explained variance, EV, of the model in Equation (A39) results in K/km and EV = 57%—a satisfactory explanatory power for the variation in the lapse rate. The good agreement of the thus modeled with the empirical values is also evident in Figure A2. A caution should be issued, though, that the validity of the model and the estimated parameter are limited to the examined area (midlatitudes) and period (2024), and it would not be appropriate to consider it as a more general macroscopic law.
It is notable that the very high variability of the net SW radiation (max/min = 4.11) does not influence the lapse rate at all. The variability of LW radiation at TOA is lower but also considerable (max/min = 1.23), and much higher than that of the lapse rate (max/min = 1.07). The variation in the LW radiation follows the pattern seen in the net SW radiation with a time lag of 2 months. Actually, the monthly average LW radiation at TOA, , can be accurately predicted by temperature through the model:
which gives as the sum of two terms: the surface LW radiation that is transmitted to space and a bulk quantity of radiation emitted by an upper layer of the atmosphere (for further explanation see also Appendix A.4 and in particular Figure A4). In Equation (A40), and are characteristic temperatures at the surface and an atmospheric layer, respectively, and are the corresponding values of the blackbody radiation, is the surface emissivity and is a bulk emissivity of the considered atmospheric layer. Specifically, we take as the temperature at 1000 hPa and as the column-average temperature from the level of 400 hPa and higher. Furthermore we take and estimate from the available monthly data, by maximizing the explained variance, EV, of the model in Equation (A40). This results in and EV = 99.5%. The very high EV signifies an impressively high level of explanatory power for the variability of the LW radiation at the TOA for this very simple model with only one parameter, despite its simplicity and the constancy of the emissivity .
Furthermore, it is clear from the plots of Figure A2 that radiative equilibrium never appears and that both the surface and the atmosphere have warming and cooling periods. Taken on an annual basis, again the radiative equilibrium does not close, as the annual average incoming SW radiation is 310 W/m2, while the sum of the annual average outgoing SW and LW radiation is 330 W/m2, 20 W/m2 higher. To close the balance, we should take the quantities over the entire Earth rather than the midlatitudes alone.
The key findings of these analyses are as follows:
- The SW radiation is highly variable through the year in midlatitudes.
- The LW radiation changes following a similar pattern to that of the SW radiation, but with a lag of 2 months and a significant attenuation of variation.
- The temperature variation fully explains and predicts the variation in the LW radiation.
- Despite considerable variation and imbalances in radiation, the lapse rate remains practically stable.
- The small changes in the lapse rate cannot be attributed to changes in any component related to radiation; rather, they can be explained by changes in relative humidity.
All the above points allow us to question the standard hypothesis that the lapse rate is driven by radiation, and to support the alternative hypothesis that it is thermodynamically determined. Further evidence in support of the alternative hypothesis is provided by Figure A3, which illustrates that the lapse rate is invariant with respect to changes in LW radiation. If the lapse rate were driven by radiation, then we would expect that the difference in LW radiation emitted at the surface, , from that outgoing at TOA, , would influence the lapse rate. This difference can be reliably estimated by
where is taken from the CERES dataset and the other variables are as described above. The difference varies substantially from 108.4 (January) to 154.5 (July) with max/min = 1.42. However, as shown in Figure A3, it has no effect on the lapse rate. It is therefore suggested that the role of LW radiation is to materialize Le Chatelier’s principle through the simple model of Equation (A40), while the lapse rate is thermodynamically driven.
Figure A3.
Illustration of invariance of lapse rate with respect to the difference between LW radiation emitted at the surface, , from that outgoing at TOA, . All data are spatially integrated over midlatitudes (30–60° N) for the months of 2024.
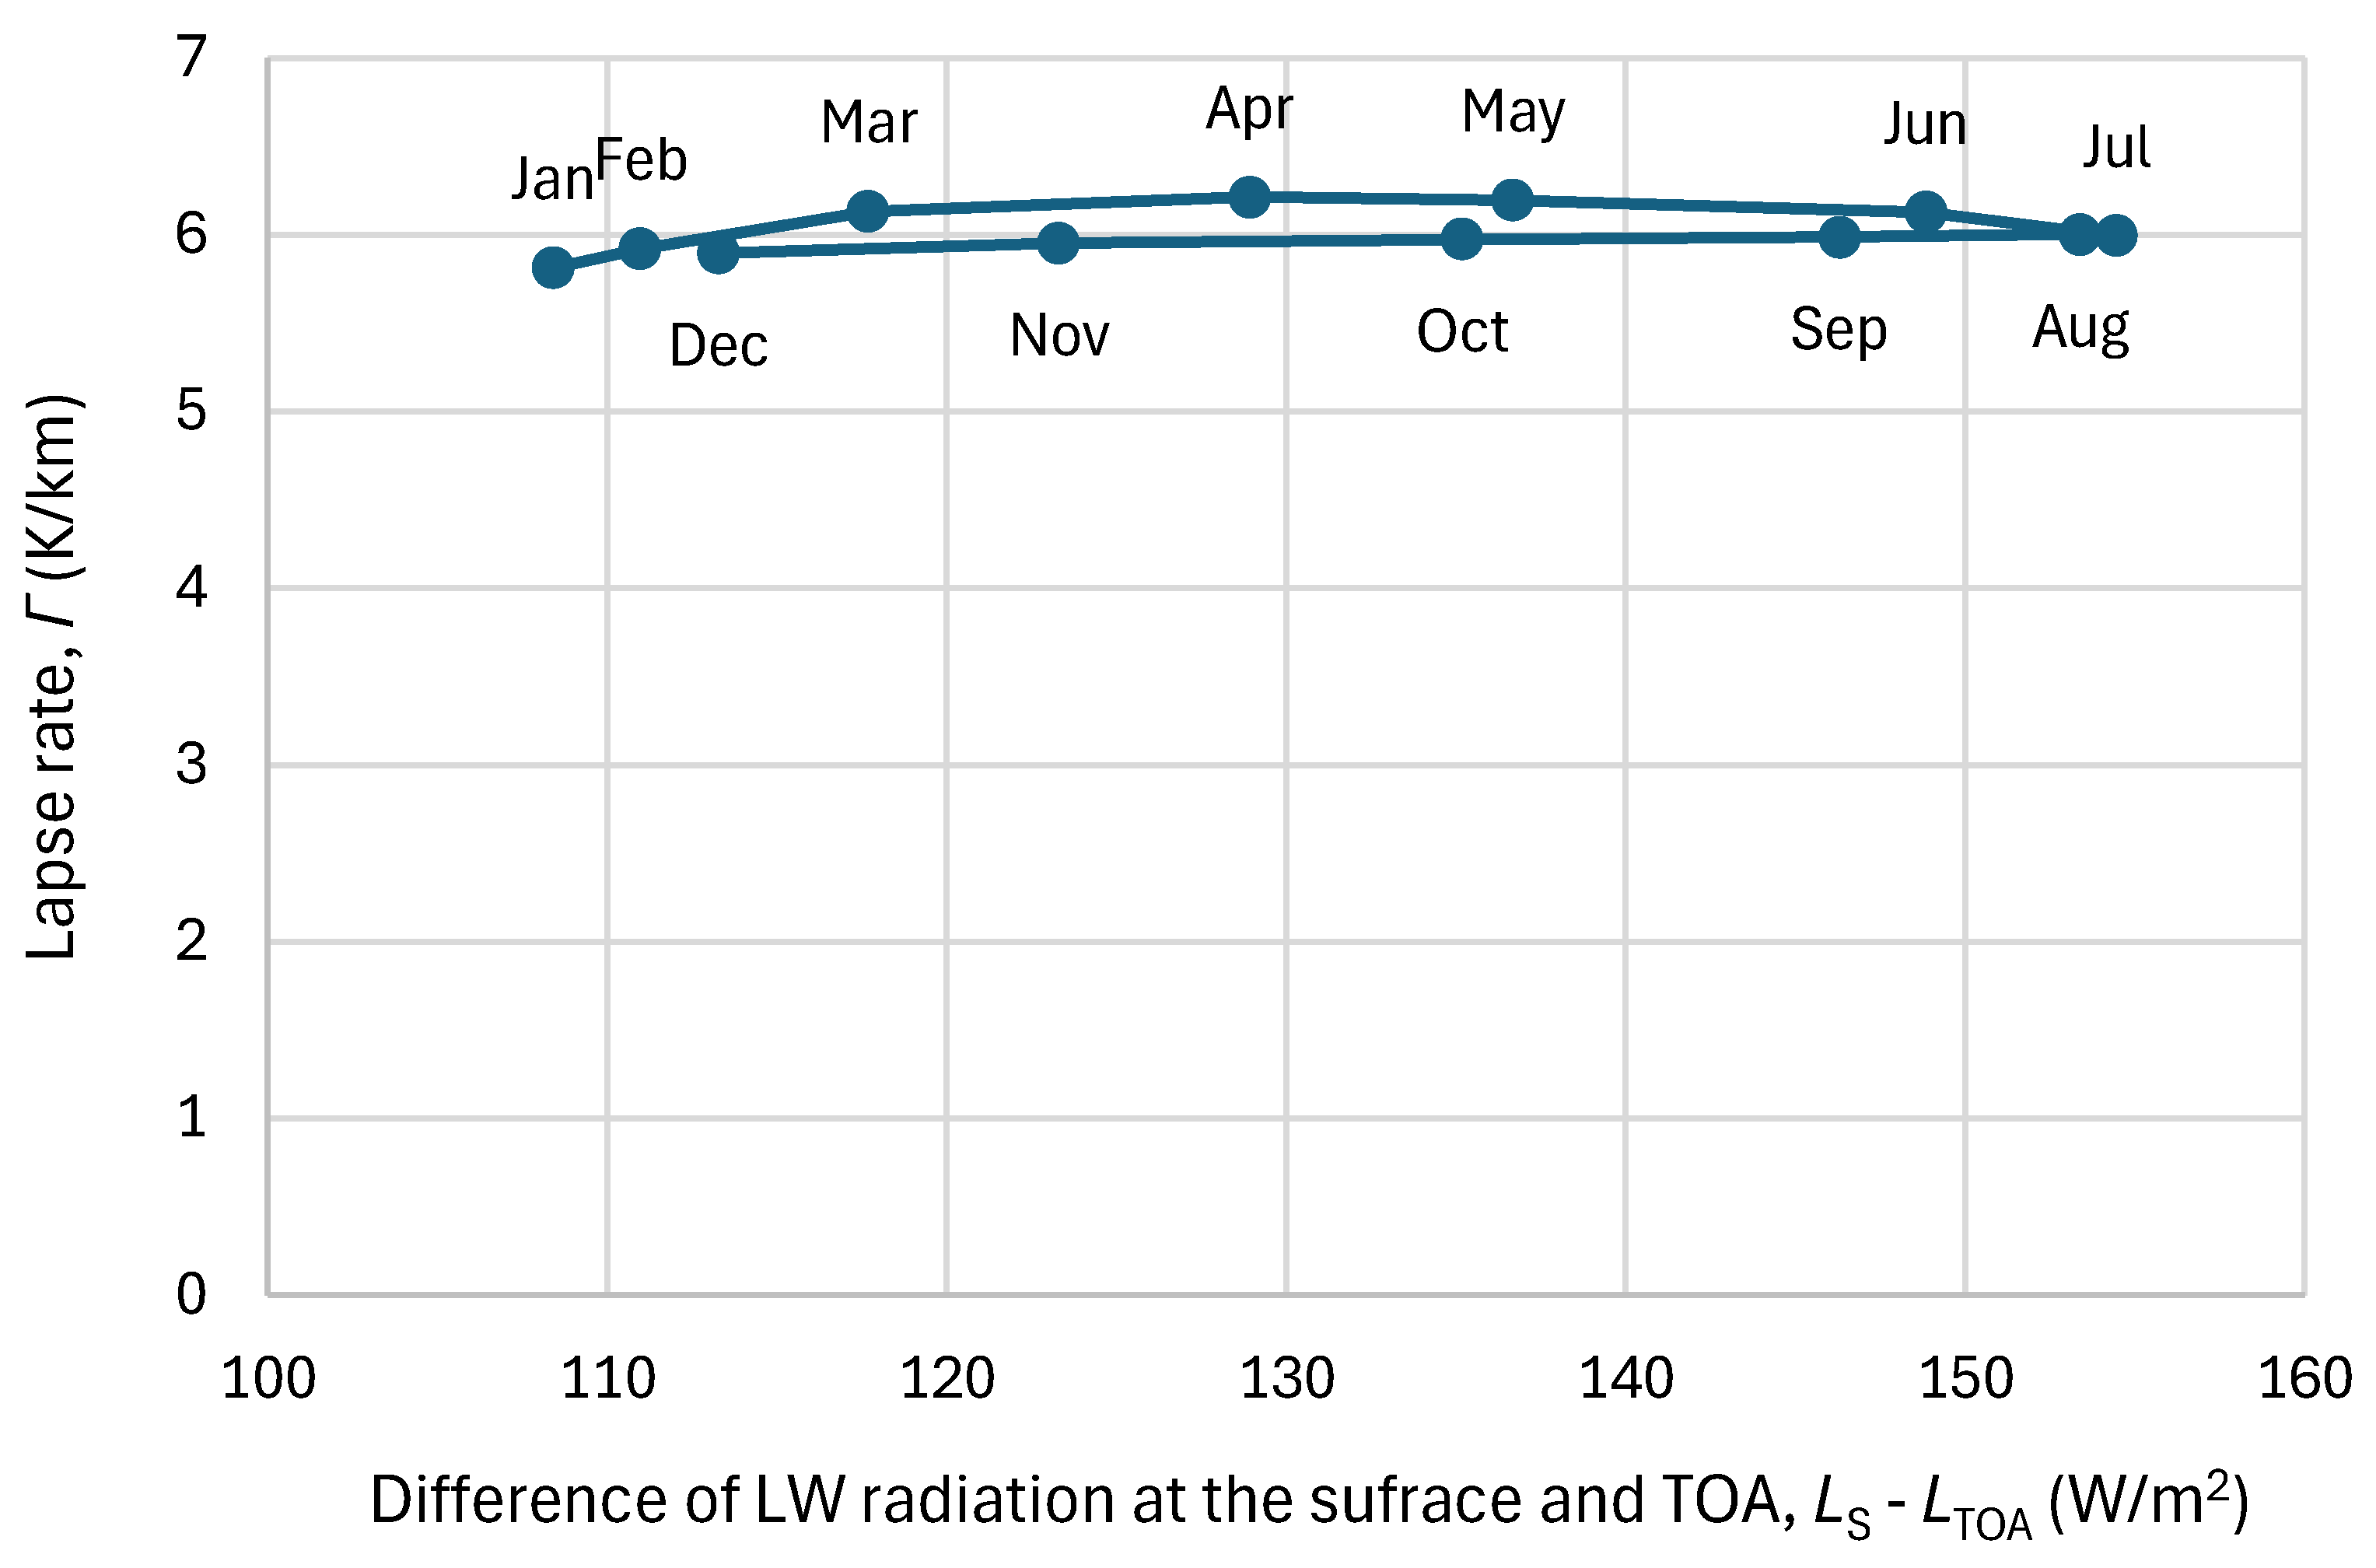
The proposed explanation of surface warming due to convection and the implied lapse rate extends beyond Earth, most notably to Venus, whose atmosphere is composed primarily of CO2 (at a mole fraction of about 97% [65]). The very high temperature of Venus’s surface, of more than 700 K, is usually attributed to the abundance of CO2. For instance, NASA’s Venus Facts site contains the statement: “The atmosphere is mostly carbon dioxide—the same gas driving the greenhouse effect on Venus and Earth” [66]. However the following facts are relevant (a) Venus has a troposphere extending to an altitude of 60 km; (b) it has a dry adiabatic lapse rate of 10.5 K/km [67]; (c) the actual lapse rate in the entire troposphere is very close to the dry adiabatic [65], which suggests an isentropic profile; (d) convection with cellular structures dominates in the atmosphere [68]; (e) relatively low temperatures of about 260 K (but higher than in the Earth) appear in the tropopause and much lower, of about 120 K (lower than in the Earth), appear in the mesopause [69]. Consequently, while the overall system is complex, the thermodynamically driven increase in temperature from the tropopause to the surface by 60 × 10.5 = 630 K fully explains the high surface temperature, leaving radiation again to play the role of an agent of Le Chatelier’s principle.
Appendix A.4. Plausibility That the Atmospheric Profile of Thermodynamic Equilibrium Is Also at Radiative Equilibrium
The RRTM model runs showed that an isothermal profile in the atmosphere (), which reflects thermodynamic equilibrium, is more or less in radiative equilibrium, too, and is therefore effectively stable as an equilibrium profile. Here we further investigate the plausibility of this result using simple calculations with an explanatory, rather than detailed modeling, aim. We assume an isothermal atmosphere with temperature , while the temperature at the surface could be different, . If our calculations show that satisfies radiative equilibrium, this would support the case for an atmospheric profile that is both radiatively and thermodynamically stable.
First, we note that, contrary to the standard case of a positive lapse rate (), an isothermal atmosphere would not feature condensation of water vapor because the saturation vapor pressure would be constant across altitudes. In contrast to the standard case, the mixing ratio of water vapor will increase with altitude because the molar mass of water is smaller than that of dry air. Hence, its density will decay more slowly with height, and its molecules will spread to higher altitudes more easily compared to dry air. On the other hand, carbon dioxide is heavier than dry air, leading to a steeper decay of density and greater concentration at low altitudes. Given that water vapor is the most powerful RAG in the atmosphere and would have higher concentrations at lower pressures, it is not unreasonable to assume a roughly constant ARE intensity across altitudes. Effectively, this means that the LW radiation emitted by the atmosphere will be
where is the blackbody radiation at temperature and is the emissivity of the atmosphere. The same quantity will be outgoing at the TOA and downwelling at the surface. On the other hand, the LW radiation emitted by Earth’s surface will be
with the symbols having the same meaning as above but with the subscript S denoting the Earth’s surface. Using Kirchhoff’s law (absorptivity = emissivity), we conclude that the atmosphere absorbs a fraction of , i.e., while the remainder will find its way to space, as seen in the schematic in Figure A4.
Figure A4.
Schematic of radiation fluxes in an isothermal atmosphere.
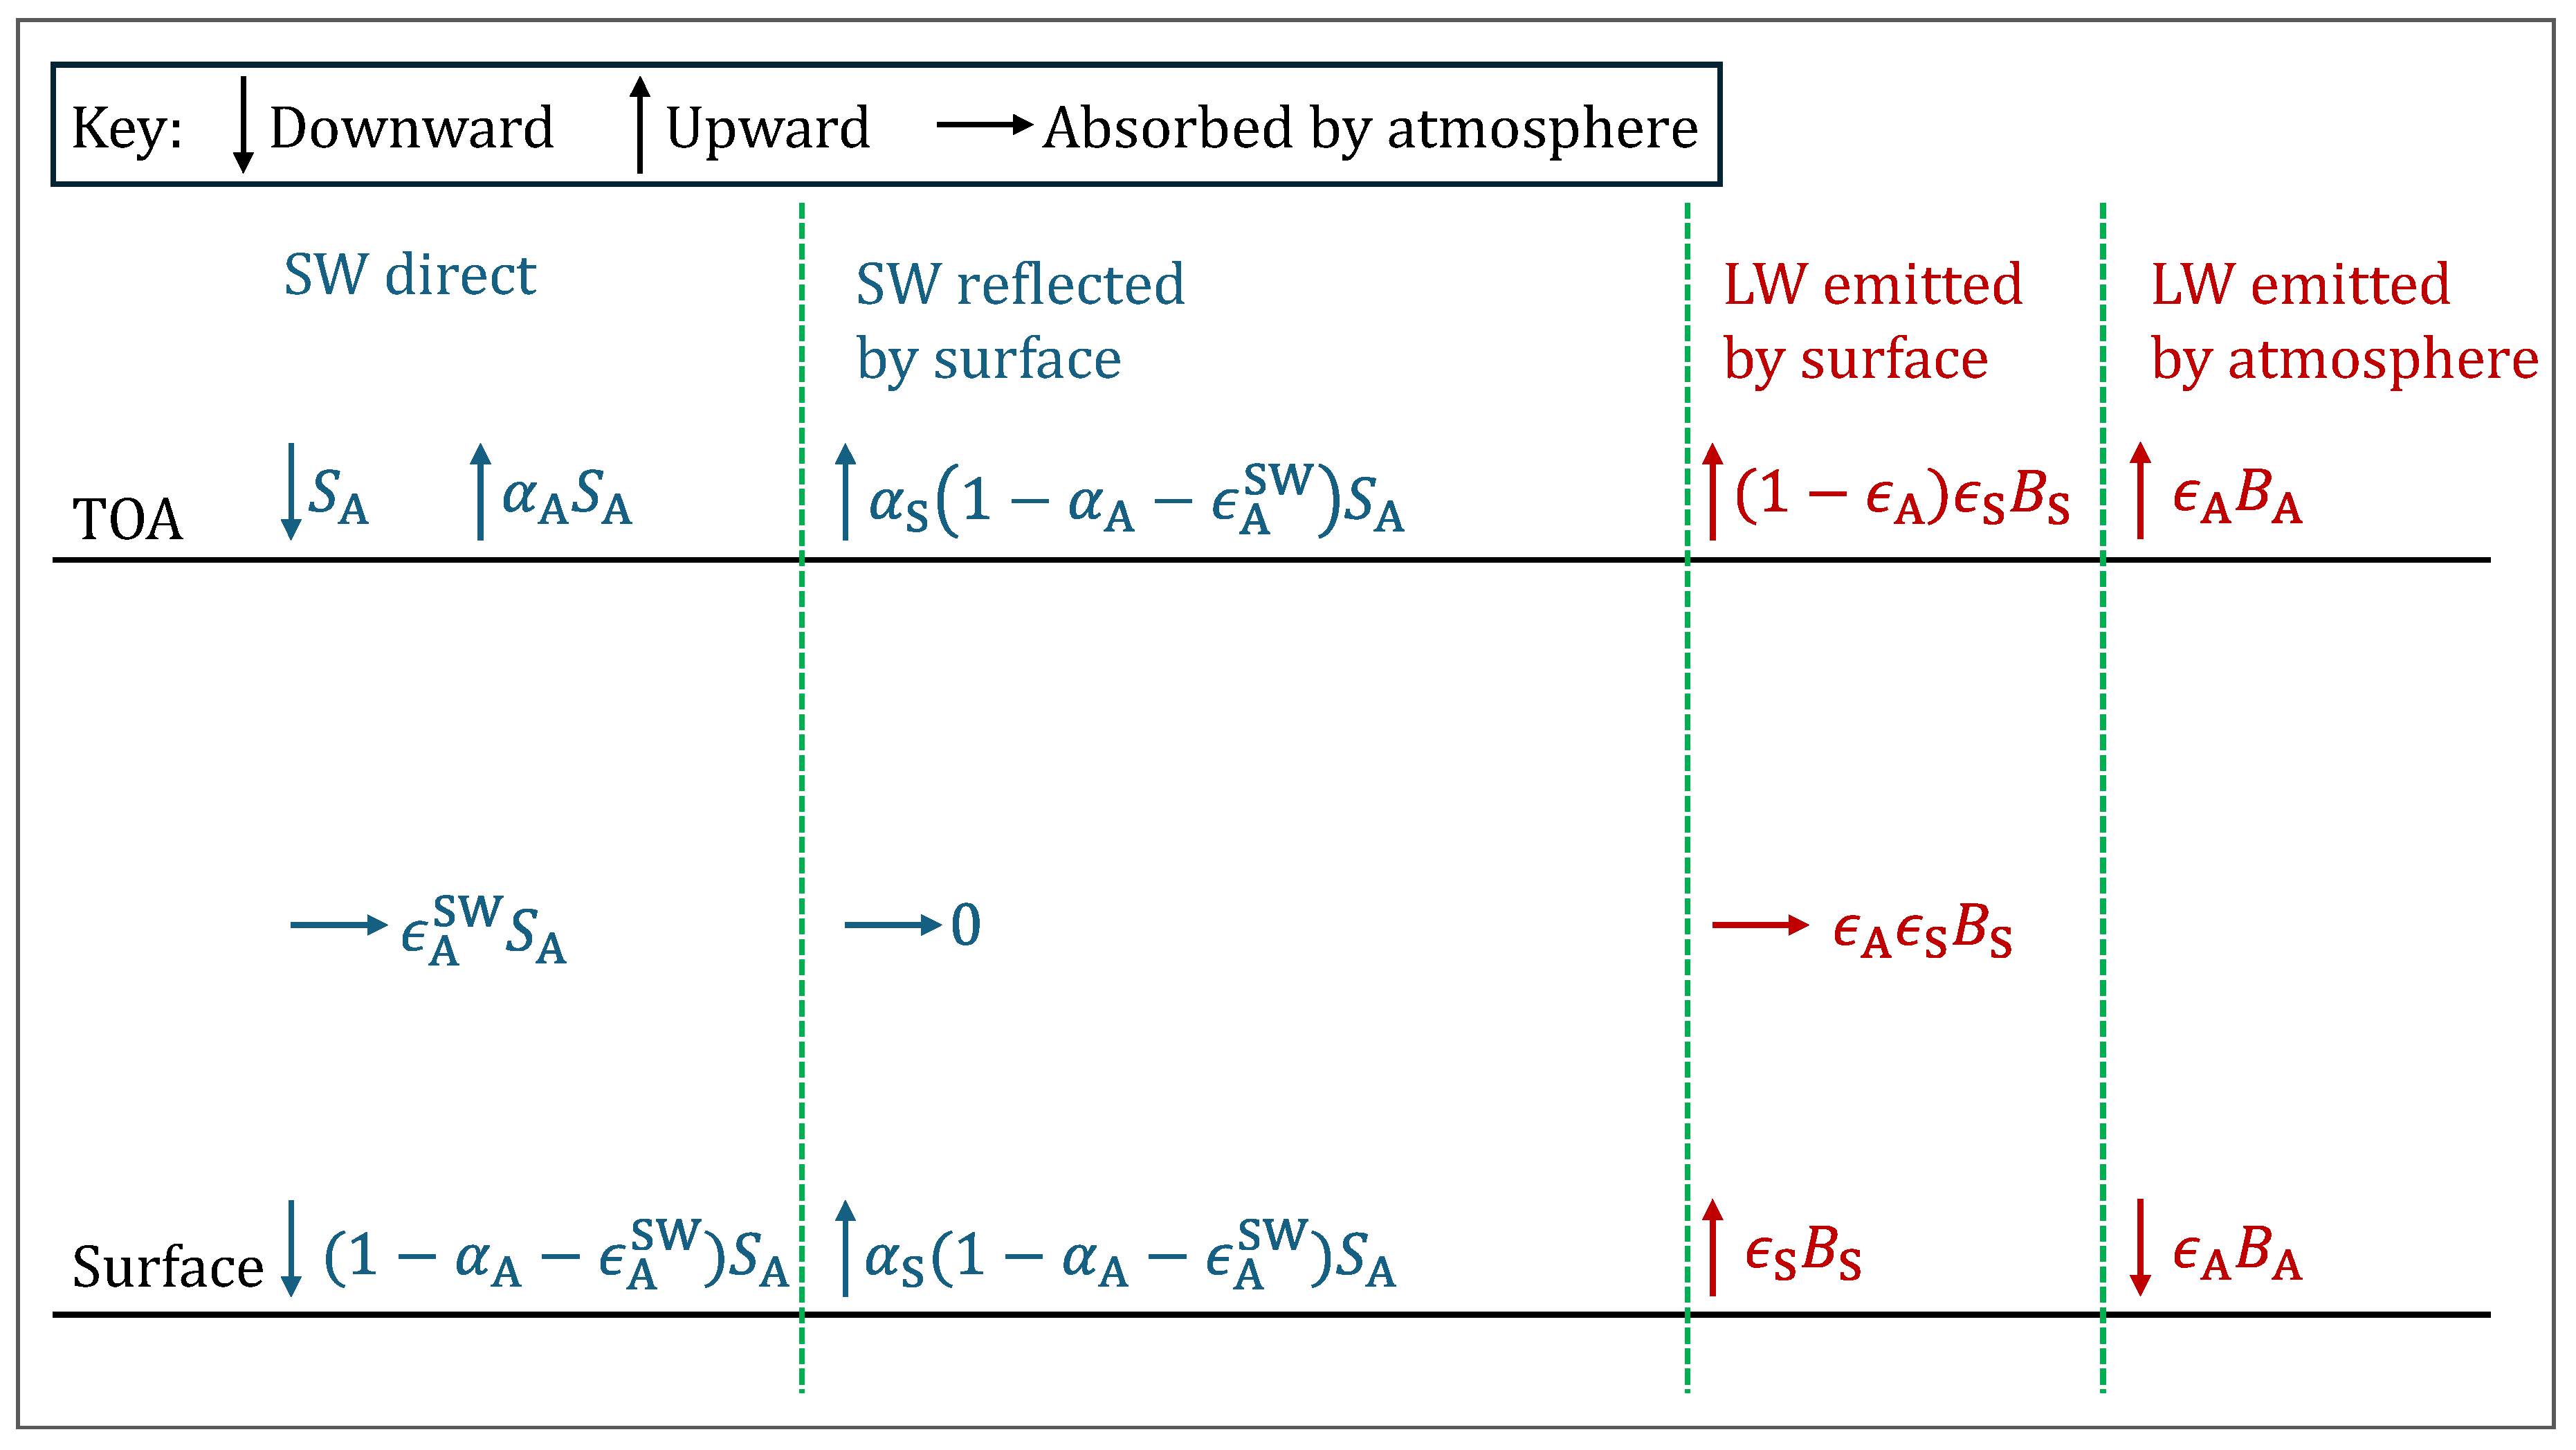
Let be the SW radiation entering TOA. A fraction equal to the albedo at the TOA, , will be scattered and reflected toward space. Denoting the absorptivity of the atmosphere for SW radiation as (which is not necessarily equal to because of the different frequency bands), a quantity will be absorbed by the atmosphere and the remainder will reach the ground. The quantity denotes the transmissivity of the atmosphere. It should be mentioned that this is not an accurate relationship for the SW radiation process, but the most typical approximation, in which reflection (more accurately, scattering) is not regarded as a local phenomenon at the TOA but one that occurs across all altitudes. According to this approximation, the absorption applies to the unattenuated incident intensity and is parallel to the propagation of an attenuated beam due to scattering.
Of the SW radiation reaching the ground, a fraction equal to the surface albedo, , will be reflected and will subsequently leave the TOA without further attenuation across its backpropagation towards space. The reason is that it no longer contains spectral components, which could further be absorbed on the way up, because in its long downward propagation through the atmosphere the absorption was completely saturated on the absorption bands. Thus the quantity will be reflected by the ground, the same quantity will escape to space, and the remainder will be absorbed by the surface.
Hence, the radiation equilibrium will be as follows:
- at the surface,
- at the TOA,
- and, at the atmospheric mass,
Solving the system of the two linear Equations (A44) and (A45), we find
It can be seen after some algebra that substitution of this solution into Equation (A46) satisfies the equality of the two sides.
From Equation (A47), we readily find the ratio of temperatures
To find a simplified solution, we set
where we note that this equation results in smaller emissivity/absorptivity to SW than to LW (, with the value 1 attained if there is no reflection, i.e., ). In this case, after some algebra, Equation (A48) simplifies to
and if we set , then we get a precisely isothermal and stable atmosphere. For realistic values of between 0.95 and 0.97, we find , i.e., very close to isothermality.
In this simplified solution, the albedos do not play any role, but more generally they do. Looking for realistic values of the albedos, we observe that an appropriate value for the surface is , as calculated in typical energy balance studies. For the atmosphere, we also set , close to the albedo inferred by CERES satellite observations for clear-sky conditions—because in an isothermal atmosphere we would not have clouds.
Realistic values of the bulk atmospheric emissivity are regarded to be in the range = 0.75 to 0.85. Using Brutsaert’s formula [70]:
where is the vapor pressure near the surface, assuming an average surface temperature 288 K and an average relative humidity of 50%, we find and . However, in an isothermal atmosphere, the average Earth’s temperature would be lower, 255 K, so that with 50% relative humidity, hPa and . But since the assumption and data on which Brutsaert’s formula was based were for a nearly standard atmosphere, we cannot be certain about the actual of an isothermal atmosphere. Therefore, instead of assuming a specific value, we present in Figure A5 the ratio as a function of .
Figure A5.
Ratio of atmospheric to surface temperature, for three cases described in the text, where in the gray-body case and in the low SW emissivity case .
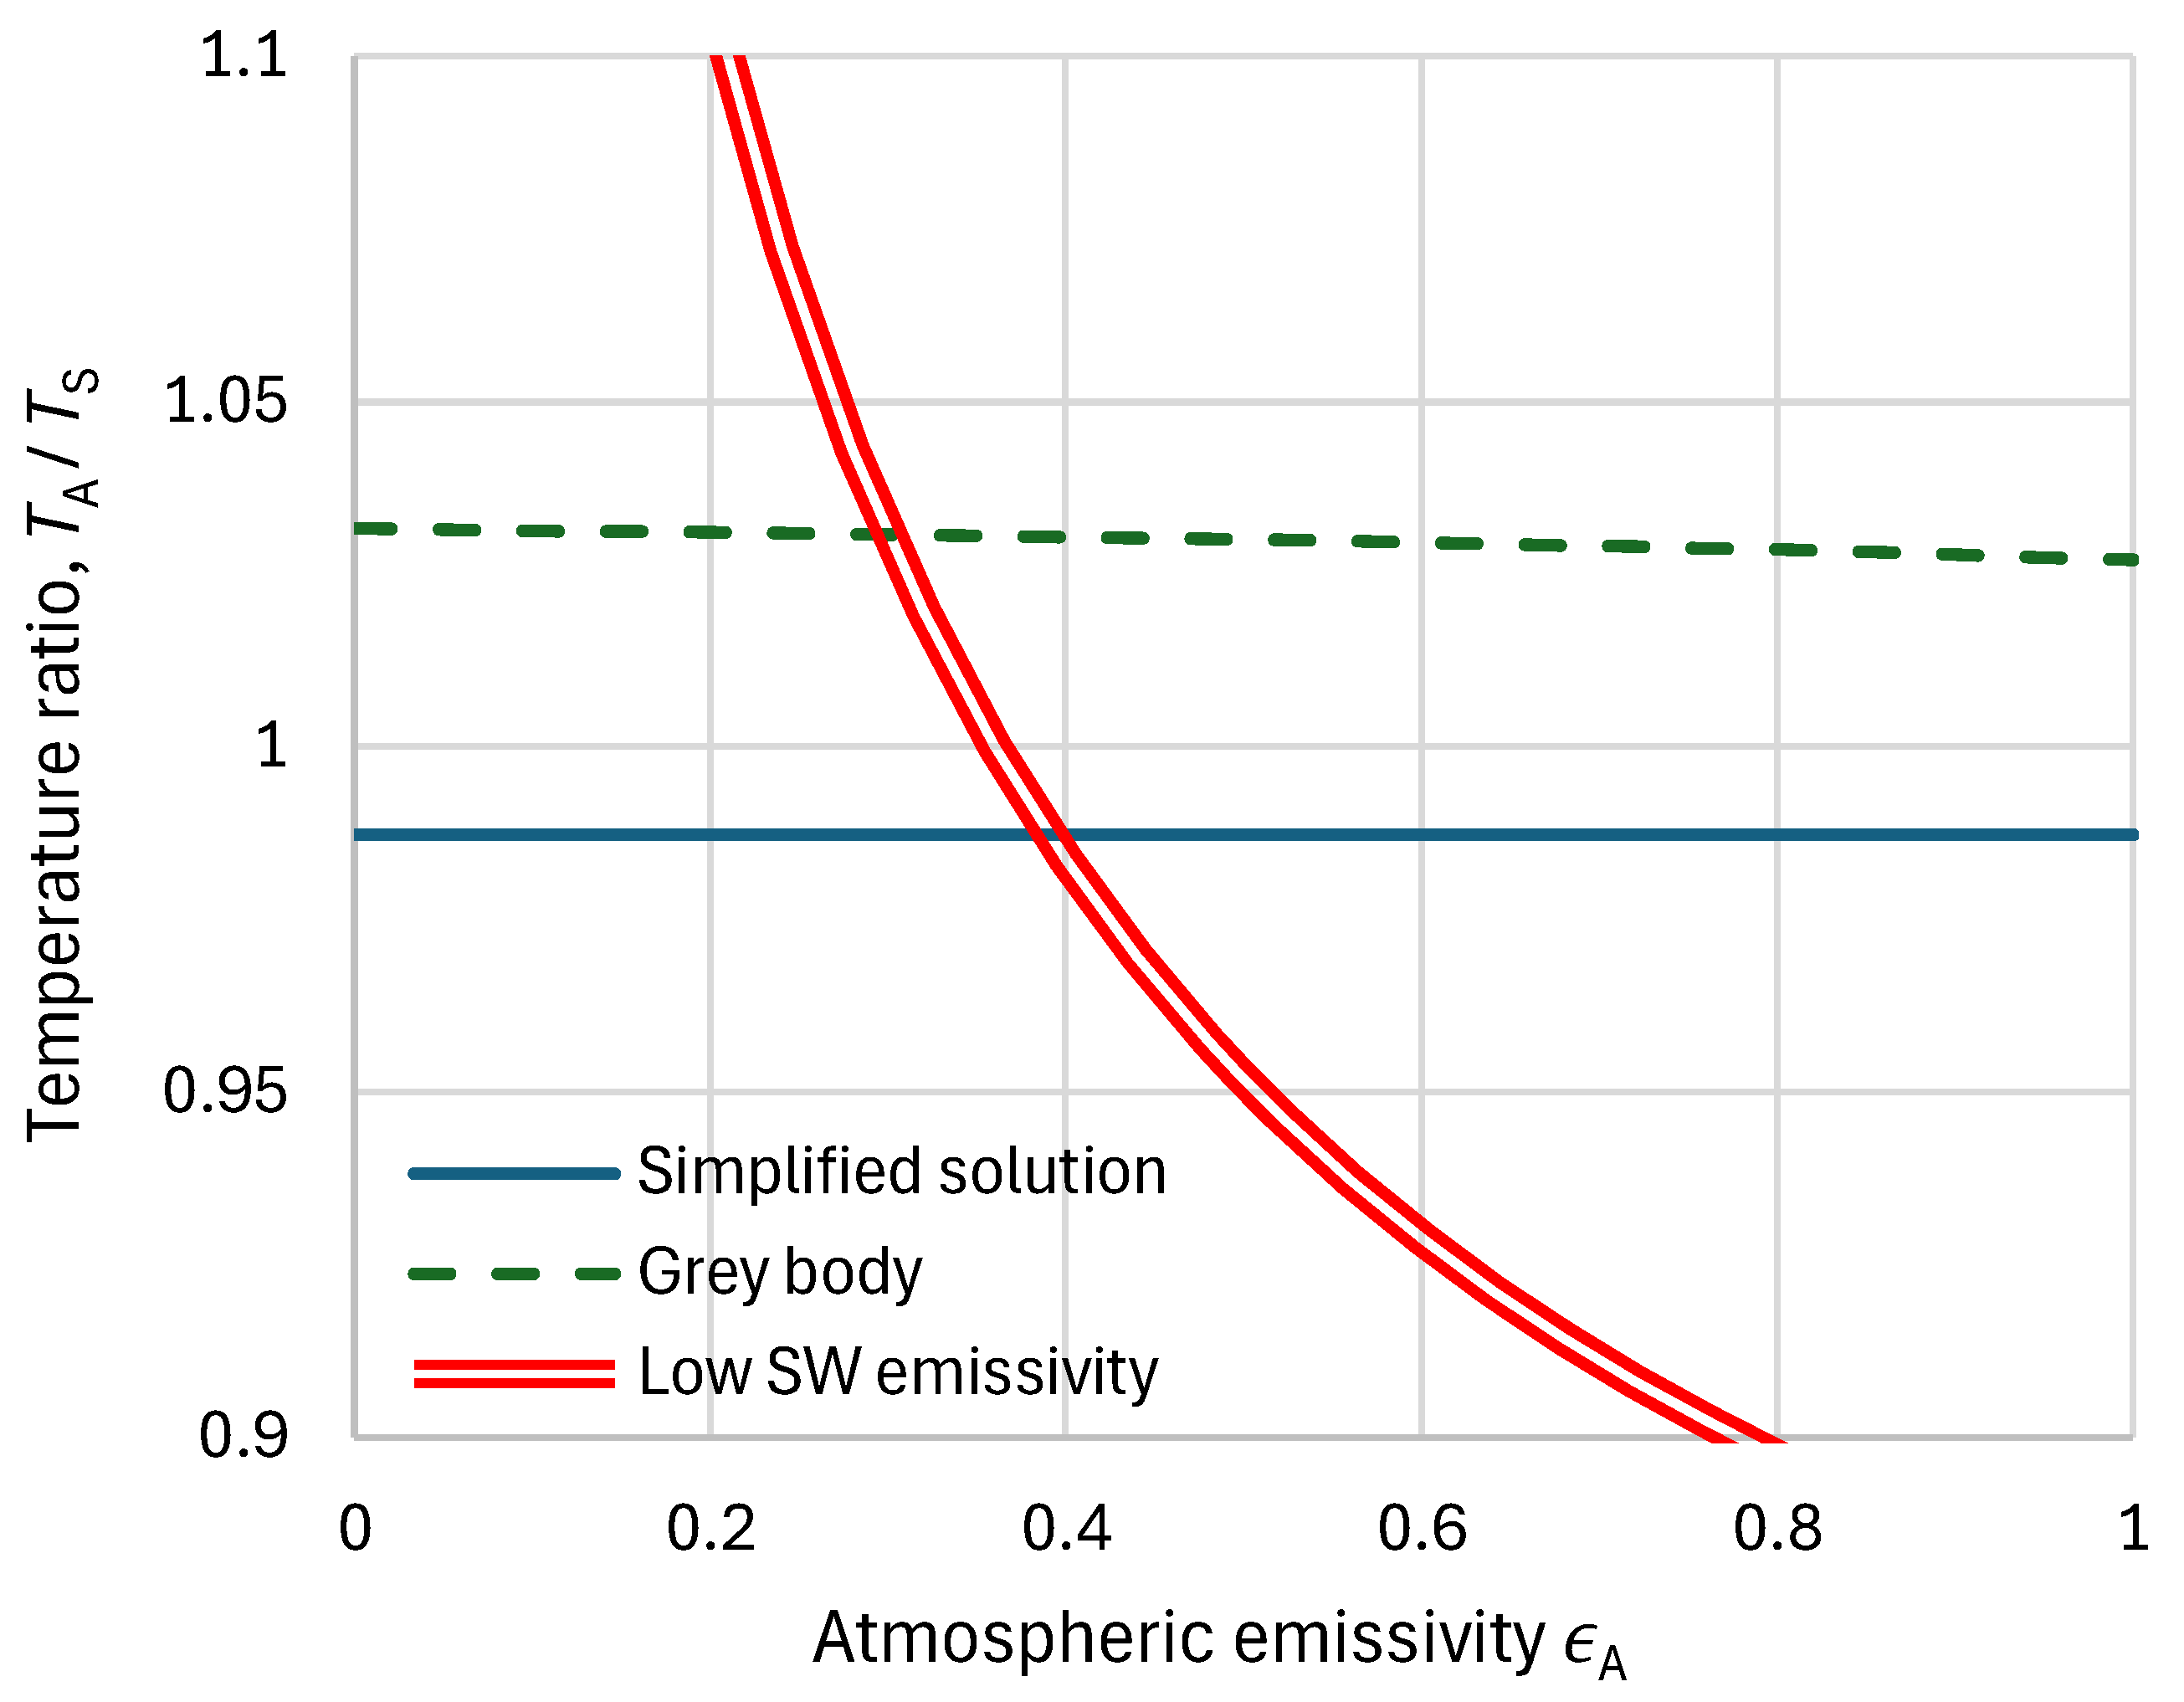
Here are some characteristic values assuming :
- Simplified solution: .
- Assuming an atmosphere behaving as a gray body with : (almost constant, practically independent of ).
- Assuming a non-gray-body atmosphere with and : .
- Assuming a non-gray-body atmosphere with and : .
These values are not far from isothermality. Deviations from the precise equality appear in both directions (both lower and higher values than 1), which means that the Earth’s surface could be warmer or cooler than the atmosphere. Therefore, a conclusion that the ARE necessarily warms the surface can be disputed. Instead, according to the hypothesis supported in this paper, it is the lapse rate that warms the surface, and this lapse rate is in turn created by convection.
Overall, the results of these simple calculations are consistent with the RRTM outputs, with the latter being, of course, more reliable. Yet the analysis in this appendix provides a transparent explanation of why this occurs.
Appendix A.5. Comparison of the Proposed Framework with the Notion of Radiative Equilibrium
The classical work by Manabe and Strickler [50] argued that, in the absence of convection, a pure radiative equilibrium would produce a very steep lapse rate that would lead to a surface temperature of 332.3 K due to the “greenhouse effect”. Modern recalculations (e.g., Wester [71]) reaffirmed this result. This pure radiative equilibrium is not associated with a linear vertical temperature profile, as are the RRTM results presented in this work. On the other hand, the RRTM version adopted here, which is the simplest and most transparent (available online so that any interested reader can repeat the calculations and check the results), only allows a linear temperature profile. Therefore, an accurate comparison of the Manabe and Strickler’s radiative equilibrium with RRTM results is (a) out of the capacity range of the current study and (b) beyond the scope of this paper, as the radiative equilibrium refers to idealized conditions not realized in the observed troposphere.
However, another type of comparison is provided here, which is more relevant to reality as it only uses linear temperature profiles. Linear profiles are empirically supported by long-term observations and, within the theoretical framework of the present study, correspond to the condition that characterizes steady state. A deviation from the linear profile would imply vertically varying energy fluxes inconsistent with that steady-state condition. Forcing the temperature profile to remain linear is therefore the relevant comparison for the purposes of this paper.
Specifically, we use those linear profiles that mimic the steep lower part of Manabe and Strickler’s curve reproduced in Figure A6 (digitized from their Figure 4 in [50]) enveloping this curve. We use three families of linear temperature profiles. Each family is characterized by a ground temperature (assumed equal to corresponding to the pressure level of 1000 hPa), namely 330 K, 315 K and 300 K. The examined lapse rates vary between 10 K/km and 30 K/km, as specified in the caption of Figure A6 for each ground temperature. Such values are far beyond realistic ones; they are used only to create the envelope and are mathematically necessitated by the fact that the Manabe and Strickler profile is very steep, with surface temperature for the radiative equilibrium as high as 332.3 K.
Once and are specified, the pressure at any elevation z can be determined from Equation (29), valid for any . The resulting curve can then be directly compared to the Manabe and Strickler curve seen in Figure A6. It is observed in the figure that the envelope for = 330 K covers the entire curve, while that at the other end, = 300 K, leaves out a non-negligible part of the curve.
Given and , RRTM can directly determine the loss, gain, or equilibrium of energy from the Earth considering both SW and LW radiation. The RRTM results are plotted in Figure A7, from which we can readily make the following observations:
- In all cases, there is a loss of energy, and equilibrium never appears.
- The loss of energy is an increasing function of (a) the ground temperature and (b) the lapse rate.
- The case where = 330 K, which (a) is closest to the Manabe and Strickler surface temperature of 332.3 K and (b) envelopes their entire curve, results in very high energy loss.
Hence, the RRTM results show that if linearity of the vertical temperature profile, which is consistent with empirical evidence, is set as a requirement, in a manner that they approximate the nonlinear Manabe and Strickler’s curve, then pure radiative equilibrium with these steep linear profiles does not hold. Rather, the RRTM calculations show substantial energy loss for all examined cases. The imbalance is largest for the family that most closely envelopes the nonlinear Manabe and Strickler’s curve ( K). These results are consistent with the view that pure radiative equilibrium is an idealized construct; profiles with the steep lapse rates characteristic of that construct are radiatively far from balance and would require strong convective action to reach a steady state.
Figure A6.
Explanatory schematic for comparing the Manabe and Strickler’s (1964) [50] radiative equilibrium curve (digitized from their Figure 4) with RRTM results using three families of linear temperature profiles, starting at ground temperature (assumed equal to corresponding at the pressure level of 1000 hPa) and having appropriate lapse rates . The envelopes for all examined shown in the schematic have, respectively, minimum and maximum values of 14 K/km and 30 K/km for 330 K, 12 K/km and 18 K/km for 315 K, and 10 K/km to 12 K/km for 300 K.
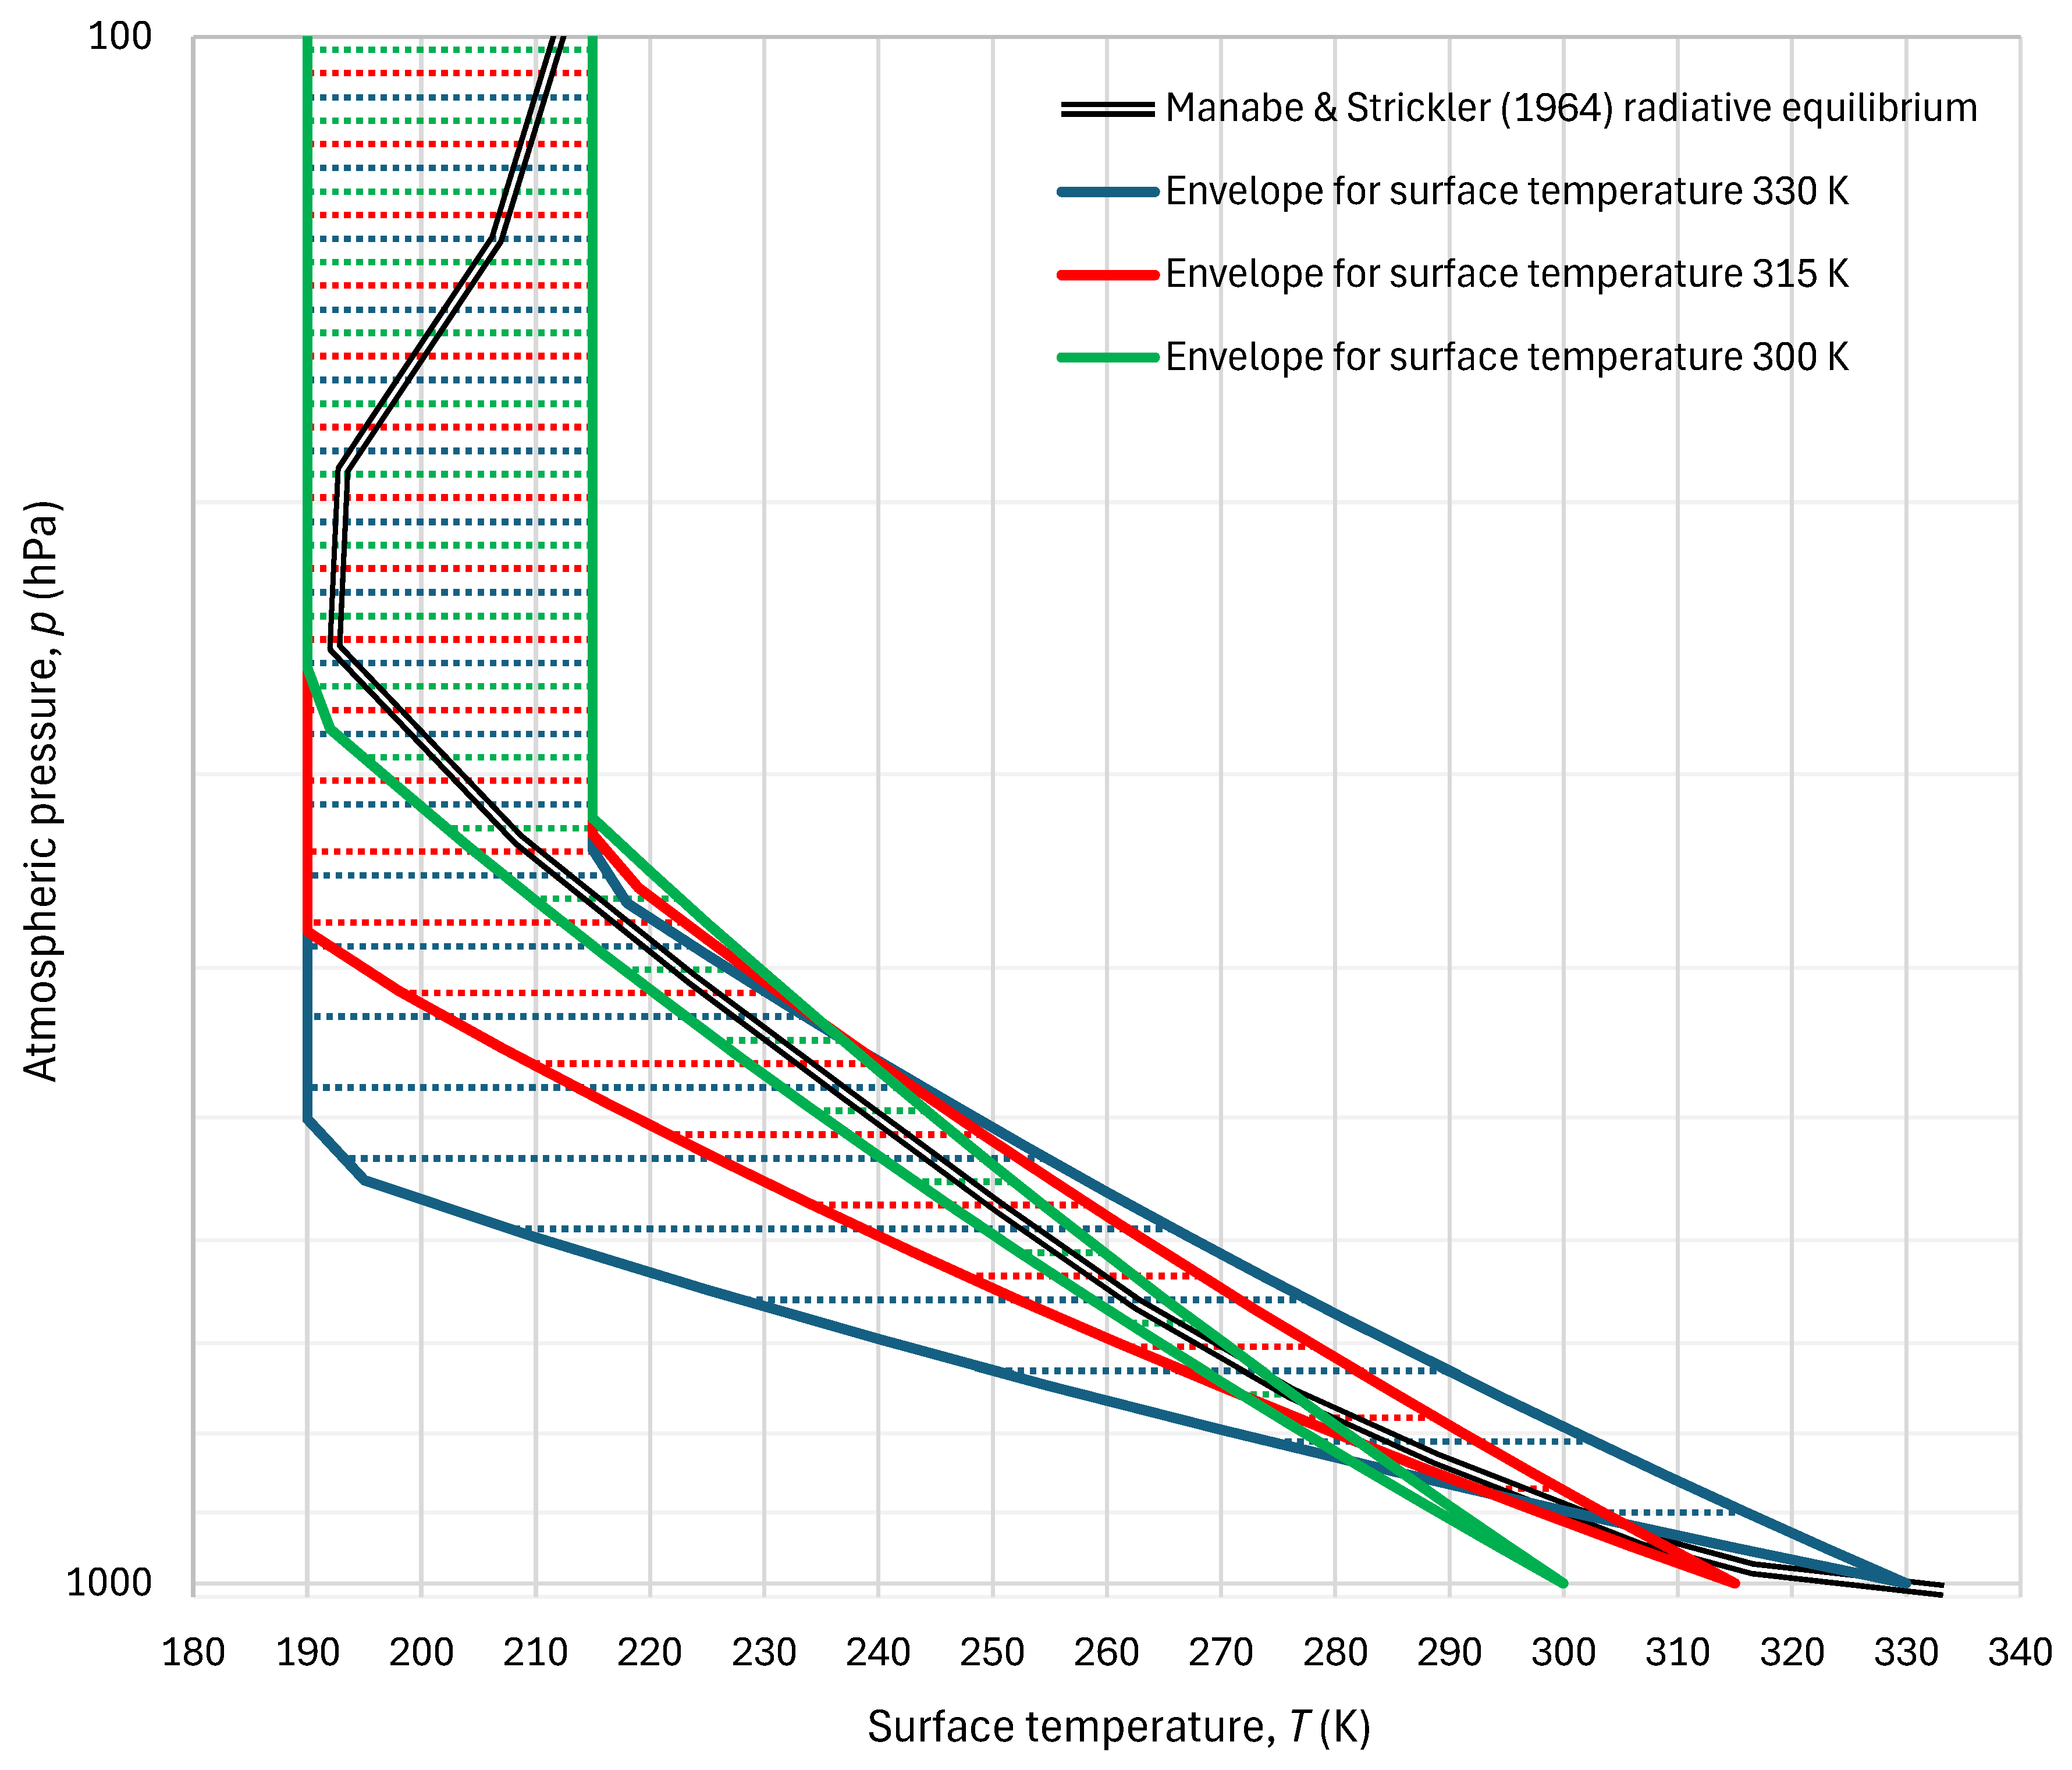
Additional support for the same view is also provided by other analyses and results of this study, namely the asymptotically constant surface temperature for high lapse rates (clearly visible in Figure 12), the general behavior of the RRTM-derived radiative flux gradient (seen in Figure 13), and the nearly radiative balance () of the isothermal () profile (also seen in Figure 13). All analyses presented, based on a constant lapse rate, suggest that the surface temperature increase is accompanied by an increased lapse rate, which is also associated with increased convection intensity (in contrast to Manabe and Strickler’s implication that convection decreases the surface temperature). Hence, all thermodynamic and radiative analyses presented in this work, including the RRTM results, converge to the conclusion that steep lapse rates enhance convection rather than leading to an equilibrium without convection.
Figure A7.
Energy loss rate (difference in outgoing minus incoming total radiation at Earth’s TOA) resulting from RRTM for default parameters. Continuous lines correspond to the assumptions described in the text and to the envelopes of Figure A6, while dashed lines correspond to additional RRTM runs in which the two vertical lines in the envelopes of Figure A6 (corresponding to low pressure, hPa) are forced to coincide at 190 K.
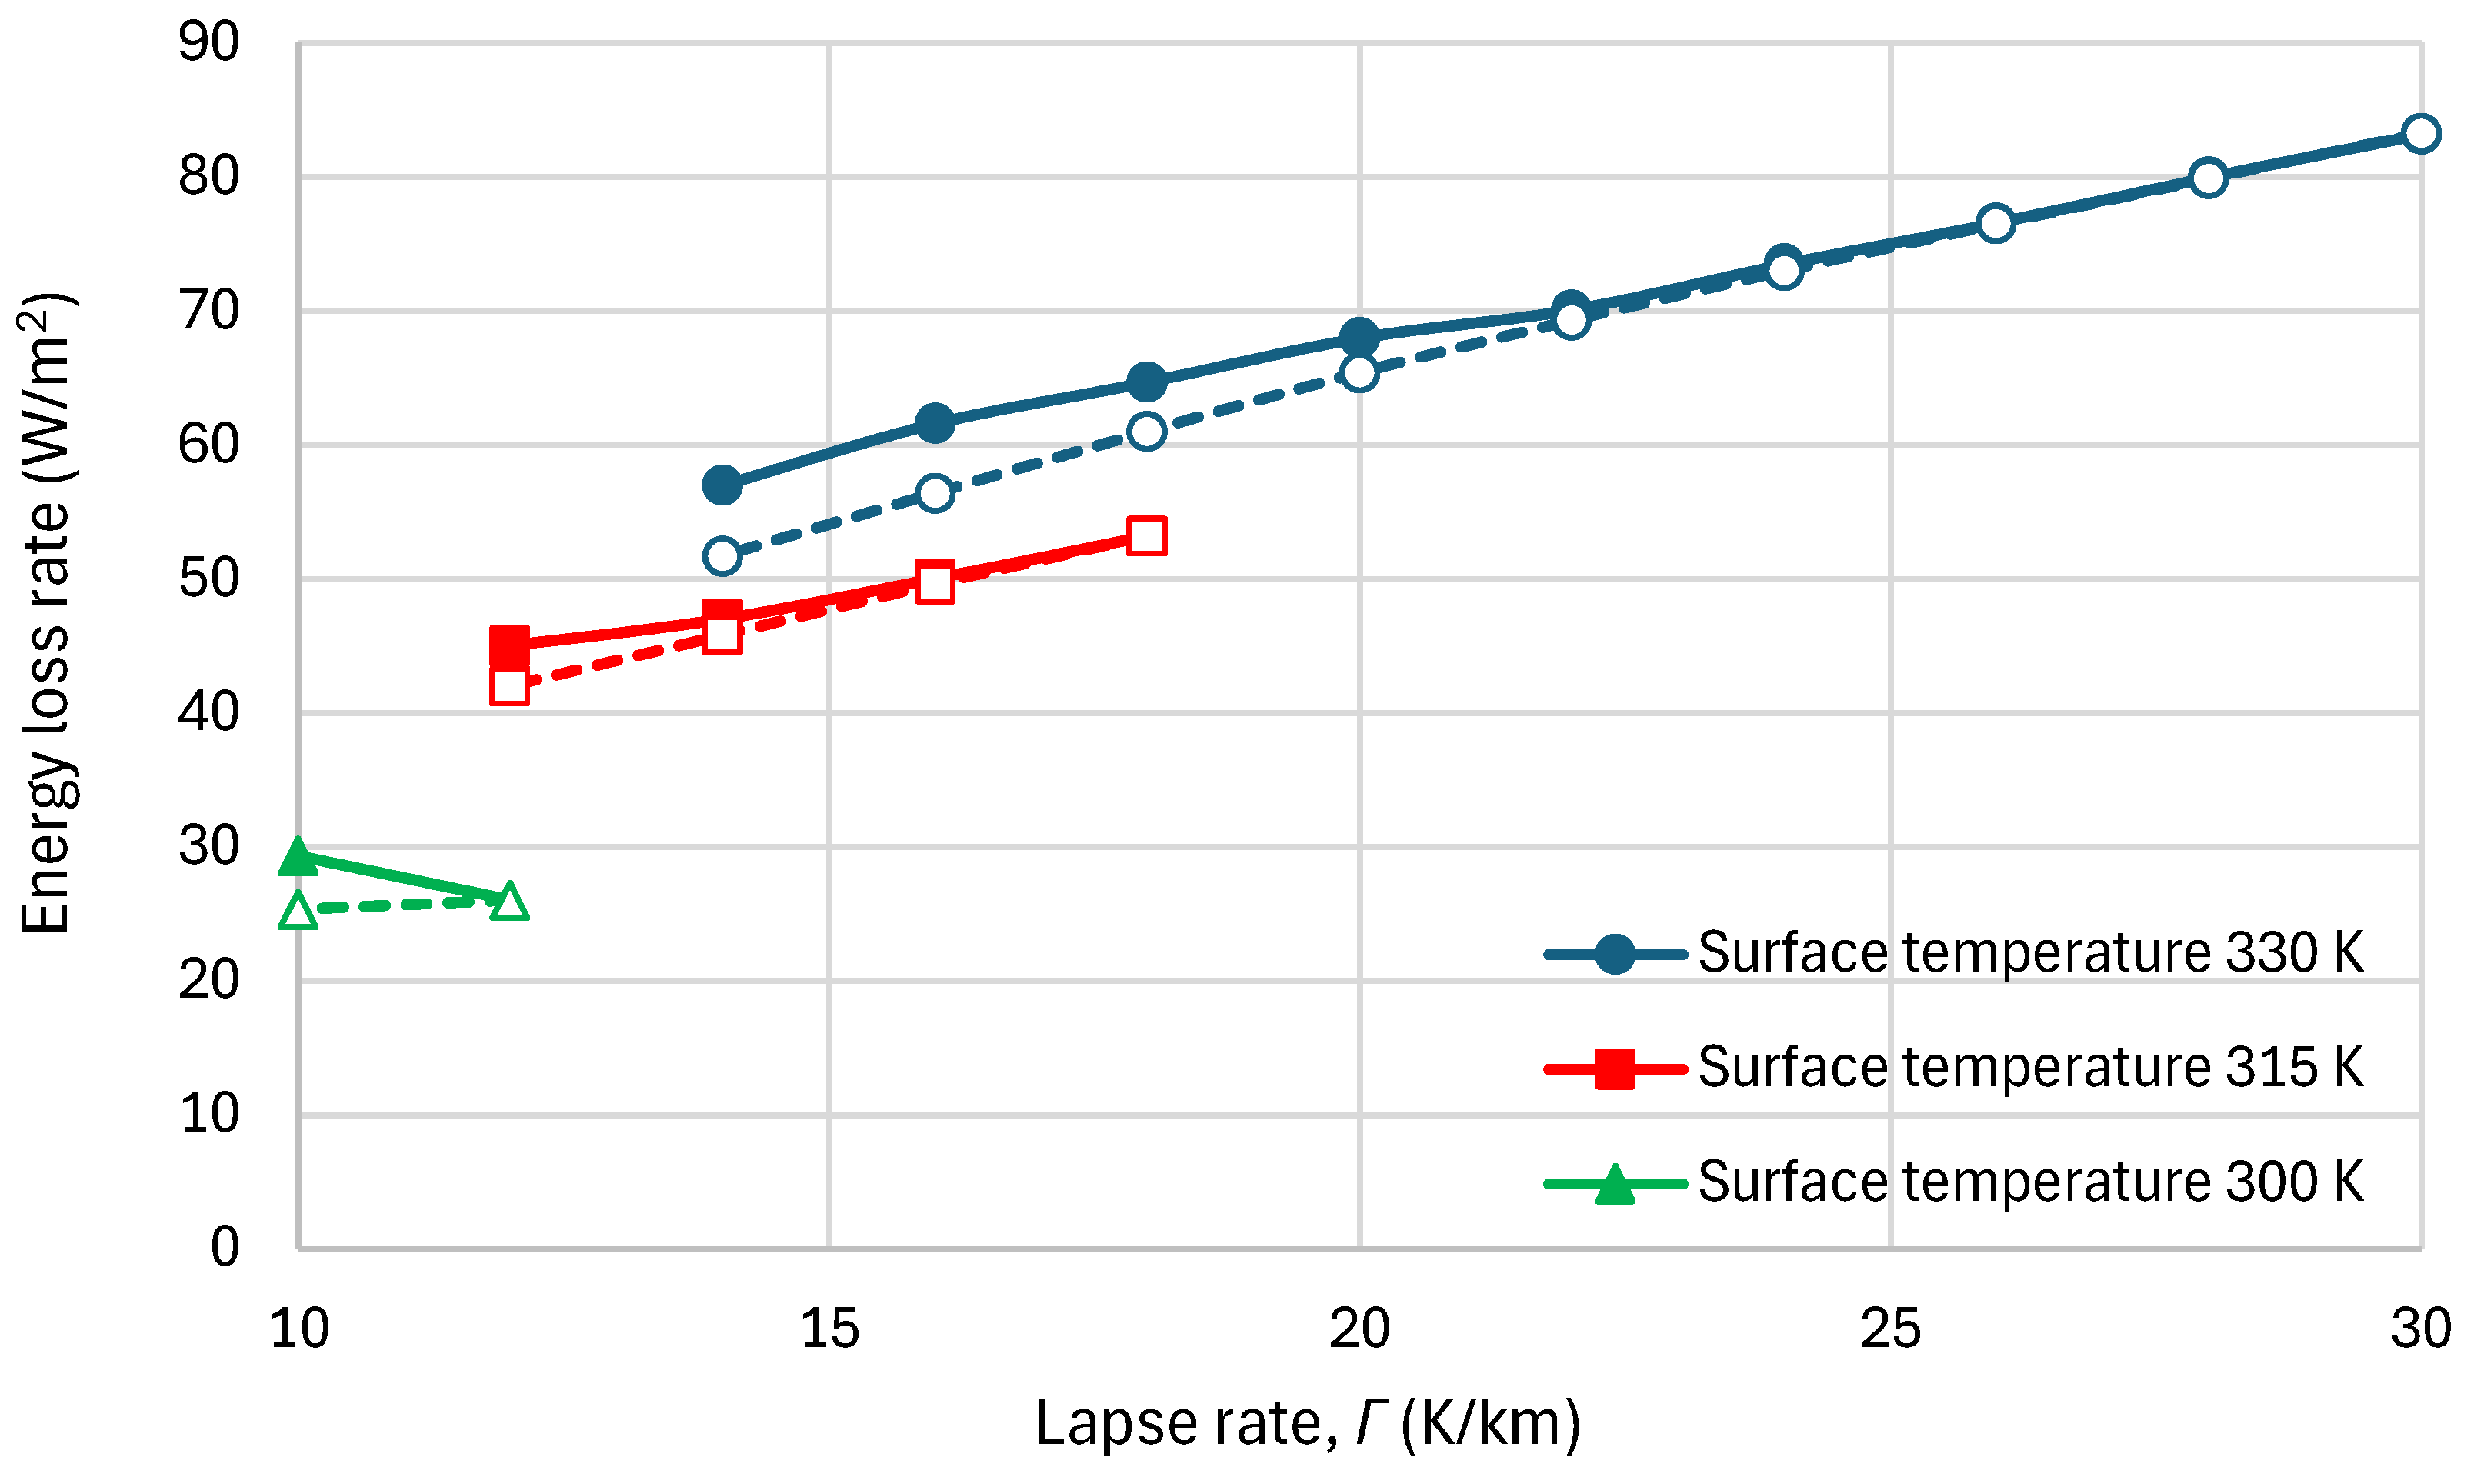
Appendix A.6. Falsifiable Empirical Benchmarks
To further test the present stochastic maximum-entropy framework, in comparison to the established one, a first possible falsifiable empirical benchmark could be based on whether suppressed convection increases or decreases the distance from molecular isothermality. A distinctive, testable prediction of the proposed framework is that the tropospheric temperature profile systematically approaches the isothermal molecular equilibrium (the state that maximizes entropy at the microscopic level) as the intensity of macroscopic convective motions declines. Because residual convection, advection, and latent-heat release never vanish completely, pure isothermality is an asymptotic reference rather than an attainable end-state. The observable signature is therefore a continuous reduction in the conditional mean lapse rate (and a corresponding narrowing of the temperature profile difference from isothermality) with decreasing convective activity. This relation can be examined with existing high-resolution soundings, radio-occultation profiles, and reanalyses by stratifying the data according to independent measures of convective intensity (such as convective available potential energy—CAPE) while controlling for radiative effects and moisture content. Polar-night and inversion regimes provide natural promising cases.
The appropriate conventional counterpart is that of the pure radiative equilibrium that does not impose any fixed critical lapse rate through convective adjustment. Under those conditions, the temperature profile is free to evolve according to radiative cooling rates, and is under no theoretical obligation to approach isothermality. Rather, in this counterpart framework an increase in the distance from isothermality is expected, accompanied by a steepening of the near-surface lapse rate. The so-called radiative-convective equilibrium, which also includes convection, is another candidate counterpart. We note, though, that this is not an equilibrium state despite the term used for it [72].
If, after the stated controls, the observed conditional mean lapse rate shows no systematic drift toward zero as convective intensity decreases, but rather remains constant or steepens toward the non-adjusted pure radiative model, then the claim that the tropospheric profile reflects a competition between molecular (isothermal) and macroscopic (isentropic) maximum-entropy states is falsified.
A second falsifiable empirical benchmark can be based on the speed of the thermodynamic adjustment of the lapse rate. According to the proposed framework, the tropospheric lapse rate should adjust to its characteristic seasonal value on a timescale of weeks or less, regardless of whether the LW radiation field approaches equilibrium or remains far from it. This separation of timescales follows because the macroscopic isentropic state is enforced by fast convective processes related to entropy maximization under the relevant parcel constraints; radiation responds more slowly. The prediction can be examined with consecutive monthly or sub-monthly temperature and radiation profiles (as already illustrated for mid-latitudes in Figure A3).
If the observed lapse rate is found to lag the radiation field on the radiative timescale, or to vary in proportion to the concurrent difference rather than locking rapidly to the seasonal thermodynamic value, then the claim that the lapse rate is primarily related to entropy-maximizing thermodynamics (with radiation adjusting passively) is falsified.
A third falsifiable empirical benchmark can be based on studying cross-planetary atmospheres. A hint has already been given for Venus in Appendix A.3, but systematic work is possible, based on modern data availability from space exploration missions. In this case, however, the available data can hardly support detailed testing similar to those in the previous empirical benchmarks. Yet it is possible to make predictions, based on the proposed framework, for the equilibrium lapse-rate structure (or the isothermal molecular baseline) under different gravity, different molecular degrees of freedom, or different radiatively active gas inventories. If these predictions differ substantially from observational data, then the claim of entropy-maximizing thermodynamics as the primary driver of the atmospheric profile is falsified.
References and Notes
- Clement of Alexandria, The Stromata, 4.3.8. Available online: http://www.poesialatina.it/_ns/greek/testi/Clemens/Stromata04.html (accessed on 7 June 2026).
- Koutsoyiannis, D. Stochastics of Hydroclimatic Extremes—A Cool Look at Risk, 5th ed.; Kallipos Open Academic Editions: Athens, Greece, 2025; 420p, Available online: http://www.itia.ntua.gr/2000/ (accessed on 7 June 2026). [CrossRef]
- Koutsoyiannis, D. Stochastics as Physics; Edition 0 (incomplete); National Technical University of Athens: Athens, Greece, 2026; Available online: https://www.itia.ntua.gr/2600/ (accessed on 7 June 2026).
- Koutsoyiannis, D. A random walk on water. Hydrol. Earth Syst. Sci. 2010, 14, 585–601. [Google Scholar] [CrossRef] [Scilit]
- Koutsoyiannis, D.; Sargentis, G.-F. Entropy and Wealth. Entropy 2021, 23, 1356. [Google Scholar] [CrossRef] [Scilit] [PubMed]
- Heraclitus, quoted in Plato’s Cratylus, 439d, 440c.
- Aristotle, Meteorologica, I.14, 353a 16.
- Jaynes, E.T. Information theory and statistical mechanics. Phys. Rev. 1957, 106, 620–630. [Google Scholar] [CrossRef] [Scilit]
- Jaynes, E.T. Probability Theory: The Logic of Science; Cambridge University Press: Cambridge, UK, 2003; 728p. [Google Scholar]
- Clausius, R. A contribution to the history of the mechanical theory of heat. Phil. Mag. 1872, 43, 106–115. [Google Scholar] [CrossRef] [Scilit]
- Boltzmann, L. Weitere Studien über das Wärmegleichgewicht unter Gasmolekülen. In Sitzungsberichte Akad. Wiss., Vienna, Part II; (Reprinted in Boltzmann’s Wissenschaftliche Abhandlungen; J. A. Barth: Leipzig, Germany, 1909; Volume I, pp. 316–402); J. A. Barth: Leipzig, Germany, 1872; Volume 66, pp. 275–370. [Google Scholar]
- Boltzmann, L. Über die Beziehung zwischen dem zweiten Hauptsatze der mechanischen Wärmetheorie und der Wahrscheinlichkeitsrechnung respektive den Sätzen über das Wärmegleichgewicht. Wien. Ber. 1877, 76, 373–435. [Google Scholar]
- Gibbs, J.W. Elementary Principles in Statistical Mechanics; Reprinted by Dover: New York, NY, USA, 1960; Yale University Press: New Haven, CT, USA, 1902; Available online: https://www.gutenberg.org/ebooks/50992 (accessed on 7 June 2026).
- Planck, M. Vorlesungen Über die Theorie der Wärmestrahlung; J. A. Barth: Leipzig, Germany, 1906; Available online: https://archive.org/details/vorlesungenberd03plangoog (accessed on 7 June 2026).
- Planck, M. The Theory of Heat Radiation; Blakiston: Philadelphia, PA, USA, 1914; Available online: https://www.gutenberg.org/ebooks/40030 (accessed on 7 June 2026).
- Shannon, C.E. A mathematical theory of communication. Bell Syst. Tech. J. 1948, 27, 623–656. [Google Scholar] [CrossRef] [Scilit]
- Wiener, N. Cybernetics or Control and Communication in the Animal and the Machine; MIT Press: Cambridge, MA, USA, 1948; 212p. [Google Scholar]
- Von Neumann, J. Probabilistic logics and the synthesis of reliable organisms from unreliable components. Autom. Stud. 1956, 34, 43–98. [Google Scholar] [CrossRef] [Scilit]
- Szilard, L. Über die Entropieverminderung in einem thermodynamischen System bei Eingriffen intelligenter Wesen. Z. Für Phys. 1929, 53, 840–856. [Google Scholar] [CrossRef] [Scilit]
- Khinchin, A.Y. Mathematical Foundations of Information Theory; Silverman, R.A.; Friedman, M.D., Translators; Dover Publications: New York, NY, USA, 1957. [Google Scholar]
- Papoulis, A. Probability, Random Variables and Stochastic Processes, 3rd ed.; McGraw-Hill: New York, NY, USA, 1991. [Google Scholar]
- Kolmogorov, A.N. Grundbegriffe der Wahrscheinlichkeitsrechnung; Ergebnisse der Mathematik und ihrer Grenzgebiete, Vol. 2, No. 3; Julius Springer: Berlin, Germany, 1933; pp. 1–62. [Google Scholar]
- Sackur, O. Die Anwendung der kinetischen Theorie der Gase auf chemische Probleme. Ann. Der Phys. 1911, 36, 958–980. [Google Scholar] [CrossRef] [Scilit]
- Tetrode, H. Die chemische Konstante der Gase und das elementare Wirkungsquantum. Ann. Der Phys. 1912, 38, 434–442. [Google Scholar] [CrossRef] [Scilit]
- Translational Motion, Wikipedia Commons. Available online: https://commons.wikimedia.org/wiki/File:Translational_motion.gif (accessed on 7 June 2026).
- Koutsoyiannis, D.; Tsakalias, G. Simulation of 100,000 Molecules Under a Uniform Gravitational Field, 2025. Available online: https://www.itia.ntua.gr/en/getfile/2537/40/documents/UnsettlingSupplementaryMaterialVideo.mp4 (accessed on 7 June 2026).
- Koutsoyiannis, D. Physics of uncertainty, the Gibbs paradox and indistinguishable particles. Stud. Hist. Philos. Mod. Phys. 2013, 44, 480–489. [Google Scholar] [CrossRef] [Scilit]
- Bureau International des Poids et Mesures. The International System of Units (SI), 9th ed.; 2019; Available online: https://www.bipm.org/documents/20126/41483022/SI-Brochure-9-EN.pdf (accessed on 22 July 2026).
- Thomson, W. On an absolute thermometric scale founded on Carnot’s theory of the motive power of heat, and calculated from Regnault’s observations. In Mathematical and Physical Papers; Cambridge Library Collection—Physical Sciences; Cambridge University Press: Cambridge, UK, 2011. [Google Scholar] [CrossRef] [Scilit]
- Planck, M. Zur Theorie des Gesetzes der Energieverteilung im Normalspectrum. Verhandlungen Der Dtsch. Phys. Ges. 1900, 2, 237–245. Available online: https://archive.org/details/verhandlungende01goog (accessed on 22 July 2026).
- Wagner, W.; Pruss, A. The IAPWS formulation 1995 for the thermodynamic properties of ordinary water substance for general and scientific use. J. Phys. Chem. Data 2002, 31, 387–535. [Google Scholar] [CrossRef] [Scilit]
- Pikeroen, Q.; Paillard, D.; Watrin, K. A radiative–convective model computing precipitation with the maximum entropy production hypothesis. Geosci. Model Dev. 2024, 17, 3801–3814. [Google Scholar] [CrossRef] [Scilit]
- Thimsen, E. Planetary Energy Flow and Entropy Production Rate by Earth from 2002 to 2023. Entropy 2024, 26, 350. [Google Scholar] [CrossRef] [Scilit] [PubMed]
- Courtney, J.A. Regime Change in Top of the Atmosphere Radiation Fluxes: Implications for Understanding Earth’s Energy Imbalance. Climate 2025, 13, 107. [Google Scholar] [CrossRef] [Scilit]
- Koutsoyiannis, D.; Tsakalias, G. Unsettling the settled: Simple musings on the complex climatic system. Front. Complex Syst. 2025, 3, 1617092. [Google Scholar] [CrossRef] [Scilit]
- University of Wyoming. Atmospheric Science Radiosonde Archive. Available online: https://weather.uwyo.edu/upperair/sounding.shtml (accessed on 7 June 2026).
- Fraundorf, P. Heat capacity in bits. Am. J. Phys. 2003, 71, 1142–1151. [Google Scholar] [CrossRef] [Scilit]
- Koutsoyiannis, D. Entropy: From thermodynamics to hydrology. Entropy 2014, 16, 1287–1314. [Google Scholar] [CrossRef] [Scilit]
- Koutsoyiannis, D. Clausius-Clapeyron equation and saturation vapour pressure: Simple theory reconciled with practice. Eur. J. Phys. 2012, 33, 295–305. [Google Scholar] [CrossRef] [Scilit]
- ICAO (International Civil Aviation Organization). Manual of the ICAO Standard Atmosphere: Extended to 80 Kilometres/262,500 Feet, 3rd ed.; 7488/3; ICAO: Montreal, QC, Canada, 1993; 304p. [Google Scholar]
- Berk, A.; Bernstein, L.S.; Robertson, D.C. MODTRAN: A Moderate Resolution Model for LOWTRAN; Scientific Report No. 1; Air Force Geophysics Laboratory, Air Force Systems Command, United States Air Force: Hanscom Air Force Base, MA, USA, 1987; Available online: https://www.researchgate.net/publication/235184147_MODTRAN_A_moderate_resolution_model_for_LOWTRAN (accessed on 7 June 2026).
- Berk, A.; Acharya, P.K.; Bernstein, L.S.; Anderson, G.P.; Lewis, P.; Chetwynd, J.H.; Hoke, M.L. Band Model Method for Modeling Atmospheric Propagation at Arbitrarily Fine Spectral Resolution. U.S. Patent #7433806, 7 October 2008. [Google Scholar]
- Berk, A.; Conforti, P.; Kennett, R.; Perkins, T.; Hawes, F.; van den Bosch, J. MODTRAN6: A Major Upgrade of the MODTRAN Radiative Transfer Code. Proc. SPIE 2014, 9088, 90880H. [Google Scholar] [CrossRef] [Scilit]
- Hersbach, H.; Bell, B.; Berrisford, P.; Biavati, G.; Horányi, A.; Muñoz Sabater, J.; Nicolas, J.; Peubey, C.; Radu, R.; Rozum, I.; et al. ERA5 hourly data on single levels from 1940 to present. Copernic. Clim. Change Serv. (C3S) Clim. Data Store (CDS) 2023, 10, 24381. [Google Scholar] [CrossRef]
- WRIT (Web-Based Reanalysis Intercomparison Tool). Monthly Timeseries, NOAA Physical Sciences Laboratory: Boulder, CO, USA. Available online: https://psl.noaa.gov/data/atmoswrit/timeseries/ (accessed on 7 June 2026).
- ClimExp. Climate Explorer; Koninklijk Nederlands Meteorologisch Instituut (KNMI): De Bilt, The Netherlands, 2022; Available online: https://climexp.knmi.nl (accessed on 7 June 2026).
- Wikimedia Commons. Available online: https://commons.wikimedia.org/wiki/File:Atmospheric_Transmission.svg (accessed on 7 June 2026).
- Janick, J.; Paris, H. History of controlled environment horticulture: Ancient origins. HortScience 2022, 57, 236–238. [Google Scholar] [CrossRef] [Scilit]
- Wood, R.W. XXIV. Note on the theory of the greenhouse. Lond. Edinb. Dublin Philos. Mag. J. Sci. 1909, 17, 319–320. [Google Scholar] [CrossRef] [Scilit]
- Manabe, S.; Strickler, R.F. Thermal equilibrium of the atmosphere with a convective adjustment. J. Atmos. Sci. 1964, 21, 361–385. [Google Scholar] [CrossRef] [Scilit]
- Mlawer, E.J.; Taubman, S.J.; Brown, P.D.; Iacono, M.J.; Clough, S.A. Radiative transfer for inhomogeneous atmospheres: RRTM, a validated correlated-k model for the longwave. J. Geophys. Res. Atmos. 1997, 102, 16663–16682. [Google Scholar] [CrossRef] [Scilit]
- Pincus, R.; Mlawer, E.J.; Delamere, J.S. Balancing accuracy, efficiency, and flexibility in radiation calculations for dynamical models. J. Adv. Model. Earth Syst. 2019, 11, 3074–3089. [Google Scholar] [CrossRef] [Scilit] [PubMed]
- RRTM. Earth’s Energy Budget. Available online: https://climatemodels.uchicago.edu/rrtm/ (accessed on 7 June 2026).
- Harde, H.; Schnell, M. Verification of the greenhouse effect in the laboratory. Sci. Clim. Change 2022, 2, 1–33. [Google Scholar] [CrossRef] [PubMed]
- Harde, H.; Schnell, M. The negative greenhouse effect—Part II, Studies of infrared gas emission with an advanced experimental set-up. Sci. Clim. Change 2025, 5.3, 10–34. [Google Scholar] [CrossRef] [PubMed]
- Schnell, M.; Harde, H. Model-experiment of the greenhouse effect. Sci. Clim. Change 2023, 3, 445–462. [Google Scholar] [CrossRef] [PubMed]
- Schnell, M.; Harde, H. The negative greenhouse effect—Part I, Experimental studies with a common laboratory set-up. Sci. Clim. Change 2025, 5.3, 1–9. [Google Scholar] [CrossRef] [PubMed]
- Schnell, M.; Harde, H. Radiative and Convective Heat-Transfer in the Atmosphere: Some Basic Laboratory Studies. Sci. Clim. Change 2026, 6, 128–139. [Google Scholar] [CrossRef] [PubMed]
- van Wijngaarden, W.A.; Happer, W. Radiation transport in clouds. Sci. Clim. Change 2025, 5, 1–12. [Google Scholar] [CrossRef] [PubMed]
- Harde, H. Radiation and heat transfer in the atmosphere: A comprehensive approach on a molecular basis. Int. J. Atmos. Sci. 2013, 2013, 503727. [Google Scholar] [CrossRef] [Scilit]
- Hanel, R.A.; Conrath, B.J. Thermal emission spectra of the Earth and atmosphere from the nimbus 4 Michelson interferometer experiment. Nature 1970, 228, 143–145. [Google Scholar] [CrossRef] [Scilit] [PubMed]
- CERES. CERES_EBAF_Ed4.1 Data Quality Summary, Version 3 (Updated 12 September 2021). 2021. Available online: https://ceres.larc.nasa.gov/documents/DQ_summaries/CERES_EBAF_Ed4.1_DQS.pdf (accessed on 7 June 2026).
- CERES. CERES_SSF1deg_Hour/Day/Month_Ed4A Data Quality Summary. Version 2 (Updated 8 April 2023). 2023. Available online: https://ceres.larc.nasa.gov/documents/DQ_summaries/CERES_SSF1deg_Ed4A_DQS.pdf (accessed on 7 June 2026).
- CERES Site for Terra Platform (Edition 4.2; SSF1deg Monthly Averaged Observed TOA Fluxes Grid). Available online: https://ceres-tool.larc.nasa.gov/ord-tool/jsp/SSF1degEd42Selection.jsp (accessed on 22 July 2026).
- Taylor, F.W.; Hunten, D.M. Venus: Atmosphere. In Encyclopedia of the Solar System, 3rd ed.; Tilman, S., Breuer, D., Johnson, T.V., Eds.; Elsevier Science & Technology: Amsterdam, The Netherlands, 2014. [Google Scholar] [CrossRef] [Scilit]
- NASA. Venus Facts. Available online: https://science.nasa.gov/venus/venus-facts/ (accessed on 22 July 2026).
- NASA; PDS. The Planetary Atmospheres Node, Adiabatic Lapse Rate, Dry. Available online: https://pds-atmospheres.nmsu.edu/education_and_outreach/encyclopedia/adiabatic_lapse_rate.htm (accessed on 22 July 2026).
- Belton, M.J.; Smith, G.R.; Schubert, G.; Del Genio, A.D. Cloud patterns, waves and convection in the Venus atmosphere. J. Atmos. Sci. 1976, 33, 1394–1417. [Google Scholar] [CrossRef] [Scilit][Green Version]
- Clancy, R.T.; Sandor, B.J.; Moriarty-Schieven, G.H. Observational definition of the Venus mesopause: Vertical structure, diurnal variation, and temporal instability. Icarus 2003, 161, 1–16. [Google Scholar] [CrossRef] [Scilit]
- Brutsaert, W. On a derivable formula for long-wave radiation from clear skies. Water Resour. Res. 1975, 11, 742–744. [Google Scholar] [CrossRef] [Scilit]
- Wester, L. Investigating Radiative and Radiative-Convective Equilibrium with DALES. Master’s Thesis, Delft University of Technology, Delft, The Netherlands, 2019. Available online: http://www.srderoode.nl/Students/Laurens_Wester.pdf (accessed on 20 August 2026).
- Singh, M.S.; O’Neill, M.E. The climate system and the second law of thermodynamics. Rev. Mod. Phys. 2022, 94, 015001. [Google Scholar] [CrossRef] [Scilit]
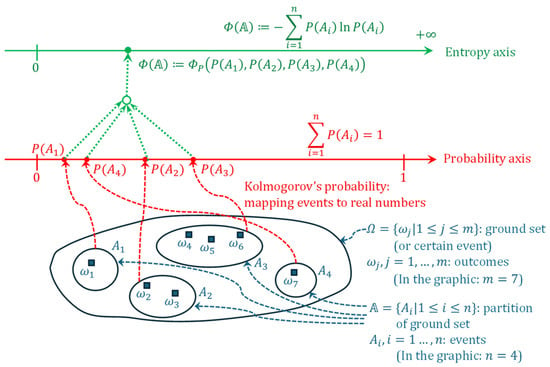
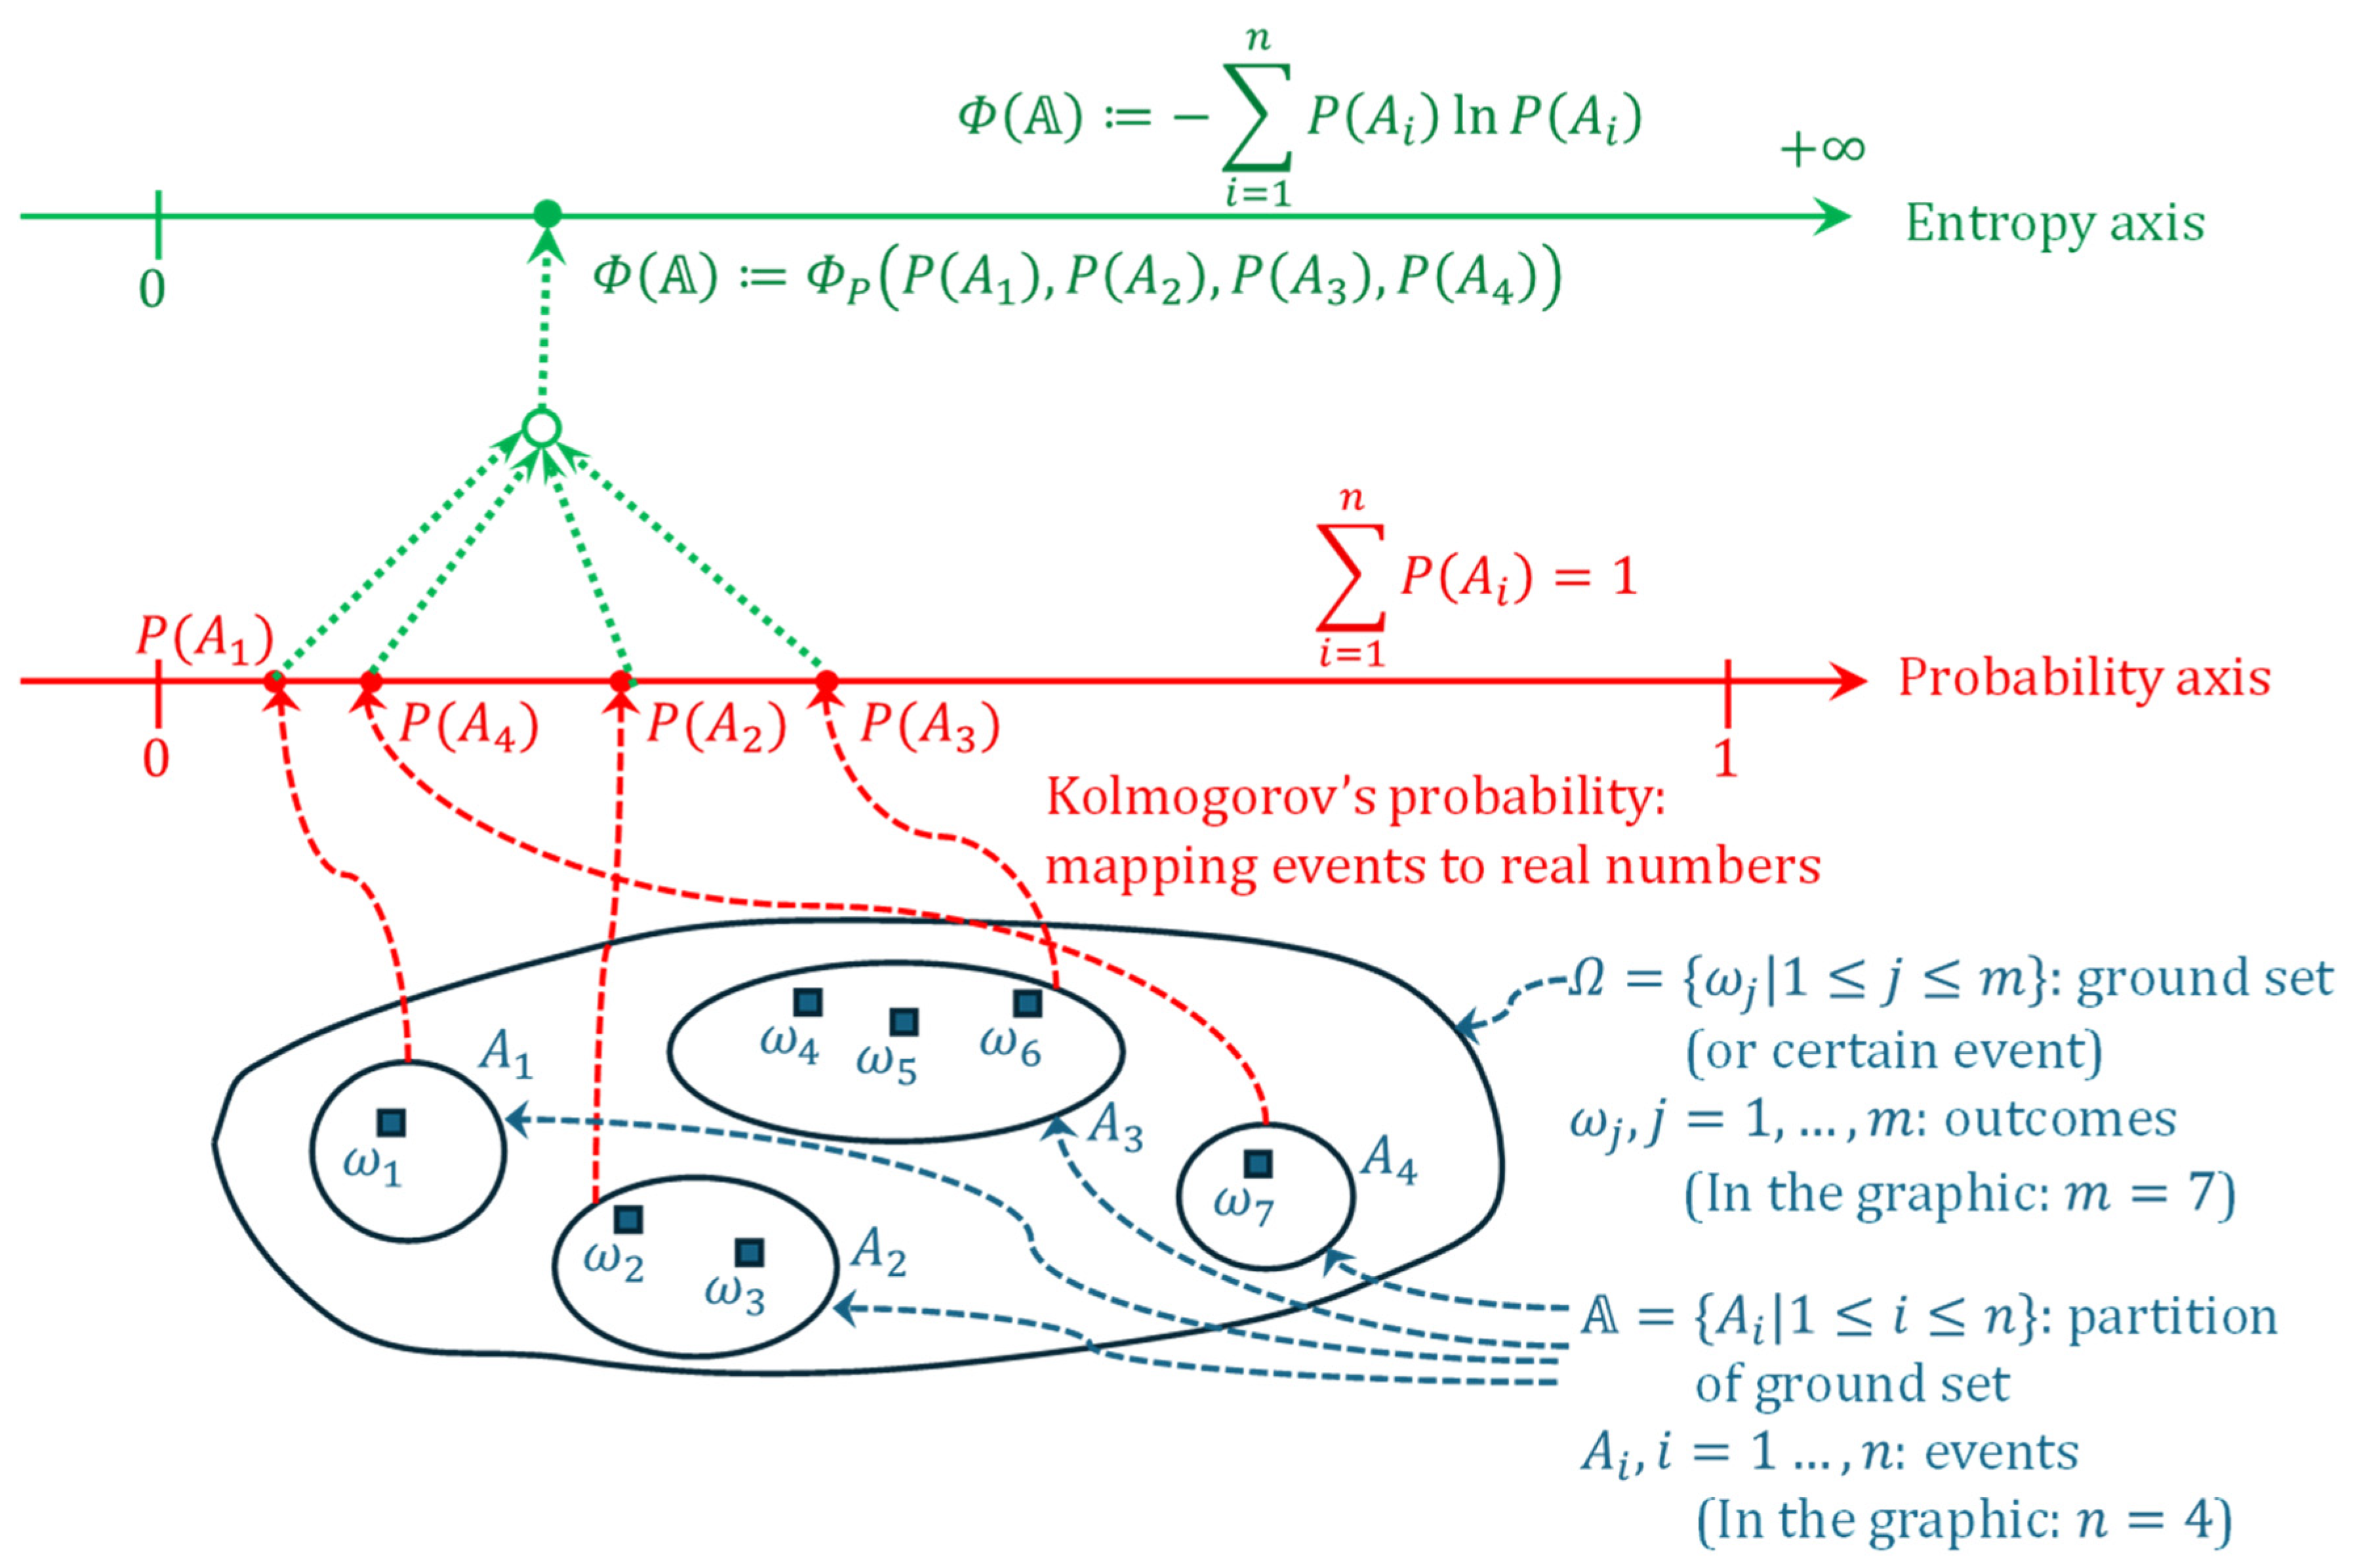
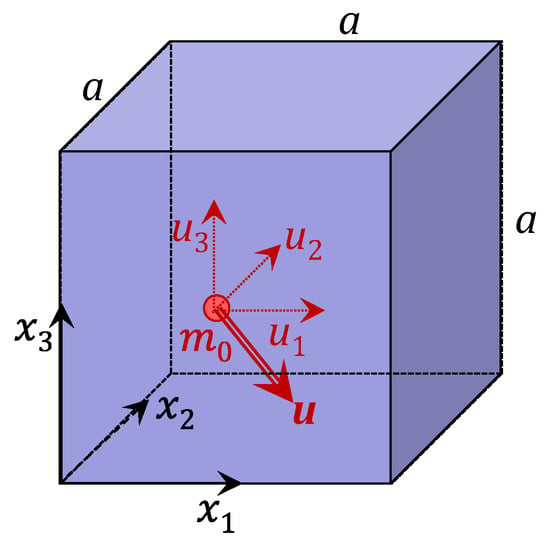
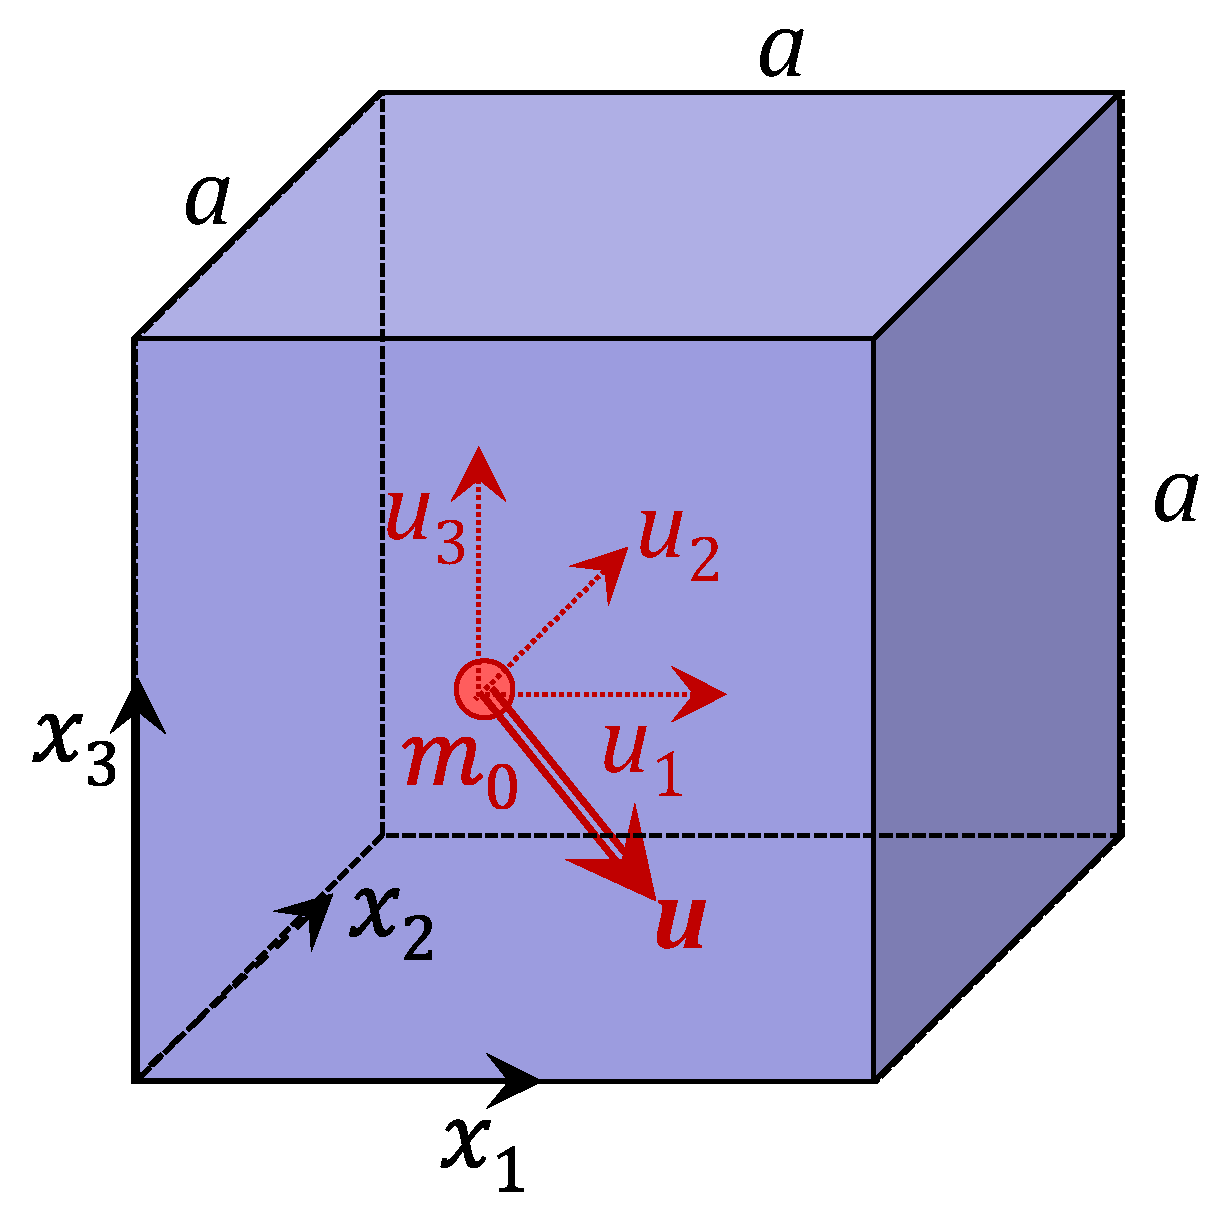
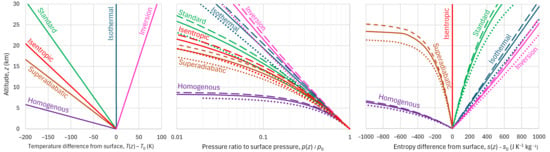
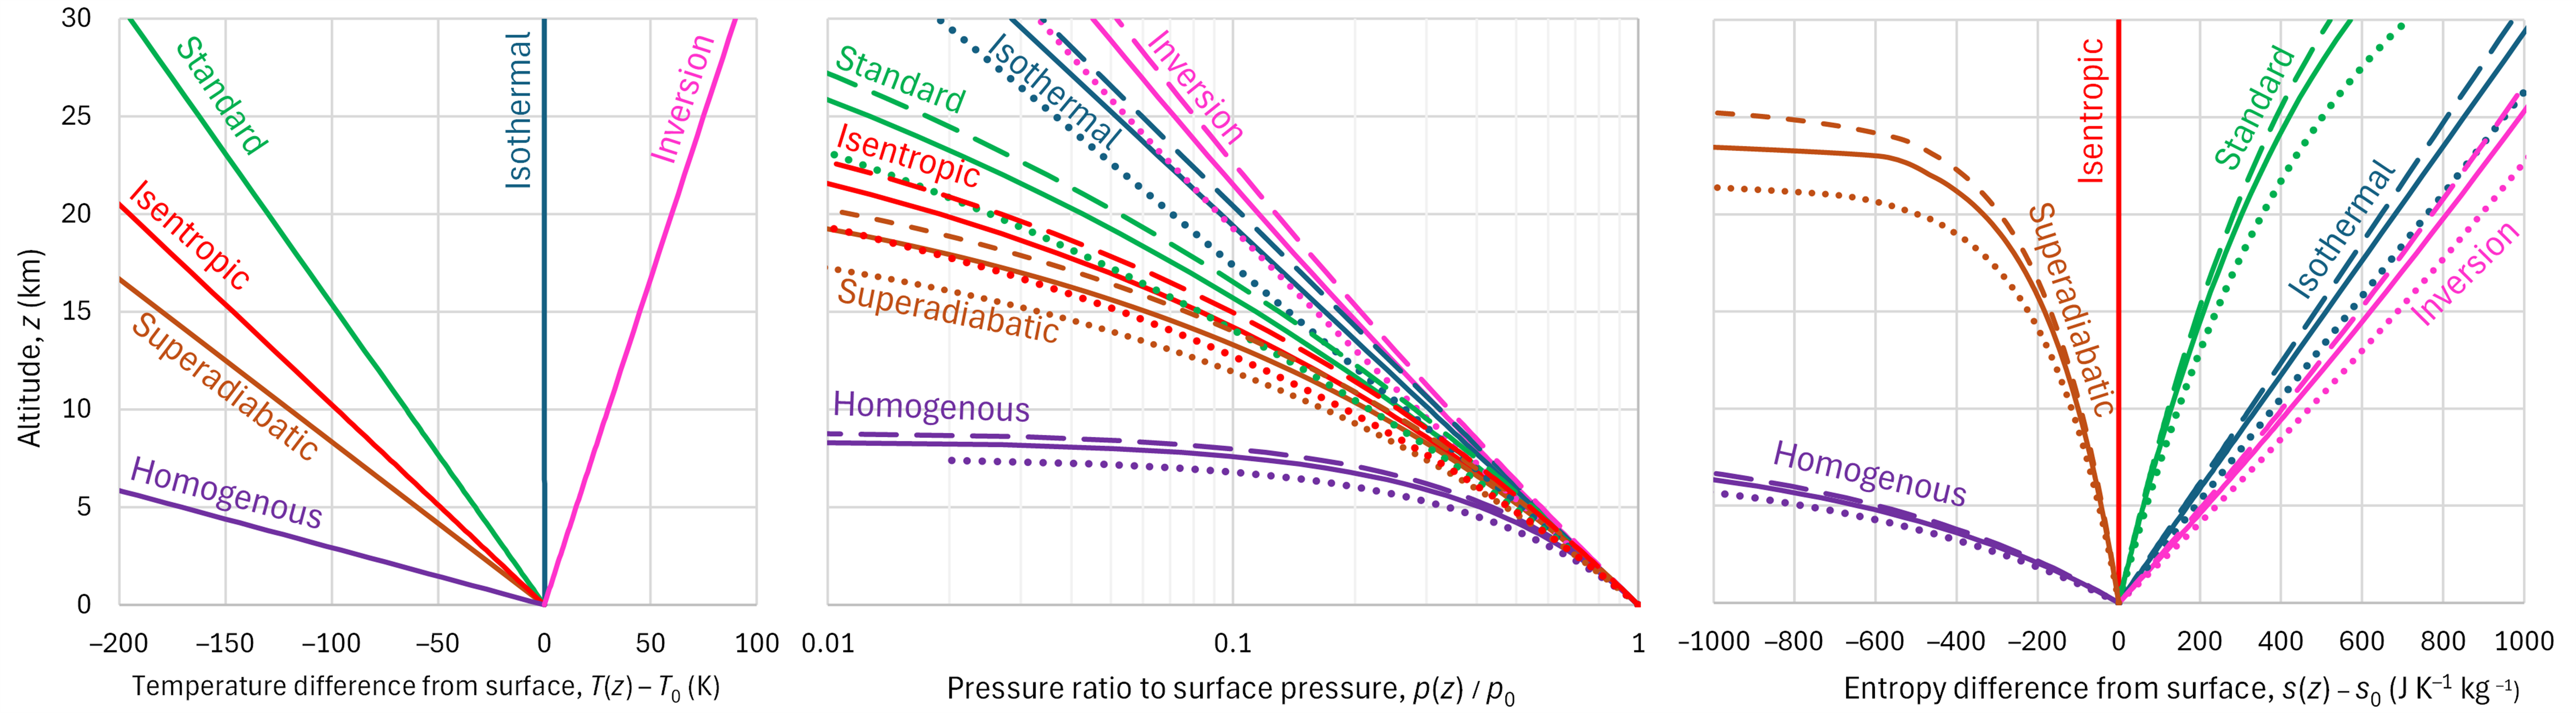
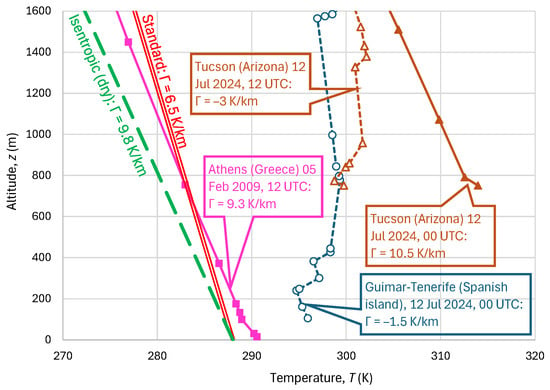
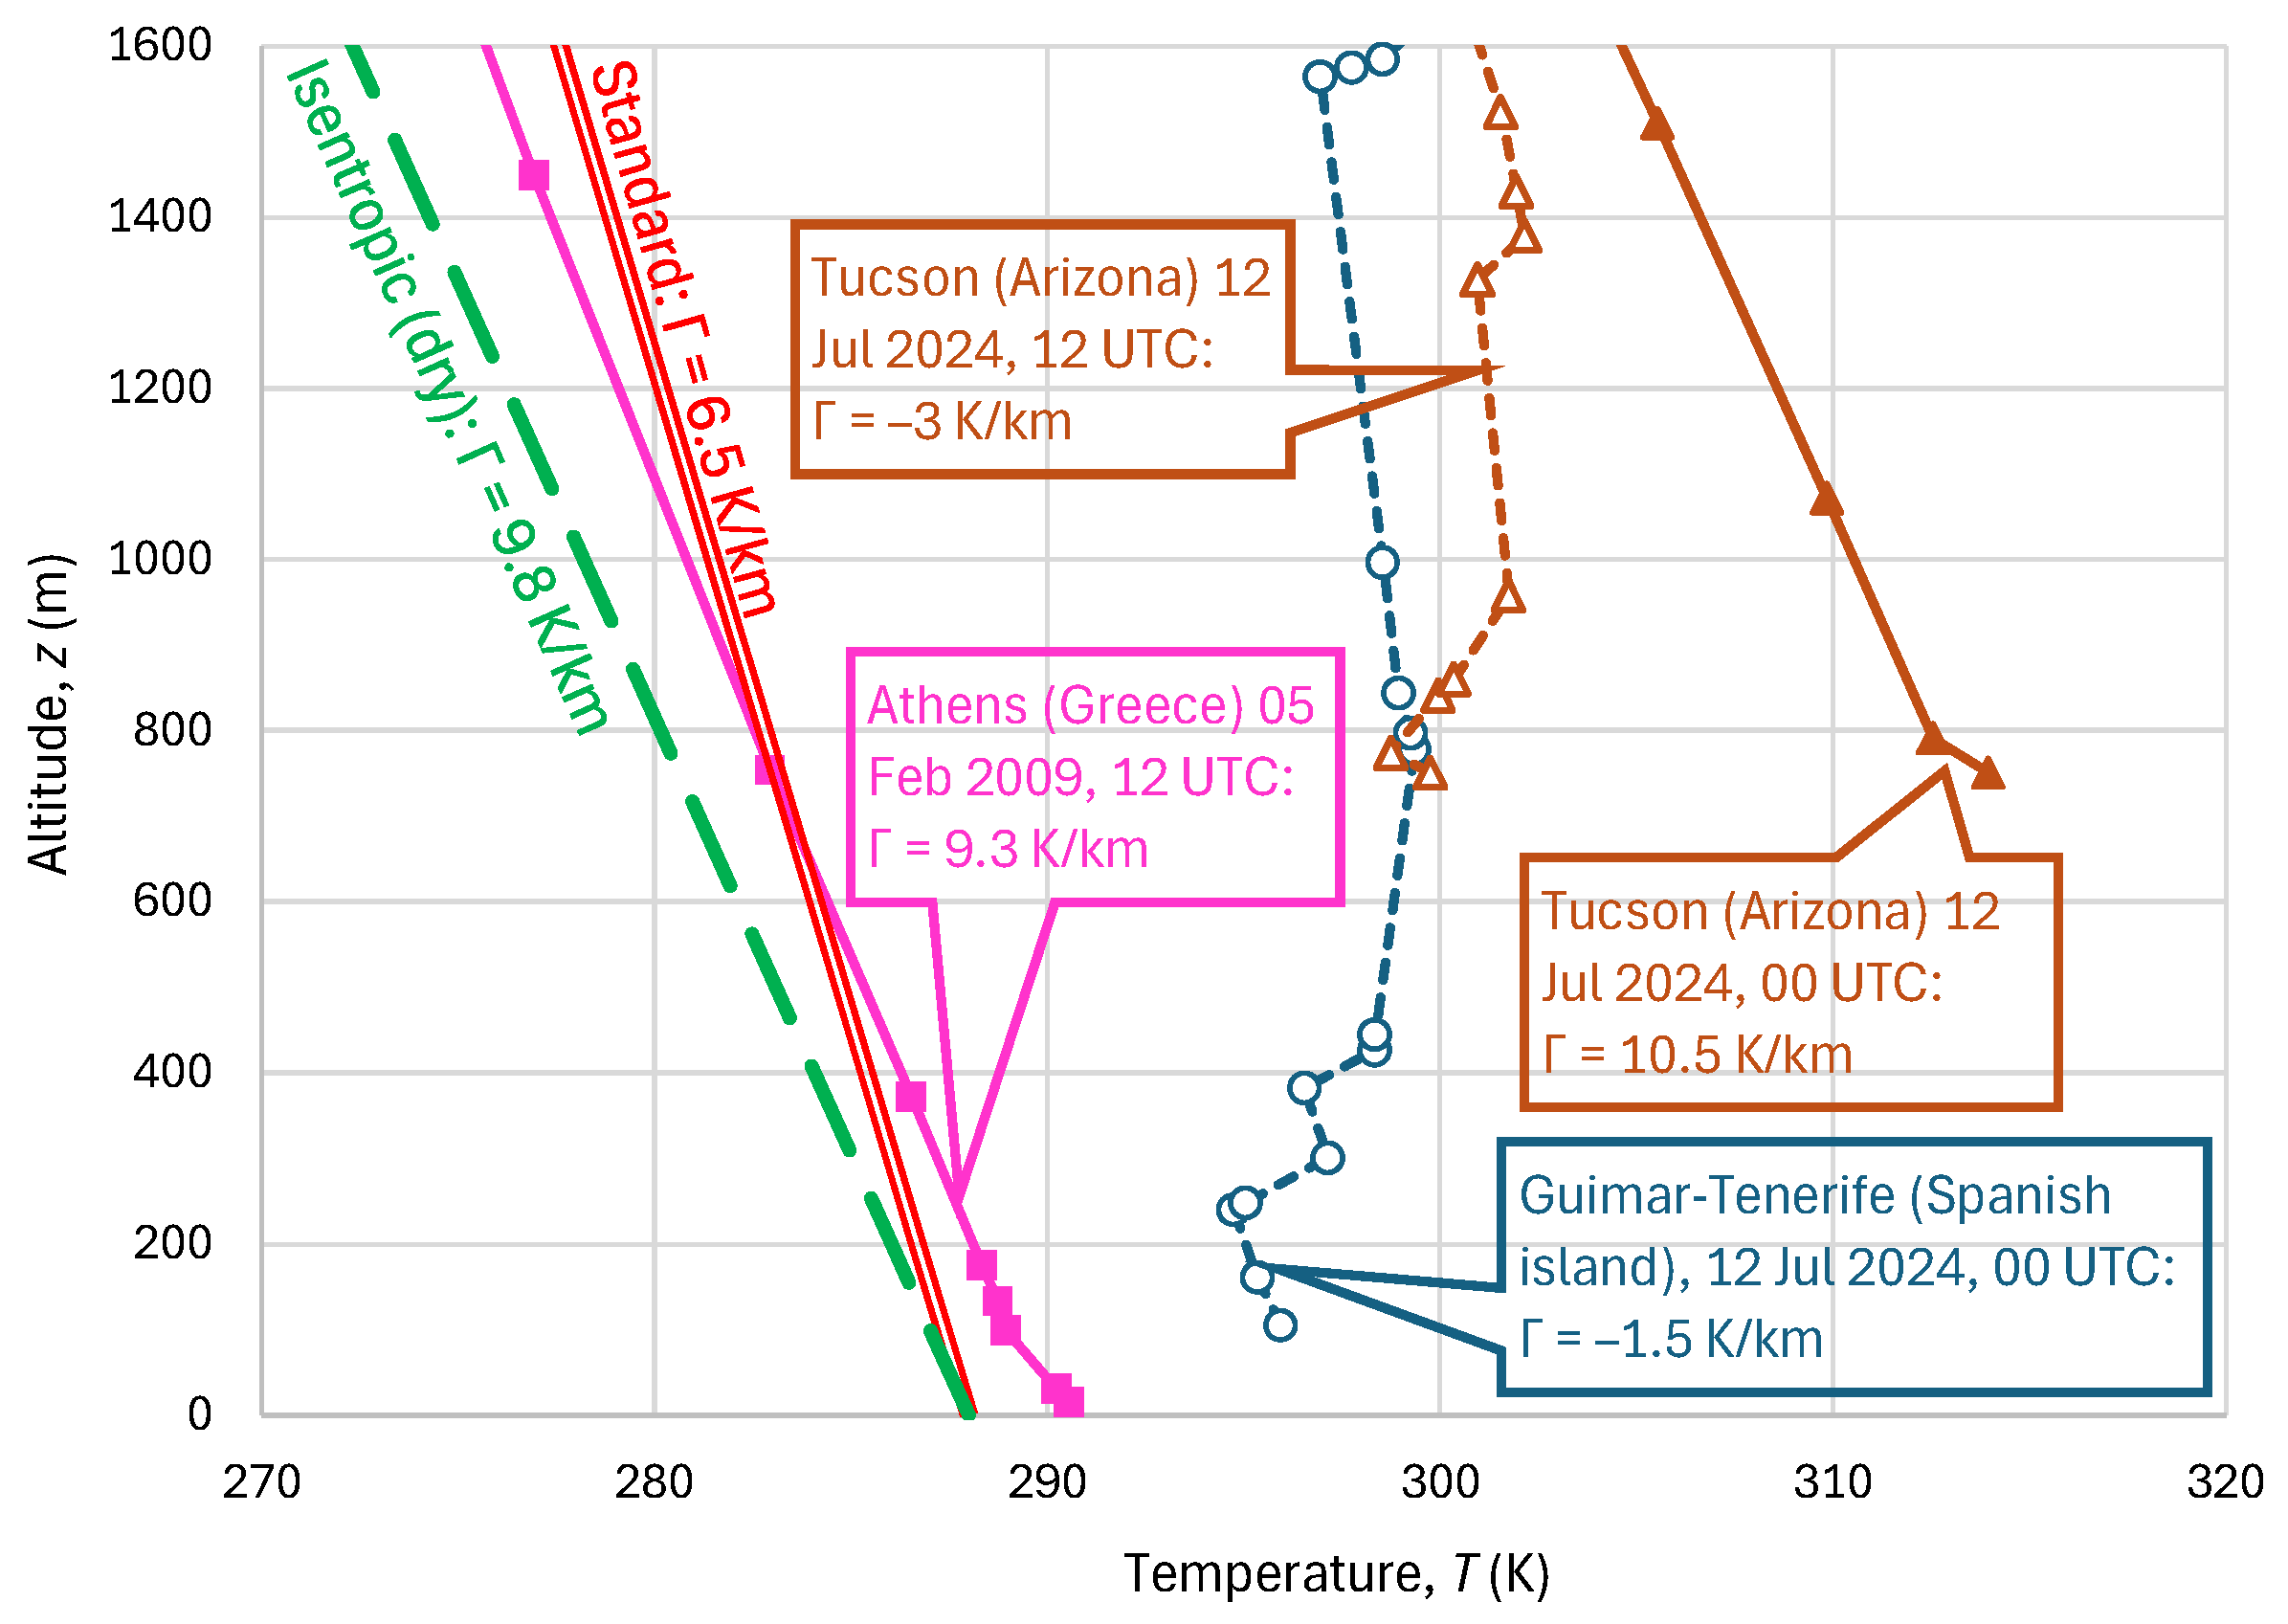
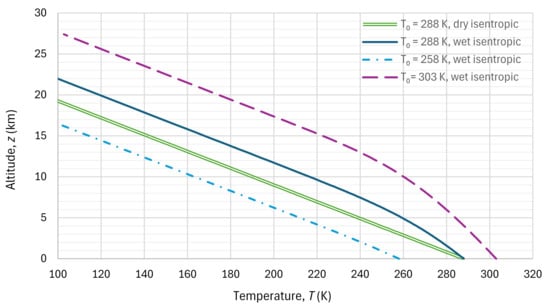
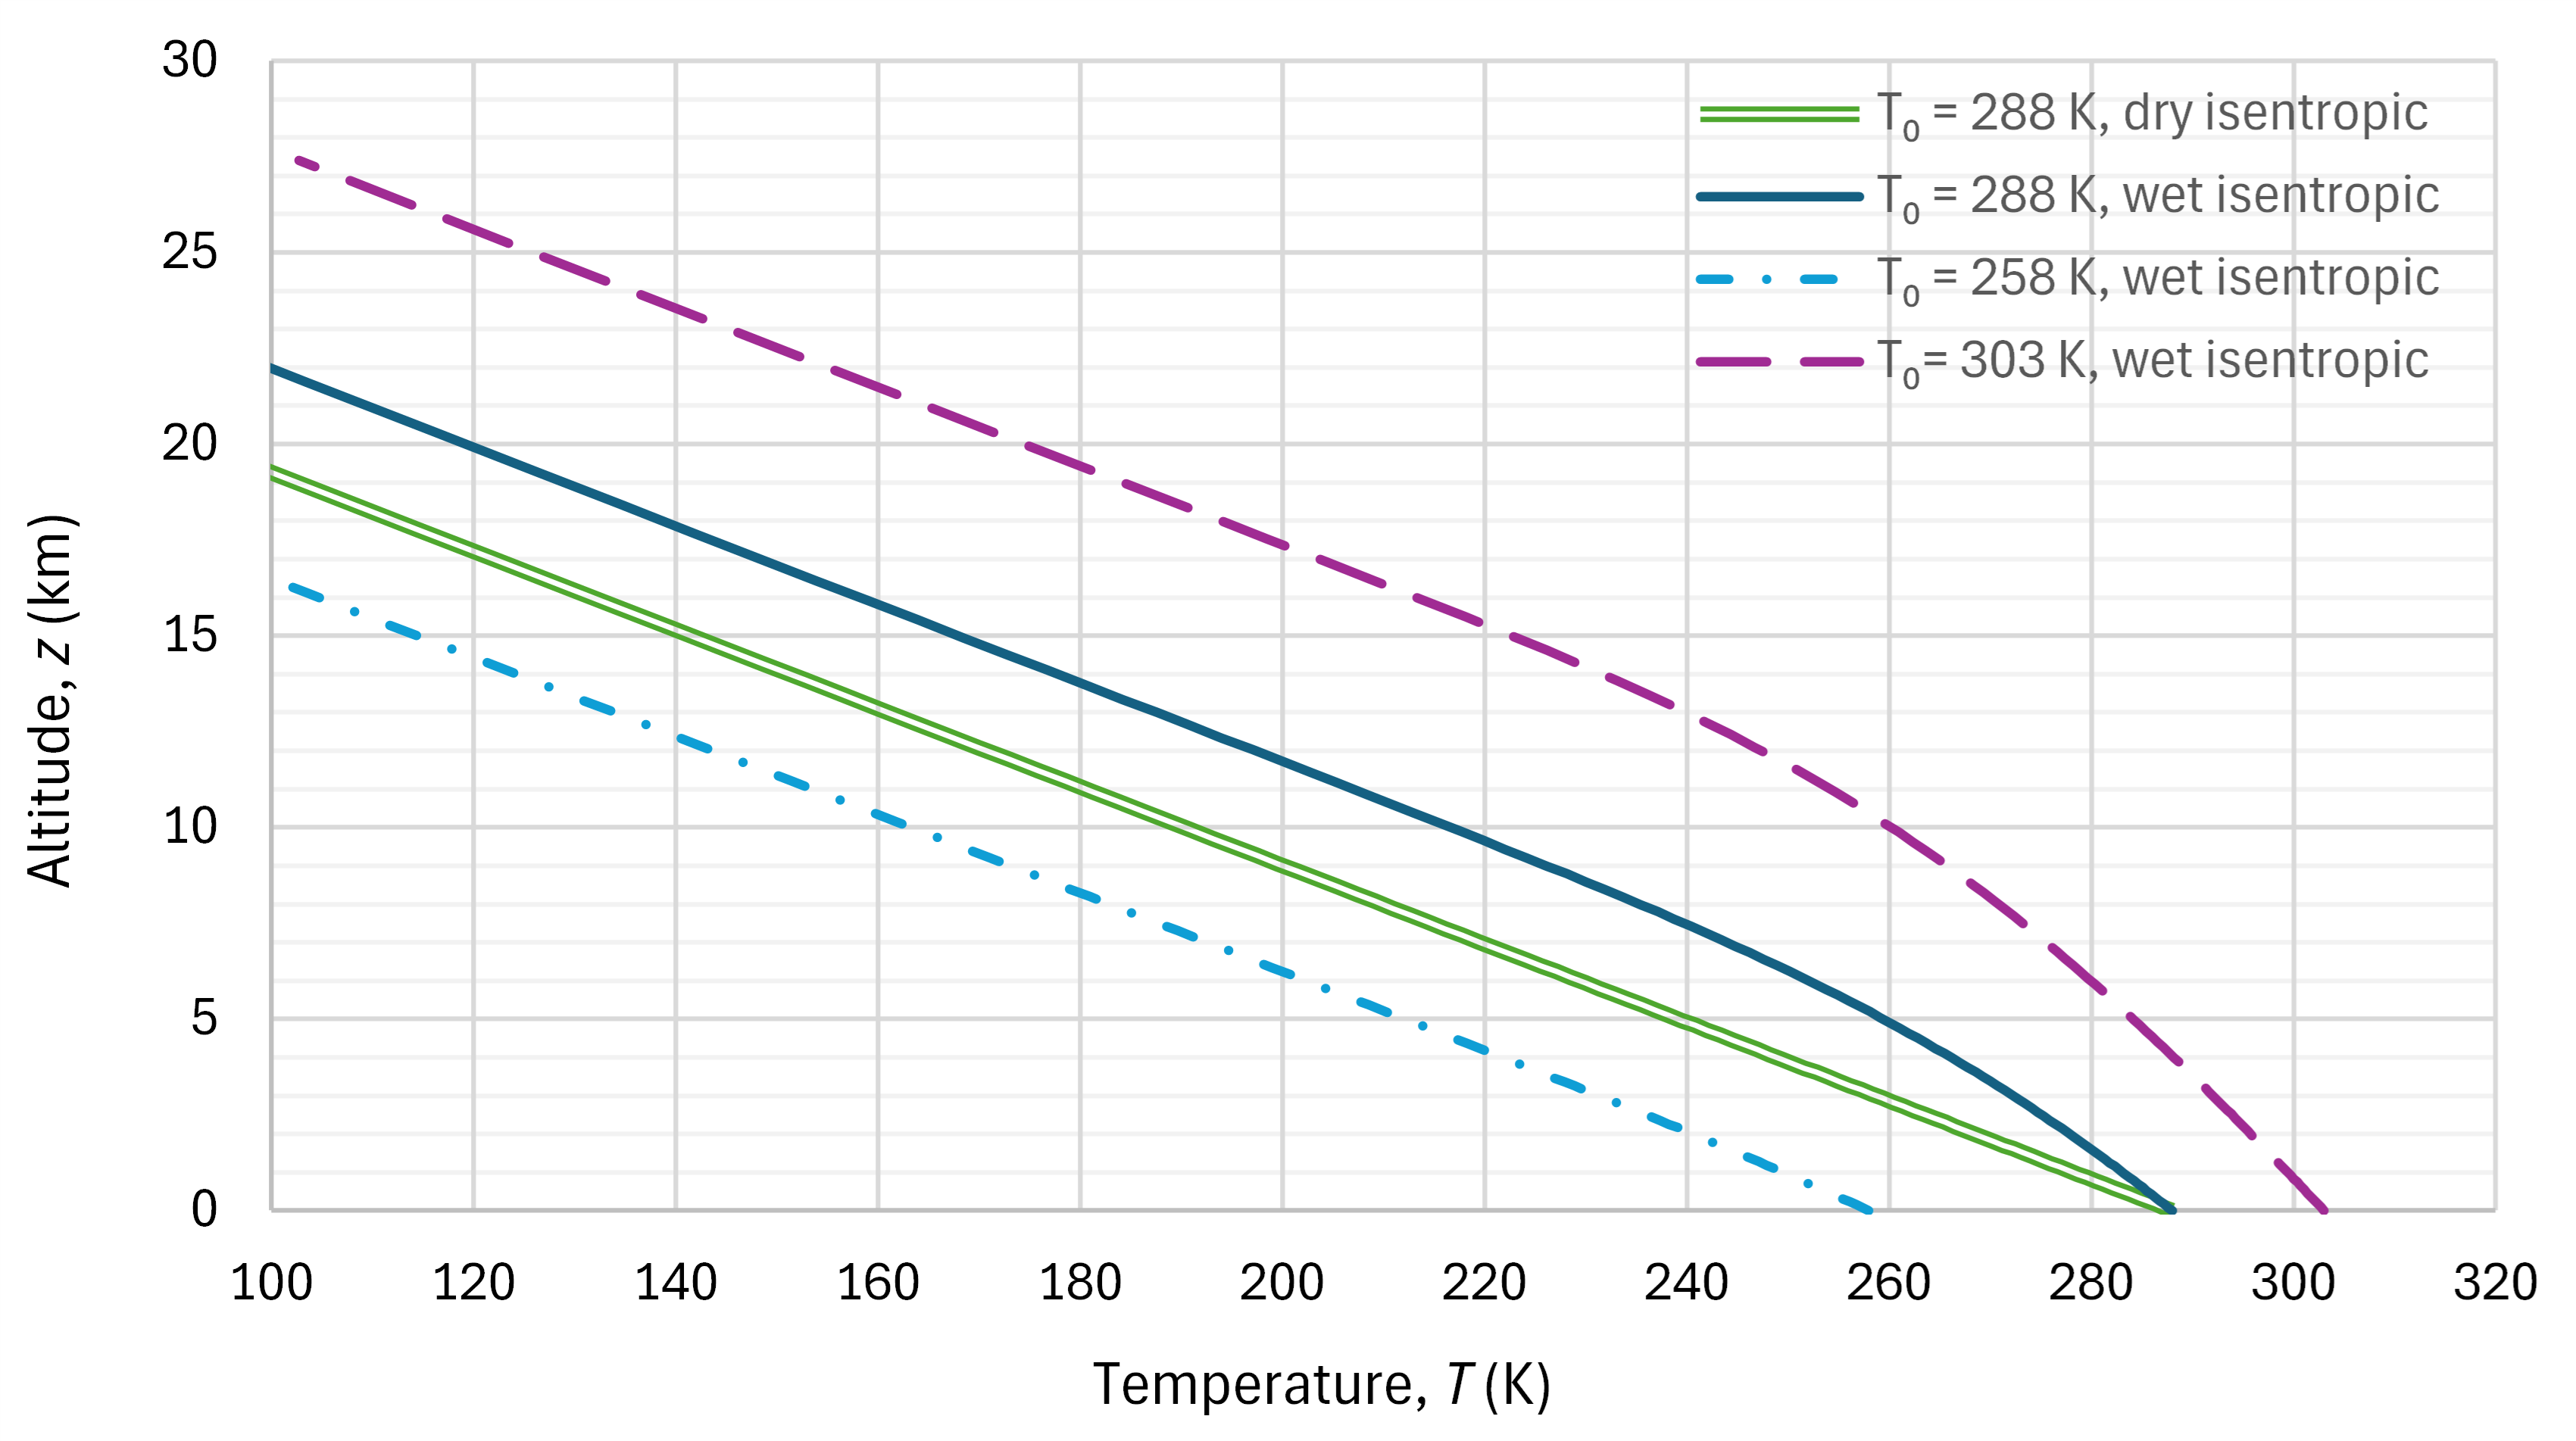
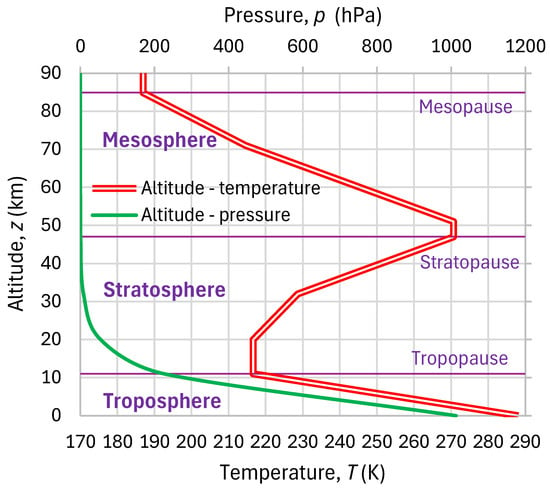
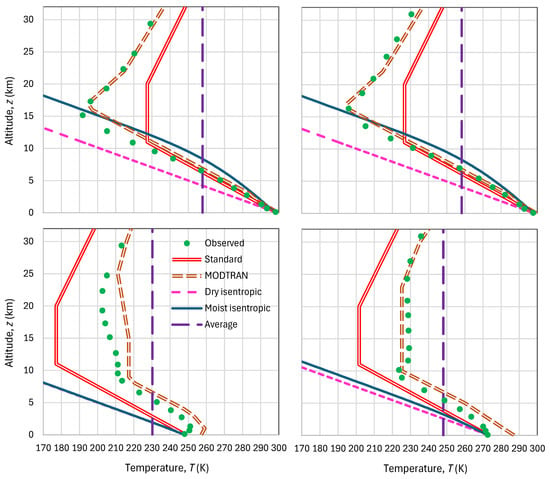
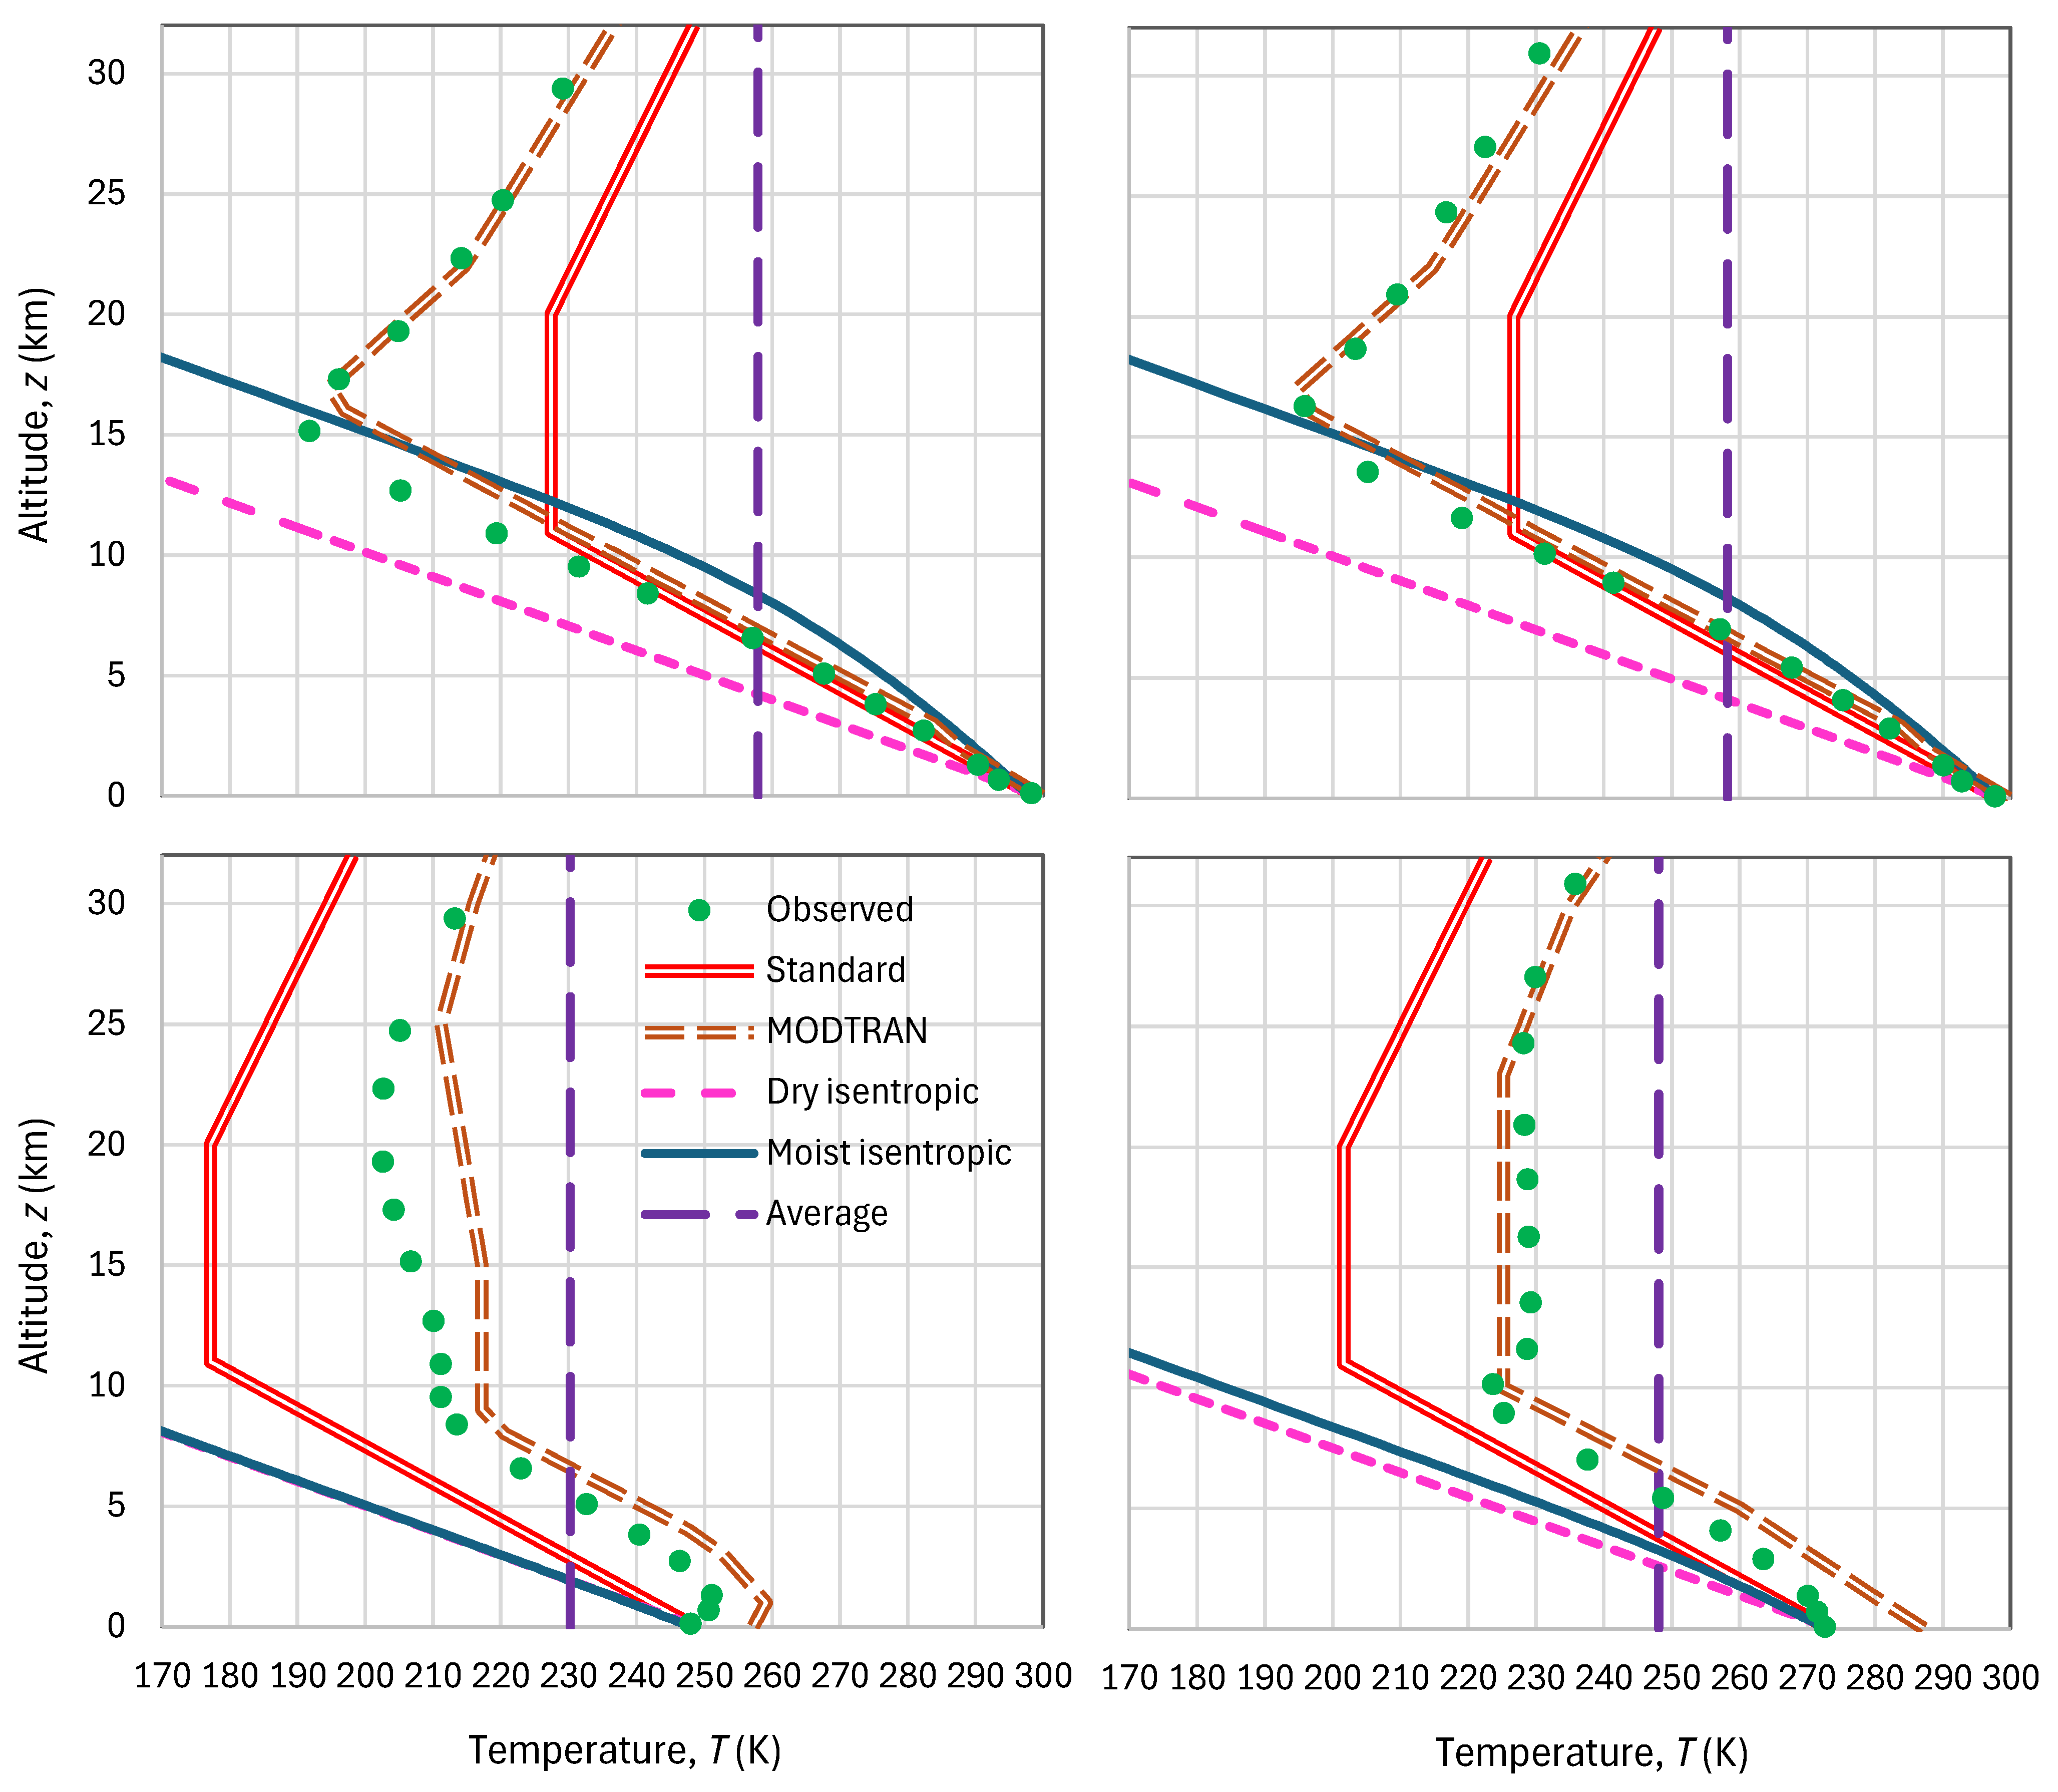
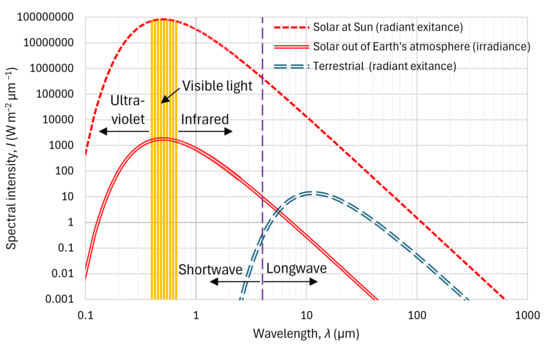
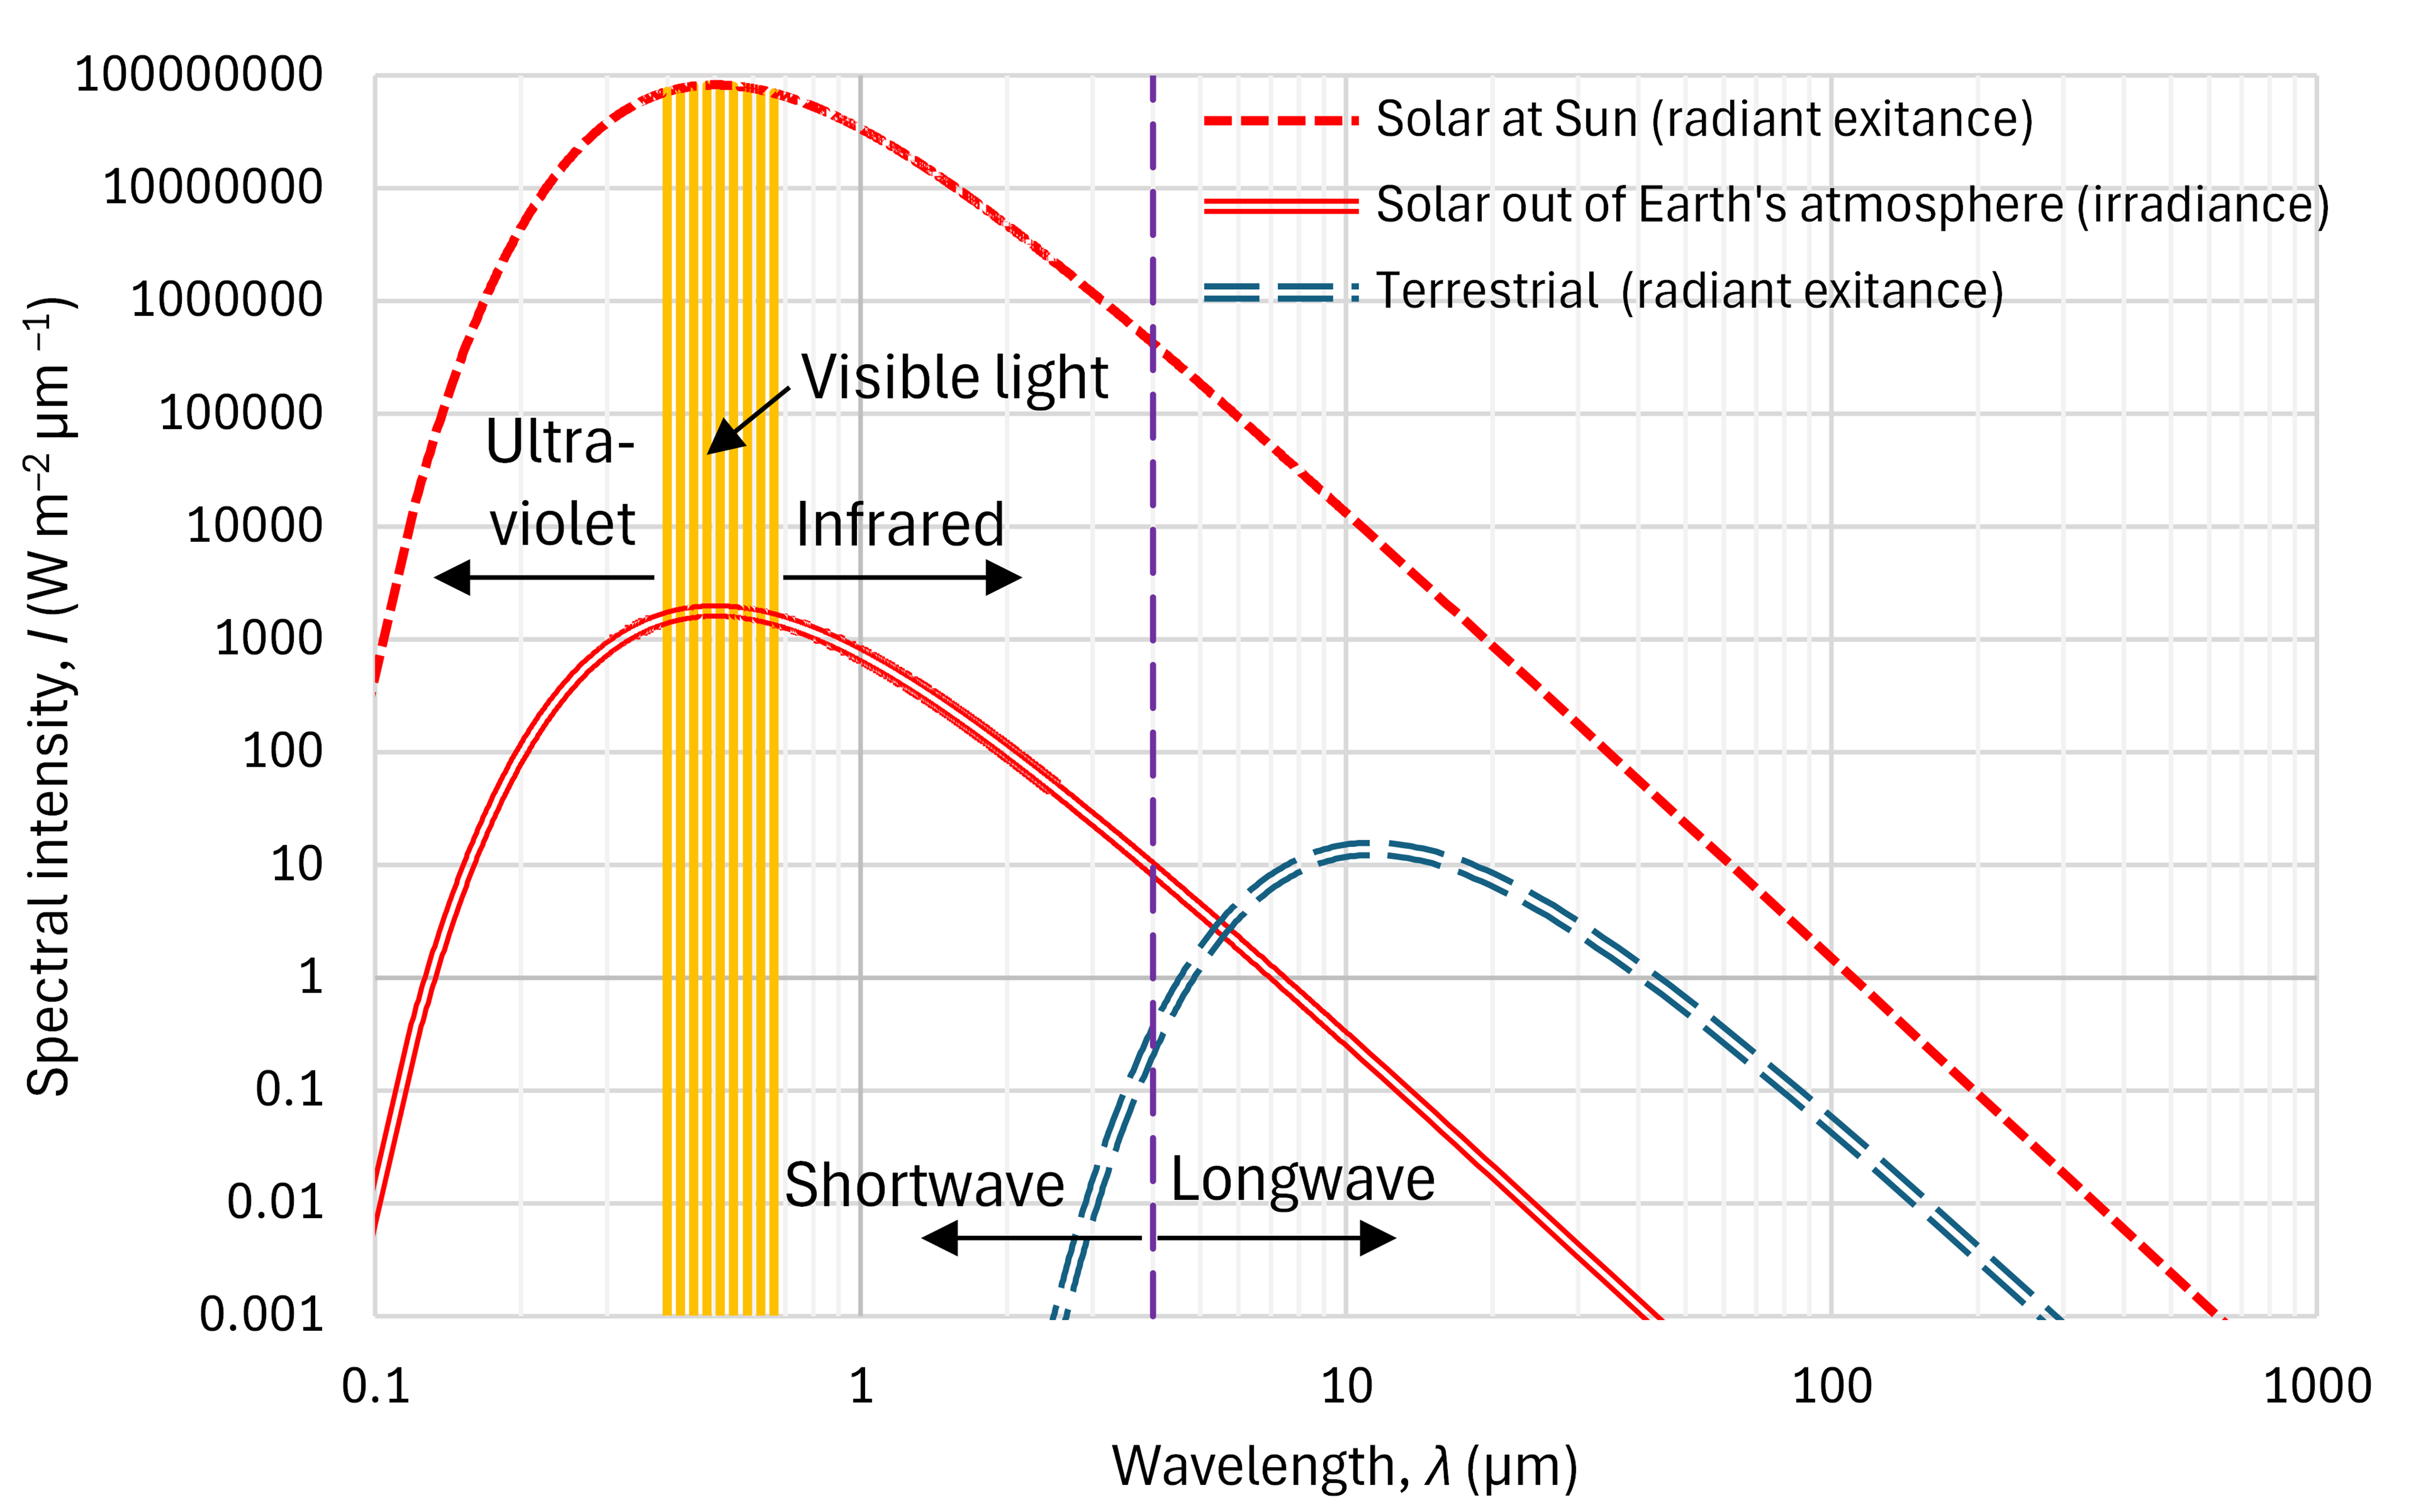
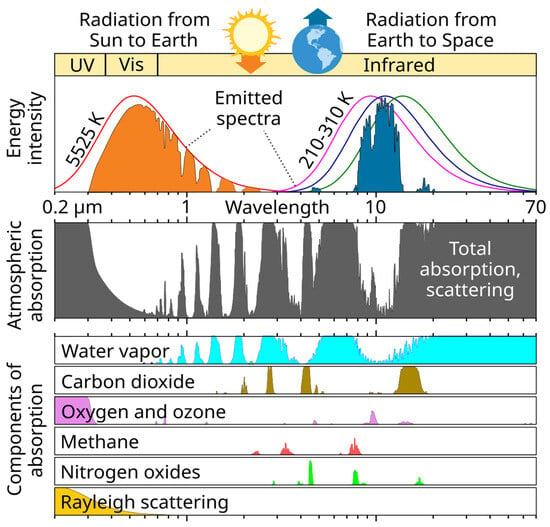
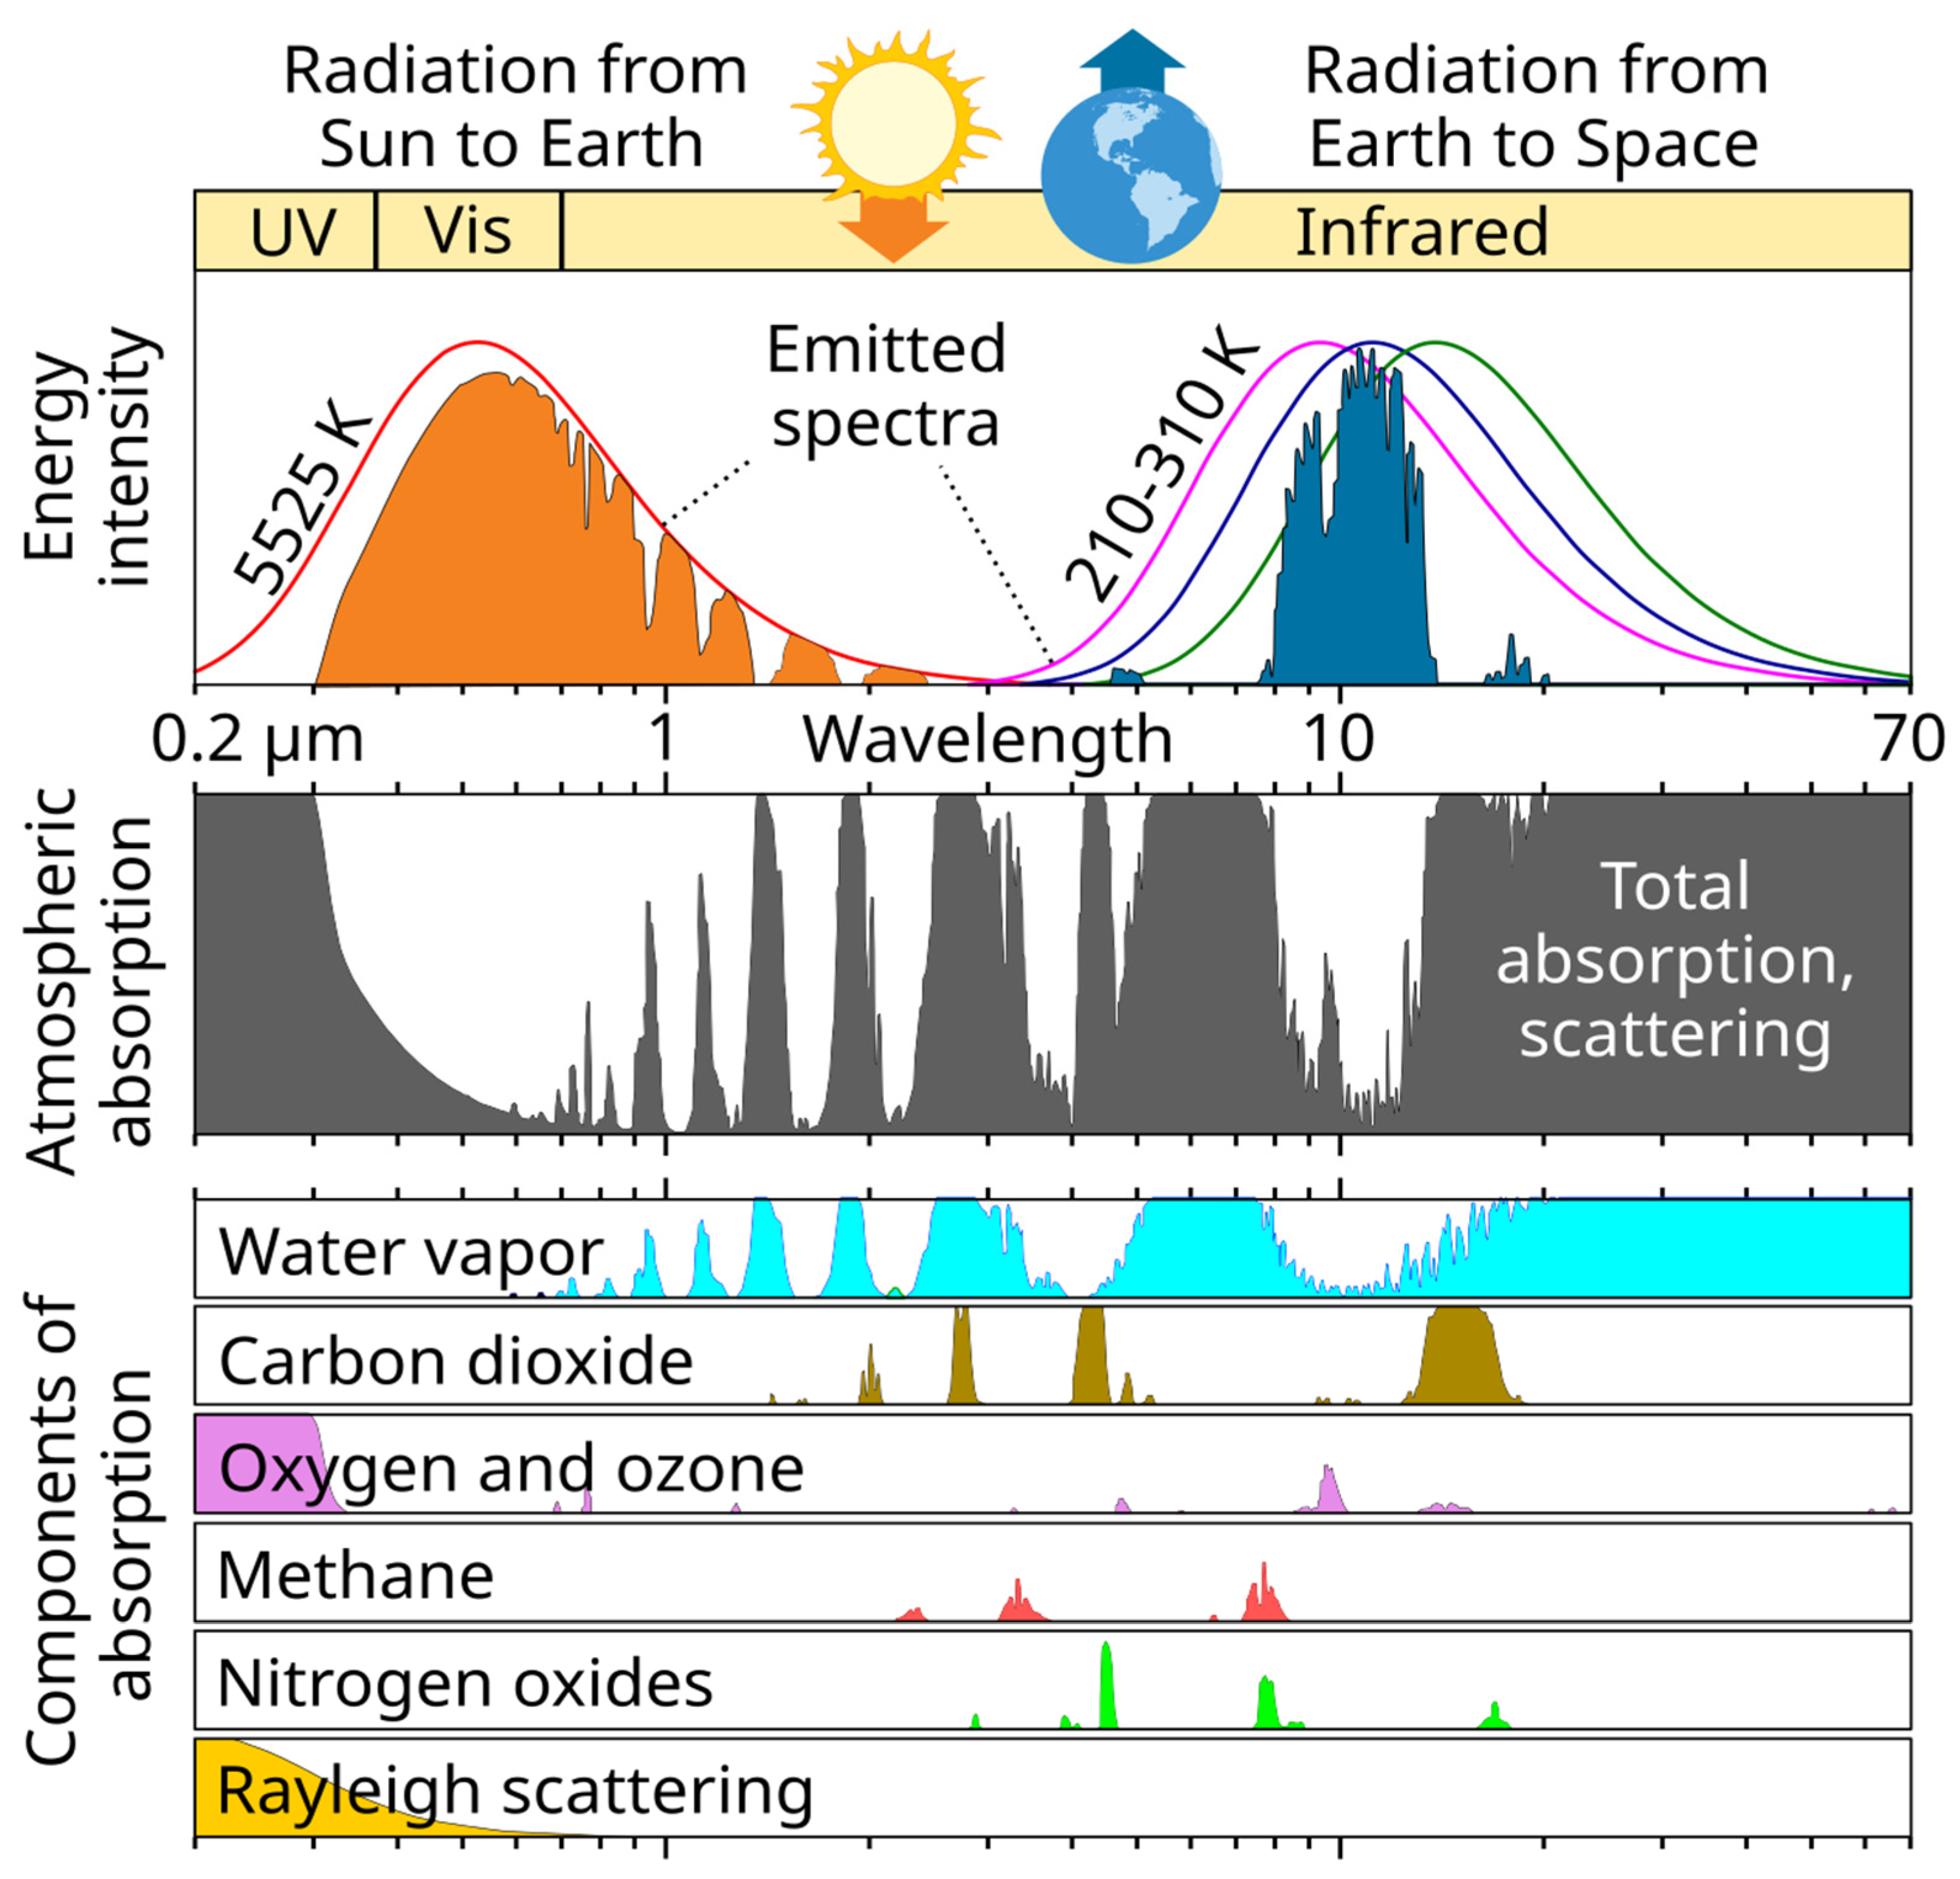
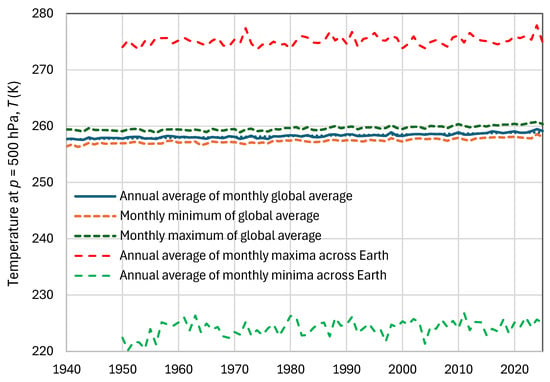
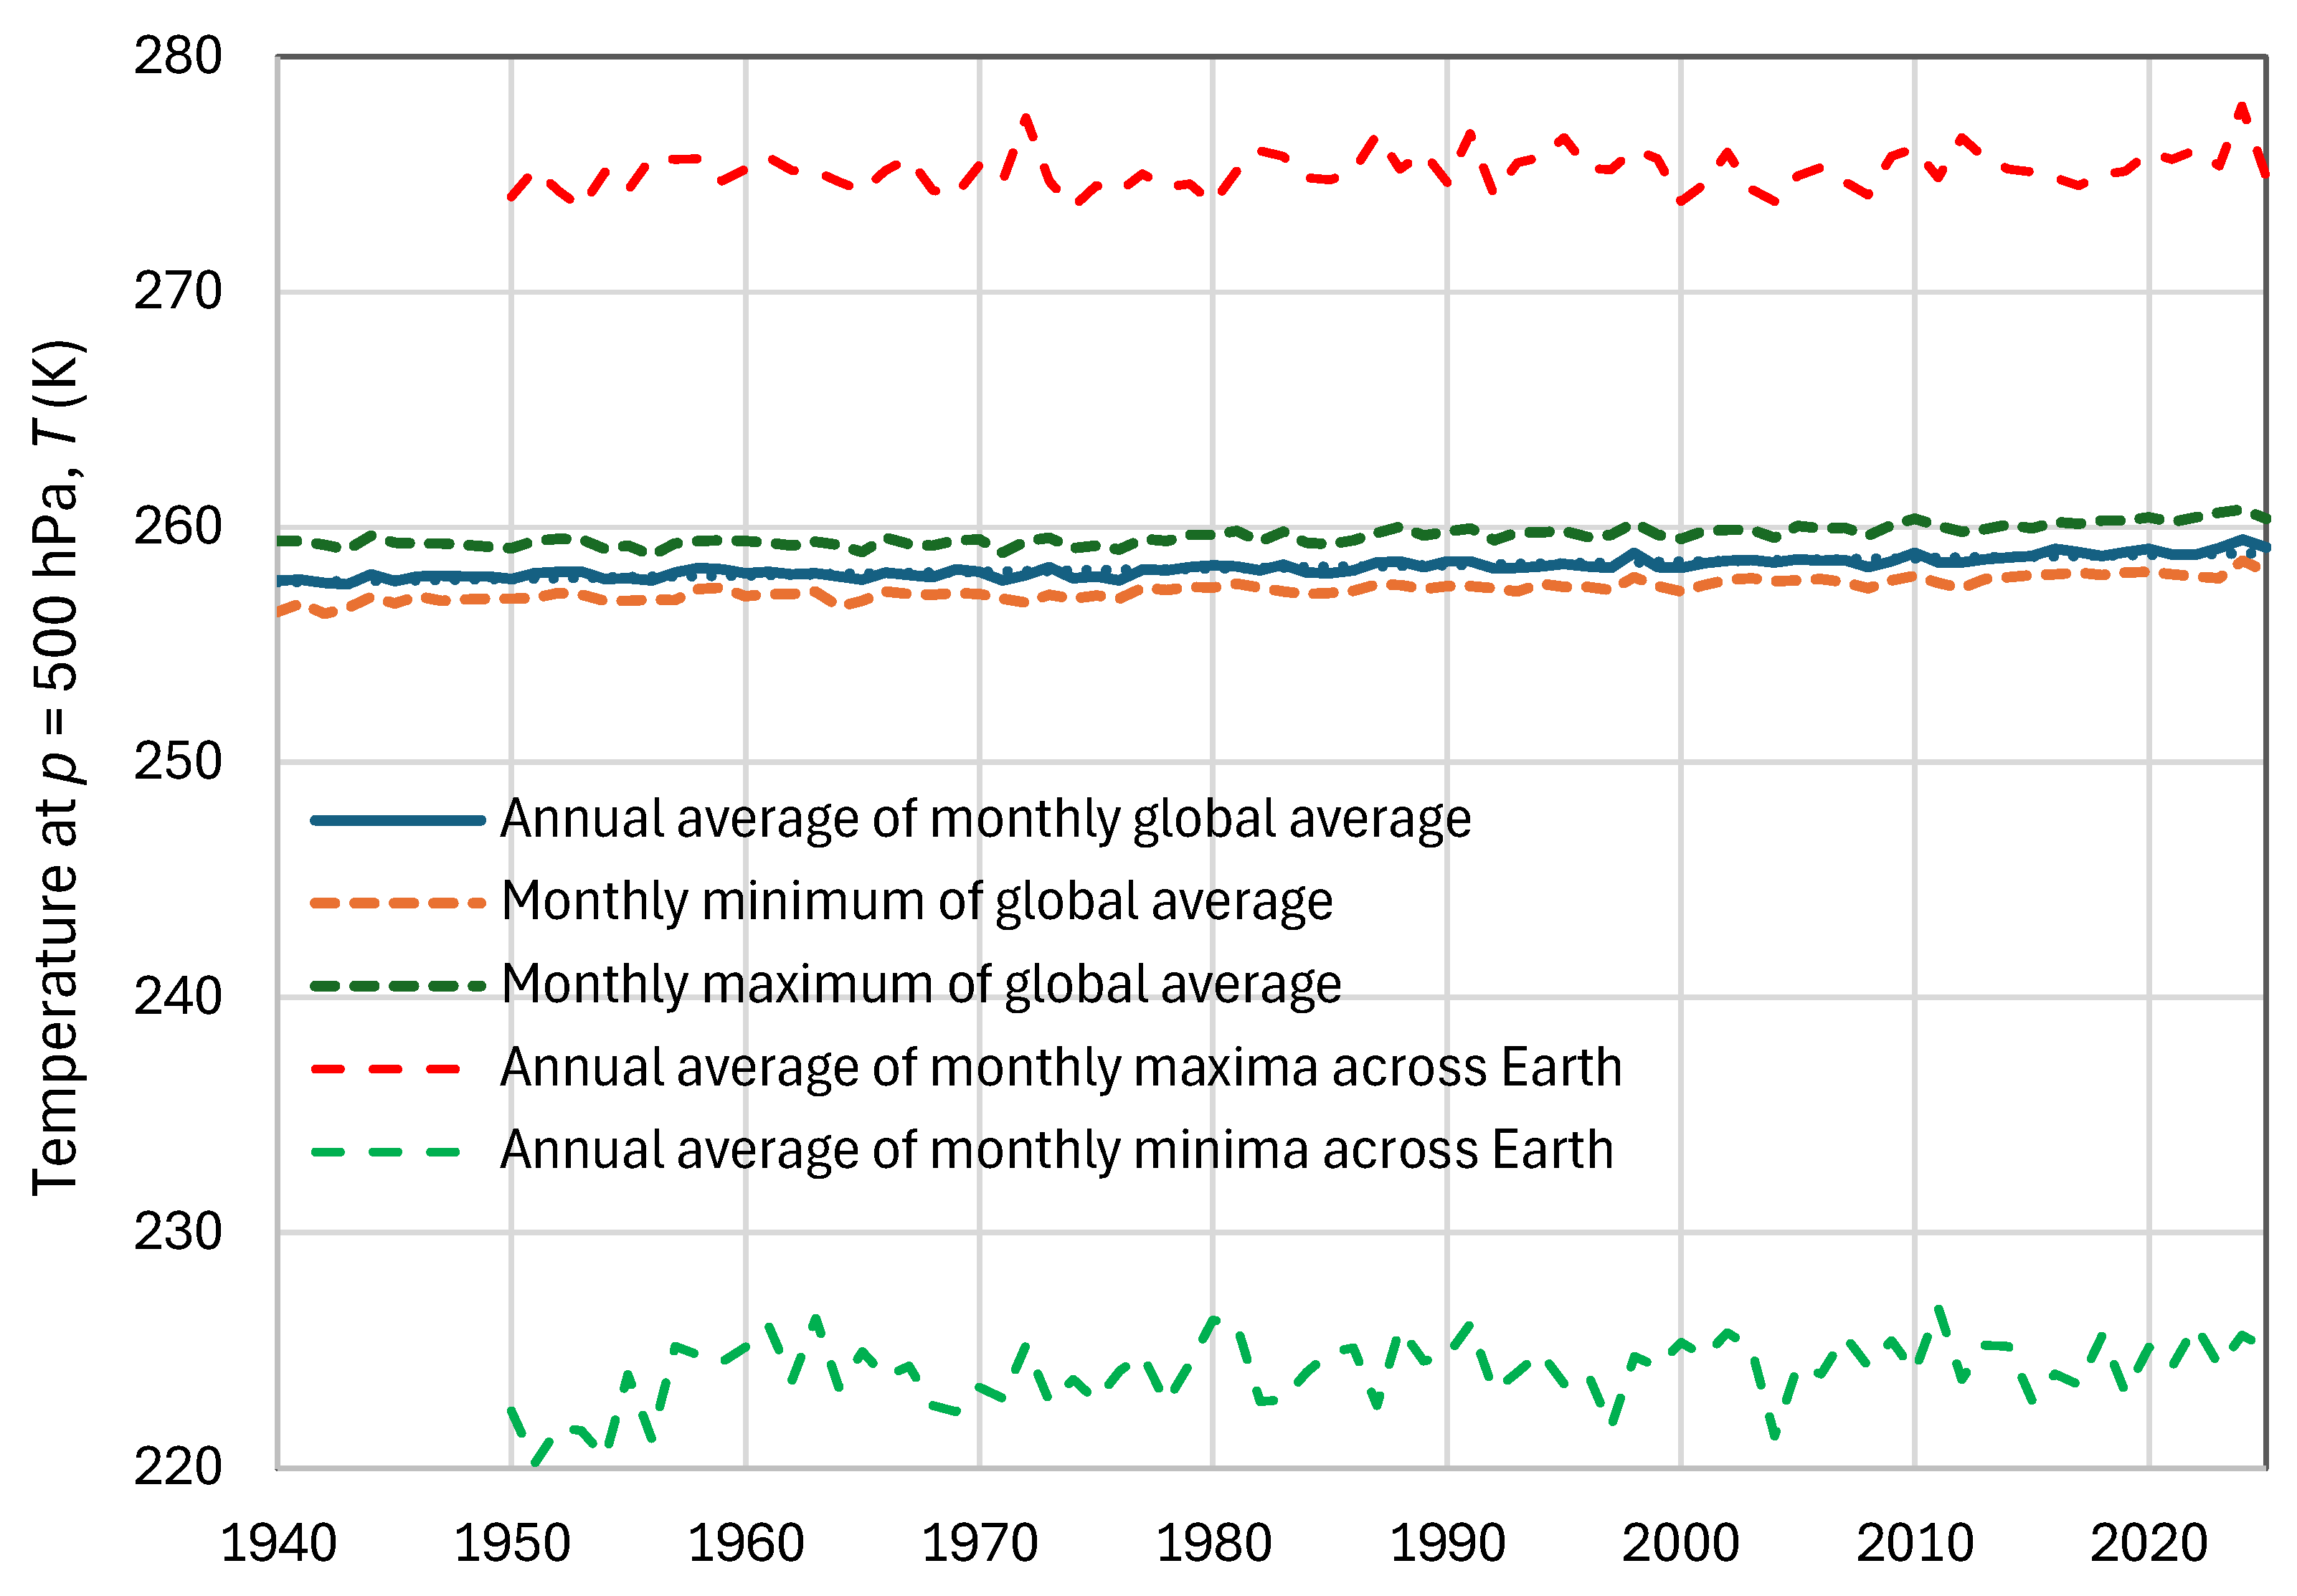
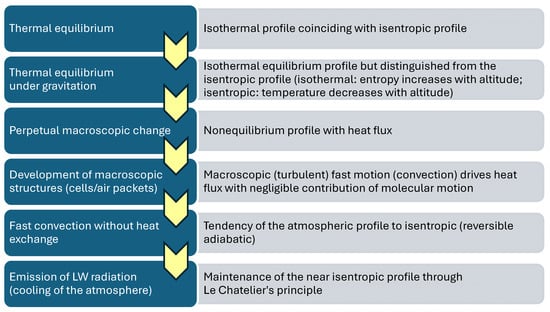
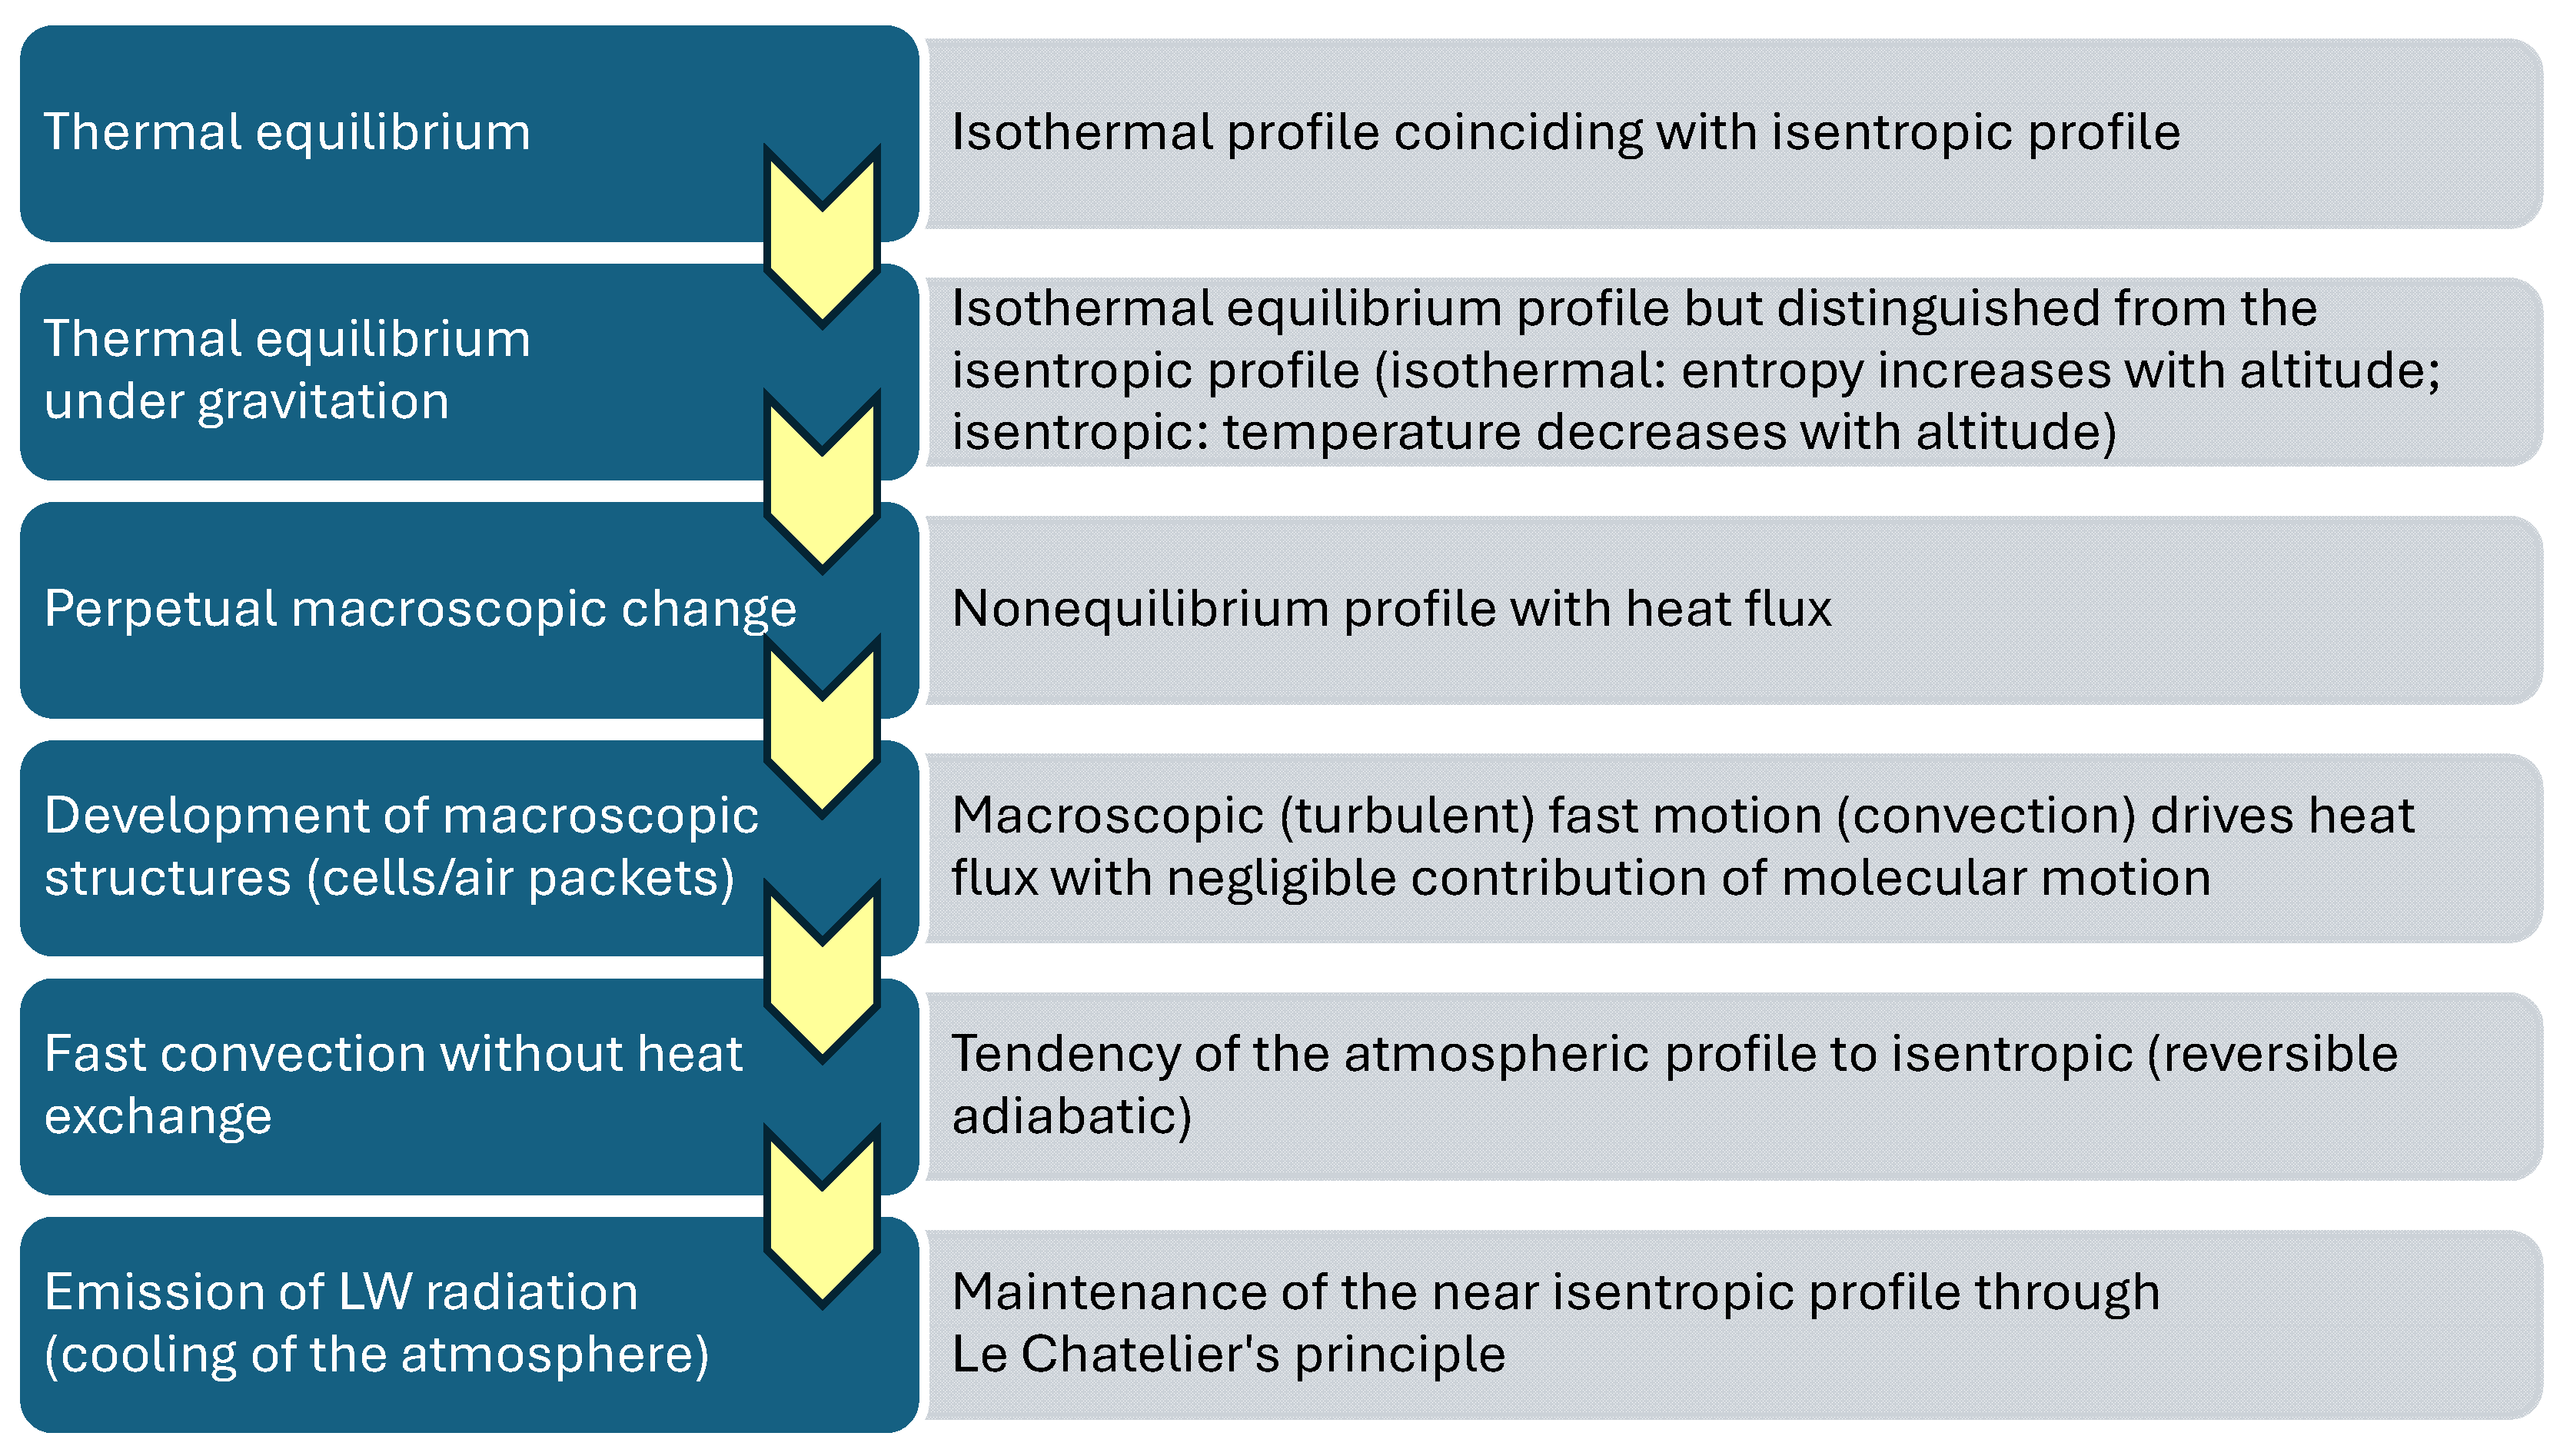
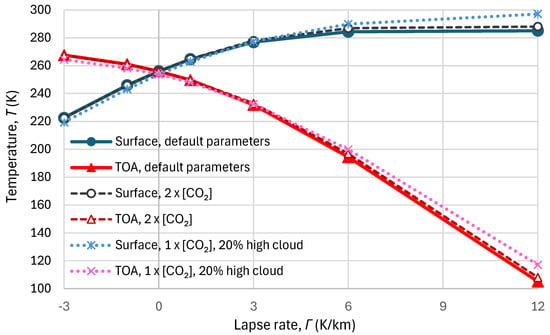
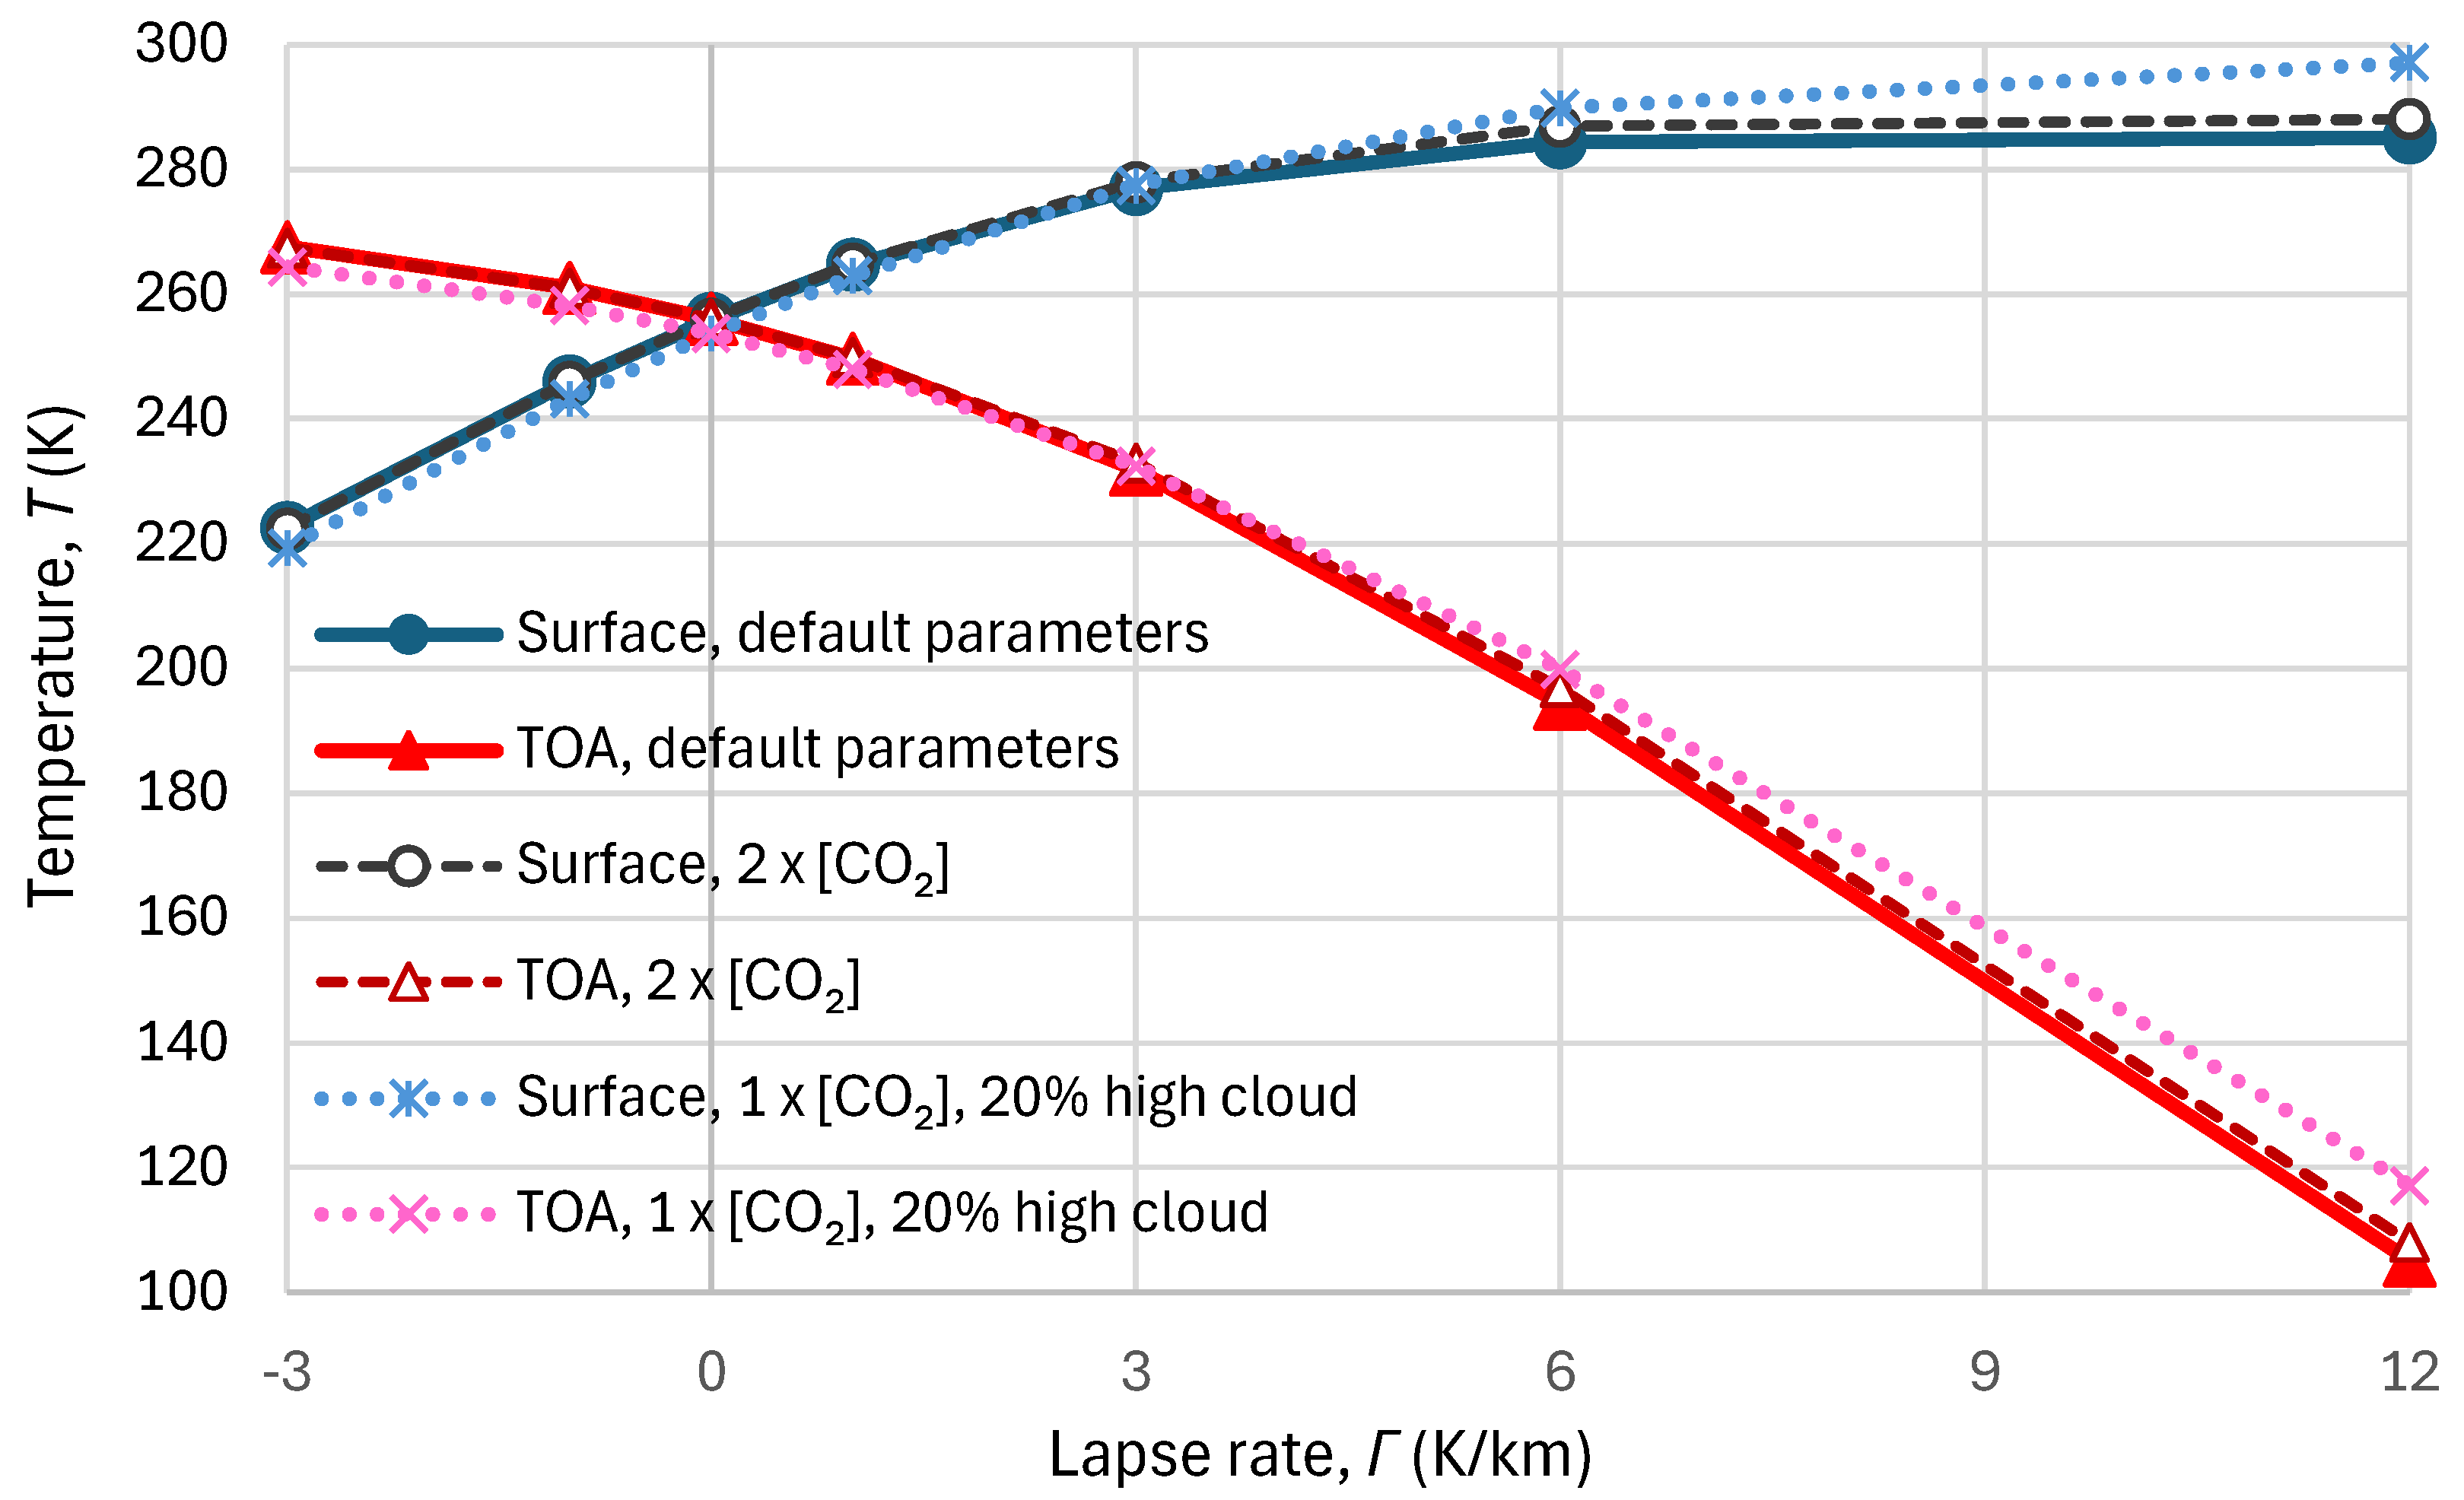
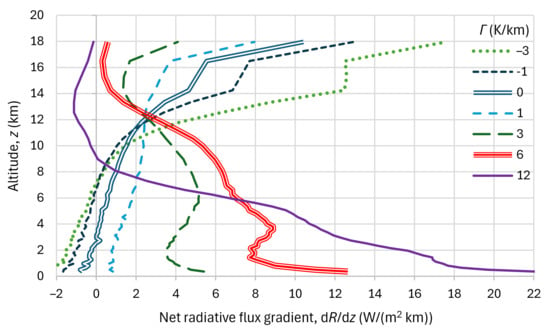
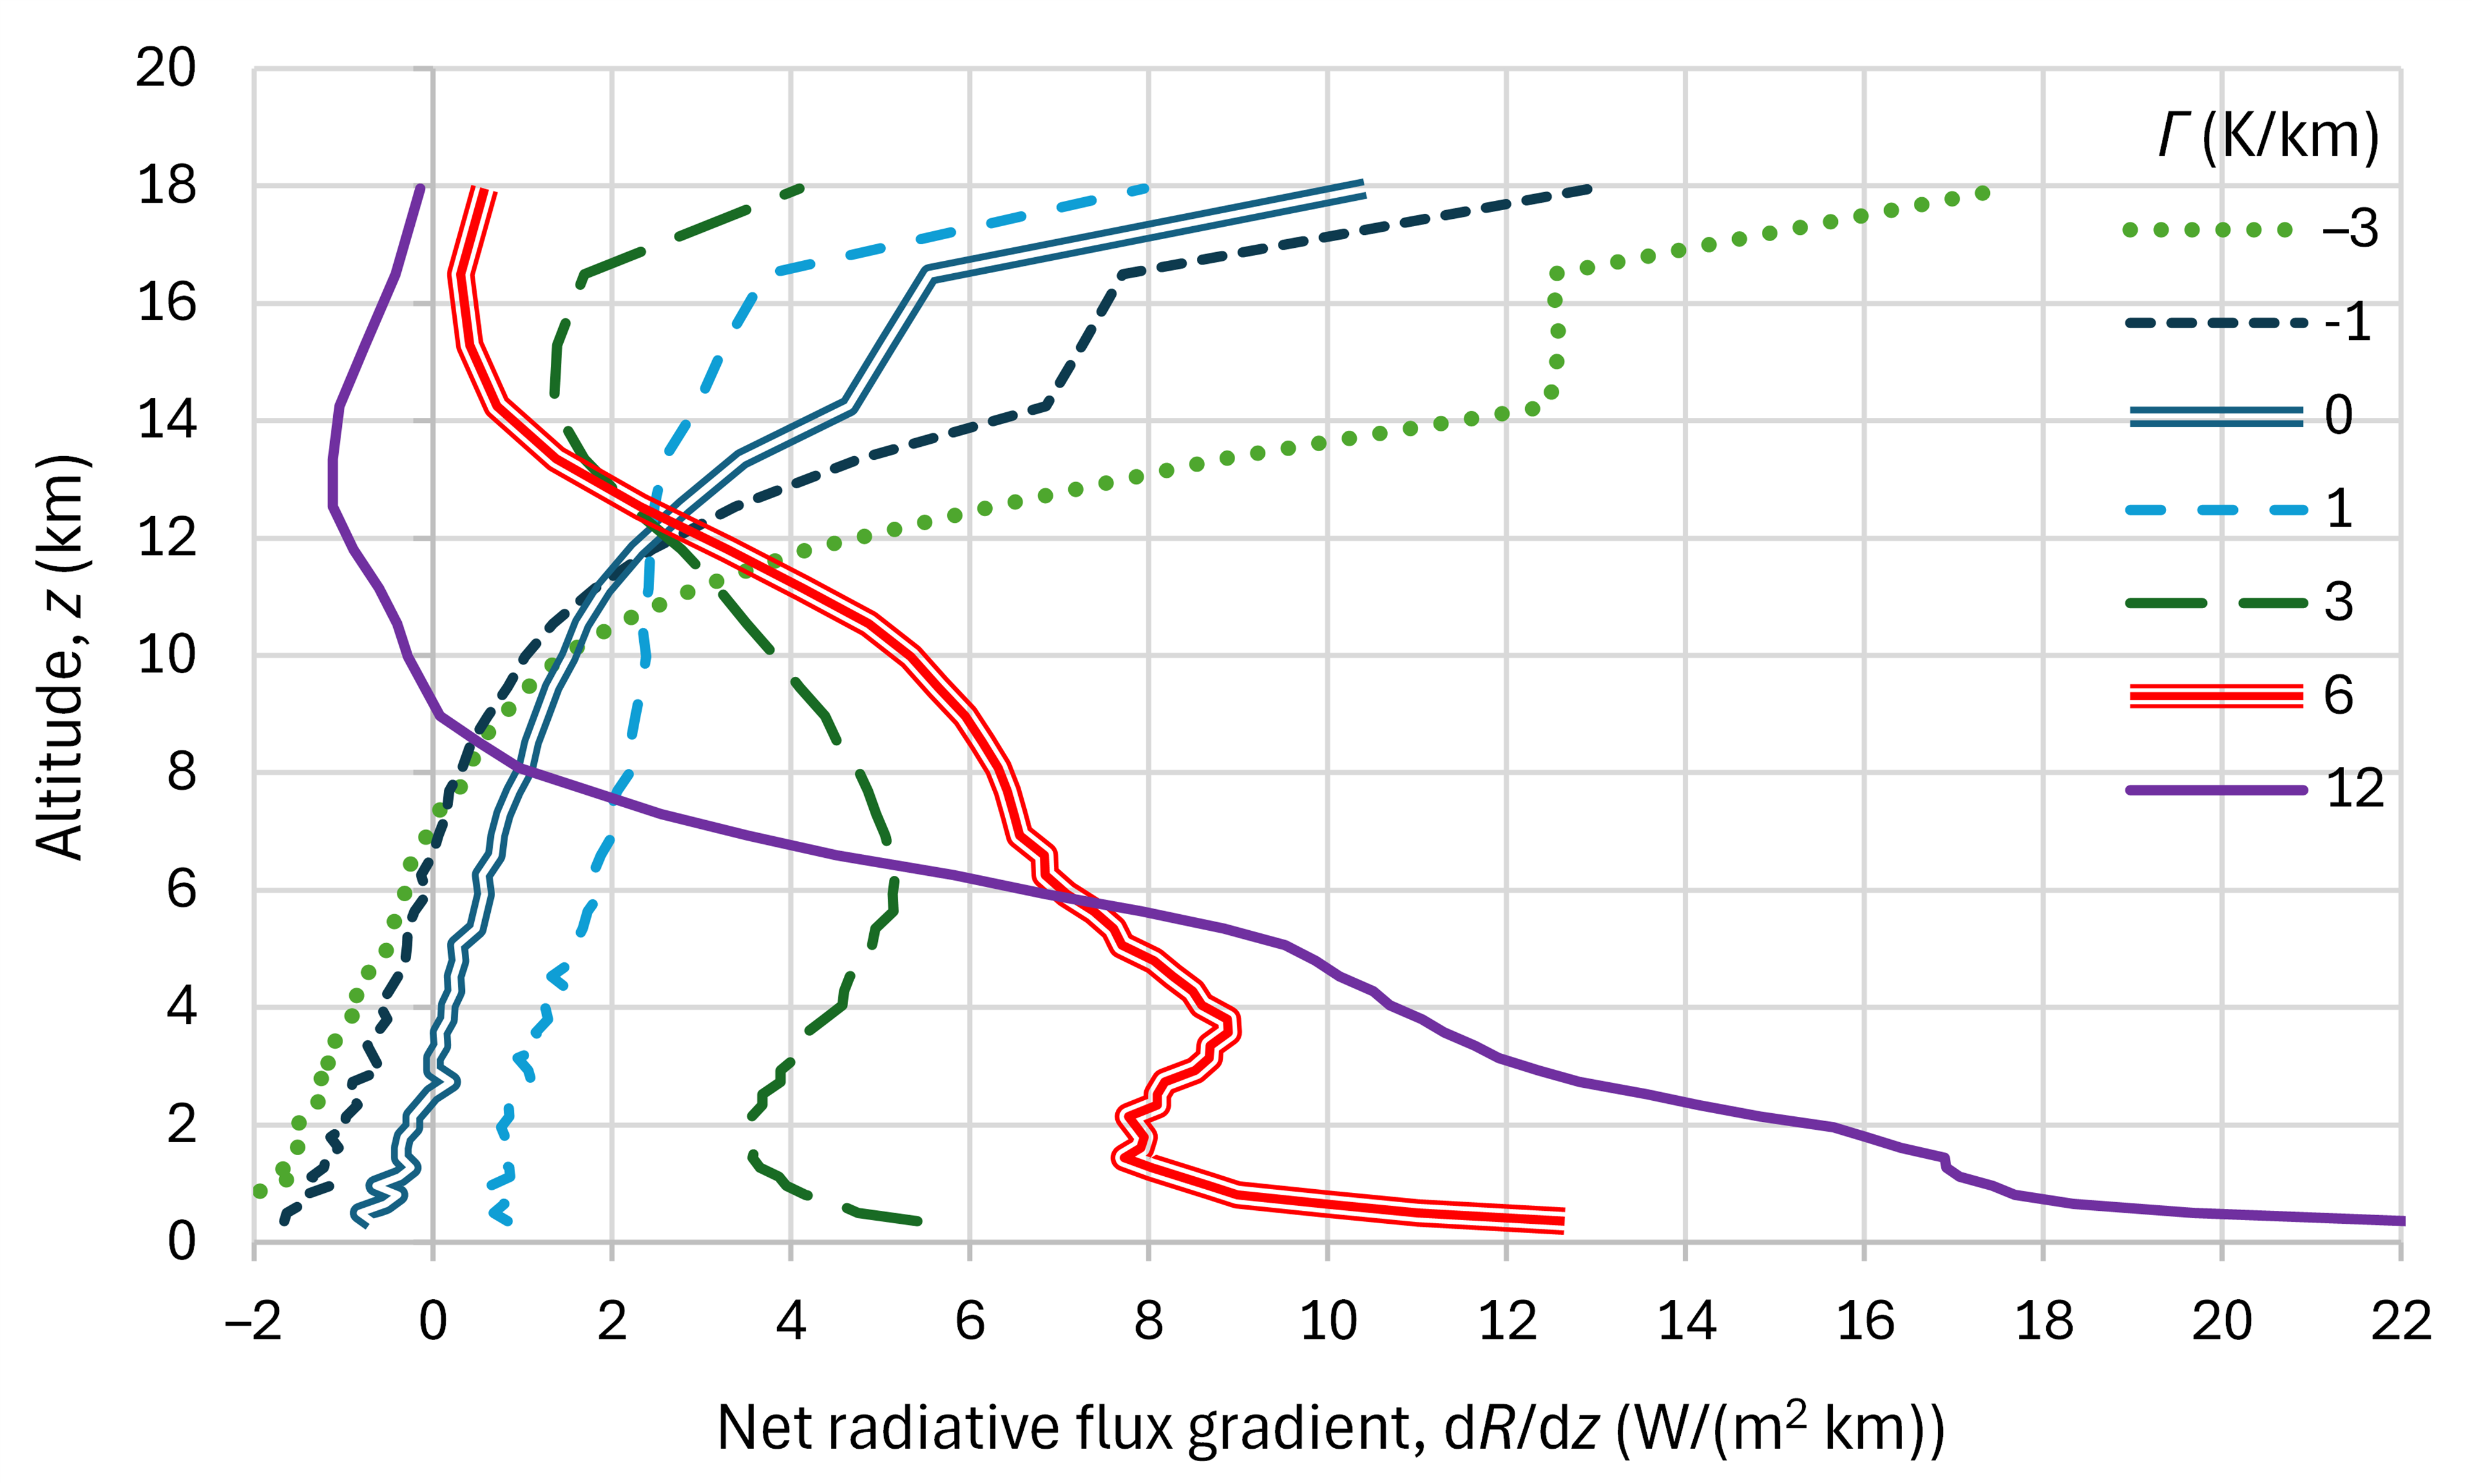
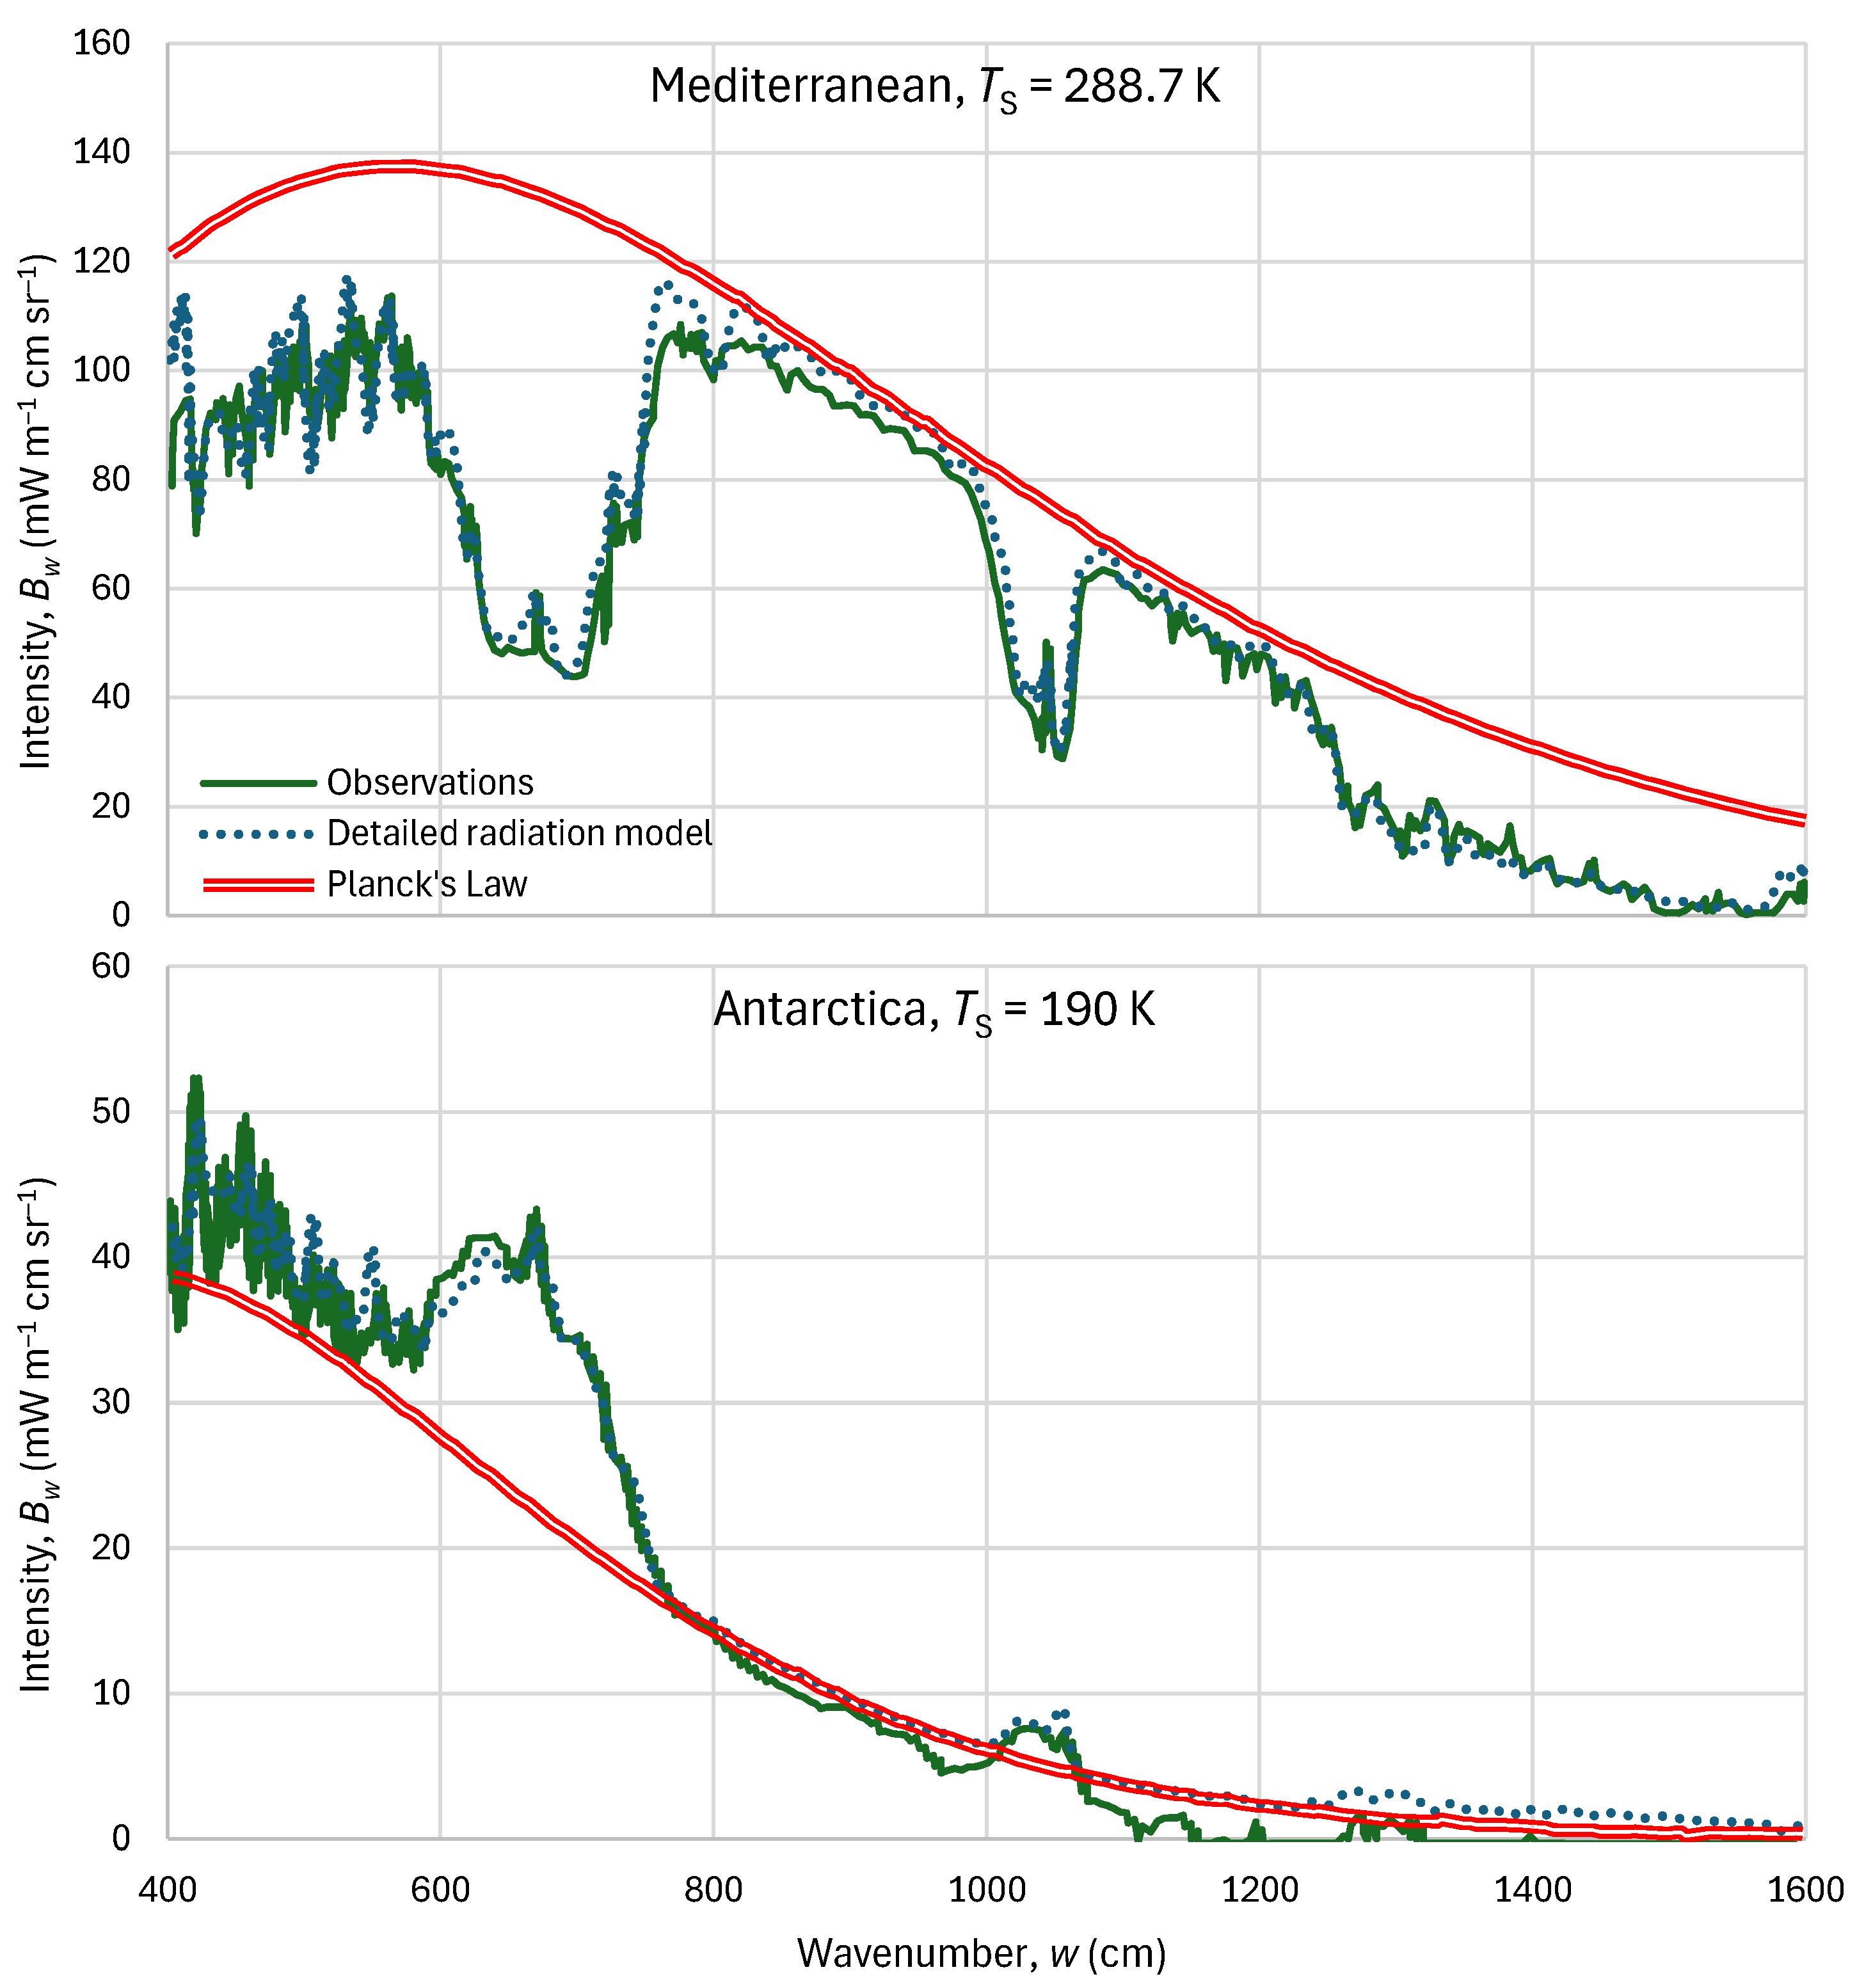

Disclaimer/Publisher’s Note: The statements, opinions and data contained in all publications are solely those of the individual author(s) and contributor(s) and not of MDPI and/or the editor(s). MDPI and/or the editor(s) disclaim responsibility for any injury to people or property resulting from any ideas, methods, instructions or products referred to in the content. |
© 2026 by the author. Licensee MDPI, Basel, Switzerland. This article is an open access article distributed under the terms and conditions of the Creative Commons Attribution (CC BY) license.